Preprint
Article

Social Media Influencers: Customer Attitudes and Impact on Purchase Behaviour

Altmetrics

Downloads

220

Views

196

Comments

0

A peer-reviewed article of this preprint also exists.

Submitted:

16 May 2024

Posted:

17 May 2024

You are already at the latest version

Alerts
Abstract
The aim of this study is to investigate and determine the key factors guiding customer attitudes towards social media influencers, and on that base to explore their effects on purchase intentions towards advertised products or services. A total of 376 fulfilled questionnaires from an online survey were analysed. The main characteristics of digital influencers’ behaviour, affecting consumer perceptions have been systematized and categorized through a combination of both traditional and advanced data analysis methods. Structural Equation Modelling (SEM), machine learning and multi-criteria decision-making (MCDM) methods were selected to uncover the hidden dependencies between variables from the perspective of social media users. The developed models elucidate the underlying relationships that shape the acceptance mechanism of influencers’ messages. The results obtained provide specific recommendations for stakeholders across the social media marketing value chain. Marketers can make informed decisions and optimize influencer marketing strategies to enhance user experience and increase conversion rates. Working collaboratively, marketers and influencers can create impactful and successful marketing campaigns that resonate with the target audience and drive meaningful results. Customers benefit from more tailored and engaging influencer content that aligns with their interests and preferences, fostering a stronger connection with brands and potentially affecting their purchase decisions. As the perception of customer satisfaction is individual and evolving process, stakeholders should organize regular evaluations of influencer marketing data and explore the possibilities to ensure continuous improvement of this e-marketing channel.
Keywords: 
Subject: Business, Economics and Management  -   Marketing

1. Introduction

Social media influencers also referred to as digital influencers, online influencers or internet influencers came into prominence in the early 2000s during the transition from the early Web 1.0 to the collaborative Web 2.0 era. Initially, companies sought only for celebrities for successful product sales. Today, online influencers are key figures who attract and captivate audiences with specialized knowledge or intriguing lifestyle, making them valuable assets for brands establishing a strong online presence [1]. Influencer marketing is a form of internet advertising that builds brand authority based on the reputation, recommendations, and popularity of a given celebrity or well-known personality [2]. The rise of social media has turned influencer marketing into a preferred tool for brand awareness and sales promotions.
The COVID-19 health crisis has been one of the catalysts for the technological advancements in marketing strategies. As people spent more time online due to lockdowns and restrictions, online influencers became key marketing instrument for brands to connect with their target audiences. The pandemic led to a greater proliferation of social media influencers as sources of information and product recommendations [3,4].
According to Statista‘s analysis [5], the global influencer marketing market was valued at 21.1 billion U.S. dollars as of 2023, representing a substantial increase of 224.6% from the pre-pandemic level of 6.5 billion in 2019 and a 28.7% increase from the previous 16.4 billion in 2022. As per the Influencer Marketing Hub report [6], the influencer marketing industry is projected to reach around 24 billion by the end of 2024. In this report, nearly a quarter of surveyed participants plan to allocate over 40% of their total marketing budget to influencer campaigns. This growth underscores the importance of influencer marketing as a communication channel for reaching and engaging audiences.
However, there is no unified framework for researching the features of this digital marketing tool. Studying factors that affect user perceptions towards influencers and predicting their impact on customer decision-making process is a complex issue for the following three main reasons:
1. The heightened ambiguity and complexity of the current economic landscape rap-idly alter customer needs, preferences, and purchasing habits. For instance, during economic recessions, consumers may prioritize only essential goods and services indicating a shift in preferences and reduced willingness to spend [7].
2. The advancements in modern technologies, including virtual reality, life streaming, and mobile applications, have the potential to improve the methods and platforms used by digital influencers as advertising tools [8].
3. The array of methods for customer satisfaction research has been broadened with the introduction of big data, sentiment analysis, multi-criteria decision-making methods, fuzzy logic, neural networks, or their combinations [9,10]. These new analytical capabilities facilitate the discovery of new dependencies in influencer marketing data.
These challenges prompt us to investigate user perception towards internet influencers using classical statistical methods, modern techniques such as Structural Equation Modelling (SEM) and Machine Learning (ML), as well as Multi-Criteria Decision-Making (MCDM) methods.
The objective of this study is to develop and verify new structural, discriminative, and ranking models for the impact of digital influencers on customer perceptions regarding their convenience, interactivity, attractiveness, expertise and trustworthiness. The models should also incorporate various socioeconomic and demographic factors such as monthly household income per capita, communication behaviour, age, place of residence, education level, etc.
The main tasks of the study are as follows:
  • Create a conceptual framework that enables the systematic analysis of consumer data and uncover hidden relationships in their attitudes towards digital influencers.
  • Arrange and collect a customer dataset for their experiences and preferences in social media marketing (including socio-economic indicators, respondents’ perceptions towards digital influencers, and specific issues).
  • Identify the key factors affecting buying intentions generated by online influencers and propose methods for their impact determination based on a review of previous similar research.
  • Develop and validate mathematical models based on factors recognized in the previous task and compare them to those obtained from similar previous studies.
This study examines customer attitude towards internet influencers by categorizing perception factors into three main groups. The derived weights of these factors from structural cause-effect model can be utilized in multi-criteria assessment system to compare digital influencers' campaigns. The primary contribution of this paper lies in the creation of new models for evaluating, comparing, and predicting customer attitudes towards online influencers, products or services utilizing both traditional and intelligent methods for data analysis.
The remainder of this paper is structured as follows: Section 2 outlines the main characteristics of social media influencers. Section 3 introduces related research on customer attitudes towards digital influencers. Section 4 discusses the structure and content of the questionnaire and proposes measurement indicators based on those utilized in previous similar research. Section 5 analyses the collected dataset, establishes mathematical models, and verifies them. The results obtained are then compared to those from existing studies. The paper concludes in the final section, where future research directions are out-lined.

2. State of the Art Review of Influencer Marketing

Digital influencers are individuals who have established expertise or authority in a specific industry or niche, often with many engaged followers on social media platforms. They leverage their strength to promote brands, products, or services to their audience, creating authentic and relatable content. For businesses, the benefits of collaboration with social media influencers include reaching a targeted audience, building brand awareness, and driving engagement and conversions through their trusted recommendations [11].
However, managers of brick-and-mortar stores, physical retail outlets, conventional media companies and other traditional marketing stakeholders are often unfamiliar with the capabilities of this innovative marketing channel for brand positioning. This knowledge deficiency results in a lack of alignment with the evolving demands of customers, who seek valuable information, entertainment, or inspiration in the virtual space. Moreover, it could lead to unnecessary marketing expenditures without a corresponding return on investment.

2.1. Key Features and Taxonomy of Social Media Influencers

Starting in the 2000s, online influencers have revolutionized traditional marketing with technological innovations. Influencers are adept at creating high quality and attractive content, including photos, blog posts and videos, which resonates with their audience. Through active engagement such as responding to comments, clicks, likes, and shares, influencers create a sense of community. Some of the recent tendencies [12,13] are as follows:
  • Growing reliance on video materials: Influencers focus on creating high-quality videos, especially short video forms on platforms like TikTok and Instagram. These formats are appealing even to users with short attention spans. Additionally, the platforms' algorithms promote viral content and amplify the popularity of these videos.
  • Social commerce: The integration of e-commerce and social media platforms is growing rapidly. Users can discover, shop, and purchase products directly from social media platforms like Facebook Marketplace, Pinterest and TikTok, which offer e-commerce features.
  • Diversification of platforms: Influencers expand their content presence across various platforms to reach different audiences. This approach ensures influencers connect with their followers regardless of their preferred online spaces.
  • Virtual influencers and AI: The rise of AI-generated influencers is an emerging trend because these influencers offer an innovative approach to brand collaborations. However, this format can lead to a lack of sincerity in interactions with the audience and decrease the level of users’ trust and engagement with virtual personalities.
  • Data-driven influencer marketing: The intensified competition among social media influencers necessitates the implementation of data-driven influencer marketing. Brands now rely on data analytics and AI to pinpoint the most suitable influencers for their campaigns. These data-driven decisions not only lead to measurable results but also yield more effective partnerships.
Each internet influencer has unique characteristics that attract diverse audiences. Based on their attributes, content creators can be categorized in various ways according to different criteria.
Content Focus: Influencers often specialize in specific niches or content types [14], such as business and entrepreneurship, technologies and gaming, health and fitness, fashion and beauty, travel, and adventure among many others.
Form of Internet Marketing: Influencers can be classified based on the forms of internet marketing they use, such as content creation, social media presence, video production, blogging, affiliate marketing, etc. [15]. These categories help brands identify influencers who align with their marketing goals and target audience. From content creators to brand ambassadors, each category offers its own approach to reaching and engaging with audiences online.
Platform: Influencers can be grouped based on the social media platforms where they are active. While Instagram influencers focus on visual content such as photos and short videos, YouTube influencers create long form video content like tutorials and vlogs. TikTok influencers utilize short, creative, and entertaining videos, while X (formerly Twitter) influencers share real-time updates and involve users in conversations [11].
Reach: This criterion refers to the size of influencer audiences, typically measured in terms of number of followers or subscribers. Influencers can be classified based on their reach into four main categories: mega, macro, micro and nano influencers with millions, hundreds of thousands, tens of thousands and several thousand followers respectively [11]. The efficiency of influencers is not solely dependent on their audience size, but also on many other features such as their engagement rates.
Audience Demographics: Influencers can also be divided based on the demographics of their audience: age, gender, location, and income level of their followers. Some influencers appeal to specific demographics, while others have a more diverse audience [16].
The above taxonomy can be used by businesses and marketers to identify the influencers that align best with their marketing objectives and target audience. Each influencer category offers unique advantages and can be leveraged based on the specific campaign goals and budget.

2.2. Assessing Online Influencers

When evaluating and comparing Internet influencers, various assessment tools can be employed to measure their quality and efficiency. These tools can be categorized into three main areas: marketing metrics, compound indices, and theoretical models. These benchmarks work together to enhance the understanding and improvement of the adoption and spread of influencer marketing.
Marketing metrics
They assess the efficiency of online influencers’ similarly to how traditional internet marketing instruments (such as website content, display advertising, email, affiliate, and video marketing) are evaluated. A variety of metrics for influencer impact and user engagement is provided by social media platforms via embedded analytical tools, including Meta Business Suite Insights, TikTok Analytics, and X Analytics.
The most widely used metrics are as follows:
Engagement Rates: These factors measure how actively the audience interacts with the influencer's content. The engagement rate can be determined by the number of likes, comments, shares, reactions, and other forms of interaction a post receives in relation to the total number of followers or views [17]. A high engagement rate indicates that the audience is attentive and responsive to the influencer's posts.
Follower Growth: This measure indicates the rate at which the influencer's follower count is increasing over time. It reflects the influencer's ability to attract new followers and expand their audience, which can be a sign of increasing influence and popularity [18].
Website traffic from social media: This influencer marketing metric tracks the relationship between influencers’ activities in social media and brand’s website visits, demonstrating the strength of influencer campaigns on encouraging potential customers to explore brand further by visiting its websites [19].
Key Performance Indicators (KPIs) for influencer marketing [20] depend on the goals of the campaign and the specific metrics that are important to the brand. Click-Through Rate (CTR) and Conversion Rate are essential KPIs for measuring the quality and efficiency of influencer content, while Brand Sentiment provides indicators for brand perception through the influencer's audience. Content quality, as a subjective assessment, encompasses visual appeal, creativity, and storytelling within the influencer's content. Brand mentions show the frequency and context of references by the influencer, indicating their relationship and endorsement of a brand [21]. Share Of Voice (SOV) calculates the percentage of mentions or conversations an influencer has compared to others in the same industry or niche [22].
The metrics employed for influencer classification (Subsection 2.1.) can also be applied to assess the efficiency of online influencers.
Compound indices
Each index considers a combination from various metrics such as reach, engagement, relevance, and authority [23]. Lee and Eastin develop and validate a multi-dimensional measure of Perceived Authenticity of Social Media Influencers (PASMIs) consisting of sincerity, truthful endorsements, visibility, expertise, and uniqueness [24]. Zhuang et al. propose a complex measurement approach to determine both users’ topic-level influence and users’ global-level influence [25]. There are numerous pre-defined influencer indices accessible, with Klout score being one of the earliest examples. It rates an influencer's social media impact on a scale from 1 to 100, considering factors like followers, engagement, and activity. Its successors aim to provide a more comprehensive view of an influencer's efficiency in the digital space. These indices can be accessed through social media analytics platforms or mobile apps. For example, each social media platform has its own algorithm to rank posts in users' feeds, but there are differences in how these algorithms work to determine post popularity.
Despite the oversight of organizations like The Interactive Advertising Bureau (IAB) in online marketing, there are currently no specific standards for assessing influencers. While there are not direct guidelines pertaining to social media marketing practices, some existing standards can be indirectly applied to influencer marketing. For instance, ISO 20671 provides recommendations for the evaluation and measurement of brand value, which can be relevant when assessing the impact of influencer marketing on a brand [26].
Theoretical models
These models utilize different theories to measure the effects of digital influencers’ behaviour on their audience. Rogers’s Diffusion of Innovations Theory (1962) model focuses on how new ideas, products, and behaviours are spread through society. It assesses how influencers can act as early adopters and opinion leaders, impacting the diffusion process [27,28]. Social Cognitive Theory (1963) emphasizes how individuals learn from observing others, including influencers. It explores how influencers' behaviours and messages can influence the beliefs, attitudes, and actions of their followers [29,30]. Elaboration Likelihood Model (1986) looks at how individuals process persuasive messages. It categorizes influencers' content into central route (careful consideration of arguments) and peripheral route (quick, emotional reactions), predicting how followers will respond [31,32]. The Belief-Attitude-Behaviour theory [33] suggests that beliefs affect intentions through their effect on attitudes towards the behaviour. Later, the Theory of Reasoned Action (1975) extends the Belief-Attitude-Behaviour model by adding the concept of subjective norms to explain behavioural intentions. The Theory of Planned Behaviour (1988) built upon the Theory of Reasoned Action, incorporates the component of perceived behavioural control to enhance predictions of individual behaviour [34,35]. Ohanian’s Source Credibility Model (1990) evaluates the perceived credibility of the influencer. It considers factors such as expertise, trustworthiness, and attractiveness, which affects the way followers interpret and accept influencer messages [36,37].
These theoretical models provide conceptual frameworks for understanding how influencers impact their audiences, and furthermore can guide research into the efficiency of digital marketing campaigns.

3. Related Work

3.1. Customer Attitude towards the Role of Influencer Recommendations on Purchase Intention and Its Measurement

In the last fifteen years, there has been a growing interest among both e-commerce practitioners and academic researchers in the impact of digital influencers on purchase intention. In social media marketing, purchase intention refers to the likelihood of a consumer to purchase a product or service after exposure to marketing efforts on social media platforms. It reflects the consumer readiness to buy influenced by social media content like advertisements, sponsored posts, reviews, or influencer recommendations. This factor is vital for businesses as it helps predict potential sales and the effectiveness of their social media marketing initiatives.
Lim et al. have explored the effectiveness of social media influencers, focusing on the influence of four factors – Source credibility, Source attractiveness, Product match-up, and Meaning transfer [38]. The authors employ Partial Least Squares (PLS)-SEM technique to test the model with sample dataset of 200 respondents in Malaysia. The study revealed that three hypotheses are supported, except for this related to Source credibility. Mediating effect of Consumer attitude on Purchase intention has been also supported.
To determine the attitude of customers towards digital influencers’ activities, Xiao et al. utilize heuristic-systematic model to investigate how Information credibility affect evaluations of influencers’ posts in YouTube [39]. The authors have examined the relationships between nine key constructs – Expertise, Trustworthiness, Likability, Homophily, Social advocacy, Interactivity, Argument quality, Information involvement and Knowledge. A two-step, structural equation modelling data analysis approach was preferred to explore the correlation between variables. The study finds that Trustworthiness, Social influence, Argument quality, and Information involvement are factors with positive impact on consumer perceived Information credibility on YouTube. The analytic results also reveal a strong and positive correlation between perceived Information credibility, Brand attitude, and Video attitude.
Chekima et al. have clarified the relevance of three factors that affect the attitude to-wards digital influencers in Malaysian cosmetic industry [40]. This research examined the impact of social media influencer credibility (Attractiveness, Trustworthiness, and Expertise) on advertising effectiveness, specifically focusing on attitudes towards the product and advertisement, as well as Purchase intention. The goal was to determine the suitability of hiring a social media influencer to advertise cosmetic products on the local Malaysian market, as compared to using a celebrity. The study discovered that source Credibility has a significant positive impact on consumer attitudes. Using influencer marketing, cosmetic products marketers can develop effective ads to communicate with their customers.
Yuan and Lou proposed and verified the determinants of relationship between social media influencers and their followers, as well as their effects on followers’ interests in the products advertised by influencers [41]. The conceptual model includes eight key constructs – Attractiveness, Expertise, Trustworthiness, Similarity, Distributive, Procedural, Interpersonal and Informational fairness. The obtained results showed that the impact of four input constructs on the output variables are statistically significant – followers’ perceived Attractiveness of influencers, Similarity to influencers, Procedural and Interpersonal fairness.
Pham et al. developed a research model to determine the impact of influencers on Vietnamese generation Z (Gen Z) in the internet environment [42]. A conceptual model was developed based on a 24-question survey. The input variables were categorized into the following second order constructs: Argument quality, Perceived usefulness, and Social influence, each comprising Attractiveness, Expertise and Trustworthiness. The analysis of the obtained results confirmed the research hypotheses that Attitude towards social media influencers in the Vietnamese market directly depends on the given constructs.
Ata et al. investigated the significant factors influencing consumer purchase intention following social media advertising in Turkey [43]. Their study found that Attractiveness, Expertise, and Trustworthiness positively influence buying behaviour. However, they observed that the impact of Attitude towards social media advertising on Purchase intention is statistically insignificant.
Ebrahimi et al. studied how social network marketing affect the consumer purchase behaviour of Hungarian users in Facebook Marketplace [44]. The results of this study indicate that the five constructs (Entertainment, Customization, Interaction, WoM and Trend) have positive and significant effects on customer buying decisions. Furthermore, they used clustering algorithms to cluster consumers. Using the obtained cluster profiles, marketing managers can develop targeted strategies tailored to the preferences and characteristics of each cluster.
Niloy et al. analysed four influencing factors (Source credibility, Source attractive-ness, Product match-up and Source familiarity) and two output constructs (Attitude to-wards influencers and Purchase intention) using multiple linear regression (MLR) [45]. The results reveal that Attitude towards influencers is positively correlated and significantly influenced by Source attractiveness, Product match-up, and Source familiarity. However, Source credibility was found to be insignificant factor impacting Attitude towards influencers.
Ooi et al. investigated the impact of Mobile convenience, Interactivity, and Influencer Credibility on the Attitude towards social media influencer and Attitude towards advertised product or service, as well as how these outcomes lead to actual buying decisions. The results indicate that Interactivity is playing negative direct and indirect roles on both user attitudes. Furthermore, the Attitude towards product or service is a factor, which mediate the direct effect of Attitude towards the social media influencer on Purchase intention [46].
Al-Sous et al. surveyed the impact of social media influencers on consumer behaviour by examining two factors affecting Influence purchase intentions of Jordanian Facebook users – Information quality and Trustworthiness [47]. The results confirm significant impact of both factors on Attitude towards a brand, which in turn determines customer Purchase intentions.
Coutinho et al. studied the factors that influence consumer attitude (Brand equity) and Purchase intention by conducting an empirical study in the context of Portugal social media marketing [48]. The authors have developed a conceptual model that includes four key constructs—Attractiveness, Expertise, Trustworthiness and Brand equity—and test the model using SEM with survey data. The analysis indicates that both constructs (Attractiveness and Brand equity) have a significant positive impact on Consumer purchase intention, and they are positively interrelated.

3.2. Comparison of Existing Models of User Attitudes towards Social Media Influencers

The studies outlined in the preceding subsection rely on factors originating from seminal works in the field of Source Credibility theory, including Credibility and Attractiveness [49], and Attractiveness, Expertise, and Trustworthiness [50]. The majority of studies have employed PLS-SEM, while two models have been built using other techniques – machine learning k-means clustering [44] and multiple linear regression [45]. The key characteristics of models illustrating the factors affecting user perception of social media marketing are outlined in Table 1.
The distribution of constructs in the above-mentioned models is as follows: Purchase intention – 9/11; Attractiveness (Likability, Similarity) – 9/11; Trustworthiness – 8/11; Attitude towards ad, brand, product or service including Product interest – 7/11; Expertise – 7/11, Attitude towards influencers (Parasocial relationship) – 6/11; Convenience (Perceived usefulness, Product match-up) – 4/11; Interactivity (Interaction) – 3/11; Argument quality – 2/11, etc. The effectiveness of the models proposed in the literature varied from 49.0% [38] to 84.1% [44], with the number of latent variables ranging from 2 to 9. The number of statistically significant factors fluctuates in the same interval.
Despite the considerable research on the factors affecting customer satisfaction in internet influencer marketing, widely accepted metrics for evaluating this online marketing tool are still lacking. Additionally, current research on the impact dimensions of social media influencers in the European Union electronic market context is limited and does not fully consider the dynamic changes in consumer preferences and behaviour. Therefore, identifying new approaches and conducting empirical investigations in this field can help fill these gaps and offer valuable insights for both businesses and marketing agencies.

3.3. Main Factors Affecting Consumer Attitudes towards Social Media Influencers and Their Impact on Buying Decisions

The source credibility theory, interactivity theory, and the theory of planned behaviour can be adapted and applied to comprehend the adoption and acceptance of influencers, particularly in the context of digital marketing and social media platforms. Based on the literature review, the primary factors determining user attitudes towards social media influencers can be represented in a theoretical model with three main input constructs: Convenience, Interactivity, and Source Credibility. Source Credibility is a second-order construct, encompassing the influencer Attractiveness, Expertise, and Trustworthiness. This combination offers the advantage of integrating both internal factors (Convenience and Interactivity) and external factors (Source Credibility) related to social media plat-forms, thereby enhancing consumer purchase intention. The following section provides a detailed overview of the factors in our proposed model.
Convenience
The concept of Convenience originates from the Ease of use and Perceived usefulness of technology in the Technology Acceptance Model (TAM) [51] and the Unified Theory of Acceptance and Use of Technology (UTAUT) [52]. It encompasses factors such as mobile access, user-centric interfaces, fast loading times, and intuitive navigation. Convenience allows users to connect quickly and effortlessly with others, consume content, and react to posts and updates. It also enables businesses and influencers to reach their target audience, as users are more likely to engage with content that is easily accessible and user-friendly [53,54].
Interactivity
The notion of Interactivity in communication research, especially in relation to emerging digital media technologies, has been investigated by numerous scholars [55,56]. Interactivity in social media is defined as the degree to which users can actively engage with content and other users on the platform [57]. Unlike push marketing in the past, interactive social media marketing creates real-time dialogue between the business and its customers. Advertising has become a dynamic process that follows customers rather than leading them [Jun & Yi 2020]. Interactivity enhances user engagement and helps community building on social media platforms. Influencers leverage the feedback provided, such as consumer impressions and preferences, to tailor and direct their advertising endeavours more effectively [58].
Source credibility
The source credibility theory [59] postulates that the credibility of endorsers could influence the beliefs, attitudes, and behaviours of receivers towards the endorsed objects. Kelman’s source characteristics [49] identify three features of successful marketing communication sources: credibility, attractiveness, and power.
The dimensionality and dimensions of source credibility varied among the researchers depending on the study. Expertise and trustworthiness are two predictors of source credibility, according to a study of Hovland et al. [60]. Some later studies have employed attractiveness and trustworthiness to determine the reliability of source expertise [36]. All three dimensions were important to purchase intentions and affected involvement with the advertisement message equally [50].
Brands can employ source credibility theory by carefully selecting influencers who are perceived as credible by their audience. They focus on influencers who demonstrate expertise, trustworthiness, and attractiveness, as these qualities enhance the effectiveness of brand messages. Influencers employ credibility theory principles to establish and up-hold their credibility, emphasizing consistency in brand values, transparency in sponsored content, and engagement with followers to foster trust and loyalty.
a) Attractiveness
The Source Attractiveness Model, introduced by McGuire [61], supplements the Source Credibility Theory by highlighting the impact of source attractiveness on message effectiveness. This model posits that source attractiveness, which includes familiarity, likability, and similarity, can influence how a message is perceived. It is commonly combined with the Source Credibility model to evaluate the effects of endorsements and testimonials on consumer attitudes and purchase intentions. Source attractiveness, along with trustworthiness and expertise, contribute to the overall credibility of marketing communications.
The Attractiveness includes factors such as their personality, appearance, content style, and overall reputation. An attractive influencer can captivate the audience attention, increase engagement, and build a loyal following [40,62].
b) Expertise
The expertise of online influencers refers to their knowledge and authority in a specific niche or industry. An influencer with Expertise is seen as knowledgeable, credible, and trustworthy by his/her audience. He/she is considered expert in his/her field, which enhances his/her ability to influence opinions, behaviours, and purchasing decisions of the followers [38,63].
c) Trustworthiness
Trustworthiness of social media influencers refers to the perceived reliability, hones-ty, and credibility of the influencer by their audience. An influencer who is considered trustworthy is more likely to have loyal followers who believe in his/her recommendations and opinions. Trustworthiness is crucial for building and maintaining a strong relationship with followers, which in turn influences their purchase decision and brand preferences [64,65].
The output constructs of the proposed model of social media influencer effects on users are attitudes towards influencers, brands and/or product/service, which together contribute to forming purchase intention.
Attitude towards social media influencers
Attitude towards social media influencers refers to the general feelings, beliefs, and evaluations that individuals hold about influencers on social media platforms. This factor can be analysed using the Belief-Attitude-Behaviour model, aiding in understanding how beliefs about influencers translate into attitudes and subsequent actions [66]. This factor can significantly impact consumer behaviour, influencing his/her engagement with influencer content, willingness to follow recommendations, and overall brand perception.
Attitude towards brand, product or service
The concept is central to theoretical models like the Theory of Reasoned Action and Theory of Planned Behaviour, which explain how attitudes towards products and services impact on consumer behaviours and intentions. Attitude towards brand refers to individual's preferences, feelings, beliefs, and evaluations regarding a particular brand [67]. These three attitudes reflect the overall perception and liking towards the brand, product, or service, which can influence consumer buying behaviour and purchase intentions. Positive attitudes typically lead to a higher likelihood of purchasing or recommending the brand, product, or service, while negative attitudes can deter consumers from engaging with or purchasing the brand, product or service.
Purchase intention
Purchase intention refers to a consumer predisposition or plan to buy a particular product or service in the future. As a key concept in consumer behaviour research, it indicates the likelihood of a purchase based on various factors such as attitudes, perceptions, and external influences [68]. The term is defined by individual consumers based on their needs, preferences, attitudes, perceptions, and various other factors. It is not defined by a single entity but rather emerges from the complex dependencies between personal, social, cultural, and economic influences on an individual's decision-making process [69,70].
The factors highlighted above demonstrate the diverse aspects of consumer attitudes towards social media influencers. In the following section, this study employs an integrated approach to assess how these factors influence customer purchase behaviour in relation to attitudes towards influencers, brands, and products. Social media platforms and marketers can utilize these insights to enhance customer experience, promoting sustained loyalty over time.

4. Research Methodology

Our research methodology aims to uncover and describe customer perceptions of digital influencers, with a focus on forecasting future changes. To achieve this goal, we will collect primary data and employ a variety of analytical techniques. These techniques include descriptive statistics and predictive Machine Learning methods, along with a multi-criteria decision-making approach. Additionally, we will conduct sentiment analysis on user opinions to identify common issues faced during interactions with social media influencers. These results will offer valuable insights for marketing managers to address customer concerns and refine their marketing strategies accordingly.

4.1. Questionnaire Design and Data Collection

The survey method was chosen as a primary research tool due to its ability to collect a large volume of data and analyse it to gain insights into customer preferences and behaviour regarding social media influencers. Online surveys were particularly favoured for their wide reach, convenience, cost-effectiveness, ease of design and relative quick pro-cessing. A questionnaire was designed based on previous research on customer perceptions of interactions with digital influencers [53,71,72,73], following the format proposed by Ooi et al. [46]. The questionnaire comprises five main sections: introduction, demographics, experience with social media influencers, attitudes toward them and products or services, and purchasing intentions.
Indicators for Question #10 (Convenience) and Question #11 (Interactivity) were adapted from Wu and France et al., respectively [53,73]. Both Convenience and Interactivity factors consist of five indicators each. The items for Question #12 (Attractiveness), Question #13 (Expertise), and Question#14 (Trustworthiness) were sourced from Munnukka et al. [72]. Question #15 and Question #16, which measure attitude towards influencers and attitude towards products or services respectively, have been obtained from Silvera and Austad [71]. The last five factors (Attractiveness, Expertise, Trustworthiness, Attitude towards influencers and Attitude towards products or services) consist of four indicators each. Two indicators for Question #17 (Purchase intention) for respondents’ expenditures due to social media influencer advertising were adapted from Cheung et al. [74]. To incorporate participants’ opinions, suggestions, and their favourite influencers, the last two questions (Question #19 and Question #20) were included based on recommendations from marketing experts [75]. The research details and questionnaire link have been disseminated through partner organizations via classic web and social media communications.

4.2. Questionnaire Measurements and Scales

Approximately 35% of the survey questionnaire (7 out of 20) is composed of “multiple choice grid” questions that implement a five-point Likert scale, ranging from “Strongly disagree” to “Strongly agree”. A further 40% of the questionnaire (8 out of 20) comprises “multiple choice” questions. Three questions require open-ended text responses to be entered into text fields marked as “short answer” or “paragraph” type in Google Forms. Finally, two questions are formulated using five-point linear scale.

4.3. Data Analysis Methods

The data analysis methods for the investigation of user attitudes towards social media influencers can be divided into three main groups: statistical methods, machine learning methods and multi-criteria decision-making methods.
The first group comprises methods that measure object properties, summarize, and visualize the main characteristics of multi-dimensional data. The analysis utilizes techniques such as tests for normality, t-test, analysis of variance (ANOVA), chi-squared test and regression analysis. Partial Least Squares Structural Equation Modelling (PLS-SEM) as a modern statistical method, also belongs to this category, because it is particularly suited for complex models with latent variables and smaller sample sizes [76].
Machine learning methods such as cluster analysis, predictive modelling and sentiment analysis are employed to uncover hidden relationships between variables. Cluster analysis group similar observations, while sentiment analysis extract and analyse subjective information from text opinions. By utilizing ML methods, researchers can uncover hidden patterns and relationships between variables that may not be apparent using traditional statistical methods. Unlike statistical methods, ML algorithms do not focus on testing theoretical models or causal relationships. Instead, they are data-driven and aim to predict future outcomes based on past data patterns.
MCDM methods provide a systematic approach to decision-making in influencer marketing, considering multiple criteria simultaneously to make informed and data-driven choices. MCDM techniques can be applied for marketing campaign evaluation, content optimization, influencer selection and other similar problems requiring alternatives’ ranking.
While classical and modern statistical methods like SEM are suited for hypothesis testing and understanding complex theoretical models, machine learning methods are more data-driven and focused on extracting insights from large datasets, primarily for tasks such as prediction, segmentation, and sentiment analysis. In contrast, MCDM methods provide a comprehensive approach to analysing consumer attitudes towards social media influencers, offering a more nuanced understanding of consumer preferences and behaviour.
The benefits of integrating various data analysis methods for social media influencer research include: obtaining an overall view, improving accuracy, enhancing segmentation, optimizing campaigns, validating data, monitoring in real-time, and making strategic decisions.

5. Data Analysis

The proposed methodology (Section 4) has been applied to address the research tasks.
Customers’ data collection
We distributed the online survey link via our institutional websites, email, and social media platforms. The survey was aimed at Bulgarian online customers, and the participation was voluntary. Utilizing Google Forms, the survey comprises 20 questions designed to gauge customer perceptions of the variables under this study [75]. Data on customer attitudes towards social media influencers was collected from January 8, 2024, to March 14, 2024. A total of 376 respondents completed the questionnaire. Duplicate checking was conducted, and no identical values were found in the dataset rows. However, the model constructs data (Question #10 to Question #18) revealed one duplicate dataset row (#337 duplicates #233). Since the dataset does not contain completely identical records, all observations will be included in the analysis.
Figure 1 visualizes the degree of similarity among respondents’ answers, with closer distances indicating smaller differences. The degree of similarity is depicted by different colours, ranging from full coincidence (0—light blue colour) to maximum difference (25—blue colour). To visualize the dissimilarity matrix, we utilized the fviz_dist() function from the factoextra R package.
Data storage
The questionnaire and respondents’ answers are available online [75].
Data encoding
The coding rules and coded data are accessible online [75]. Among the 20 questions, responses to 17 questions have been coded. Additionally, the three open-text answers (municipality, opinions, and list of followed influencers) have undergone further processing.
Data preprocessing
Preprocessing was conducted, and the dataset underwent examination to ensure accuracy and consistency.
Statistical analysis
To clarify the profile of the participants in the survey, a classical statistical analysis (percentage distribution of responses, descriptive statistics, and correlation analysis) has been performed.
Main Characteristics of Respondents in the Sample
Table 2 presents the demographics of the survey participants. Most respondents are female, making up 74% of the total participants (Question #1). More than two-thirds (72%) of the respondents are under the age of 30 (Question #2). The sample is evenly split between individuals with at least a university degree, accounting for 50.2%, and those with higher education (50.8%) of the participants (Question #6). Additionally, the survey primarily targeted urban areas, with 94.6% of the respondents residing in such locations (Question #3).
In terms of geographic distribution, most respondents are from the Plovdiv municipality, comprising 52% of the total survey participants. Additionally, the Asenovgrad municipality represents 5% of the total respondents, while the Pazardzhik municipality accounts for 4% of the respondents (Question #4). Geographically, the survey was primarily conducted in the South-Central region, covering 82.2% of the participants, followed by the Southwestern region (3.7%).
Ninety-six percent of the participants indicated that they visit social media sites daily (Question #8), aligning with findings from Statista regarding daily social media usage [77]. Furthermore, more than half of the respondents (51.1%) stated that they follow more than 10 influencers (Question #9). This percentage reflects a significant increase compared to the adoption of digital influencers in developed countries such as the UK, where only 15% reported following 10 or more influencers [78] in 2023. One possible explanation for this contrast is that 59.9% of respondents in our sample belong to Generation Z and Millennials.
Feature selection
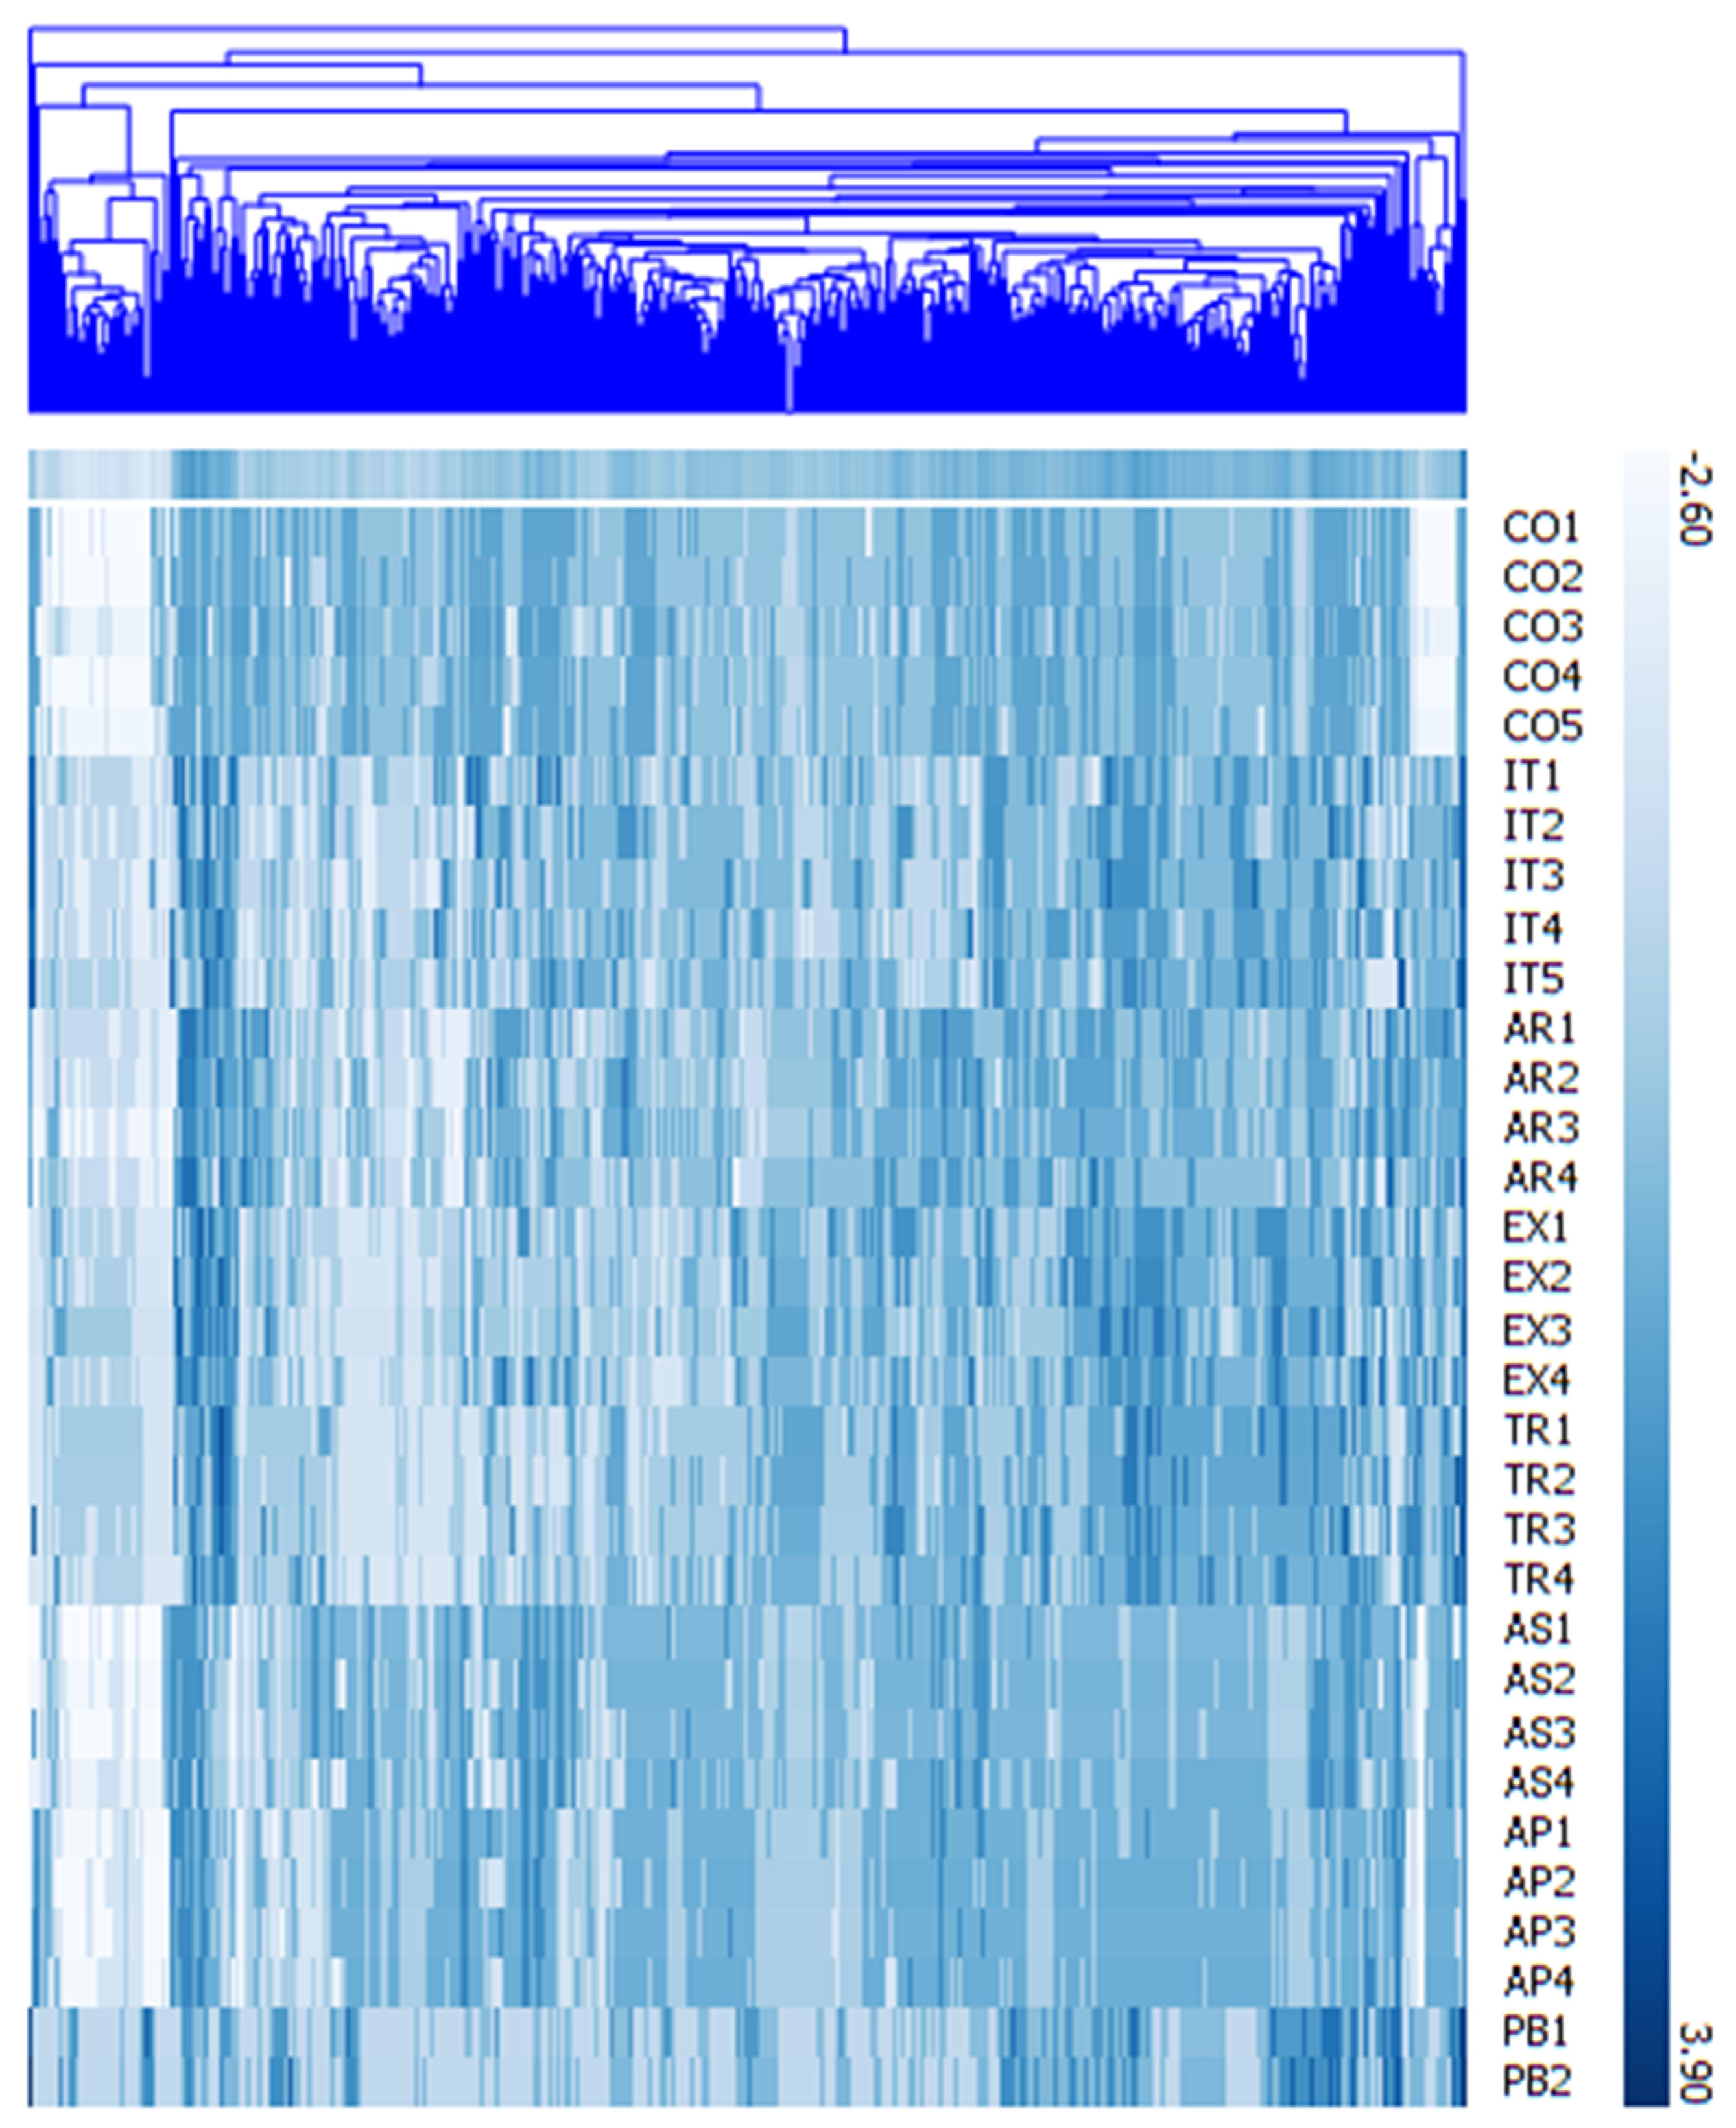
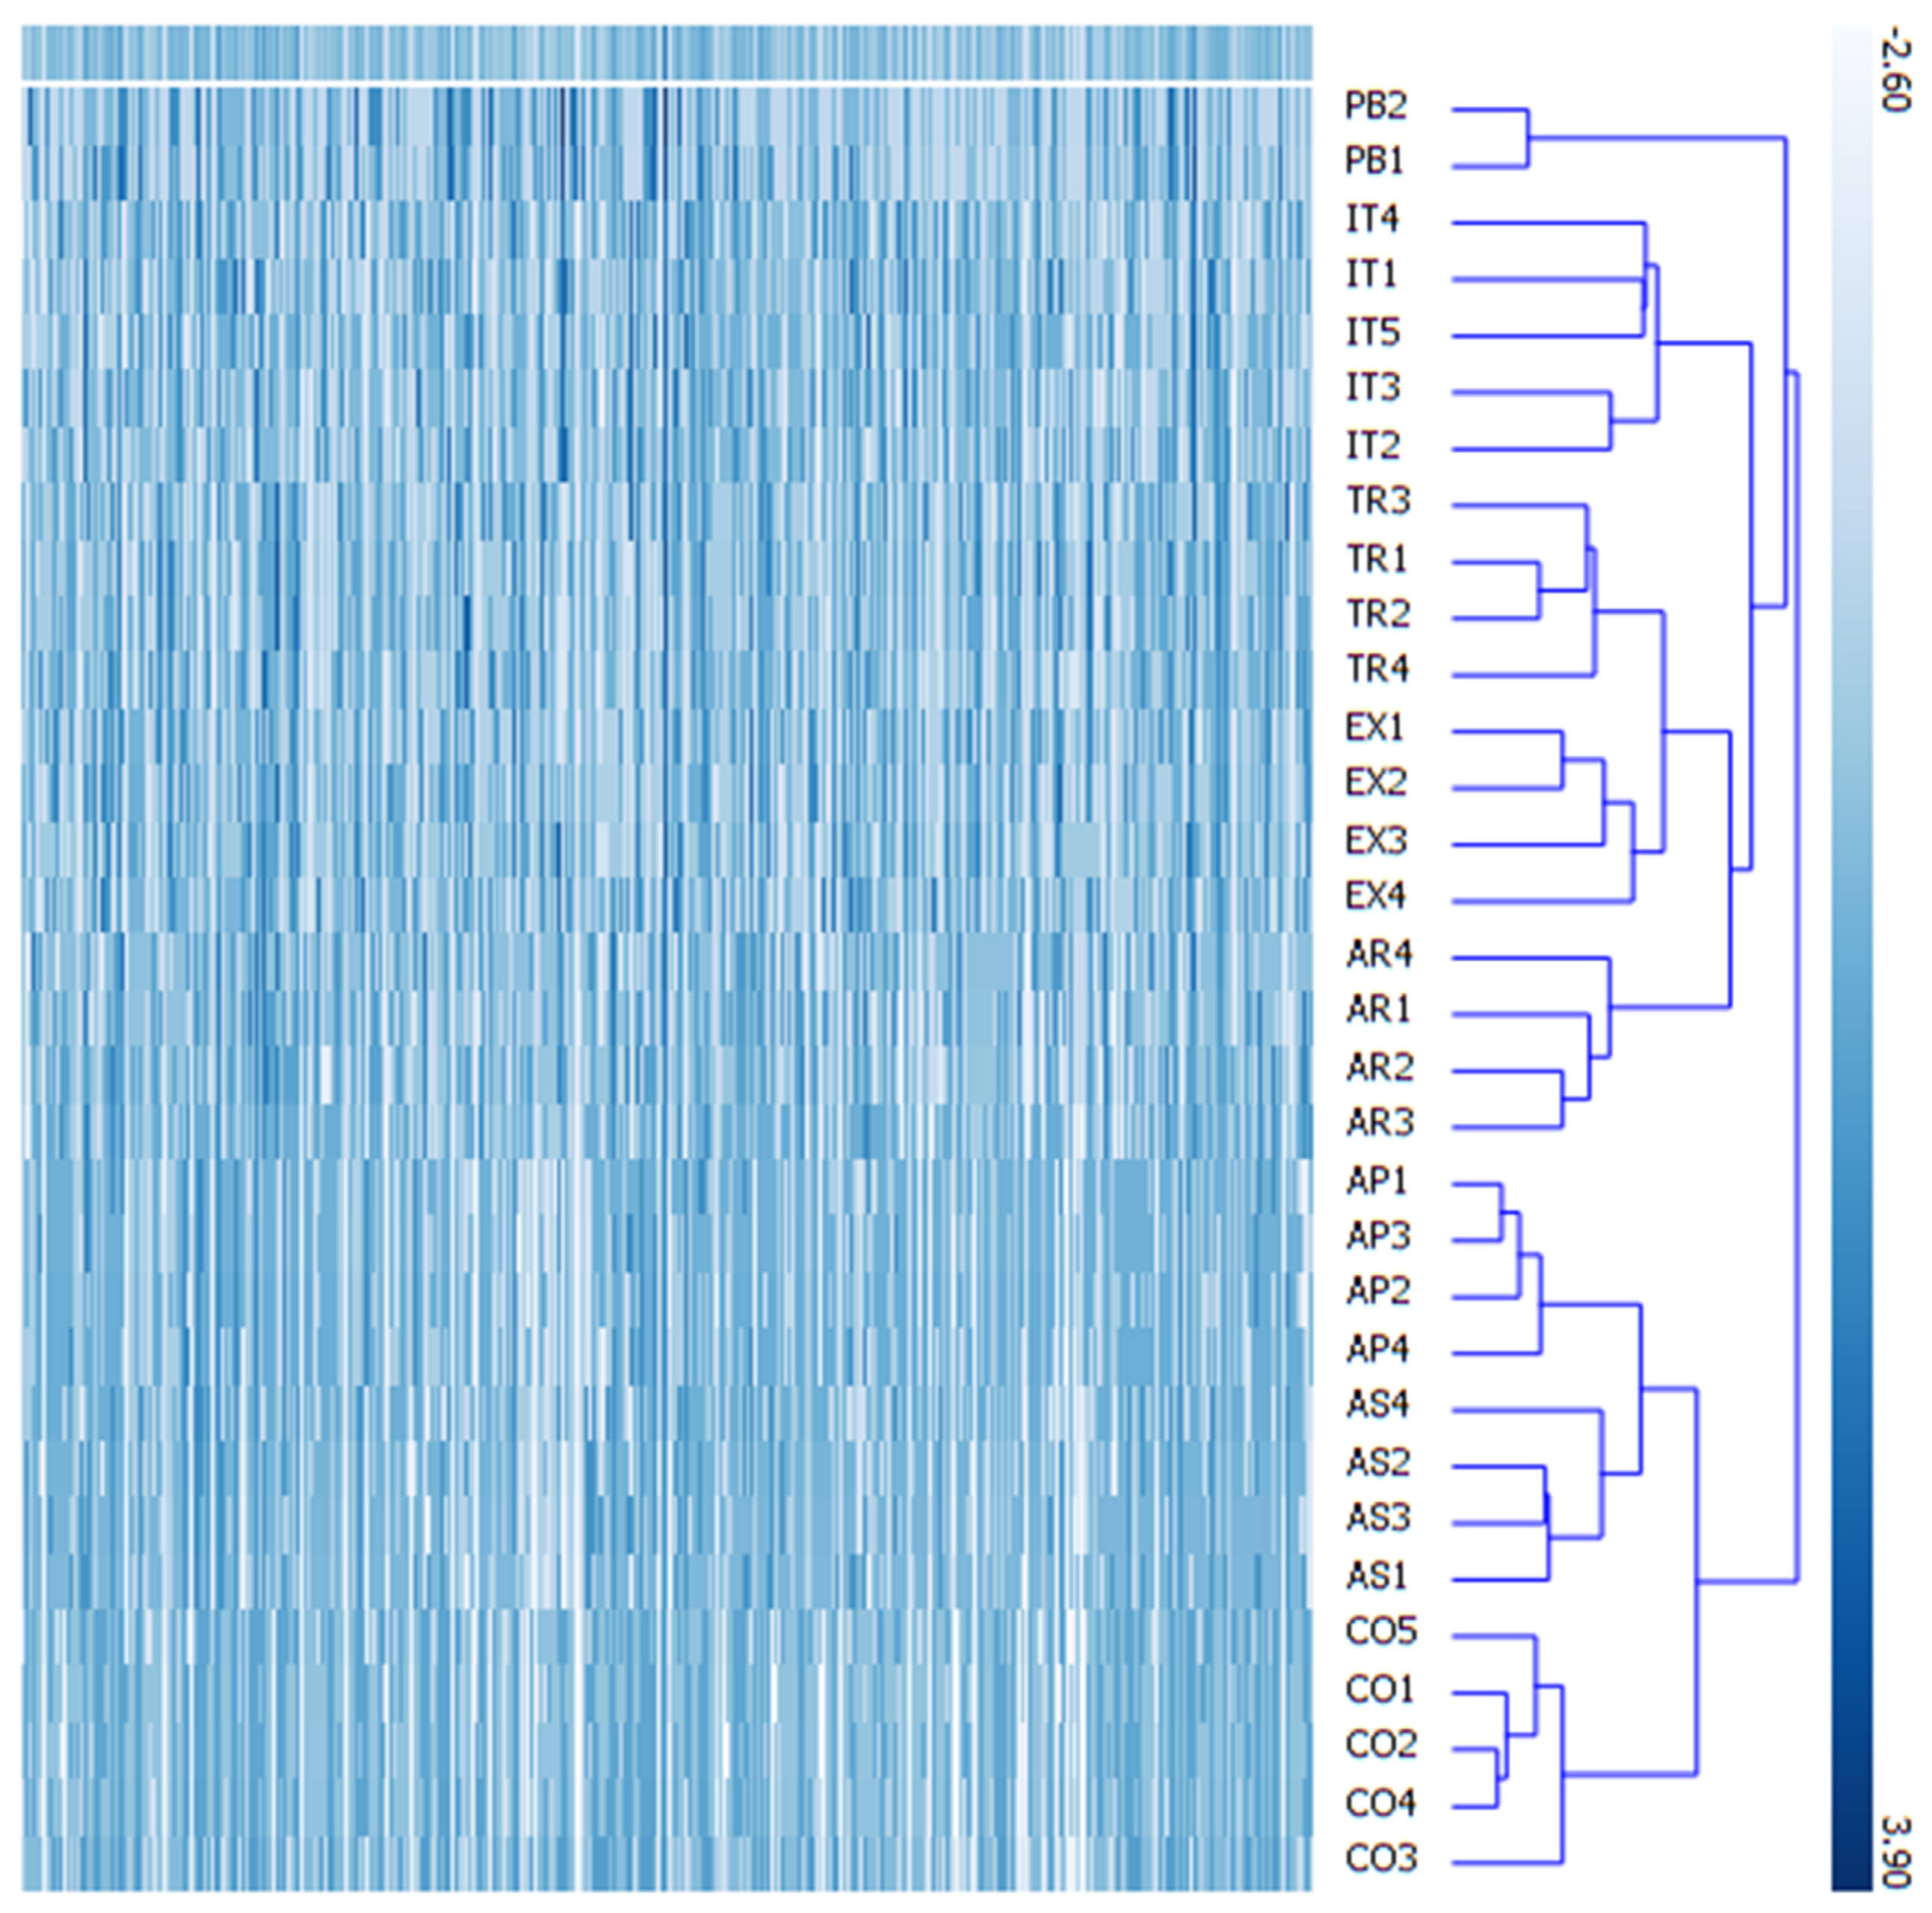
To visualize the spectrum of attitudes towards digital influencers, we employed hierarchical clustering with heat maps, as depicted in Figure 2 for observations and Figure 3 for attributes. The colour gradient in the heat maps corresponds to standardized values, ranging from light blue (minimum value approximately −2.60) to blue (maximum value approximately 3.90). The hierarchical structure shown atop Figure 2 illustrates the grouping of respondents based on their similar attitudes. Similarly, the dendrogram in Figure 3 (right) illustrates the similarities between variables. These heat maps reveal clusters of data points with similar characteristics, without any notable anomalies or irregularities. The Heat Map widget in Orange 3.22 software was utilized to generate these visualizations.

5.1. Clustering

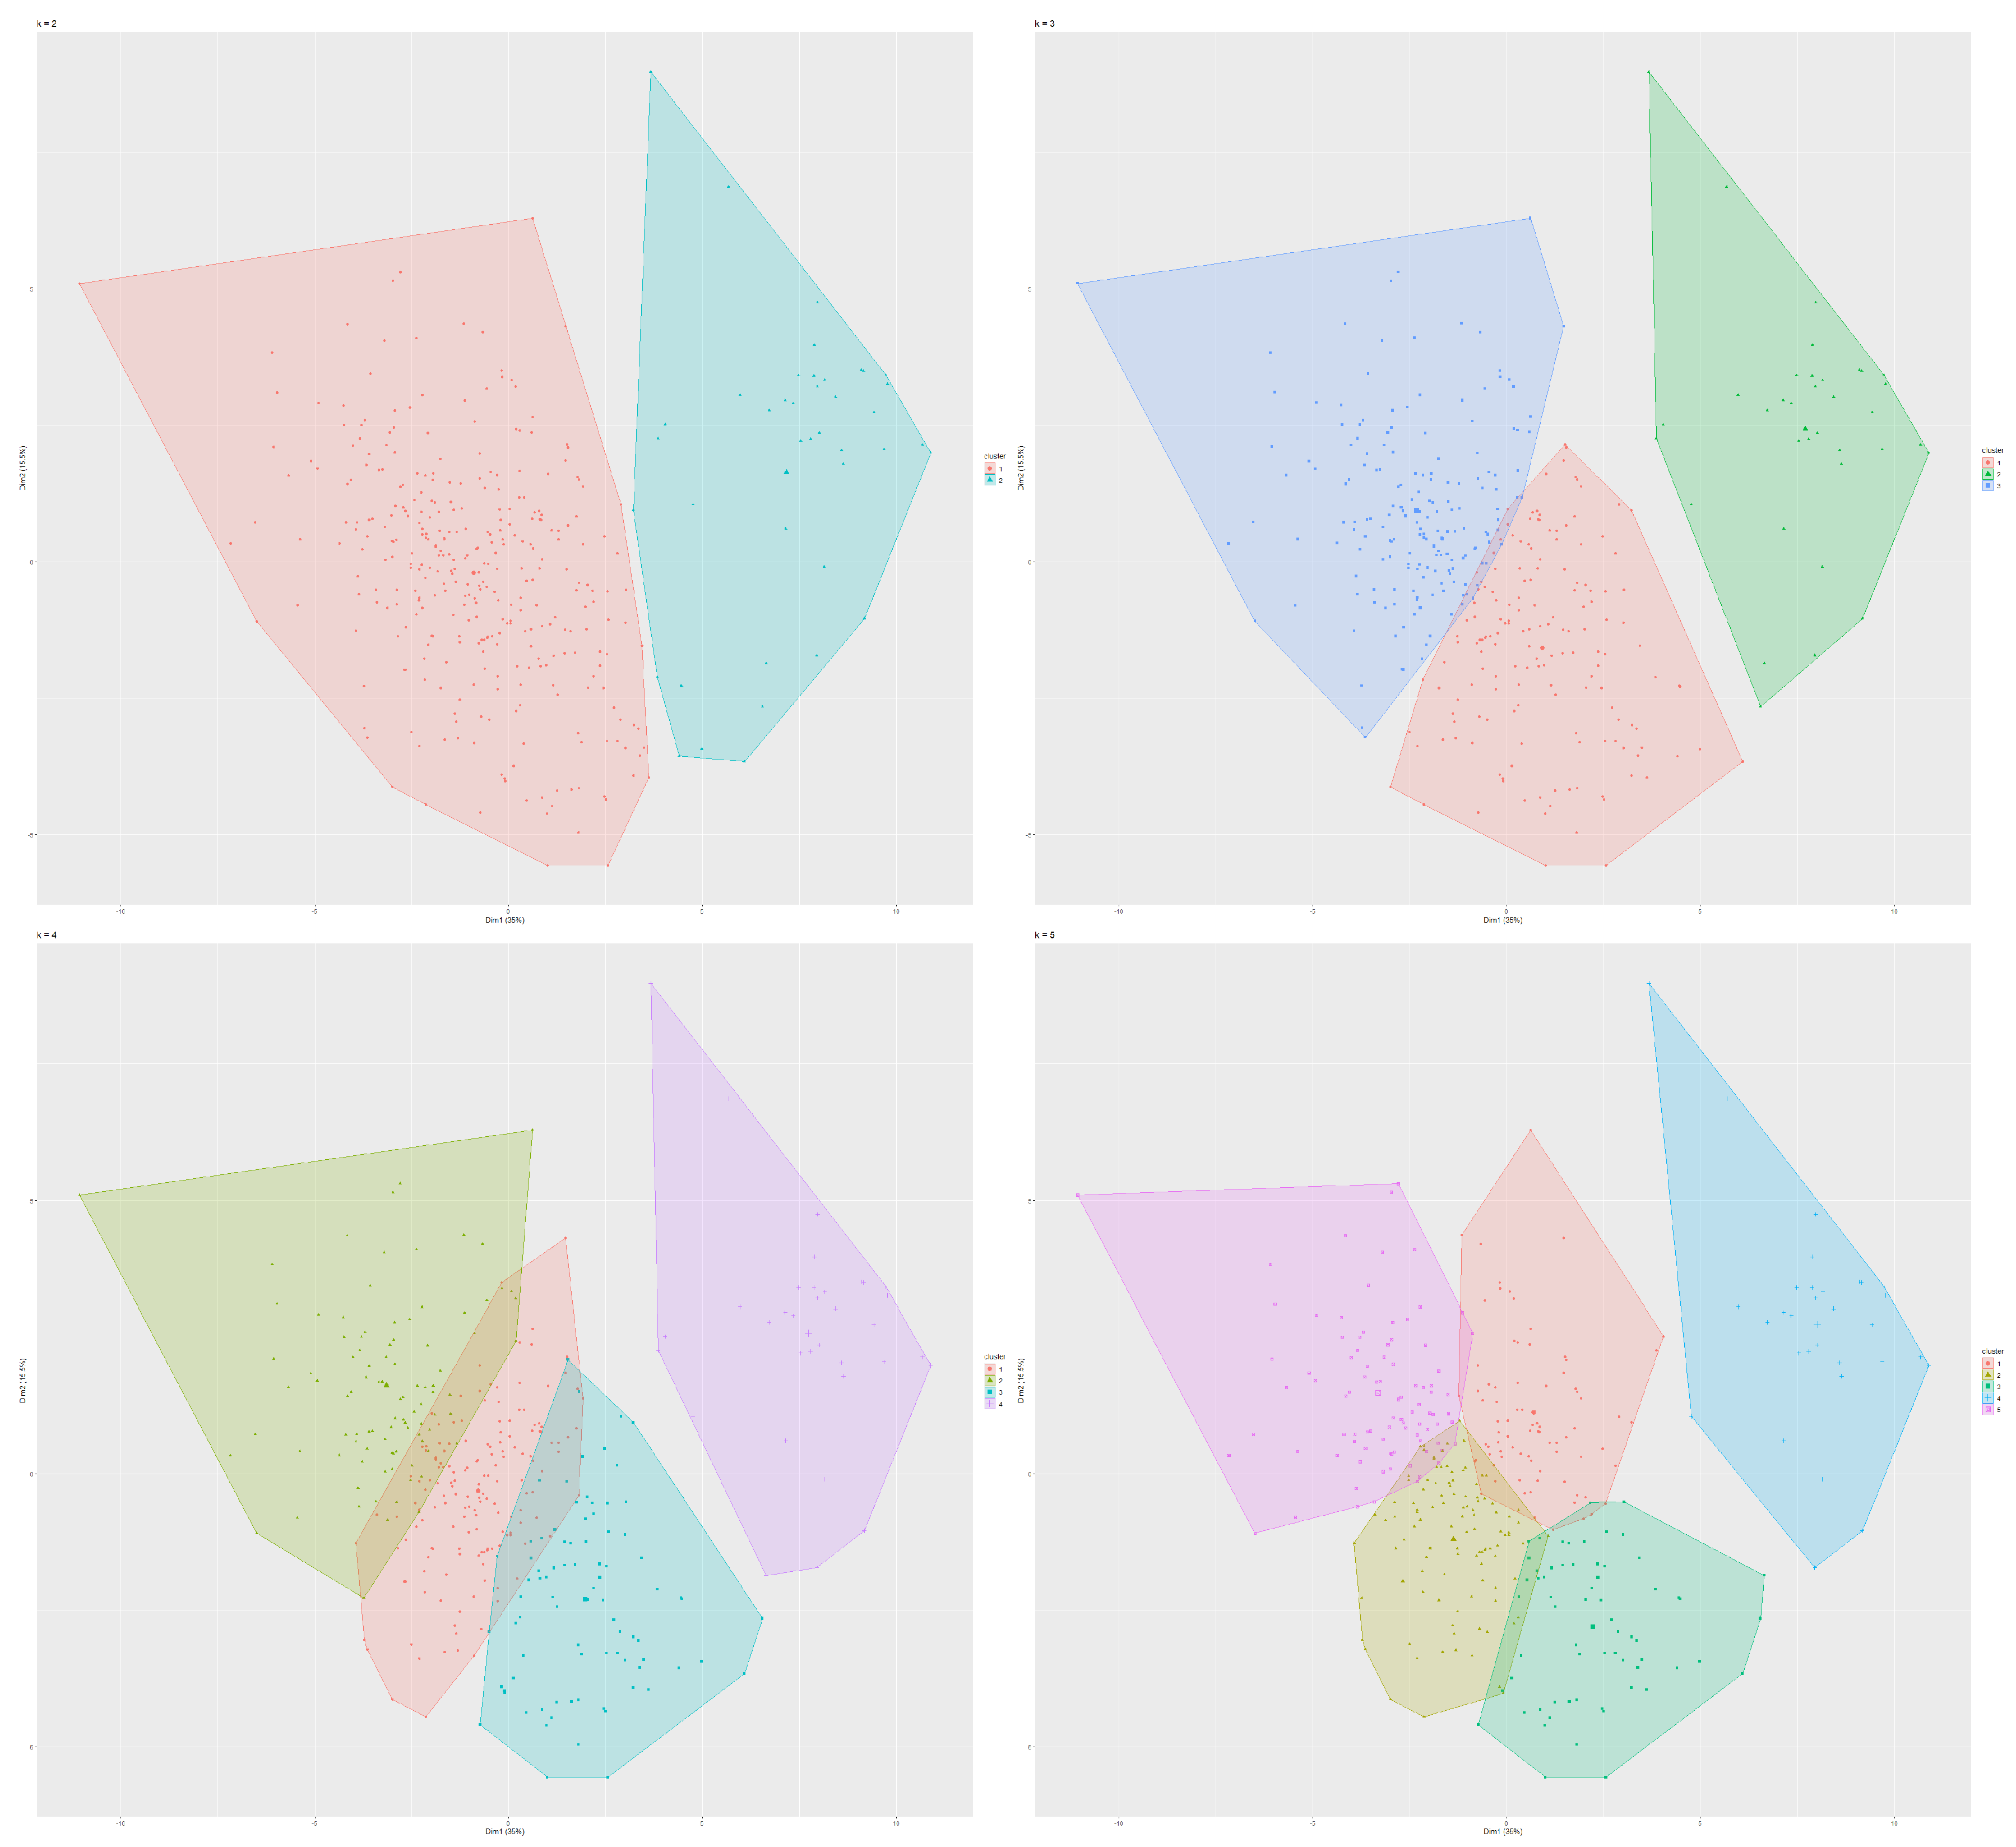
To identify the groups of customers with similar characteristics and variables that have a comparable effect on consumer attitudes, we employ k-means method for cluster analysis and multi-criteria decision-making approach. The number of clusters is determined using the Elbow and Silhouette methods, and the results revealed that the optimal number of clusters is two. The two clusters consist of 334 and 42 respondents, respectively. Figure 4 shows that when k = 2, there is no overlap between clusters. This means that the k-means method offers a feasible solution to the problem of identifying clusters of customers with similar attitudes towards internet influencers.
The first cluster (Cluster #1) comprises 334 “satisfied” customers, demonstrating more positive perceptions of social media influencers. They exhibit higher ratings for influencer characteristics (Question #10 – Question #14), attitudes towards influencers and products or services (Question #15 and Question #16), and purchase intentions (Question #17 and Question #18) (Table 3). Among the indicators, Convenience (Question #10), Attractiveness (Question #12), and Expertise (Question #13) exert the strongest influence on overall satisfaction. In contrast, the second cluster reflects some dissatisfaction with digital influencer relationships, with Trustworthiness (Question #14) and Interaction (Question #12) being the most significant factors contributing to the negative attitude of this group of users. Table 3 illustrates the average values of the indicators for both clusters, along with the differences between these estimates.

5.2. Sentiment Analysis

The open-ended question regarding respondents’ opinions about social media influencers (Question #19) elicited 146 text responses. Following preprocessing and filtering, 140 responses remained, reflecting user perceptions about influencers. Sentiment analysis of these responses yielded the following scores: 61 positive (average value 0.751), 21 neutral (average value 0.524), and 47 negative (after excluding 11 opinions with a score of less than 0.010; average value 0.181). Overall, respondents generally support digital influencers as a convenient source of information, although negative opinions often center around concerns regarding influencers’ expertise in promoted products and their trustworthiness in endorsing certain product categories. Neutral opinions acknowledge the benefits of digital influencer usage but highlight behavioural weaknesses. The Azure Machine Learning add-in in MS Excel was utilized for sentiment analysis.
The final open-ended question concerning preferred social media platforms and influencers (Question #20) garnered responses from 257 participants (after preprocessing). The resulting rankings for the top 5 social media platforms closely resemble those found in a recent research report [79], with a Spearman correlation coefficient of 0.742. Similarly, the rankings for the top 5 influencers, based on their number of followers, also present strong similarity, with a Spearman correlation coefficient of 0.883. These findings underscore the consistency of preferences among respondents and align closely with broader online marketing trends.

5.3. SEM Model of Customer Attitude and Purchase Intention towards Digital Influencers

Based on the review of previous research (Section 3), there is a lack of consensus regarding the definition of inputs and outputs for evaluating consumer perceptions and attitudes towards social media influencers. To address this issue, we iteratively utilize the PLS-SEM method in SmartPLS software [80]. Additionally, we adhere to the standard five-step procedure for PLS-SEM model creation.
Step 1. Formulate hypotheses about input and output variables and their relationships.
Based on the synthesis and comparison of existing models for customer attitudes towards internet influencers (Table 1), the research hypotheses in this study are formulated as follows [46]:
H1: There is a significant impact of Convenience on Attitude towards social media influencers.
H2: There is a significant impact of Interactivity on Attitude towards social media influencers.
H3: There is a significant impact of Influencer credibility on Attitude towards social media influencers.
H4: There is a significant impact of Influencer credibility on Attitude towards products or services.
H5: There is a significant impact of Attitude towards social media influencers on Attitude towards products or services.
H6: There is a significant impact of Attitude towards social media influencers on Purchase intention.
H7: There is a significant impact of Attitude towards products or services on Purchase intention.
H8: Demographic characteristics have statistically significant mediating effects on customer attitudes or on purchase intentions.
Note: The demographic characteristics include Gender, Age, Education level and Residence.
Step 2. Identify indicators for latent variables.
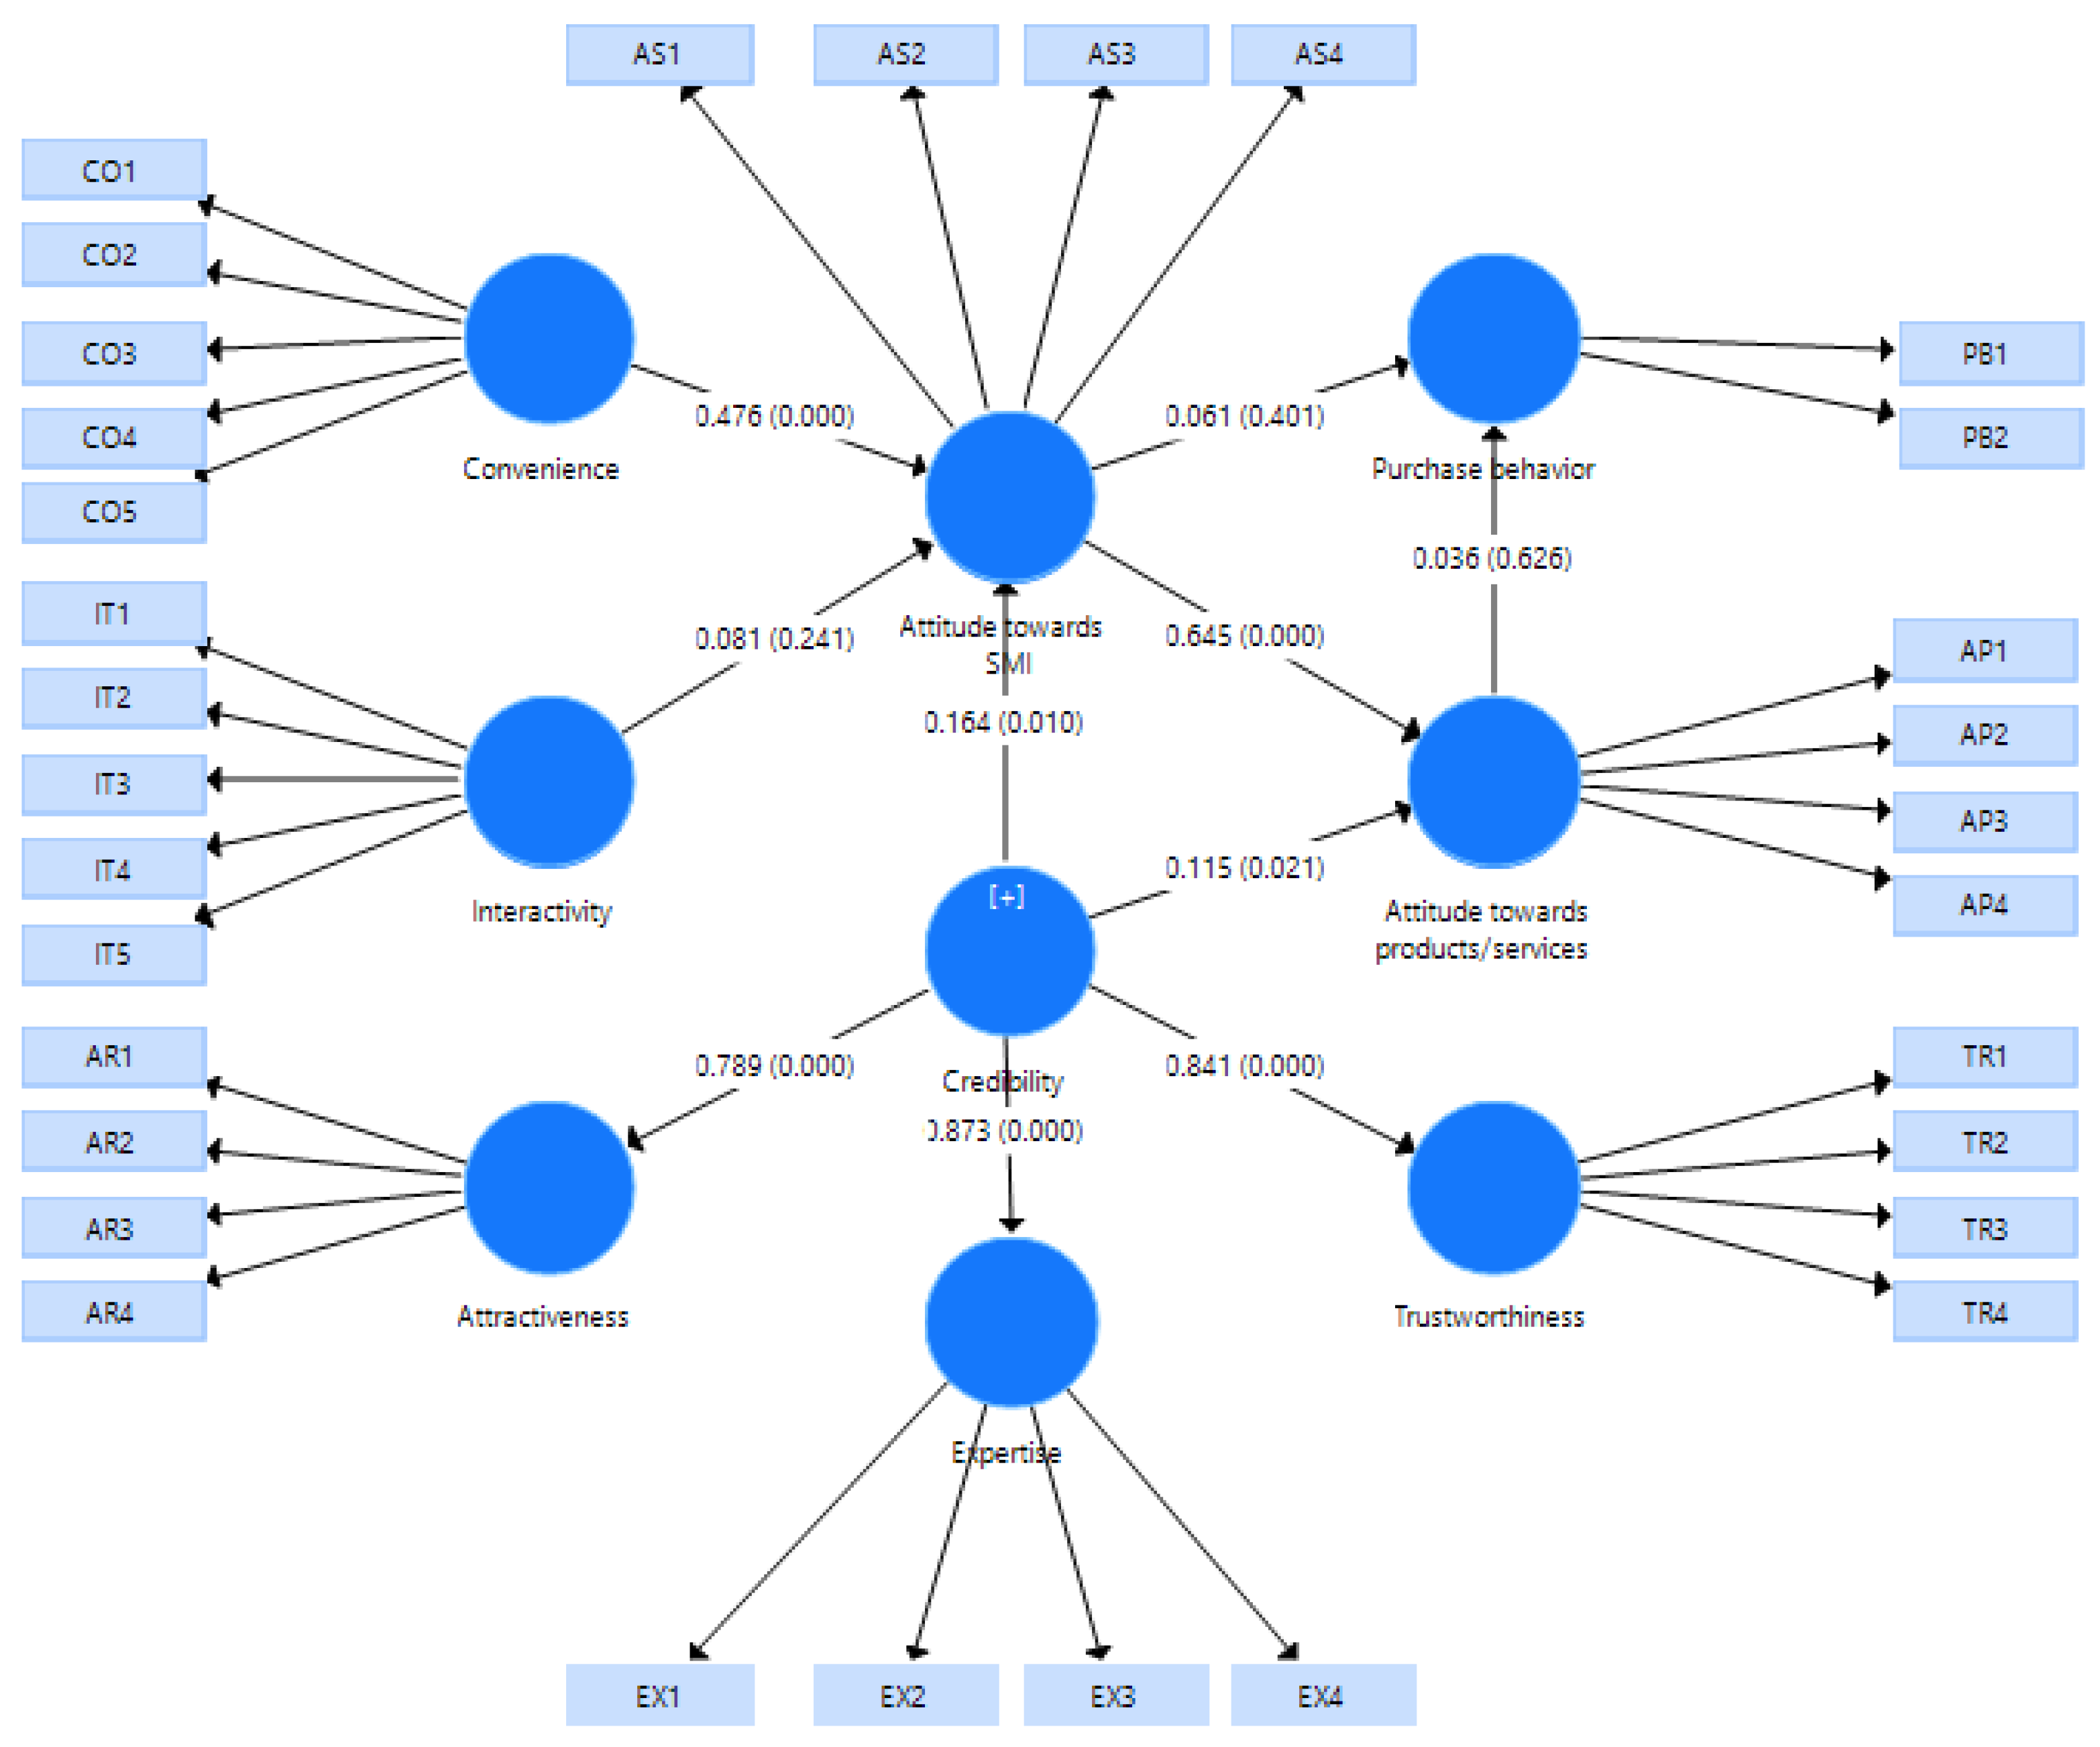
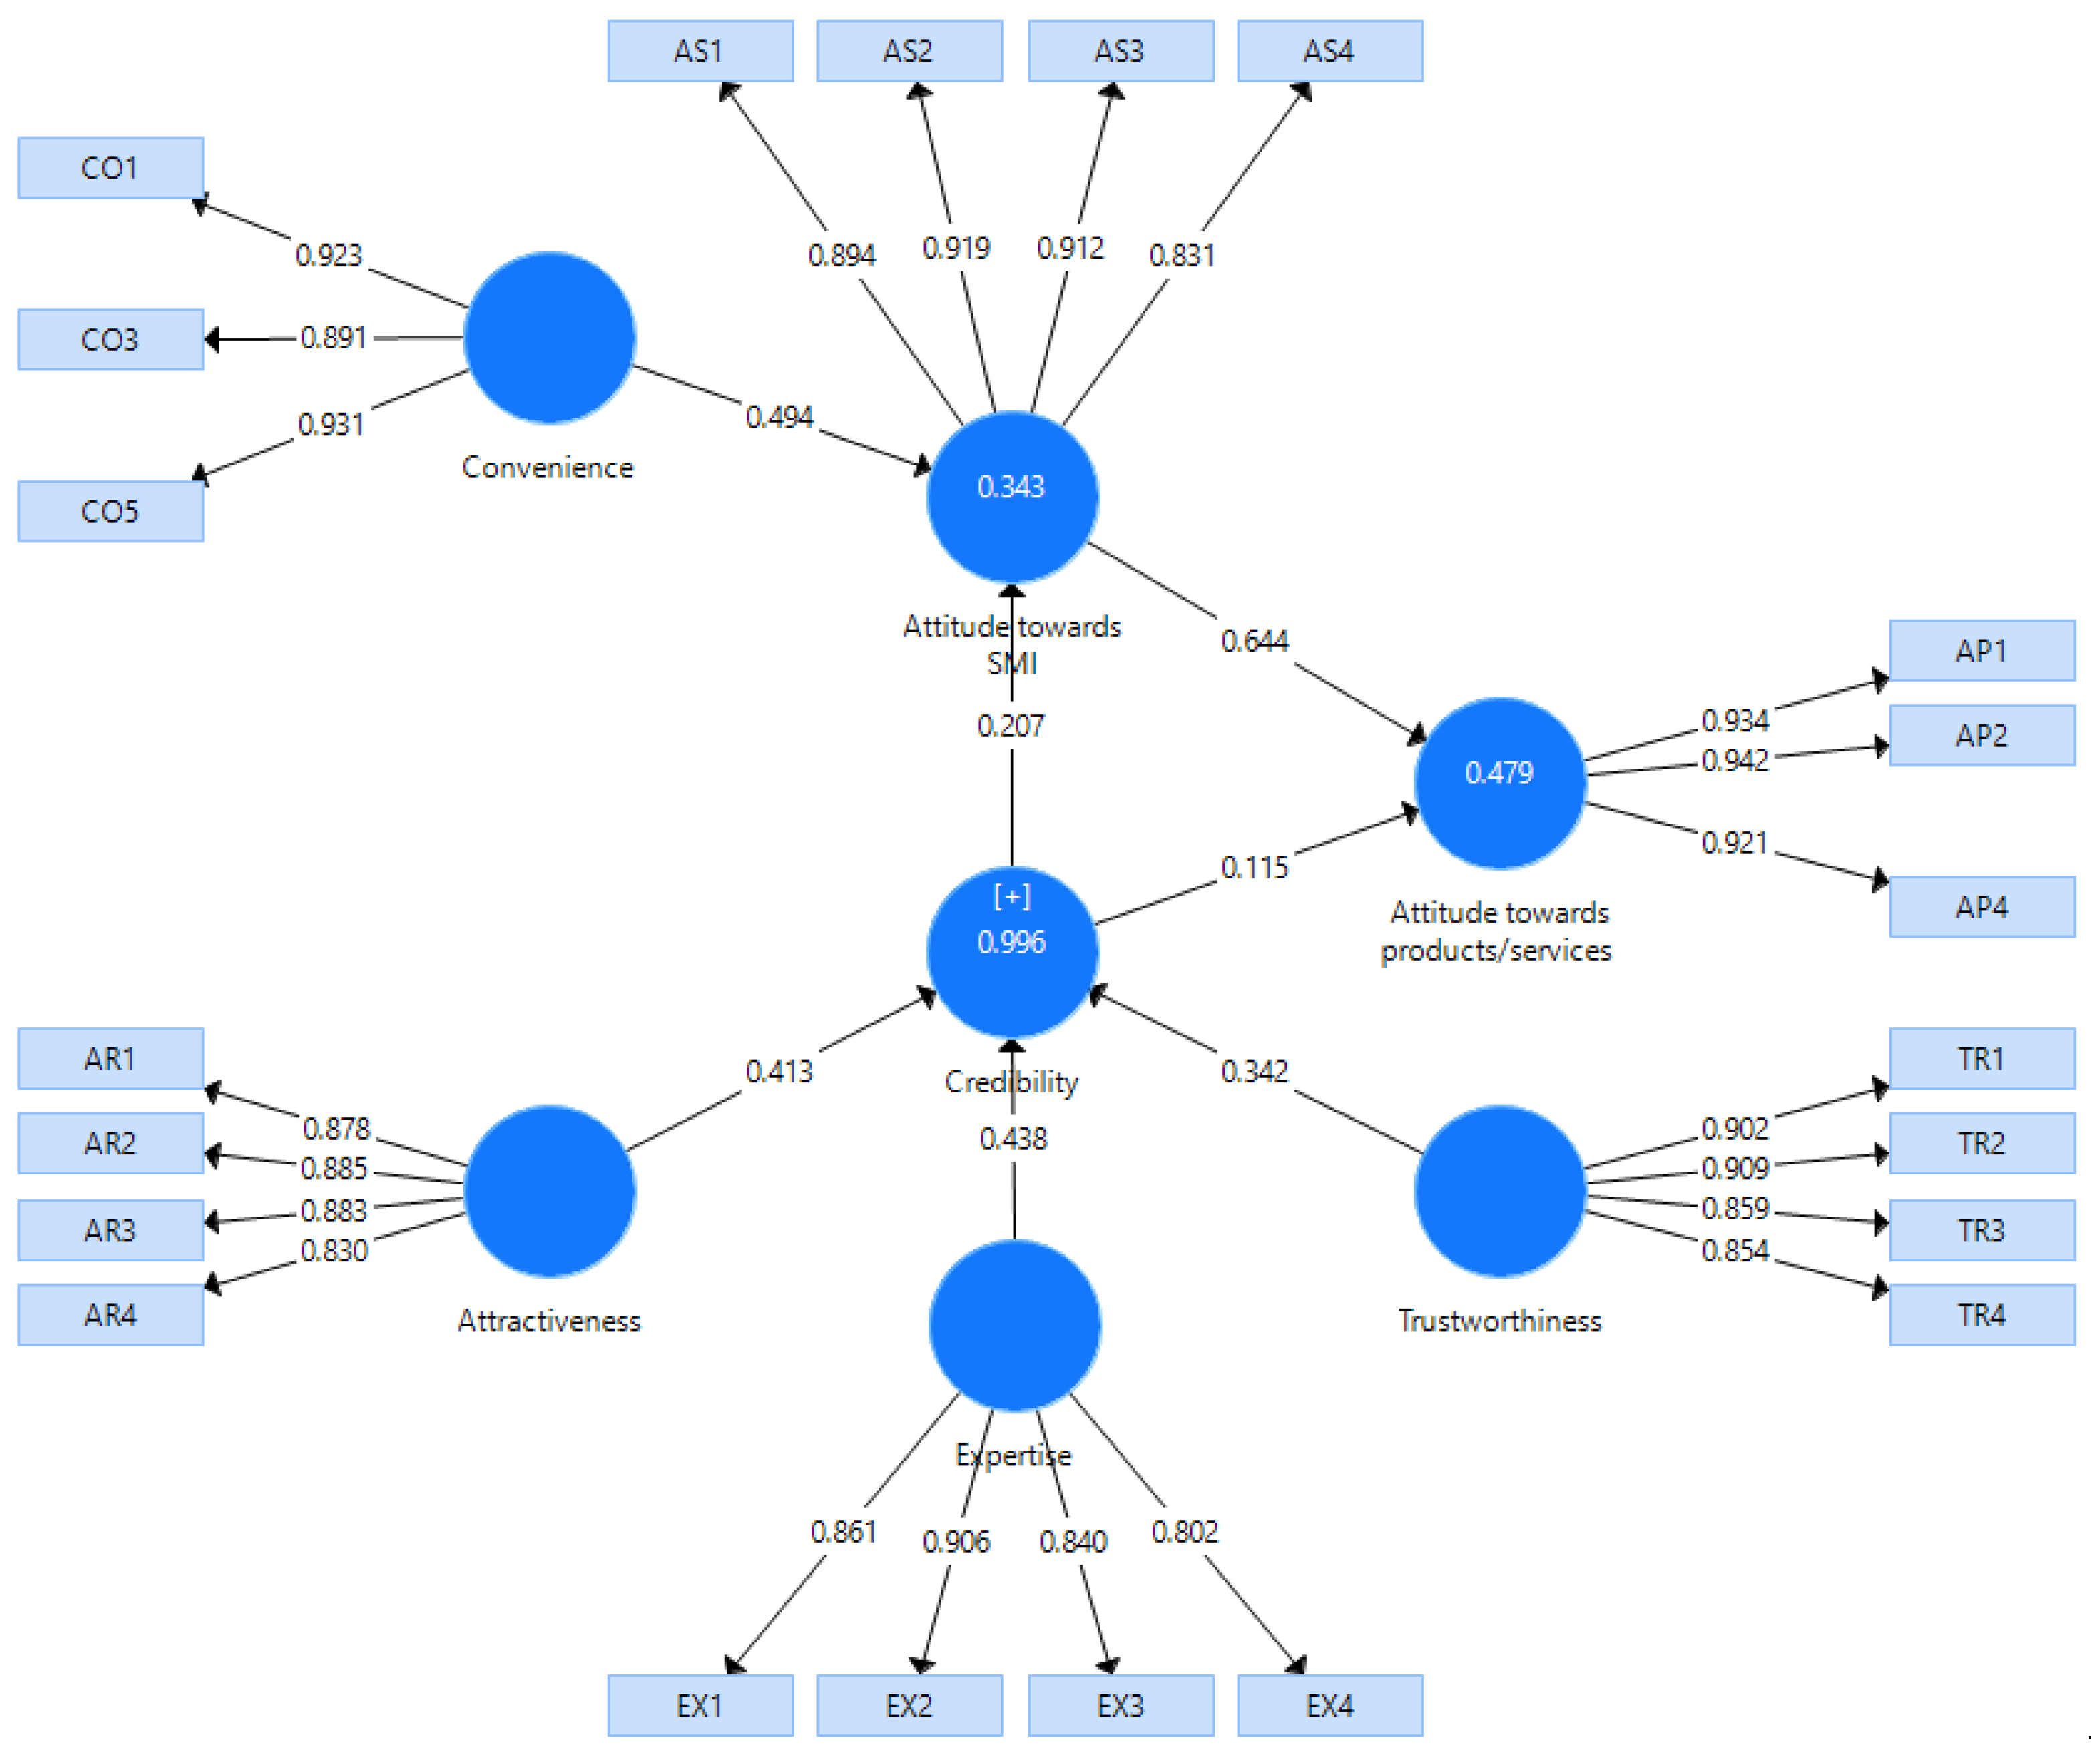
Indicators of latent variables are available in the survey questionnaire—eight constructs with 32 indicator variables [75]. The measurement model consists of 22 input indicators: CO1, CO2, CO3, CO4 and CO5 from variable Convenience (CO); IT1, IT2, IT3, IT4, and IT5 from variable Interactivity (IT); AR1, AR2, AR3, and AR4 from variable Interactivity (IT); EX1, EX2, EX3, and EX4 from variable Experience (EX); TR1, TR2, TR3, and TR4 from variable Trustworthiness (TR) and ten output indicators: AS1, AS2, AS3, and AS4 from output variable Attitude towards social media influencers (AS), AP1, AP2, AP3, and AP4 from output variable Attitude towards products or services (AP) and PB1 and PB2 from output variable Purchase intention (PB), represented in Figure 5.
Step 3. Conduct numerical modelling and evaluate the model's quality.
Utilize the PLS algorithm to derive model parameters.
Step 4. Assess the model's suitability. If it fits the data, proceed to Step 5. Otherwise, return to Step 3 to refine the model.
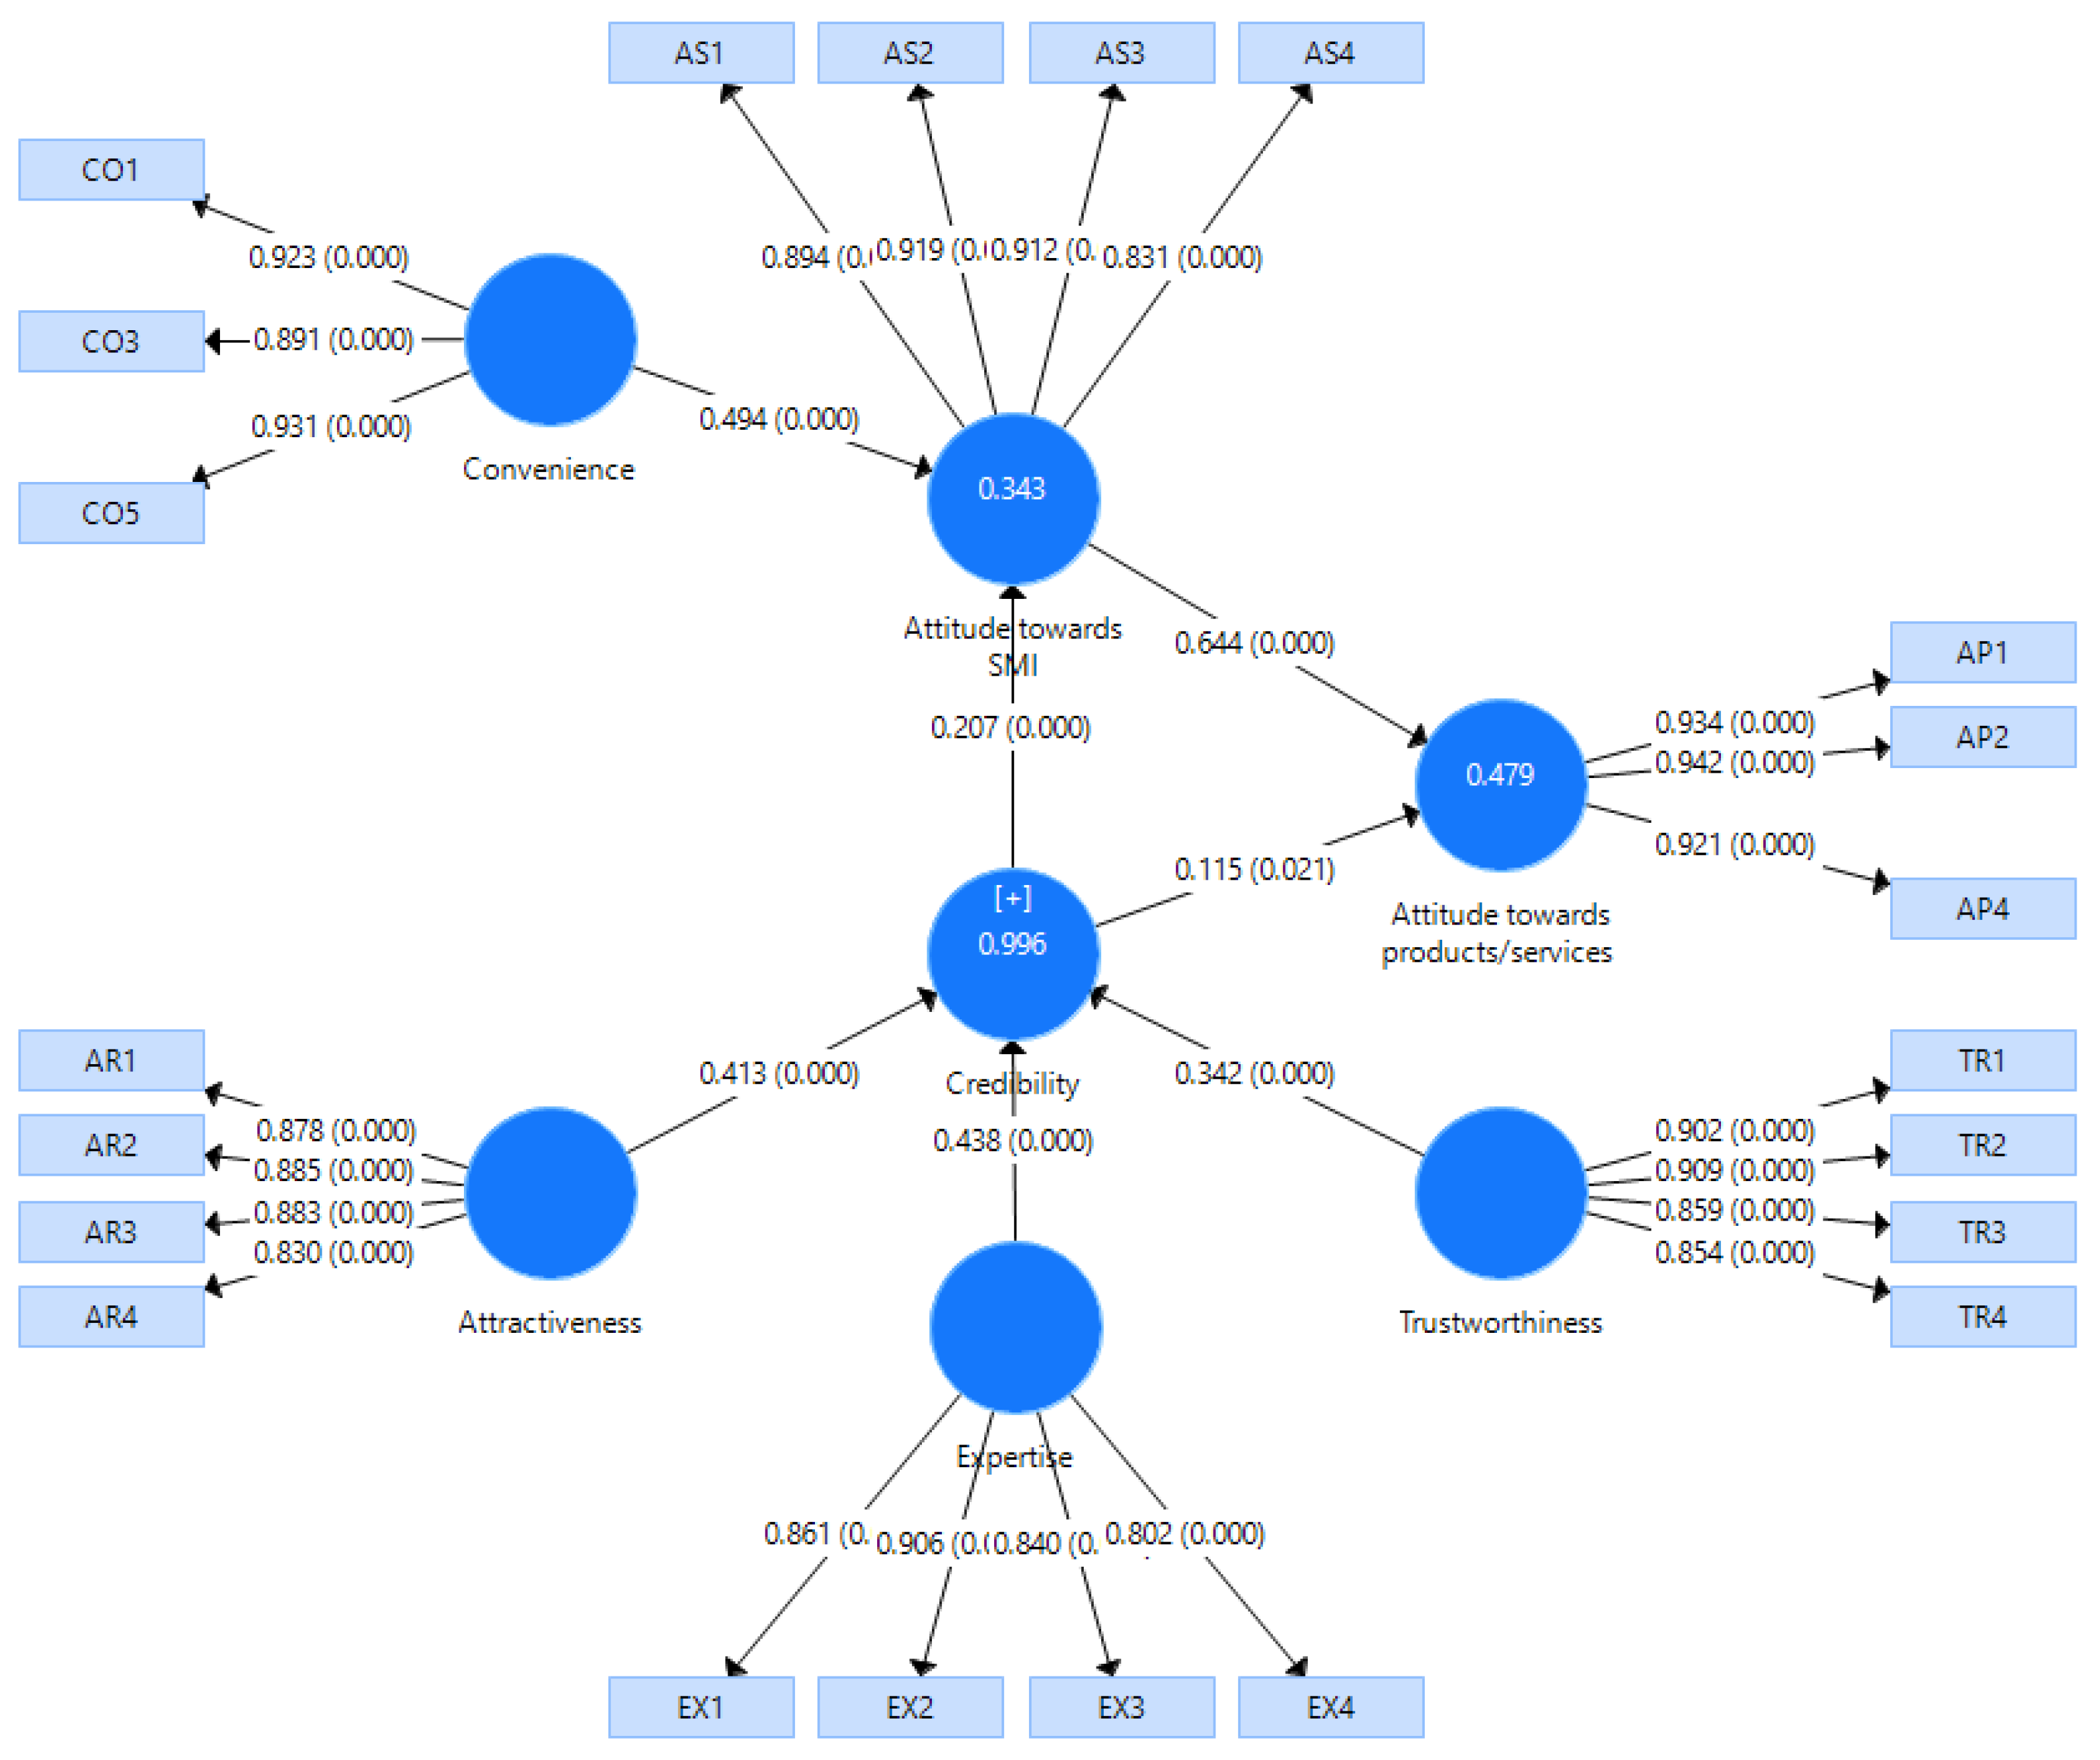
According to the assessment of path coefficients, our second-order model does not fit the data well. This is because the p-values of Interactivity and Purchase intention as a function of Attitude towards social media influencers and Attitude towards products or services, which are 0.241, 0.401 and 0.626, respectively, are outside the acceptable limit (Figure 5). As a result, the process needs to go back to Step 3 and change the model settings by removing some model factors. As the p-values of the path coefficients for the new model are acceptable, the model examination continues by establishing the construct reliability and validity (Step 4).
Validity and Reliability
The first phase of the validity assessment process entails examining both the measurement and structural models. The measurement model aims to establish the construct's validity and reliability, involving an assessment of construct reliability, indicator reliability, convergent validity, and discriminant validity. Conversely, the structural model focuses on verifying the significance of the proposed relationships.
Factor Loadings
Factor loadings indicate the extent to which each item in the correlation matrix correlates with the designated principal component. The higher absolute values signify a stronger correlation between the item and the underlying factor, as detailed in Pett et al. [81]. In this investigation, all items exhibited factor loadings exceeding the recommended threshold of 0.5, as suggested by Hair et al. [82]. The obtained measurement model and corresponding factor loadings are illustrated in Figure 6 and Table 5.
Indicator Multicollinearity
To assess multicollinearity among indicators, the study utilizes the Variance Inflation Factor (VIF) statistic. A VIF value below five indicates acceptable multicollinearity. Table 6 presents the VIF values for each indicator, all of which fall below the recommended threshold [83].
Reliability Analysis
There are two primary methods used to establish construct reliability (i.e., repeatability), which are Dillon-Goldstein’s rho (DG rho, rho_A in SmartPLS) and composite reliability (CR). For adequate reliability, both the DG rho and CR values should exceed 0.7 [83]. The DG rho ranged from 0.884 to 0.953, while CR ranged from 0.931 to 0.970 (Table 6); therefore, the DG rho and CR values for all constructs in the model are acceptable. All constructs have adequate reliability coefficients.
Construct Validity
Subsequently, two forms of validity assessment—convergent validity and discriminant validity—are essential for establishing construct validity.
Convergent Validity
Convergent validity evaluates the consistency across multiple measures of a single concept. The average variance extracted (AVE) was computed to gauge the convergent validity of the construct, with a minimum threshold of 0.5 [83]. The AVE values for all constructs were determined to be significant, affirming the robust convergent validity of the model (Table 6).
Discriminant Validity
Discriminant validity pertains to the ability to distinguish measures of separate concepts from one another.
Fornell and Larker Criterion
As per Fornell and Larcker’s criterion, discriminant validity is affirmed when the square root of the average variance extracted (AVE) for each construct surpasses its correlation with all other constructs. The findings of this study reveal that the square root of the AVE (italicized) for each construct exceeds its correlation with other constructs (as detailed in Table 7). Hence, compelling evidence is provided to confirm discriminant validity.
Cross Loadings
Assessing cross loadings allows the determination of whether an item, assigned to a specific construct, displays a higher loading on its designated construct compared to others in the model. The results of this study (as depicted in Table 8) demonstrate that all item factor loadings exhibit stronger associations with their respective constructs (italicized), rather than with other constructs. Hence, based on the examination of cross-loadings, discriminant validity can be confirmed.
Heterotrait-Monotrait Ratio (HTMT)
The HTMT (Heterotrait-Monotrait) ratio assesses the correlation between constructs to ensure discriminant validity. Although the threshold for HTMT varies in the literature, typically ranging from 0.85 to 0.9, the results of this study (as shown in Table 9) reveal that the HTMT ratios for the constructs are below the recommended threshold of 0.9, while also being statistically significant.
Path Coefficients and evaluation of the structural model—hypotheses testing
The p-values of model constructs indicate: 1) moderate impact of both Convenience and Credibility on Attitude towards social media influencers; and 2) significant impact of both Credibility and Attitude towards social media influencers on customer Attitude towards products or services. All p-values are below 1%, except the p-value of influence of Credibility on Attitude towards products or services, which value is below 5% (as shown in Figure 7 and Table 10). These findings align with our hypotheses and previous similar research. The regression coefficients for all predictor variables are positive.
In terms of the structural model, the pathways Credibility → Attitude towards SMI and Credibility → Attitude towards products/services show a weak effect, while Attitude towards SMI → Attitude towards products or services and Convenience → Attitude towards SMI relationships demonstrate slightly more significant influence (Table 10). The Q2 values indicate a good predictive performance of the model, all being above zero.
We found no mediating effects of demographics on the construct relationships, except for one exception – Education level. Education level statistically significantly alter the causal-effect relationship between Credibility and Attitude towards social media influencers, where the coefficient β is –0.090 with a p-value of 0.040.
Step 5. Interpret the obtained results.
The reasons for rejecting the effects of Interactivity (H2) (Figure 7) can be explained by the fact that our young respondents perceive interactivity with social media influencers as something “for granted”. The interactivity has been an inherent and expected capability of websites since the emergence of the web. Social media platforms have evolved to facilitate and encourage this interaction through features such as comments, likes, direct messages, and live streams. As a result, users have grown accustomed to engaging directly with influencers, asking questions, sharing opinions, and forming connections, making interactivity with influencers a standard and integral part of the social media experience. In contrast, individuals from older generations or different cultural backgrounds may not have grown up with social media and may not intuitively expect or value the same level of interactivity with influencers as younger, more digitally native individuals. For this reason, the findings of some previous studies [39,46] do not confirm our hypothesis regarding the presumed presence of interactivity of social media. It is also noteworthy that the beta coefficient of Interactivity from the SEM model of Ooi et al. [46] is negative, indicating a negative relationship between interactivity and attitude towards social media influencers. In other words, as the level of interactivity with social media influencers increases, the attitude towards them tends to decrease. This could imply that excessive or intrusive interactivity may lead to decreased favourability or trust towards influencers, possibly due to perceptions of over-promotion, lack of authenticity, or invasion of privacy.
The factors contributing to the rejection of the effects of Attitude towards influencers (H6) and Attitude towards products or services (H7) on Purchase intention (Figure 7) can be attributed to the specific context of our study. A well-known fact in Bulgarian social psychology is that Bulgarians tend to be particularly sceptical and mistrustful of the unknown. This cautiousness often has roots in historical and cultural factors. Some historical periods may have played a role in shaping this distrust among Bulgarians. Additionally, economic situation and corruption in society can further erode trust. These factors collectively contribute to a cultural framework that fosters mistrust and scepticism, ingraining them as common elements of the societal mentality. Unlike our country, developed nations are characterized by the so-called “keep up with the Joneses” phenomenon. This phenomenon is particularly widespread in countries with high levels of individualism, consumer culture, and social media usage, where people tend to compare themselves with others and strive to maintain or enhance their social status through excessive consumption.
After the elimination of the Interactivity construct (H2) from the unfitted model, social media Convenience (H1) indicated the positive relationship (Figure 7, β = 0.494 and p < 0.001) with the Attitude towards influencers. Convenience encourages user engagement and retention on social media platforms. When users find it easy and convenient to access and interact with content, engage with other followers or viewers, or perform tasks such as shopping products or booking services, they are more likely to spend time on the platform and return in the future. This result is in line with research that showed this variable as one of the main determinants of the Attitude towards influencers [38,42,45,46].
The result of H3 testing, which is the effect of Credibility, shows that its measures can reflect the user Attitude towards influencers ( β = 0.207 and p <= 0.001). The credibility significantly affects user attitudes towards influencers for several reasons. Credible influencers are more likely to be seen as authentic sources of information or recommendations. The credibility of influencers shape users’ perceptions of their content and recommendations. Credible influencers foster trust with their audience over time, leading to stronger relationships and loyalty. Our result is in line with the results of previous studies of Lim et al., Yuan and Lou, Pham et al., Ata et al., Niloy et al., Ooi et al. [38,41,42,43,45,46].
A similar situation occurs with the influence of Credibility on Attitude towards products or services (H4). The Credibility of social media influencers also significantly shapes user Attitudes towards advertised products or services ( β = 0.151 and p < 0.05). The endorsements of credible influencers hold greater weight and effect among their followers. Positive perceptions of the influencer extend to the advertised products, resulting in more favourable attitudes and an increased likelihood of purchase. Our result confirms the results obtained by Xiao et al., Chekima et al., Yuan and Lou, Ooi et al., Al-Sous et al., Coutinho et al. [39,40,41,46,47,48]
According to the results of H5 testing, which is the impact of Attitude towards influencers (β = 0.644 and p < 0.001), this factor can positively influence the Attitude towards products or services. As previously demonstrated, users often view social media influencers as credible sources of information. Consequently, their favourable Attitude towards influencers may result in a more favourable attitude toward the products or services endorsed by those influencers. Users tend to associate themselves with influencers whose values, lifestyle, or preferences align with their own. Users often develop emotional connections with influencers they follow, which can shape their attitudes towards advertised products or services. This finding is consistent with the significance of the same factor in Yuan and Lou, and Ooi et al. models [41,46].
Our testing supports H8 in its part for education level, but not the rest of the moderating sub-hypotheses. For the above said path between Credibility and Attitude towards influencers, individuals that are more educated are less reliant on influencer credibility in comparison to their counterparts. Higher education often fosters critical thinking skills, allowing individuals to assess information more critically and discern the credibility of sources. Educated individuals are more sceptical of influencers’ claims and endorsements, i.e. they place smaller importance on influencer credibility as a factor in their attitudes.
The R2 values, as shown in Table 10, are 0.343 and 0.479, indicating that roughly 34% and 48% of the variability in customer attitudes toward influencers and products can be explained by the predictor variables: social media convenience and source credibility. The remaining variability can be attributed to various other factors.
In addition to the classic one-order construct SEM approach, in line with the source credibility theory, our data analysis also includes a second-order construct known as Credibility, comprising Attractiveness (AT), Expertise (EX), and Trustworthiness (TR), and employing both the embedded and disjoint approaches for investigation of higher-order constructs.

5.4. Other Models of Customer Attitudes towards Social Media Influencers

To elucidate the relationships between the input and output constructs, we employed four ML algorithms as depicted in Table 11. The Mean Square Error (MSE) signifies the disparity between the assessed and actual output values of a model, while the Mean Absolute Error (MAE) is calculated as the average of the absolute differences between the predicted and actual values. AdaBoost consistently outperformed the other ML techniques across all evaluation metrics, followed by Random Forest and Decision Tree.
While SEM models demonstrate a considerably smaller R2 value compared to machine learning models, their advantage lies in the interpretability of their predictions. Conversely, while ML models boast higher accuracy (ranging from 0.876 to 0.999), their predictions often lack transparency and prove challenging to interpret. Thus, the selection between these models hinges on the specific purpose of the data analysis.
Using the coefficients derived from the SEM model, we can employ Multi-Criteria Decision Making (MCDM) methods such as Technique for Order of Preference by Similarity to Ideal Solution (TOPSIS) and Evaluation based on Distance from Average Solution (EDAS). These methodologies facilitate the computation of composite indices for a comprehensive assessment of user satisfaction with social media marketing.
This study has the following limitations: 1) the sample size and its attributes might not adequately represent diverse demographic perspectives; 2) user perceptions are multifaceted and may involve various psychological, social, and cultural factors, which were not included in our analysis; and 3) it solely focused on individual user attitude, excluding input from marketing experts and business representatives. These limitations may result in an incomplete portrayal of the broader social media marketing landscape, potentially overlooking valuable insights and challenges.

6. Conclusions and Future Research

Social media marketing revolutionizes business-customer interactions, providing various platforms for online engagement. By delivering valuable content in an interactive manner, social media influencers bridge the gap between brands and consumers, empowering companies to transform their advertising strategies and extend their reach beyond geographical constraints. This digital marketing tool enhances business-to-customer relationships by facilitating collaboration and efficiency in interactions.
In this study, we explore the characteristics of social media influencers, highlighting their transformative effect on brand perception and consumer behaviour. The key findings are outlined below:
  • An online survey was conducted to gather data for customer perceptions and attitudes towards social media influencers. A demographic analysis of the survey data revealed that the majority of respondents (98%) reside in urban areas, with 60% being under 40 years old, and 74% being female. Nearly all respondents (96%) reported using social media daily. In terms of education, respondents were evenly distributed between high school and higher educational levels (bachelor’s, master’s, or doctoral studies). Analysis of customer sentiment in their opinions showed that a majority (66%) expressed positive attitudes towards social media influencers as a convenient tool for online marketing. Only a quarter (25%) of the respondents do not have favourite influencers.
  • The customers were grouped into two statistically significant clusters. The first cluster consisted of respondents who reported higher levels of satisfaction in perceived convenience, satisfaction in social media influencer activities, satisfaction in products or services advertised and perceived attractiveness. On the other hand, the second cluster included those with relatively low level of purchase intention, satisfaction in influencers’ experience, trustworthiness and interactivity.
  • The theoretical causal one- and second-order SEM models revealed several dependencies:
There are statistically significant impacts of perceived Convenience (H1) and source Credibility (H3) on Attitude towards influencers.
There are statistically significant effects of perceived source Credibility (H4) and Attitude towards influencers (H5) on Attitude towards products or services.
There are no statistically significant consequences of perceived Interactivity (H2) on customer Attitude towards influencers.
There are no statistically significant dependencies of Attitudes towards influencers (H6) and Attitude towards products/services (H7), and Purchase intention.
Additionally, our analysis of hypothesis H8 indicated that customers’ attitudes and purchase behaviour are not significantly affected by demographic factors such as age, gender, education level, or place of residence. The only factor found to have a significant negative mediating effect on customers’ attitude towards social media influencers was their education level.
Our contributions to the field of social media marketing include identifying the key drivers behind consumer attitudes and purchase behaviour resulting from digital influencer activities. Additionally, we propose models that practitioners can utilize to develop effective strategies for promoting the adoption of social media advertising through online influencers.
Social media influencer marketing offers numerous advantages for both small and medium enterprises (SMEs) and global corporations. For SMEs, collaborating with influencers provides an opportunity to increase brand awareness and reach a larger audience without the need for a substantial marketing budget. Additionally, influencer collaborations allow SMEs to target niche markets with specific demographics more effectively. For global companies, social media influencer marketing offers a scalable approach to reaching diverse audiences across different regions and markets. By partnering with mega influencers, large corporations can enhance brand awareness on a massive scale and communicate with their target audience. Furthermore, influencer marketing allows global companies to stay agile and adapt their marketing strategies to different cultural contexts and consumer preferences worldwide. Overall, leveraging social media influencers can provide both SMEs and global companies with a competitive edge in today's digital landscape.
Our plans for future research include:
1)
Increasing the participant pool in our survey to encompass additional participants, including the unexplored behaviours of Generation Alpha;
2)
Comparing our results with similar studies from other countries, with a focus on the spread of social media influencer marketing and the moderation effect of different socio-economic indicators such as income and region;
3)
Exploring the changes and evolution of social media marketing in the post-COVID-19 environment.
Additionally, we aim to conduct further analysis by implementing fuzzy multi-criteria decision-making methods to determine the multi-attribute cause-and-effect interdependencies between factors that affect customer satisfaction in e-influencer advertising. This future research aims to ensure that social media, as a burgeoning advertising platform, remains accessible to users of all demographics, fostering ethical and socially responsible digital transformations that can enhance customer value.

Author Contributions

Conceptualization, G.I., T.Y. and Y.D.; modelling, G.I., T.Y., M.R. and S.K.-B.; validation, G.I. and T.Y.; formal analysis, T.Y.; resources, G.I., T.Y., Y.D., M.R., S.K.-B., and M.B.; writing—original draft preparation, G.I.; writing—review and editing, G.I., T.Y., and Y.D.; visualization, T.Y. and S.K.-B.; supervision, G.I.; project administration, Y.D.; funding acquisition, G.I. and T.Y. All authors have read and agreed to the published version of the manuscript.

Funding

This research was funded by the National Science Fund, co-founded by the European Regional Development Fund, Grant No. BG05M2OP001-1.002-0002 “Digitization of the Economy in Big Data Environment”.

Data Availability Statement

The data stored as csv and pdf files are publicly available at https://data.mendeley.com/datasets/4m9k8xwbmt/1 (accessed on 30 April 2024).

Acknowledgments

The authors thank the academic editor and anonymous reviewers for their insightful comments and suggestions.

Conflicts of Interest

The authors declare no conflicts of interest.

References

  1. Kotler, P.; Kartajaya, H.; Setiawan, I. Marketing 4.0: moving from Traditional to Digital, 1st ed.; Wiley: Hoboken, New Jersey, U.S., 2016; 208 p.
  2. Babson. What is Influencer Marketing? An Industry on the Rise. Available online: https://entrepreneurship.babson.edu/what-is-influencer-marketing (accessed on 30 April 2024).
  3. Francisco, E.; Fardos, N.; Bhatt, A.; Bizel, G. Impact of the COVID-19 Pandemic on Instagram and Influencer Marketing. Int. J. Mark. Stud. 2021, 13(2), 20–35. [CrossRef]
  4. Dimitrova, T.; Ilieva, I. Consumption behaviour towards branded functional beverages among gen Z in post-COVID-19 times: exploring antecedents and mediators. Behav. Sci. 2023, 13(8), 670. [CrossRef]
  5. Statista. Influencer marketing market size worldwide from 2016 to 2024. Available online: https://www.statista.com/statistics/1092819/global-influencer-market-size (accessed on 30 April 2024).
  6. Influencer Marketing Hub. The State of Influencer Marketing 2024: Benchmark Report. Available online: https://influencermarketinghub.com/influencer-marketing-benchmark-report/ (accessed on 30 April 2024).
  7. Loxton, M.; Truskett, R.; Scarf, B.; Sindone, L.; Baldry, G.; Zhao, Y. Consumer behaviour during crises: Preliminary research on how coronavirus has manifested consumer panic buying, herd mentality, changing discretionary spending and the role of the media in influencing behaviour. J. risk financ. manag. 2020, 13(8), 166. [CrossRef]
  8. Nguyen, T.M.; Le, D.; Quach, S.; Thaichon, P.; Ratten, V. The current trends and future direction of digital and relationship marketing: A business perspective. In Developing Digital Marketing: Relationship Perspectives, Thaichon, P., Ratten, V., Eds.; Emerald Publishing Limited: Bingley, U.K., 2021; pp. 191–200.
  9. Kitsios, F.; Kamariotou, M.; Karanikolas, P.; Grigoroudis, E. Digital marketing platforms and customer satisfaction: Identifying eWOM using big data and text mining. Appl. Sci. 2021, 11(17), 8032. [CrossRef]
  10. Siregar, V.M.M.; Sinaga, K. ; Sirait, E. ; Manalu, A.S. ; Yunus, M. Classification of Customer Satisfaction through Machine Learning: An Artificial Neural Network Approach. Internet of Things and Artificial Intelligence Journal 2023, 3(3), 273–282. [CrossRef]
  11. Gómez, A.R. Digital Fame and Fortune in the age of Social Media: A Classification of social media influencers. aDResearch: Revista Internacional de Investigación en Comunicación 2019, 19, 8–29. [CrossRef]
  12. Dwivedi, Y.K.; Ismagilova, E.; Hughes, D.L.; Carlson, J.; Filieri, R.; Jacobson, J.; Jain, V.; Karjaluoto, H.; Kefi, H.; Krishen, A.S.; Kumar, V.; Rahman, M.M.; Raman, R.; Rauschnabel, P.A.; Rowley, J.; Salo, J.; Tran, J.A.; Wang, Y. Setting the future of digital and social media marketing research: Perspectives and research propositions. Int. J. Inf. Manag. 2021, 59, 102168. [CrossRef]
  13. Joshi, Y.; Lim, W.M.; Jagani, K.; Kumar, S. Social media influencer marketing: foundations, trends, and ways forward. Electron. Commer. Res. 2023, 1–55. [CrossRef]
  14. Ouvrein, G.; Pabian, S.; Giles, D.; Hudders, L.; De Backer, C. (2021). The web of influencers. A marketing-audience classification of (potential) social media influencers. J. Mark. Manag. 2021, 37(13-14), 1313–1342. [CrossRef]
  15. Zabel, C. The Business of Influencing: Business Models of Social Media Influencers–a Literature Review. Nordic Journal of Media Management 2023, 4(3), 3–36. [CrossRef]
  16. Malinen, S.; Koivula, A. Influencers and targets on social media: Investigating the impact of network homogeneity and group identification on online influence. First Monday 2020, 25(4). [CrossRef]
  17. Oliveira, M.; Barbosa, R.; Sousa, A. The use of influencers in social media marketing. In Proceedings of International Conference Marketing Technologies (ICMarkTech), Porto, Portugal, 27 – 29 November 2019. (pp. 112–124). Springer Singapore.
  18. Bellavista, P.; Foschini, L.; Ghiselli, N. Analysis of growth strategies in social media: the Instagram use case. In IEEE 24th International Workshop on Computer Aided Modeling and Design of Communication Links and Networks (CAMAD), Limassol, Cyprus, 11 – 13 September 2019. (pp. 1–7). IEEE. [CrossRef]
  19. Dimitrieska, S.; Efremova, T. The effectiveness of the influencer marketing. Economics and Management 2021, 18(1), 109–118. [CrossRef]
  20. Gräve, J.F. What KPIs are key? Evaluating performance metrics for social media influencers. Social Media+ Society 2019, 5(3), 2056305119865475. [CrossRef]
  21. Delbaere, M.; Michael, B.; Phillips, B.J. Social media influencers: A route to brand engagement for their followers. Psychol. Market. 2021, 38(1), 101–112. [CrossRef]
  22. Nguyen, T.H.; Le, H.A. The impact of social media on the efficiency of online business performance. Indian J. Finance 2022, 46–63. [CrossRef]
  23. Arora, A.; Bansal, S.; Kandpal, C.; Aswani, R.; Dwivedi, Y. Measuring social media influencer index-insights from Facebook, Twitter and Instagram. J. Retail. Consum. Serv. 2019, 49, 86–101. [CrossRef]
  24. Lee, J.A.; Eastin, M.S. (2021). Perceived authenticity of social media influencers: scale development and validation. J. Res. Interact. Mark. 2021, 15(4), 822–841. [CrossRef]
  25. Zhuang, Y.B.; Li, Z.H.; Zhuang, Y.J. Identification of influencers in online social networks: measuring influence considering multidimensional factors exploration. Heliyon 2021, 7(4). [CrossRef]
  26. ISO. Brand evaluation. Available online: https://www.iso.org/standard/81739.html (accessed on 30 April 2024).
  27. Rogers, E.M. Diffusion of Innovations, 5th ed.; Free Press: New York, New York, U.S., 2003; 576 p.
  28. Devec, F.G.; Yildiz, T. Influencers in the Diffusion of Innovations and Their Channels: A Perspective for Millennials. In New Paradigms within the Communication Sciences, Başar, E.E, Bacaksız, P. Eds.; Cambridge Scholars Publishing: Newcastle upon Tyne, U.K., 2021; pp. 95–115.
  29. Bandura, A.; Walters, R.H. Social learning and personality development. Holt Rinehart and Winston: New York, New York, U.S., 1963.
  30. Yoon, H.J.; Tourassi, G. Analysis of online social networks to understand information sharing behaviors through social cognitive theory. In Proceedings of the 2014 Biomedical Sciences and Engineering Conference, Oak Ridge, Tennessee, U.S., 6 – 8 May 2014 (pp. 1–4). IEEE. [CrossRef]
  31. Petty, R.E.; Cacioppo, J.T.; Petty, R.E.; Cacioppo, J.T. (1986). The elaboration likelihood model of persuasion. In Communication and Persuasion. Springer Series in Social Psychology. Springer: New York, New York, U.S., 1986, pp. 1–24. [CrossRef]
  32. Erkli, Y.T. Social media influencers: The perspective of elaboration likelihood model. Journal of Academic Tourism Studies 2022, 3(1), 1–12. [CrossRef]
  33. Fishbein, M.; Ajzen, I. Belief, Attitude, Intention, and Behavior: An Introduction to Theory and Research. Addison-Wesley: Reading, Massachusetts, U.S., 1975.
  34. Madden, T.J.; Ellen, P.S.; Ajzen, I. A comparison of the theory of planned behavior and the theory of reasoned action. Pers. Soc. Psychol. Bull. 1992, 18(1), 3–9. [CrossRef]
  35. Tiwari, A.; Kumar, A.; Kant, R.; Jaiswal, D. Impact of fashion influencers on consumers' purchase intentions: theory of planned behaviour and mediation of attitude. J. Fash. Mark. Manag. 2024, 28(2), 209–225. [CrossRef]
  36. Ohanian, R. Construction and validation of a scale to measure celebrity endorsers' perceived expertise, trustworthiness, and attractiveness. J. Advert. 1990, 19(3), 39–52. [CrossRef]
  37. Breves, P.L.; Liebers, N.; Abt, M.; Kunze, A. The perceived fit between Instagram influencers and the endorsed brand: How influencer–brand fit affects source credibility and persuasive effectiveness. J. Advert. Res. 2019, 59(4), 440–454. [CrossRef]
  38. Lim, X.J.; Radzol, A.M.; Cheah, J.; Wong, M.W. The impact of social media influencers on purchase intention and the mediation effect of customer attitude. Asian J. Bus. Res. 2017, 7(2), 19–36. [CrossRef]
  39. Xiao, M.; Wang, R.; Chan-Olmsted, S. Factors affecting YouTube influencer marketing credibility: a heuristic-systematic model. J. Media Bus. Stud. 2018, 15(3), 188–213. [CrossRef]
  40. Chekima, B.; Chekima, F.Z.; Adis, A.A.A. Social media influencer in advertising: The role of attractiveness, expertise and trustworthiness. J. Econ. Bus. 2020, 3(4). [CrossRef]
  41. Yuan, S.; Lou, C. How social media influencers foster relationships with followers: The roles of source credibility and fairness in parasocial relationship and product interest. J. Interact. Advert. 2020, 20(2), 133–147. [CrossRef]
  42. Pham, M.; Dang, T.Y.; Hoang, T.H.Y.; Tran, T.T.N.; Ngo, T.H.Q. The effects of online social influencers on purchasing behavior of generation Z: An empirical study in Vietnam. J. Asian Finance Econ. Bus. 2021, 8(11), 179–190. [CrossRef]
  43. Ata, S.; Arslan, H.M.; Baydaş, A.; Pazvant, E. The effect of social media influencers’ credibility on consumer’s purchase intentions through attitude toward advertisement. ESIC Market 2022, 53(1), e280–e280. [CrossRef]
  44. Ebrahimi, P.; Basirat, M.; Yousefi, A.; Nekmahmud, M.; Gholampour, A.; Fekete-Farkas, M. Social networks marketing and consumer purchase behavior: the combination of SEM and unsupervised machine learning approaches. Big Data and Cognitive Computing 2022, 6(2), 35. [CrossRef]
  45. Niloy, A.C.; Alam, J.B.; Alom, M.S. Influencer marketing: factors influencing a customer’s purchase intention. Asian Journal of Business Environment 2023, 13(1), 23–32. [CrossRef]
  46. Ooi, K.B.; Lee, V.H.; Hew, J.J.; Leong, L.Y.; Tan, G.W.H.; Lim, A.F. Social media influencers: An effective marketing approach?. J. Bus. Res. 2023, 160, 113773. [CrossRef]
  47. Al-Sous, N.; Almajali, D.; Alsokkar, A. Antecedents of social media influencers on customer purchase intention: Empirical study in Jordan. International Journal of Data and Network Science 2023, 7(1), 125–130. [CrossRef]
  48. Coutinho, F.; Dias, A.; Pereira, L.F. (2023). Credibility of social media influencers: Impact on purchase intention. Hum. Technol. 2023, 19(2), 220–237. [CrossRef]
  49. Kelman, H.C. Processes of Opinion Change. Public Opin. Q. 1961, 25(1), 57–78. [CrossRef]
  50. Pornpitakpan, C. The Persuasiveness of Source Credibility: A Critical Review of Five Decades’ Evidence. J. Appl. Soc. Psychol. 2004, 34(2), 243–281. [CrossRef]
  51. Davis, F. A Technology Acceptance Model for Empirically Testing New End-User Information Systems: Theory and Results. Doctoral dissertation, Sloan School of Management, Massachusetts Institute of Technology: Boston, Massachusetts, U.S., 1986.
  52. Venkatesh, V.; Morris, M.G.; Davis, G.В.; Davis, F. User Acceptance of Information Technology: Toward a Unified View. MIS Q. 2003, 27(3), 425–478. [CrossRef]
  53. Wu, L. Understanding the Impact of Media Engagement on the Perceived Value and Acceptance of Advertising within Mobile Social Networks. J. Interact. Advert. 2016, 16(1), 59–73. [CrossRef]
  54. Rochman, H.N.; Kusumawati, E. Analysis of the influence of promotions, influencers, convenience, service quality and prices on the Tiktok application on purchasing decisions on the "Tiktok Shop” (Study on Accounting Students of Muhammadiyah University of Surakarta Class of 2019-2020). International Journal of Latest Research in Humanities and Social Science (IJLRHSS) 2023, 6(4), 9–20. http://ijlrhss.com/paper/volume-6-issue-4/2-HSS-1843.pdf.
  55. Rafaeli, S. From new media to communication. Sage annual review of communication research: Advancing communication science 1988, 16(1), 110–134.
  56. Jensen, J.F. ‘Interactivity’: Tracking a new concept in media and communication studies. Nordicom review 1998, 19(1), 185–204.
  57. Jun, S.; Yi, J. What makes followers loyal? The role of influencer interactivity in building influencer brand equity. J. Prod. Brand Manag. 2020, 29(6), 803–814. [CrossRef]
  58. ur Rehman, H.I.; Parvaiz, S.; Shakeel, M.A.; Iqbal, H.K.; Zainab, U. Impact of Social Media Influencer Interactivity and Authenticity on Impulsive Buying Behaviour: Mediating Role of Attitude and Brand Attachment. Journal of Policy Research 2023, 9(1). [CrossRef]
  59. Hovland, C.I.; Weiss, W. The Influence of Source Credibility on Communication Effectiveness. Public Opin. Q. 1952, 15(4), 635. [CrossRef]
  60. Hovland C.I.; Janis I.L.; Kelley H.H. Communication and Persuasion. Yale University Press: New Haven, Connecticut, U.S., 1953.
  61. McGuire WJ. Attitudes and attitude change. In The Handbook of Social Psychology, 3rd ed.; Lindzey, G., Aronson, E., Eds.; Random House: New York, New York, U.S., 1985; Volume 2, pp. 233–346.
  62. Wiedmann, K.P.; Von Mettenheim, W. Attractiveness, trustworthiness and expertise–social influencers’ winning formula?. J. Prod. Brand Manag. 2020, 30(5), 707–725. [CrossRef]
  63. Nafees, L.; Cook, C.M.; Nikolov, A.N.; Stoddard, J.E. (2021). Can social media influencer (SMI) power influence consumer brand attitudes? The mediating role of perceived SMI credibility. Digital Business 2021, 1(2), 100008. [CrossRef]
  64. Masuda, H.; Han, S.H.; Lee, J. Impacts of influencer attributes on purchase intentions in social media influencer marketing: Mediating roles of characterizations. Technol. Forecast. Soc. Change 2022, 174, 121246. [CrossRef]
  65. Lu, H.-H.; Chen, C.-F. How do influencers’ characteristics affect followers’ stickiness and well-being in the social media context?, J. Serv. Mark. 2023, 37(8), 1046–1058. [CrossRef]
  66. Ajzen, I.; Fishbein, M. Attitudes and the Attitude-Behavior Relation: Reasoned and Automatic Processes. Eur. Rev. Soc. Psychol. 2000, 11(1), 1–33. [CrossRef]
  67. Hudson, S.; Elliott, C. Measuring the impact of product placement on children using digital brand integration. J. Food Prod. Mark. 2013, 19(3), 176–200. [CrossRef]
  68. Howard, J.A.; Sheth, J.N. (1969). The theory of buyer behavior. Wiley: New York, New York, U.S., 1969. 458 p.
  69. Spears, N.; Singh, S.N. Measuring Attitude toward the Brand and Purchase Intentions. J. Curr. Issues Res. Advert. 2004, 26(2), 53–66. [CrossRef]
  70. Nguyen, C.; Nguyen, T.; Luu, V. Relationship between influencer marketing and purchase intention: focusing on Vietnamese gen Z consumers. Indep. J. Manag. Prod. 2022, 13(2), 810–828. [CrossRef]
  71. Silvera, D.H.; Austad, B. Factors predicting the effectiveness of celebrity endorsement advertisements. Eur. J. Mark. 2004, 38(11/12), 1509–1526. [CrossRef]
  72. Munnukka, J.; Uusitalo, O.; Toivonen, H. Credibility of a peer endorser and advertising effectiveness. J. Consum. Mark. 2016, 33(3), 182–192. [CrossRef]
  73. France, C.; Grace, D.; Merrilees, B.; Miller, D. Customer brand co-creation behavior: Conceptualization and empirical validation. Marketing Intelligence and Planning 2018, 36(3), 334–348. [CrossRef]
  74. Cheung, R.; Lam, A.Y.C.; Lau, M.M. Drivers of green product adoption: the role of green perceived value, green trust and perceived quality. J. Glob. Scholars Mark. 2015, 25(3), 232–245. [CrossRef]
  75. Ilieva, G.; Yankova, T.; Ruseva, M.; Dzhabarova, Y.; Klisarova-Belcheva, S.; Bratkov, M. Social Media Influencers: Exploring User Attitudes and Purchase Behavior. Mendeley Data 2024. [CrossRef]
  76. Beran, T.N.; Violato, C. Structural Equation Modeling in Medical Research: A Primer. BMC Res. Notes 2010, 3, 267. [CrossRef]
  77. Statista. Average amount of hours spent per day on social media worldwide as of November 2021, by generation. Available online: https://www.statista.com/statistics/1314973/global-daily-time-spent-on-social-media-networks-generation/ (accessed on 30 April 2024).
  78. Kantarmedia. Followers of social media influencers. Available online: https://www.kantarmedia.com/news-and-resources/followers-of-social-media-influencers (accessed on 30 April 2024).
  79. Statista. Most popular social networks worldwide as of January 2024, ranked by number of monthly active users. Available online: https://www.statista.com/statistics/272014/global-social-networks-ranked-by-number-of-users/ (accessed on 30 April 2024).
  80. Ringle, C. M.; Wende, S.; Becker, J.-M. SmartPLS 4, SmartPLS GmbH: Bönningstedt, Germany, 2024.
  81. Pett, M.A.; Lackey, N.R.; Sullivan, J.J. Making Sense of Factor Analysis: The Use of Factor Analysis for Instrument Development In Health Care Research, Sage Publications: Thousand Oaks, California, U.S., 2003. 368 p.
  82. Hair, J.F., Jr.; Black, W.C.; Babin, B.J.; Andreson, R.E. Multivariate Data Analysis, 7th ed.; Pearson: Edinburgh, U.K., 2014.
  83. Fornell, C.; Bookstein, F.L. Two Structural Equation Models: LISREL and PLS Applied to Consumer Exit-voice Theory. J. Mark Res. 1982, 19, 440–452. [CrossRef]
Figure 1. The ordered dissimilarity matrix of respondents’ answers.
Preprints 106660 g001
Figure 2. Hierarchical group heat map by respondents.
Preprints 106660 g002
Figure 3. Hierarchical group heat map by indicators.
Preprints 106660 g003
Figure 4. Customer clusters by k-means (k = 2, 3, 4, 5) using 32 input indicators.
Preprints 106660 g004
Figure 5. Measurement model with six latent variables, their path coefficients and p-values.
Preprints 106660 g005
Figure 6. SEM procedure validity result – path coefficients and coefficients of determination.
Preprints 106660 g006
Figure 7. Path coefficients and p-values—inner and outer model.
Preprints 106660 g007
Table 1. Comparison between models of customer attitudes and purchase intentions in social media marketing
Reference Utilized
Algorithm
Evaluation Metrics
(Number)
Statistically Significant Factors
(Number)
R2
Lim et al. 2017
[38]
PLS-SEM Source credibility, Source attractiveness, Product match-up, Meaning transfer (4) → Customer attitude
→ Purchase intention
Source attractiveness, Product match-up, Meaning transfer (3) 0.490; 0.708
Xiao et al. 2018
[39]
PLS-SEM Expertise, Trustworthiness, Likability, Homophily, Social advocacy, Interactivity, Argument quality, Involvement, Knowledge (9)
→ Brand attitude
Trustworthiness, Social advocacy,
Argument quality, Involvement (4)
–;
N/A
Chekima et al. 2020
[40]
PLS-SEM Attractiveness, Expertise, Trustworthiness (3) → Ad attitude, Product attitude, Purchase intention Attractiveness, Expertise,
Trustworthiness (3)
0.514, 0.558; 0.671
Yuan and Lou (2020)
[41]
PLS-SEM Attractiveness, Expertise, Trustworthiness, Similarity, Distributive, Procedural, Interpersonal and Informational fairness (8) → Parasocial relationship
→ Purchase interest
Expertise, Similarity, Procedural fairness, Interpersonal fairness (4) 0.740; 0.530
Pham et al. 2021
[42]
PLS-SEM Attractiveness, Expertise, Trustworthiness → Argument quality, Perceived usefulness and Social influence (9)
→ Attitude → Purchasing behavior
Attractiveness, Expertise,
Trustworthiness (9)
0.571; 0.501
Ata et al. 2022
[43]
PLS-SEM Attractiveness, Expertise,
Trustworthiness (3) → Attitude
→ Purchase intention
Attractiveness, Expertise,
Trustworthiness (3)
0.765; N/A
Ebrahimi et al. (2022)
[44]
PLS-SEM,
k-means
Entertainment, Customization, Interaction, Word of mouth, Trend (5)
→ Customer purchase behavior
Entertainment, Customization, Interaction, Word of mouth, Trend (5) N/A; 0.841
Niloy et al. 2023
[45]
MLR Source credibility, Source attractiveness, Product match-up, Source familiarity (4) → Attitude → Purchase intention Source attractiveness, Product match-up, Source familiarity (3) 0.527; 0.653
Ooi et al. 2023
[46]
PLS-SEM Convenience, Interactivity, Source credibility (Attractiveness, Expertise, Trustworthiness) (5) → Attitude towards SMI, Attitude towards the product or service
→ Purchase intention
Convenience, Interactivity, Attractiveness, Expertise, Trustworthiness (5) 0.745, 0.776; 0.484
Al-Sous et al. 2023
[47]
PLS-SEM Information quality, Trustworthiness (2) → Attitude towards a brand
→ Influence purchase intentions
Information quality, Trustworthiness (2) –;
Coutinho et al. 2023
[48]
PLS-SEM Attractiveness, Expertise,
Trustworthiness → Brand equity (4)
→ Customer purchase intention
Attractiveness, Brand equity (2) 0.623; 0.811
Our model 2024 PLS-SEM, ML, MCDM Convenience, Interactivity, Source credibility (Attractiveness, Expertise, Trustworthiness) (5) → Attitude towards SMI → Attitude towards products or services → Purchase intention Convenience, Interactivity, Source credibility (Attractiveness, Expertise, Trustworthiness) (4) 0.343, 0.479; N/A
Note: In the last column, R2 represents the determination coefficient. The symbol “;” separates the coefficient value(s) for Attitude(s) from that of Purchase intention. “N/A” indicates “Not Applicable”, while the symbol “–“ signifies missing data.
Table 2. Customers profile in the sample (n = 376).
Variables of the Sample No. of Consumers Percentage (%)
1. Gender Male 99 26.3
Female 277 73.7
2. Age Under 20 88 23.4
Between 21 and 30 183 48.7
Between 31 and 40 42 11.2
Between 41 and 50 50 13.3
Over 50 13 3.5
3. Place of residence City 241 64.1
Town 127 33.8
Village 8 2.1
4. Municipality - -
5. Monthly income per household member Less than BGN 1320 141 37.5
More than BGN 1320 235 62.5
6. Education High school 191 50.8
Bachelor 119 31.6
Master 61 16.2
PhD 5 1.3
7. Experience with social media Less than 3 years 31 8.2
3 to 5 years 47 12.5
More than 5 years 298 79.3
8. Frequency of use of social media Less than once a week 3 0.8
Once or twice a week 1 0.3
Several times a week 10 2.7
Once or twice a day 40 10.6
Several times a day 241 64.1
Several times an hour 81 21.5
9. Number of influencers that you follow on social media Less than 10 184 48.9
10 to 20 99 26.3
20 to 30 44 11.7
More than 30 49 13.0
Table 3. Average values by clusters and absolute differences between clusters by indicators.
CO1 CO2 CO3 CO4 CO5 IT1 IT2 IT3 IT4
Cluster #1 4.222 4.263 3.931 4.186 4.195 2.829 2.850 2.868 3.015
Cluster #2 2.000 1.976 1.976 1.929 1.714 1.762 1.738 1.714 1.738
Difference 2.222 2.287 1.955 2.257 2.480 1.067 1.112 1.154 1.277
IT5 AR1 AR2 AR3 AR4 EX1 EX2 EX3 EX4
Cluster #1 2.590 3.084 3.210 3.575 3.027 2.668 2.545 2.249 2.695
Cluster #2 1.643 1.810 1.786 1.762 1.976 1.667 1.595 1.762 1.595
Difference 0.947 1.274 1.424 1.813 1.051 1.001 0.950 0.487 1.099
TR1 TR2 TR3 TR4 AS1 AS2 AS3 AS4 AP1
Cluster #1 2.302 2.356 2.458 2.605 3.880 3.760 3.808 3.539 3.671
Cluster #2 1.714 1.714 1.595 1.690 1.810 1.667 1.762 1.714 1.738
Difference 0.588 0.642 0.863 0.914 2.071 2.094 2.046 1.825 1.933
AP2 AP3 AP4 PB1 PB2
Cluster #1 3.572 3.665 3.560 1.880 1.737
Cluster #2 1.762 1.833 1.905 1.548 1.476
Difference 1.810 1.831 1.655 0.333 0.260
Table 5. Factor loadings for indicators.
Indicator Variable Factor Loading Indicator Variable Factor Loading Indicator Variable Factor Loading
CO1 0.923 EX2 0.906 AS2 0.919
CO3 0.891 EX3 0.840 AS3 0.912
CO5 0.931 EX4 0.802 AS4 0.831
AR1 0.878 TR1 0.902 AP1 0.934
AR2 0.885 TR2 0.909 AP2 0.942
AR3 0.883 TR3 0.859 AP4 0.921
AR4 0.830 TR4 0.854
EX1 0.861 AS1 0.894
Table 6. Construct reliability (DG rho and CR), convergent validity (AVE) and multicollinearity (VIF).
Factor DG rho CR AVE VIF
Convenience 0.909 * 0.939 * 0.837 * 1.080 *
Credibility 0.911 * 0.924 * 0.526 * 1.0830 *, 1.132 *
Attractiveness 0.895 * 0.925 * 0.756 * 1.378 *
Expertise 0.879 * 0.914 * 0.728 * 2.019 *
Trustworthiness 0.905 * 0.933 * 0.777 * 2.008 *
Attitude towards social media influencers 0.913 * 0.938 * 0.792 * 1.132 *
Attitude towards products or services 0.925 * 0.953 * 0.870 *
Symbol “*” means: DG rho – Dillon–Goldstein’s rho > 0.7; CR – Composite Reliability > 0.6; AVE – Average Variance Extracted > 0.5; VIF – Variance Inflation Factors < 5.
Table 7. Discriminant validity—Fornell and Larker criterion.
Factor Attitude towards SMI Attitude towards products/services Attractiveness Convenience Credibility Expertise Trustworthiness
Attitude towards SMI 0.890
Attitude towards products/services 0.684 0.933
Attractiveness 0.403 0.363 0.869
Convenience 0.550 0.478 0.377 0.915
Credibility 0.341 0.335 0.789 0.271 0.726
Expertise 0.253 0.295 0.484 0.194 0.873 0.853
Trustworthiness 0.197 0.170 0.479 0.101 0.841 0.688 0.881
Note: Italics represents the square root of AVE.
Table 8. Discriminant validity—cross loadings.
Indicator Variable Attitude towards SMI Attitude towards products/services Attractiveness Convenience Credibility Expertise Trustworthiness
AS1 0.894 0.601 0.356 0.507 0.299 0.214 0.174
AS2 0.919 0.602 0.384 0.501 0.331 0.239 0.206
AS3 0.912 0.636 0.346 0.52 0.262 0.185 0.121
AS4 0.831 0.594 0.349 0.428 0.323 0.264 0.202
AP1 0.641 0.934 0.367 0.489 0.318 0.264 0.150
AP2 0.629 0.942 0.311 0.442 0.302 0.274 0.158
AP3 0.642 0.921 0.336 0.406 0.317 0.287 0.167
AR1 0.324 0.290 0.878 0.275 0.709 0.448 0.438
AR2 0.291 0.289 0.885 0.335 0.719 0.439 0.476
AR3 0.451 0.417 0.883 0.432 0.684 0.421 0.402
AR4 0.341 0.265 0.830 0.266 0.627 0.369 0.343
CO1 0.518 0.461 0.337 0.923 0.229 0.152 0.082
CO3 0.457 0.387 0.357 0.891 0.269 0.199 0.110
CO5 0.532 0.459 0.342 0.931 0.25 0.184 0.088
EX1 0.301 0.317 0.445 0.202 0.765 0.861 0.599
EX2 0.216 0.263 0.431 0.174 0.800 0.906 0.654
EX3 0.109 0.155 0.345 0.093 0.703 0.840 0.559
EX4 0.229 0.265 0.425 0.188 0.707 0.802 0.532
TR1 0.142 0.114 0.387 0.052 0.756 0.633 0.902
TR2 0.126 0.122 0.402 0.034 0.761 0.630 0.909
TR3 0.199 0.174 0.439 0.126 0.736 0.570 0.859
TR4 0.232 0.192 0.466 0.15 0.713 0.594 0.854
Table 9. Discriminant validity—HTMT.
Factor Attitude towards SMI Attitude towards products/services Attractiveness Convenience Credibility Expertise Trustworthiness
Attitude towards SMI
Attitude towards products/services 0.745
Attractiveness 0.449 0.399
Convenience 0.604 0.521 0.42
Credibility 0.377 0.365 0.884 0.303
Expertise 0.282 0.326 0.545 0.218 0.973
Trustworthiness 0.219 0.187 0.532 0.115 0.923 0.773
Table 10. The path coefficient of relationship between latent variables.
Hypothesis β Sample Mean SD t Statistics p-Values R2 Q2
Attitude towards SMI → Attitude towards products/services 0.494 0.497 0.055 8.910 0.000 0.343 0.268
Attractiveness → Credibility 0.207 0.202 0.050 4.117 0.000
Convenience → Attitude towards SMI 0.644 0.643 0.051 12.643 0.000 0.479 0.411
Credibility → Attitude towards SMI 0.115 0.116 0.050 2.317 0.021
Credibility → Attitude towards products/services 0.413 0.413 0.015 27.173 0.000 0.996 0.520
Expertise → Credibility 0.438 0.438 0.014 32.326 0.000
Trustworthiness → Credibility 0.342 0.342 0.013 25.990 0.000
Table 11. Results of using ML algorithms to model user Attitude towards influencers.
ML Method MSE MAE R2
Decision Tree 0.002 0.006 0.997
SVM 0.094 0.181 0.876
Random Forest 0.001 0.009 0.998
AdaBoost 0.000 0.002 0.999
Disclaimer/Publisher’s Note: The statements, opinions and data contained in all publications are solely those of the individual author(s) and contributor(s) and not of MDPI and/or the editor(s). MDPI and/or the editor(s) disclaim responsibility for any injury to people or property resulting from any ideas, methods, instructions or products referred to in the content.
Copyright: This open access article is published under a Creative Commons CC BY 4.0 license, which permit the free download, distribution, and reuse, provided that the author and preprint are cited in any reuse.
Prerpints.org logo

Preprints.org is a free preprint server supported by MDPI in Basel, Switzerland.

Subscribe

© 2024 MDPI (Basel, Switzerland) unless otherwise stated