1. Introduction
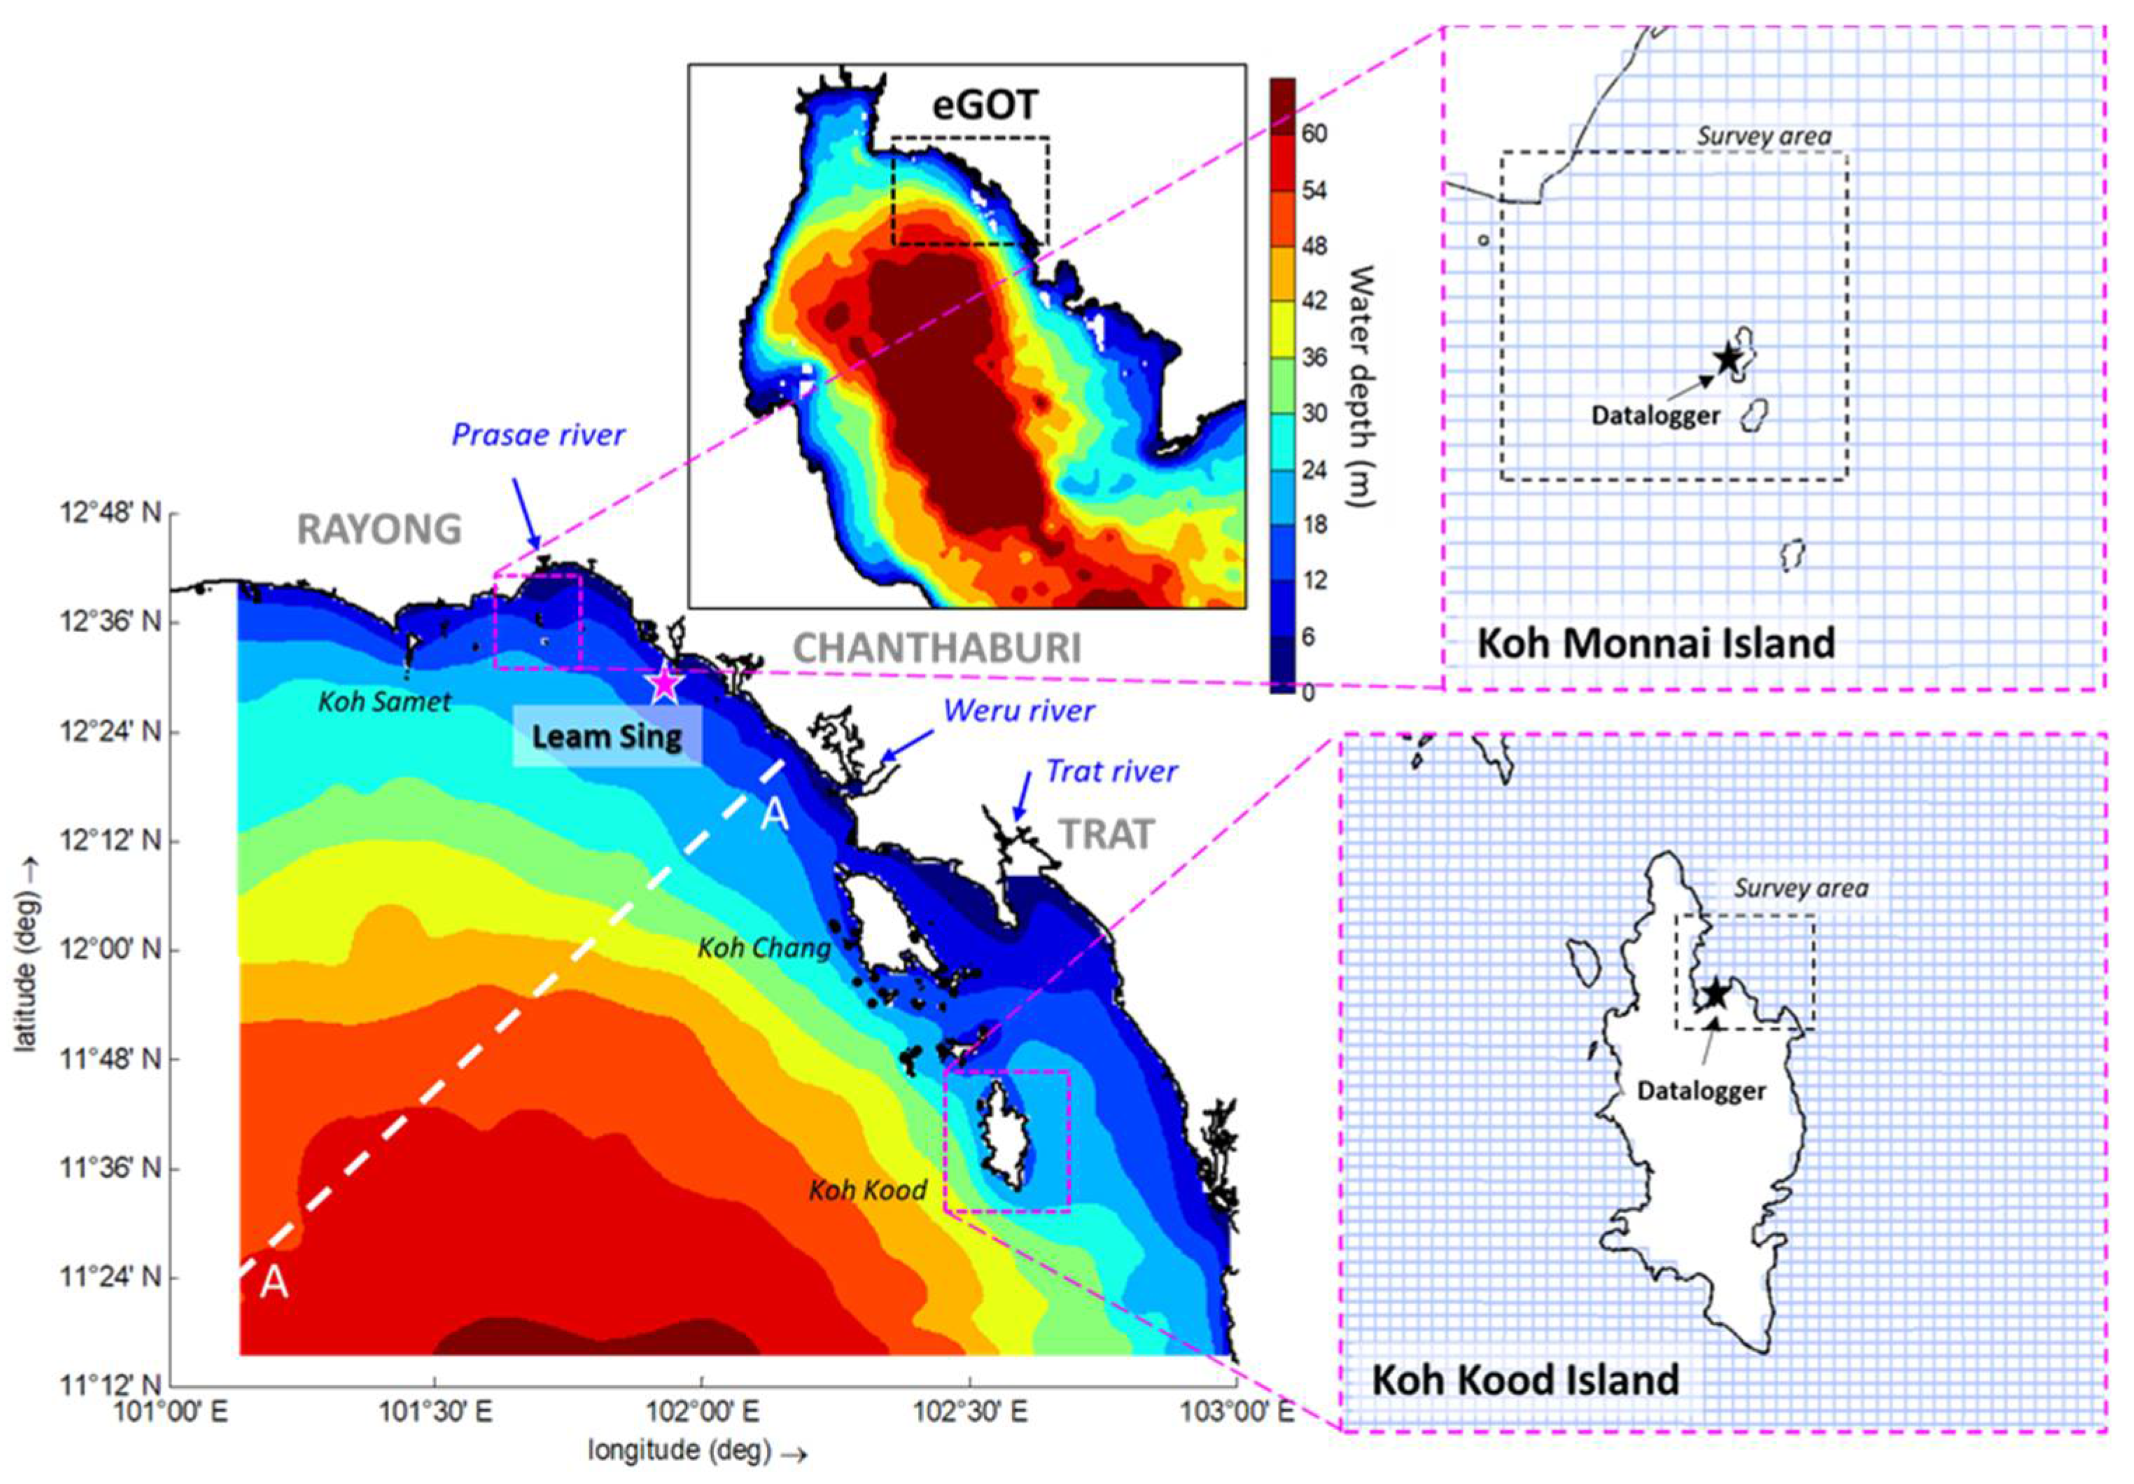
The eastern Gulf of Thailand (eGOT), depicted in
Figure 1, spans over 25,000 km
2 and constitutes a shallow coastal water body situated at the northeastern extremity of the Gulf of Thailand. With an average depth of 35 m and the deepest area located offshore in the southwestern direction, reaching a maximum depth of 65 m, the eGOT encompasses approximately 500 km of coastline, which represents about 15% of Thailand’s total coastline. It serves as a crucial site for marine environmental and socio-economic services in Thailand. The sea within the eGOT borders the coastal zones of Rayong, Chanthaburi, and Trat provinces in Thailand, as well as western regions of Cambodia, hosting vital industries, tourism facilities, cities, fisheries, and farmland. Despite its significant footprint, there exists limited documentation regarding its hydrographic characteristics. A comprehensive understanding of the hydrographic properties and their variations is essential for facilitating improved sea and resource management in this region.
Previous hydrographic investigations pertaining to the eastern Gulf of Thailand (eGOT) have predominantly focused on the broader characteristics of the Gulf of Thailand on a regional scale, with the eGOT area being merely a subset of their scope. Notably, [
1] utilized data from the NAGA expedition to provide an initial description of the intricate hydrographic dynamics within the South China Sea and the Gulf of Thailand, highlighting their seasonal variability linked to the Asian-Australian monsoon. Subsequent numerical studies, including those by [
2,
3,
4,
5] have further elucidated the seasonal variations in Gulf of Thailand circulation. These variations are shown to be influenced by a combination of factors, including tides, prevailing winds, river discharge, direct rainfall to the sea, and sea surface heat exchanges. [
6] conducted an analysis utilizing data obtained from High Frequency Radar, unveiling seasonal variations in tidal residual surface current patterns. Additionally, [
7] corroborated these observations, providing further insight into the intricate complexities of these variations through the utilization of remotely sensed data.
Early works that providing detailed insights into the eGOT are scarce. [
8] Utilized remotely sensed observations to discern the presence of a warm water pool during winter in the northeastern region of the Gulf of Thailand, adjacent to the eGOT. This phenomenon was attributed to orographic effects from the Cardamom Mountains in Cambodia. Furthermore, [
9] conducted limited field measurements using current meters at Ban Leam Sork in Trat province, revealing robust tidal currents with maximum speeds reaching 24 cm/s. They observed alternating flow directions during flood and ebb tides, along with residual currents predominantly towards the southeastern direction in December. Additionally, [
9] documented the intricate seasonal patterns of residual currents around Koh Monnai Island in Rayong province. These patterns were found to be influenced by monsoonal winds, which were further modified by tides and local topography.
Expanding upon previous research, field evidence and unpublished reports have revealed peculiar hydrographic features within the eastern Gulf of Thailand (eGOT). Notably, despite the absence of significant river inflows, instances of low salinity seawater (<28 ppt) have been documented, with notable salinity disparities (>2-3 ppt) between near-surface and sub-surface layers. We hypothesize that this reduced salinity stems from direct rainfall into the sea. Although lacking major river inputs, the eGOT experiences rainfall rates exceeding the national average. Direct rainfall likely diminishes coastal water salinity, thereby reducing overall water density. Consequently, a freshwater layer can form atop denser seawater, resulting in stratification that hampers vertical mixing and restricts exchanges of heat, nutrients, and dissolved gases between surface and deeper layers. Such stratification may induce buoyancy-driven flows and horizontal currents, influencing coastal hydrodynamics and distinguishing the eGOT from the broader Gulf of Thailand (GOT) system. Similar phenomena of rainfall influence on coastal dynamics have been documented both in the open ocean [
10,
11] and coastal environments [
12,
13,
14]. Moreover, studies by [
5,
15] have demonstrated the substantial impact of atmospheric freshwater fluxes of the Asian-Australian monsoon system on the Bay of Bengal and the Gulf of Thailand, respectively. Alterations in coastal hydrodynamics induced by direct rainfall can yield ecological ramifications. Changes in circulation patterns and stratification can affect nutrient availability, primary production, and the distribution of plankton and other marine organisms, thereby influencing ecosystem dynamics [
16,
17,
18].
This paper aims to offer detailed insights into the topographic, meteorological and three-dimensional hydrographic characteristics of the eGOT intricate three-dimensional hydrography of the region. Furthermore, we present influence of direct rainfall on local three-dimensional hydrography at the eGOT and the emergence of the Chathaburi Coastal Current (CCC) through numerical experiments. This finding holds relevance for hydrodynamic modeling endeavors in tropical shallow coastal regions that receive significant freshwater inputs, not only from river systems but also from direct rainfall.
5. Conclusions
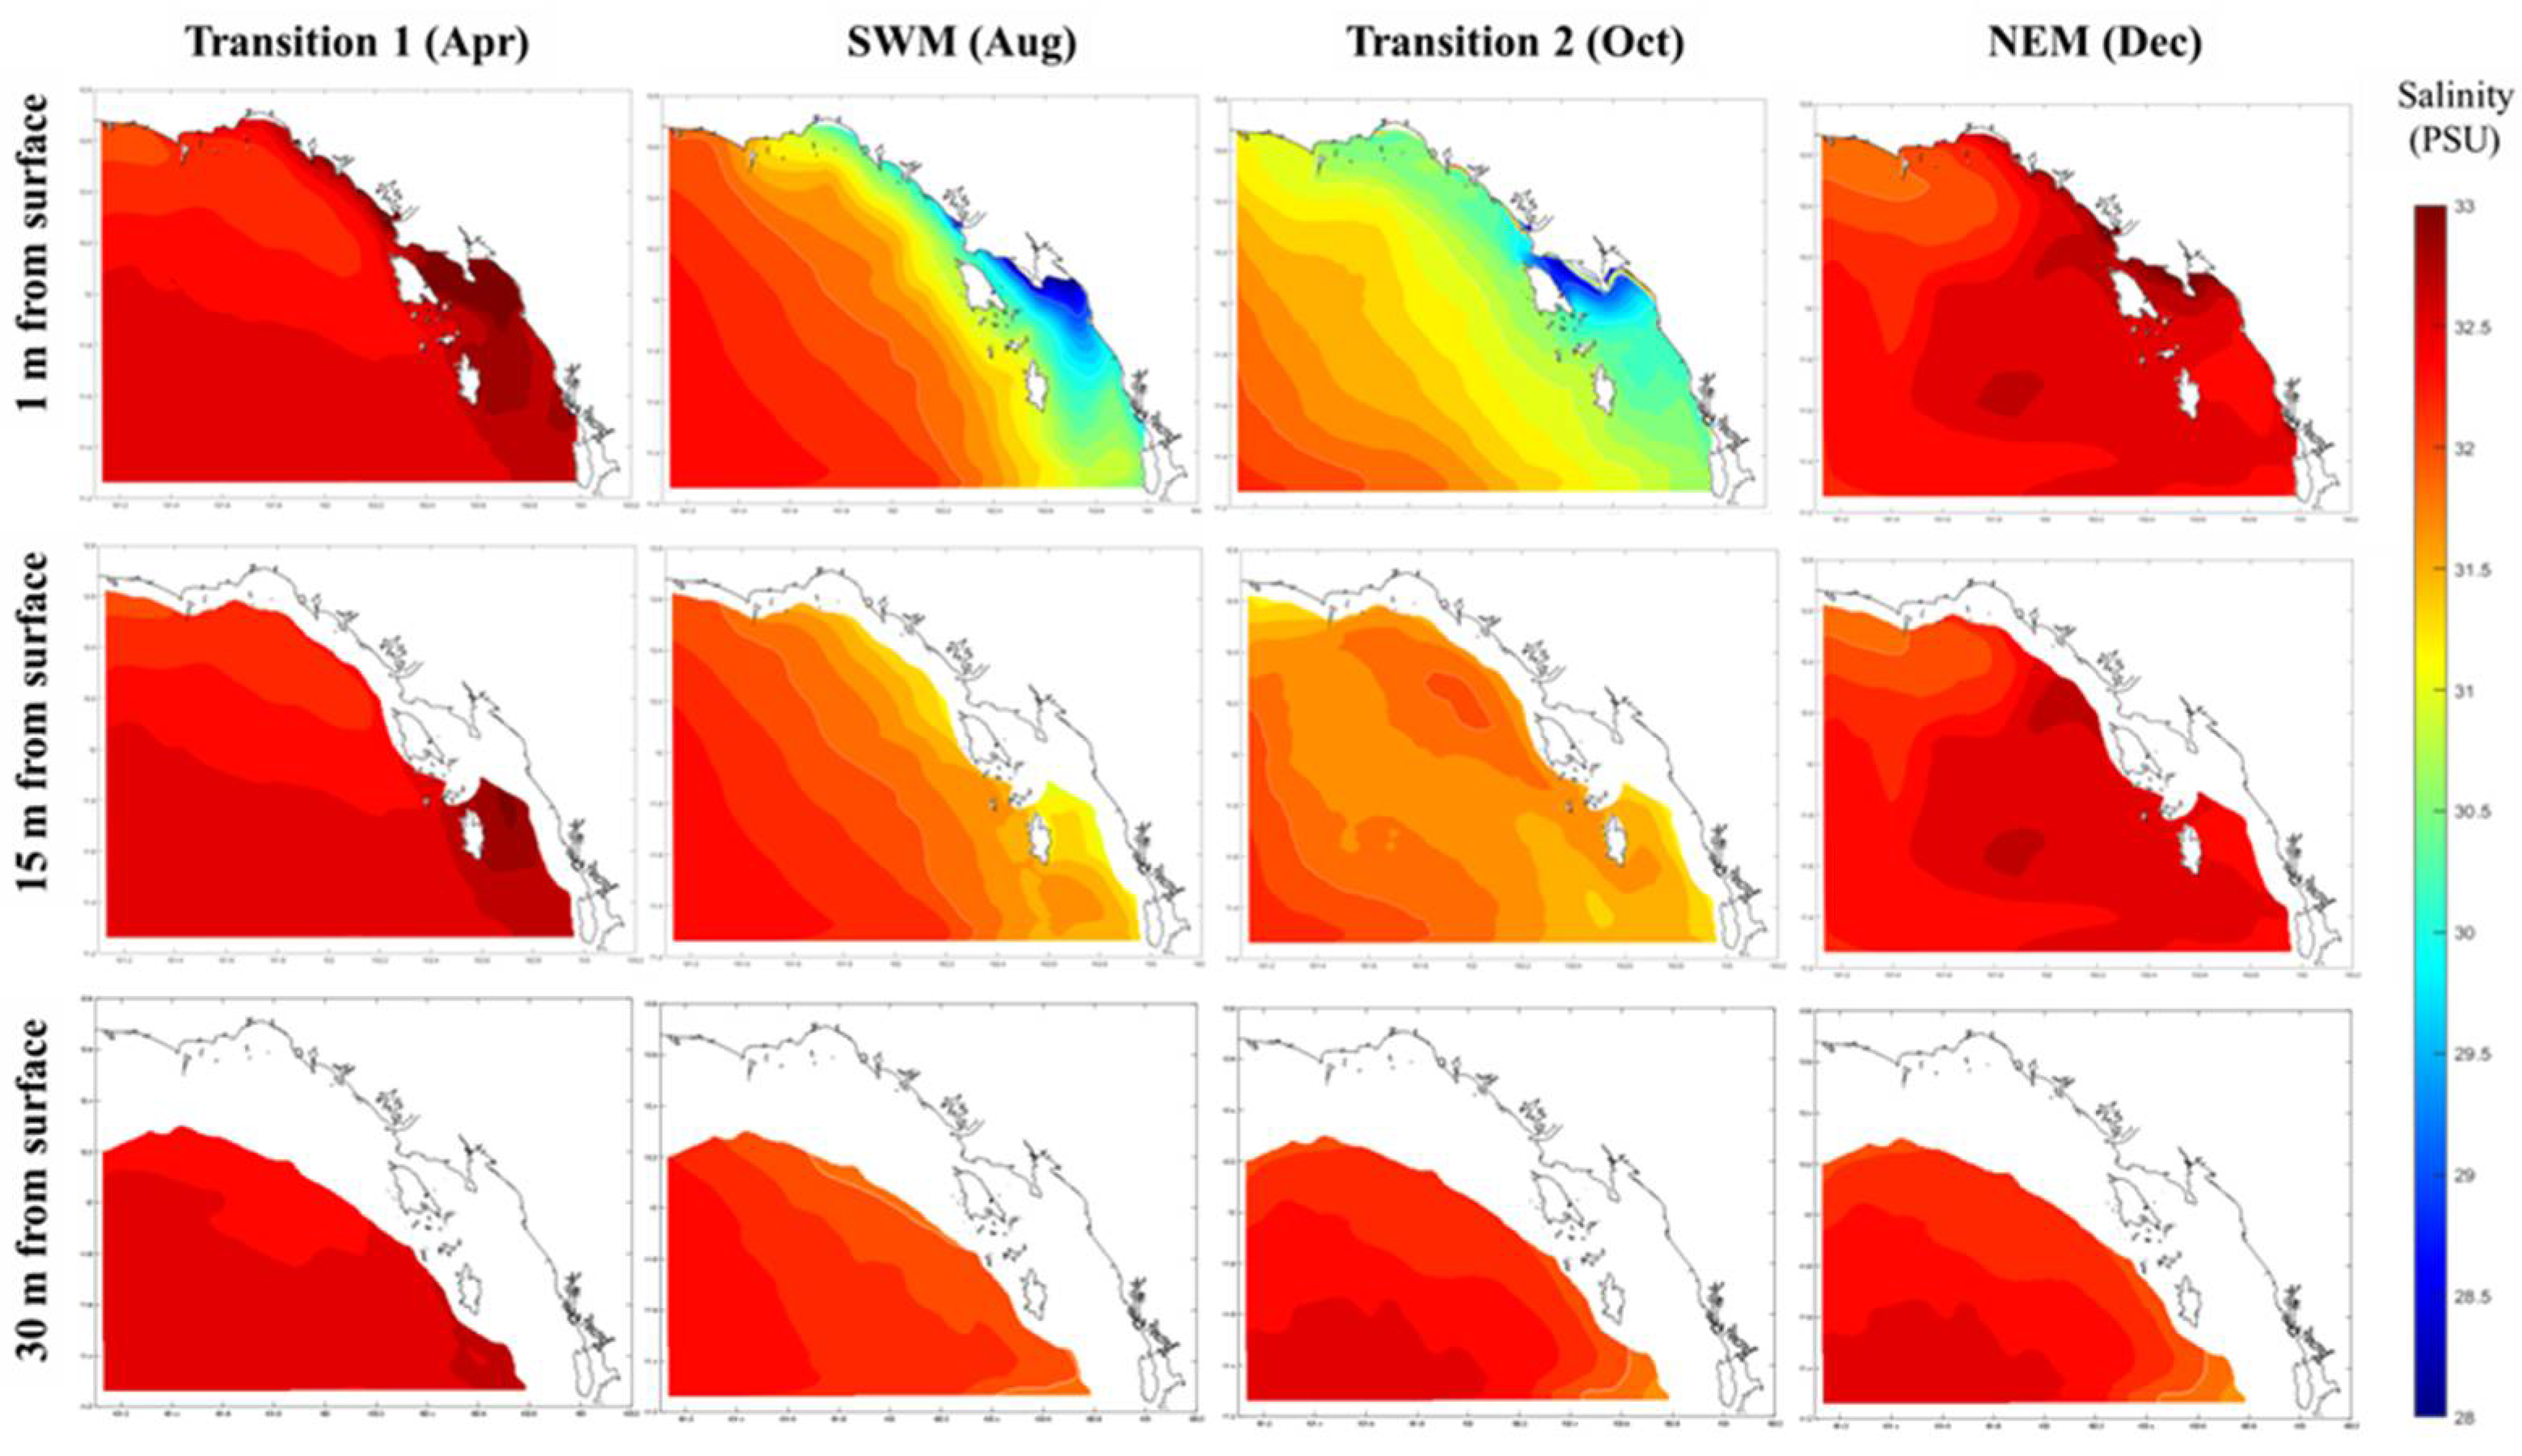
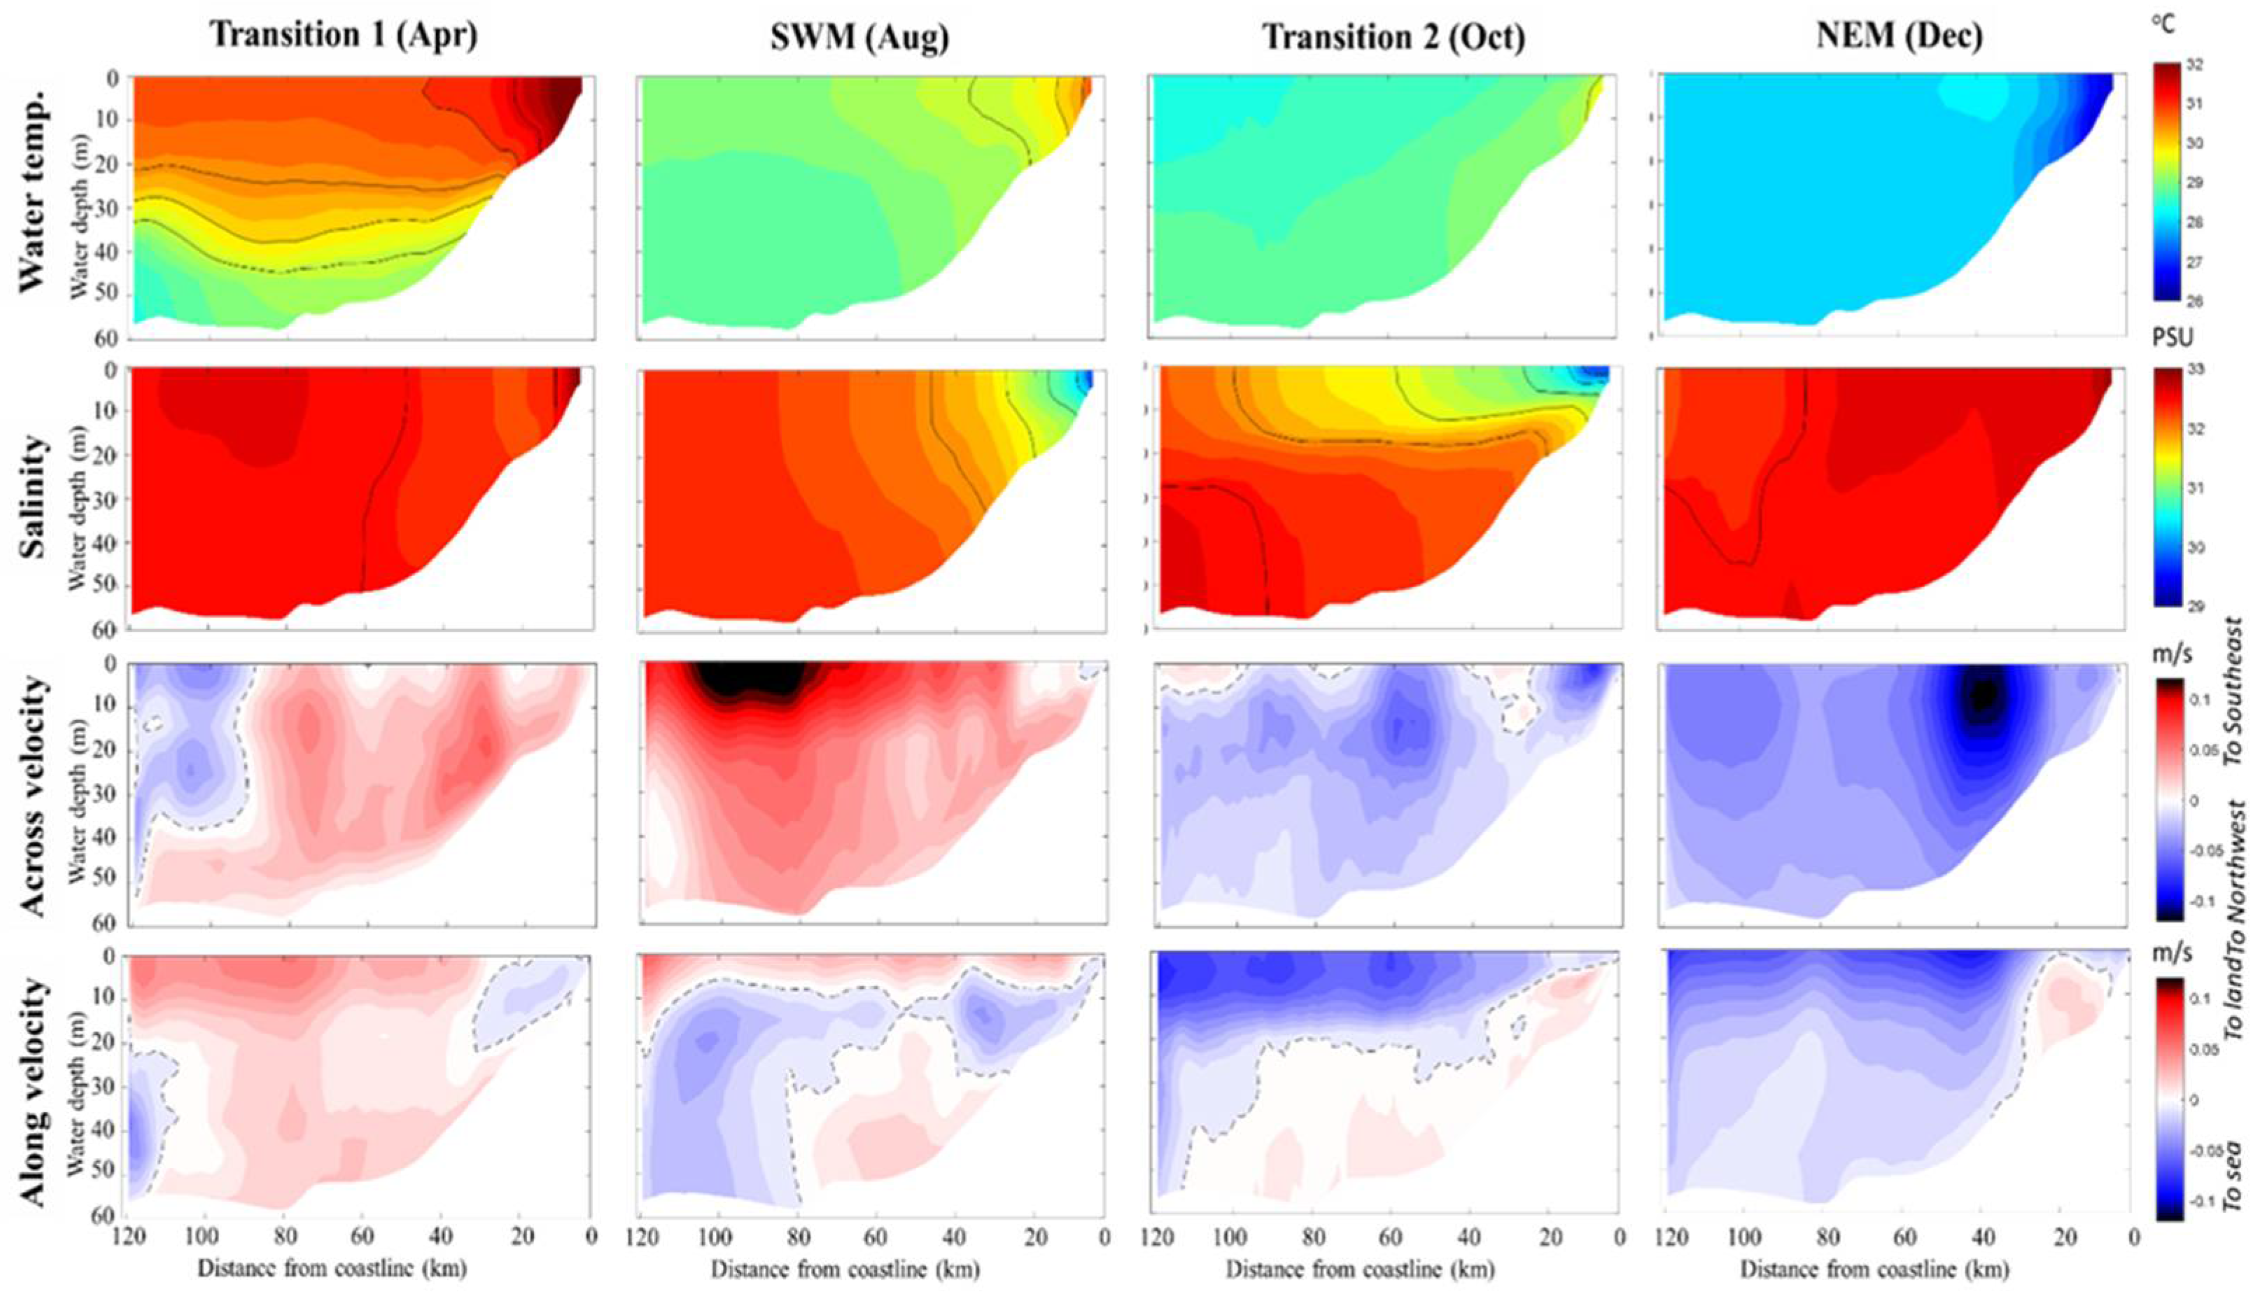
Noted from field observations, hydrographic conditions at the eGOT exhibit significant spatial and temporal variability, with pronounced variations in water temperature, salinity, and flow velocities influenced by the Asian-Australian monsoon. Offshore and deep areas typically experience lower water temperatures, reaching their lowest levels during the NEM. During Transition 1, lower layer temperatures are 2-3 degrees lower than near-surface values. The SWM brings higher freshwater input from rainfall, resulting in a significant reduction in salinity of near-surface layers. This salinity decrease is particularly prominent during the SWM and Transition 2. Differences between near-surface and sub-surface, and near-shore and offshore salinity can be 2-3 ppt, significantly impacting seawater density. The influx of freshwater from rainfall diminishes the overall salinity of coastal waters, leading to decreased water density. During the SWM and Transition 2, strong stratification is observed in shallow areas (water depth < 15 m), influencing coastal hydrodynamics. Salinity levels are low during these periods when rainfall rates significantly increase and wind is relatively calm. Stratification affects vertical mixing and circulation patterns of the water column, altering hydrodynamics. It can hinder vertical mixing and restrict exchange of heat, nutrients, and dissolved gases between surface and deeper layers [
10,
11,
12,
13,
26].
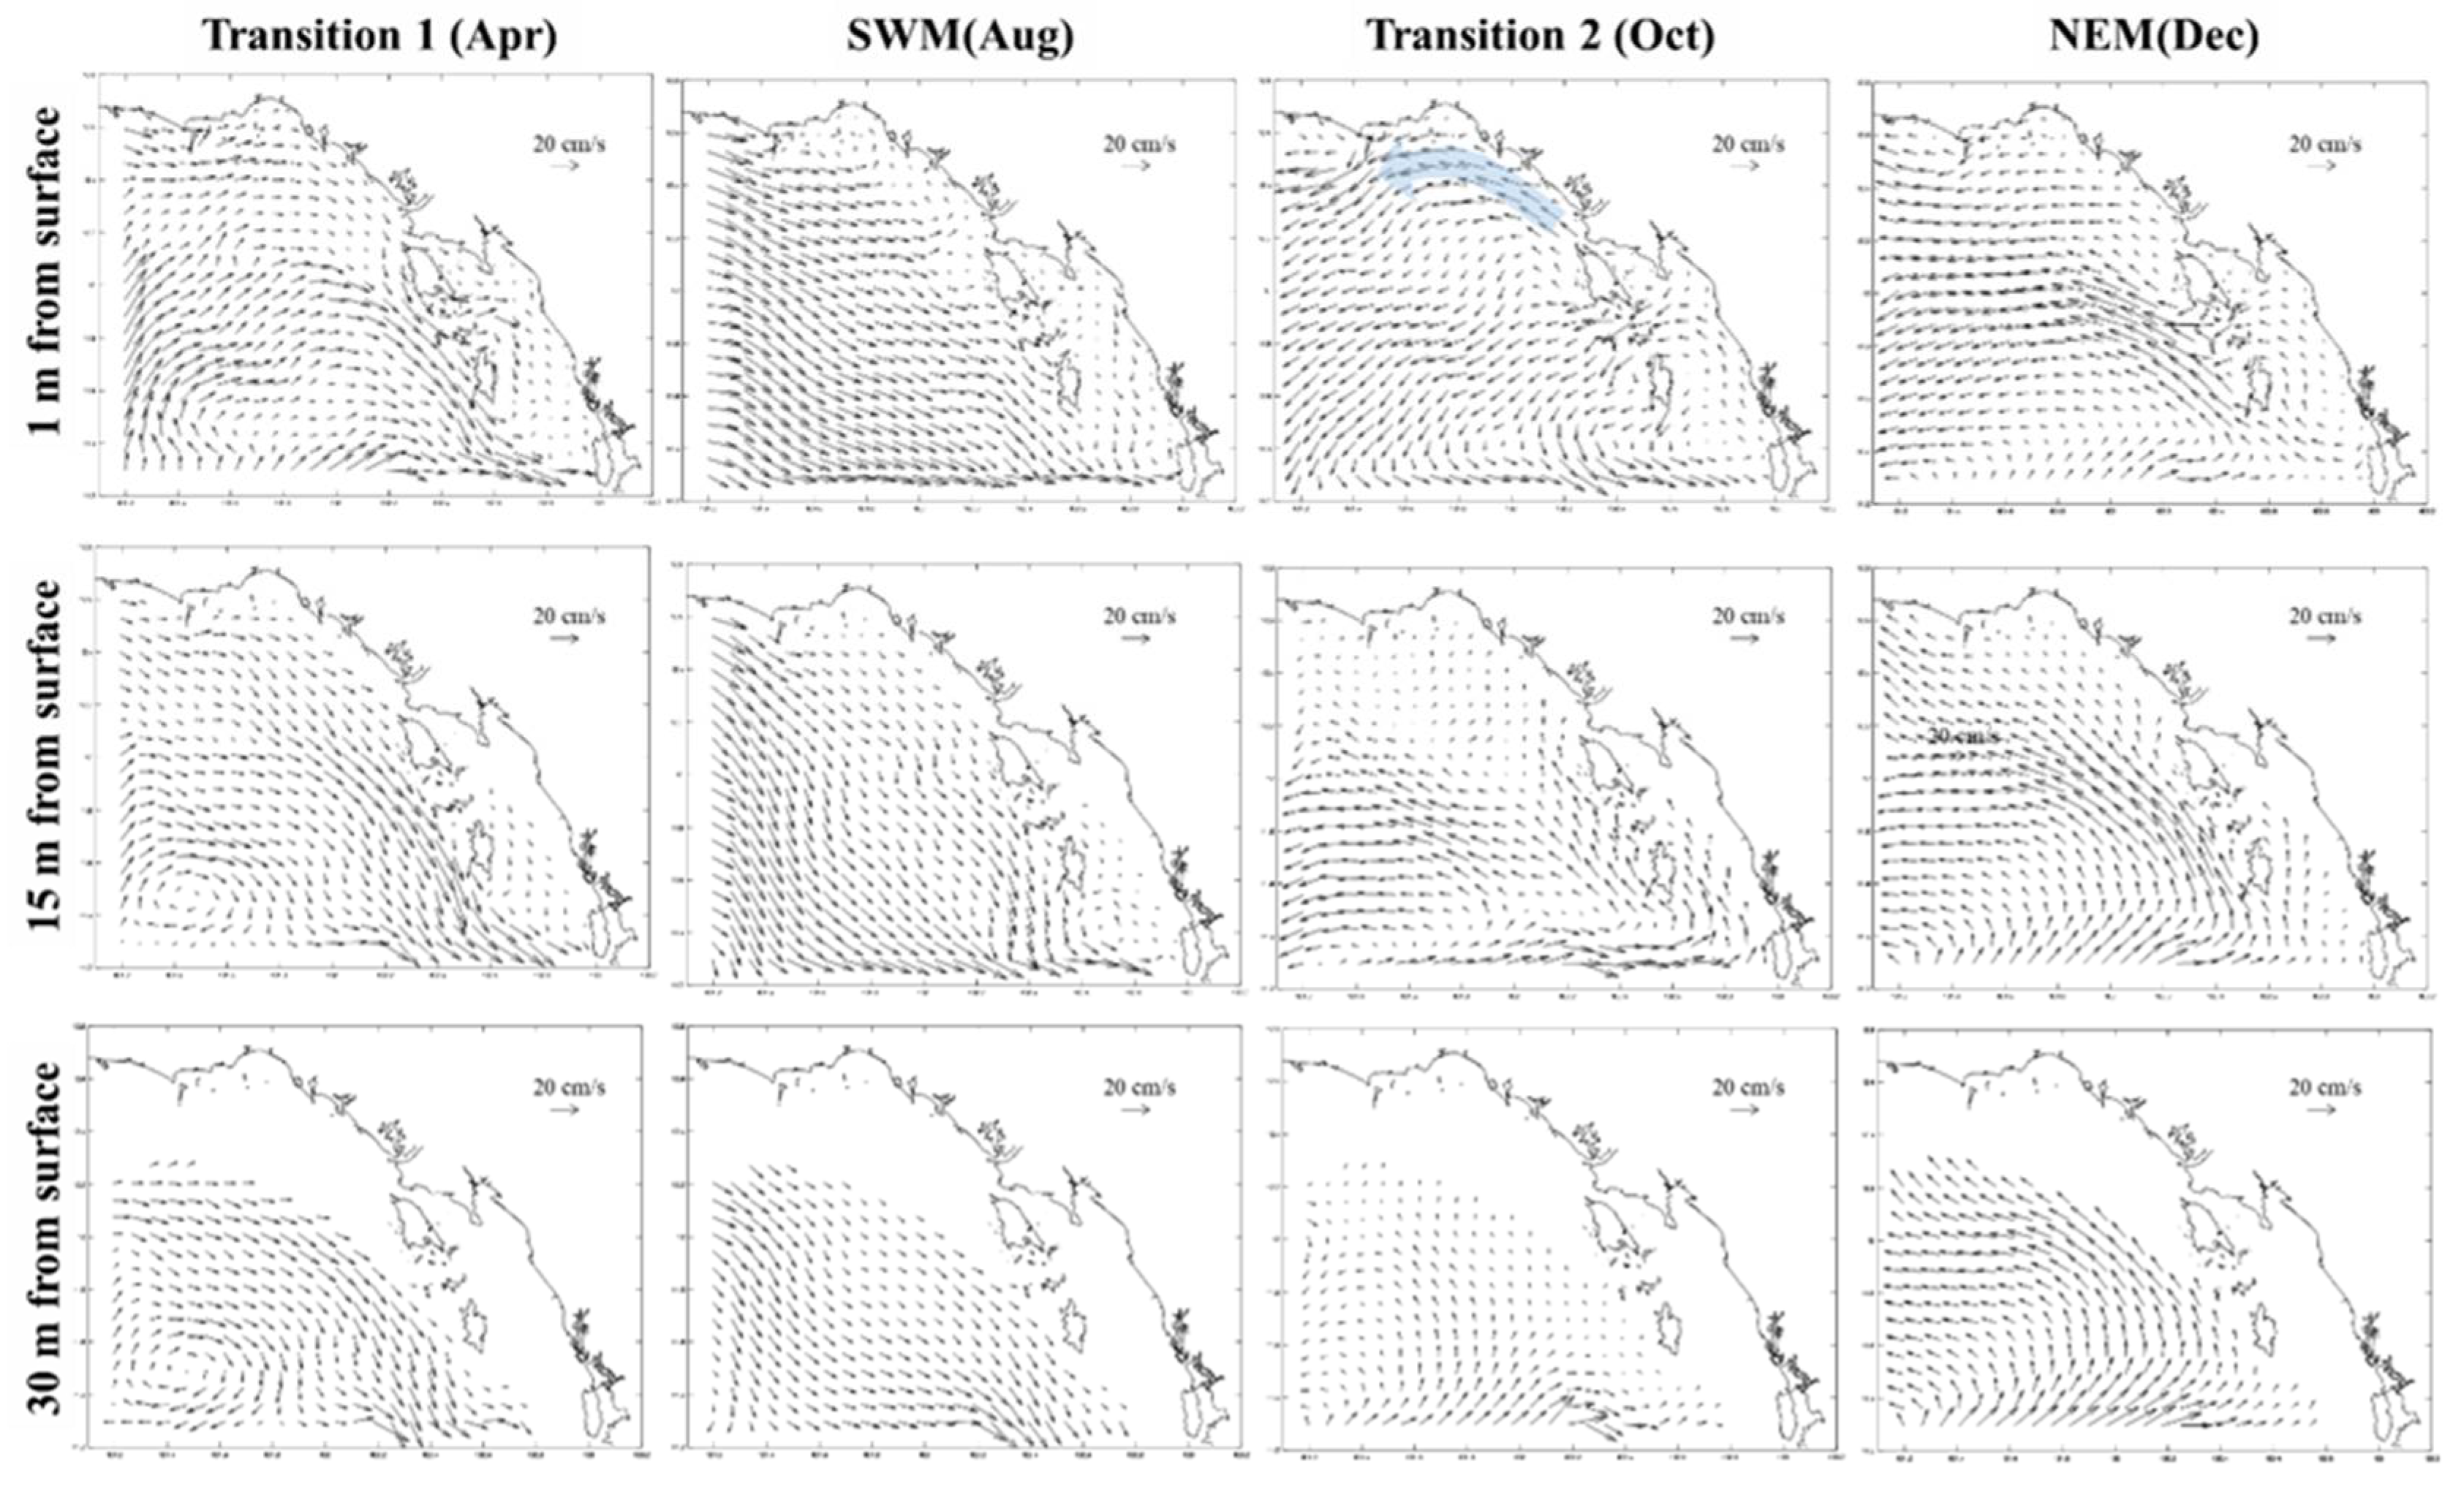
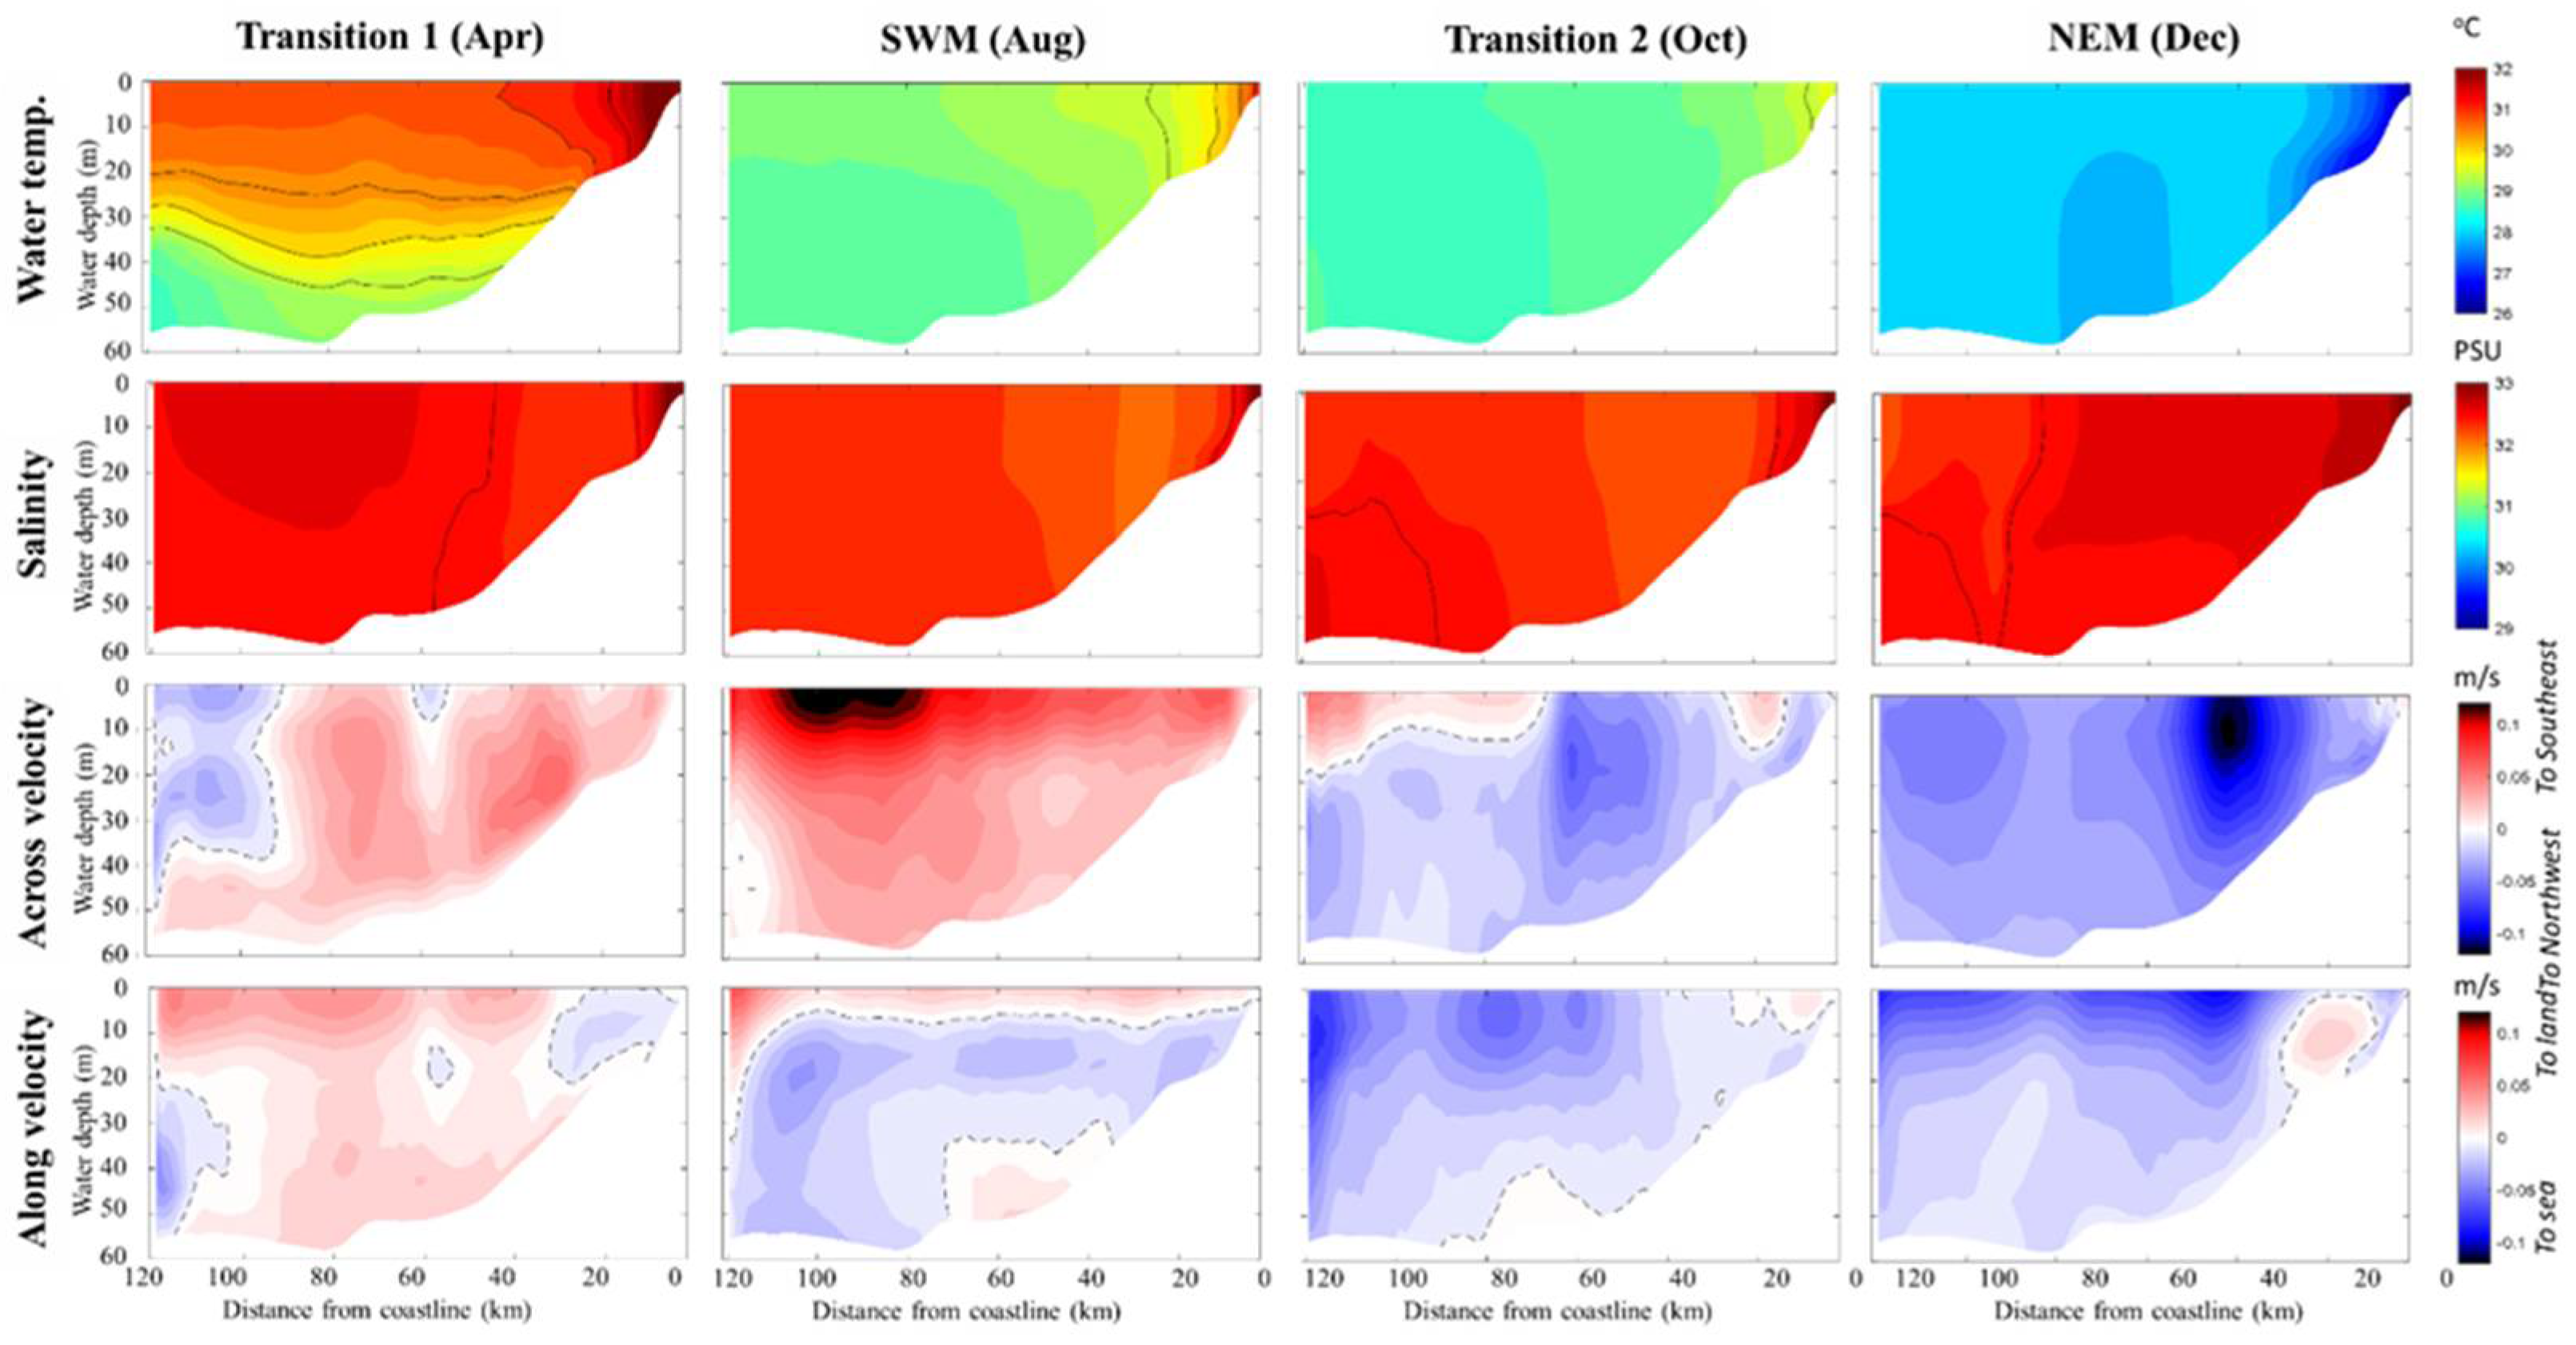
The water circulation in the eGOT exhibits two distinct modes, flowing southeastward during the Transition 1 and SWM, and northwestward during Transition 2 and NEM, closely aligned with predominant wind directions. The strongest circulation occurs during the SWM and NEM periods. Layered flows induced by water column stratification are particularly notable during the SWM and Transition 2. During these periods, a northwesterly Chanthaburi Coastal Current (CCC) emerges. Model simulations suggest that the CCC can be sustained by direct rainfall into the sea during the SWM and Transition 2. The presence of the CCC may significantly influence the seasonal transport of sediments, nutrients, and pollutants along the eGOT coastline, with ecological ramifications. Altered circulation patterns and stratification affect nutrient availability, primary production, and the distribution of plankton and other marine organisms, ultimately impacting the entire ecosystem and fisheries dynamics [
17,
18].
Future work is essential to conduct detailed sensitivity analyses and model runs to investigate the mechanisms governing the Chanthaburi Coastal Current (CCC) and its variations. This may include considering freshwater discharges from small rivers and creeks along the eGOT coastline, as well as grid refinement and additional continuous field observations for model validation along the coastline. These efforts could enhance the model’s capability to capture the detailed behavior of the CCC. Furthermore, investigation of the effects of changing rainfall patterns in the future, resulting from inter-annual variations in climate drivers such as the El Niño-Southern Oscillation and the Indian Ocean Dipole, is warranted. Additionally, exploring the influence of extreme rainfall events, which are expected to occur more frequently under ongoing global warming, is crucial [
14,
16,
27]. Such future research endeavors will provide valuable insights into the dynamics of the eGOT’s hydrographic features and their responses to environmental changes.
Figure 1.
Location map, bathymetry, and modeling domain of the Eastern Gulf of Thailand (eGOT) within the larger Gulf of Thailand. Star symbols indicate the locations of field-observed data, while inset plots provide detailed views of the modeling grid and survey areas near Koh Monnai Island and Koh Kood Island.
Figure 2.
Monthly average wind rose derived from the ECMWF-ERA5 dataset between 2006-2020 showing at different monsoonal periods from Koh Monnai island.
Figure 2.
Monthly average wind rose derived from the ECMWF-ERA5 dataset between 2006-2020 showing at different monsoonal periods from Koh Monnai island.
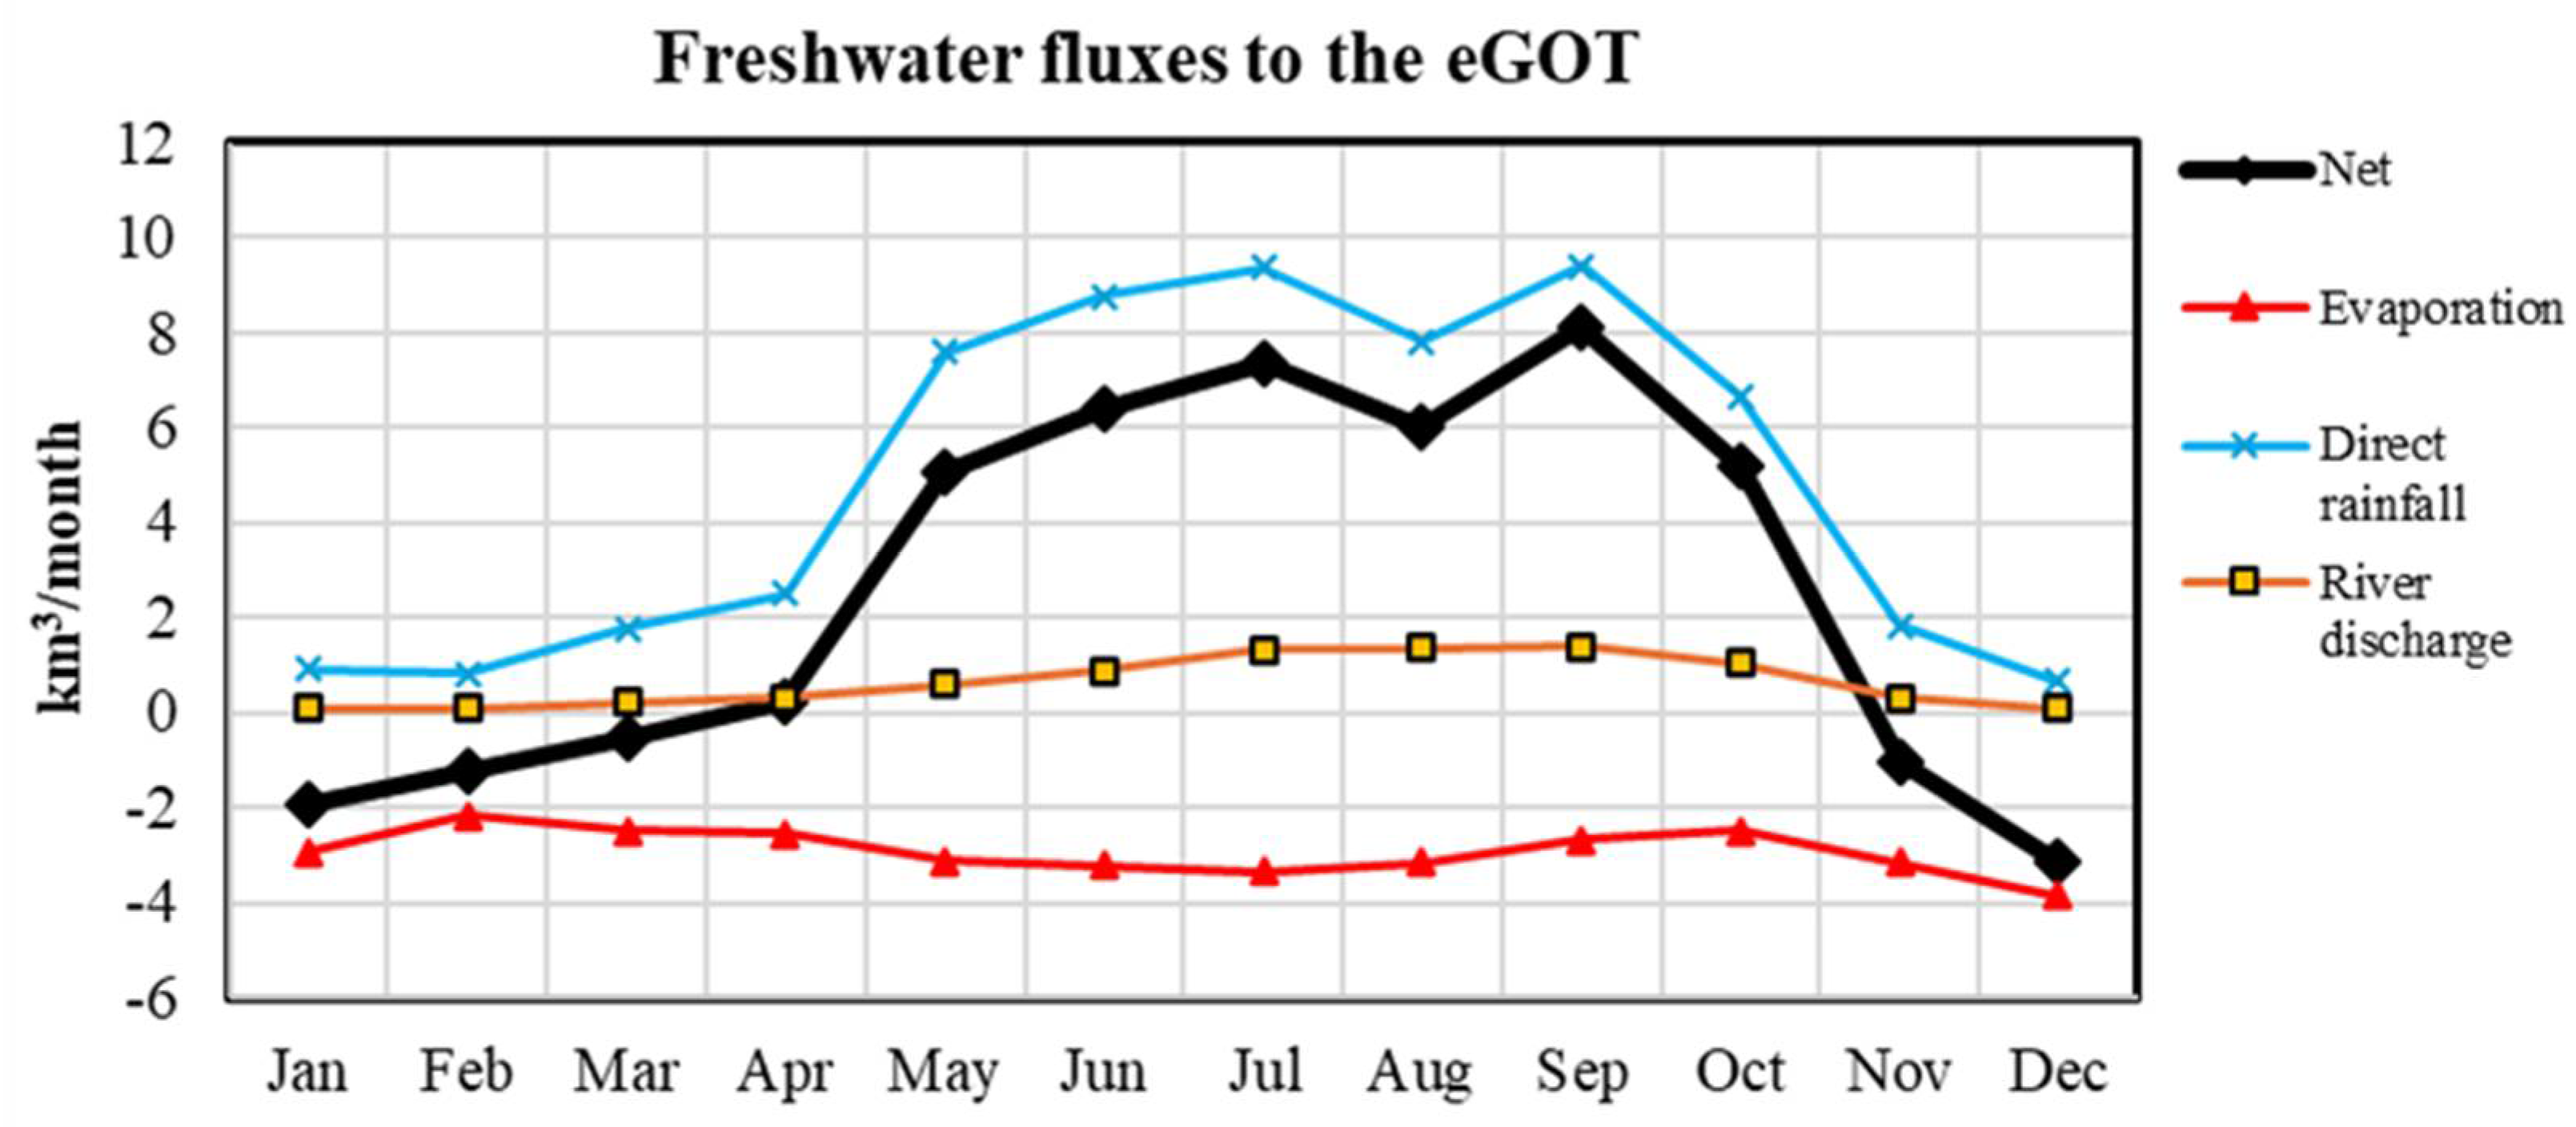
Figure 3.
Freshwater fluxes to the eGOT. Data are from ECMWF-ERA5 reanalysis dataset averaged monthly between 2006-2020.
Figure 3.
Freshwater fluxes to the eGOT. Data are from ECMWF-ERA5 reanalysis dataset averaged monthly between 2006-2020.
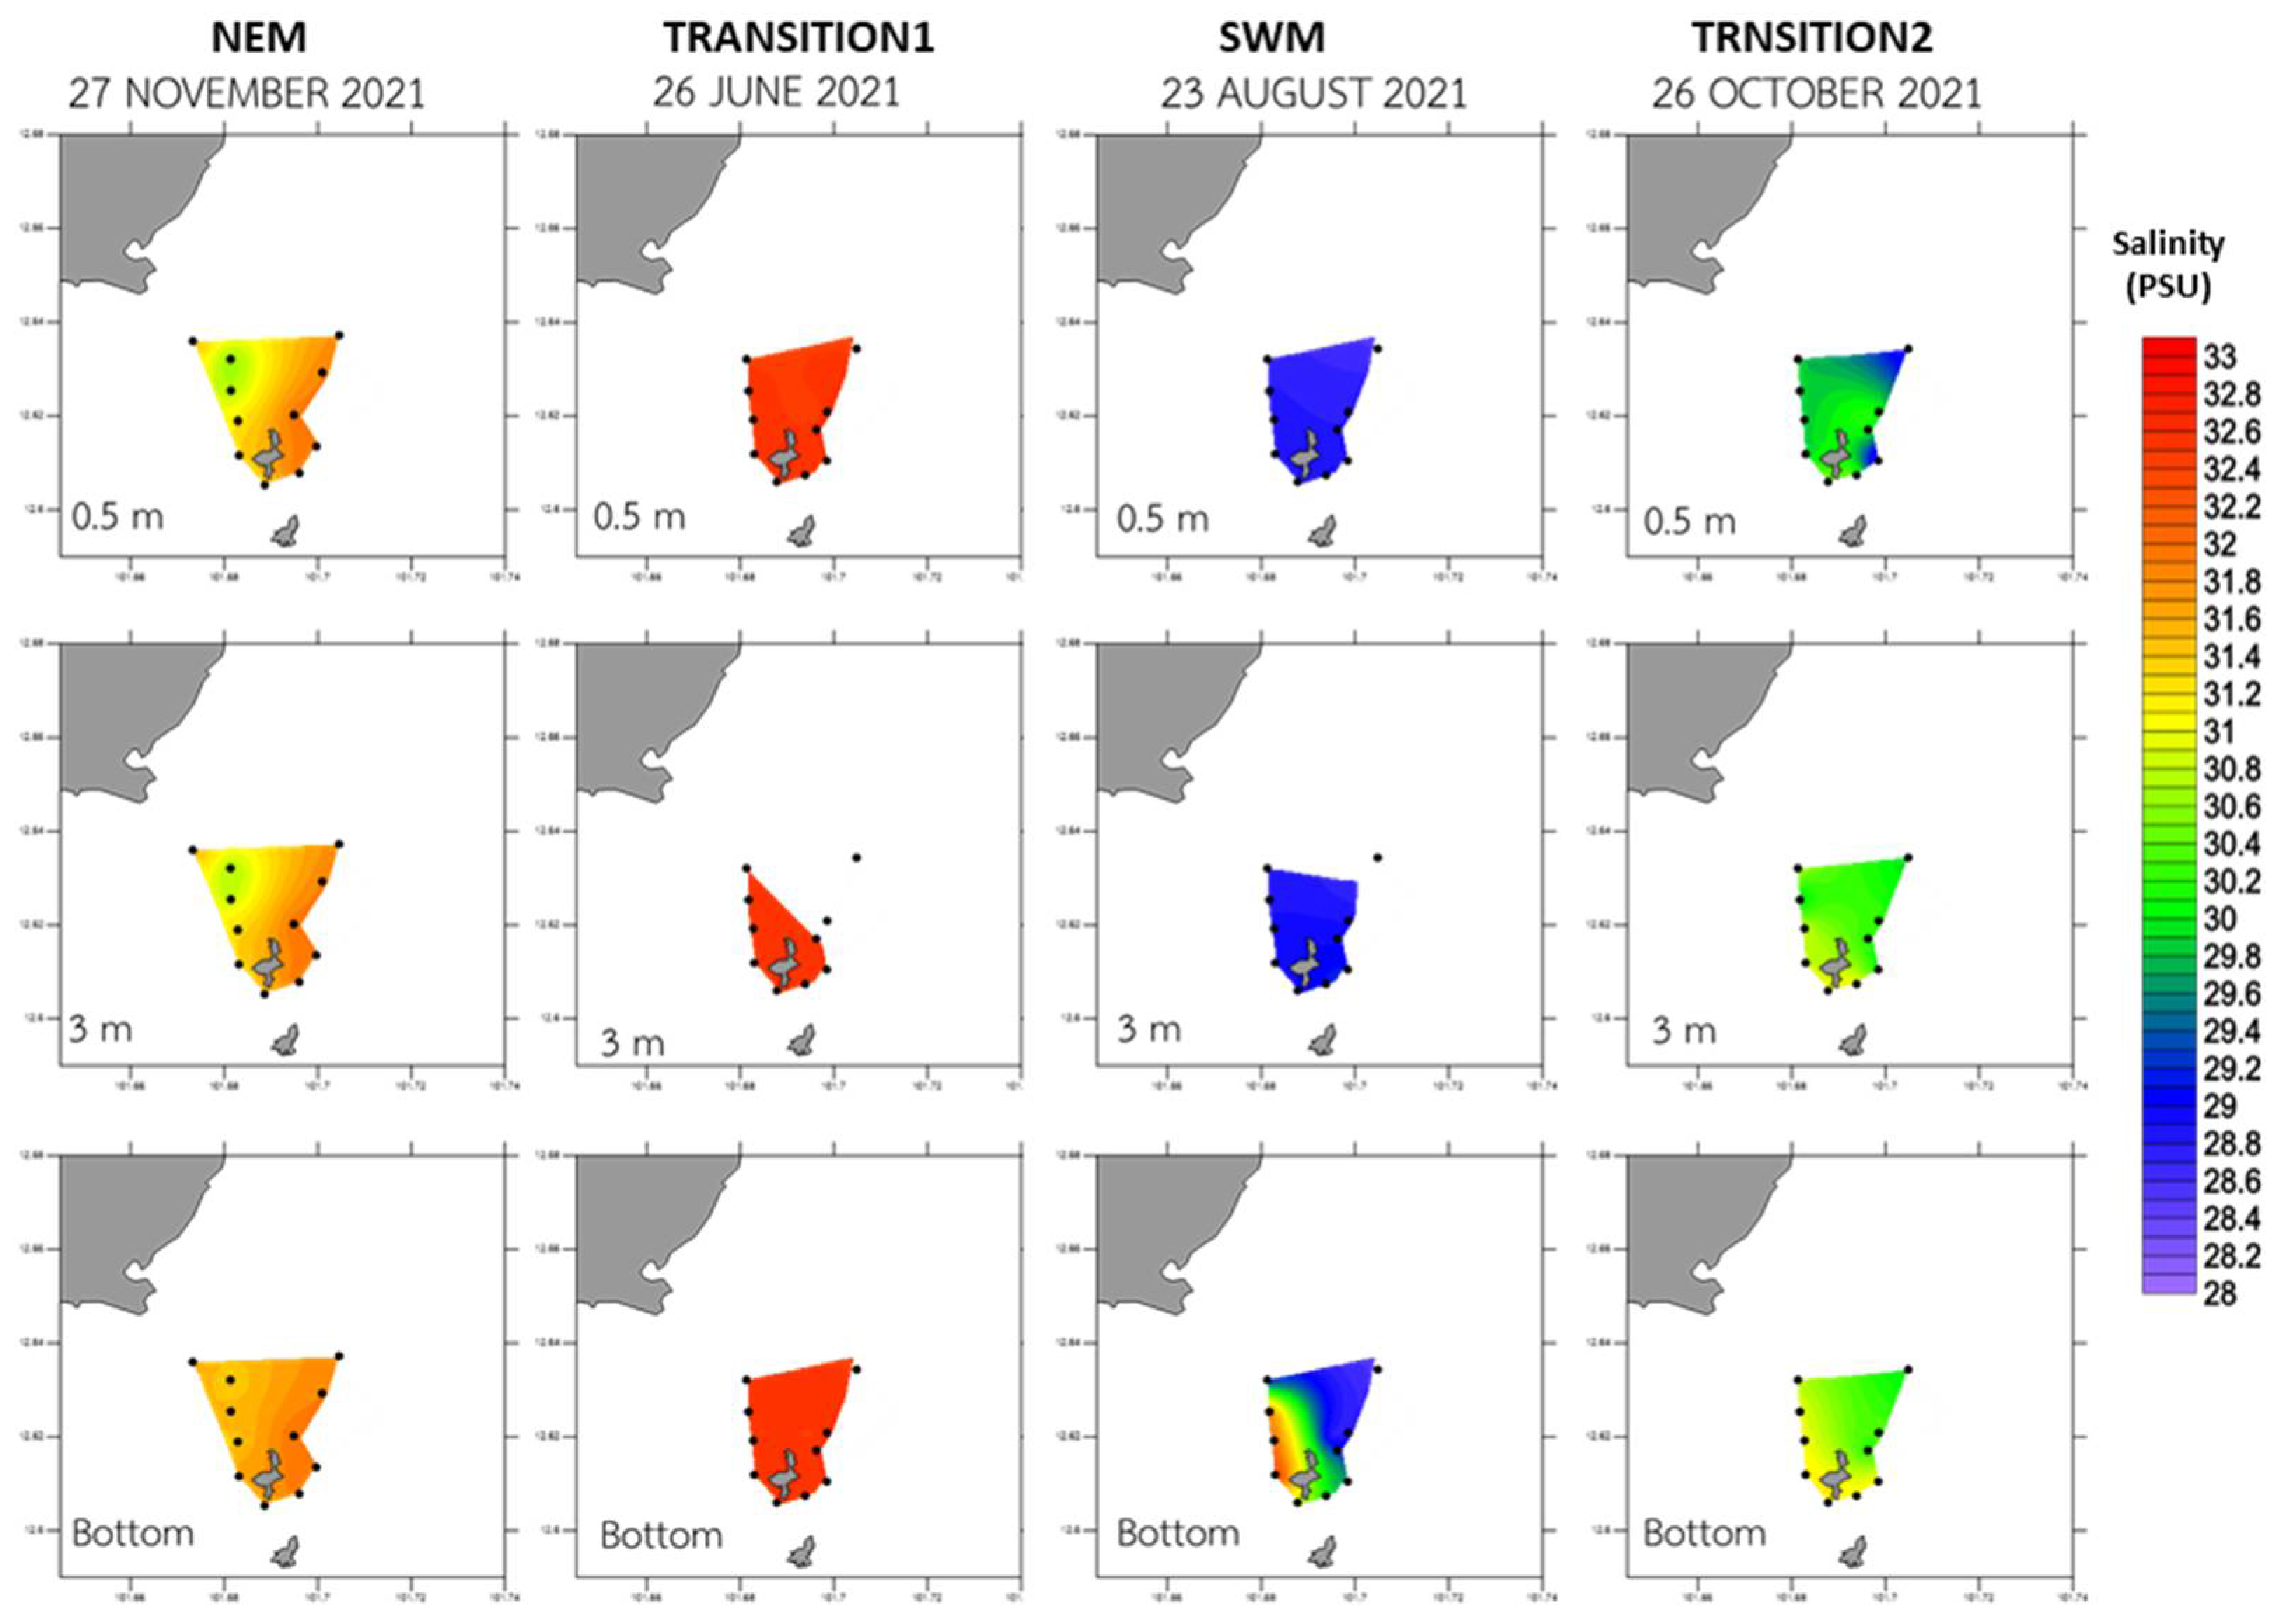
Figure 4.
The salinity distribution at various times and depths around Koh Monnai Island was derived from synoptic survey data interpolation. The locations of the measurements are denoted by black dots.
Figure 4.
The salinity distribution at various times and depths around Koh Monnai Island was derived from synoptic survey data interpolation. The locations of the measurements are denoted by black dots.
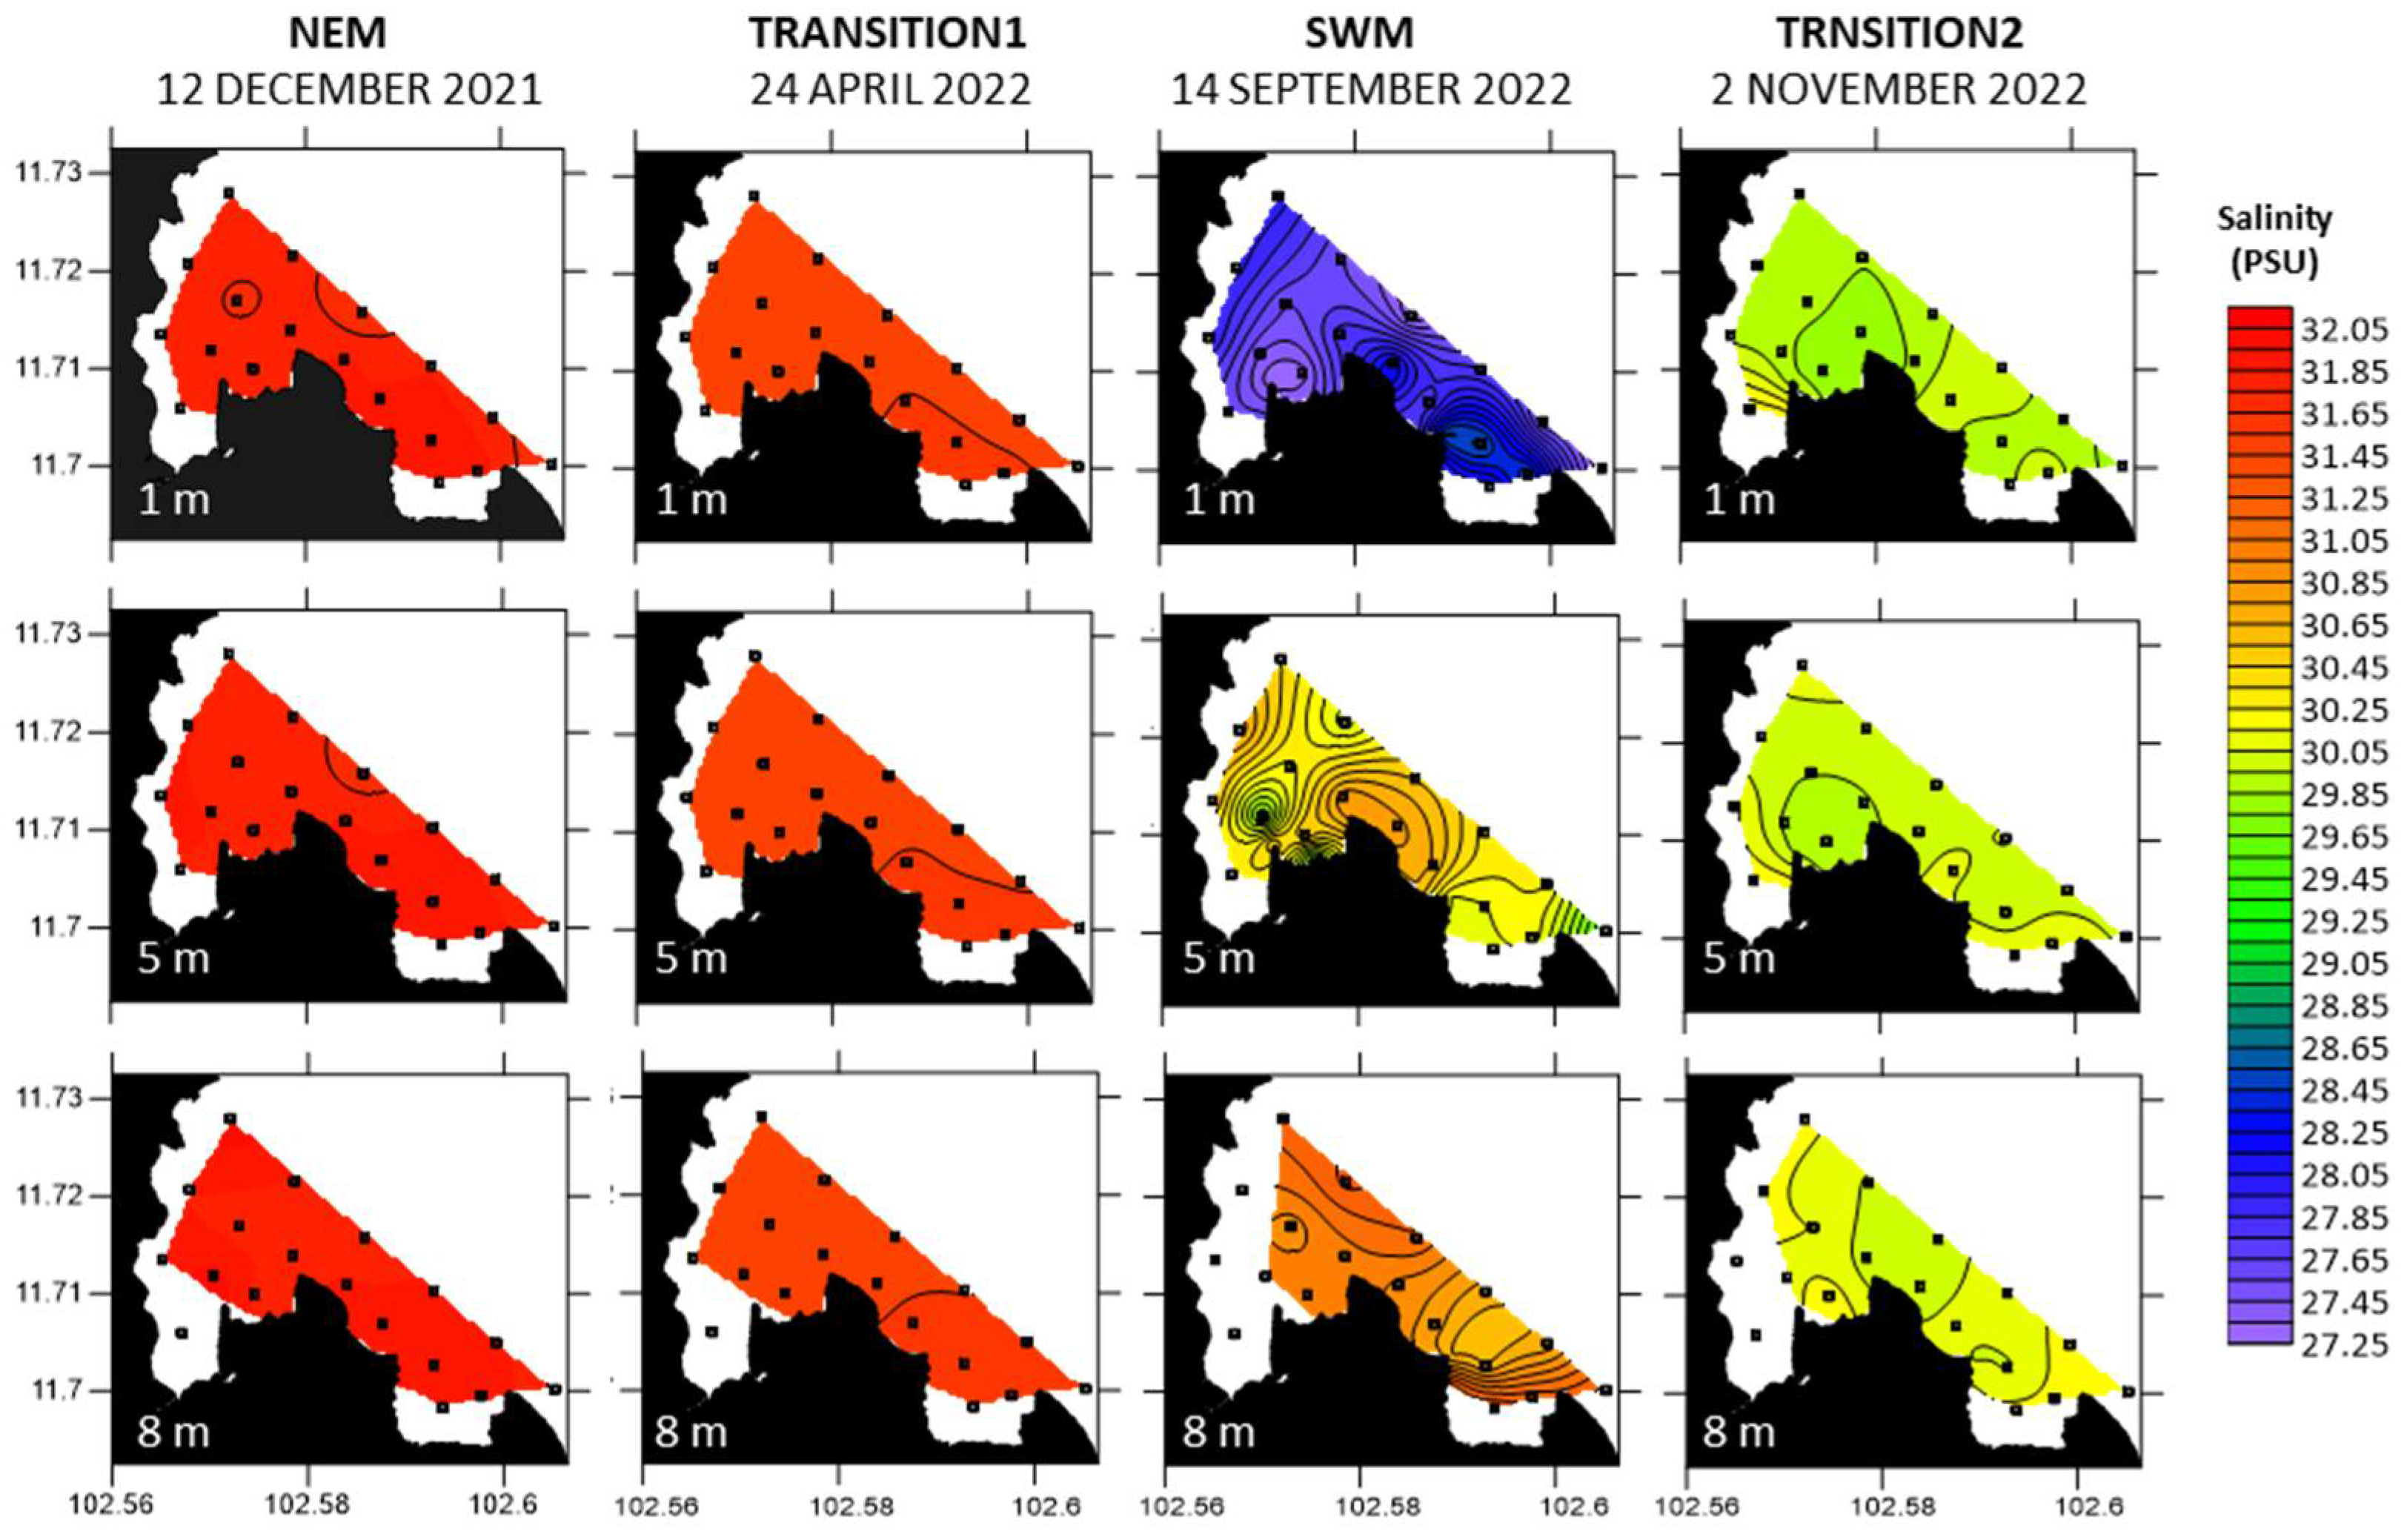
Figure 5.
The salinity distribution at various times and depths around Koh Kood Island was derived from synoptic survey data interpolation. The locations of the measurements are denoted by black dots.
Figure 5.
The salinity distribution at various times and depths around Koh Kood Island was derived from synoptic survey data interpolation. The locations of the measurements are denoted by black dots.
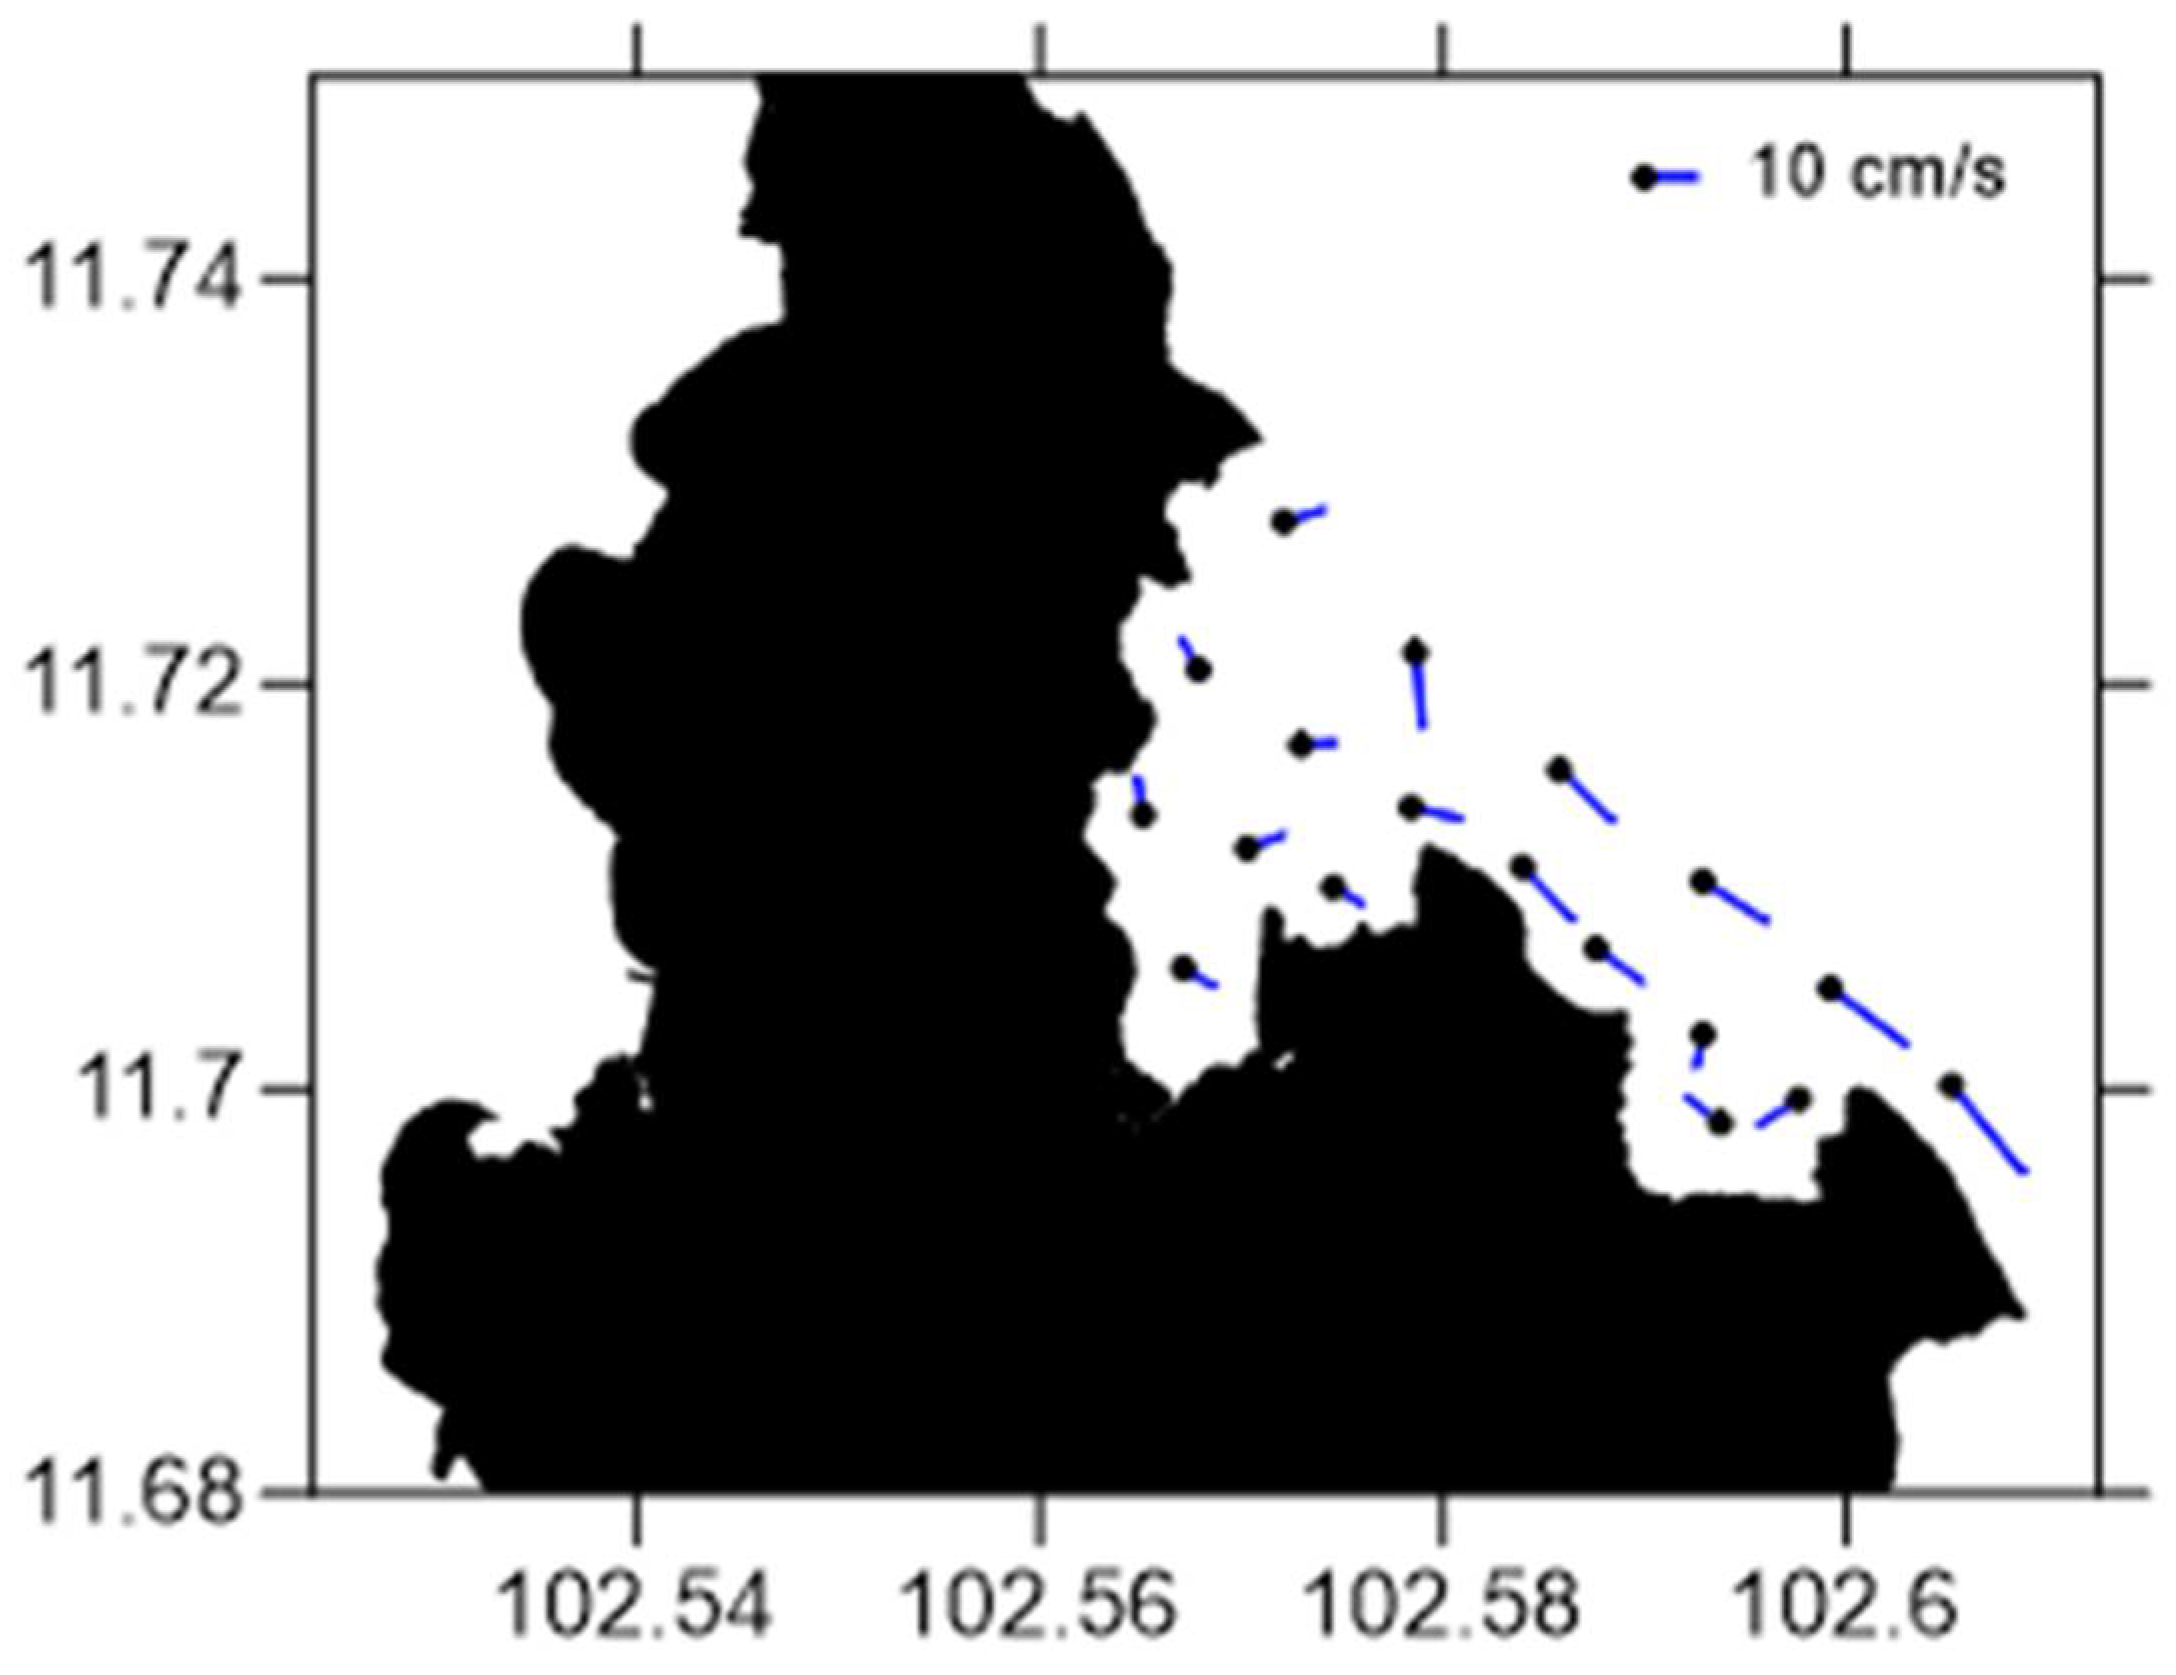
Figure 6.
Near-surface flow velocity field from ADCP measurement facing down with bottom tracking functionality at Koh Kood island during ebb tide on 14 September 2022.
Figure 6.
Near-surface flow velocity field from ADCP measurement facing down with bottom tracking functionality at Koh Kood island during ebb tide on 14 September 2022.
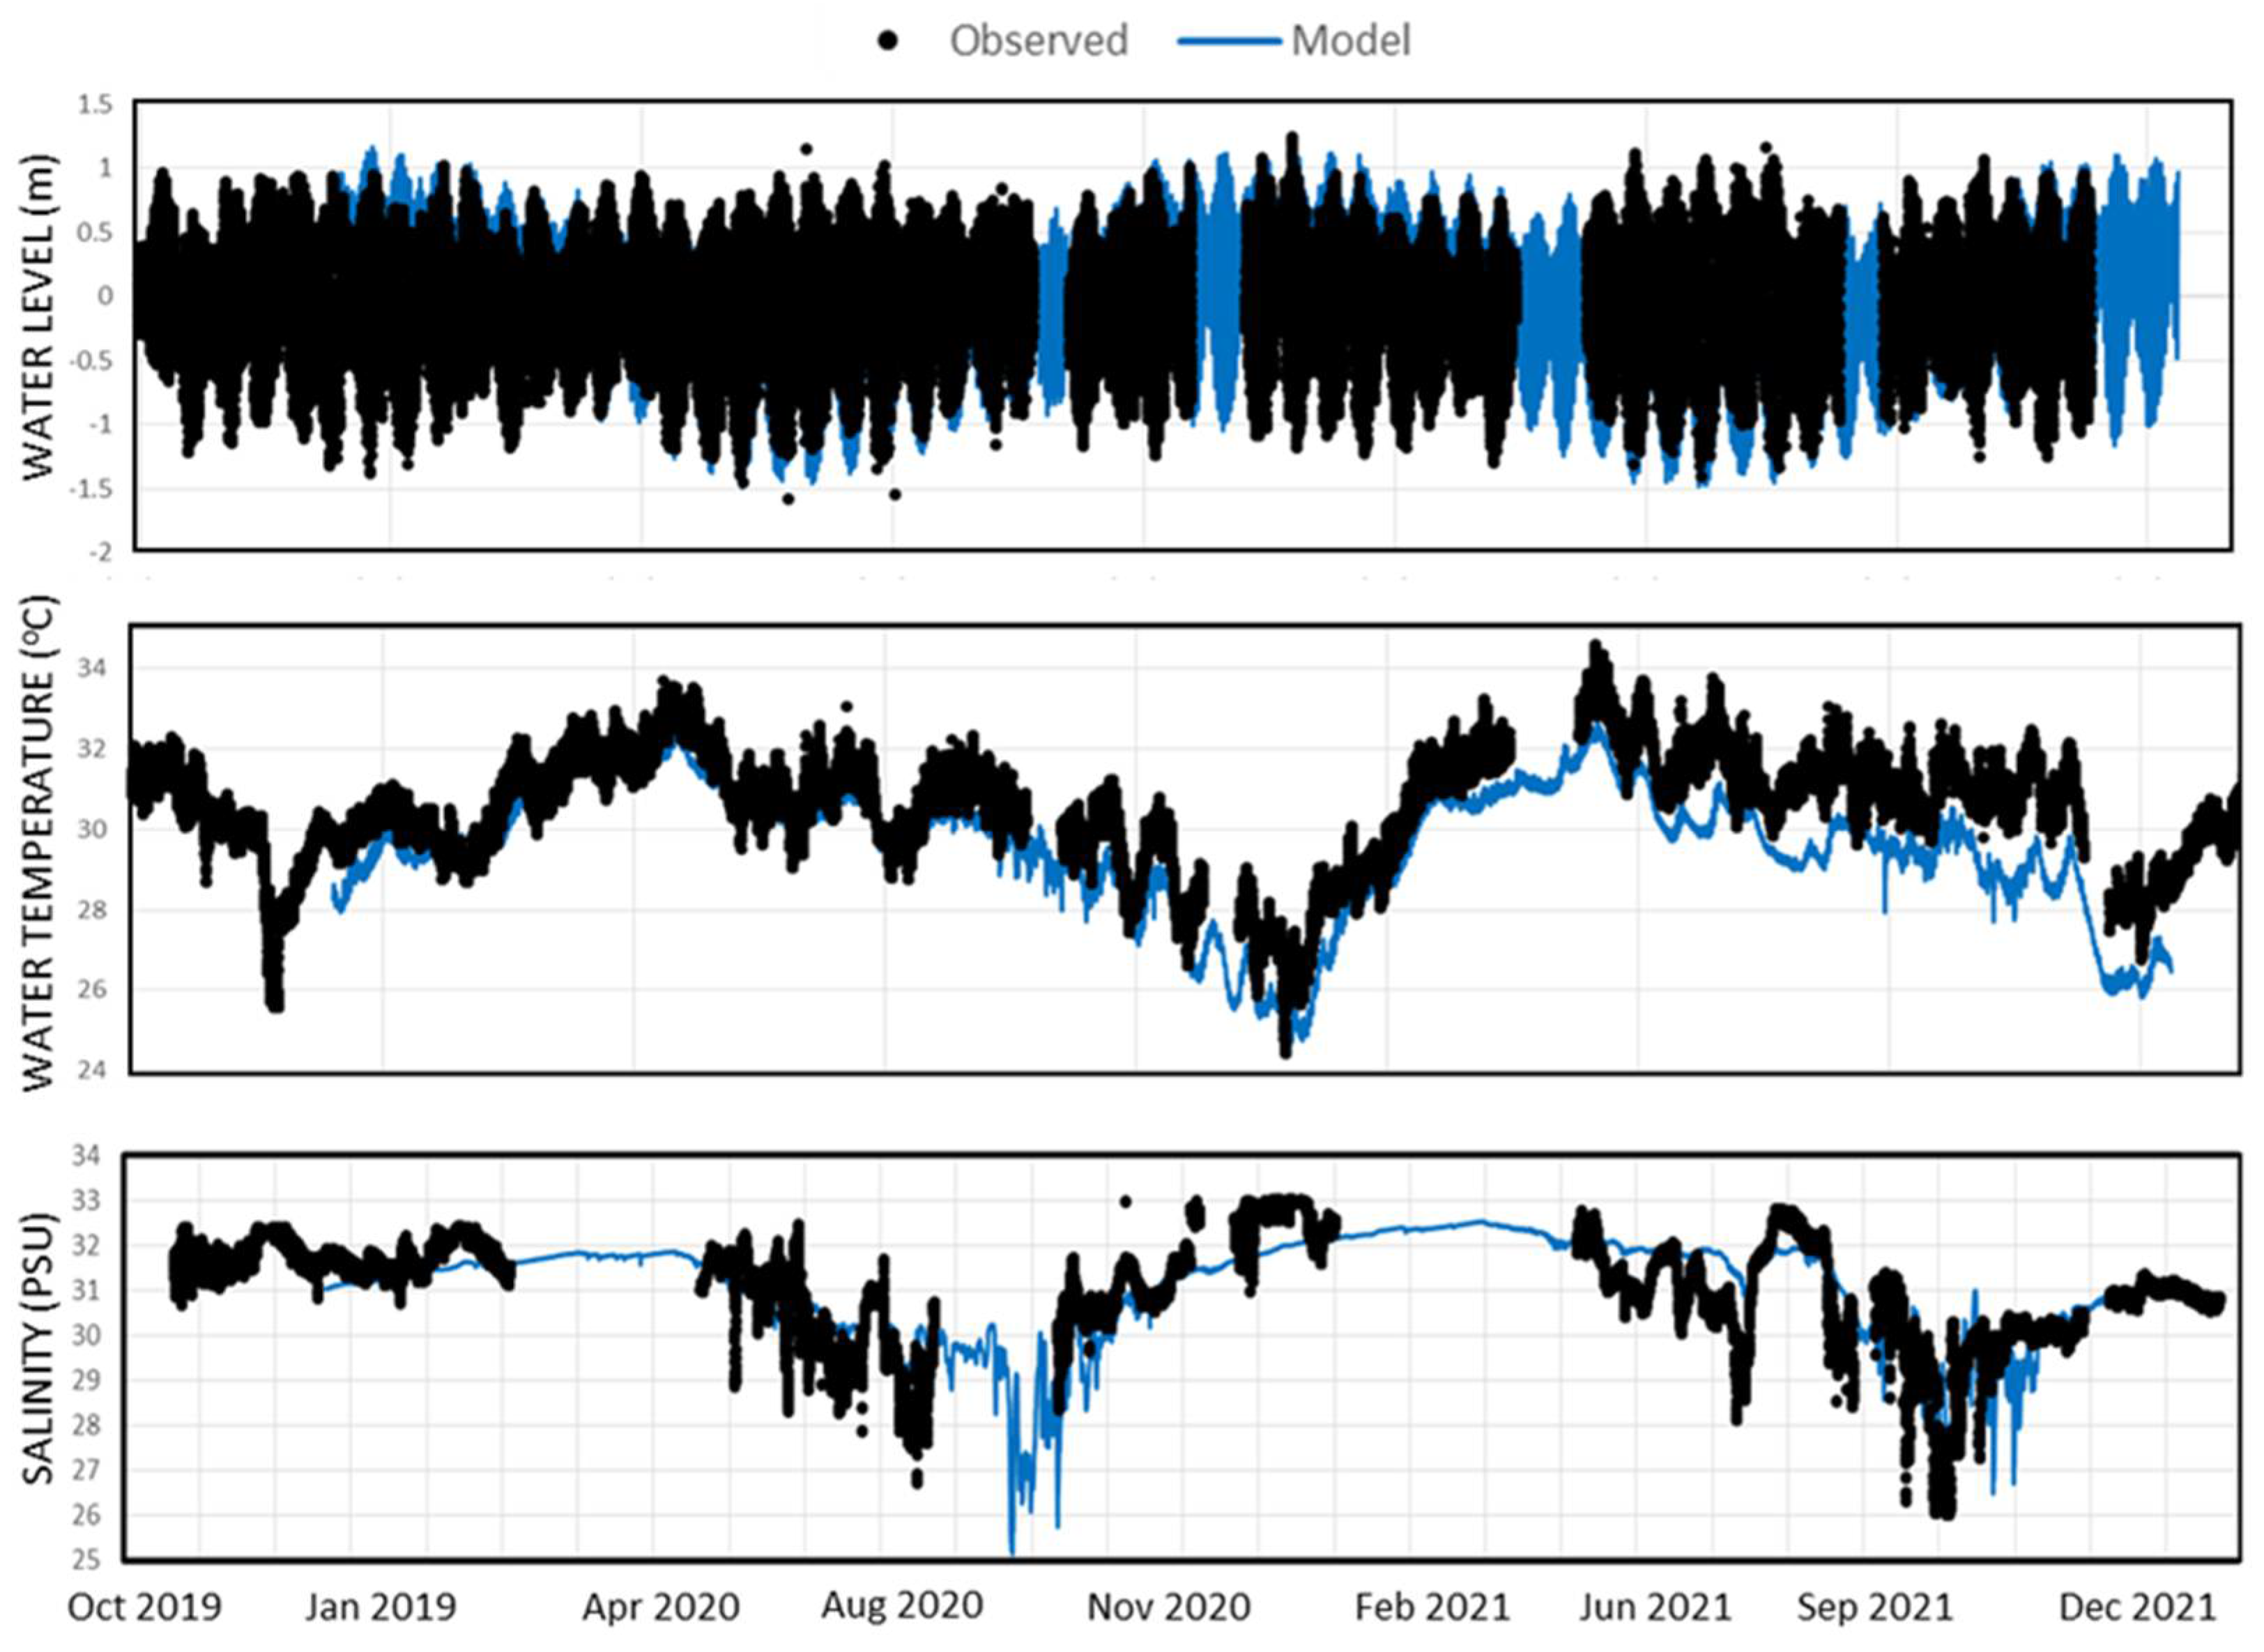
Figure 7.
Comparison between continuous measurements of water level, water temperature, and salinity at Koh Monnai Island and the modeled results. The continuous measurement data is represented by blank dots, while the model results are indicated by a blue line.
Figure 7.
Comparison between continuous measurements of water level, water temperature, and salinity at Koh Monnai Island and the modeled results. The continuous measurement data is represented by blank dots, while the model results are indicated by a blue line.
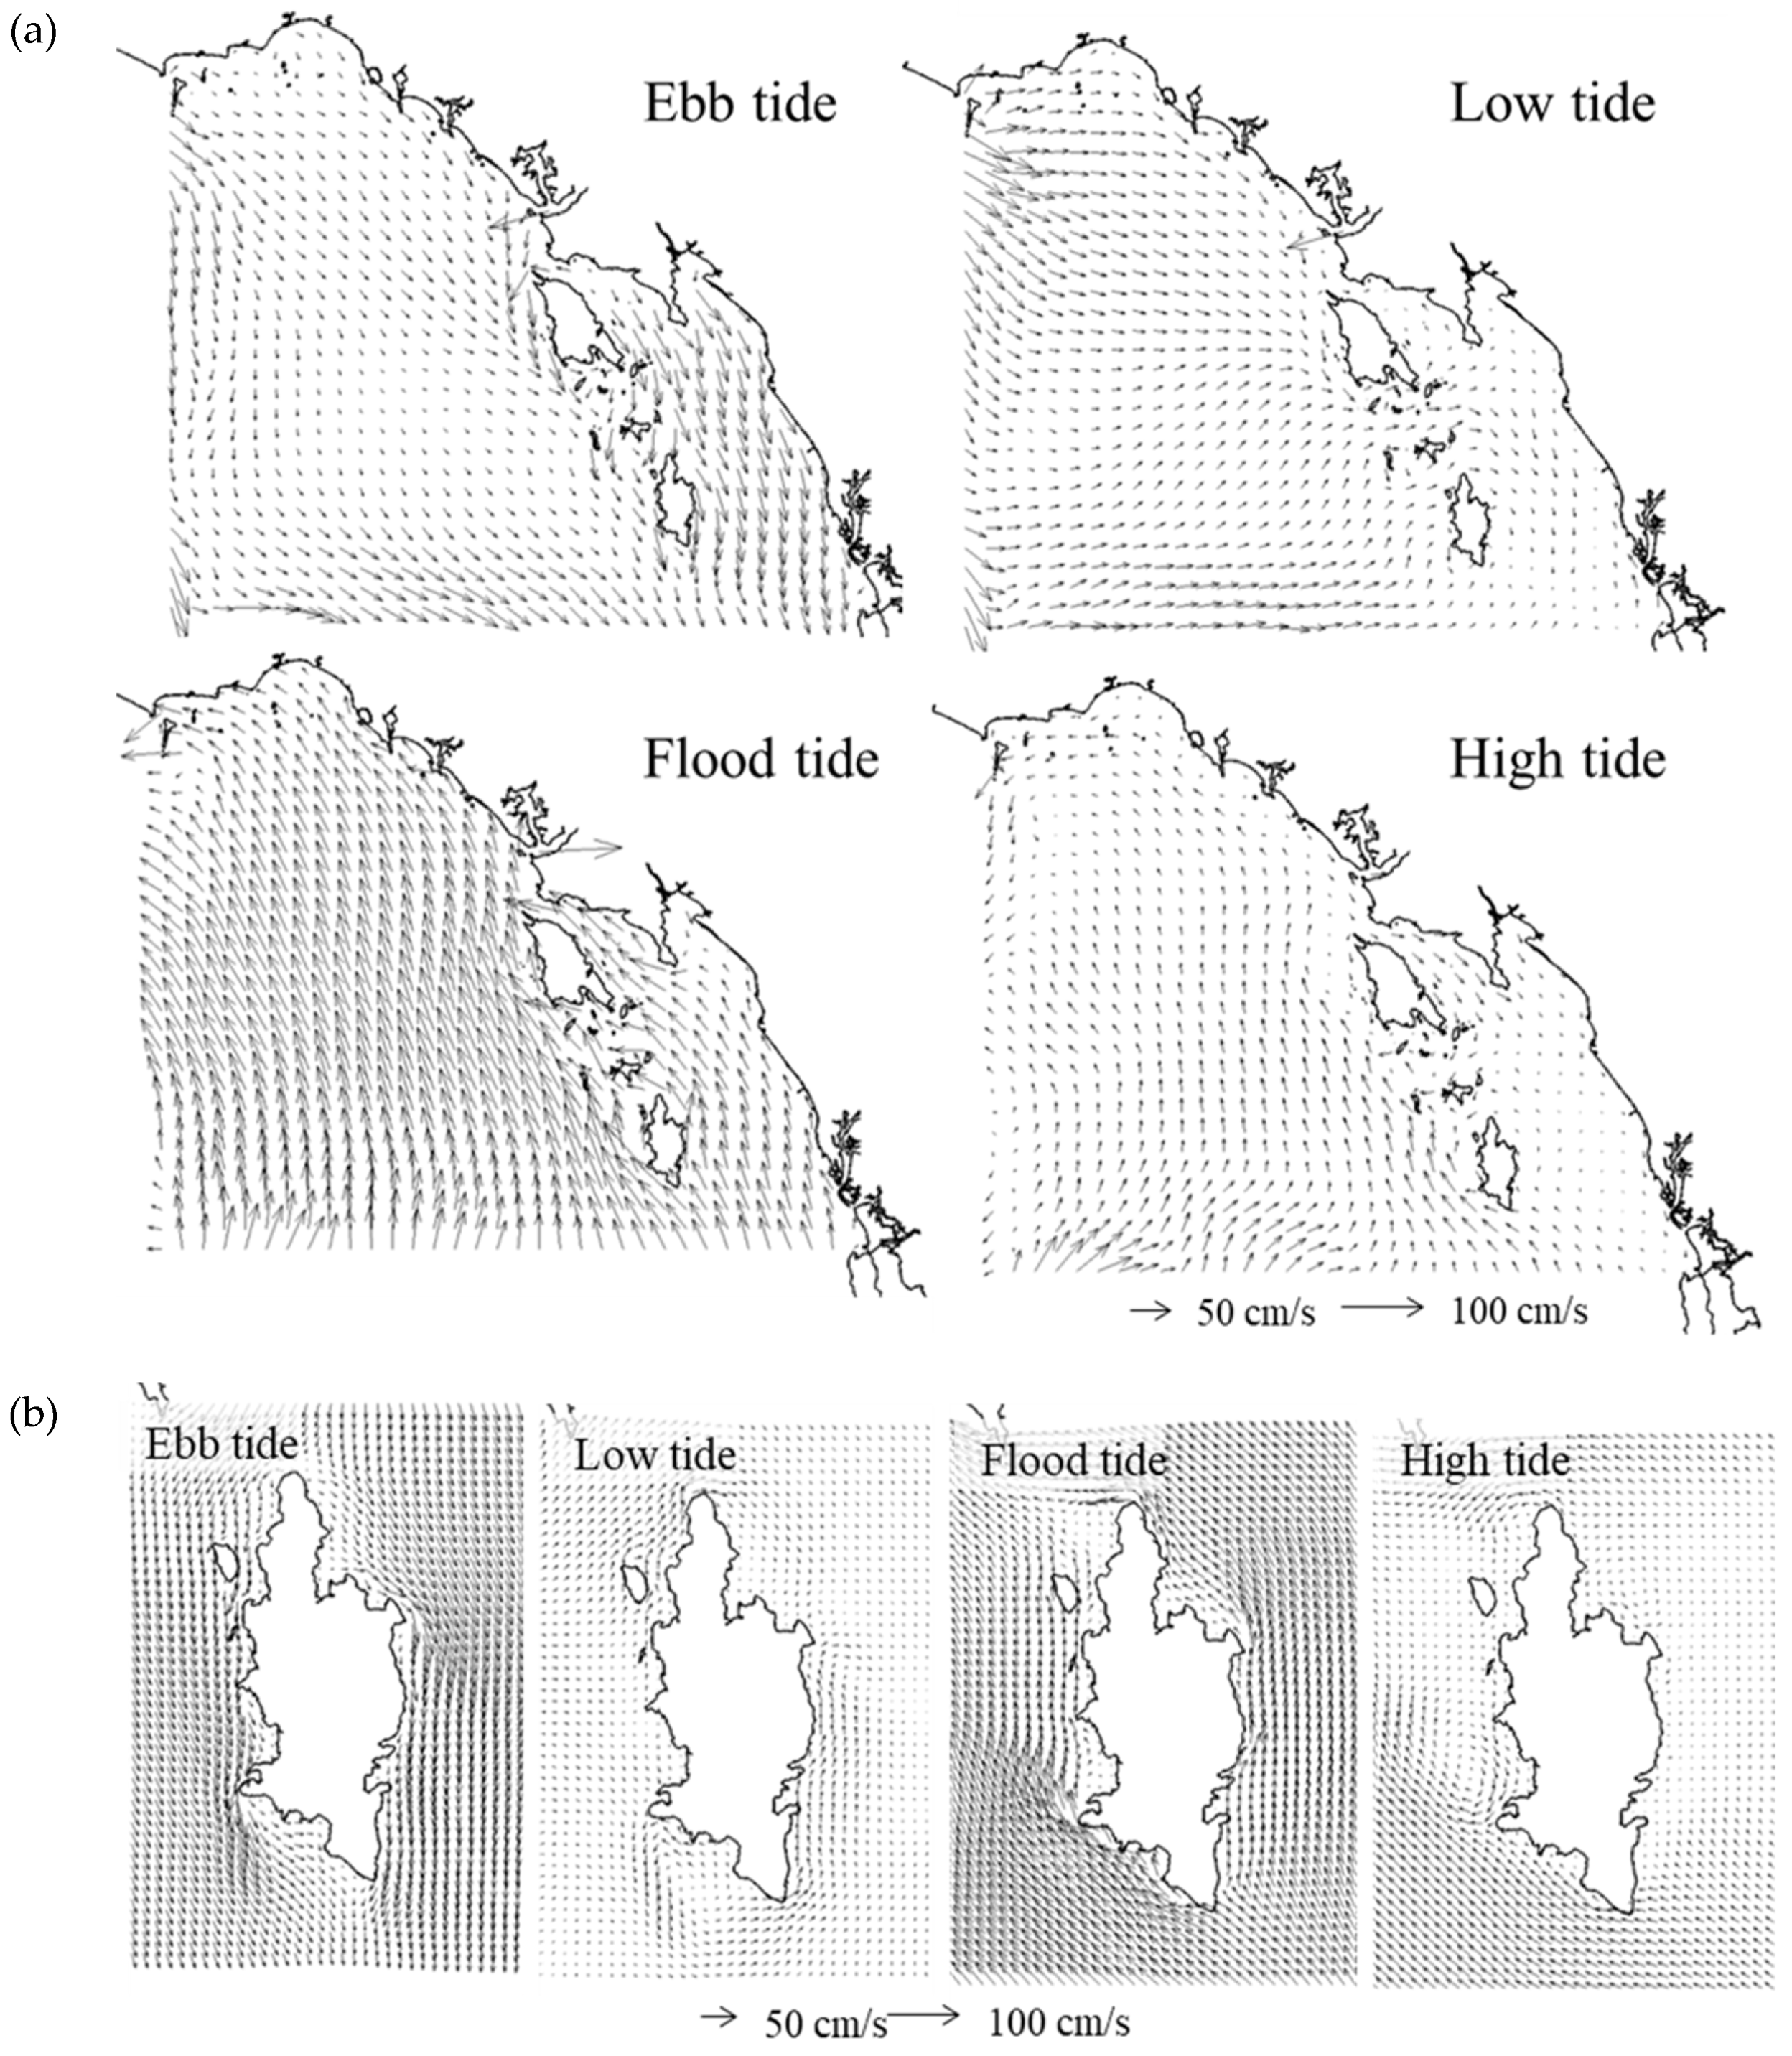
Figure 8.
Tidal current patterns (a) at the eGOT and (b) around Koh Kood Island during spring tide.
Figure 8.
Tidal current patterns (a) at the eGOT and (b) around Koh Kood Island during spring tide.
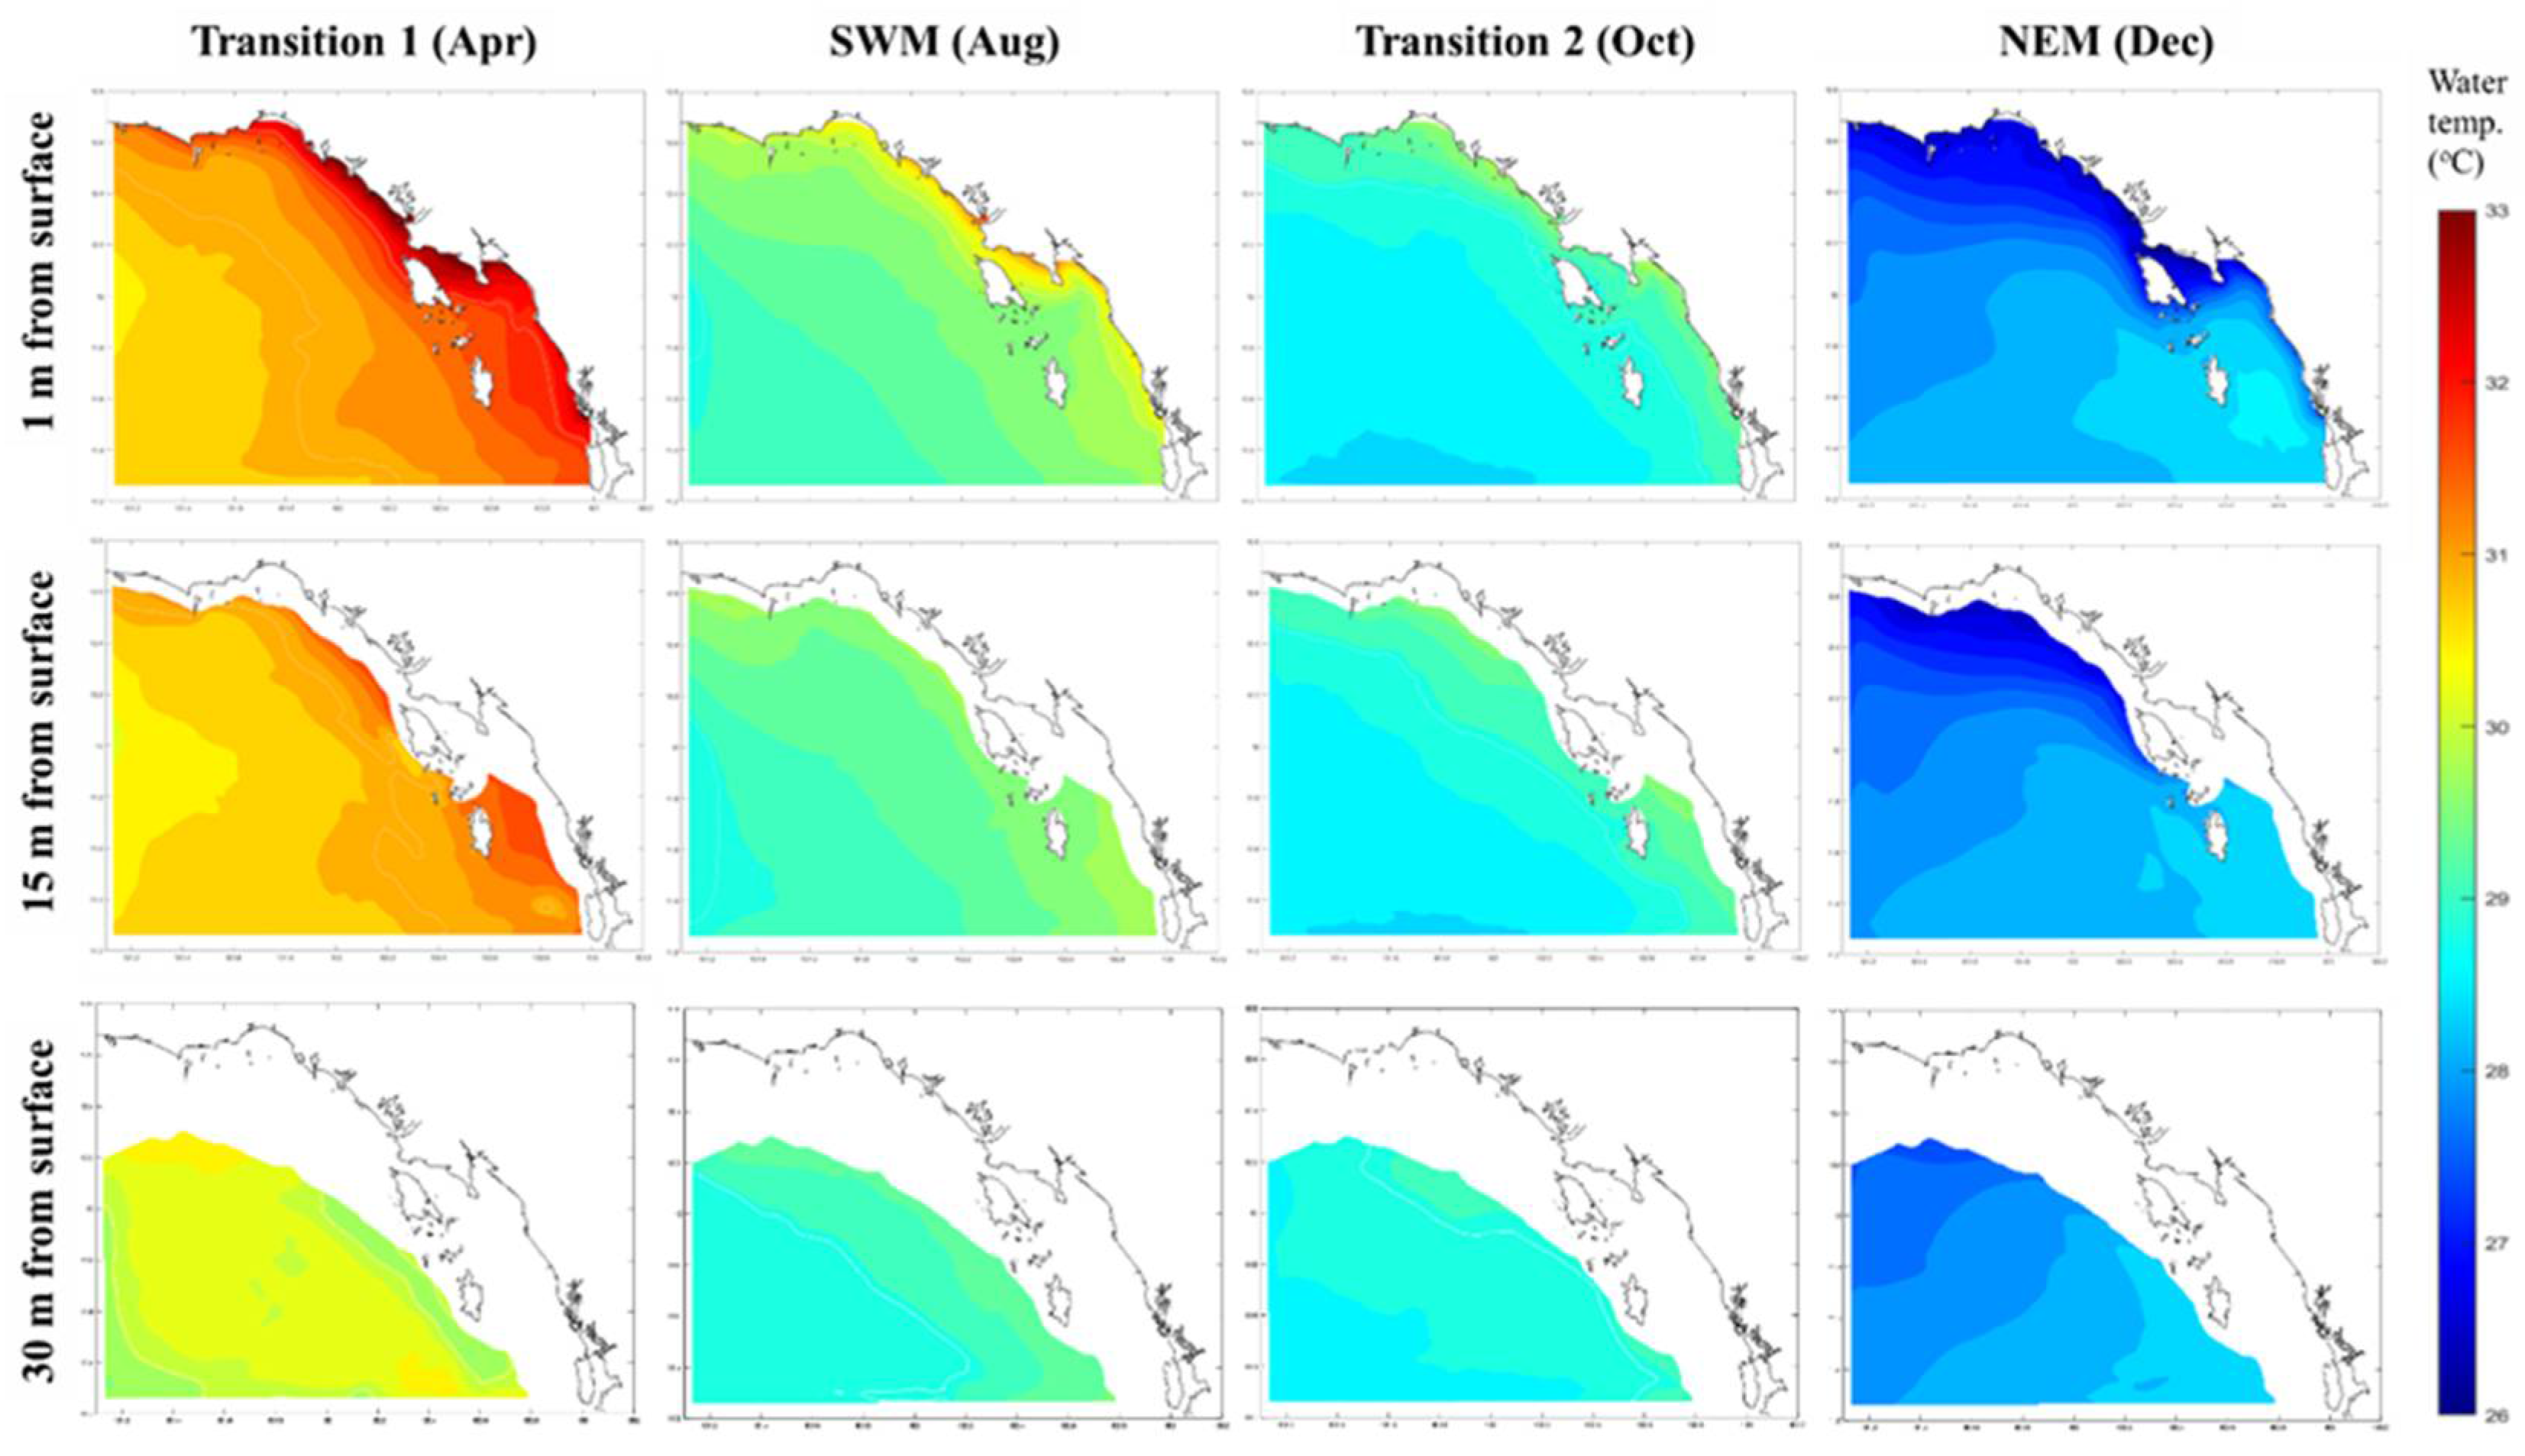
Figure 9.
Modeled monthly averaged water temperature at 1 m, 10 m and 20 meter from the sea-surface at different monsoonal periods.
Figure 9.
Modeled monthly averaged water temperature at 1 m, 10 m and 20 meter from the sea-surface at different monsoonal periods.
Figure 10.
Modeled monthly averaged salinity at 1 m, 10 m and 20 meter from the sea-surface at different monsoonal periods.
Figure 10.
Modeled monthly averaged salinity at 1 m, 10 m and 20 meter from the sea-surface at different monsoonal periods.
Figure 11.
Modeled monthly averaged flow velocity field at 1 meter, 15 meter and 30 meter from the sea-surface at different monsoonal periods. Light blue translucent arrows present near-surface during the Transition 2 is the Chanthaburi Coastal Current.
Figure 11.
Modeled monthly averaged flow velocity field at 1 meter, 15 meter and 30 meter from the sea-surface at different monsoonal periods. Light blue translucent arrows present near-surface during the Transition 2 is the Chanthaburi Coastal Current.
Figure 12.
Distribution of the water temperature and salinity and mean flow velocities at the A-A section at different monsoonal periods from the model run with the direct rainfall into the sea.
Figure 12.
Distribution of the water temperature and salinity and mean flow velocities at the A-A section at different monsoonal periods from the model run with the direct rainfall into the sea.
Figure 13.
Distribution of the water temperature and salinity and mean flow velocities at the A-A section at different monsoonal periods from the model run without the direct rainfall into the sea.
Figure 13.
Distribution of the water temperature and salinity and mean flow velocities at the A-A section at different monsoonal periods from the model run without the direct rainfall into the sea.
