Submitted:
16 May 2024
Posted:
17 May 2024
You are already at the latest version
Abstract
Keywords:
1. Introduction
2. Creep Phenomena
2.1. Creep Deformation
2.2. Creep Life
2.3. Creep Ductility and Fracture Mode
3. Creep Mechanisms
4. Creep Modeling
4.1. Deformation-Mechanism-Based True-Stress Model
4.2. Effects of Composition and Microstructure
4.3. Environmental Effects
5. Concluding Remarks
Author Contributions
Funding
Acknowledgments
Conflicts of Interest
References
- Andrade, E.N.D. , On the viscous flow in metals and allied phenomena. Proc. Roy. Soc. A 1910, 84, 1–12. [Google Scholar]
- Andrade, E.N.D. , The flow in metals under large stresses. Proc. Roy. Soc. A 1914, 90, 329–342. [Google Scholar]
- French, D. N. , Creep and Creep Failures, National Board Bulletin 1991, The National Board of Boiler and Pressure Vessel Inspectors, 1055 Crupper Avenue Columbus, OH.
- Koizumi, Y.; Kobayashi, T.; Yokokawa, T.; Zhang, J.X.; Osawa, M.; Harada, H.; Aoki, Y.; Arai, M. , Development of next-generation Ni-base single crystal superalloys, In Superalloys 2004; K.A. Green, T.M. Pollock, H. Harada, Eds, TMS (The Minerals, Metals & Materials Society), 2004. [CrossRef]
- Wu, X.J. Deformation and Evolution of Life in Crystalline Materials, Eds.; CRC Press, Taylor & Francis Group: Boca Raton, 2019.
- Norton, F.H. , The Creep of Steel at High Temperatures. McGraw-Hill, London, UK, 1929.
- Bailey, R.W. , The utilization if creep test data in engineering design. Proc. I. Mech. E. 1935, 131, 209–284. [Google Scholar] [CrossRef]
- Graham, A. and Walles, K., Relationships between long and short time creep and tensile properties of a commercial alloy. J. Iron Steel Inst. 1955, 179, 104–121. [Google Scholar]
- Evans, R.W. and Wilshire, B., Creep of Metals and Alloys. The Institute of Metals, London, UK, 1985.
- Larson, F.R. , and Miller, J., Time-temperature relationships for rupture and creep stresses. Trans. ASME 1952, 74, 765–771. [Google Scholar]
- Orr, R.L.; Sherby, O.D. and Dorn, J. E., Correlations of rupture data for metals at elevated temperature, Transactions ASM 1954, 46, 113–128. [Google Scholar]
- Monkman, F.C. and Grant, N.J., An empirical relationship between rupture life and minimum creep rate in creep-rupture tests. Proc. ASTM 1956, 56, 593–620. [Google Scholar]
- Wilshire, B.; Scharning, P.J. A new methodology for analysis of creep and creep fracture data for 9%–12% chromium steels. Int. Mater. Rev 2008, 53, 91–104. [Google Scholar] [CrossRef]
- Wilshire, B.; Scharning, P.J. Prediction of long-term creep data for forged 1Cr-1Mo-0.25V steel. Mater. Sci. Technol 2008, 24, 1–9. [Google Scholar] [CrossRef]
- Wilshire, B. and Scharning, P. J., Theoretical and practical approaches to creep of Waspaloy. Mat. Sci. Tech. 2009, 25, 243–248. [Google Scholar] [CrossRef]
- Abdallah, Z.; Gray, V.; Whittaker, M.; Perkins, K. A critical analysis of the conventionally employed creep lifing methods. Materials, 2014; 7, 3371–3398. [Google Scholar] [CrossRef]
- Allen, D. and Garwood, S., Energy materials-strategic research agenda. Q2. Materials Energy 414 Review, 2007, IoM3, London, UK.
- ISO 204. Metallic Materials—Uniaxial Creep Testing in Tension—Method of Test; International Organization for Standardization: Geneva, Switzerland, 2018. [Google Scholar]
- Spindler, M.W. , The multiaxial and uniaxial creep rupture ductility of Type 304 steel as a function of stress and strain rate. Mater. High Temp. 2004, 21, 47–52. [Google Scholar] [CrossRef]
- Holdsworth, S. Creep-ductility of high temperature steels: A review, Metals 2019, 9, 342. [CrossRef]
- Kocks, U.F.; Argon, A.S.; Ashby, M.F. Thermodynamics and kinetics of slip. Prog. Mater., Sci. 1975, 19, 1–271. [Google Scholar]
- Mukherjee, A.K.; Bird, J.E. and Dorn, J.E., Experimental correlations for high-temperature creep. Trans. ASM 1969, 62, 155. [Google Scholar]
- Frost, H. and Ashby, M., Deformation Mechanism Maps, Pergamon Press, Elmsford, NY, 1982.
- Weertman, J. , Theory of steady-state creep based on dislocation climb. J. Appl. Phys. 1955, 26, 1213–1217. [Google Scholar] [CrossRef]
- Langdon, T.G. , Grain boundary sliding as a deformation mechanism during creep, Phil. Mag. 1970, 22, 689–700. [Google Scholar]
- Dyson, B.F. and McLean, M., Particle-coarsening, σ0 and tertiary creep. Acta Metall. 1983, 31, 17–27. [Google Scholar] [CrossRef]
- Furrillo, F.T.; Davidson, J.M.; Tien, J.K. and Jackman, L. A., The effects of grain boundary carbides on the creep and back stress of a nickel-base superalloy. Mater. Sci. Eng. 1979, 39, 267–273. [Google Scholar]
- Wu, X.J.; Koul, A.K. Grain boundary sliding in the presence of grain boundary precipitates during transient creep. Metall. Mater. Trans. A 1995, 26A, 905–914. [Google Scholar] [CrossRef]
- Wadsworth, J.; Ruano, O.A. and Sherby, O.D., Denuded zones, diffusional creep, and grain boundary sliding. Metall. Mater. Trans. A 2002, 33A, 219–229. [Google Scholar] [CrossRef]
- Wilshire, B. , Observations, theories, and predictions of high-temperature creep behavior. Metall. Mater. Trans. A 2002, 33A, 241–248. [Google Scholar] [CrossRef]
- Ardell, A.J. and Huang, J.C., Antiphase boundary energies an transition from shearing to looping in alloys strengthened by ordered precipitates. Phil. Mag. Letters 1988, 58, 189–197. [Google Scholar] [CrossRef]
- Perry, A.J. Cavitation in creep. J. Mater. Sci. 1974, 9, 1016–1039. [Google Scholar] [CrossRef]
- Hull, D.; Rimmer, D.E. The growth of grain-boundary voids under stress. Phil. Mag. A 1959, 4, 673–687. [Google Scholar] [CrossRef]
- Dyson, B.F. , Constrained cavity growth, its use in quantifying recent creep fracture results. Can. Metall. Q. 1979, 18, 31–38. [Google Scholar] [CrossRef]
- Needleman, A. and Rice, J. R., Plastic creep flow effects in the diffusive cavitation of grain boundaries. Acta Met. 1980, 28, 1315–1332. [Google Scholar] [CrossRef]
- Weaver, C.W. Intergranular cavitation, structure, and creep of Nimonic 89A-type alloy. J Inst. Met, 1959; 88, 296–230. [Google Scholar]
- Raj, R. and Ashby, M.F., On grain boundary sliding and diffusional creep. Metall. Trans A 1971. Metall. Trans A 1971, 1971. 2A, 1113–1125. [Google Scholar] [CrossRef]
- Raj, R. and Ashby, M. F., Intergranular fracture at elevated temperature. Acta Metall. 1975, 23, 653–666. [Google Scholar]
- Miura, S.; Hashimoto, S. and Fujii, T. , Effect of the triple junction on grain boundary sliding in aluminum tricrystals. Journal de Physique Colloques 1988, 49, C5–C599. [Google Scholar]
- Kassner, M.E. and Hayes, T. A., Creep cavitation in metals, Int. J. Plasticity 2003, 19, 1715–1748. [Google Scholar] [CrossRef]
- Wu, X.J.; Williams, S. and Gong, D. , A true-stress creep model based on deformation mechanisms for polycrystalline materials, J. Mater. Eng. Perform. 2012, 21, 2255–2262. [Google Scholar]
- Wu, X.J. , An integrated creep-fatigue theory for material damage modeling. Key Eng. Mater. 2015, 627, 341–344. [Google Scholar] [CrossRef]
- Zhang, X.Z.; Wu, X.J.; Liu, R.; Liu, J.; Yao, M.X. , Deformation-mechanism-based modeling of creep behavior of modified 9Cr-1Mo steel, Mater. Sci. Eng. A 2017, 689, 345 352. Mater. Sci. Eng. A 2017, 689, 345–352. [Google Scholar] [CrossRef]
- Xiao, B.; Xu, L.Y.; Zhao, L.; Jing, H.Y.; Han, Y.D. , Deformation-mechanism-based creep model and damage mechanism of G115 steel over a wide stress range, Mater. Sci. Eng. A 2019, 743, 280–293. [Google Scholar] [CrossRef]
- Lu, C.Y.; Wu, X.J.; He, Y. M.; Gao, Z.L.; Liu, R.; Chen, Z.; Zheng, W.J.; Yang, J.G., Deformation mechanism-based true-stress creep model for SA508Gr3 steel over the temperature range of 450-750C, J. Nucl. Mater. 2019, 526, 151776.
- Wu, X.J. , Comment on theoretical and experimental study of creep damage on alloy 800 at high temperature (MSA 140953), Mater. Sci. Eng. A 2021, 820, 141543. [Google Scholar] [CrossRef]
- Ding, Y.P.; Wu, X.J.; Liu, R.; Zhang, X.Z.; Khelfaoui, F. , Creep performance characterization for Haynes 282TM using the deformation-mechanism-based true stress model, Thermal Sci. and Eng. Prog. 2022, 37, 101603. [Google Scholar] [CrossRef]
- Pint, B.A.; Wang, H.; Hawkins, C.S.; Unocic, K.A. , Technical Qualification of New Materials for High Efficiency Coal-Fired Boilers and Other Advanced FE Concepts: Haynes® 282® ASME Boiler and Pressure Vessel Code Case, Technical Report ORNL/TM-2020/1548, 2020, Oak Ridge National Laboratory, Oak Ridge, p 1-21.
- Wu, X.J.; Liu, Rong; R.; Zhang, X.Z.; Wu, X.; Khelfaoui, F., Assessment of creep properties of Haynes 282 weld using deformation-mechanism-`based true stress model, J. Mater. Eng. Perform. 2024 (under review).
- Wu, X.J.; Koul, A.K. Grain boundary sliding at serrated grain boundary precipitates. Advanced Performance Materials 1997, 4, 409–420. [Google Scholar] [CrossRef]
- Singh, C.V.; Mateos, A.J. and Warner, D. H., Atomistic simulations of dislocation-precipitate interactions emphasizing importance of cross-slip, Scripta Mater. 2011, 64, 398–401. [Google Scholar]
- Song, K.; Wang, K.; Zhao, L.; et al. , A physically-based constitutive model for a novel heat resistant martensitic steel under different cyclic loading modes: Microstructural strengthening mechanisms, Int. J. Plasticity, 2023, 103611. [CrossRef]
- Qi, Y. and Krajewski, P. E., Molecular dynamics simulations of grain boundary sliding: The effect of stress and boundary misorientation, Acta Mater., 2007, 55, 1555–1563. [Google Scholar]
- Huang, L.; Sauzay, M.; Cui, Y.; Bonnaile, P. Theoretical and Experimental Study of Creep Damage on Alloy 800 at High Temperature. Mater. Sci. & Eng. A 2021, 2021, 140953. [Google Scholar]
- Zhang, X.Z.; Wu, X.J.; Liu, R.; Liu, J.; Yao, M.X. Influence of Laves phase on creep strength of modified 9Cr-1Mo steel. Mater. Sci. & Eng. A 2017, 706, 279–286. [Google Scholar]
- Wu, X.J.; Liu, Rong; R.; Zhang, X.Z.; Wu, X.; Khelfaoui, F., Creep performance study of Inconel 740H weldment based on microstructural deformation mechanisms, J. Eng. Mater. and Tech. 2024, 2024, 146 / 041001. [CrossRef]
- American Society of Mechanical Engineers (ASME), “Case 2702 Seamless Ni 25Cr 20Co Material Section 1, Cases of the ASME Boiler and Pressure Vessel Code,” BVP Supp. 7, 2011.
- Special Metals Corporation, INCONEL® ALLOY 740H ® A Superalloy Specifically Designed for Advanced Ultra Supercritical Power Generation, Special Metals Corporation Technical Bulletin, 2023.
- Bueno, L. O. , Effect of oxidation on creep data: Part 1 - Comparison between some constant load creep results in air and vacuum on 2.25Cr-1Mo steel from 600 to 700°C. Materials at High Temperatures 2008, 25, 213–221. [Google Scholar] [CrossRef]
- Wheaton, H.L. , MAR-M 509, A New Cast Cobalt-Base Alloy for High-Temperature Service, Cobalt 29, 1965, p.163.
- Dyson, B.F.; Osgerby, S. Modelling creep-corrosion interactions in nickel-base superalloys. Mater. Sci. & Tech. 1987, 3, 545–553. [Google Scholar]
- Wu, X.J.; Zhang, X.Z.; Liu, R.; Yao, M.X. , Creep performance modeling of modified 9Cr 1Mo steels with oxidation, Metall. Mater. Trans. A 2020, 51A, 1134–1147. [Google Scholar] [CrossRef]
- Shrestha, T.; Basirat, M.; Charit, I.; Potirniche G., P. and Rink, K. K., Creep rupture behavior of Grade 91 steel. Mater. Sci. Eng. A 2013, 565, 382–391. [Google Scholar] [CrossRef]
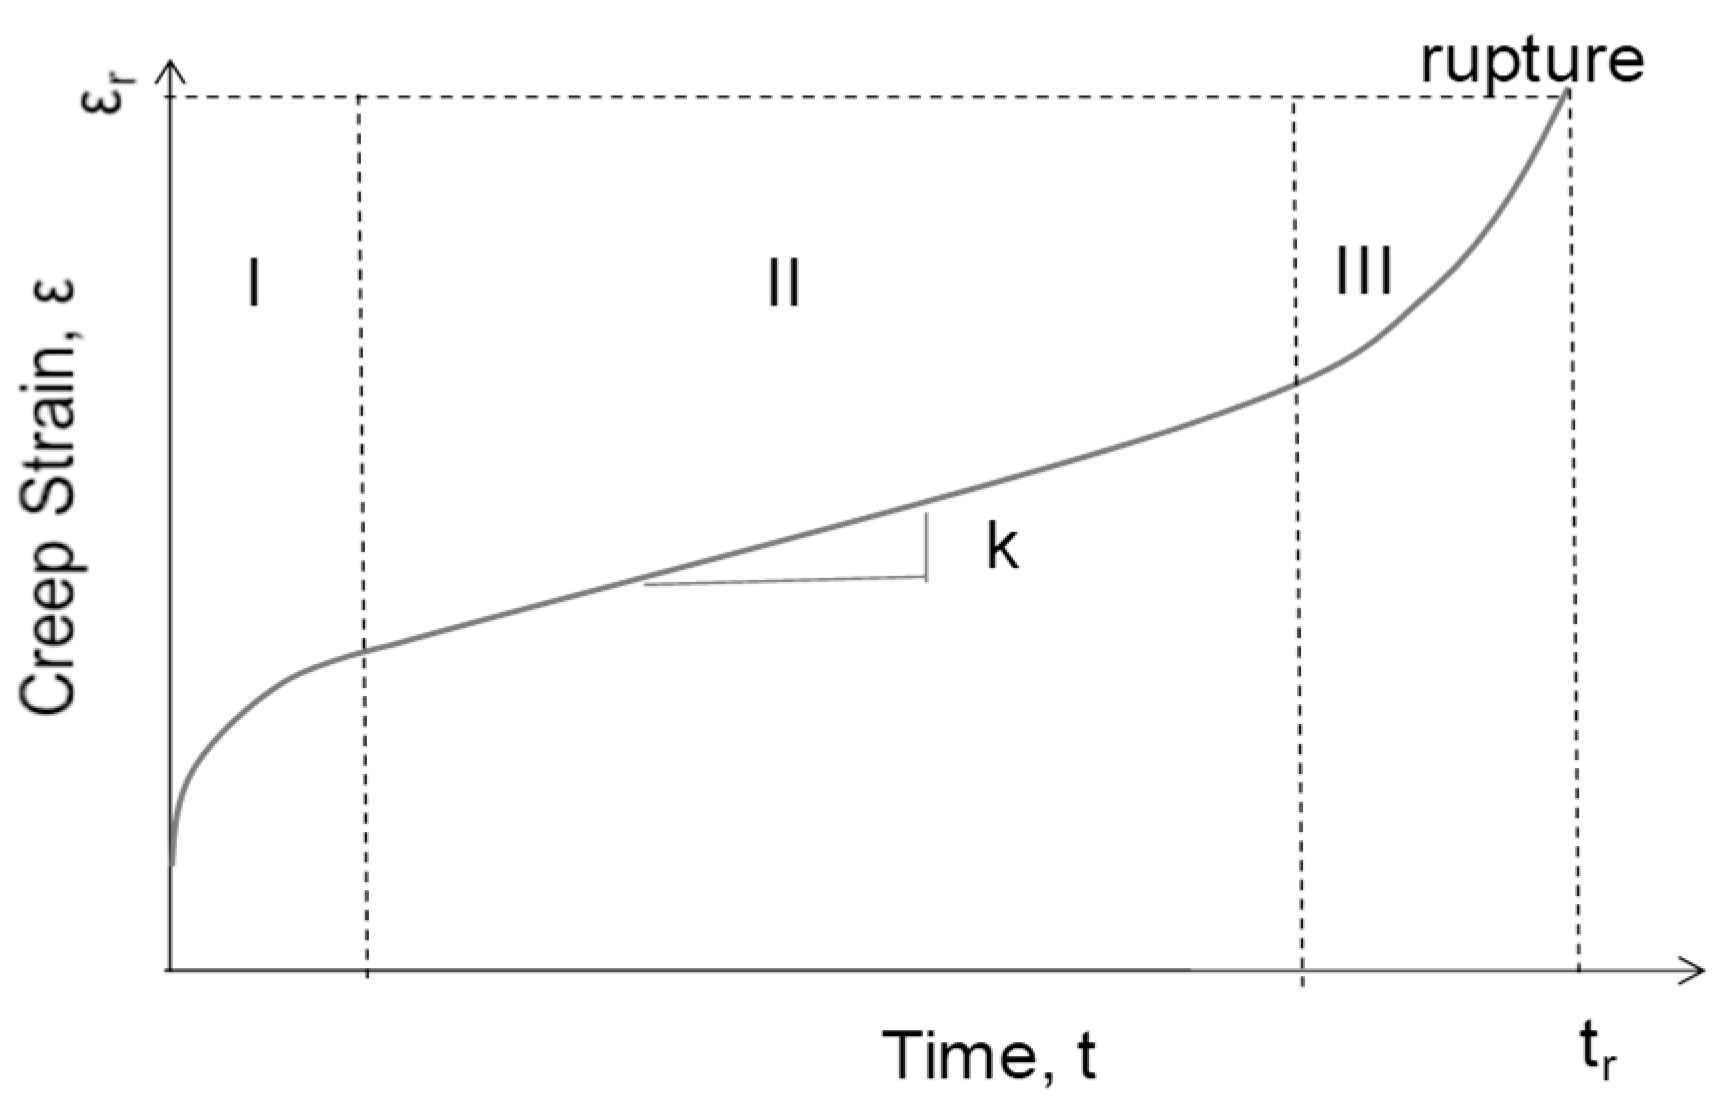
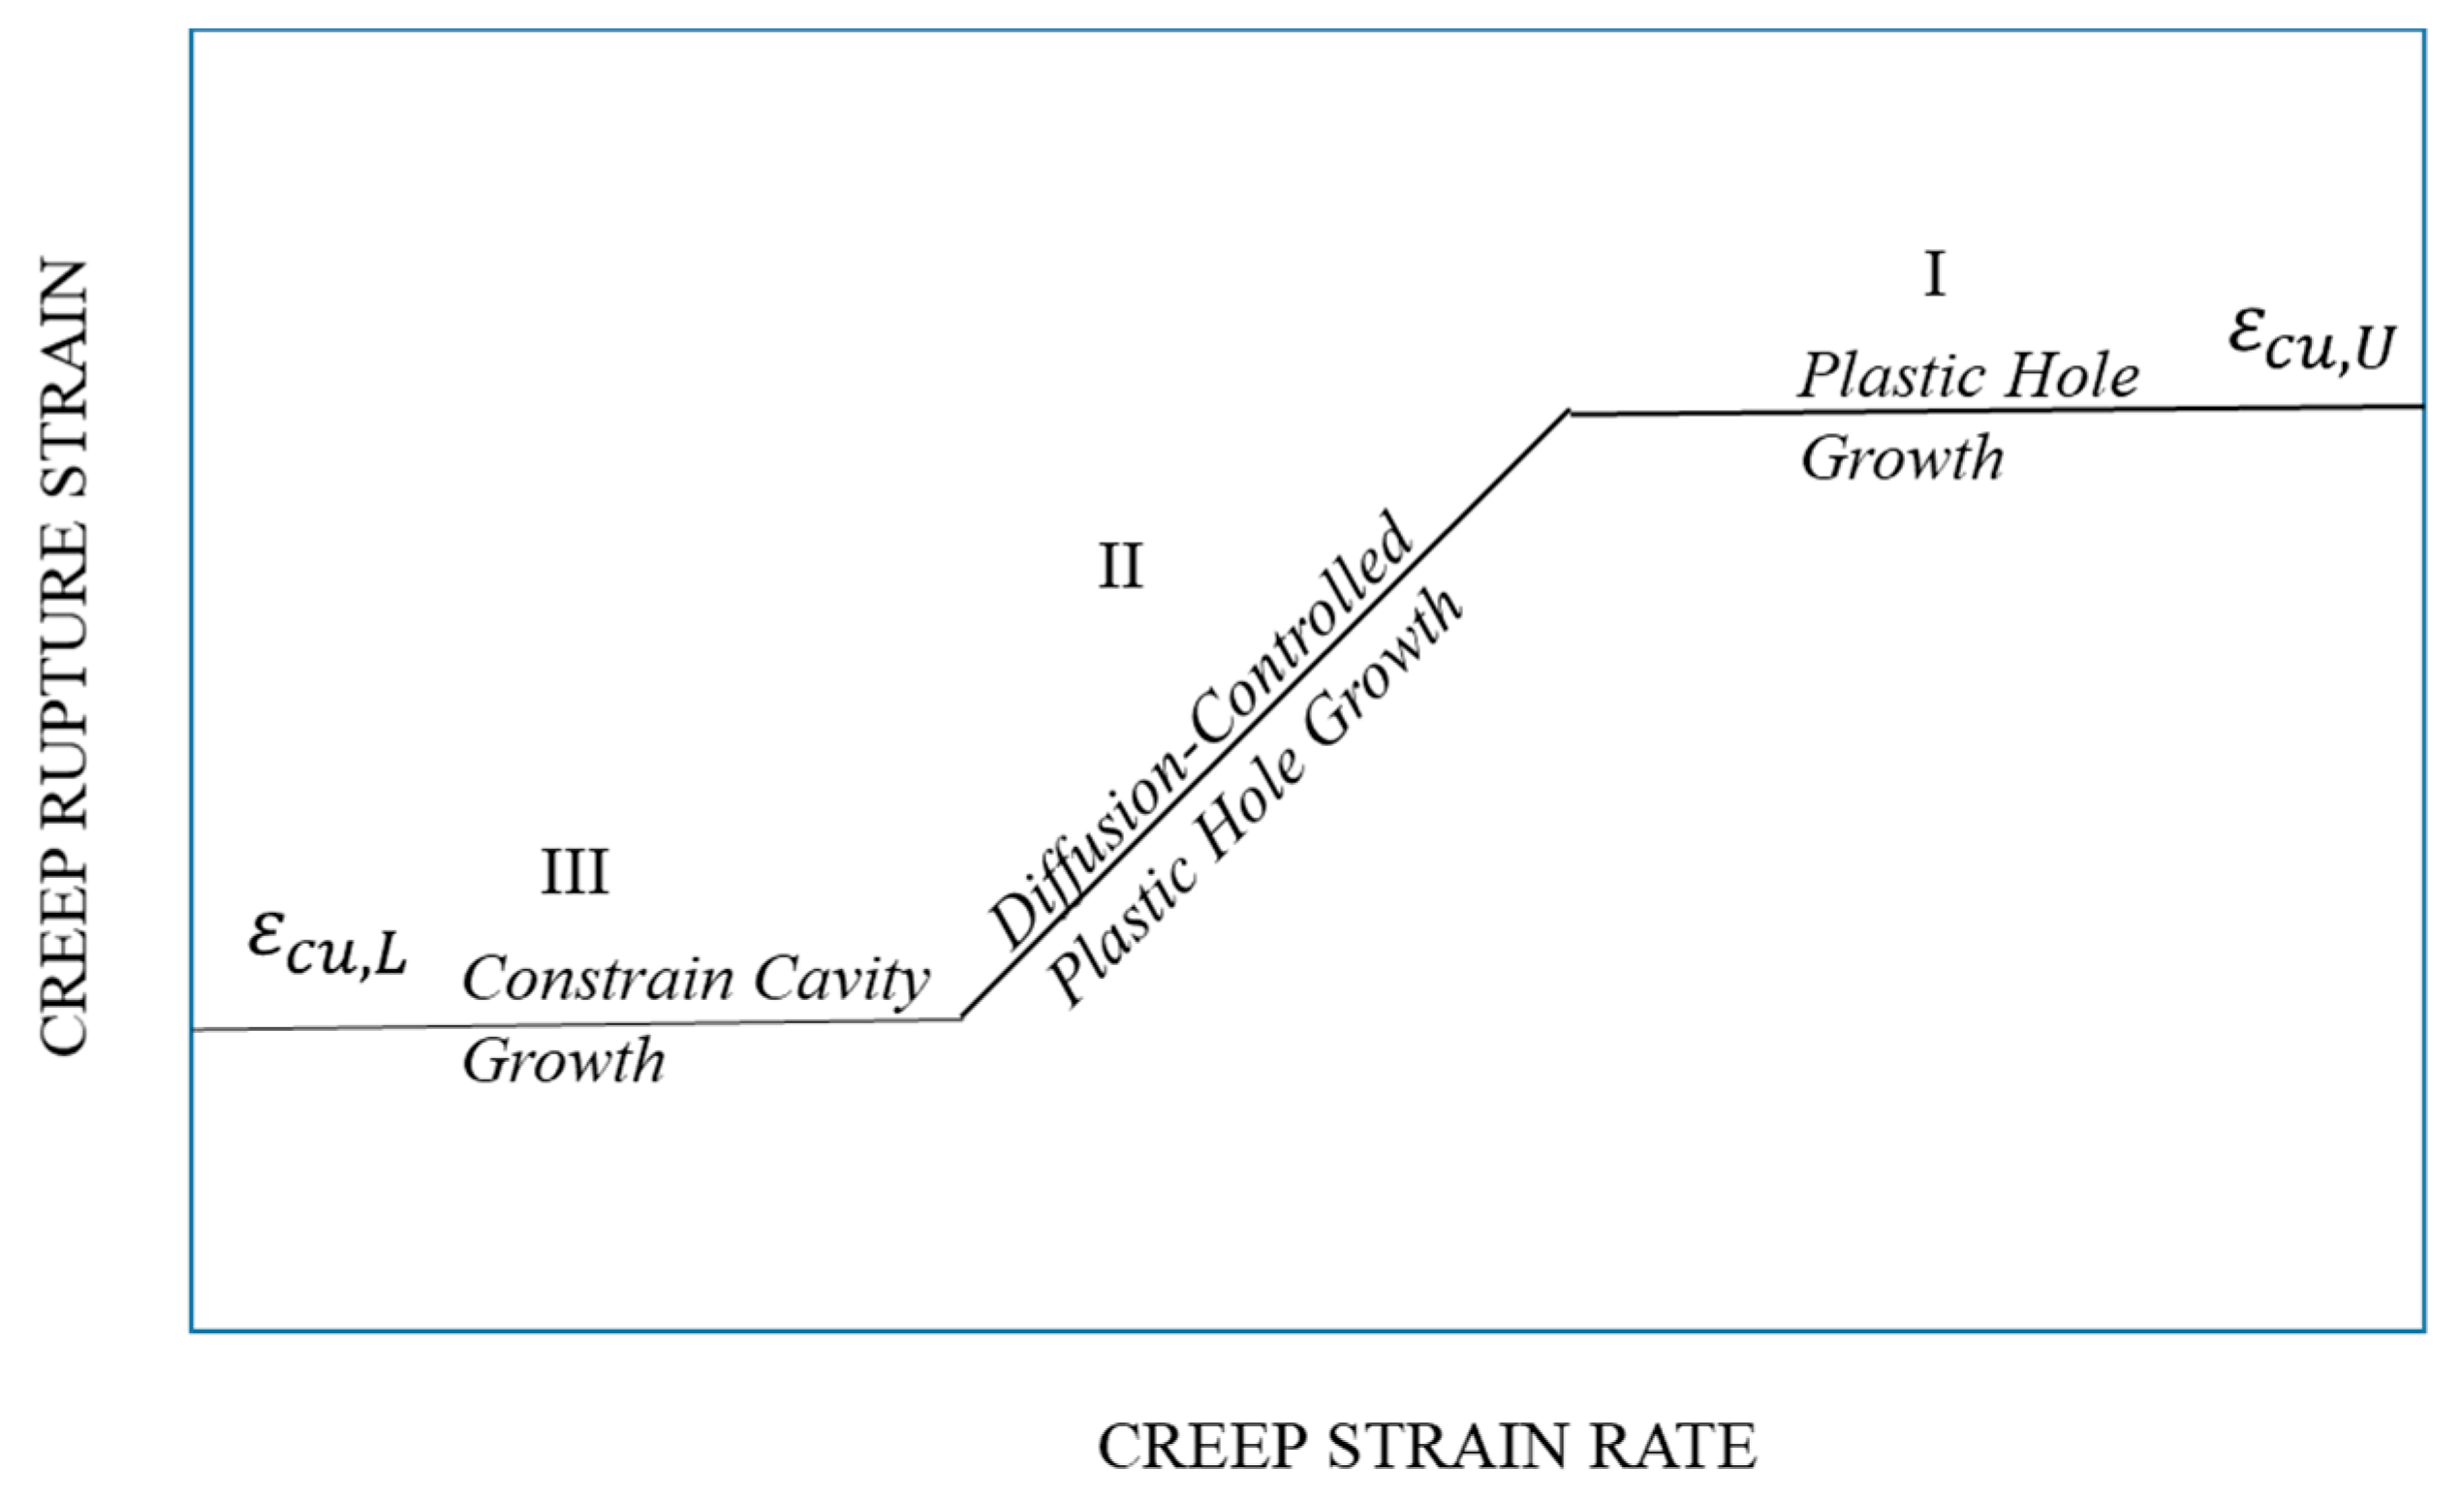
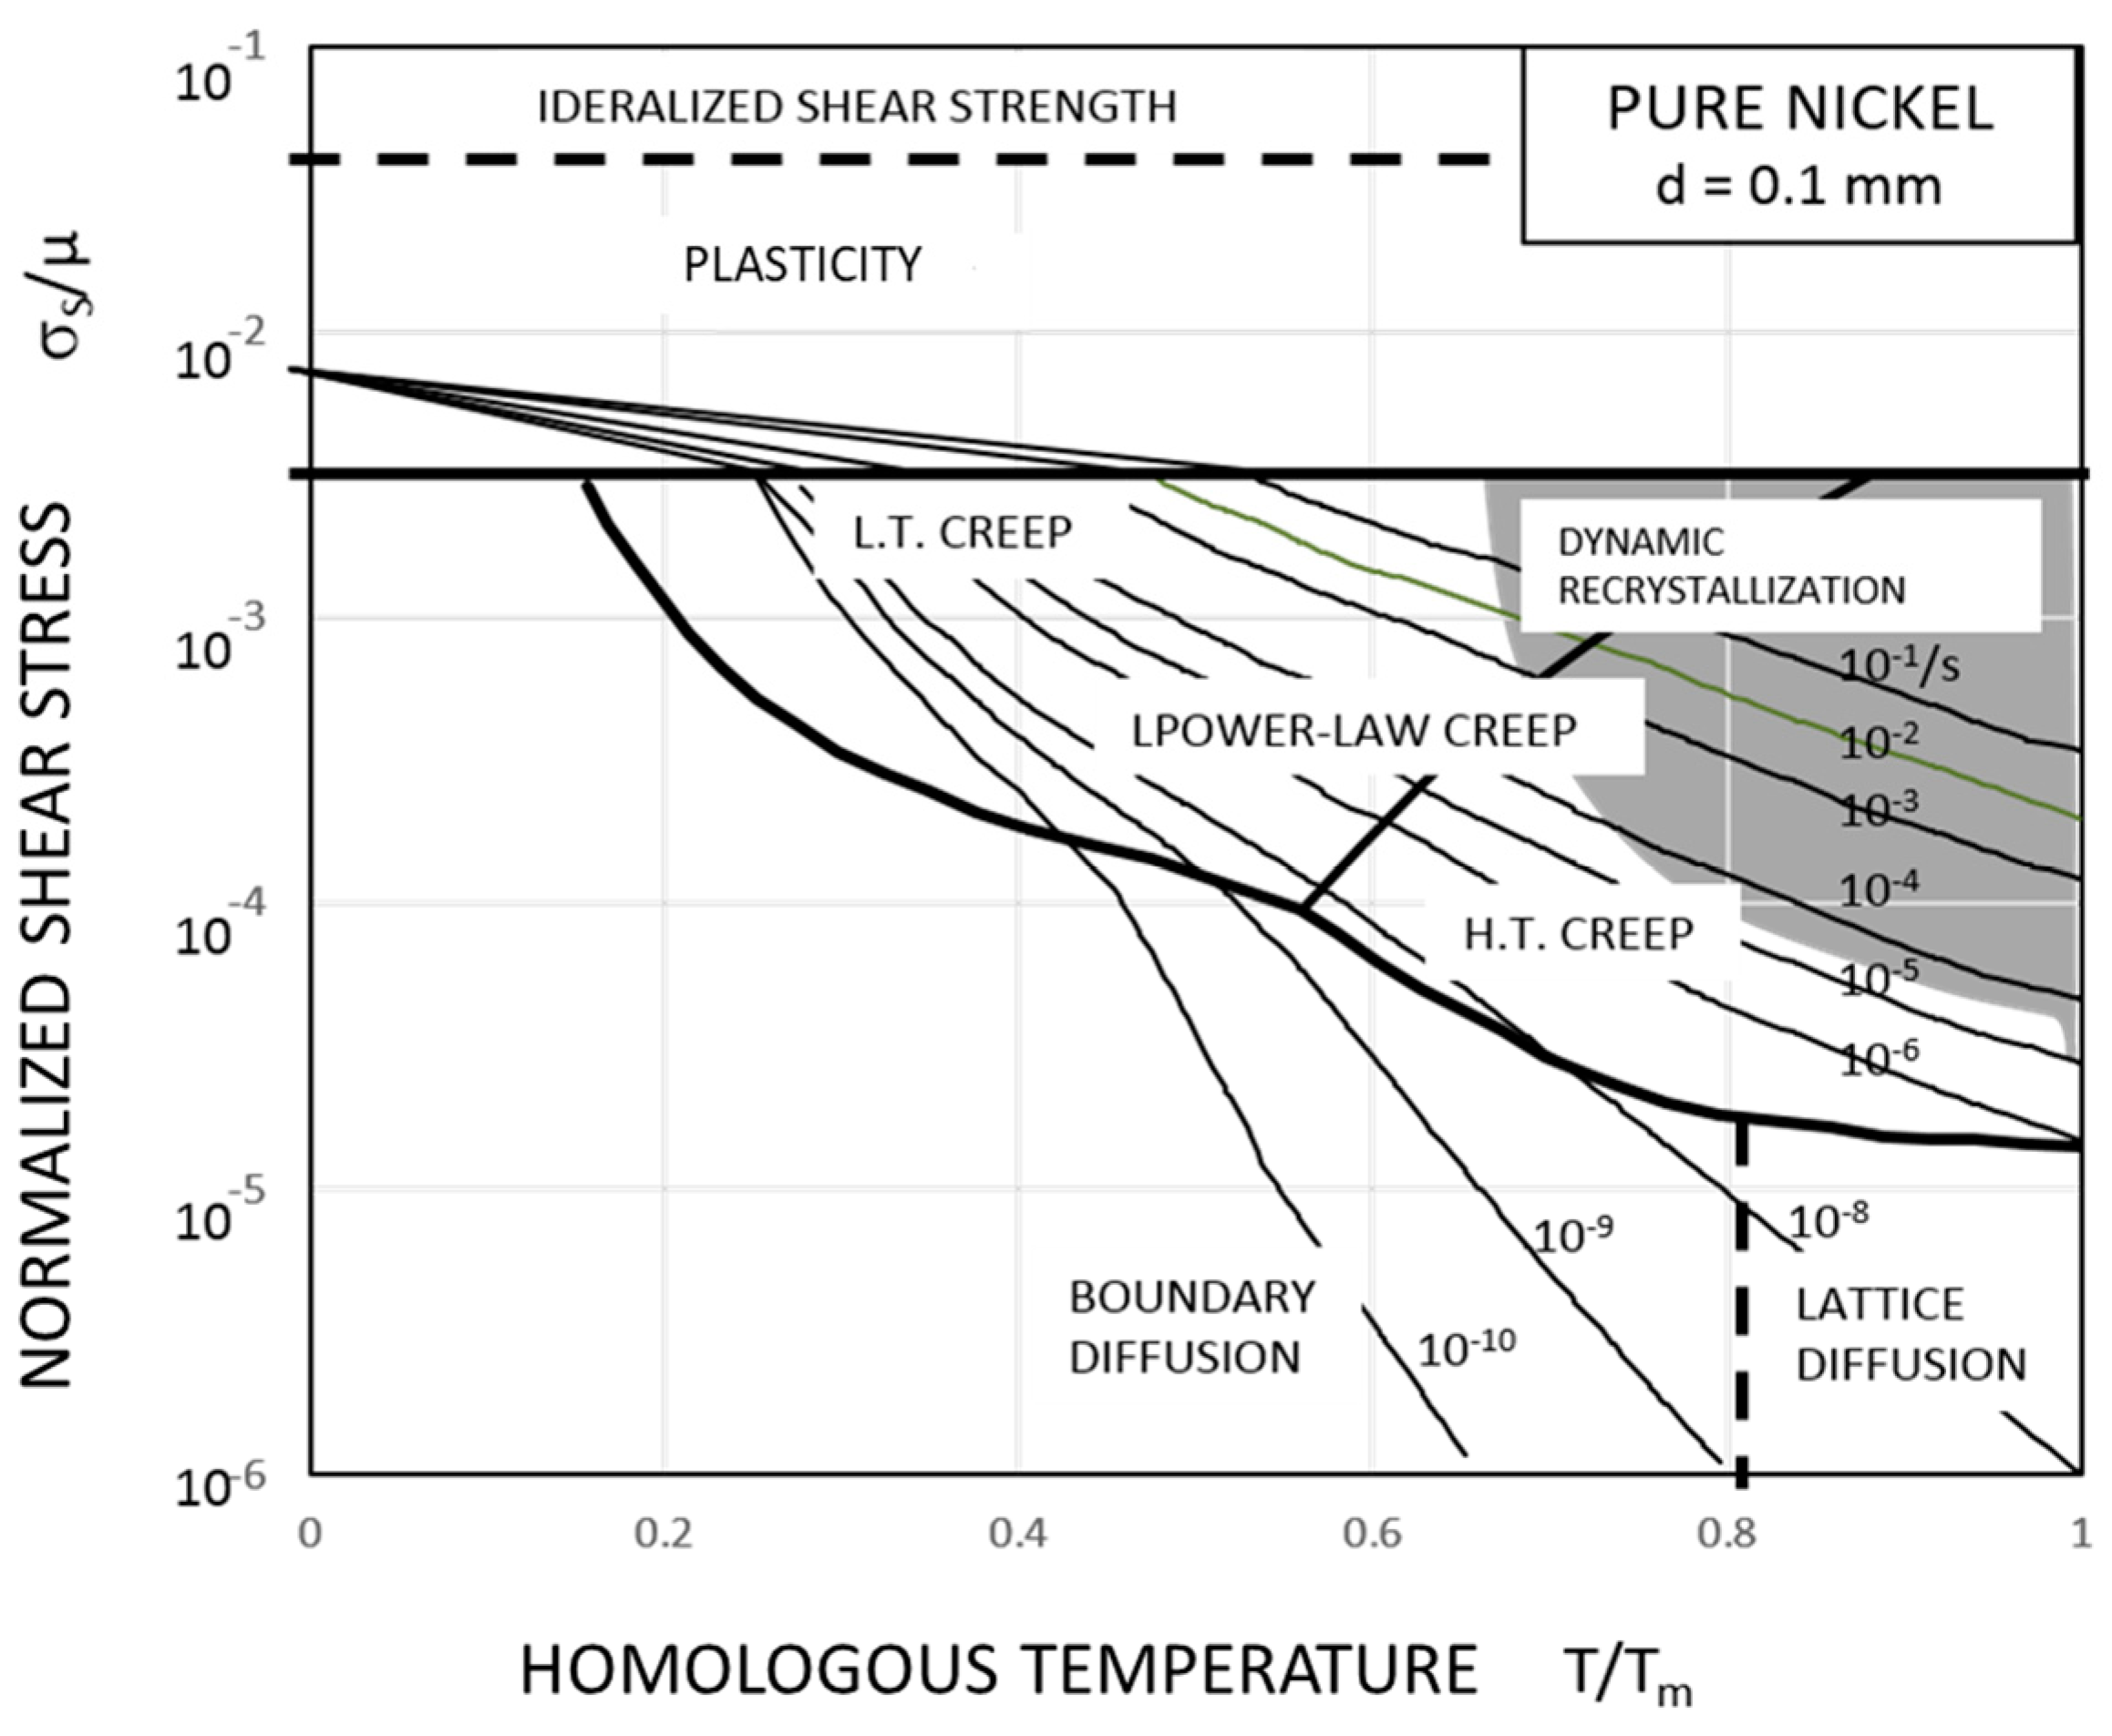
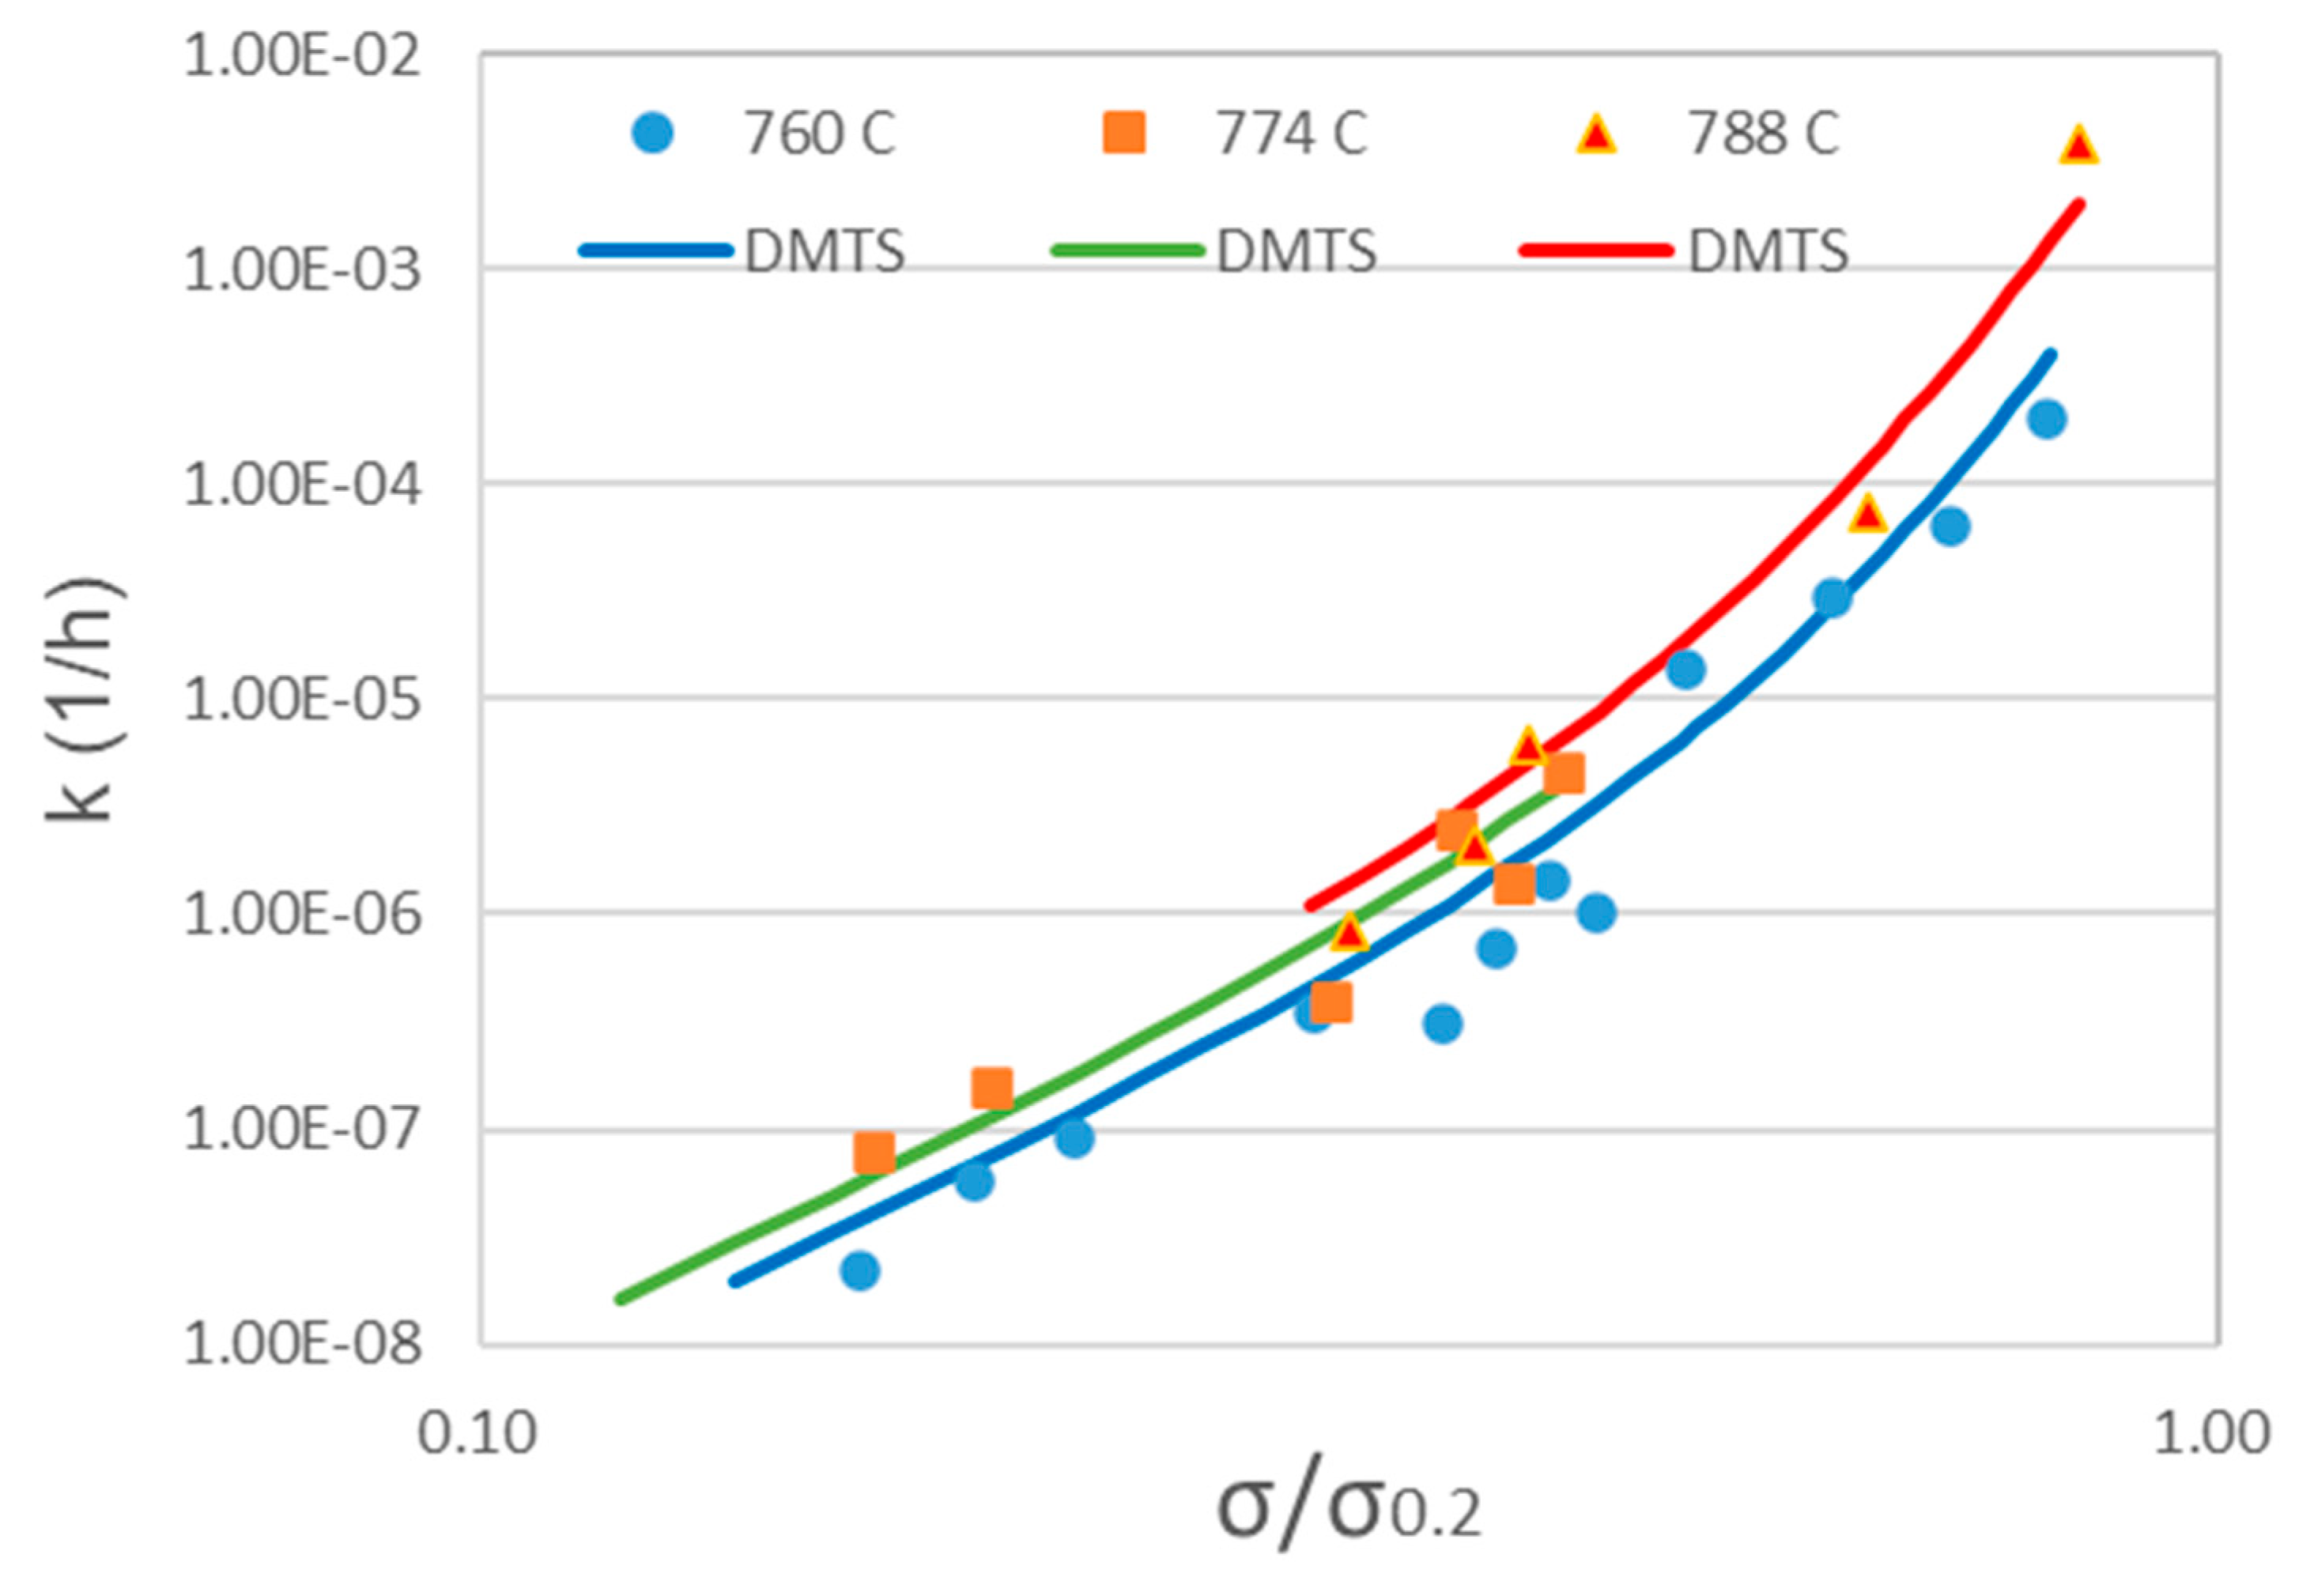
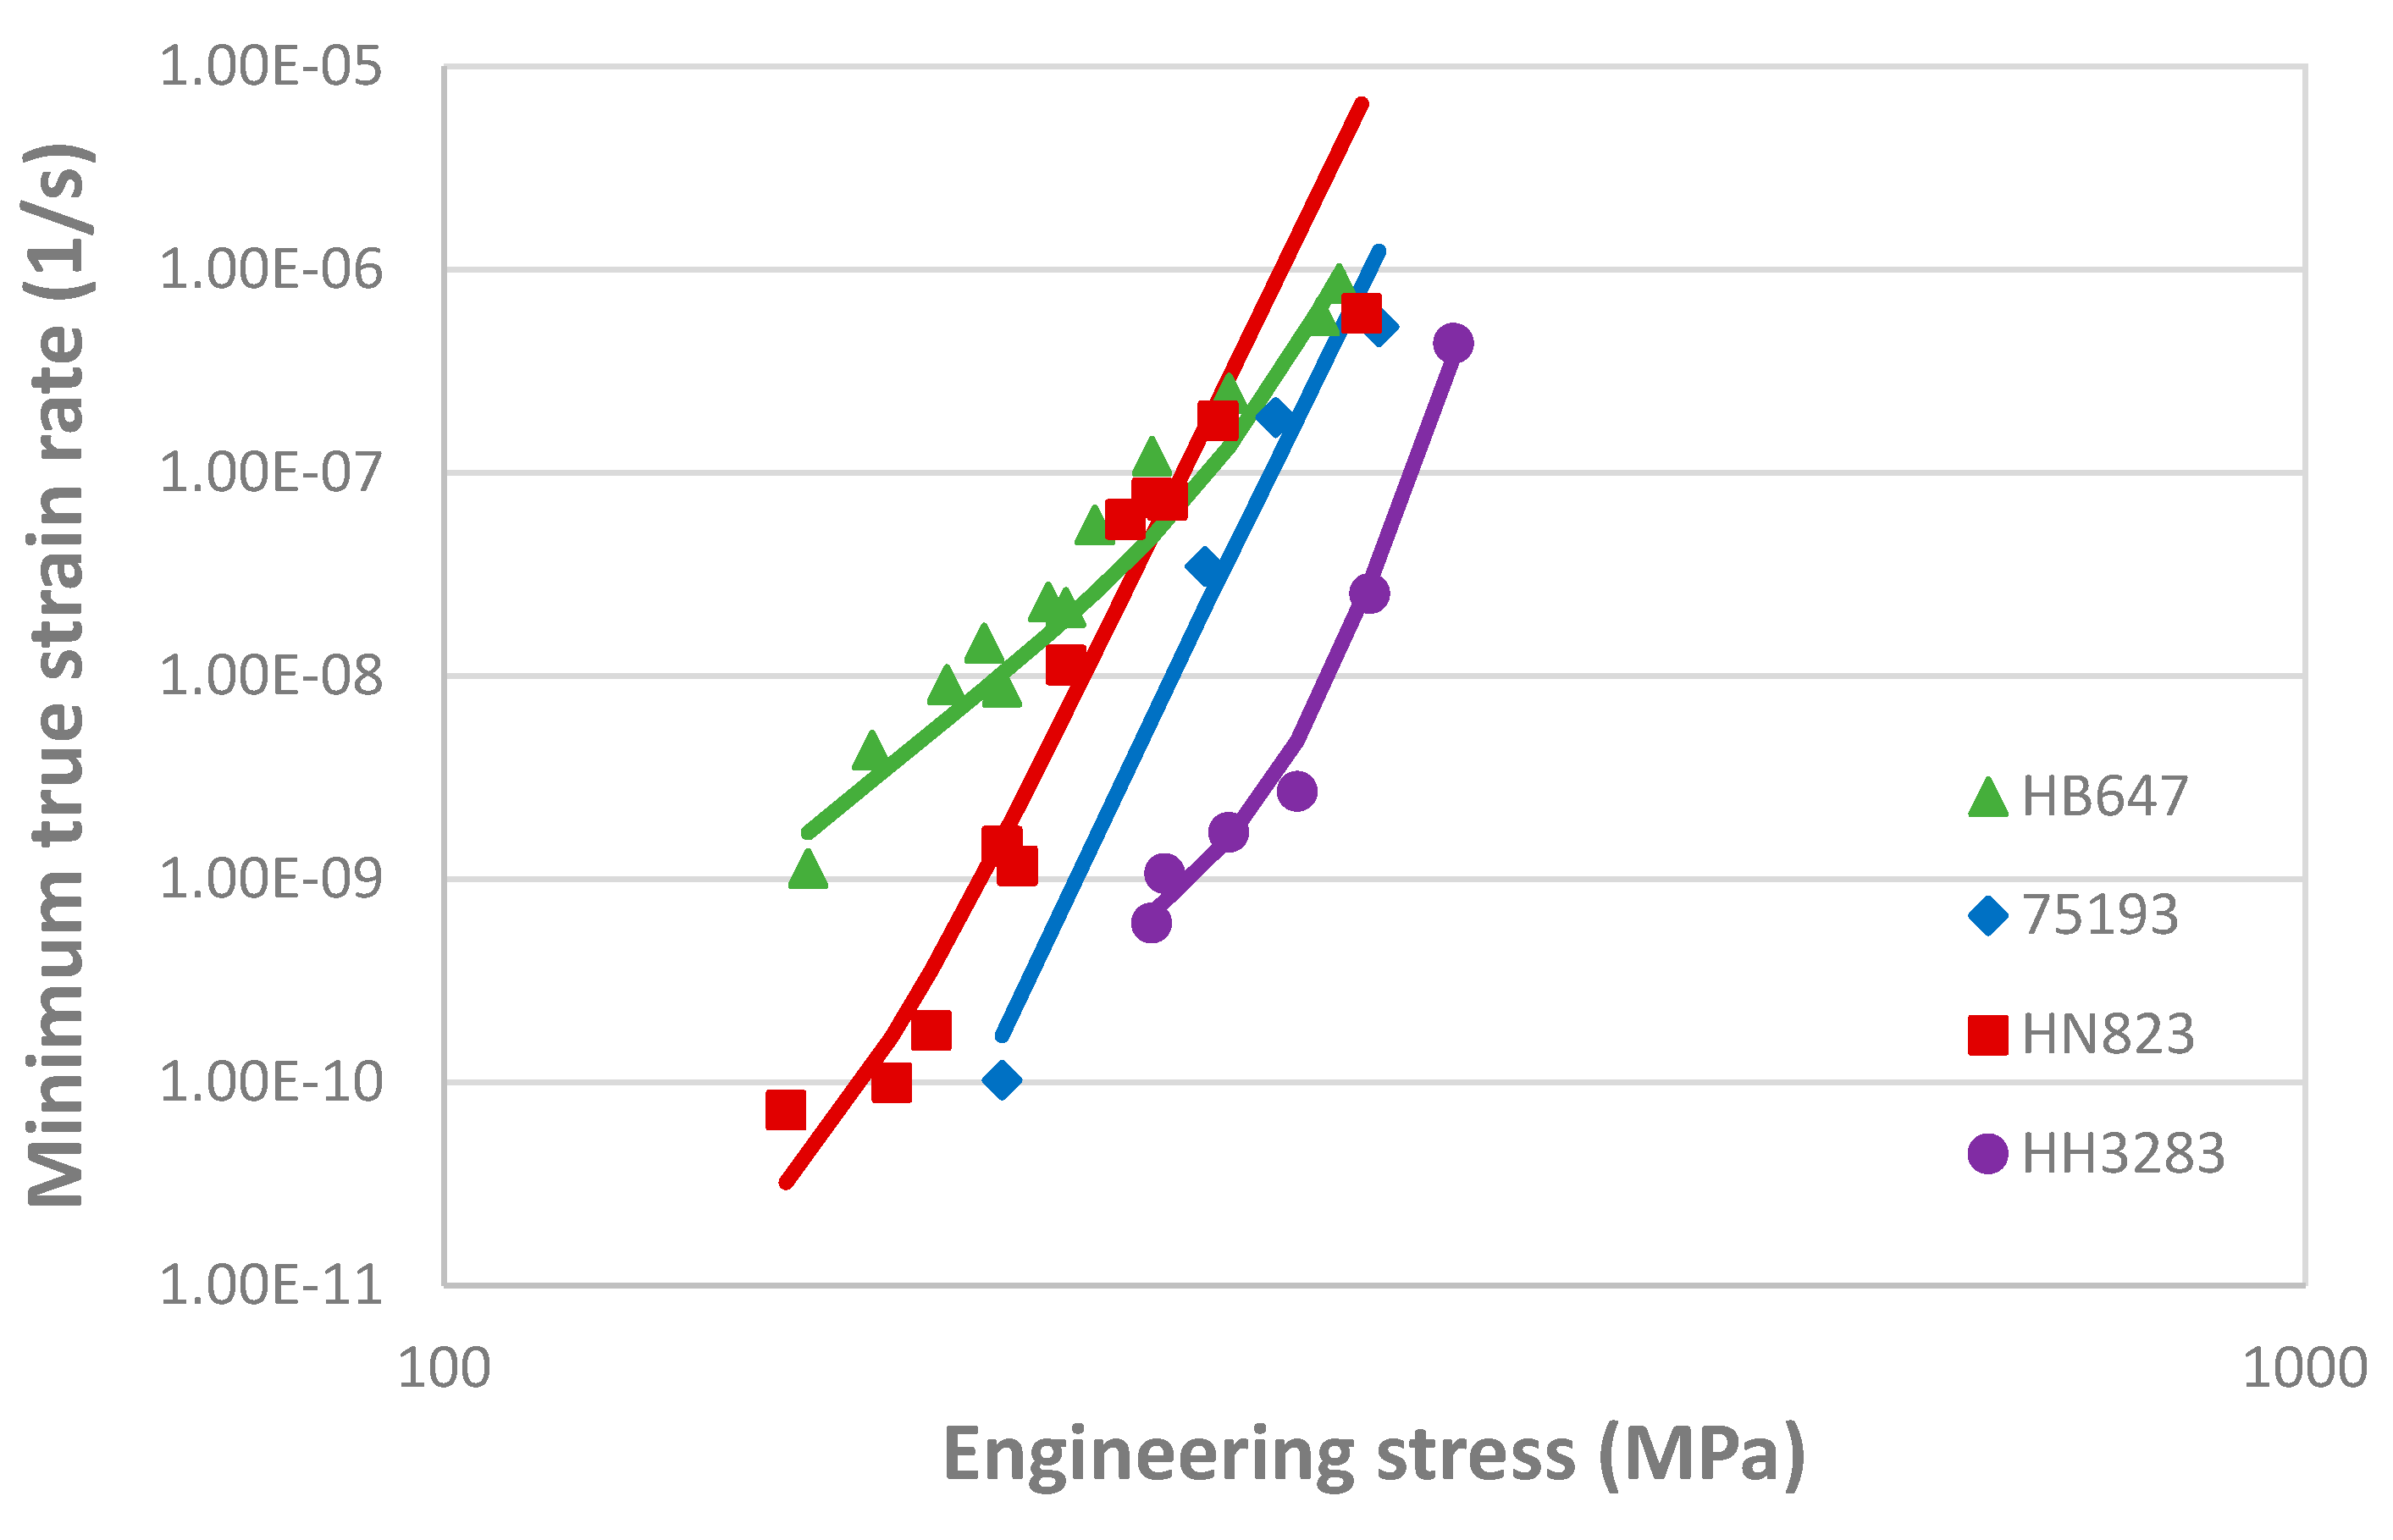
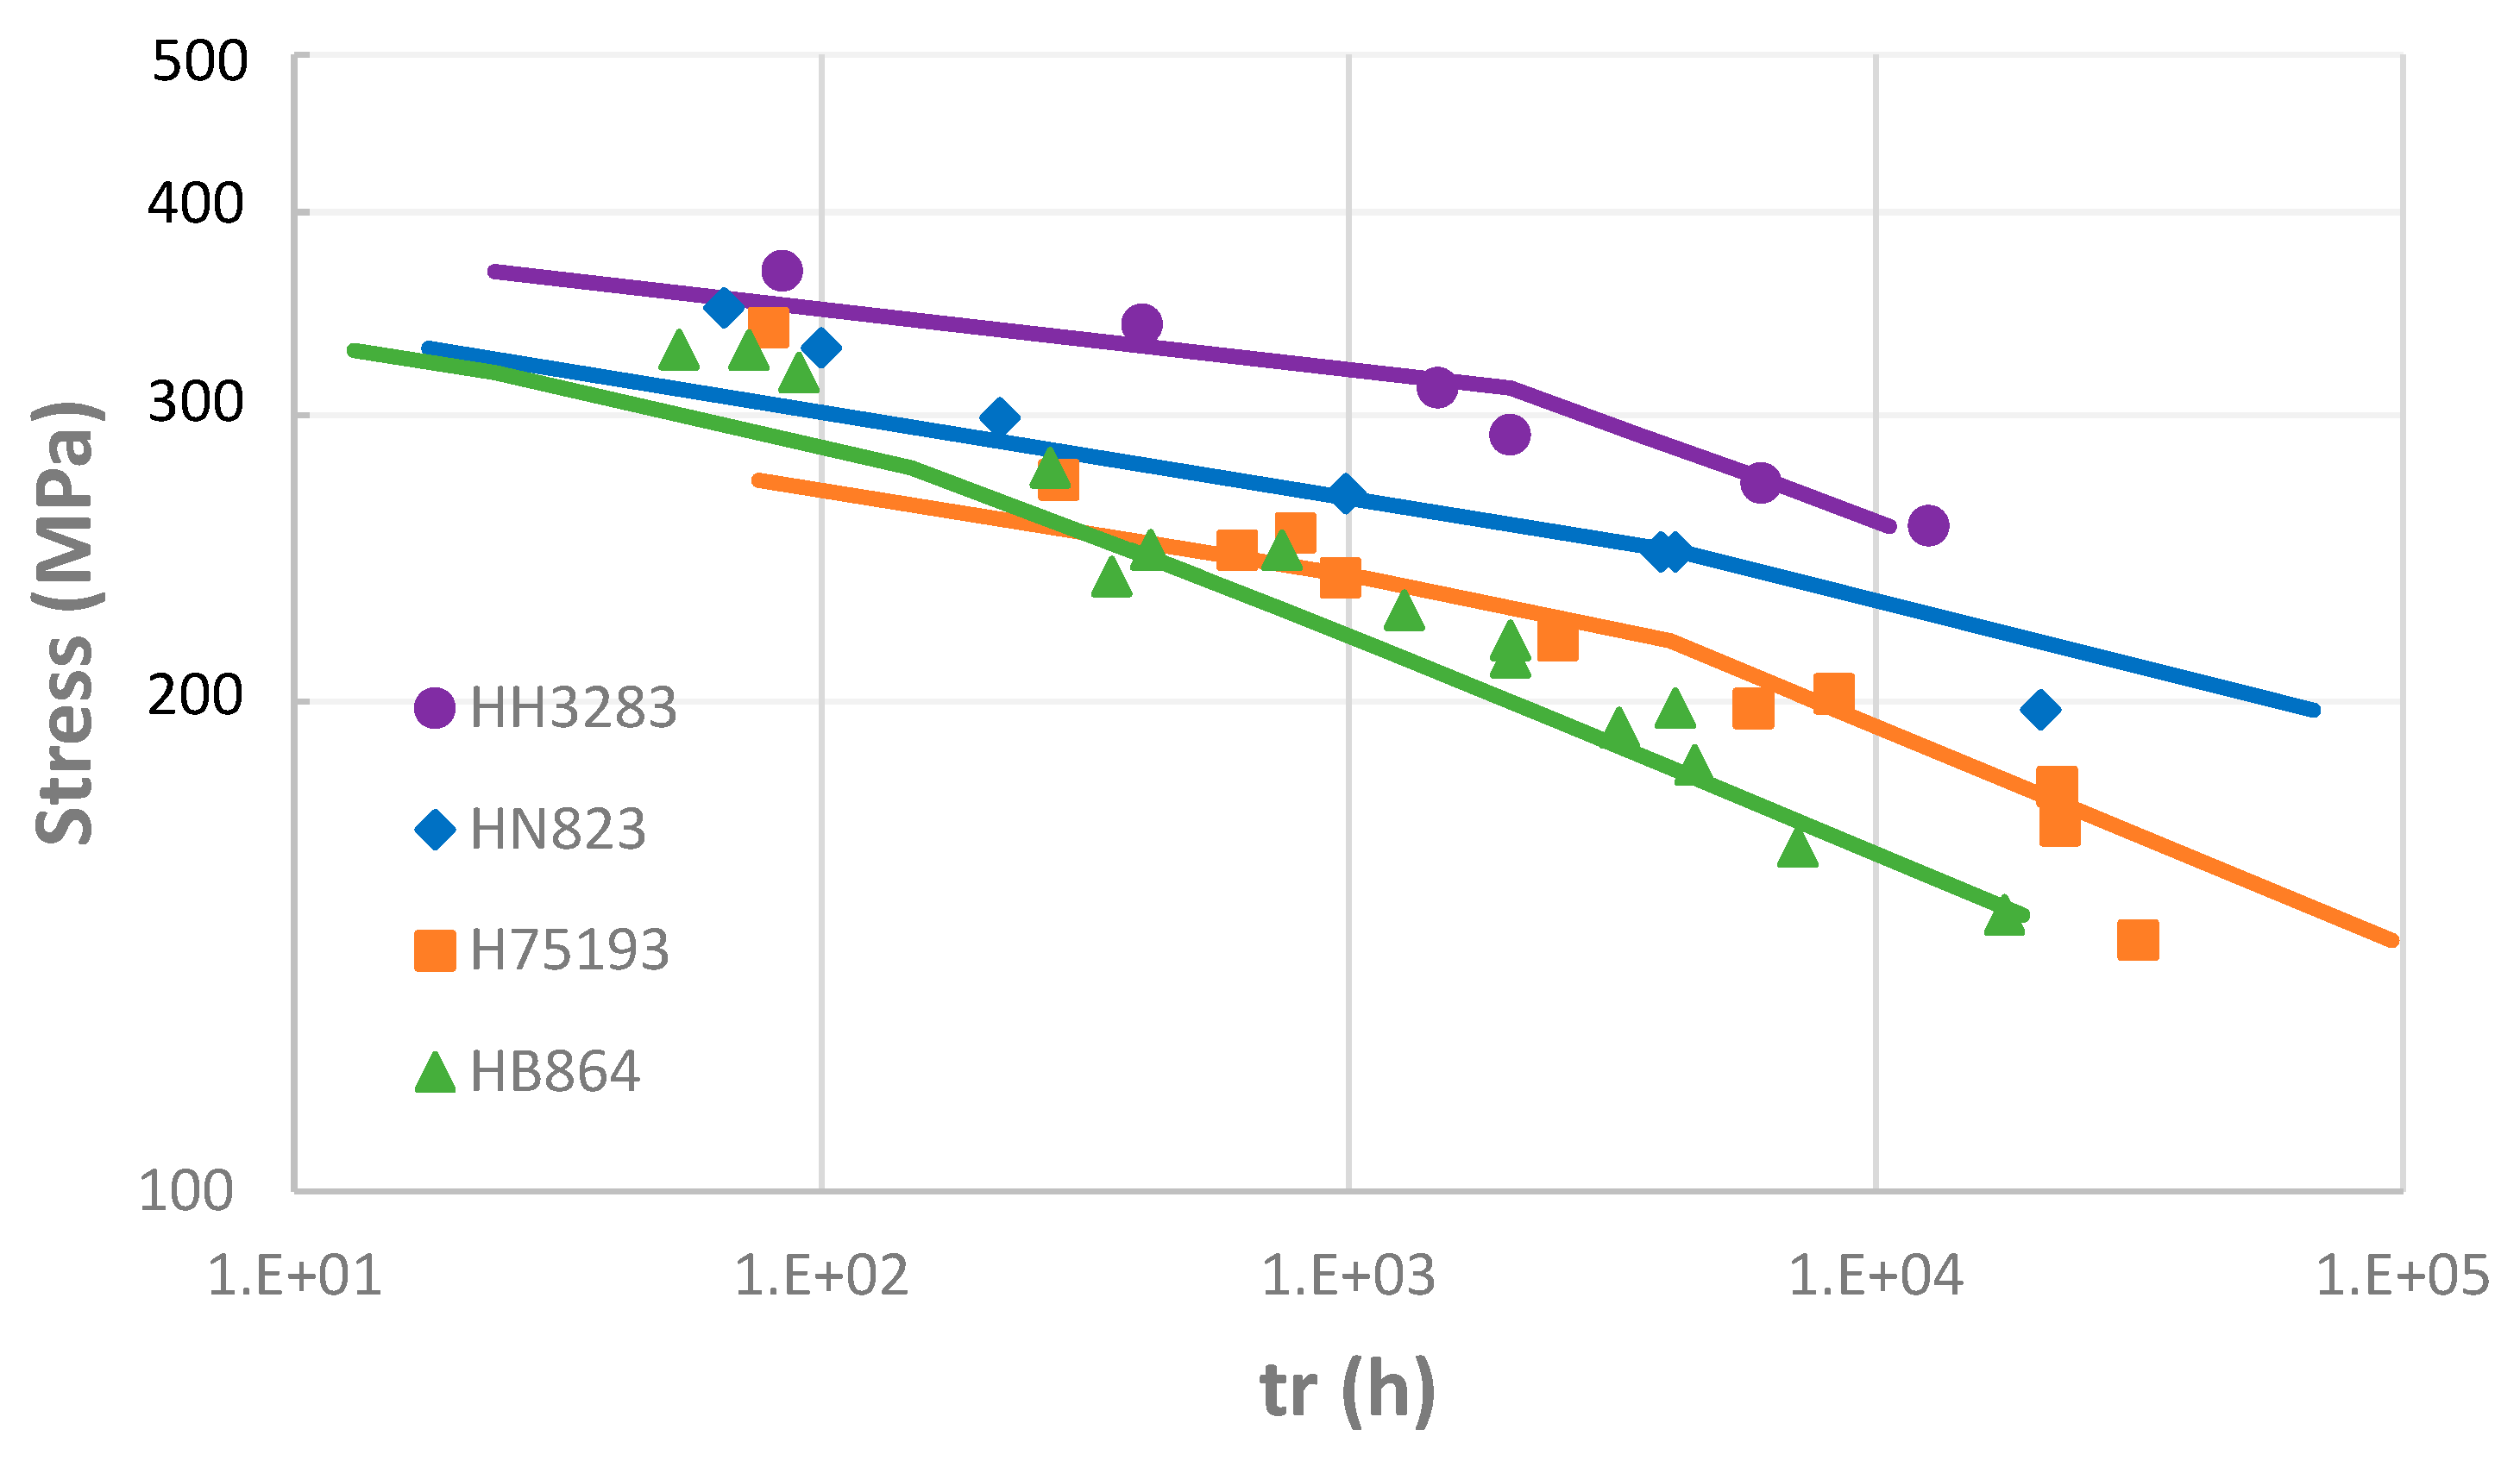
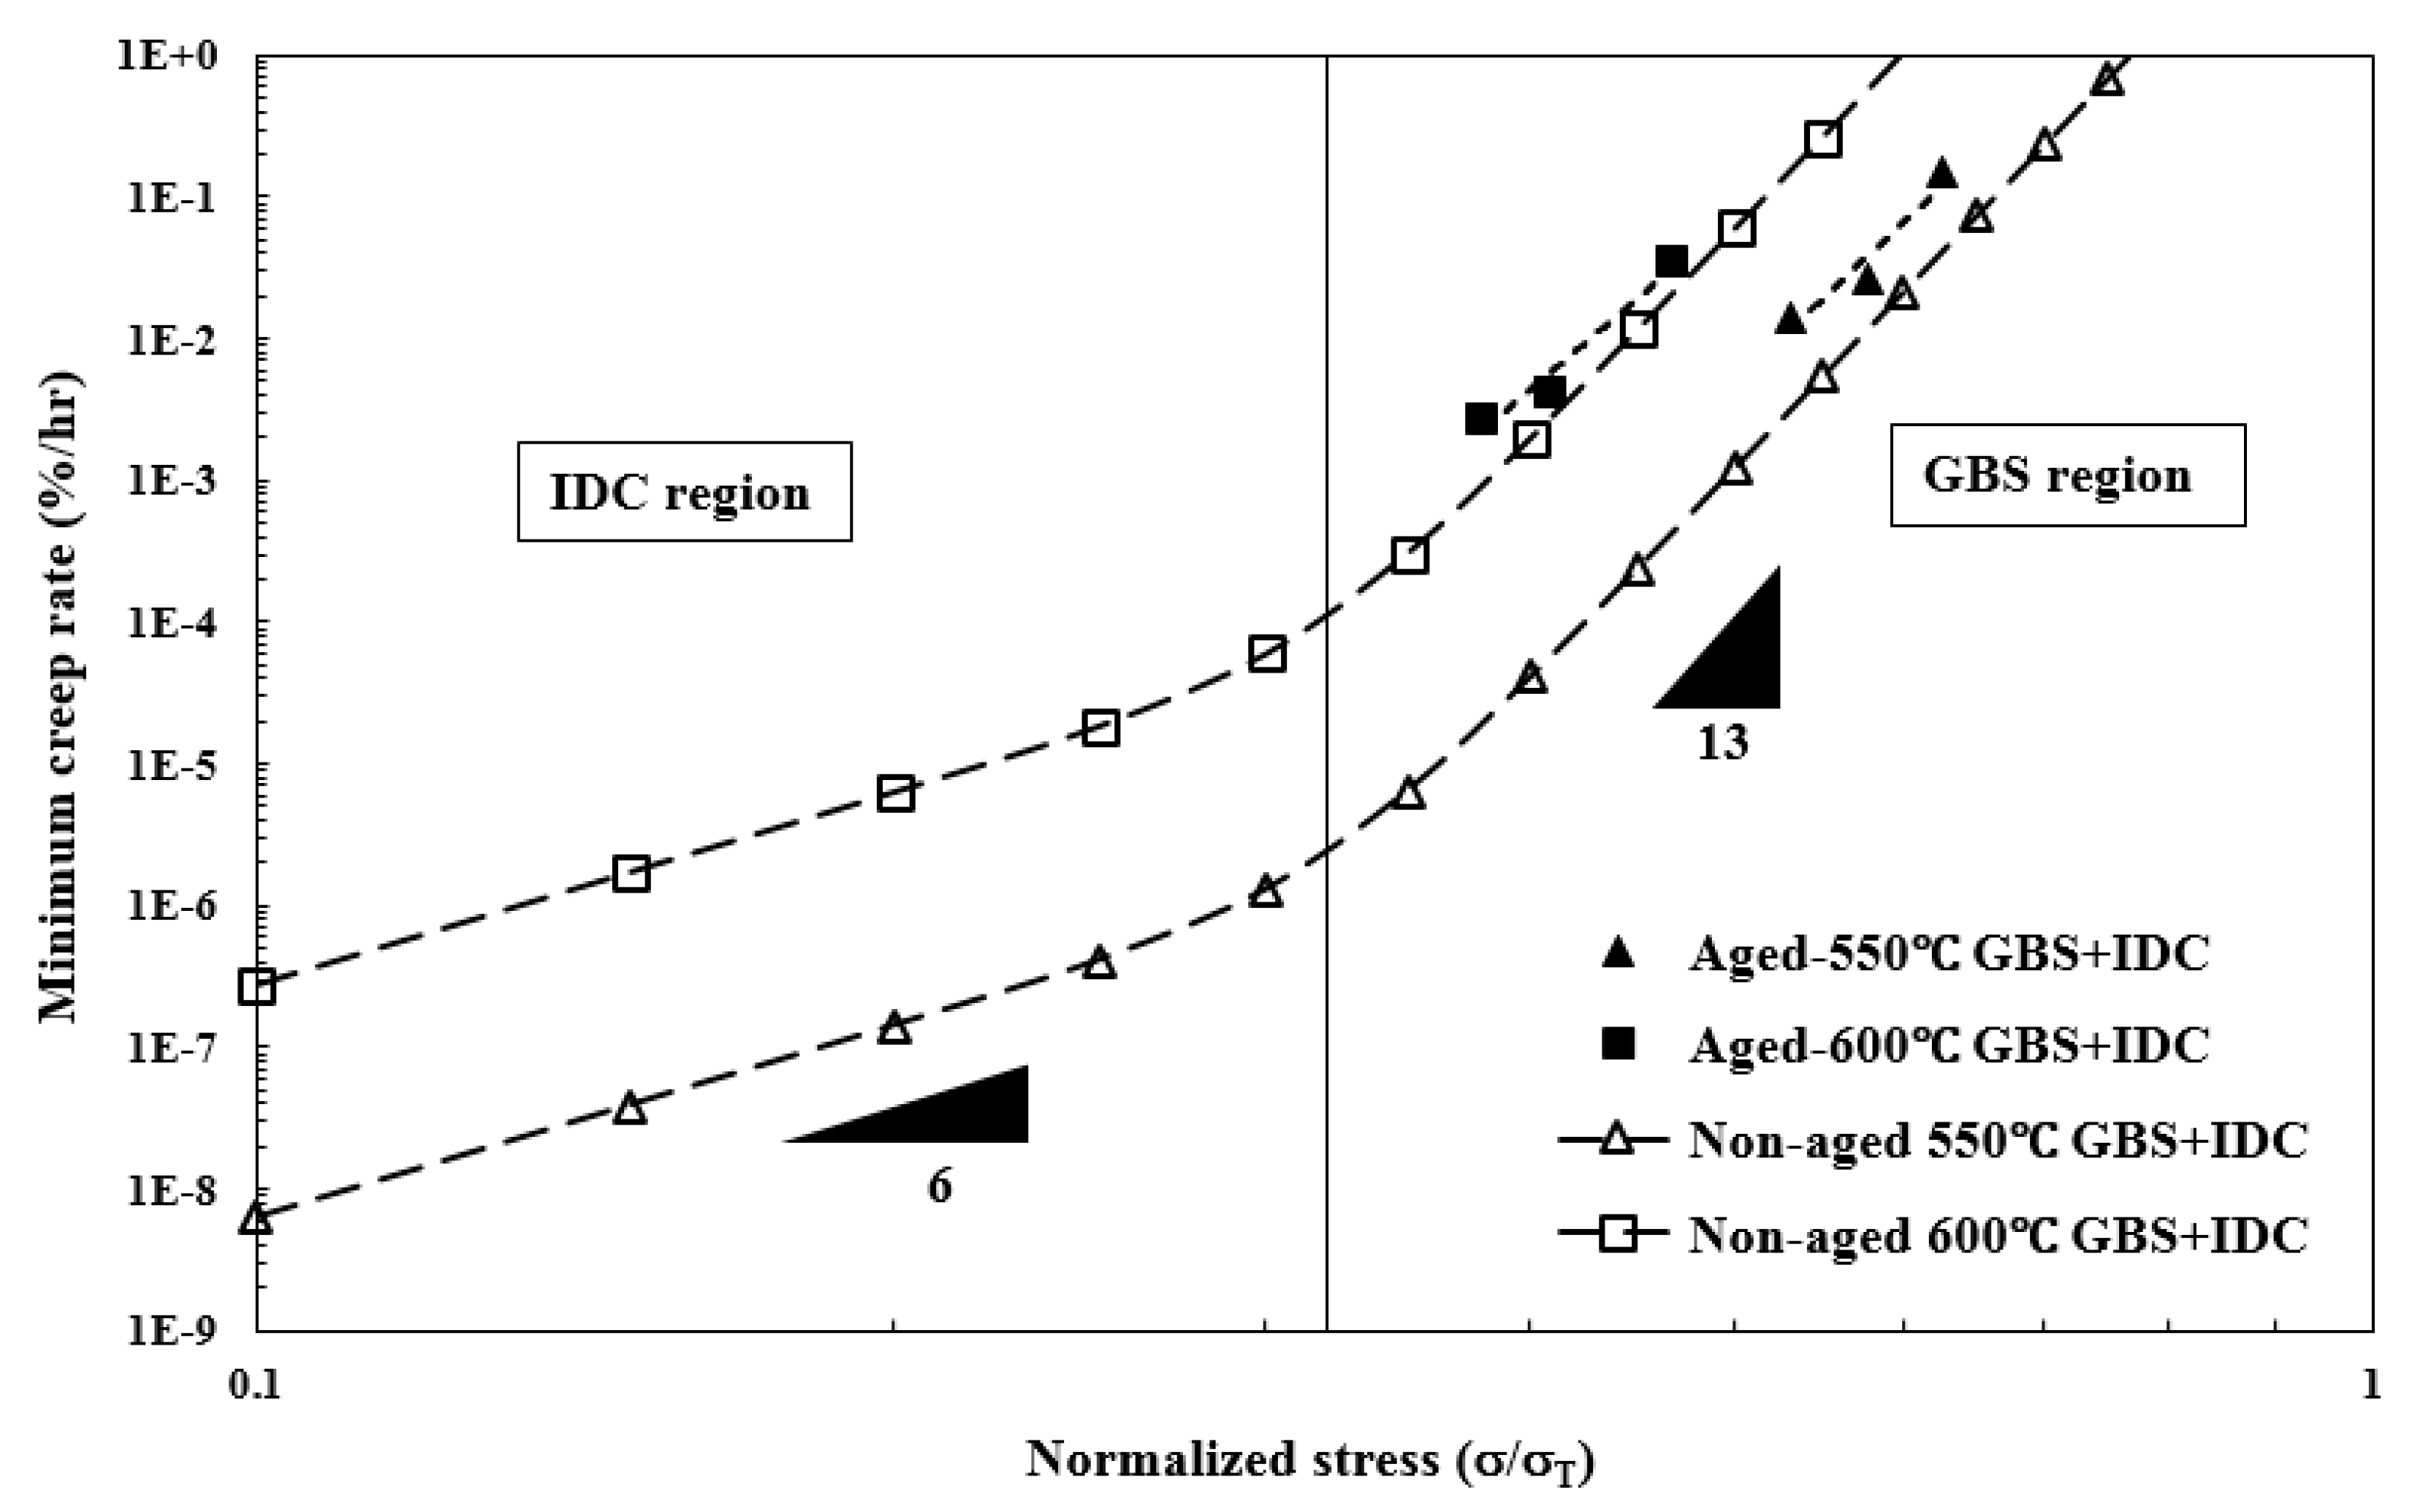
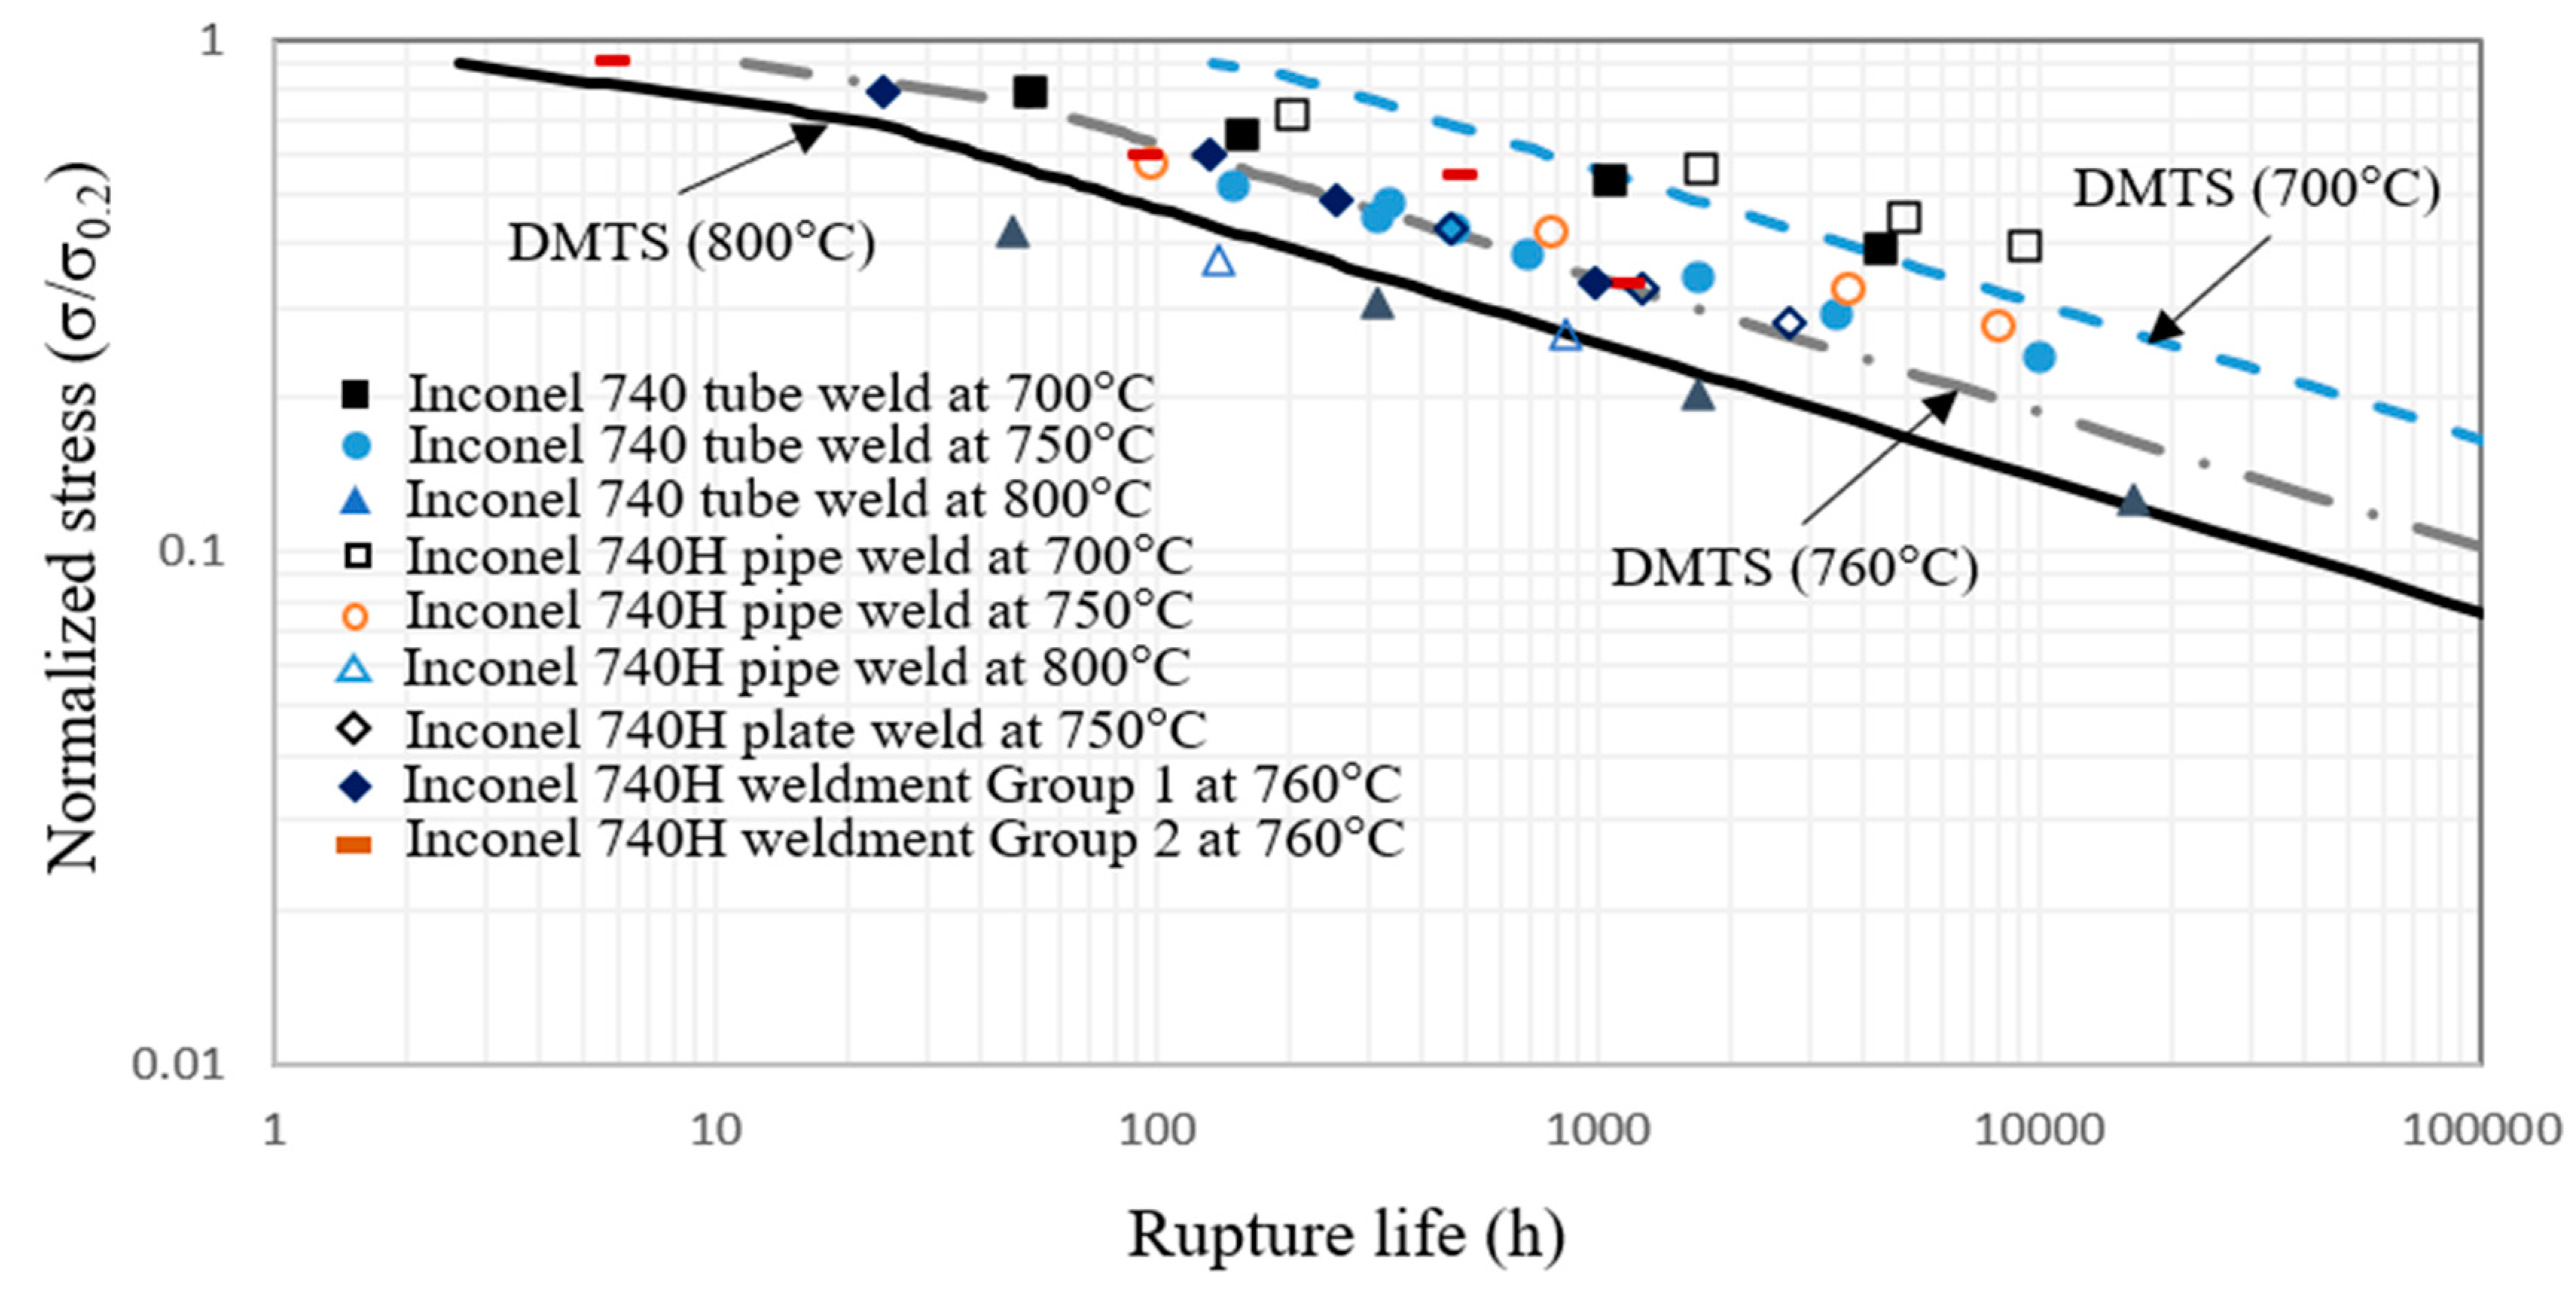
| Alloy | IDG | GBS |
|---|---|---|
| HB647 | = 5.25×10-54 σ19 | = 1.1×10⁻²⁵ σ7.4 |
| HN823 | = 3.49×10-54 σ19 | = 1.8×10⁻²⁷ σ7.4 |
| 75193 | = 2.82×10-53 σ19 | = 1.8×10⁻²⁷ σ7.4 |
| HH3283 | = 8.8×10-74 σ26.2 | = 1.8×10⁻²⁷ σ7.4 |
Disclaimer/Publisher’s Note: The statements, opinions and data contained in all publications are solely those of the individual author(s) and contributor(s) and not of MDPI and/or the editor(s). MDPI and/or the editor(s) disclaim responsibility for any injury to people or property resulting from any ideas, methods, instructions or products referred to in the content. |
© 2024 by the authors. Licensee MDPI, Basel, Switzerland. This article is an open access article distributed under the terms and conditions of the Creative Commons Attribution (CC BY) license (http://creativecommons.org/licenses/by/4.0/).


