Preprint
Article

Factors Influencing the Energy Consumption in a Building: Comparative Study between Two Different Climates

Altmetrics

Downloads

101

Views

52

Comments

0

A peer-reviewed article of this preprint also exists.

Submitted:

17 May 2024

Posted:

18 May 2024

You are already at the latest version

Alerts
Abstract
The use of energy resources is essential to the survival and development of human civilization. However, inefficient energy use not only has an impact on the economy, but it also has a significant impact on climate change. Studying and analyzing the factors that increase energy consumption is crucial for improving energy management. The aim of this study is to analyze the factors influencing energy savings in a building taken as a study model under two different climatic conditions. Measurements of the building's energy performance were carried out using the EnergyPlus calculation engine, which enabled us to analyze the strengths of building parameters such as the number of lights, the equipment used, occupancy, temperature and the relationships between the factors influenced. EnergyPlus is an important software tool in the field of building energy efficiency, enabling the precise simulation of building energy consumption. Simulation scenarios based on actual consumption data carried out by researchers have made it possible to develop energy management strategies in buildings in order to optimize energy efficiency, and in particular to promote the thermal performance of these buildings. In the present work, EnergyPlus building energy simulation software is used to simulate the energy consumption of the building of the Faculty of Electrical Engineering at the "Gheorghe Asachi" Technical University in Iasi, in order to determine the factors influencing building energy consumption. It has been shown that occupancy and heating and cooling systems are the key factors influencing energy consumption in buildings. The advantage of this study is that it can be used to model the most influential factors in predicting future energy consumption in buildings.
Keywords: 
Subject: Physical Sciences  -   Applied Physics

1. Introduction

The energy consumption of residential and non-residential buildings represents a significant share of global energy consumption. According to a study on energy demand [1], global energy needs will increase by 50% by 2050. At present, researchers around the world are focused on the simulation of building energy consumption. The results showed that the choice of lighting system is a potential option for energy saving. At the same time, the proportion of exterior walls and windows of the building is vital for the energy conservation of buildings [2].
Energy consumption in buildings can be attributed to four variables: the building (form, material and construction), the system (electrical appliances), the occupant (household statistics and energy-related behavior) and the context (geometry urban and local climate). These relationships have been widely studied [3,4]. The energy consumption is linked in part to heat gains or losses through the building envelope, but also to internal loads generated by occupancy, use of electrical equipment and artificial lighting [5]. Global carbon emissions are significantly impacted by the energy-intensive sectors associated with heating and cooling buildings. For many researchers, it's far consequently critical to make sure that the nice of lifestyles provided with the aid of using the constructing and its installations is well suited with minimal requirements of habitability, consolation and energy efficiency. The management of a building's technical and electronic equipment enhances its energy efficiency, while optimizing occupant comfort. Using EnergyPlus, Shabunko et al [6] carried out an energy assessment of 400 buildings in order to optimize their energy consumption. Through the simulation of a rural house model, Yu et al [7] defined the performance parameters of an enclosure using EnergyPlus to simulate energy efficiency under different conditions, which ultimately enabled them to provide technical support and theoretical advice for the renovation of the building to save energy.
Various parameters that affect the building's consumption are studied to act on the design of the building in order to increase its efficiency. Studies on the impact of certain architectural characteristics such as the shape of the building [8], the percentage of opening of the facades, the colors and the shading devices [9], as well as on the occupancy [10], showed that overall consumption and energy costs fluctuate significantly with changes in constructive and social variables. Climatic characteristics can also influence energy consumption in buildings. According to Ezeh and al [11], to promote the conservation, management and sustainability of building energy, it is essential to establish during the design phase the main elements having an impact on the energy performance of the building. Evaluating the energy efficiency of buildings is a more difficult task than that of common equipment. Efficiency is a result of the interaction of factors such as building structure and environmental variables, including temperature, external humidity, shading, and other systems [12]. HVAC (Heating, Ventilation and Air-Conditioning) systems are also multivariable systems in buildings which constitute the largest consumers of energy. Since they consume a lot of energy, buildings must be able to achieve significant savings by improving the process control strategy carried out by these systems.
A qualified architectural design must combine the space, shape and structure of the building, but at the same time, structural materials and equipment. These internal systems are used to maintain the thermal comfort of the building. In order to predict the energy consumption of the building and improve its energy efficiency, factors influencing energy consumption of the building are studied in this paper. In this article we use the EnergyPlus calculation engine to simulate the energy consumption of the building of the Faculty of Electrical Engineering of the Technical University "Gheorghe Asachi". A comparative study based on two different climatic conditions is carried out.

2. Materials and Methods

Our objective is to evaluate the performance of the simulated university building over a wide range of parameters, estimating the energy consumption of each space. Our study concentrated on occupancy rate, electrical equipment, and lighting specifically because these are the areas that occupants have the most influence over. In this section, we will provide an overview of the modeling process, including the estimation tool, the data requirements, the prototype building model and compliance with OpenStudio-Standards.

2.1. Materials

2.1.1. Geographic Locations and Weather Data

This case study focuses on the Faculty of Electrical Engineering building in Iasi, Romania. The building is located at latitude 47.914° N and longitude 27.2922° E, dates from the late 1970s and is located in a continental climate, but will also be subjected to temperate climate conditions to assess the influence of climate change on buildings. It is therefore necessary to install devices to meet the summer cooling and winter heating needs of all students, following the model test areas. We have a zone with a continental climate (Iasi in Romania) and another zone with a tropical climate (Lomé in Togo).

2.1.2. Architectures and Material

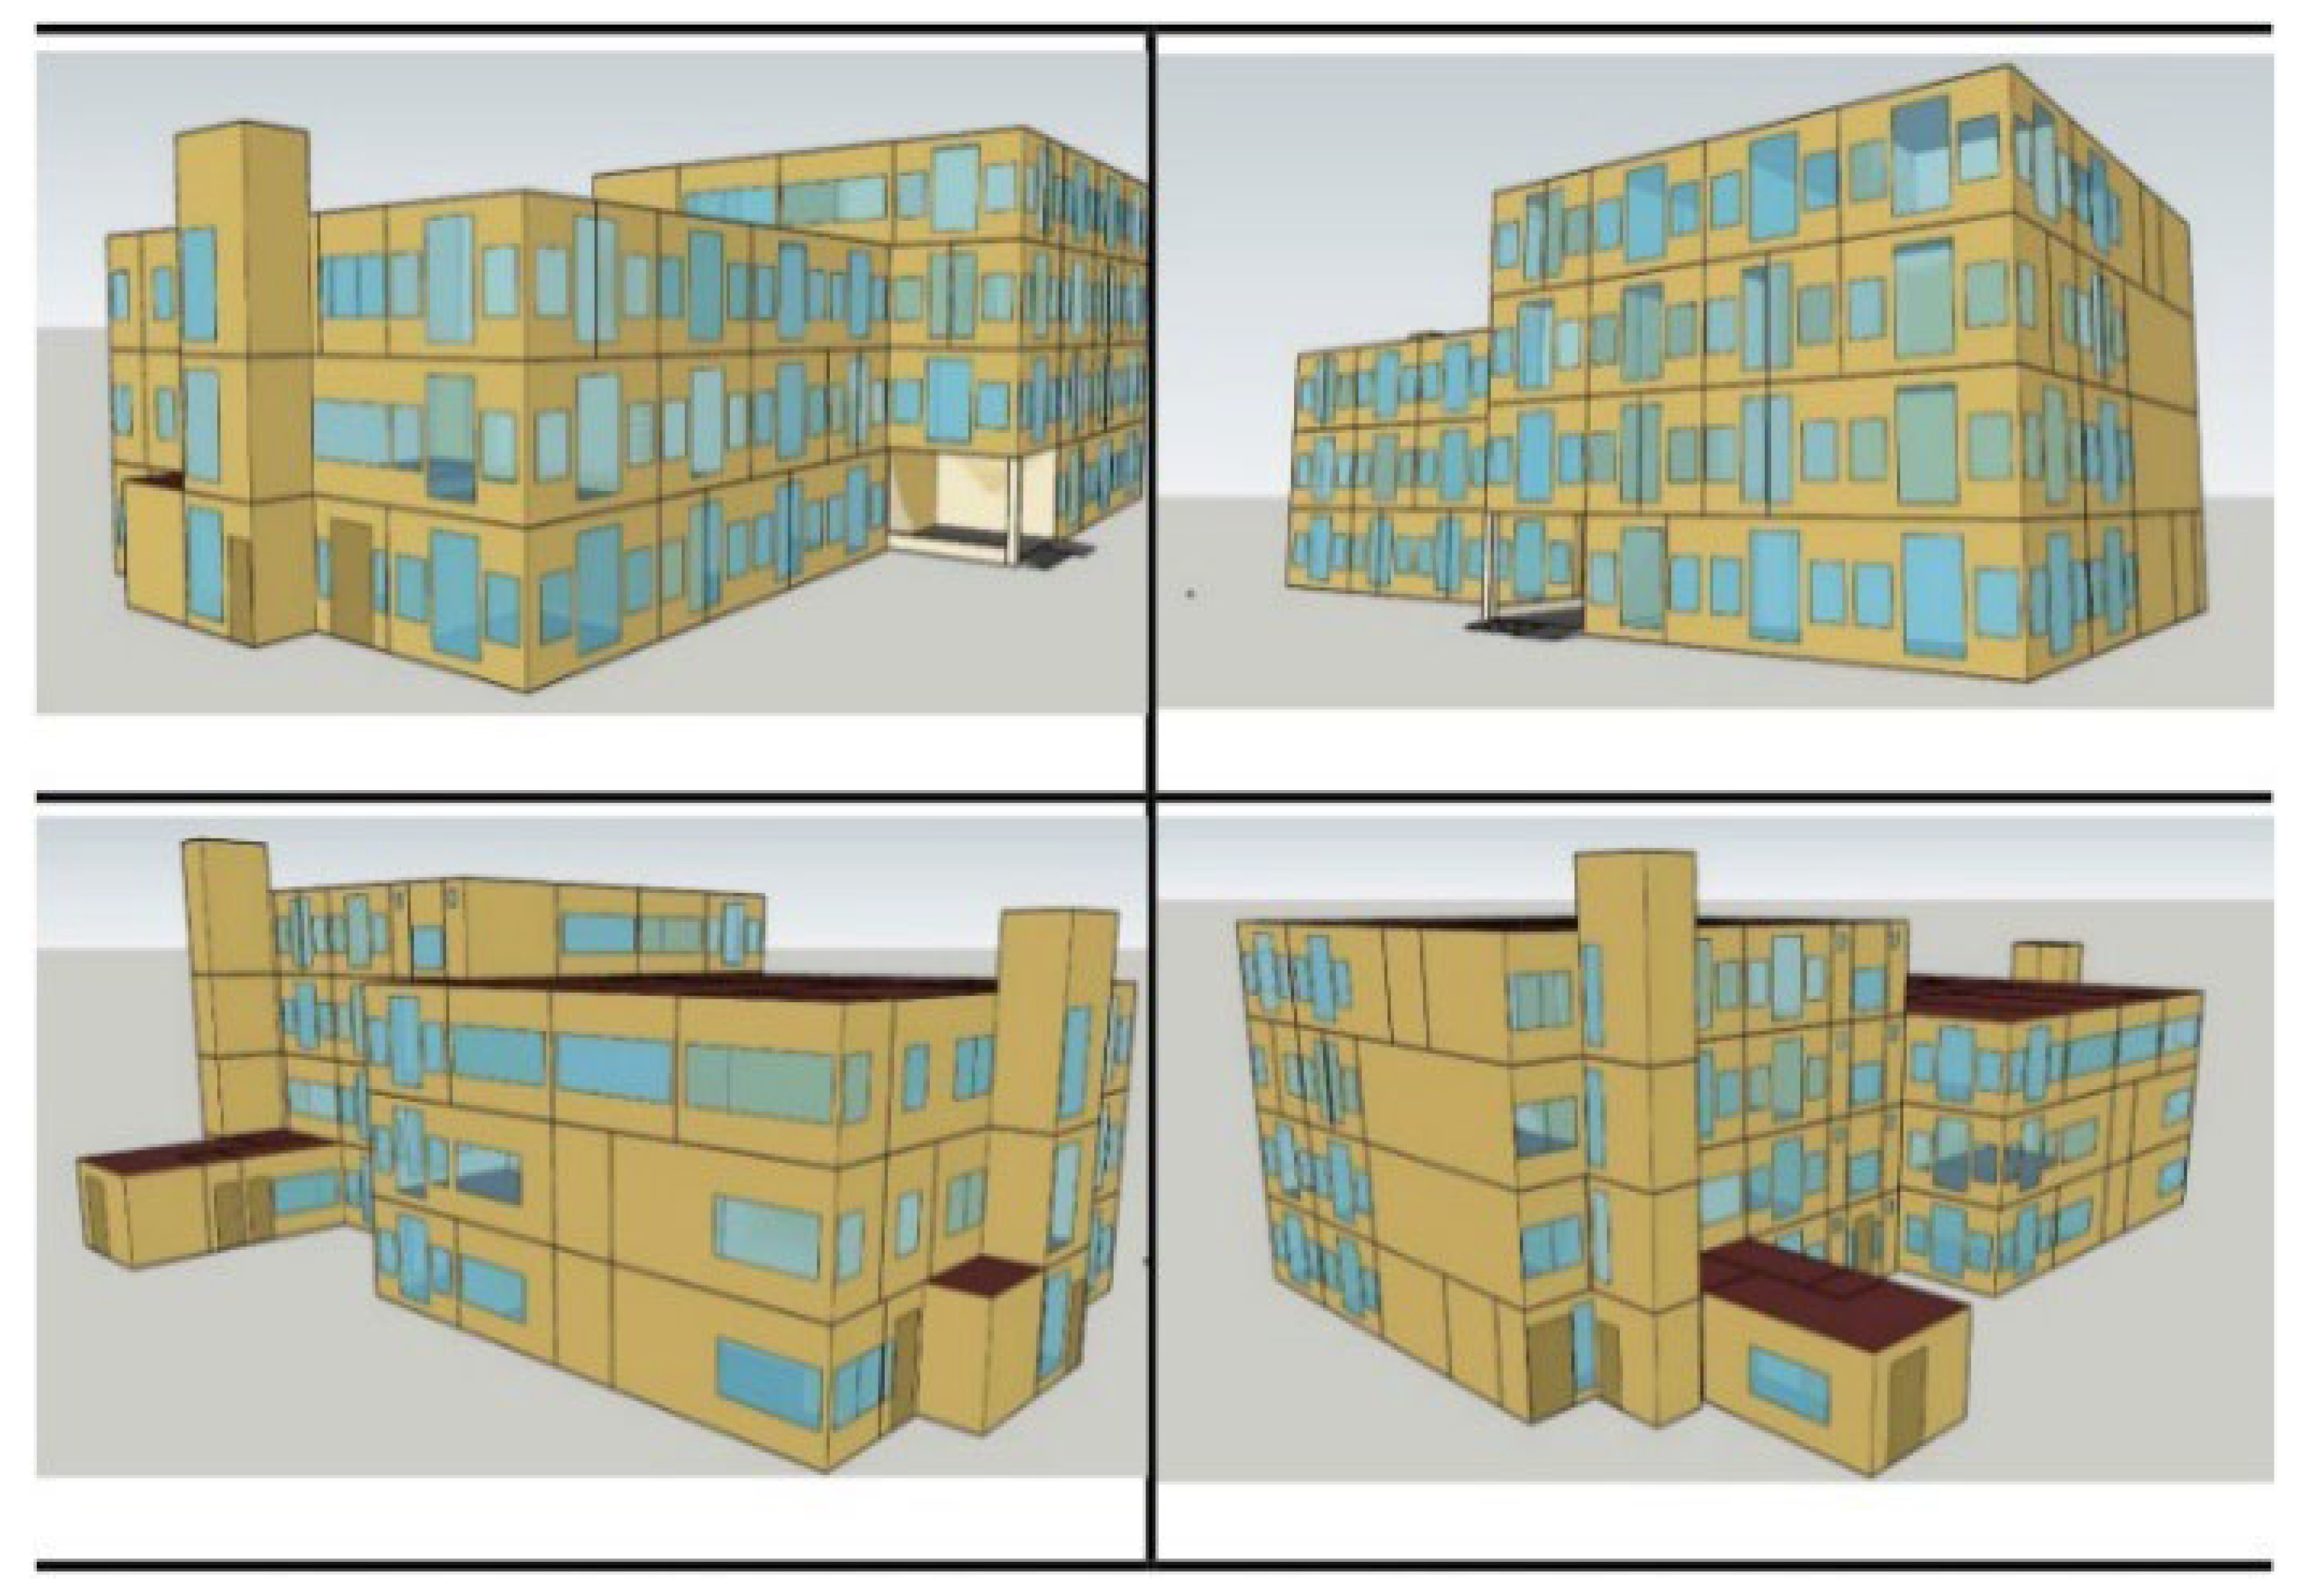
The simulated object is located on the campus of the Technical University "Gheorghe Asachi", built in the early 1980s and renovated in 2017. The chosen sample building (Figure 1) has a total area of ​​1795 square meters and is made up of a set of two buildings joined by corridors, one called Corp A (P+2E) and the other called Corp B (P+3E). The main facades of the two buildings face southwest. The masonry structure and walls are made of concrete. The upper slab is made of reinforced concrete and thermally insulated by a layer of stacked granulite 25 cm thick. The exterior walls are made of 110mm double bricks with 50mm cavities, and 10mm cement mortar on each side with a U-value of 1.46 W/m².K. Single-glazed windows have a heat transfer coefficient U= 5,500 W/m².K. The all-metal exterior door has a thermal transfer coefficient U = 5,356 W/m².K.. All elements of the envelope are not insulated.

2.1.3. EnergyPlus & OpenStudio Platform

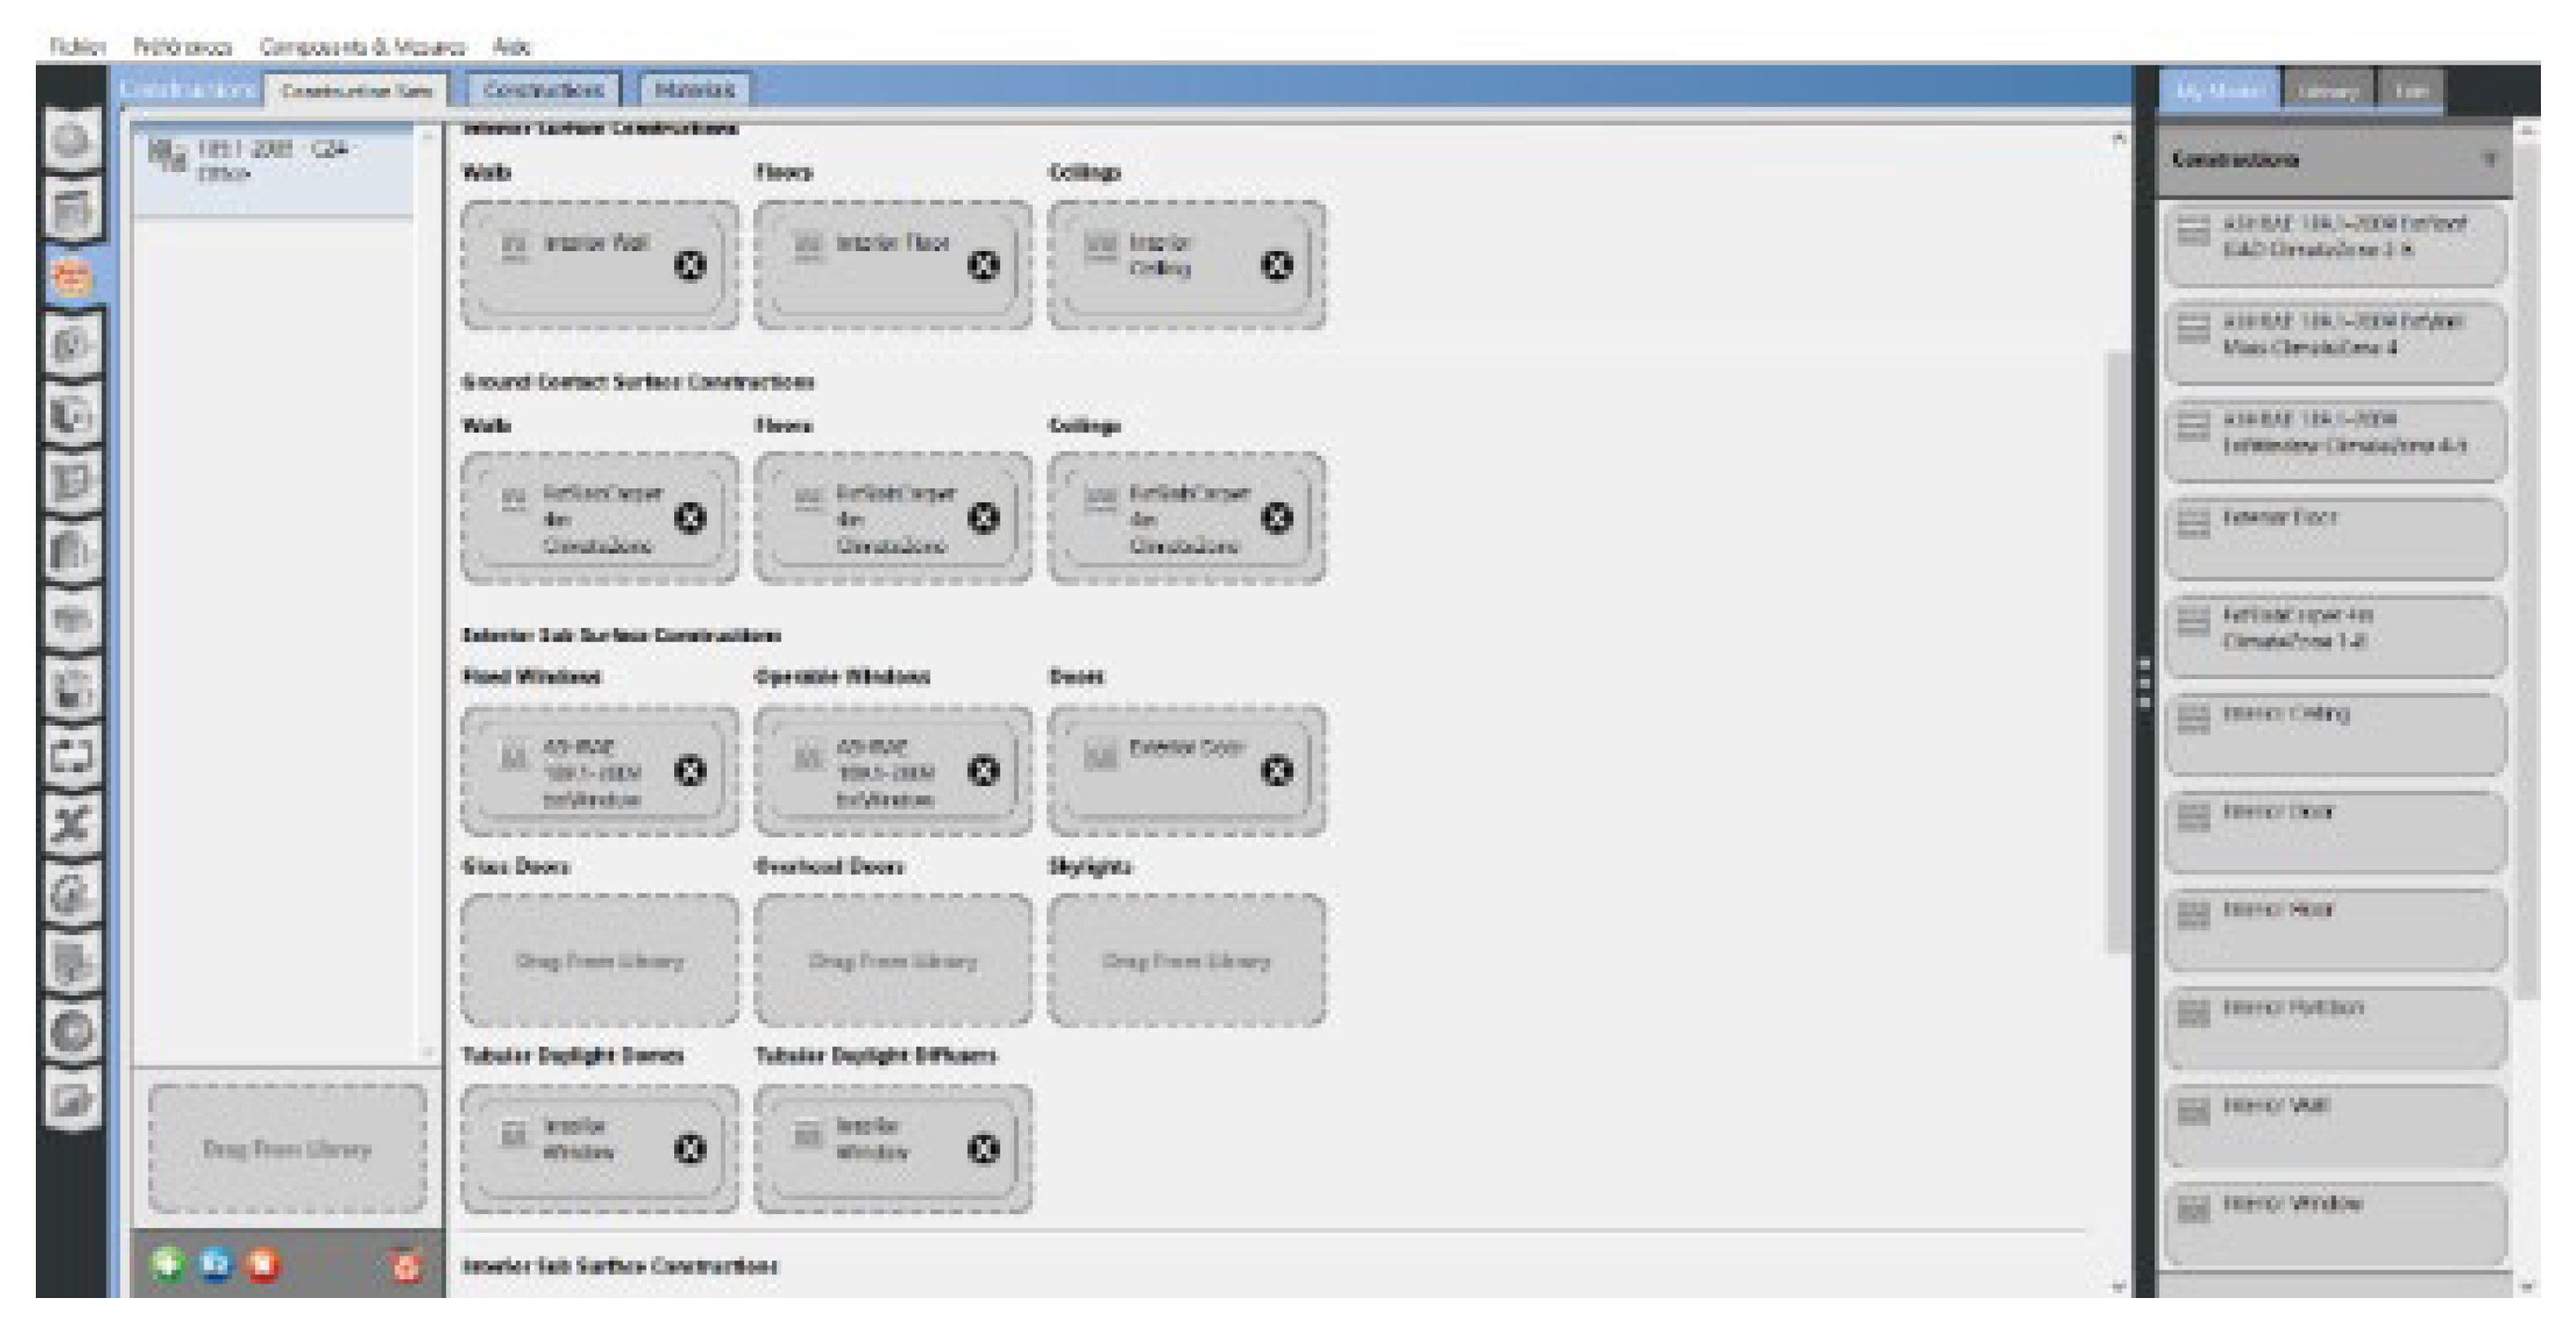
EnergyPlus is a next-generation energy analysis software that replaces BLAST and DOE-2. With the help of EnergyPlus, the building energy simulation analysis can be carried out throughout the year for the entire building. User-friendly interfaces have been developed for EnergyPlus, such as OpenStudio. It is a set of software tools that allowed the energy modeling of the entire building, including graphs create and edit in models, in order to perform simulations and display the results. The Open Studio-Standards library (Figure 2) is a collection of standard data and methods that are used to generate energy models that comply with standards.

2.2. Methodology

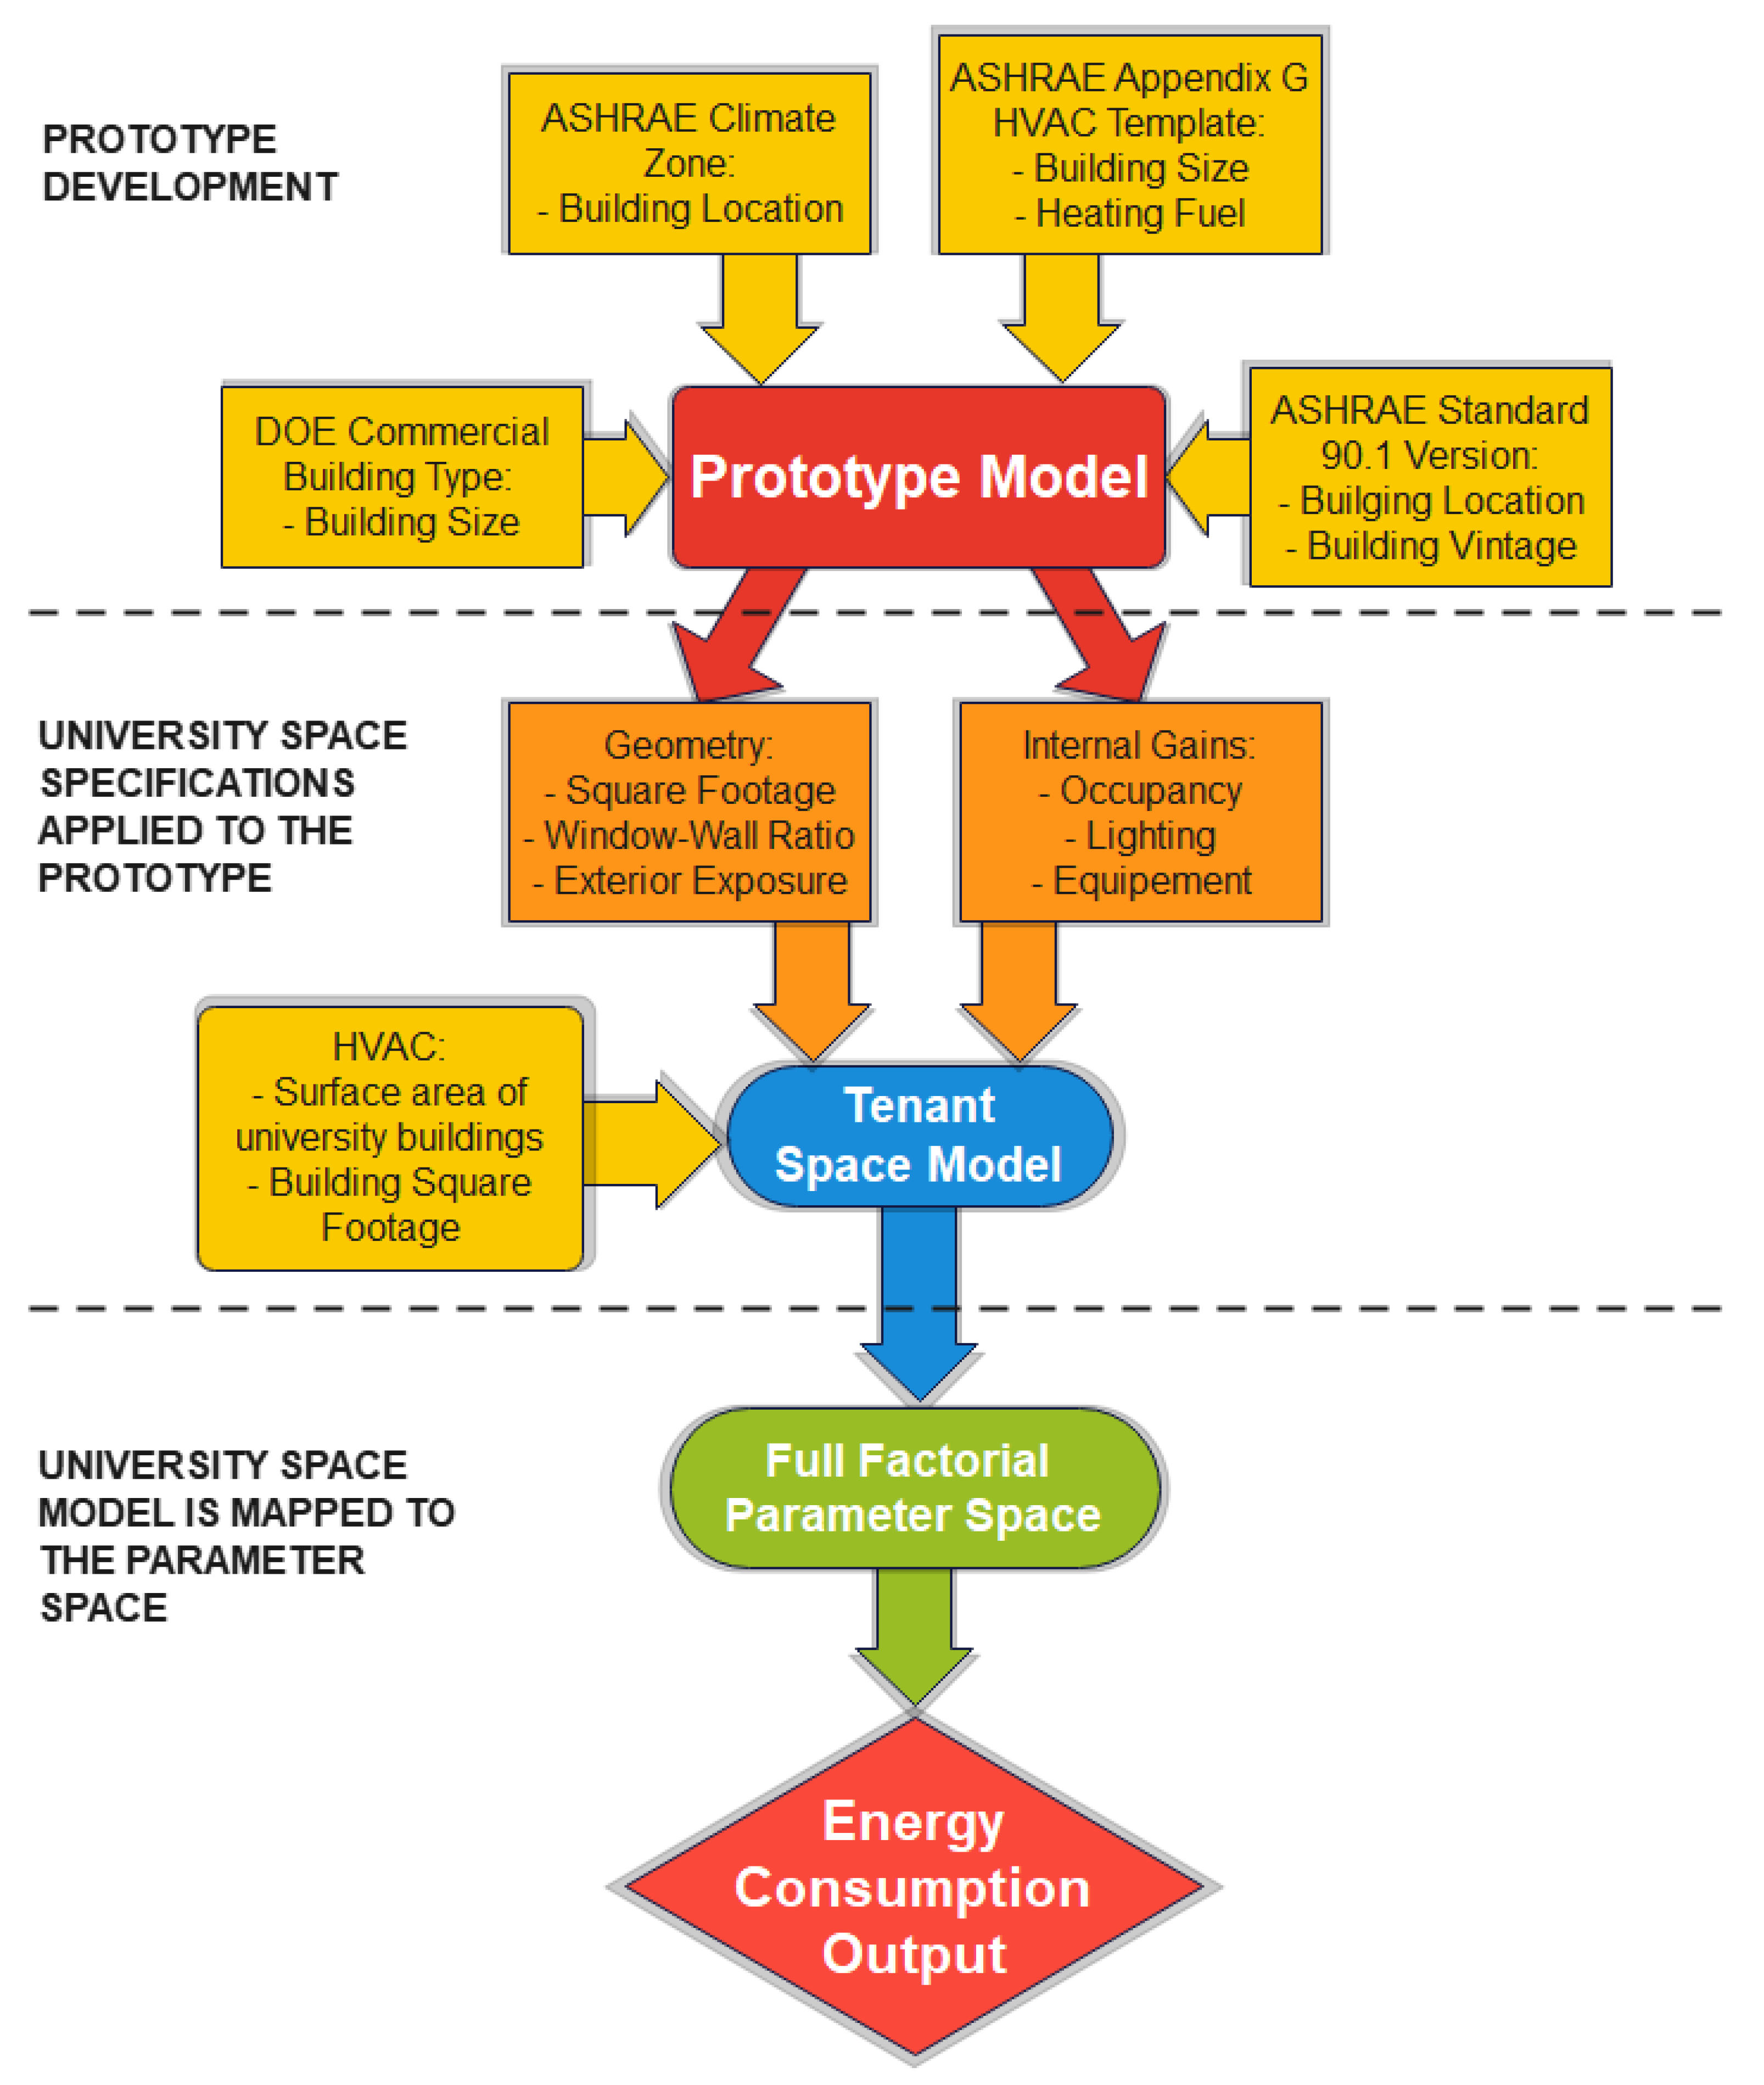
Our holistic approach to the modeling process involves simulating the building using data, a comprehensive parameter space based on ASHRAE (American Society of Heating, Refrigerating and Air-Conditioning Engineers) standards, and estimating the energy consumption of specific areas of the building. Below, we describe the overall approach to the prototype building modeling process and its compliance with OpenStudio-Standards.
Figure 3 illustrates the three main steps of our modeling process. The first step is to develop a prototype model of the academic building that follows ASHRAE standards and is customized to the building's location, age, and size. Subsequently, the prototype model is adjusted to symbolize every area by using information about its geometry, envelope properties, and internal loads. To ensure that HVAC loads are accurately estimated according to building size and function space, a series of HVAC system sizing tests is carried out. To ensure the building model performs as intended, an analysis is done on the size of the HVAC system and its internal load operation.

2.2.1. Building Modeling and Configuration

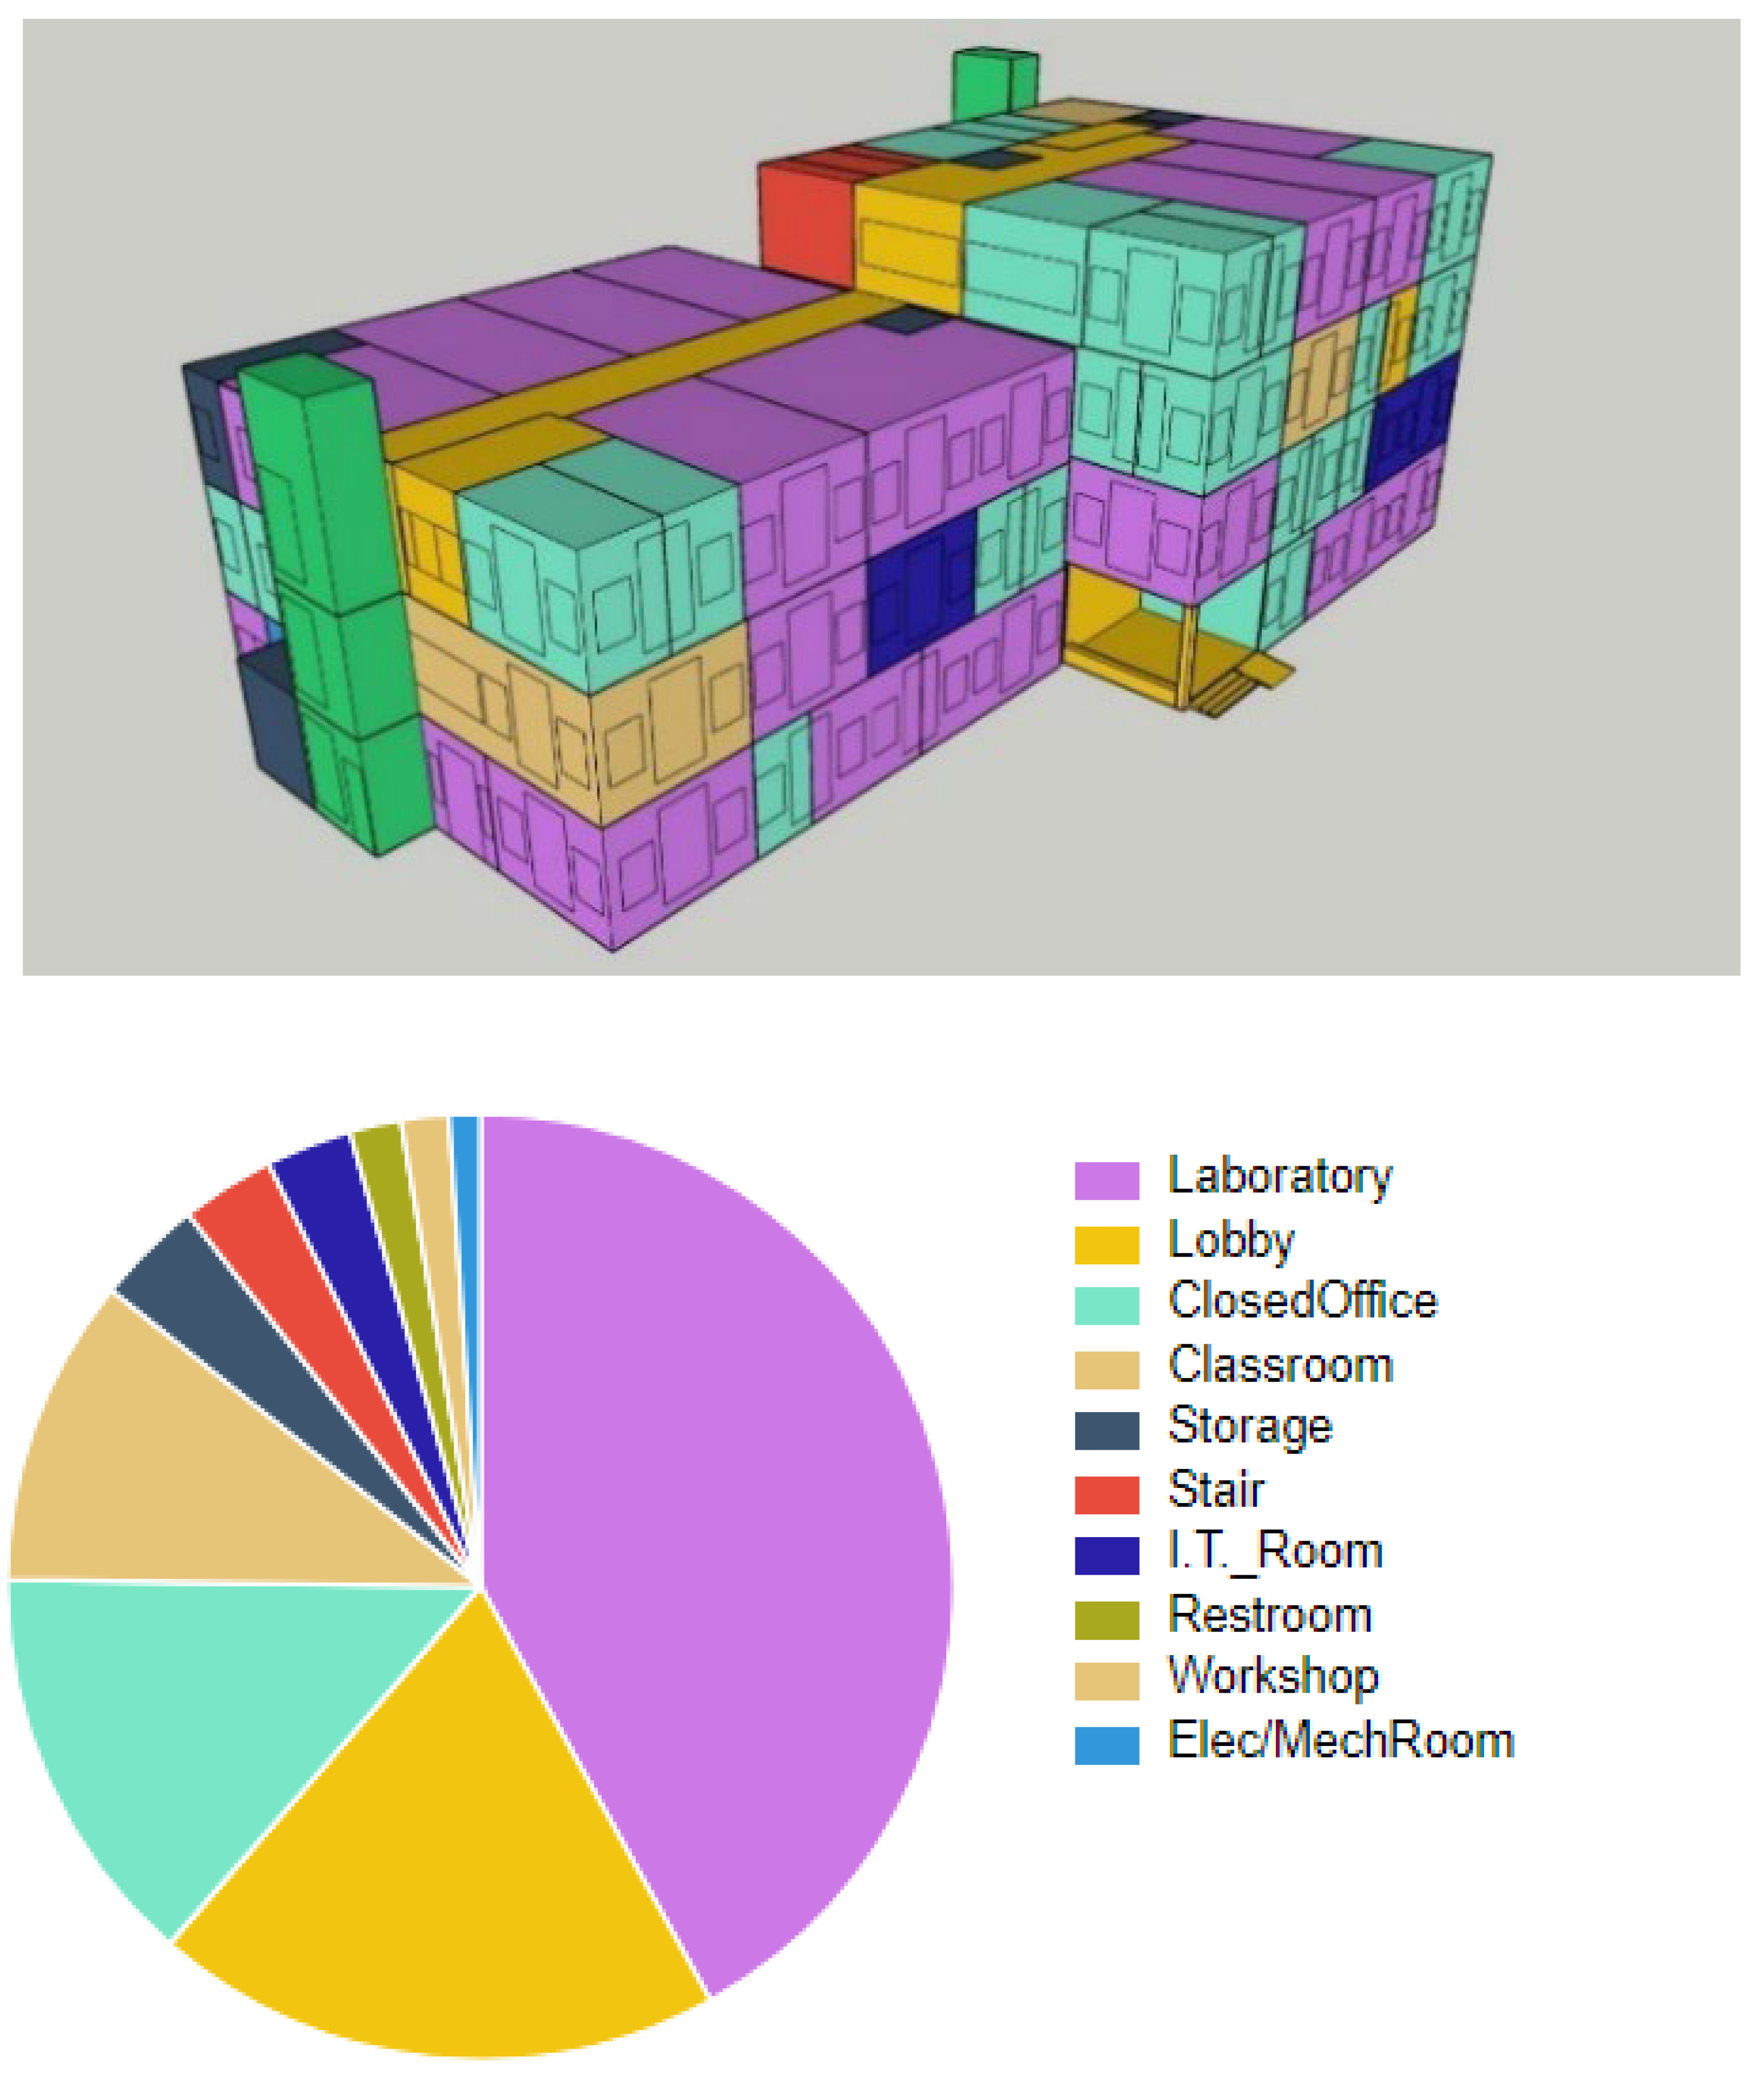
An overview of the input ranges and weights that make up the parameter space for model construction is provided in this subsection. To facilitate the energy audit of the building, we divided the building into 10 specific zones (Figure 4) based on their utility within the building, while also defining 10 thermal zones, each assigned to the 10 spaces of the building. Then, the indoor environment parameters were set. The indoor temperature is 18°C ​​and the feedback temperature is 12°C in winter. The indoor temperature is 25°C and the return temperature is 28°C in summer. Humidity control is between 10% and 90%. Next, people, light, time, electrical equipment and others were adjusted [13]. The population density is 0.04 person/m2. The personnel coefficient is 0.9. The lighting power is 5 W/m2 - 100lux. The power of the equipment is 3.58 W/m2. The schedule of the different rooms is defined according to the schedule of the teaching staff and students of the different spaces of the university building. Finally, the building envelope is adjusted to several different conditions. The heat transfer coefficient of the exterior wall is set at 0.3 and 0.2. The heat transfer coefficient of the exterior window is set at 2.2 and 2. The heat transfer coefficient of the roof is set at 0.2 and 0.1. The architectural model is shown in Figure 4.

2.2.2. Building Equipment

Lighting and equipment data are determined from building data and operating assumptions are derived from standards.

2.2.2.1. Internal Loads

The heat produced by occupants, lighting, and appliances is what constitutes internal loads. Electric lighting and electrical loads are treated separately. The density of occupancy, expressed as the number of people per floor, is calculated for the university space by dividing the number of residents occupying a space by the area of the university space. Additional checks of occupancy schedules and loads were applied during the analysis process. The following internal parameter audits ensured that these loads and schedules were reasonable and operating as intended:
  • The electrical installations follow the schedules generated from the data of the real building. For a given number of operating hours per week, the measurement generates typical internal charging programs for the university space.
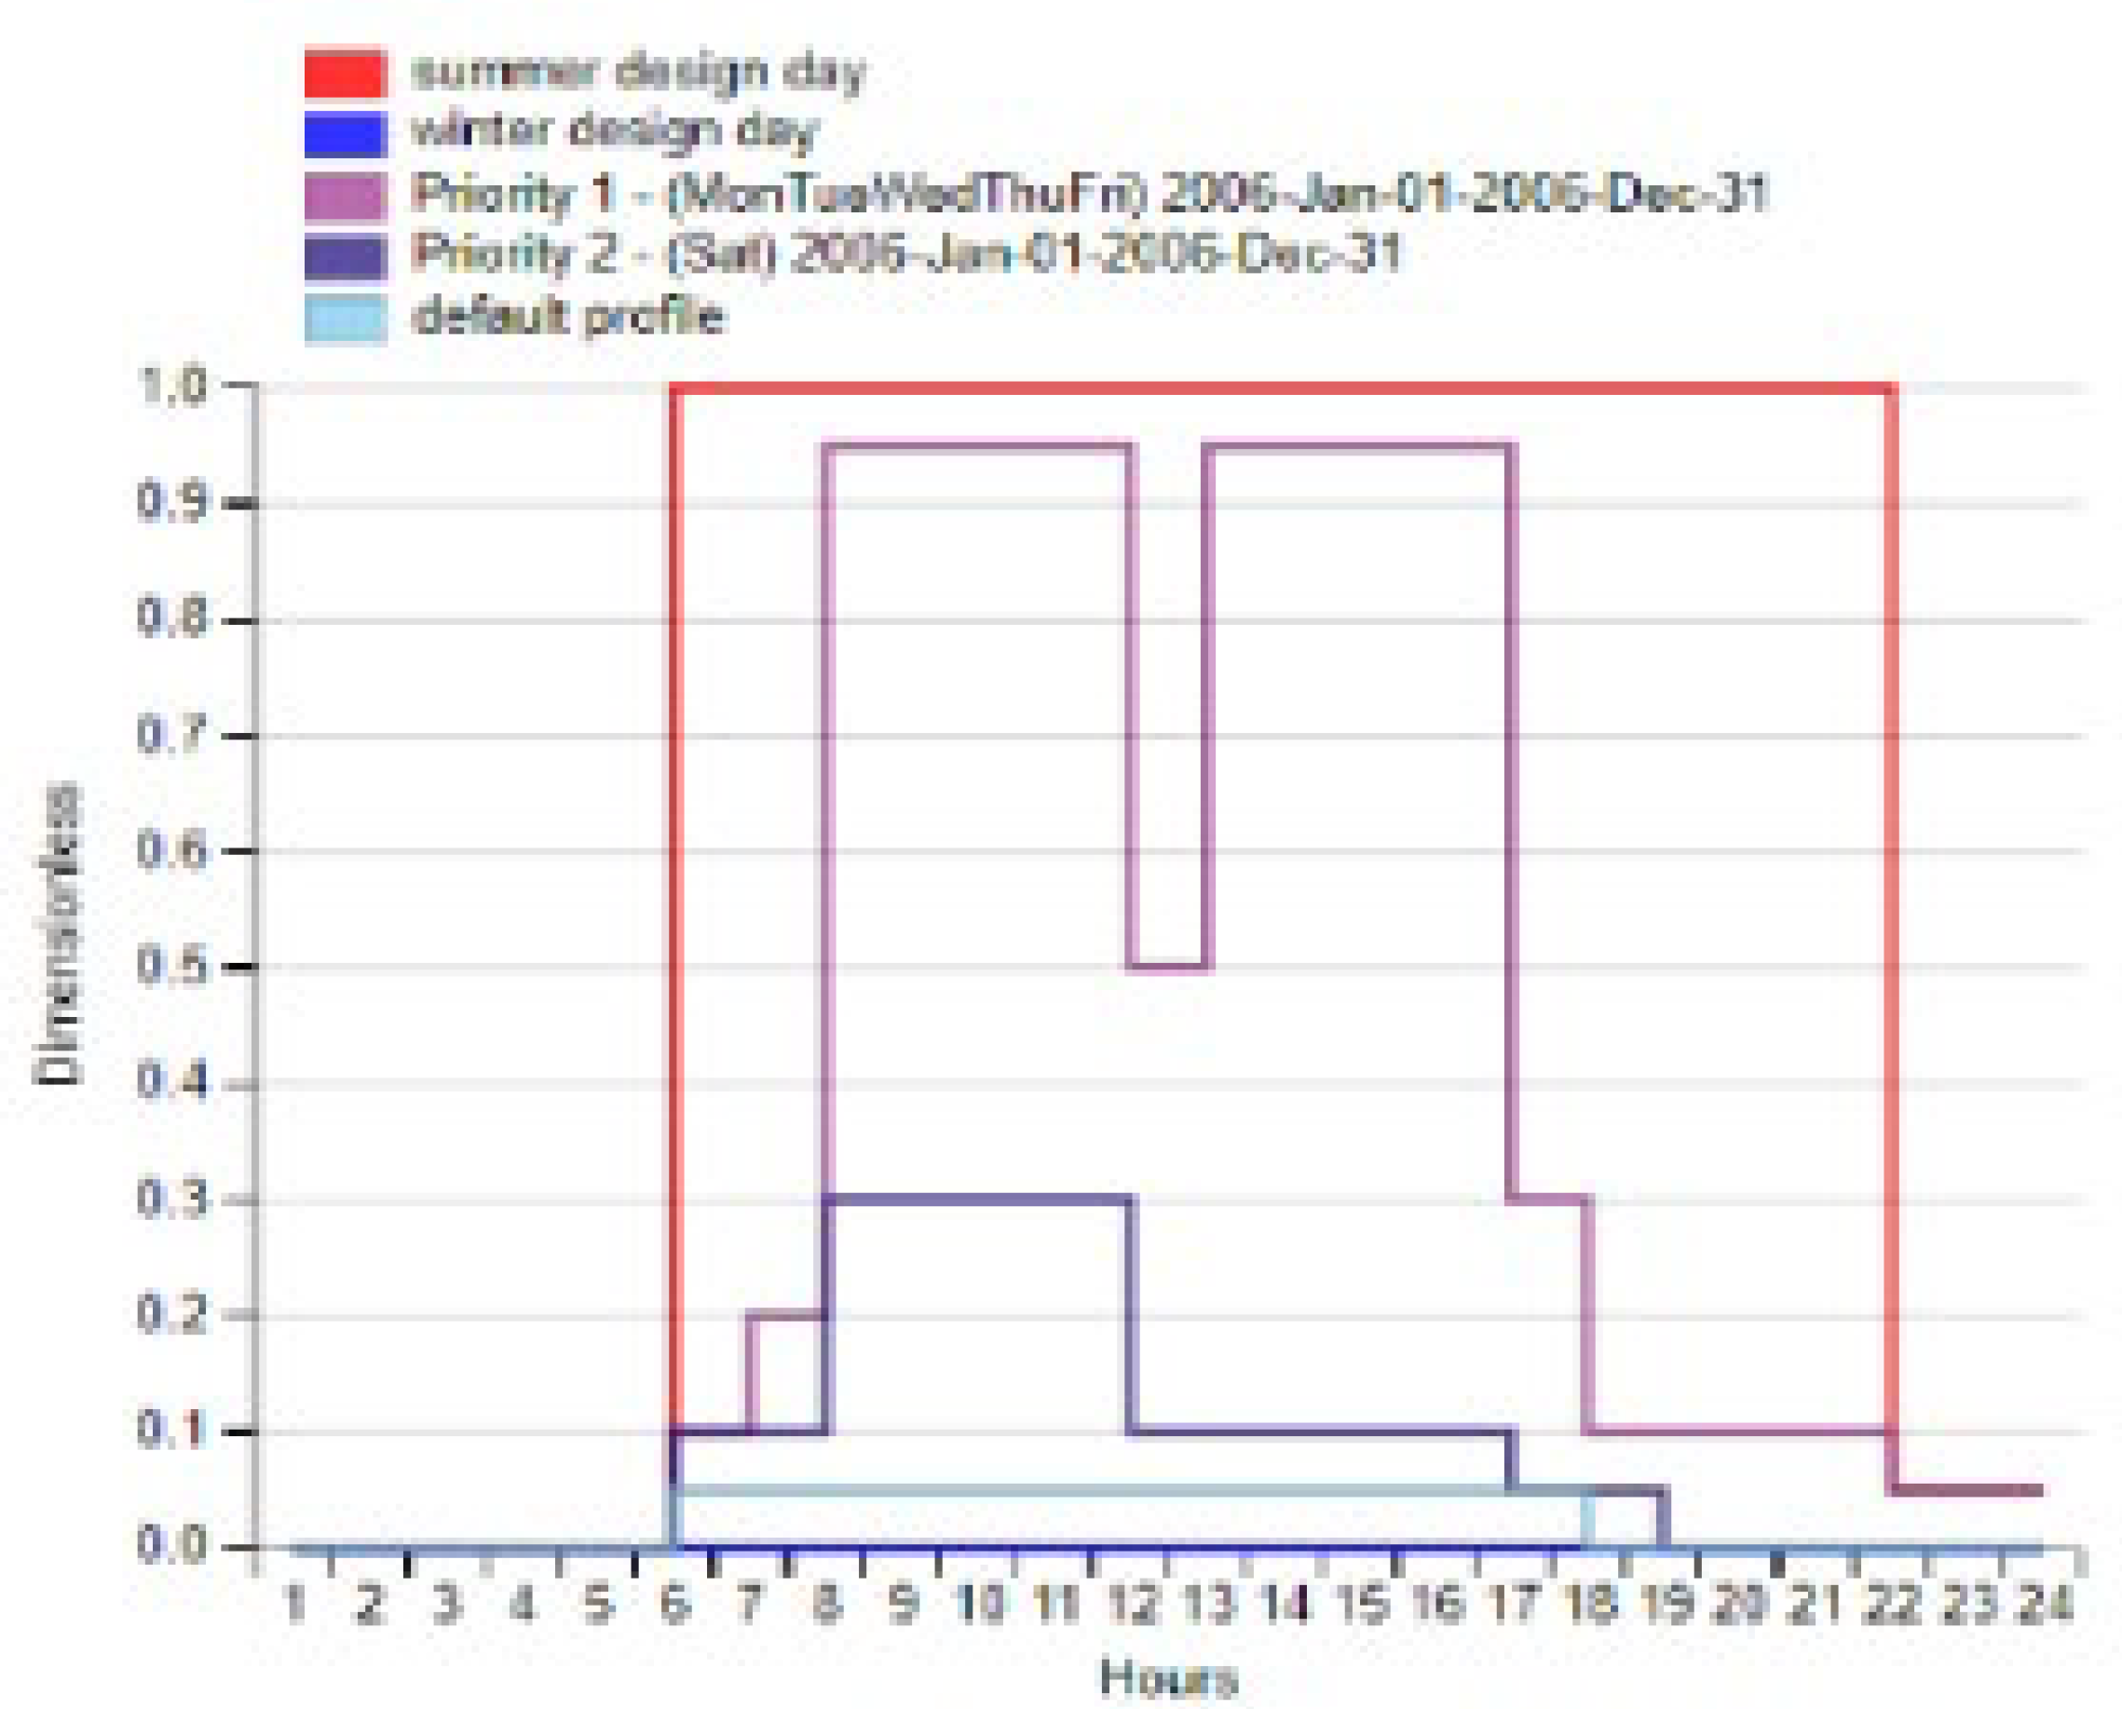
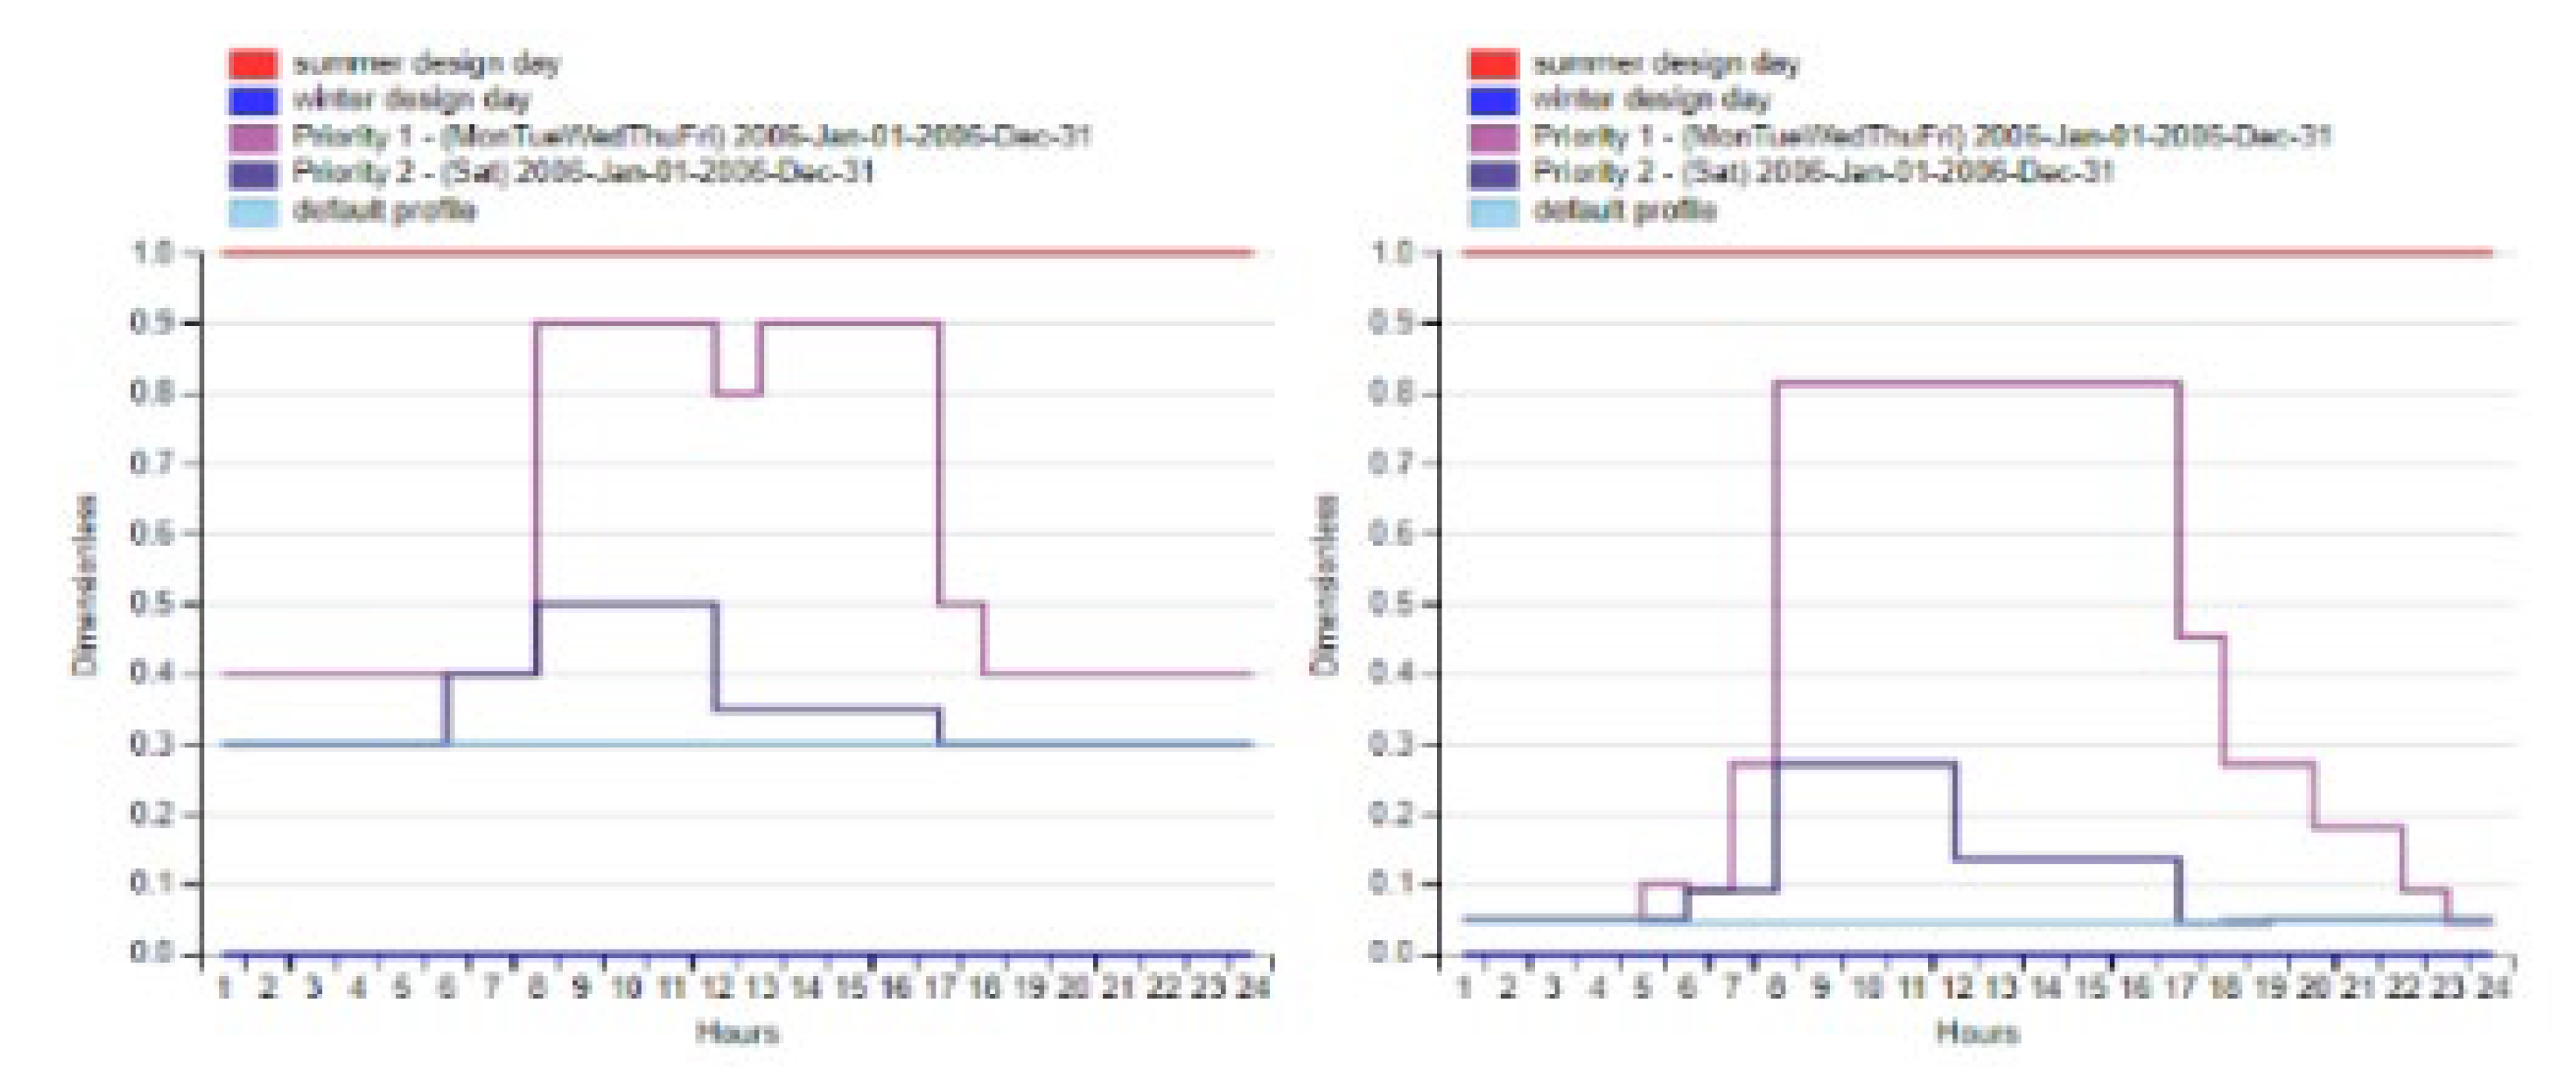
  • Figure 8 and Figure 9 display the programming of electrical equipment and occupancy for 24-hour time slots, which is discussed in the result part of this article.

2.2.2.2. Plug and Process Loads

To estimate plug loads, we used occupant information to determine the power density of equipment in each room of the building. For each type of space, the quantity of each type of equipment is defined. Equipment power is estimated according to the number of residents. Equipment schedules are created according to the number of hours of operation per week.
Equation (1) determines the PES (Power of Equipment per Surface Units) for each space in W/ft². It is expressed by multiplying the power of each device by its quantity and dividing the whole by the area in square feet of space. The Total Energy Consumption of Equipment (TECE) in kBtu can then be calculated from the PES, ground area and occupancy hours. Although performed using software, it can be accurately estimated using equation (2) below.
P E S W f t 2 = ( p e a k   p o w e r c o n v W × q u a n t i t y c o n v ) t e n a n t   f l o o r   a r e a   ( f t 2 )
T E C E = P E S W f t 2 × t e n a n t   f l o o r   a r e a   f t 2 × ( 2.59 + 0.0285 × h o u r s   p e r   w e e k + i f   h o u r s   p e r   w e e k > 60   t h e n   0.1 ,   e l s e   0 )

2.2.3. The Hypotheses

Sizing checks were performed out to determine whether the HVAC systems selected could meet the thermal loads of the building spaces. Several assumptions regarding system sizing were made and are summarized/justified below:
  • The assumption of an unoccupied building was used to size the control systems, as usually done by engineers. In practice, there is always some basic load due to lighting and equipment. Therefore, the dimensioning of these systems without base load is a conservative approach and generally results in some oversizing.
  • We used a dimensioning coefficient of 1.24 for cooling and 1.13 for heating to provide an additional safety margin under extreme conditions and avoid unusually high loads.
  • A standard sizing routine for non-matching systems has been used for all models. This means that sizing decisions for dimensioned HVAC systems are based on the zone's total distributed loads, regardless of when they occur. The adapted design is the sum of all internal loads presented in the design assuming a diversity coefficient of up to 70% for the sum of non-random loads. Inadequate sizing is also a conservative approach that can lead to oversized equipment. We analyzed system sizing using idle time, partial load factors and several other validation checks, and these results (Figure 6 and Figure 7) are presented and discussed in the following session.
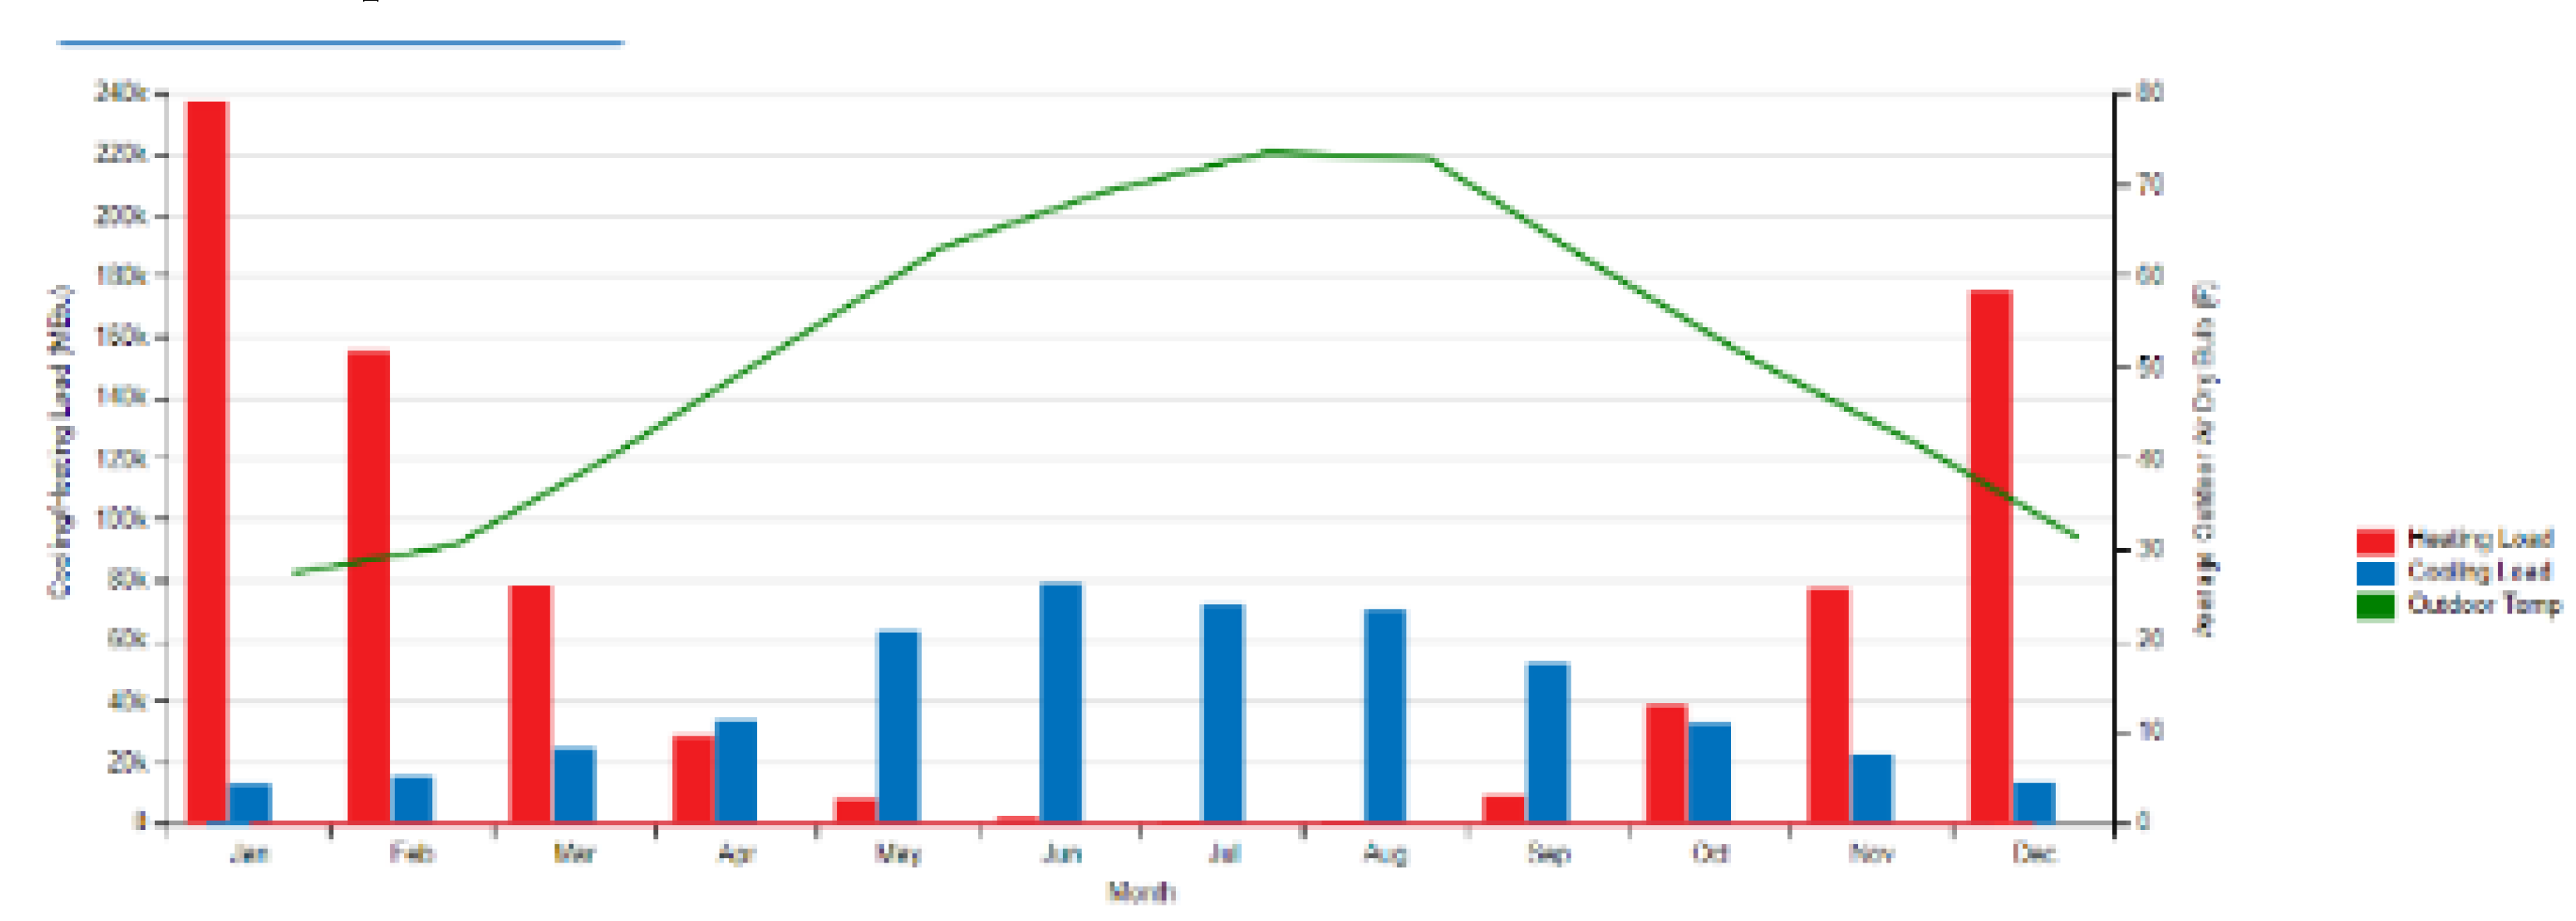
  • Validation: we checked fan pressure drops, validated the activation and deactivation of installed economizers according to heating and cooling loads, and verified the temperature-dependent energy consumption of HVAC systems and their influences. In this way, we estimated HVAC energy consumption as a function of temperature: to ensure that the HVAC systems were operating as intended and responding correctly to the outside temperature of the two climate zones (Figure 6 and Figure 7), we followed the consumption of the regulators in relation to the ambient air temperature for each space and the type of regulators. This created a direct relationship between outside temperature and energy for cooling and vice versa for heating.

3. Results

An analysis of energy consumption was carried out on the building structure. In our model, in the case of the building in "Iasi", we have integrated two energy sources. The structure of the primary energy source is closely linked to the type of heating/cooling system in this case. In the case of the model in the city of Lome, our building has only one source for cooling throughout the year. The diagrams (Figure 5a,b) show at a glance the energy consumption data from the primary energy source for the two climate zones. This is categorized according to the energy demand and activity of each building space.
Figure 5. Diagram of energy consumption needs: (a) Iasi & (b) Lome.
Preprints 106753 g005
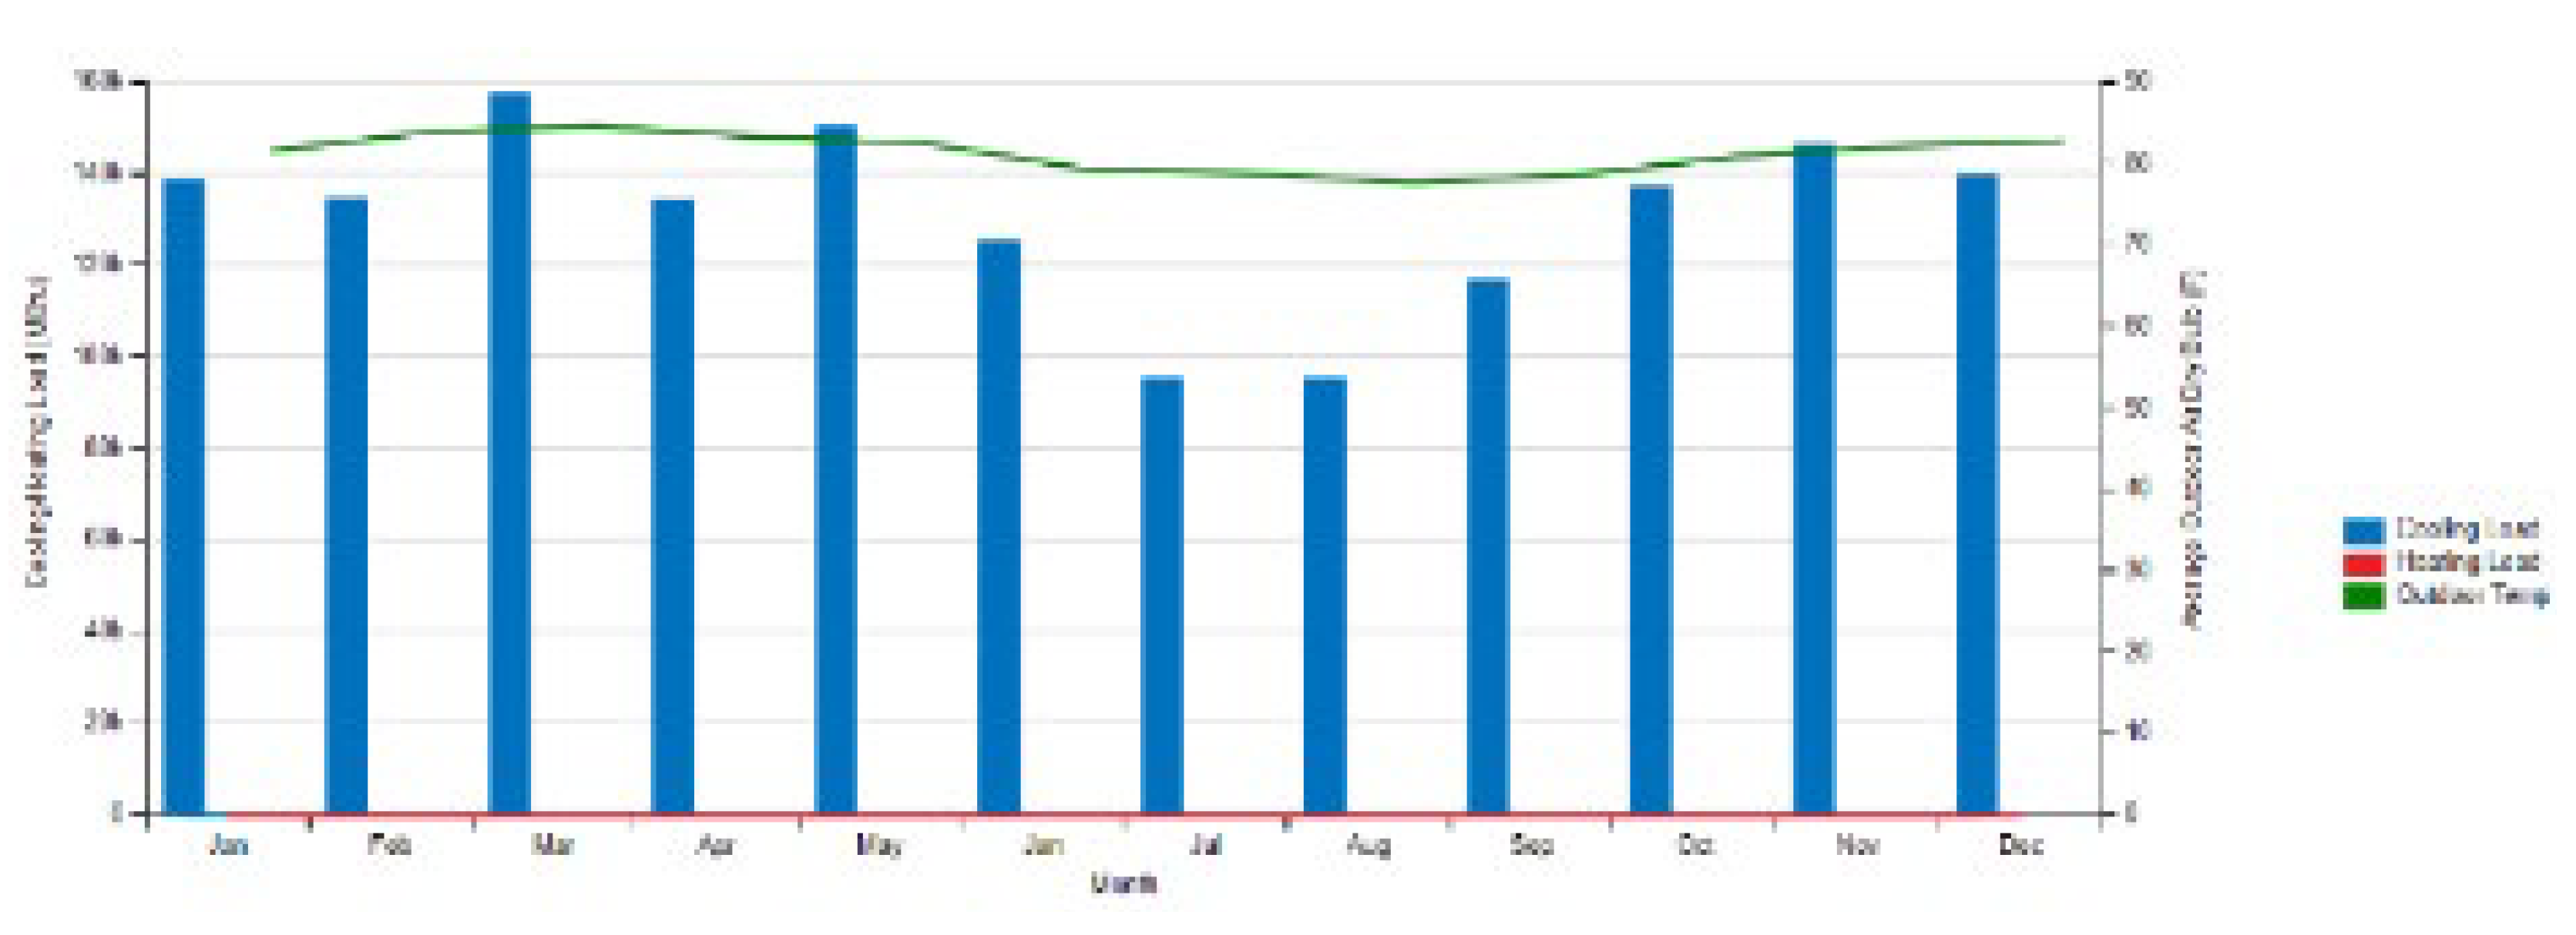
Thanks to our assumptions about these systems, we were able to estimate HVAC energy consumption as a function of temperature: Figure 6 shows the evolution of consumption from electrical and thermal equipment in Iasi, Romania. We are convinced that heating energy is higher than cooling. On the other hand, Figure 7 shows the evolution of model consumption in Lomé, Togo. This model uses a system that alternates between cooling and electric heating and requires energy only to cool the spaces in this area.
Due to the complex nature of access to information on these control systems and their inability to be accessed by the occupants, the latter do not have detailed information. For this purpose, HVAC systems predetermined in OpenStudio are assigned according to building size, in accordance with the guidelines of Appendix G of ASHRAE Standard 90.1 [14]. This approach simplifies the model and reduces the workload. However, analyzing the spatial energy consumption of these systems as part of a larger system poses additional challenges. Due to the uncertainties associated with HVAC systems, the online tool provides a range of annual HVAC energy consumption.
Figure 6. HVAC system energy consumption as a function of building temperature in the continental zone.
Preprints 106753 g006
Figure 7. Energy consumption of the HVAC system according to the temperature of the building in the tropical zone.
Preprints 106753 g007
Below (Figure 8 and Figure 9) we have the programming of equipment, lighting and occupancy for 24-hour time slots. This has enabled us to obtain reasonable internal loads and time slots, which operate as planned. Figure 8 shows the parametric occupancy schedule for a working week. This schedule assumes short working days from Monday to Friday and low occupancy on Saturdays and Sundays. Figure 9 shows the lighting schedule for a busy day. Some equipment is used on low traffic days. However, we are far from the maximum capacity.
Figure 8. Occupation program with priority days and seasons.
Preprints 106753 g008
Figure 9. Parametric lighting program and electrical equipment based on space occupancy over a 24-hour time slot.
Preprints 106753 g009
Interior lighting was defined by considering the luminous flux received per unit area according to the type of space in the building, with an estimate of around 5 W/m2. Our model was dimensioned with standard equipment for the proper functioning of the different types of spaces in the building, ranging from electrical equipment for offices, to installation standards for laboratory and classroom equipment.
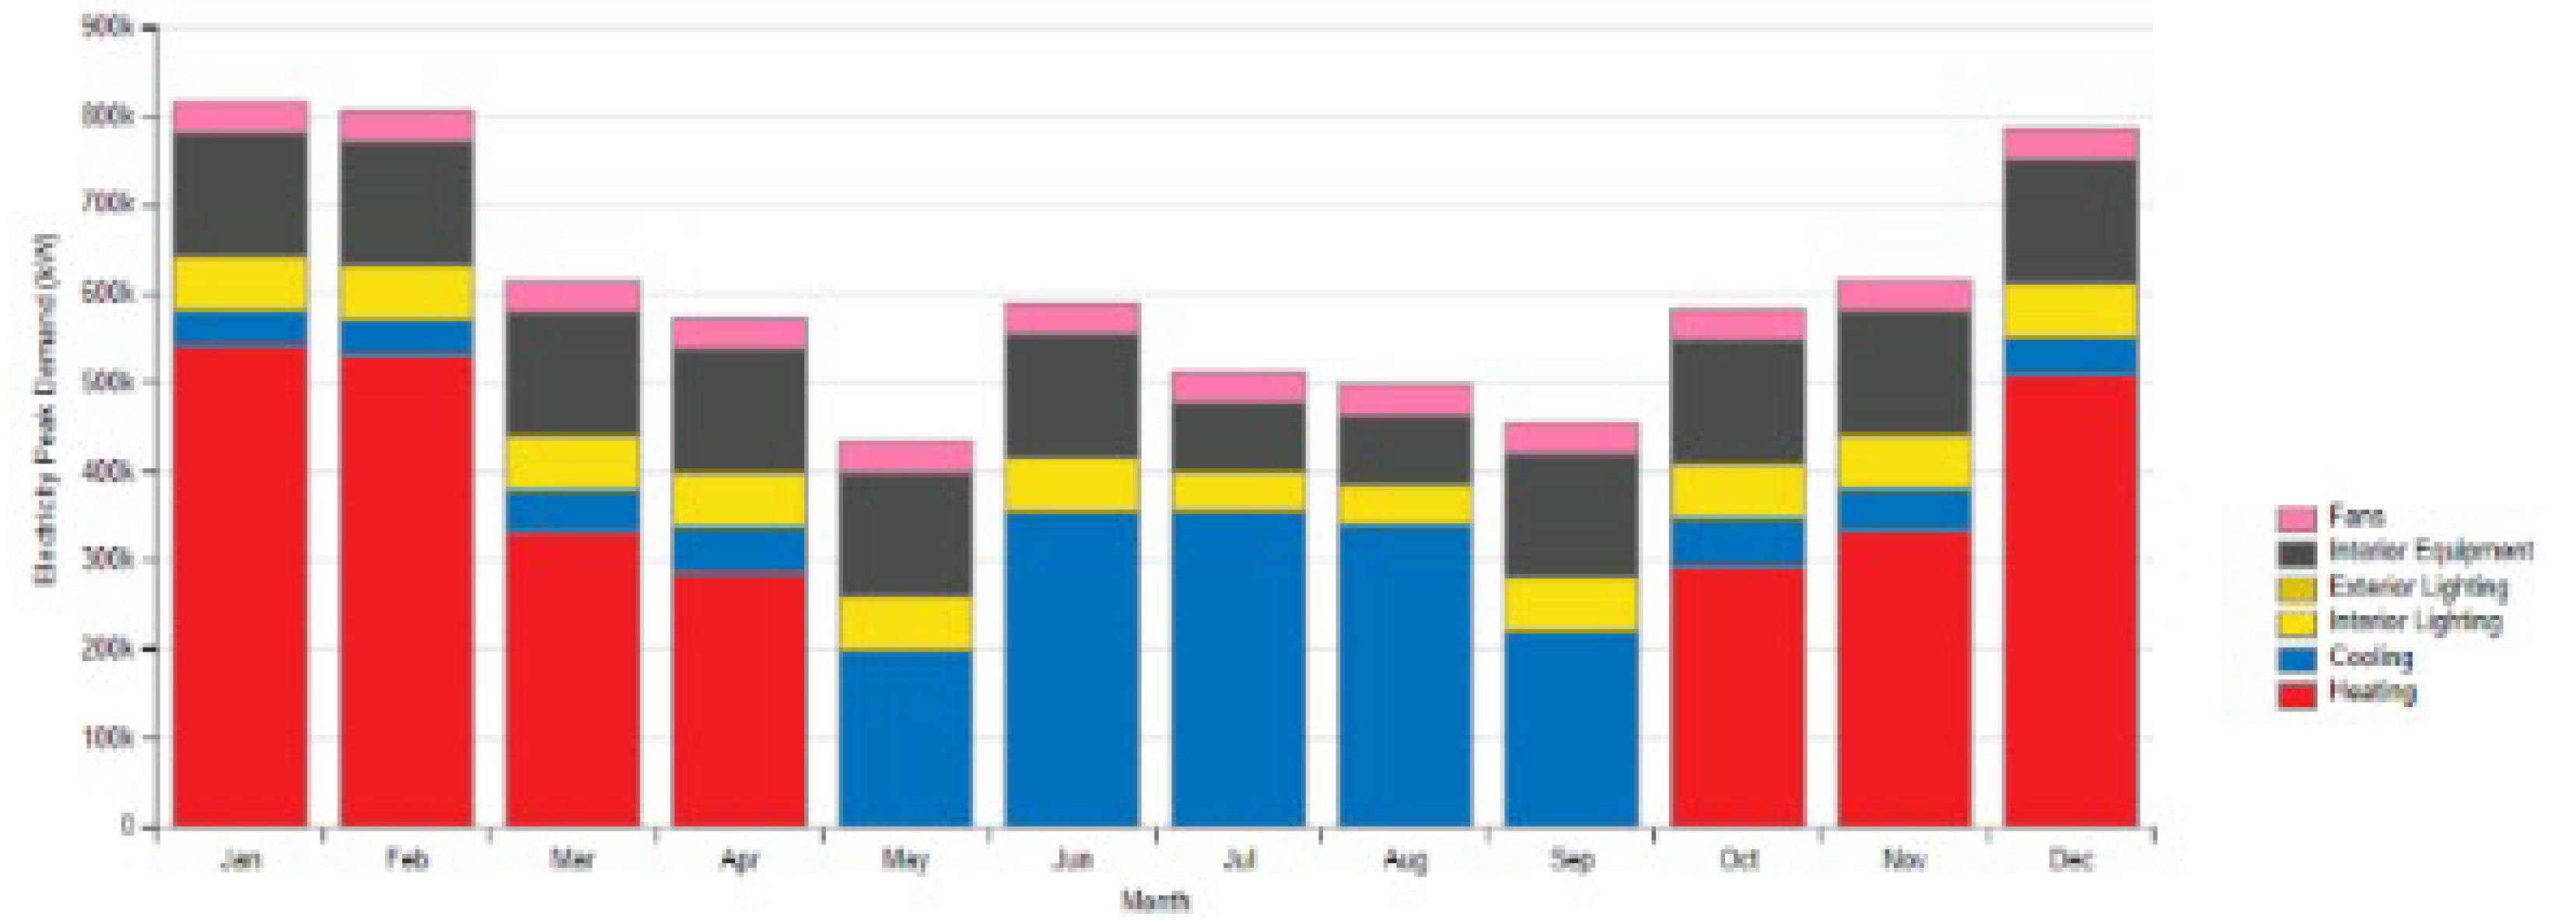
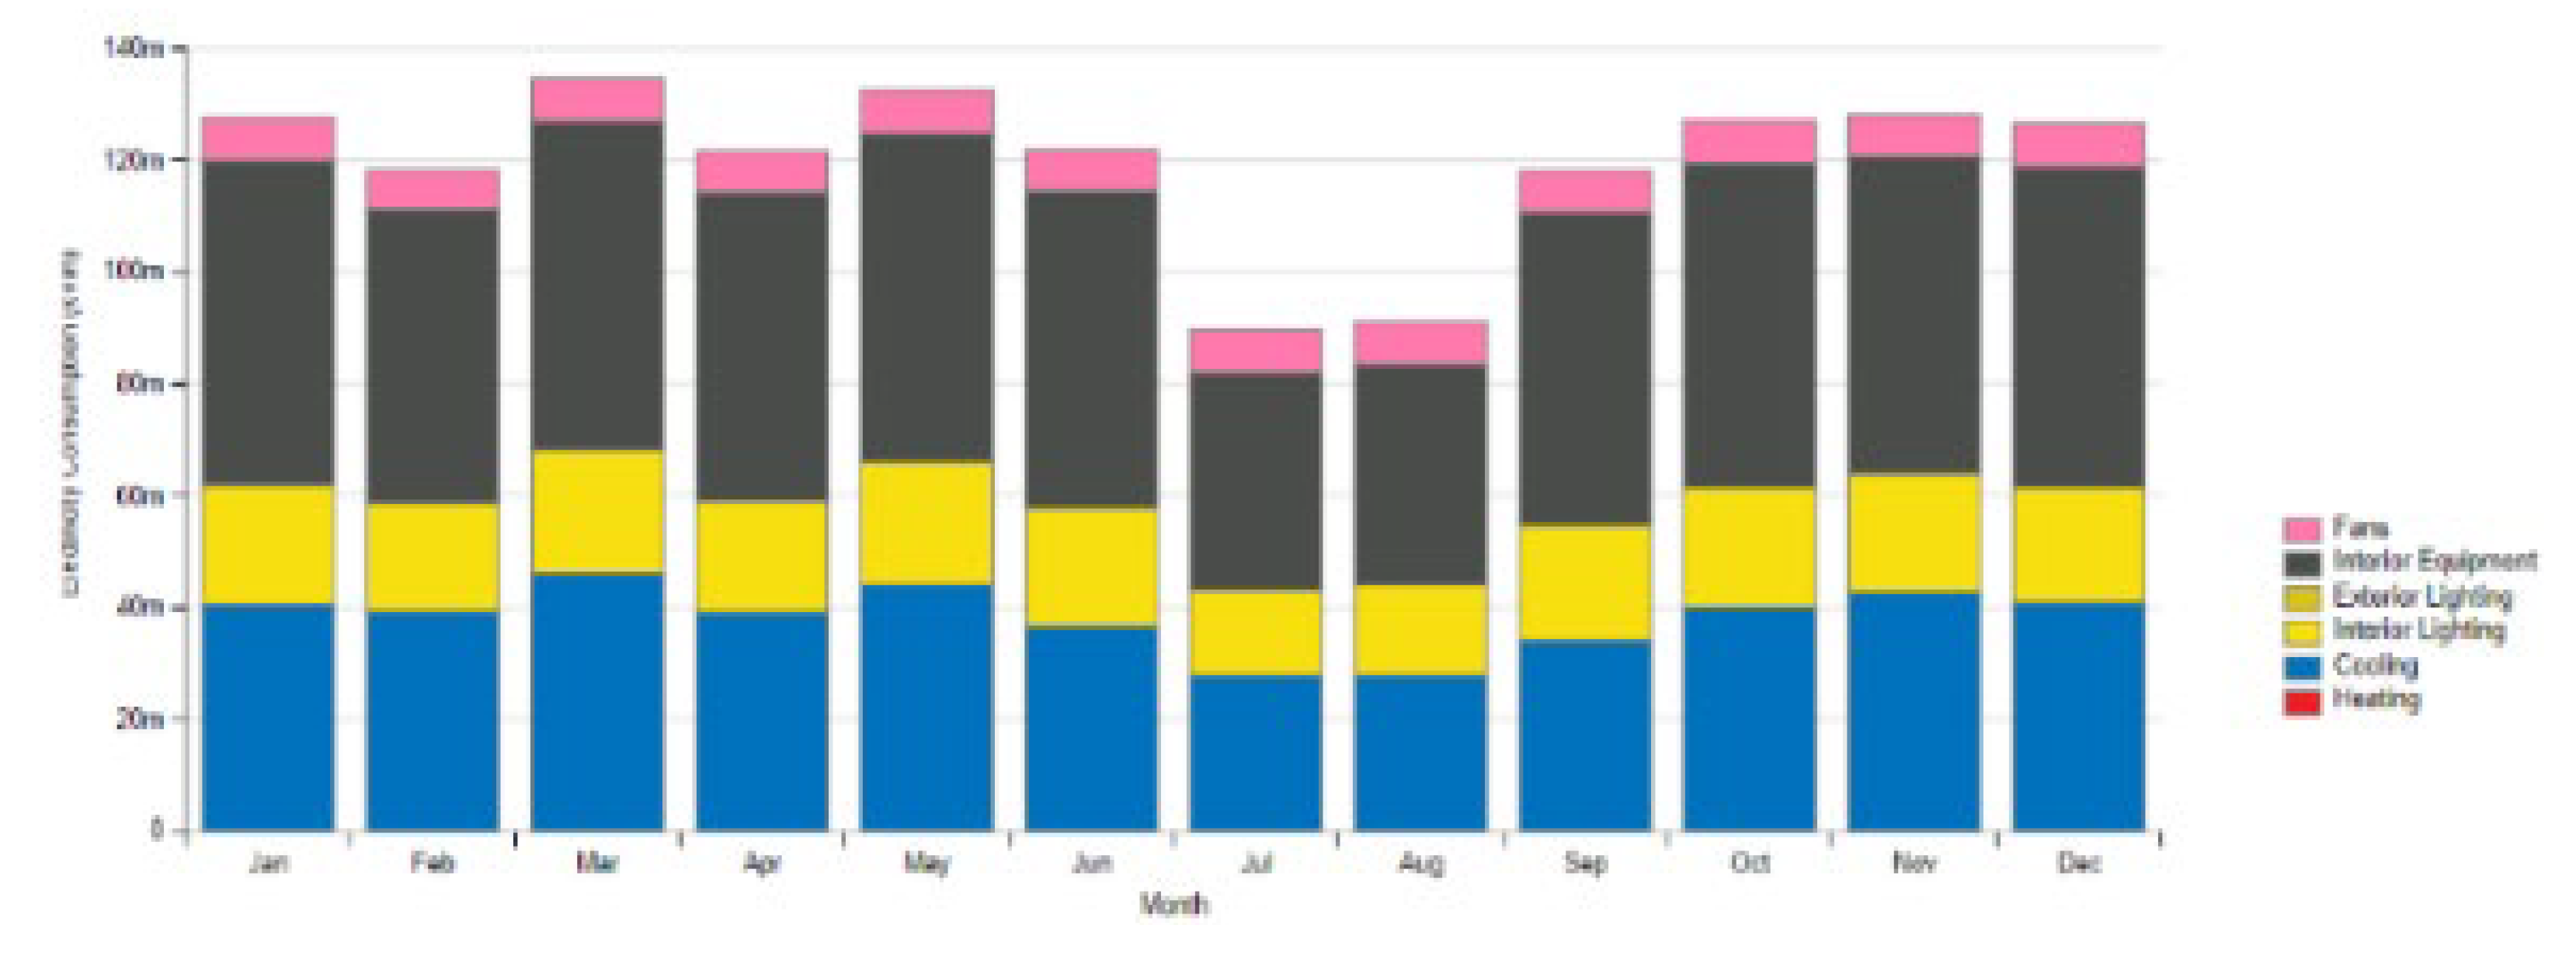
With our hypothesis applied to the model, we find that the climatic conditions experienced by the building have a significant impact on heating and cooling requirements and on the evolution of the building's overall electricity consumption. This in turn affects the building's energy performance. In Figure 10, we can see that the city of Iasi has a percentage of energy demand and expenditure that fluctuates according to the winter and summer seasons in the region.
On the other hand, when the model is subjected to the climatic constraints of the city of Lomé (Figure 11), we observe a reversal of the trend in building energy requirements in terms of comfort and use of electrical equipment. This means that in the case of Lomé, electrical equipment requires much more power to operate optimally than in the case of Iasi. In fact, electrical appliances are constantly exposed to heat, and thermal conditions are unfavorable to the proper operation of electrical equipment, resulting in poor performance and reduced efficiency. Energy consumption for HVAC systems is higher in Iasi than in Lomé, with a difference of 20% for the same electrical equipment used.
We then carried out an analysis of the factors influencing energy consumption by region. In this study, data were collected from meteorological files and design days for each climatic zone. [15] used correlation analysis to assess the degree of correlation between factors influencing energy consumption, power demand and the point of operation of a control system. This correlation coefficient is the covariance of two variables divided by the product of their standard deviations. Equation (3) shows the calculation of the correlation coefficient based on the variables of our model:
ρ = C o v x , y D x D y
The value of ρ is between -1 and 1, where 1 indicates a positive linear correlation, while -1 indicates a negative correlation. Then, a validation phase was implemented to determine if the coefficient is representative. A relationship between lighting and energy consumption was calculated using equation (3), yielding a value of 0.775. This is close to 1, indicating a strong influence of the number of openings, window location and shading devices on the level of lighting inside the building. In fact, all orientations provide natural lighting, but it is preferable to position openings so that the sun can penetrate the building when it is most needed. What's more, natural light is neither fixed nor always equal in quality and intensity, depending on orientation. This is confirmed by the study by [16], who reduced the energy consumption of a university building by automatically controlling lighting according to the amount of sunlight entering the rooms.
An observation of Figure 6 and Figure 7 shows that the power demand of HVAC systems evolves with setpoint temperature. For HVAC system energy consumption, analysis of HVAC system energy consumption intensities (Figure 6 and Figure 7) shows that it depends directly on occupancy level, and secondly on surrounding weather conditions. [17] studied the correlation coefficient of the influencing factors and found that the coefficient of heat sources was higher than that of cooling sources in a university building. These other tests are consistent with our results. For the histograms (Figure 10 and Figure 11), the evolution of energy consumption is mainly explained by the local climatic conditions to which the building is exposed in each zone. As space increases, efficiency requirements also increase, as energy production has a greater impact on the environment. Therefore, a sizing control system based only on the size of the occupied space will result in less accurate energy evaluation results. For a more accurate assessment of the total consumption of regulators, we performed a full sizing cycle for all spaces and performed measurements to extract system efficiency values to replace efficiency within the space sizing cycle. The only limitation of this new approach is that the space of the building may not work exactly at the same partial load ratio as all spaces.
With regard to the relationship between occupancy and electrical energy consumption, following the monthly consumption peaks and using equation (3), the strength of the relationship between occupancy and energy consumption is 0.870, indicating a strong positive correlation for this factor. The influence of this factor is significant irrespective of the two climatic zones (Figure 9). Ambient heat tends to increase the power required by air conditioners to maintain a cool temperature in the space, and vice versa for heating units when it's winter time. In our model, spaces covering a large area consume the most energy. Part of this energy expenditure is due to the artificial lighting systems installed, but the vast majority of consumption is due to the use of equipment by the occupants of these spaces. Simulations carried out in both zones show that 75.6% of the overall variation in energy consumption is directly linked to the occupancy of building spaces. Note that for a fixed building, the performance of its envelope structure is fixed, but not the behavior of its occupants. In the work of [18], they proposed new parameters for building correlation models between energy consumption and user behavior to predict energy consumption in university buildings. They were able to predict the evolution of consumption as a function of occupant behavior. The evolution of energy consumption is directly linked to occupant behavior in terms of energy use and management.
With the electrical equipment used, the change in energy consumption is basically generated by commissioning and adjustment by the occupants, and is therefore also linked to occupant behavior. After analyzing the results, it was found that 70% of the total variation in energy consumption was explained by the equipment used in the occupants. This is close to the value reported by [17], who used the Pearson coefficient to measure the impact of household appliances on a university’s energy consumption.
In both climatic environments, power demand varies throughout the day and across the seasons, with variations of 20% for equipment and almost 30.76% for HVAC systems. A comparative analysis of the results of the two case studies leads to the same conclusion. This means that, in most cases, the parameters affecting building consumption are more closely linked to the discomfort felt by occupants. Thus, [19] showed in a study that the correct determination of the setpoint temperature of an HVAC system can significantly reduce operating temperatures. These reductions can lead to a significant decrease in heat discomfort and improve energy efficiency.

5. Conclusions

Against a backdrop of dwindling fossil fuel resources and high energy requirements, buildings are potential sources of energy savings, particularly with heating, air conditioning, water, lighting and industrial process systems. Hence the importance of identifying them and finding solutions to optimize consumption and reduce bills. In this study, we used actual building energy consumption data from two different climate zones to compare and analyze the overall energy consumption levels and influencing factors of the university building. The results show that:
The average annual energy consumption per unit area of buildings in the two regions shows a significant discrepancy, which is mainly due to the electrical power requirements of HVAC systems. Indeed, simulations show that the greater the fluctuation in building temperature, the greater the energy required by HVAC systems to maintain temperature at the set point to ensure occupant comfort.
The space required for residents and the type of regulator used are the main factors that influence the consumption of this university model. With simulation scenarios, impacts of other factors, such as: lighting level, construction age (materials), type of heat source and building levels, are negligible in terms of consumption with good building insulation and the installation of devices to prevent energy loss. The power required by HVAC systems has a significant impact on consumption and is highly dependent on occupant comfort, but these systems can be integrated with other building management systems to meet national and international green and environmental energy efficiency targets.
Further research is needed in this area. The age of construction reflects the building's level of insulation, and new thermal standards can be defined to improve the energy performance of new buildings, adapting á to different climatic regions. The mechanisms that affect the number of floors in buildings are not yet clear, and require further study.

Acknowledgments

The AUF's Eugene Ionescu Mobility Program has been instrumental in facilitating and promoting cooperation between the universities to which they belong, and the authors express their gratitude.

References

  1. « World energy demand will increase 50% by 2050: EIA ». Viewed on: June 23, 2023. [Online]. Available on: https://www.aa.com.tr/en/energy/oil/world-energy-demand-will-increase-50-by-2050-eia/33749.
  2. A.Boyano, P. Hernandez, et O. Wolf, « Energy demands and potential savings in European office buildings: Case studies based on EnergyPlus simulations », Energy Build., vol. 65, p. 19-28, oct. 2013. [CrossRef]
  3. H. Fan, I. F. MacGill, et A. B. Sproul, « Statistical analysis of driving factors of residential energy demand in the greater Sydney region, Australia », Energy Build., vol. 105, p. 9-25, oct. 2015. [CrossRef]
  4. K. Steemers et G. Y. Yun, « Household energy consumption: A study of the role of occupants », Build. Res. Inf., vol. 37, no 5-6, p. 625-637, nov. 2009. [CrossRef]
  5. Y. Kwan et L. Guan, « Design a Zero Energy House in Brisbane, Australia », Procedia Eng., vol. 121, p. 604-611, dec. 2015. [CrossRef]
  6. V. Shabunko, C. M. Lim, et S. Mathew, « EnergyPlus models for the benchmarking of residential buildings in Brunei Darussalam », Energy Build., vol. 169, p. 507-516, 18. 20 June. [CrossRef]
  7. S. Yu, Y. Cui, X. Xu, et G. Feng, « Impact of Civil Envelope on Energy Consumption based on EnergyPlus », Procedia Eng., vol. 121, p. 1528-1534, Jan. 2015. [CrossRef]
  8. A.Al-Saggaf, H. Nasir, et T. Hegazy, quantifying the impact of architectural design features on building cost and performance in hot weather 2017.
  9. R. A. Mangkuto et al., « Design Optimisation of Fixed and Adaptive Shading Devices on Four Façade Orientations of a High-Rise Office Building in the Tropics », Buildings, vol. 12, no 1, Art. no 1, Jan. 2022. [CrossRef]
  10. T. de Meester, A.-F. Marique, A. De Herde, et S. Reiter, « Impacts of occupant behaviours on residential heating consumption for detached houses in a temperate climate in the northern part of Europe », Energy Build., vol. 57, p. 313-323, Feb. 2013. [CrossRef]
  11. C. I. Ezeh, Y. Hong, W. Deng, et H. Zhao, « High rise office building makeovers—Exploiting architectural and engineering factors in designing sustainable buildings in different climate zones », Energy Rep., vol. 8, p. 6396-6410, nov. 2022. [CrossRef]
  12. A.E. Stagrum, E. Andenæs, T. Kvande, et J. Lohne, « Climate Change Adaptation Measures for Buildings—A Scoping Review », Sustainability, vol. 12, no 5, Art. no 5, Jan. 2020. [CrossRef]
  13. R. De Dear, « Recent enhancements to the adaptive comfort standard in ASHRAE 55-2010 », in Proceedings of the 45th annual conference of the Architectural Science Association, Sydney, Australia, Citeseer, 2011, p. 16-19.
  14. S. Goel, M. I. Rosenberg, et C. Eley, « ANSI/ASHRAE/IES Standard 90.1-2016 Performance Rating Method Reference Manual », Pacific Northwest National Lab. (PNNL), Richland, WA (United States), PNNL-26917, sept. 2017. [CrossRef]
  15. Y. Zhifa et Z. Jingyu, « Multivariate statistical analysis ». Science Press, Beijing, China, 2002.
  16. E. Piotrowska et A. Borchert, « Energy consumption of buildings depends on the daylight », E3S Web Conf., vol. 14, p. 01029, 2017. [CrossRef]
  17. N. Hussin et R. Mohd Said, « analysis of influence factors affecting the energy consumption in technology campus, utem », Malays. Constr. Res. J., vol. 32, p. 29-36, dec. 2020.
  18. C. Zhang, T. Zhao, et K. Li, « Quantitative correlation models between electricity consumption and behaviors about lighting, sockets and others for electricity consumption prediction in typical campus buildings », Energy Build., vol. 253, p. 111510, dec. 2021. [CrossRef]
  19. S. Alghamdi, W. Tang, S. Kanjanabootra, et D. Alterman, « Effect of Architectural Building Design Parameters on Thermal Comfort and Energy Consumption in Higher Education Buildings », Buildings, vol. 12, no 3, Art. no 3, march 2022. [CrossRef]
Figure 1. SketchUp modeling of blocks A & B of the Faculty of Electrical Engineering, (Profile view).
Preprints 106753 g001
Figure 2. OpenStudio Construction Sets Interface.
Preprints 106753 g002
Figure 3. Modeling protocol flowchart.
Preprints 106753 g003
Figure 4. Overview of the different space types.
Preprints 106753 g004
Figure 10. Energy consumption of different building needs in Iasi.
Preprints 106753 g010
Figure 11. Electrical consumption of the different needs of the building in Lome.
Preprints 106753 g011
Disclaimer/Publisher’s Note: The statements, opinions and data contained in all publications are solely those of the individual author(s) and contributor(s) and not of MDPI and/or the editor(s). MDPI and/or the editor(s) disclaim responsibility for any injury to people or property resulting from any ideas, methods, instructions or products referred to in the content.
Copyright: This open access article is published under a Creative Commons CC BY 4.0 license, which permit the free download, distribution, and reuse, provided that the author and preprint are cited in any reuse.
Prerpints.org logo

Preprints.org is a free preprint server supported by MDPI in Basel, Switzerland.

Subscribe

© 2024 MDPI (Basel, Switzerland) unless otherwise stated