Submitted:
17 May 2024
Posted:
17 May 2024
You are already at the latest version
Abstract
Keywords:
1. Introduction
2. Materials and Methods
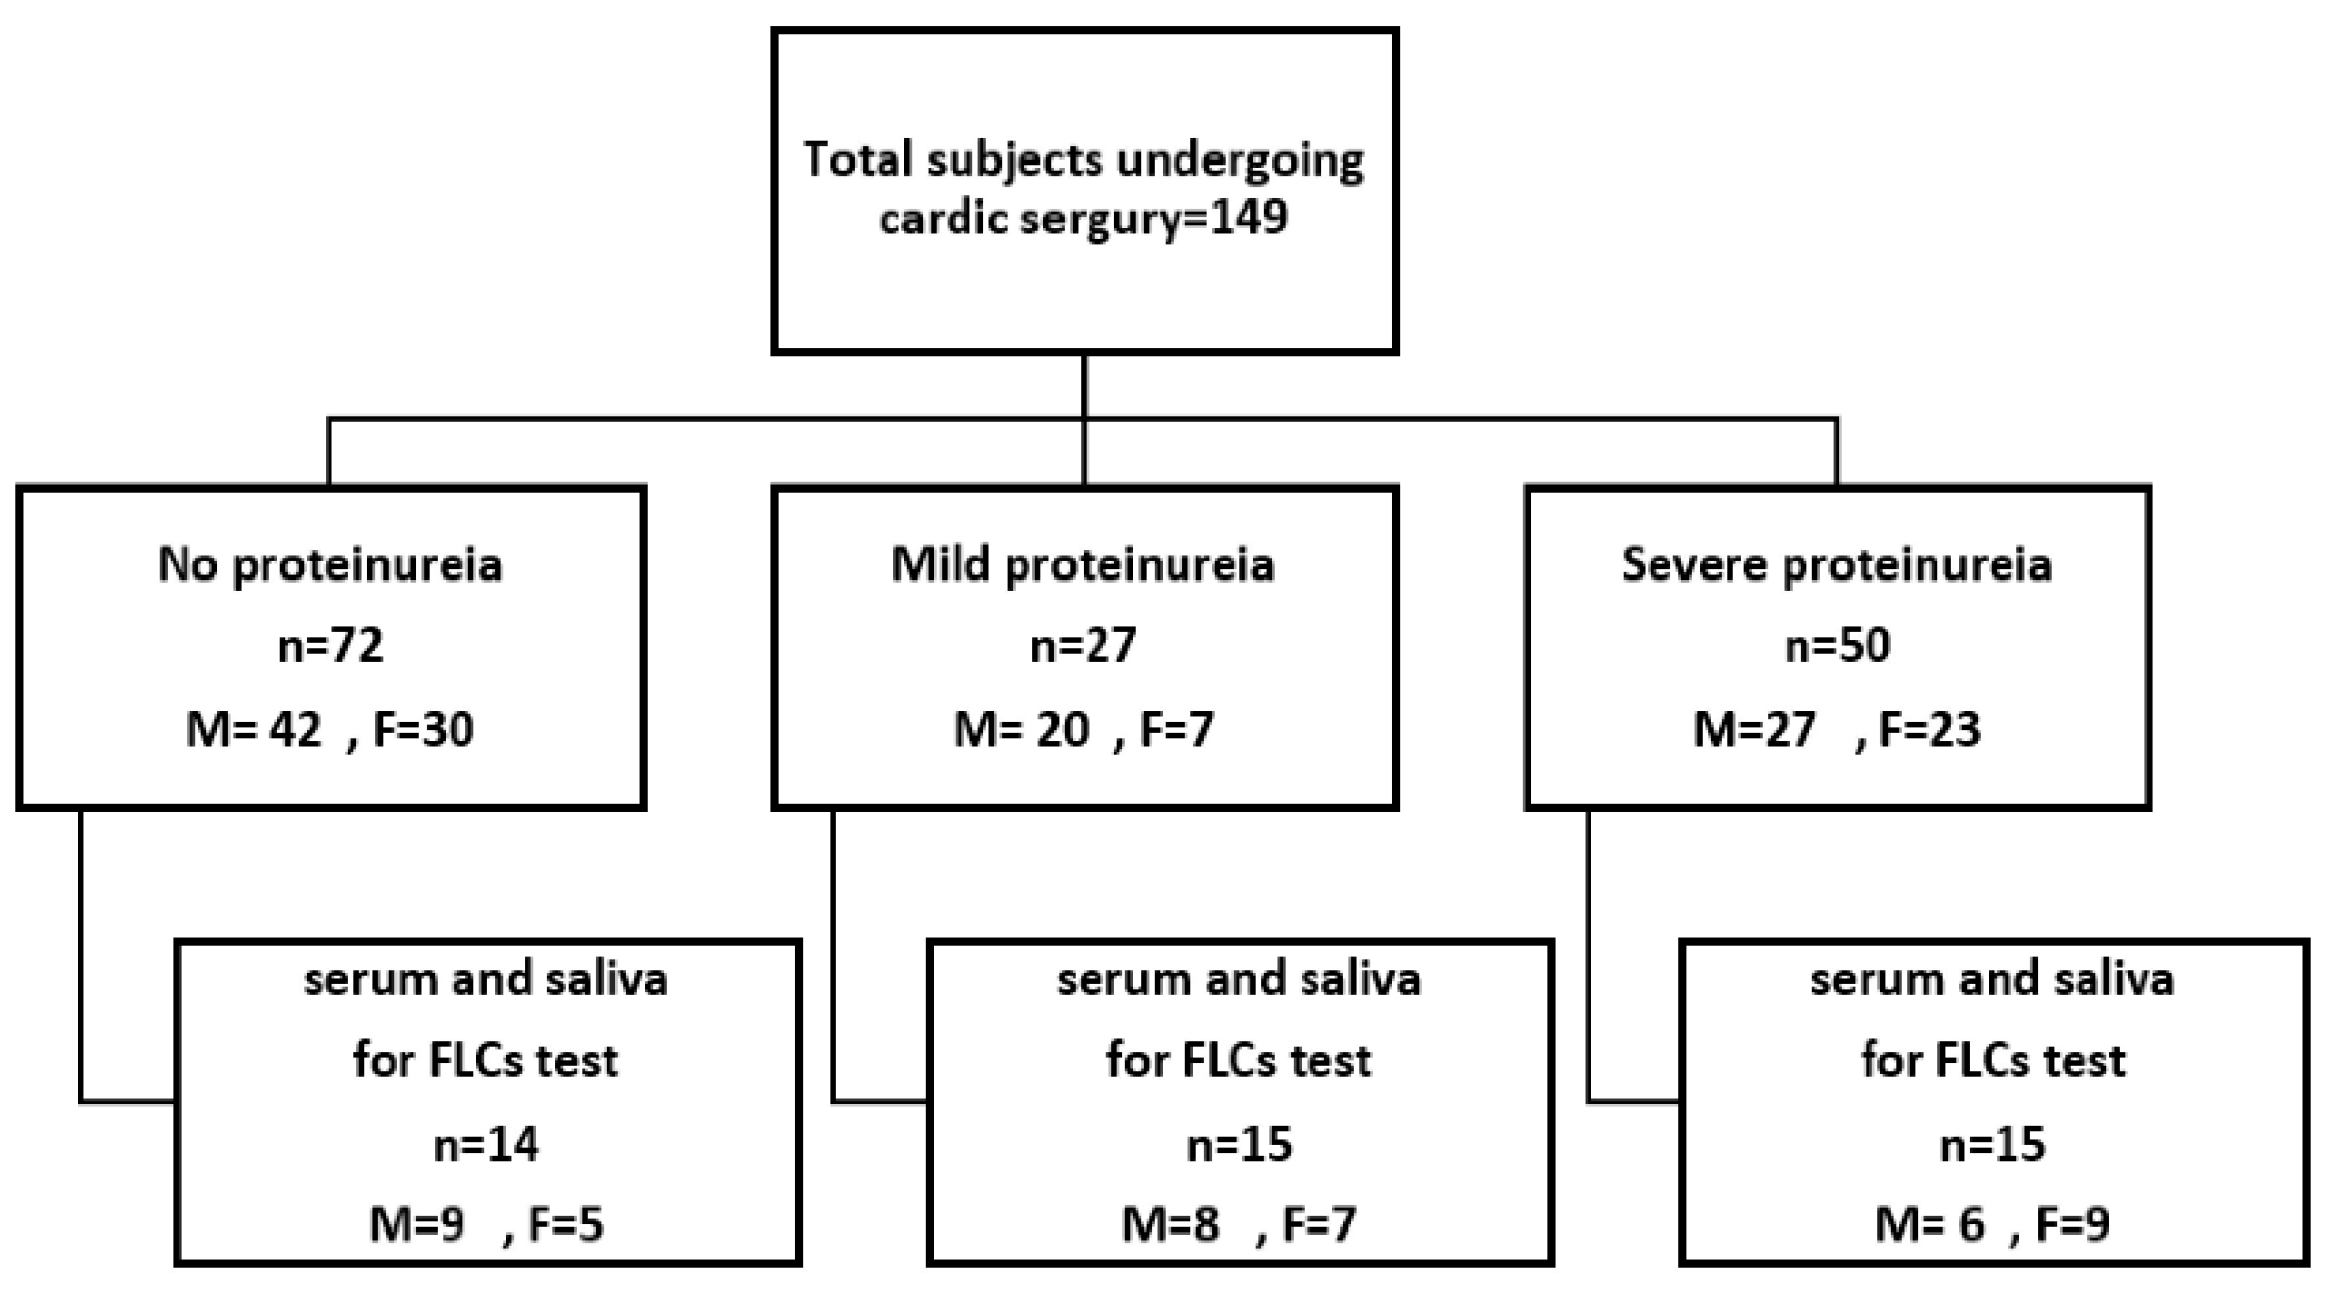
2.1. Inclusion and Exclusion Criteria
2.2. Data Collection
2.3. Sampling and Biochemical Measurements
2.3.1. Blood sampling
2.3.2. Saliva Sampling
2.3.3. Urine Sampling
2.4. Statistical Analyses
3. Results
3.1. Anthropometric Characteristics of the Study Population
3.2. Free Light Chain in Serum
3.3. Free Light Chain in Saliva
3.4. Diagnostic Performance of Free Light Chains
3.5. Correlation between Serum and Salivary In Free Light Chains
4. Discussion
5. Conclusions
Author Contributions
Funding
Institutional Review Board Statement
Informed Consent Statement
Data Availability Statement
Acknowledgments
Conflicts of Interest
References
- Vives M, Hernandez A, Parramon F, Estanyol N, Pardina B, Muñoz A, et al. Acute kidney injury after cardiac surgery: prevalence, impact and management challenges. International journal of nephrology and renovascular disease. 2019:153-66.
- Al-Saffar HB, Yassin AJ, Ali A. Delayed Recovery of Contrast Induced Kidney Injury Post Angiography: Rate and Risk Factors. Journal of the Faculty of Medicine Baghdad. 2015;57(3):183-7.
- Manuti JK. Renal Dysfunction in Patients with Heart Failure. Journal of the Faculty of Medicine Baghdad. 2010;52(2):129-31.
- O’Neal JB, Shaw AD, Billings FT. Acute kidney injury following cardiac surgery: current understanding and future directions. Critical care. 2016;20:1-9.
- Thiele RH, Isbell JM, Rosner MH. AKI associated with cardiac surgery. Clinical Journal of the American Society of Nephrology. 2015;10(3):500-14.
- Esparvarinha M, Nickho H, Mohammadi H, Aghebati-Maleki L, Abdolalizadeh J, Majidi J. The role of free kappa and lambda light chains in the pathogenesis and treatment of inflammatory diseases. Biomedicine & Pharmacotherapy. 2017;91:632-44.
- Hutchison CA, Harding S, Hewins P, Mead GP, Townsend J, Bradwell AR, et al. Quantitative assessment of serum and urinary polyclonal free light chains in patients with chronic kidney disease. Clinical Journal of the American Society of Nephrology. 2008;3(6):1684-90.
- Brebner JA, Stockley RA. Polyclonal free light chains: a biomarker of inflammatory disease or treatment target? F1000 medicine reports. 2013;5.
- Currie G, McKay G, Delles C. Biomarkers in diabetic nephropathy: present and future. World journal of Diabetes. 2014;5(6):763.
- Hutchison CA, Cockwell P, Harding S, Mead GP, Bradwell AR, Barnett AH. Quantitative assessment of serum and urinary polyclonal free light chains in patients with type II diabetes: an early marker of diabetic kidney disease? Expert opinion on therapeutic targets. 2008;12(6):667-76.
- Sorvor E, Owiredu WK, Okyere P, Annani-Akollor ME, Donkor S, Bannor R, et al. Assessment of Serum Free Light Chains as a Marker of Diabetic Nephropathy; A Cross-Sectional Study in the Kumasi Metropolis. Frontiers in Clinical Diabetes and Healthcare. 2022;3:881202.
- Napodano C, Pocino K, Rigante D, Stefanile A, Gulli F, Marino M, et al. Free light chains and autoimmunity. Autoimmunity reviews. 2019;18(5):484-92.
- Irshad L, Faustini S, Evans L, Drayson M, Campbell JP, Heaney J. Salivary free light chains as a new biomarker to measure psychological stress.
- Irshad L, Faustini S, Evans L, Drayson MT, Campbell JP, Heaney JL. Salivary free light chains as a new biomarker to measure psychological stress: the impact of a university exam period on salivary immunoglobulins, cortisol, DHEA and symptoms of infection. Psychoneuroendocrinology. 2020;122:104912.
- Al-Ghurabei BH. Role of salivary tumor necrosis factor-alpha and immunoglobulin-a in recurrent aphthous stomatitis. Journal of the Faculty of Medicine Baghdad. 2011;53(2):207-10.
- Al-Rubaee EA, Kadum HA, Al-Braich MS. Salivary aspartate amino transferase and alanine amino transferase of non-insulin-dependents (Type2) diabetic patients. Journal of the Faculty of Medicine Baghdad. 2010;52(2):212-4.
- Heaney JL, Faustini S, Evans L, Rapson A, Collman E, Emery A, et al. Investigating the utility of saliva immunoglobulins for the detection of myeloma and using myeloma proteins to clarify partition between oral and systemic immunity. European journal of haematology. 2022;108(6):493-502.
- Kaczor-Urbanowicz KE, Martin Carreras-Presas C, Aro K, Tu M, Garcia-Godoy F, Wong DT. Saliva diagnostics–Current views and directions. Experimental Biology and Medicine. 2017;242(5):459-72.
- Kaufman E, Lamster IB. The diagnostic applications of saliva—a review. Critical Reviews in oral biology & medicine. 2002;13(2):197-212.
- Zaidan TF, Al-Omary WM, Al-Sandook TA. Threshold sensitivity of taste perception and the role of saliva and Zinc level in some physiological & pathological conditions. Journal of the Faculty of Medicine Baghdad. 2009;51(1):90-4.
- Khwaja A. KDIGO clinical practice guidelines for acute kidney injury. Nephron Clinical Practice. 2012;120(4):c179-c84.
- Tsai T-Y, Chien H, Tsai F-C, Pan H-C, Yang H-Y, Lee S-Y, et al. Comparison of RIFLE, AKIN, and KDIGO classifications for assessing prognosis of patients on extracorporeal membrane oxygenation. Journal of the Formosan Medical Association. 2017;116(11):844-51.
- Shrewsberry TW, Banoub A, Fleming K, Snyder H, Stehlik J. Spreadsheet use to calculate creatinine clearance from serum creatinine. The Journal of ExtraCorporeal Technology. 2007;39(4):260-2.
- Jiang W, Chen Z, Xu J, Luo Z, Teng J, Ding X, et al. Proteinuria is a risk factor for acute kidney injury after cardiac surgery in patients with stages 3–4 chronic kidney disease: a case control study. BMC Cardiovascular Disorders. 2023;23(1):77.
- Huang T-M, Wu V-C, Young G-H, Lin Y-F, Shiao C-C, Wu P-C, et al. Preoperative proteinuria predicts adverse renal outcomes after coronary artery bypass grafting. Journal of the American Society of Nephrology. 2011;22(1):156-63.
- Li S-Y, Chuang C-L, Yang W-C, Lin S-J. Proteinuria predicts postcardiotomy acute kidney injury in patients with preserved glomerular filtration rate. The Journal of thoracic and cardiovascular surgery. 2015;149(3):894-9.
- Clausen P, Jensen J, Jensen G, Borch-Johnsen K, Feldt-Rasmussen B. Elevated urinary albumin excretion is associated with impaired arterial dilatory capacity in clinically healthy subjects. Circulation. 2001;103(14):1869-74.
- Wang Y, Chen J, Chen L, Tay Y-C, Rangan GK, Harris D. Induction of monocyte chemoattractant protein-1 in proximal tubule cells by urinary protein. Journal of the American Society of Nephrology. 1997;8(10):1537-45.
- Zoja C, Morigi M, Figliuzzi M, Bruzzi I, Oldroyd S, Benigni A, et al. Proximal tubular cell synthesis and secretion of endothelin-1 on challenge with albumin and other proteins. American journal of kidney diseases. 1995;26(6):934-41.
- Massoth C, Zarbock A, Meersch M. Acute kidney injury in cardiac surgery. Critical Care Clinics. 2021;37(2):267-78.
- Rossaint J, Berger C, Van Aken H, Scheld HH, Zahn PK, Rukosujew A, et al. Cardiopulmonary bypass during cardiac surgery modulates systemic inflammation by affecting different steps of the leukocyte recruitment cascade. 2012.
- Zou Z, Ren T, Li Y, Zeng Q, Wang X, Teng J, et al. The Association Between Serum Glutathione Peroxidase-3 Concentration and Risk of Acute Kidney Injury After Cardiac Surgery: A Nested Case-Control Study. The American Journal of Cardiology. 2023;209:29-35.
- Mehta RH, Grab JD, O’Brien SM, Bridges CR, Gammie JS, Haan CK, et al. Bedside tool for predicting the risk of postoperative dialysis in patients undergoing cardiac surgery. Circulation. 2006;114(21):2208-16.
- Thakar CV, Arrigain S, Worley S, Yared J-P, Paganini EP. A clinical score to predict acute renal failure after cardiac surgery. Journal of the American Society of Nephrology. 2005;16(1):162-8.
- Yu Y, Li C, Zhu S, Jin L, Hu Y, Ling X, et al. Diagnosis, pathophysiology and preventive strategies for cardiac surgery-associated acute kidney injury: a narrative review. European Journal of Medical Research. 2023;28(1):45.
- Magro MCdS, Franco EdS, Guimarães D, Kajimoto D, Gonçalves MAB, Vattimo MdFF. Evaluation of the renal function in patients in the postoperative period of cardiac surgery: does AKIN classification predict acute kidney dysfunction? Revista Brasileira de Terapia Intensiva. 2009;21:25-31.
- Santos FO, Silveira MA, Maia RB, Monteiro MDC, Martinelli R. Acute renal failure after coronary artery bypass surgery with extracorporeal circulation: incidence, risk factors, and mortality. Arquivos brasileiros de cardiologia. 2004;83:145-9.
- Ramos KA, Dias CB. Acute kidney injury after cardiac surgery in patients without chronic kidney disease. Brazilian journal of cardiovascular surgery. 2018;33:454-61.
- Corredor C, Thomson R, Al-Subaie N. Long-term consequences of acute kidney injury after cardiac surgery: a systematic review and meta-analysis. Journal of cardiothoracic and vascular anesthesia. 2016;30(1):69-75.
- Lopez-Delgado JC, Esteve F, Torrado H, Rodríguez-Castro D, Carrio ML, Farrero E, et al. Influence of acute kidney injury on short-and long-term outcomes in patients undergoing cardiac surgery: risk factors and prognostic value of a modified RIFLE classification. Critical care. 2013;17:1-12.
- Srivastava V, D'Silva C, Tang A, Sogliani F, Ngaage DL. The impact of major perioperative renal insult on long-term renal function and survival after cardiac surgery. Interactive cardiovascular and thoracic surgery. 2012;15(1):14-7.
- Mohammed AK, Nadr JH. Early complications associated with obesity following coronary artery bypass graft surgery: Obesity and post-CABG morbidity. Journal of the Faculty of Medicine Baghdad. 2021;63(4):158-62.
- Shashaty MG, Stapleton RD. Physiological and management implications of obesity in critical illness. Annals of the American Thoracic Society. 2014;11(8):1286-97.
- Wacharasint P, Fuengfoo P, Rangsin R, Morakul S, Chittawattanarat K, Chaiwat O. Prevalence and impact of overweight and obesity in critically ill surgical patients: analysis of THAI-SICU study. J Med Assoc Thai. 2016;99(6):55-62.
- Zhao H, Pan X, Gong Z, Zheng J, Liu Y, Zhu J, et al. Risk factors for acute kidney injury in overweight patients with acute type A aortic dissection: a retrospective study. Journal of thoracic disease. 2015;7(8):1385.
- Soto GJ, Frank AJ, Christiani DC, Gong MN. Body mass index and acute kidney injury in the acute respiratory distress syndrome. Critical care medicine. 2012;40(9):2601-8.
- Vasquez CR, DiSanto T, Reilly JP, Forker CM, Holena DN, Wu Q, et al. Relationship of body mass index, serum creatine kinase, and acute kidney injury after severe trauma. Journal of Trauma and Acute Care Surgery. 2020;89(1):179-85.
- Guan X-L, Li L, Jiang W-J, Gong M, Li H-Y, Liu Y-Y, et al. Low preoperative serum fibrinogen level is associated with postoperative acute kidney injury in patients with in acute aortic dissection. Journal of Cardiothoracic Surgery. 2023;18(1):6.
- Englberger L, Suri RM, Greason KL, Burkhart HM, Sundt III TM, Daly RC, et al. Deep hypothermic circulatory arrest is not a risk factor for acute kidney injury in thoracic aortic surgery. The Journal of thoracic and cardiovascular surgery. 2011;141(2):552-8.
- Hobson CE, Yavas S, Segal MS, Schold JD, Tribble CG, Layon AJ, et al. Acute kidney injury is associated with increased long-term mortality after cardiothoracic surgery. Circulation. 2009;119(18):2444-53.
- Kowalik MM, Lango R, Klajbor K, Musiał-Świa̢tkiewicz V, Kołaczkowska M, Pawlaczyk R, et al. Incidence-and mortality-related risk factors of acute kidney injury requiring hemofiltration treatment in patients undergoing cardiac surgery: a single-center 6-year experience. Journal of Cardiothoracic and Vascular Anesthesia. 2011;25(4):619-24.
- Roh GU, Lee JW, Nam SB, Lee J, Choi J-r, Shim YH. Incidence and risk factors of acute kidney injury after thoracic aortic surgery for acute dissection. The Annals of thoracic surgery. 2012;94(3):766-71.
- Vekstein AM, Yerokun BA, Jawitz OK, Doberne JW, Anand J, Karhausen J, et al. Does deeper hypothermia reduce the risk of acute kidney injury after circulatory arrest for aortic arch surgery? European Journal of Cardio-Thoracic Surgery. 2021;60(2):314-21.
- Chen JJ, Chang CH, Wu VCC, Chang SH, Hung KC, Chu PH, et al. Long-term outcomes of acute kidney injury after different types of cardiac surgeries: a population-based study. Journal of the American Heart Association. 2021;10(9):e019718.
- Chen J-J, Kuo G, Hung C-C, Lin Y-F, Chen Y-C, Wu M-J, et al. Risk factors and prognosis assessment for acute kidney injury: The 2020 consensus of the Taiwan AKI Task Force. Journal of the Formosan Medical Association. 2021;120(7):1424-33.
- Chou Y-H, Huang T-M, Wu V-C, Chen W-S, Wang C-H, Chou N-K, et al. Associations between preoperative continuation of renin–angiotensin system inhibitor and cardiac surgery-associated acute kidney injury: a propensity score-matching analysis. Journal of Nephrology. 2019;32:957-66.
- Wang W, Zhang L, Yang T, Ma S, Zhang Q, Shi P, et al. Combined serum free light chain predicts prognosis in acute kidney injury following cardiovascular surgery. Renal Failure. 2022;44(1):1-10.
- Desjardins L, Liabeuf S, Lenglet A, Lemke H-D, Vanholder R, Choukroun G, et al. Association between free light chain levels, and disease progression and mortality in chronic kidney disease. Toxins. 2013;5(11):2058-73.
- Fraser SD, Fenton A, Harris S, Shardlow A, Liabeuf S, Massy ZA, et al., editors. The Association of Serum Free Light Chains with Mortality and Progression to end-stage renal disease in chronic kidney disease: systematic review and individual patient data meta-analysis. Mayo Clinic Proceedings; 2017: Elsevier.
- De Novellis D, Fontana R, Carobene A, Serio B, Ferrara I, Martorelli MC, et al. Serum free light-chain ratio at diagnosis is associated with early renal damage in multiple myeloma: A case series real-world study. Biomedicines. 2022;10(7):1657.
- Zaborin A, Smith D, Garfield K, Quensen J, Shakhsheer B, Kade M, et al. Membership and behavior of ultra-low-diversity pathogen communities present in the gut of humans during prolonged critical illness. MBio. 2014;5(5):10.1128/mbio. 01361-14.
- Aggarwal R, Sequeira W, Kokebie R, Mikolaitis RA, Fogg L, Finnegan A, et al. Serum free light chains as biomarkers for systemic lupus erythematosus disease activity. Arthritis care & research. 2011;63(6):891-8.
- Jackson CE, Haig C, Welsh P, Dalzell JR, Tsorlalis IK, McConnachie A, et al. Combined free light chains are novel predictors of prognosis in heart failure. JACC: Heart Failure. 2015;3(8):618-25.
- Waldmann TA, Strober W, Mogielnicki RP. The renal handling of low molecular weight proteins: II. Disorders of serum protein catabolism in patients with tubular proteinuria, the nephrotic syndrome, or uremia. The Journal of clinical investigation. 1972;51(8):2162-74.
- Bhole MV, Sadler R, Ramasamy K. Serum-free light-chain assay: clinical utility and limitations. Annals of clinical biochemistry. 2014;51(5):528-42.
- Azat, NF. Evaluation of Serum (immunoglobulin G, M) in children with nephrotic syndrome relapse. Journal of the Faculty of Medicine Baghdad. 2012;54(1):15-7.
- Gudowska-Sawczuk M, Mroczko B. Free light chains as a novel diagnostic biomarker of immune system abnormalities in multiple sclerosis and HIV infection. BioMed Research International. 2019;2019.
- Jabbar SA, Hasan HR. ACTIVITIES OF SULFHYDRYL OXIDASE AND XANTHINE OXIDOREDUCTASE SYSTEM IN SALIVA AND SERUM OF WOMEN WITH DIFFERENT TYPES OF BREAST TUMORS. Biochemical & Cellular Archives. 2021;21.
- Hasan HRAA, N. N. Oxidative Stress Status in Sera and Saliva of Type 2 Diabetic Iraqi Patients with and without Proliferative Diabetic Retinopathy. Asian Journal of Chemistry. 2019;31(3): 719-22.
- Hasan HR, Aburahma NNA, AL-Kazaz AKA. Proteins Level in Sera and Saliva of Type2 Diabetic Iraqi Patients with and Without Proliferative Diabetic Retinopathy. Oriental Journal of Chemistry. 2017;33(6):2776.
- Hasan HR, Aburahma NN. The Variations in Saliva and Serum Total Peroxidases System’s Activity in Patients with Different Oral Tumors. Biological. 2020;2307:615.
- Hasan HR, & Mathkor, T. H. Alteration in serum & saliva α-amylase activity & levels of some hormones associated with exposure to chemicals. Asian Journal of Chemistry. 2019;31(2):410 - 6.
- Heaney JL, Gleeson M, Phillips AC, Taylor IM, Drayson MT, Goodall M, et al. Salivary immunoglobulin free light chains: reference ranges and responses to exercise in young and older adults. Exercise Immunology Review. 2016;22:28-40.
- Konen FF, Seeliger T, Schwenkenbecher P, Gingele S, Jendretzky KF, Sühs K-W, et al. Saliva Free Light Chains in Patients with Neuro-Sjögren. Biomedicines. 2022;10(10):2470.
- Rapson A, Collman E, Faustini S, Yonel Z, Chapple IL, Drayson MT, et al. Free light chains as an emerging biomarker in saliva: Biological variability and comparisons with salivary IgA and steroid hormones. Brain, behavior, and immunity. 2020;83:78-86.
- Šimundić A-M. Measures of diagnostic accuracy: basic definitions. ejifcc. 2009;19(4):203.
| Characteristics, N (%) | Total |
No proteinuria N=72 |
Mild proteinuria N=27 |
Severe proteinuria N=50 |
P value |
| Demographic | |||||
| Male | 89(59.7) | 42(58.33) | 20(74.07) | 27(54) | 0.218 |
| Female | 60(40.3) | 30(41.67) | 7(25.93) | 23(46) | |
| Age (year) | 51.57 ± 10.207 | 56.63 ± 10.724 | 53.520 ± 8.858 | 0.075 | |
| Age groups | |||||
| <39 | 15(10) | 11(15.3) | 2(7.4) | 2(4.0) | 0.076 |
| 40 – 49 | 38(25.5) | 20(27.8) | 4(14.8) | 14(28.0) | |
| 50 – 59 | 57(38) | 24(33.3) | 10(37.0) | 23(46.0) | |
| 60 – 69 | 32(21.5) | 15(20.8) | 7(25.9) | 10(20.0) | |
| >70 | 7(4.5) | 2(2.8) | 4(14.8) | 1(2.0) | |
| BMI(kg/m2) | 27.776 ± 4.136 | 27.269 ± 4.101 | 28.674 ± 4.693 | 0.339 | |
| Name of hospital | |||||
| IbnALBAYTAR | 95(63.7) | 45(62.5) | 17(63) | 33(66.0) | 0.938 |
| Ghazi Alhariri.H | 38(25.5) | 18(25.0) | 8(29.6) | 12(24.0) | |
| Outpatients | 16(10.7) | 9(12.5) | 2(7.4) | 5(10.7) | |
| Type of operation | |||||
| CABG | 66(44.3) | 29(40.3) | 14(51.9) | 23(46.0) | 0.716 |
| AVR | 79(53) | 41(56.9) | 13(48.1) | 25(50.0) | |
| CABG & AVR | 4(2.6) | 2(2.8) | 0(0.0) | 2(4.0) | |
| Comorbidities | |||||
| No Disease | 81(54) | 41(56.9) | 14(51.9) | 26(52) | 0.800 |
| With comorbidities | 68(45) | 31(43.1) | 13(48.1) | 24(48) | |
| DM | 14(20.5) | 5(6.9) | 3(11.1) | 6(12.0) | |
| Hypertension | 19(27.9) | 10(13.9) | 2(7.4) | 7(14.0) | |
| DM & Hypertension | 27(39.7) | 11(15.3) | 7(25.9) | 9(18) | |
| Thyroid | 3(4.4) | 1(1.4) | 0(0) | 2(4.0) | |
| Rheumatoid | 4(5.8) | 3(4.2) | 1(3.7) | 0(0) | |
| Hyperlipidemia | 1(1.4) | 1(1.4) | 0 | 0 | |
| Smoking status | |||||
| Smoking | 19(13) | 10(13.9) | 5(18.8) | 4(8) | 0.386 |
| Non smoking | 130(87) | 62(86.1) | 22(81.5) | 46(92.0) | |
| Other operations | |||||
| No preoperation | 129(86.6) | 60(83.3) | 24(88.9) | 45(90) | 0.784 |
| With preoperation | 20(13.4) | 12(16.6) | 3(11.1) | 5(10) | |
| Gall stone | 2(2.8) | 0(0) | 0(0) | ||
| tonsillectomy | 2(2.8) | 0(0) | 0(0) | ||
| Liver injury | 1(1.4) | 0(0) | 0(0) | ||
| thyroidectomy | 0(0) | 0(0) | 1(2.0) | ||
| Therapeutic cathetarization | 2(2.8) | 1(3.7) | 0(0) | ||
| appendix | 2(2.8) | 0(0) | 1(2.0) | ||
| ulcer | 1(1.4) | 1(3.7) | 0(0) | ||
| sinus | 1(1.4) | 0(0) | 1(2.0) | ||
| hernia | 0(0) | 1(3.7) | 2(4.0) | ||
| Abdominal injury | 1(1.4) | 0(0) | 0(0) | ||
| Residency | |||||
| Baghdad | 100(67.1) | 43(59.7) | 20(74.1) | 37(74.0) | 0.075 |
| Al-Anbar | 26(17.45) | 15(20.8) | 4(14.8) | 7(14.0) | |
| Deyala | 7(4.7) | 5(6.9) | 1(3.7) | 1(2.0) | |
| Karbalaa | 5(3.3) | 4(5.6) | 0(0.0) | 1(2.0) | |
| Wasit | 3(2.0) | 1(1.4) | 0(0.0) | 2(4.0) | |
| Salahaddin | 4(2.6) | 3(4.2) | 0(0.0) | 1(2.0) | |
| Neynava | 3(2.0) | 1(1.4) | 2(7.4) | 0(0.0) | |
| Missan | 1(0.67) | 0(0.0) | 0(0.0) | 1(2.0) | |
| Date of sample collection(after operation) | |||||
| 1 week | 95(63.7) | 7(9.7) | 3(11.1) | 4(8.0) | 0.131 |
| 2 week | 5(6.9) | 7(25.9) | 7(14.0) | ||
| 1 month | 13(18.1) | 3(11.1) | 7(14.0) | ||
| 3 month | 16(22.2) | 1(3.7) | 4(8.0) | ||
| 6 month | 9(12.5) | 1(3.7) | 8(16.0) | ||
| 1year | 54(36.3) | 17(23.6) | 9(33.3) | 17(34.0) | |
| Above 1 year | 5(6.9) | 3(11.1) | 3(6.0) | ||
| eGFR | |||||
| Normal (>90 ml/min) | 104(69.7) | 60(83.3) | 18(66.7) | 26(52.0) | 0.341 |
| Mild (60-90 ml/min) | 40(26.8) | 12(16.7) | 9(33.3) | 19(38.0) | |
| Moderate (30-60 ml/min) | 5(3.3) | 0(0.0) | 0(0.0) | 5(10.0) | |
| Severe (<30 ml/min) | 0(0.0) | 0(0.0) | 0(0.0) | ||
| Prognosis | |||||
| AKI | 46(30.1) | 9(12.5) | 9(33.3) | 28(56) | 0.378 |
| No AKI | 103(69.9) | 63(87.5) | 18(66.7) | 22(44) | |
| Baseline laboratory indices | |||||
| B.Urea (mg/dl) | 37.313 ± 15.790 | 42.092 ± 14.279 | 50.838 ± 24.682 | 0.001 | |
| S.Creatinine (mg/dl) | 0.912 ± 0.264 | 1.036 ± 0.256 | 1.332 ± 0.645 | 0.000 | |
| S.Protein (g/l) | 69.138 ± 11.105 | 65.967 ± 9.336 | 61.983 ± 17.270 | 0.015 | |
| S.Albumin (mg/l) | 43.199 ± 7.188 | 38.444 ± 7.973 | 36.538 ± 6.278 | 0.000 | |
| Urea in urine (mg) | 1444.98±472.15 | 1386.2±527.77 | 1215.3±643.77 | 0.073 | |
| Creatinine in urine (mg) | 643.41 ± 324.40 | 445.07 ± 280.58 | 261.11 ± 211.39 | 0.000 | |
| Protein in urine (mg) | 11.663 ± 6.720 | 23.919 ± 9.944 | 53.886 ± 69.344 | 0.000 | |
| Protein/Cr Ratio in urine | 39.527 ± 76.743 | 95.369 ± 82.849 | 340.4±383.765 | 0.000 | |
| Characteristics | No proteinuria N=14 |
Mild proteinuria (trace, +1) N=15 |
Severe proteinuria (+2, +3) N=15 |
P value |
|---|---|---|---|---|
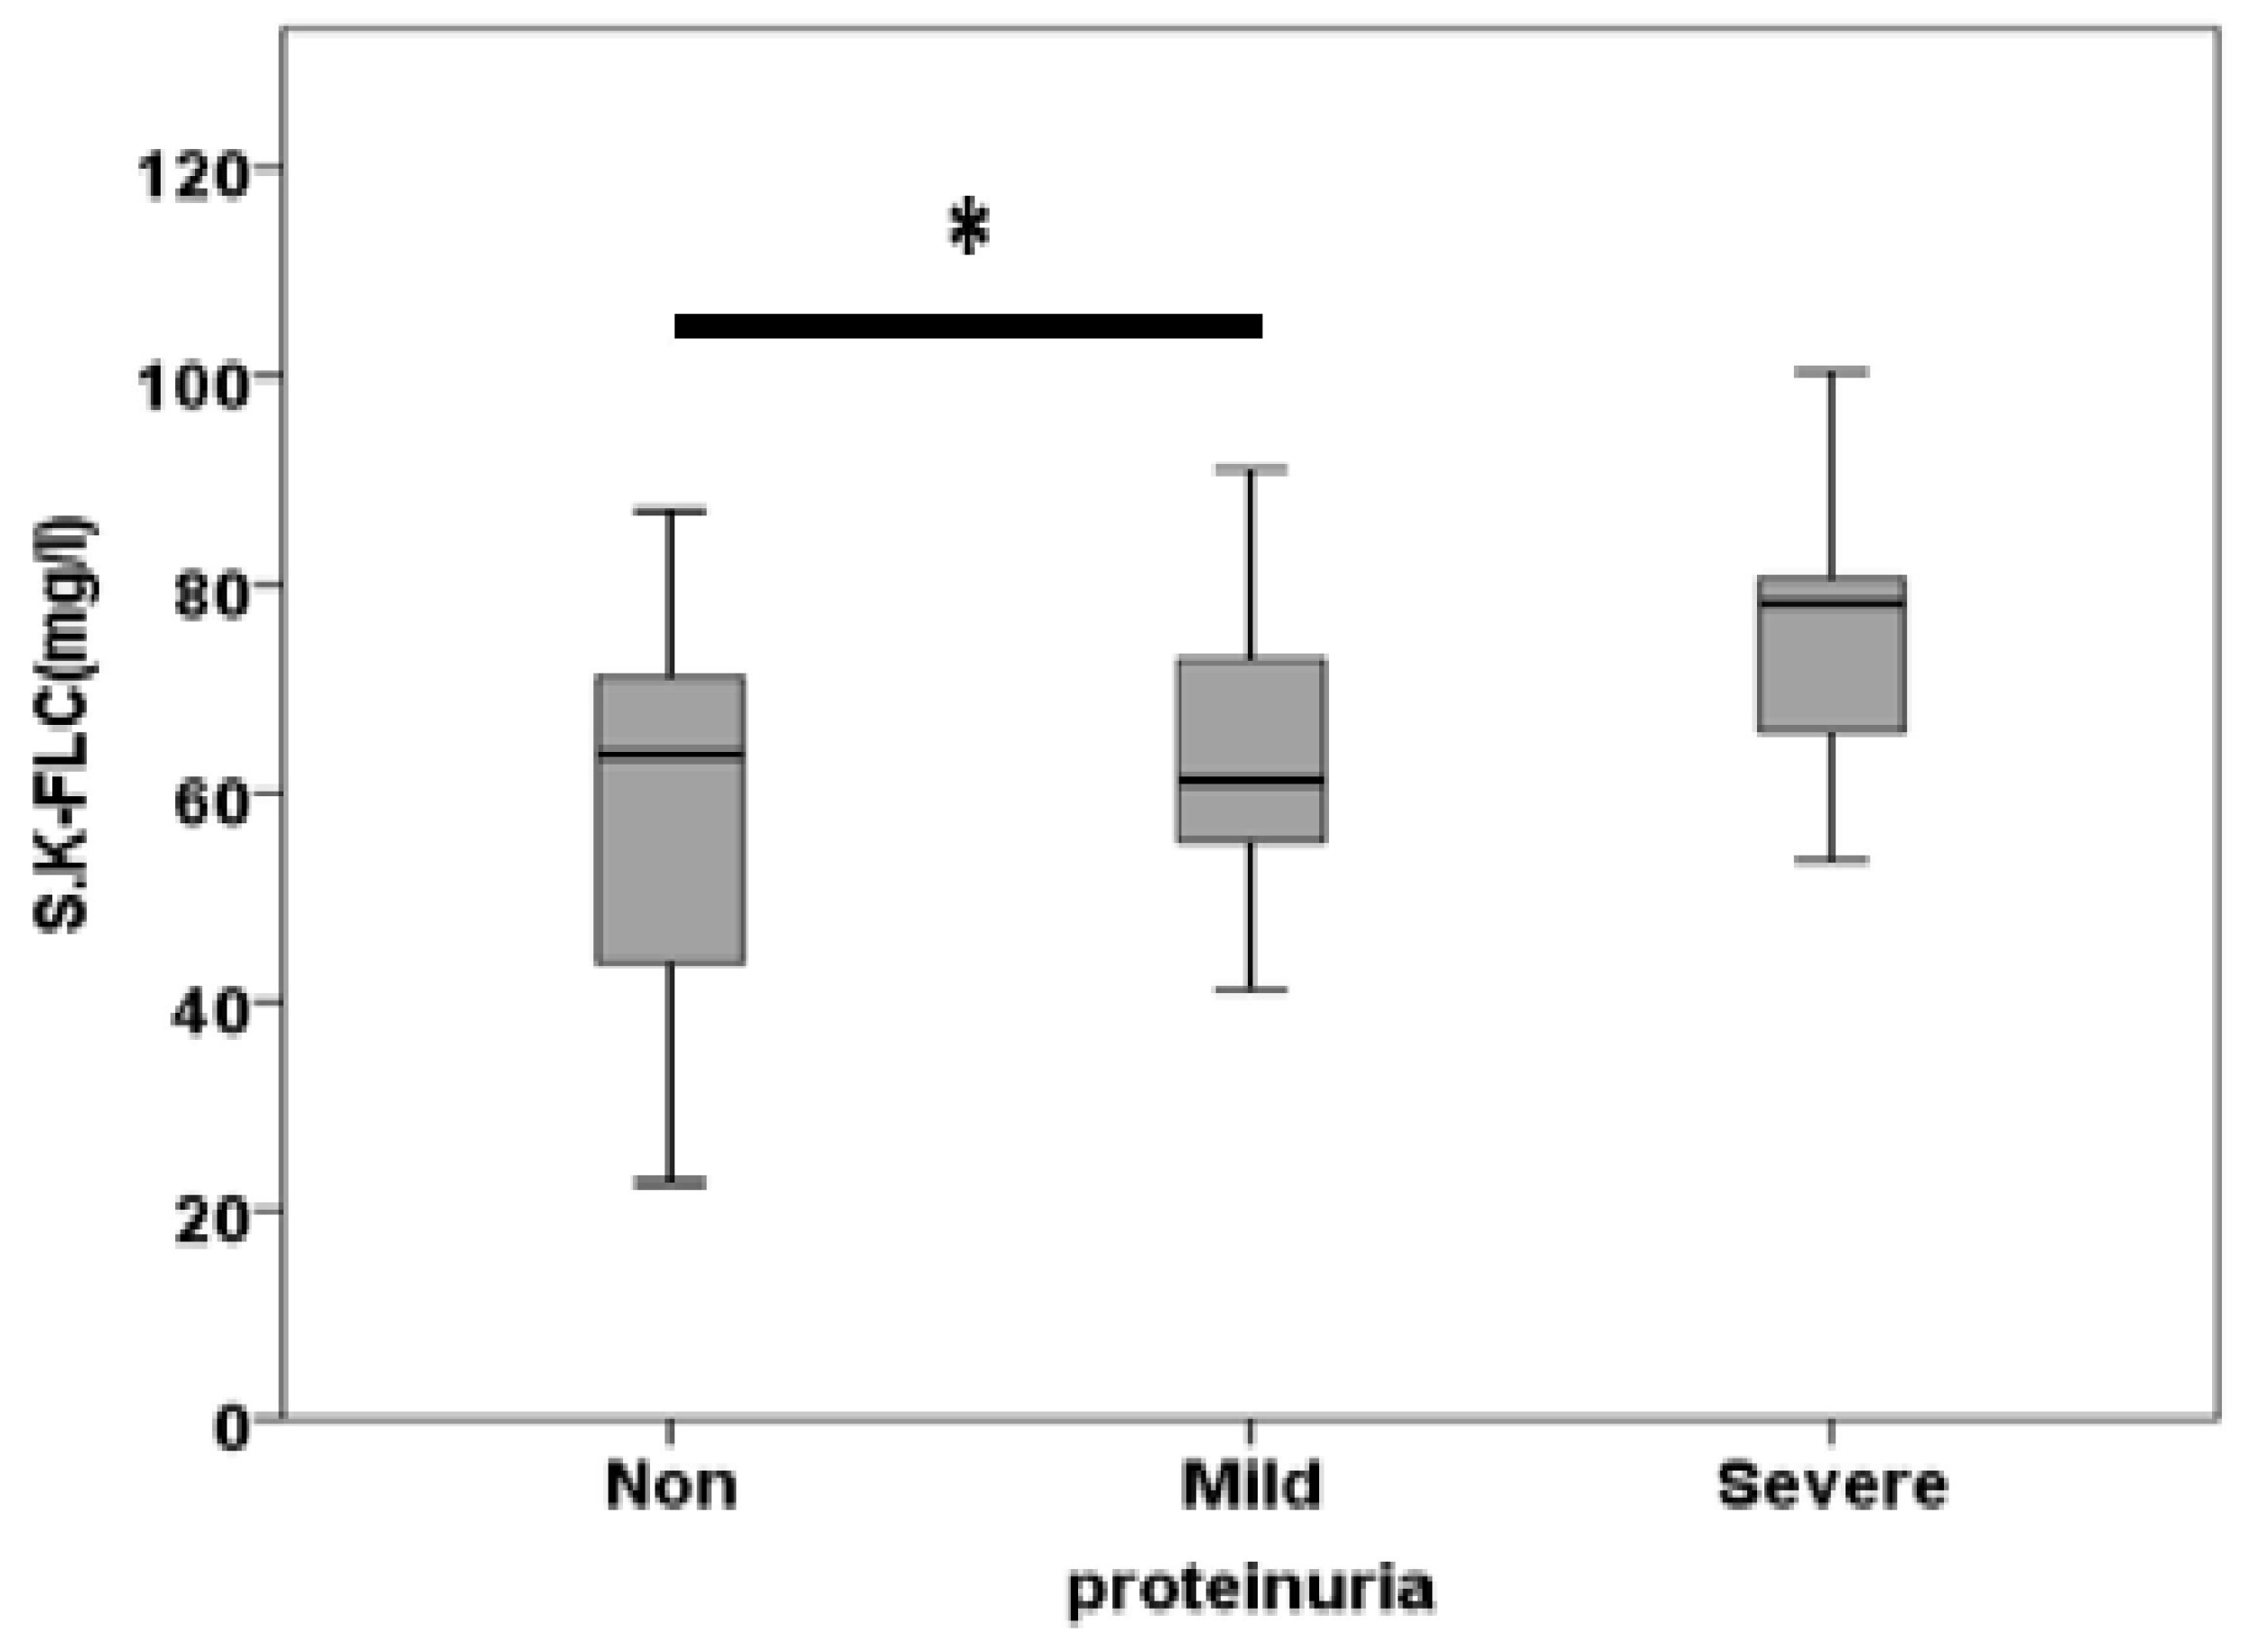
| S.K.FLC (mg/l) | 59.37±4.97 | 63.32±3.75 | 74.46±3.94 | 0.042 |
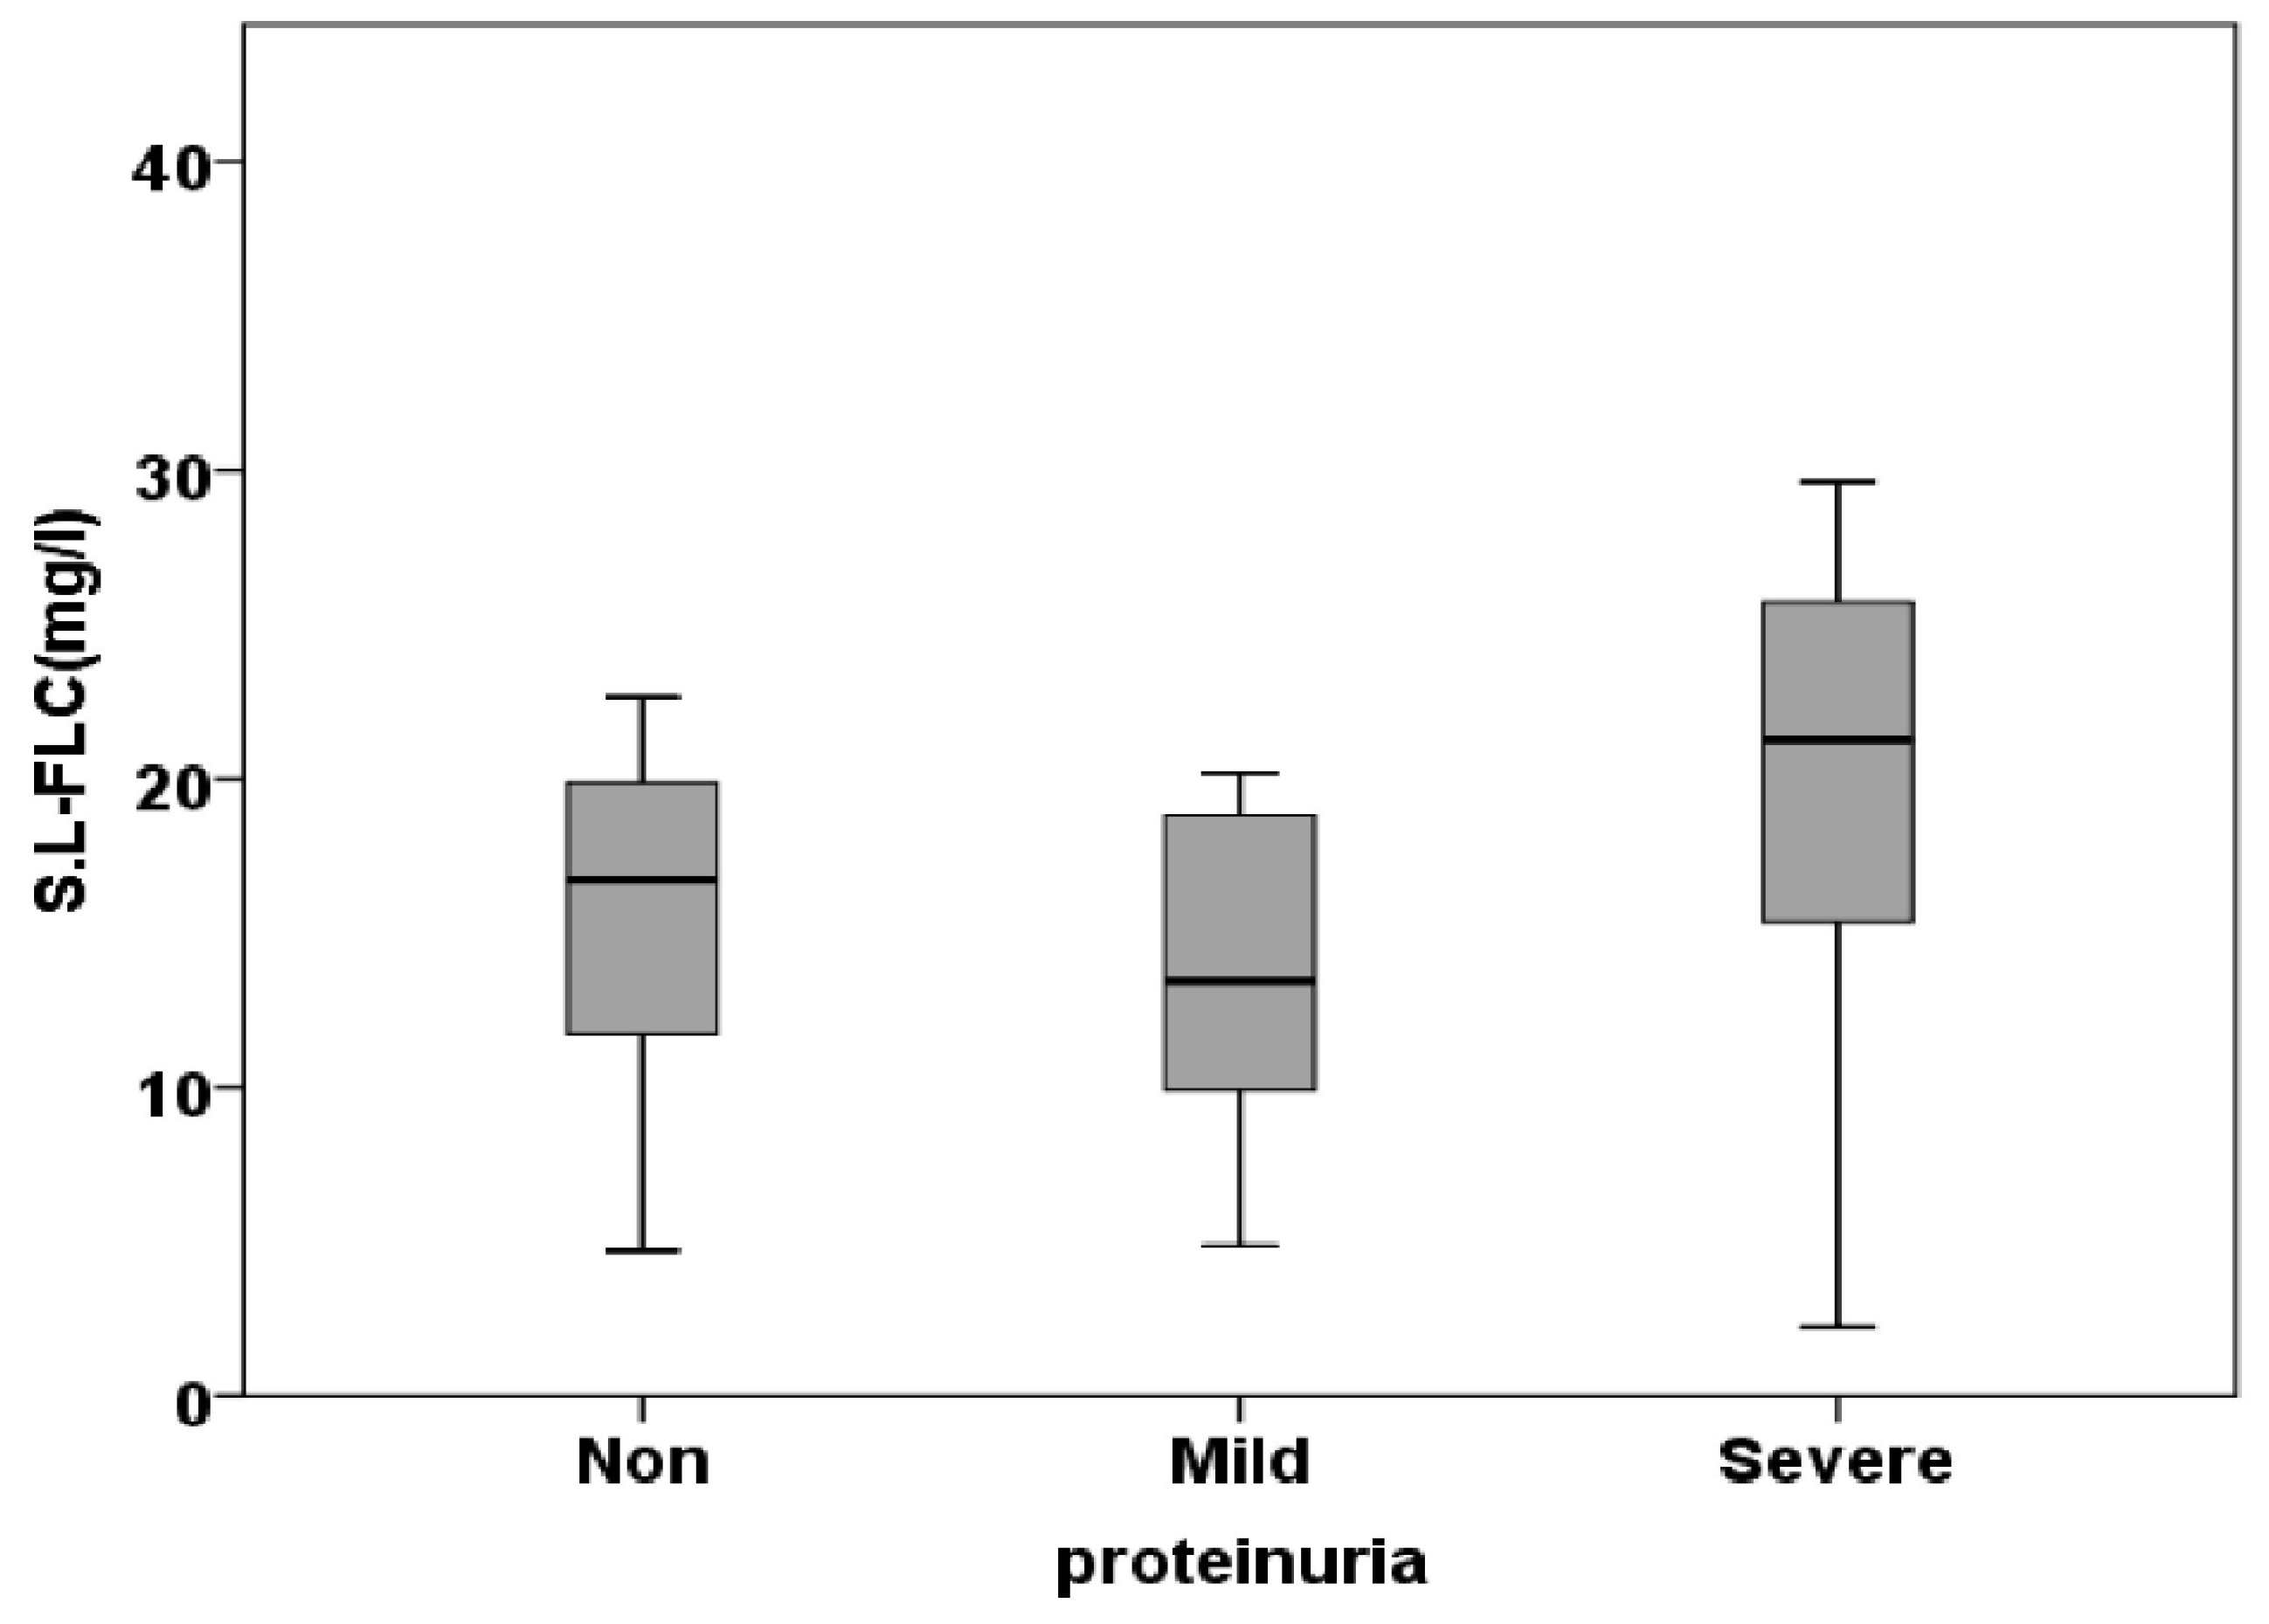
| S.L.FLC (mg/l) | 15.24±1.56 | 14.63±1.78 | 19.59±2.01 | 0.115 |
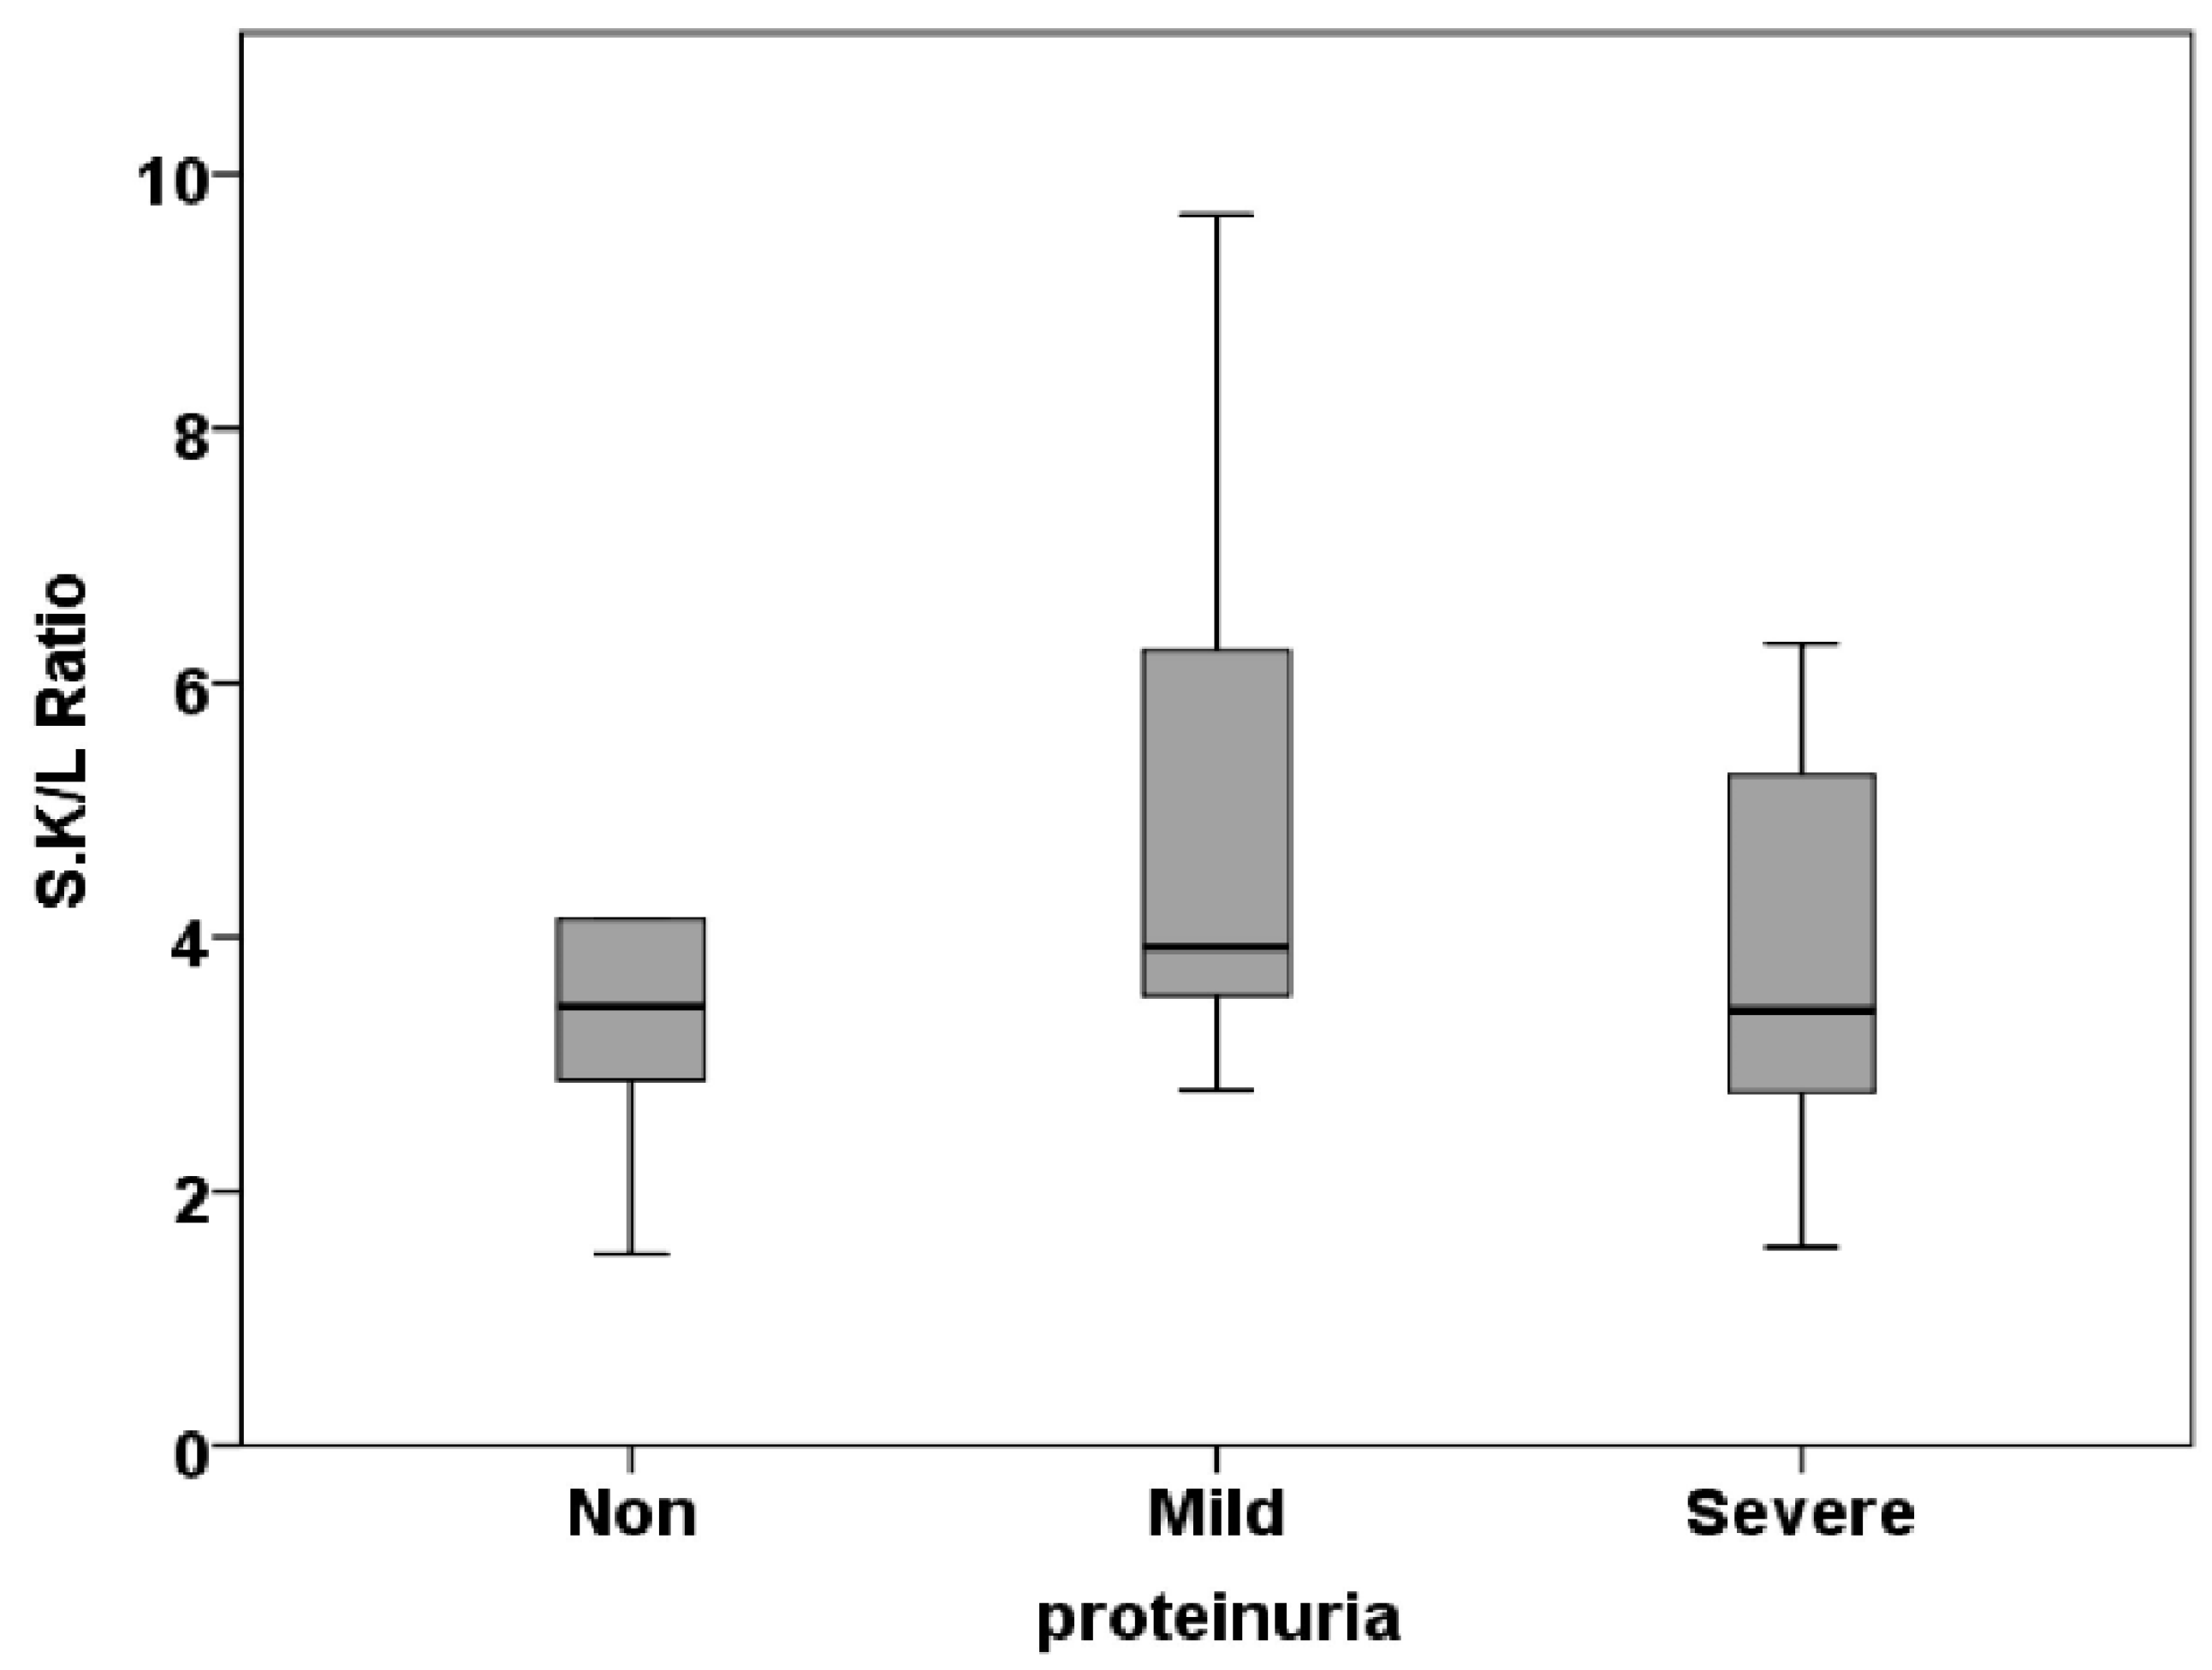
| S.K/L Ratio | 0.50±0.10 | 0.51±0.06 | 0.63±0.21 | 0.799 |
| Characteristics | No proteinuria N=14 |
Mild proteinuria (trace , +1) N=15 |
Severe proteinuria (+2 , +3) N=15 |
P value |
|---|---|---|---|---|
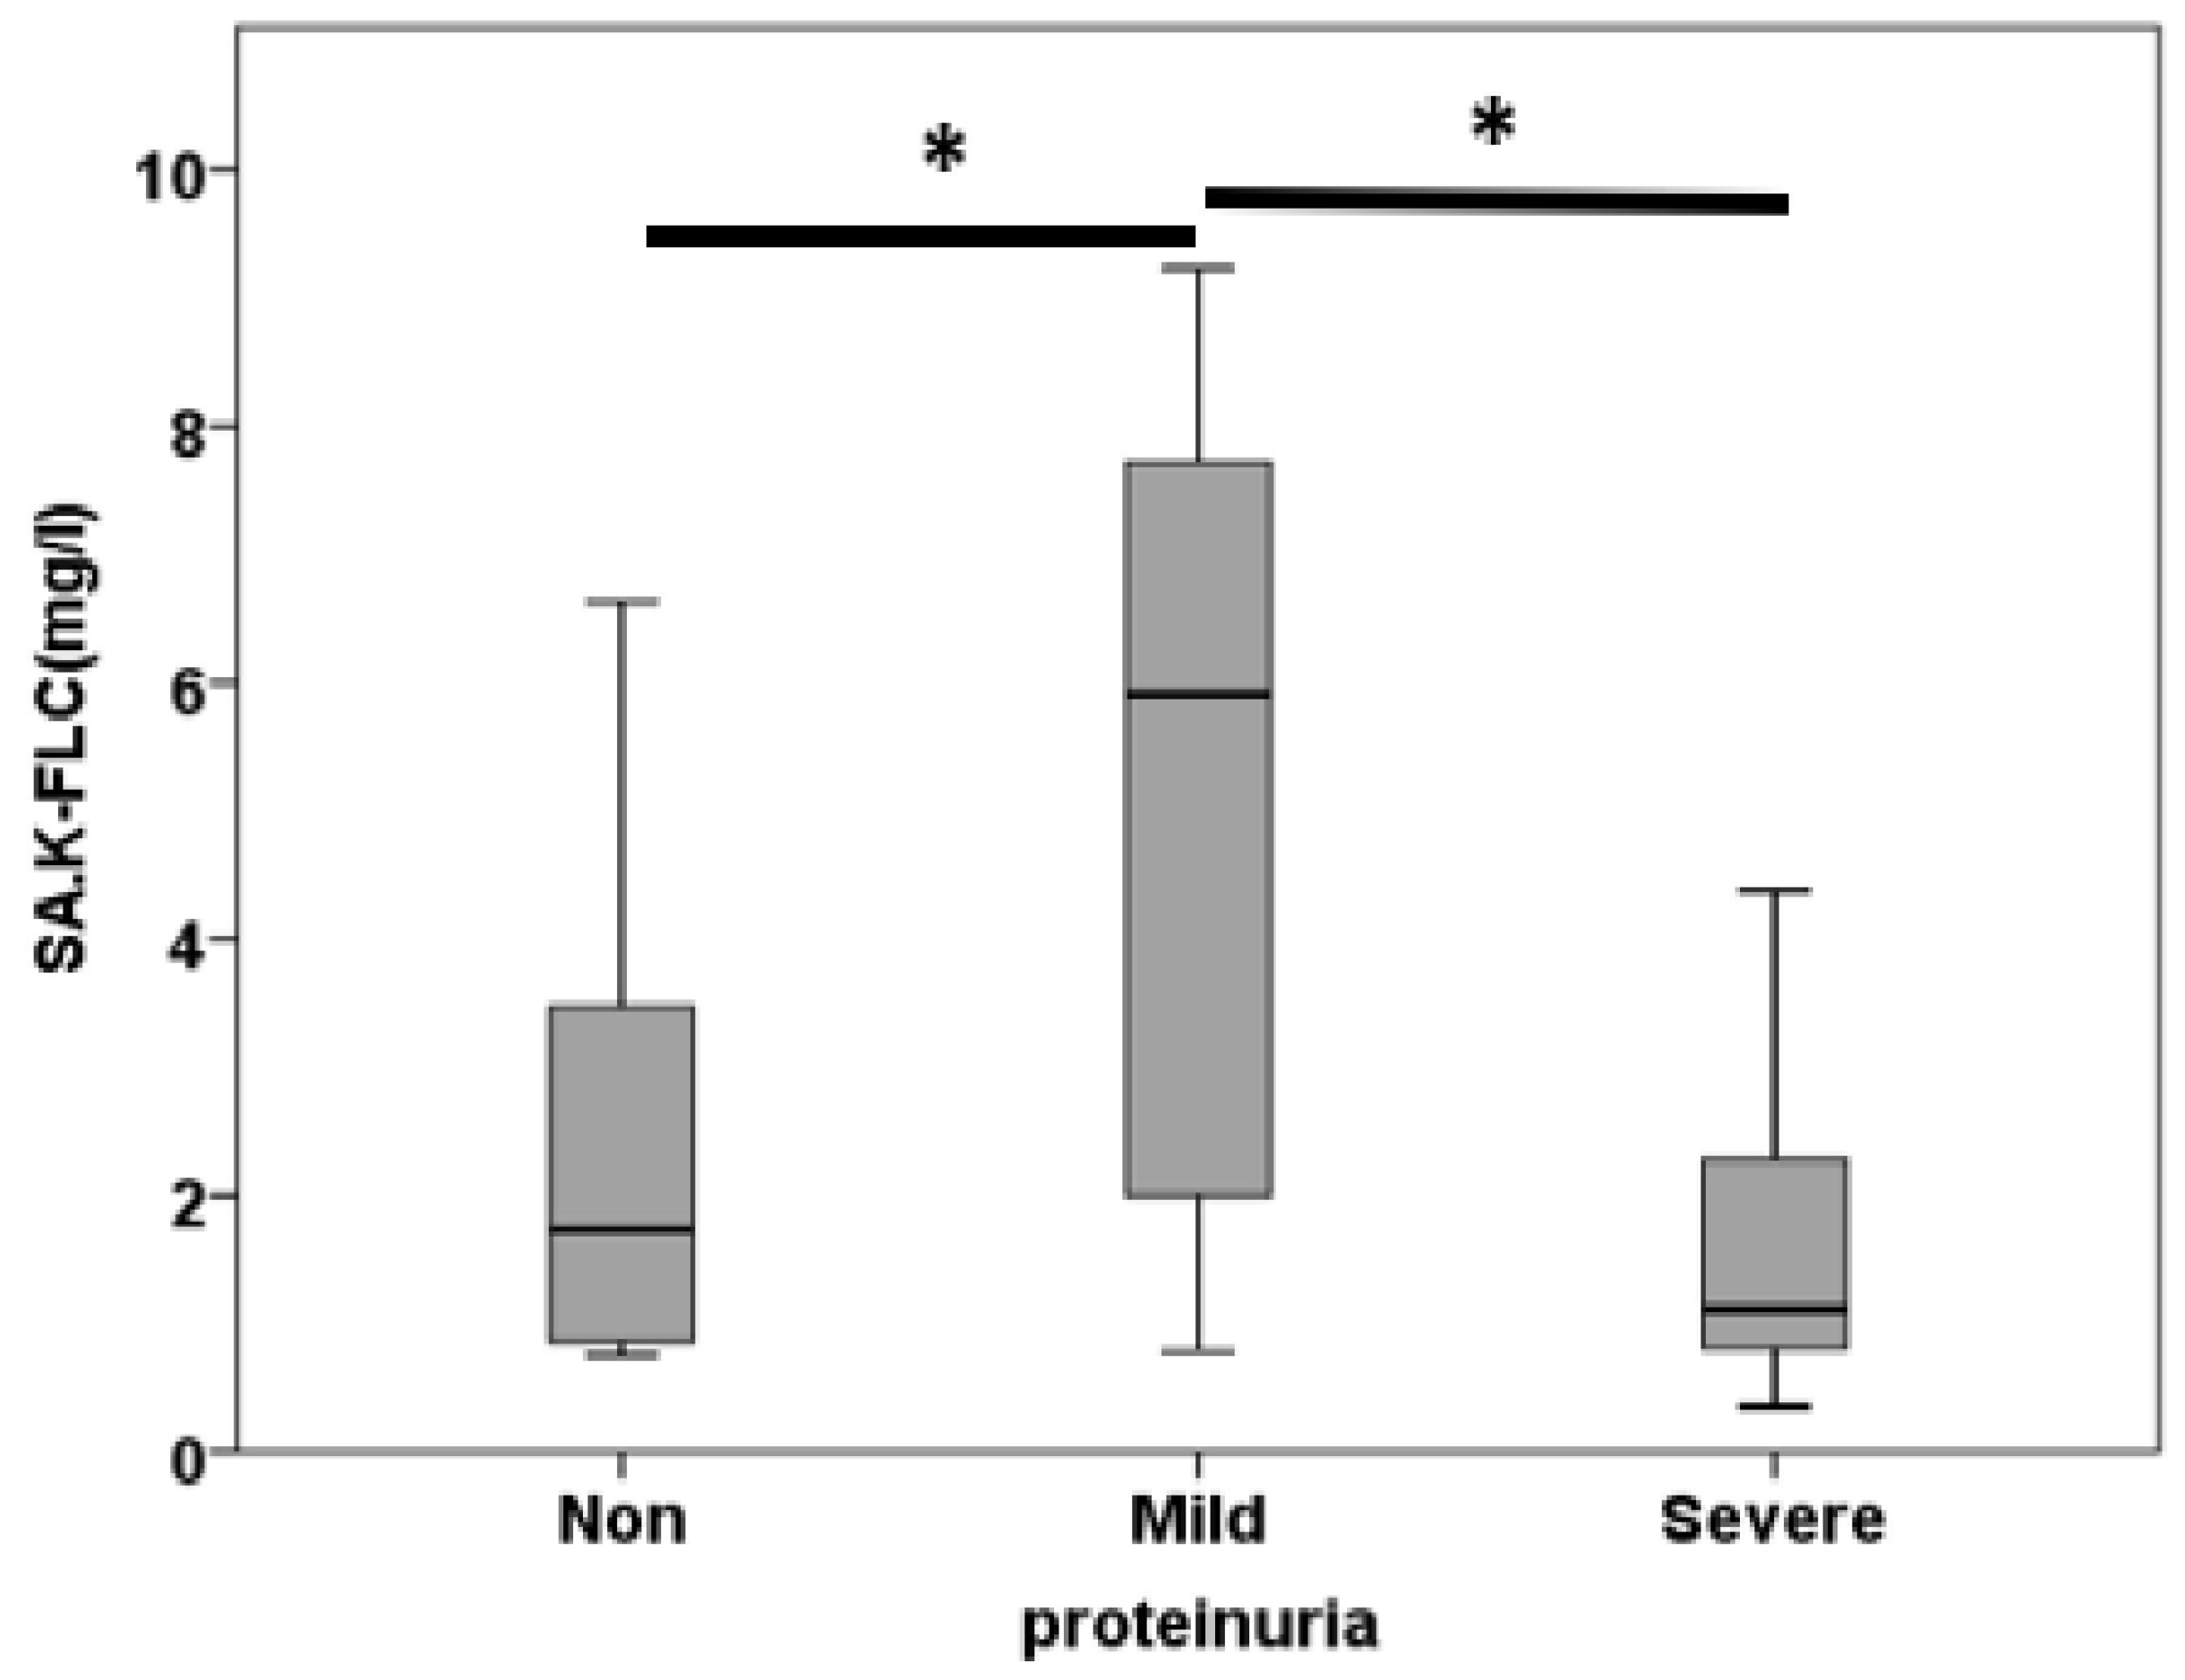
| SA.K.FLC (mg/l) | 2.68±0.65 | 5.20±0.80 | 1.74±0.29 | 0.001 |
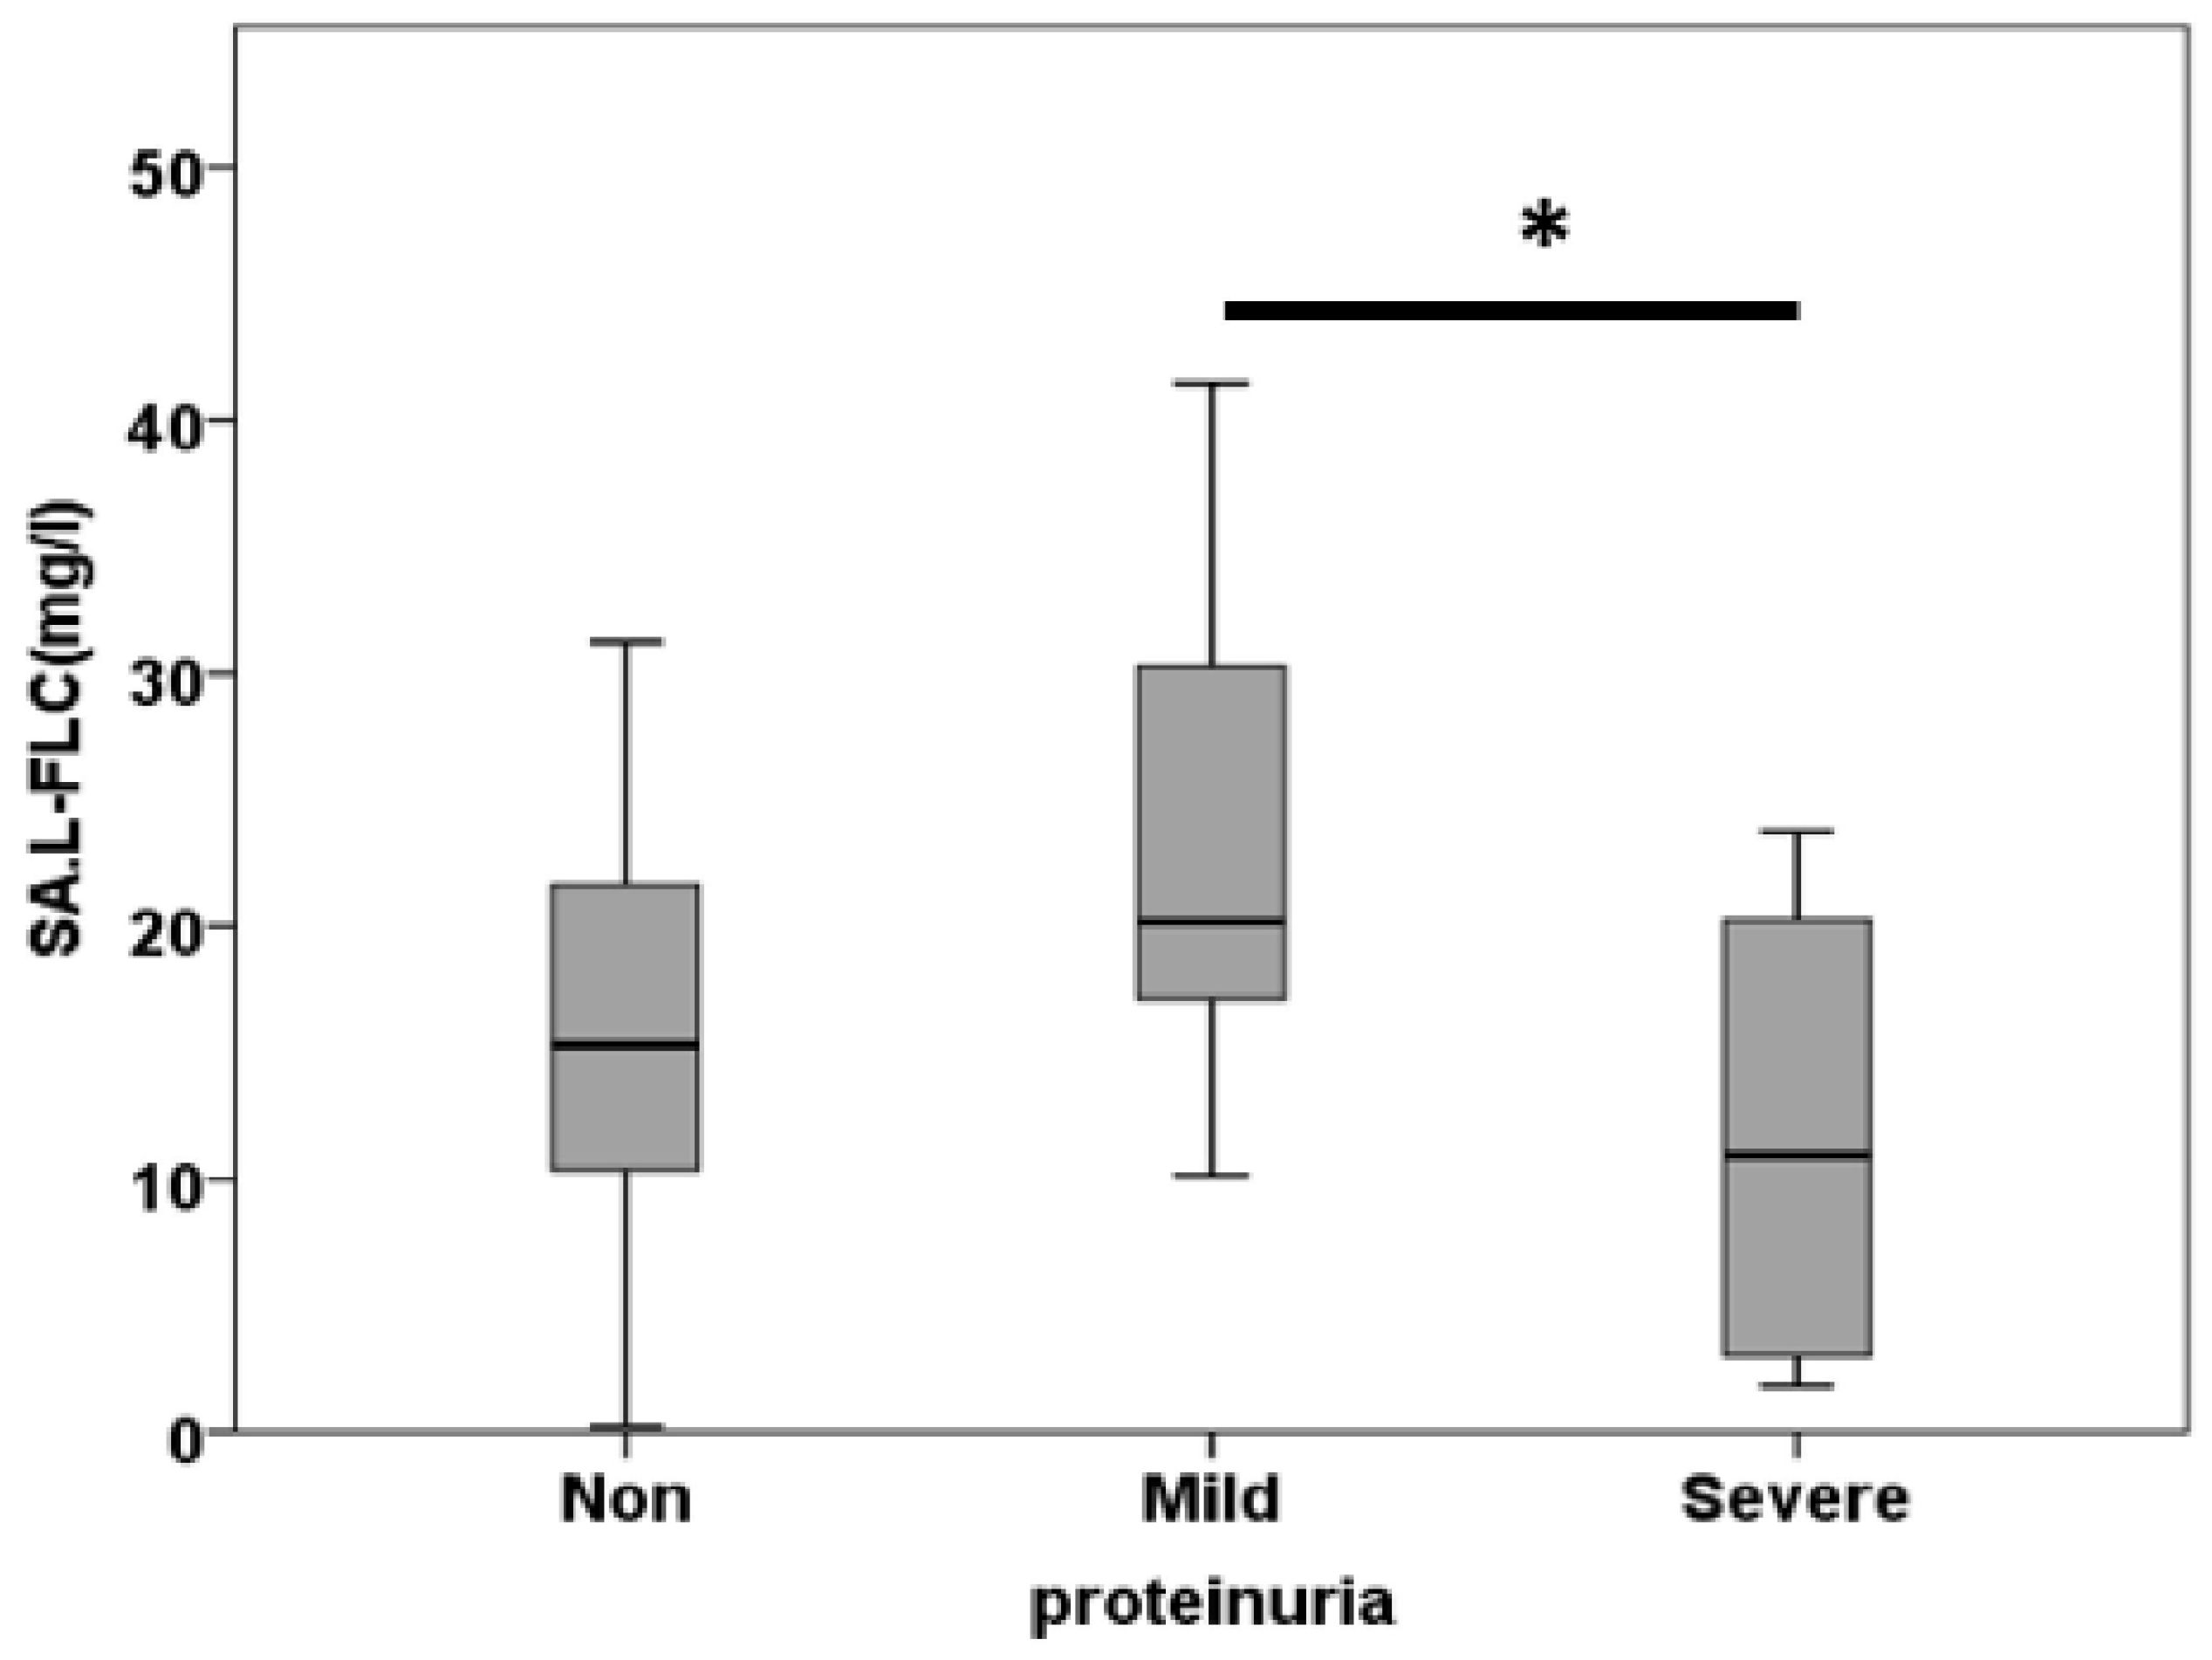
| SA.L.FLC (mg/l) | 26.54±10.83 | 25.29±3.32 | 11.99±2.31 | 0.005 |
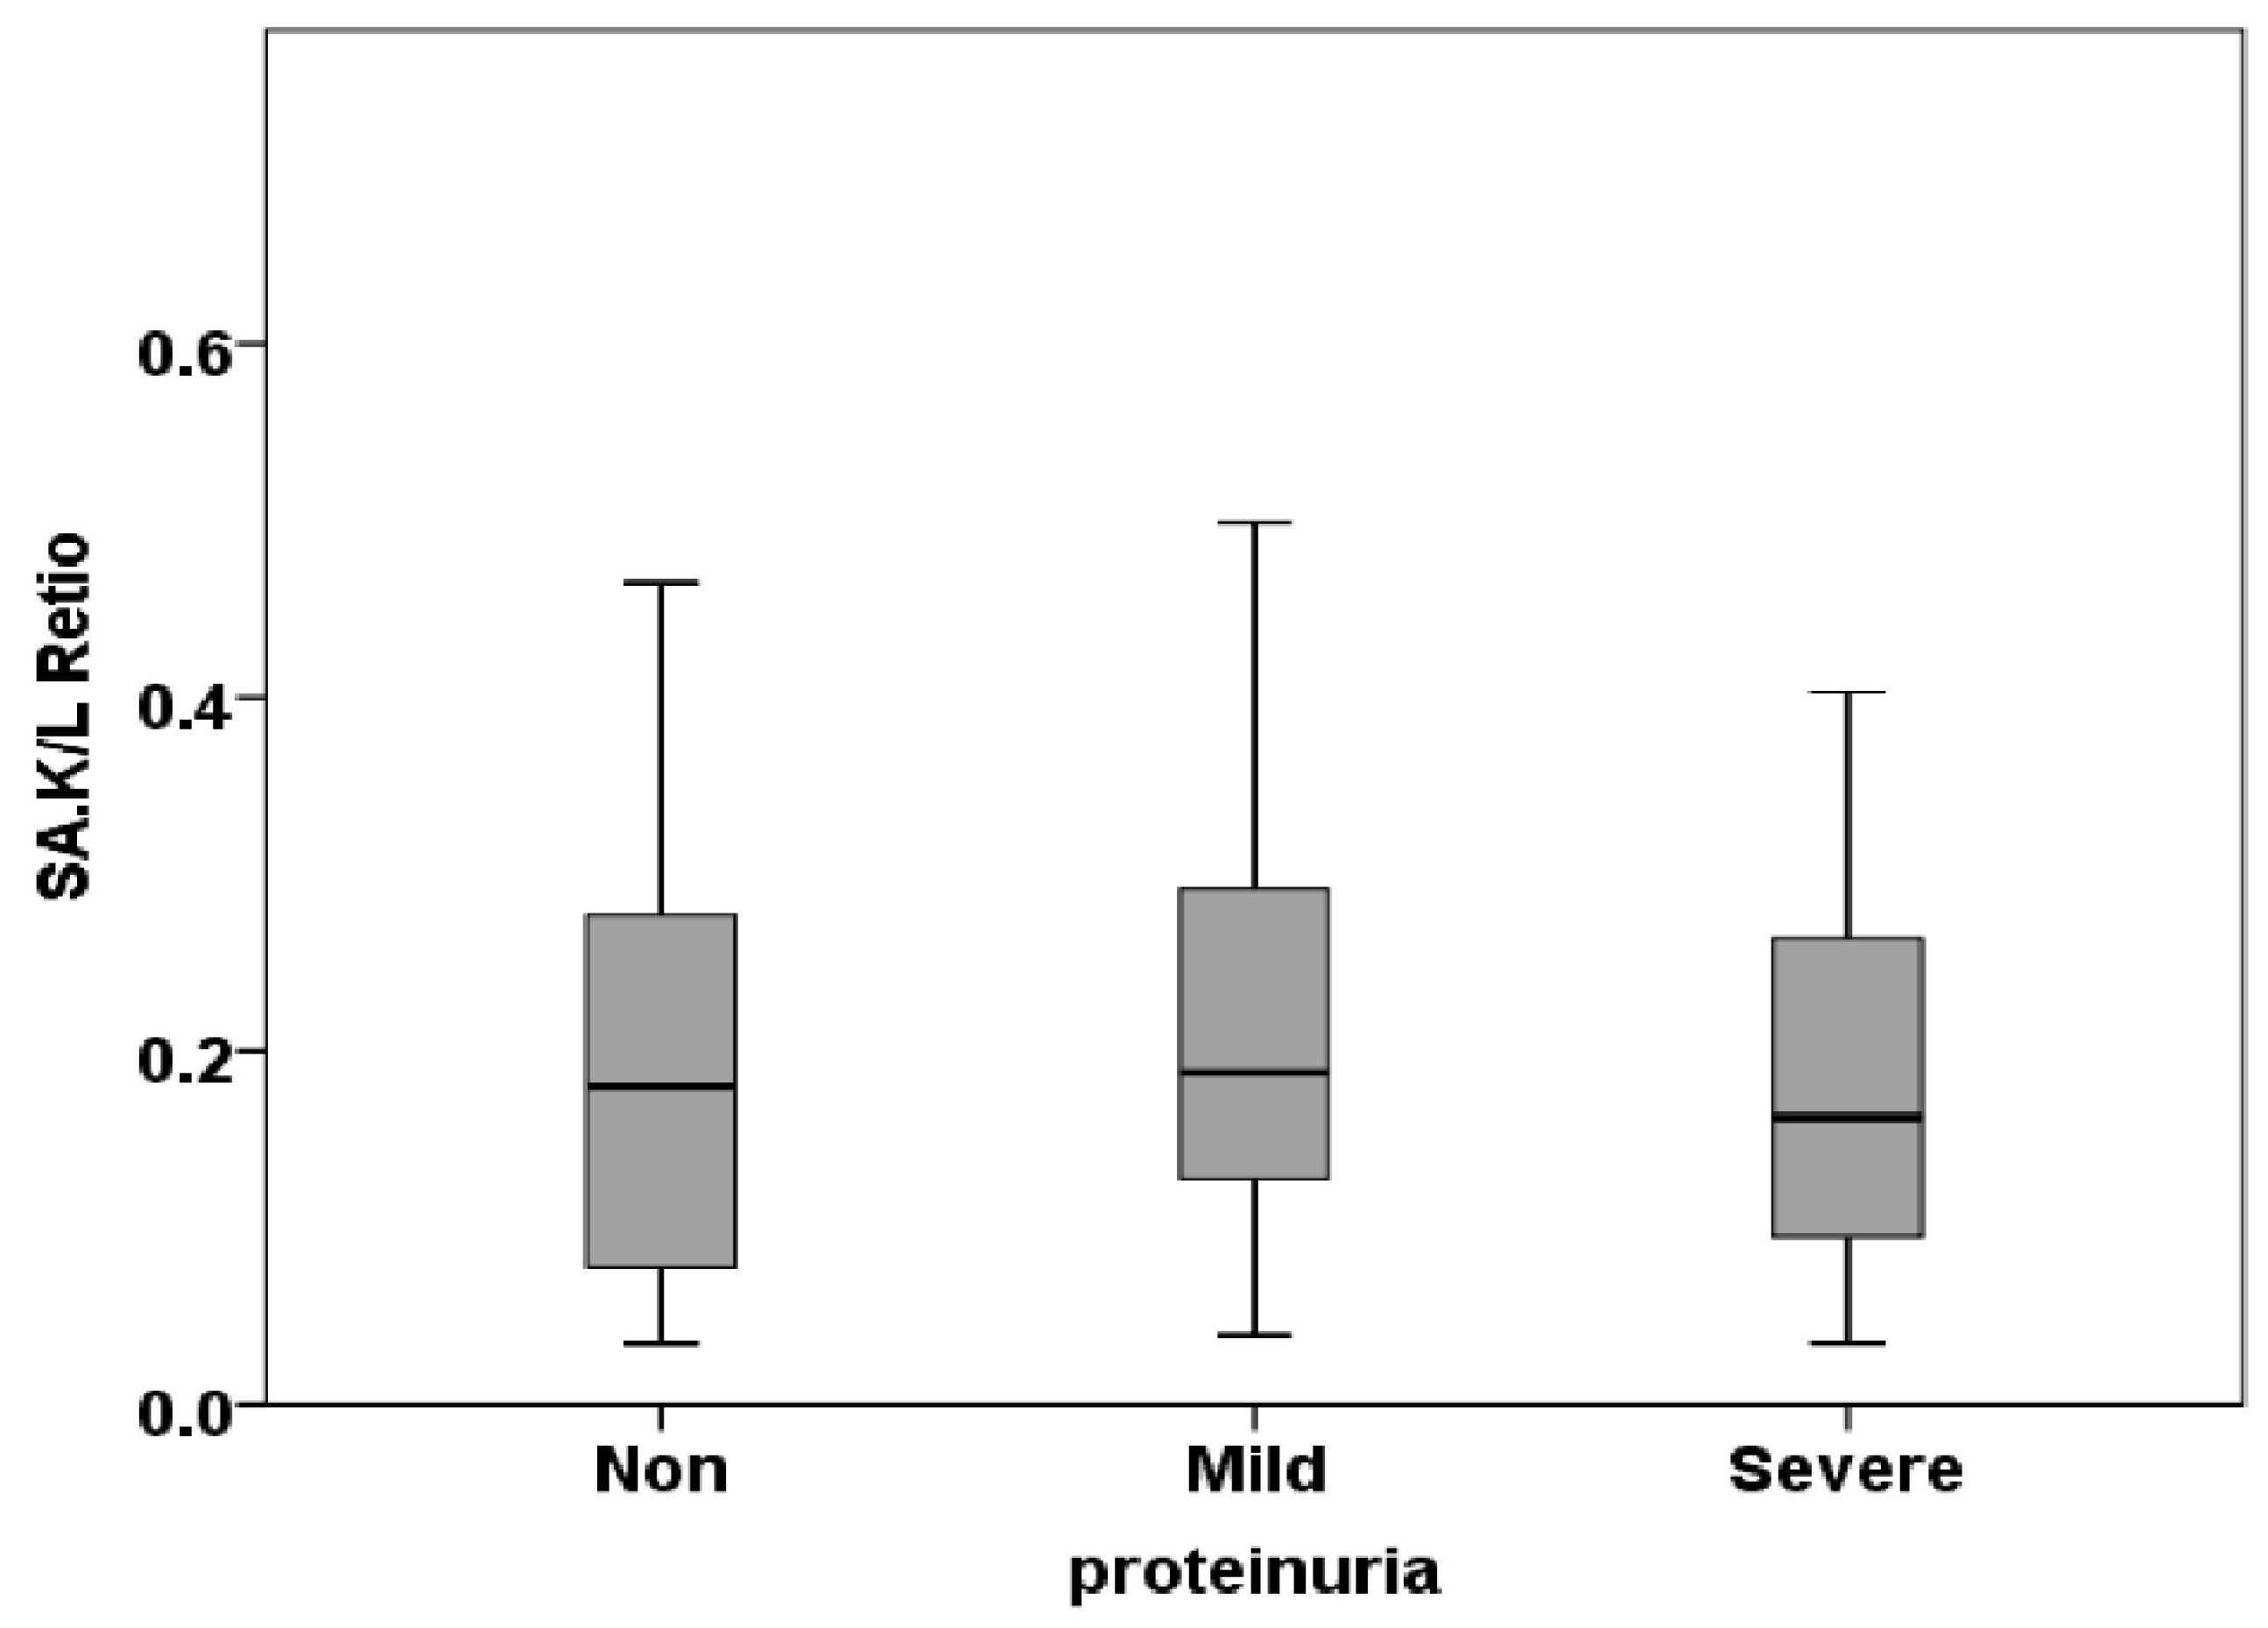
| SA. k/l Ratio | 0.04±0.02 | 0.02±0.003 | 0.03±0.008 | 0.485 |
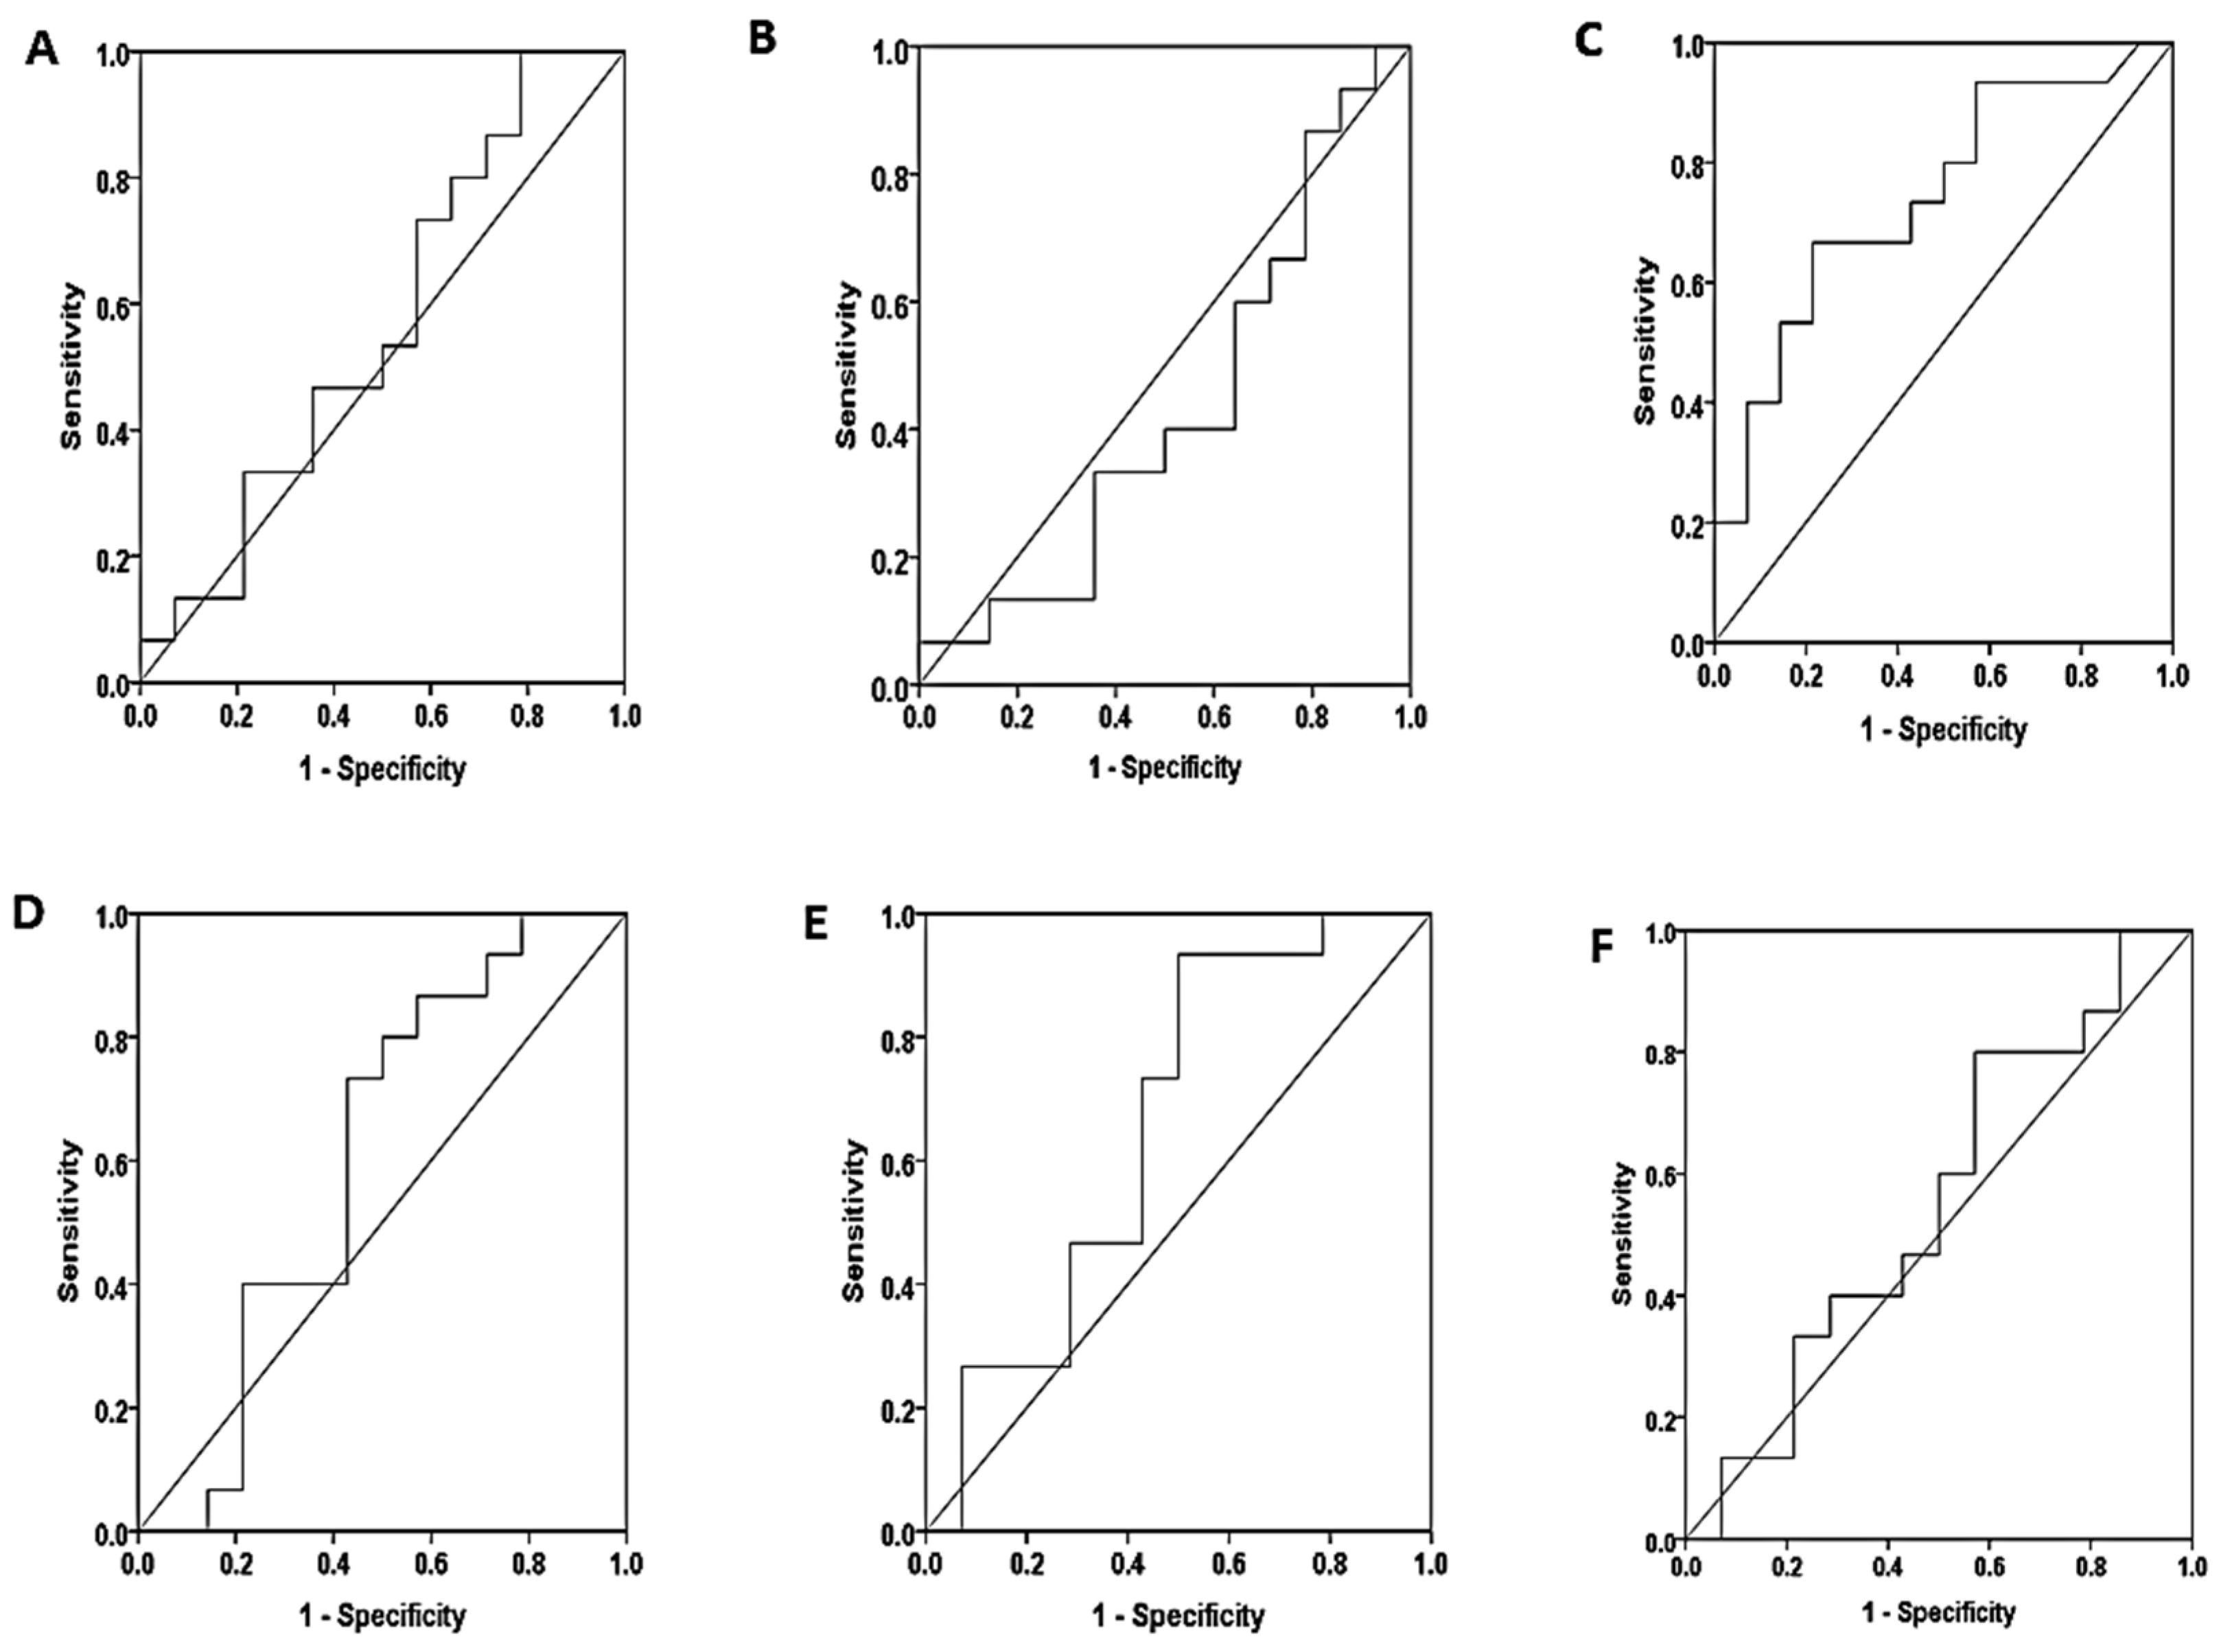
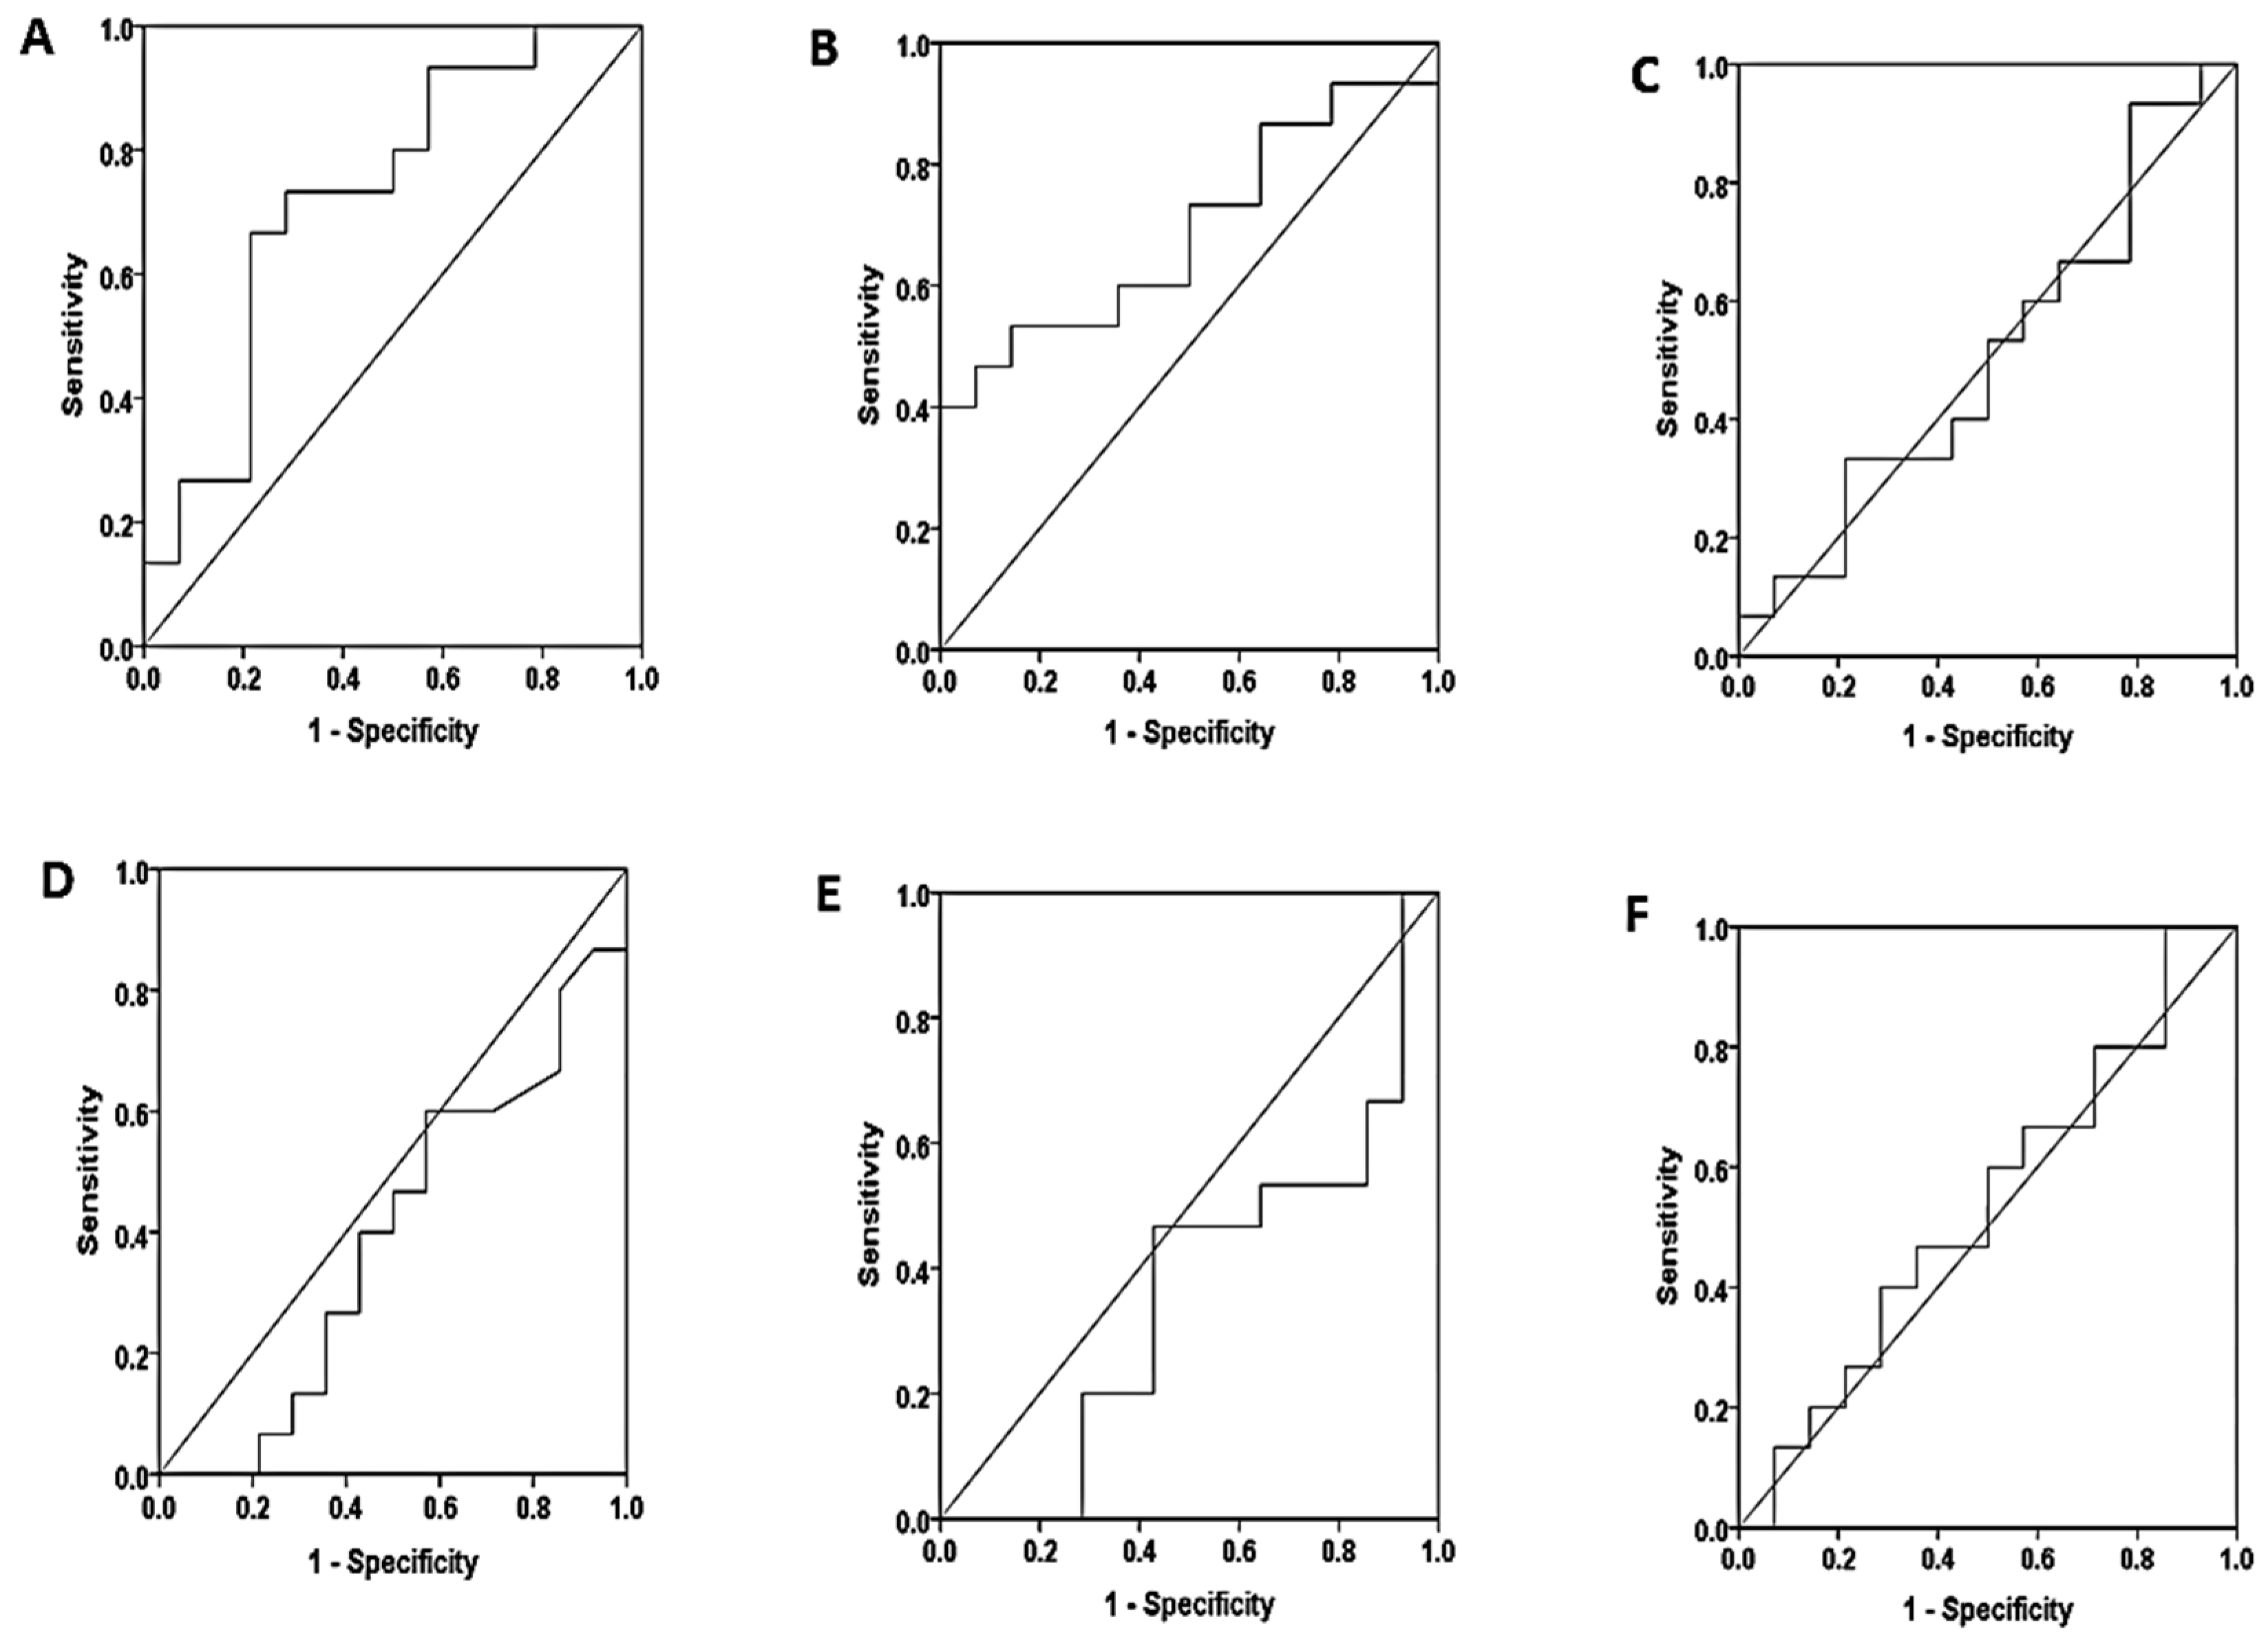
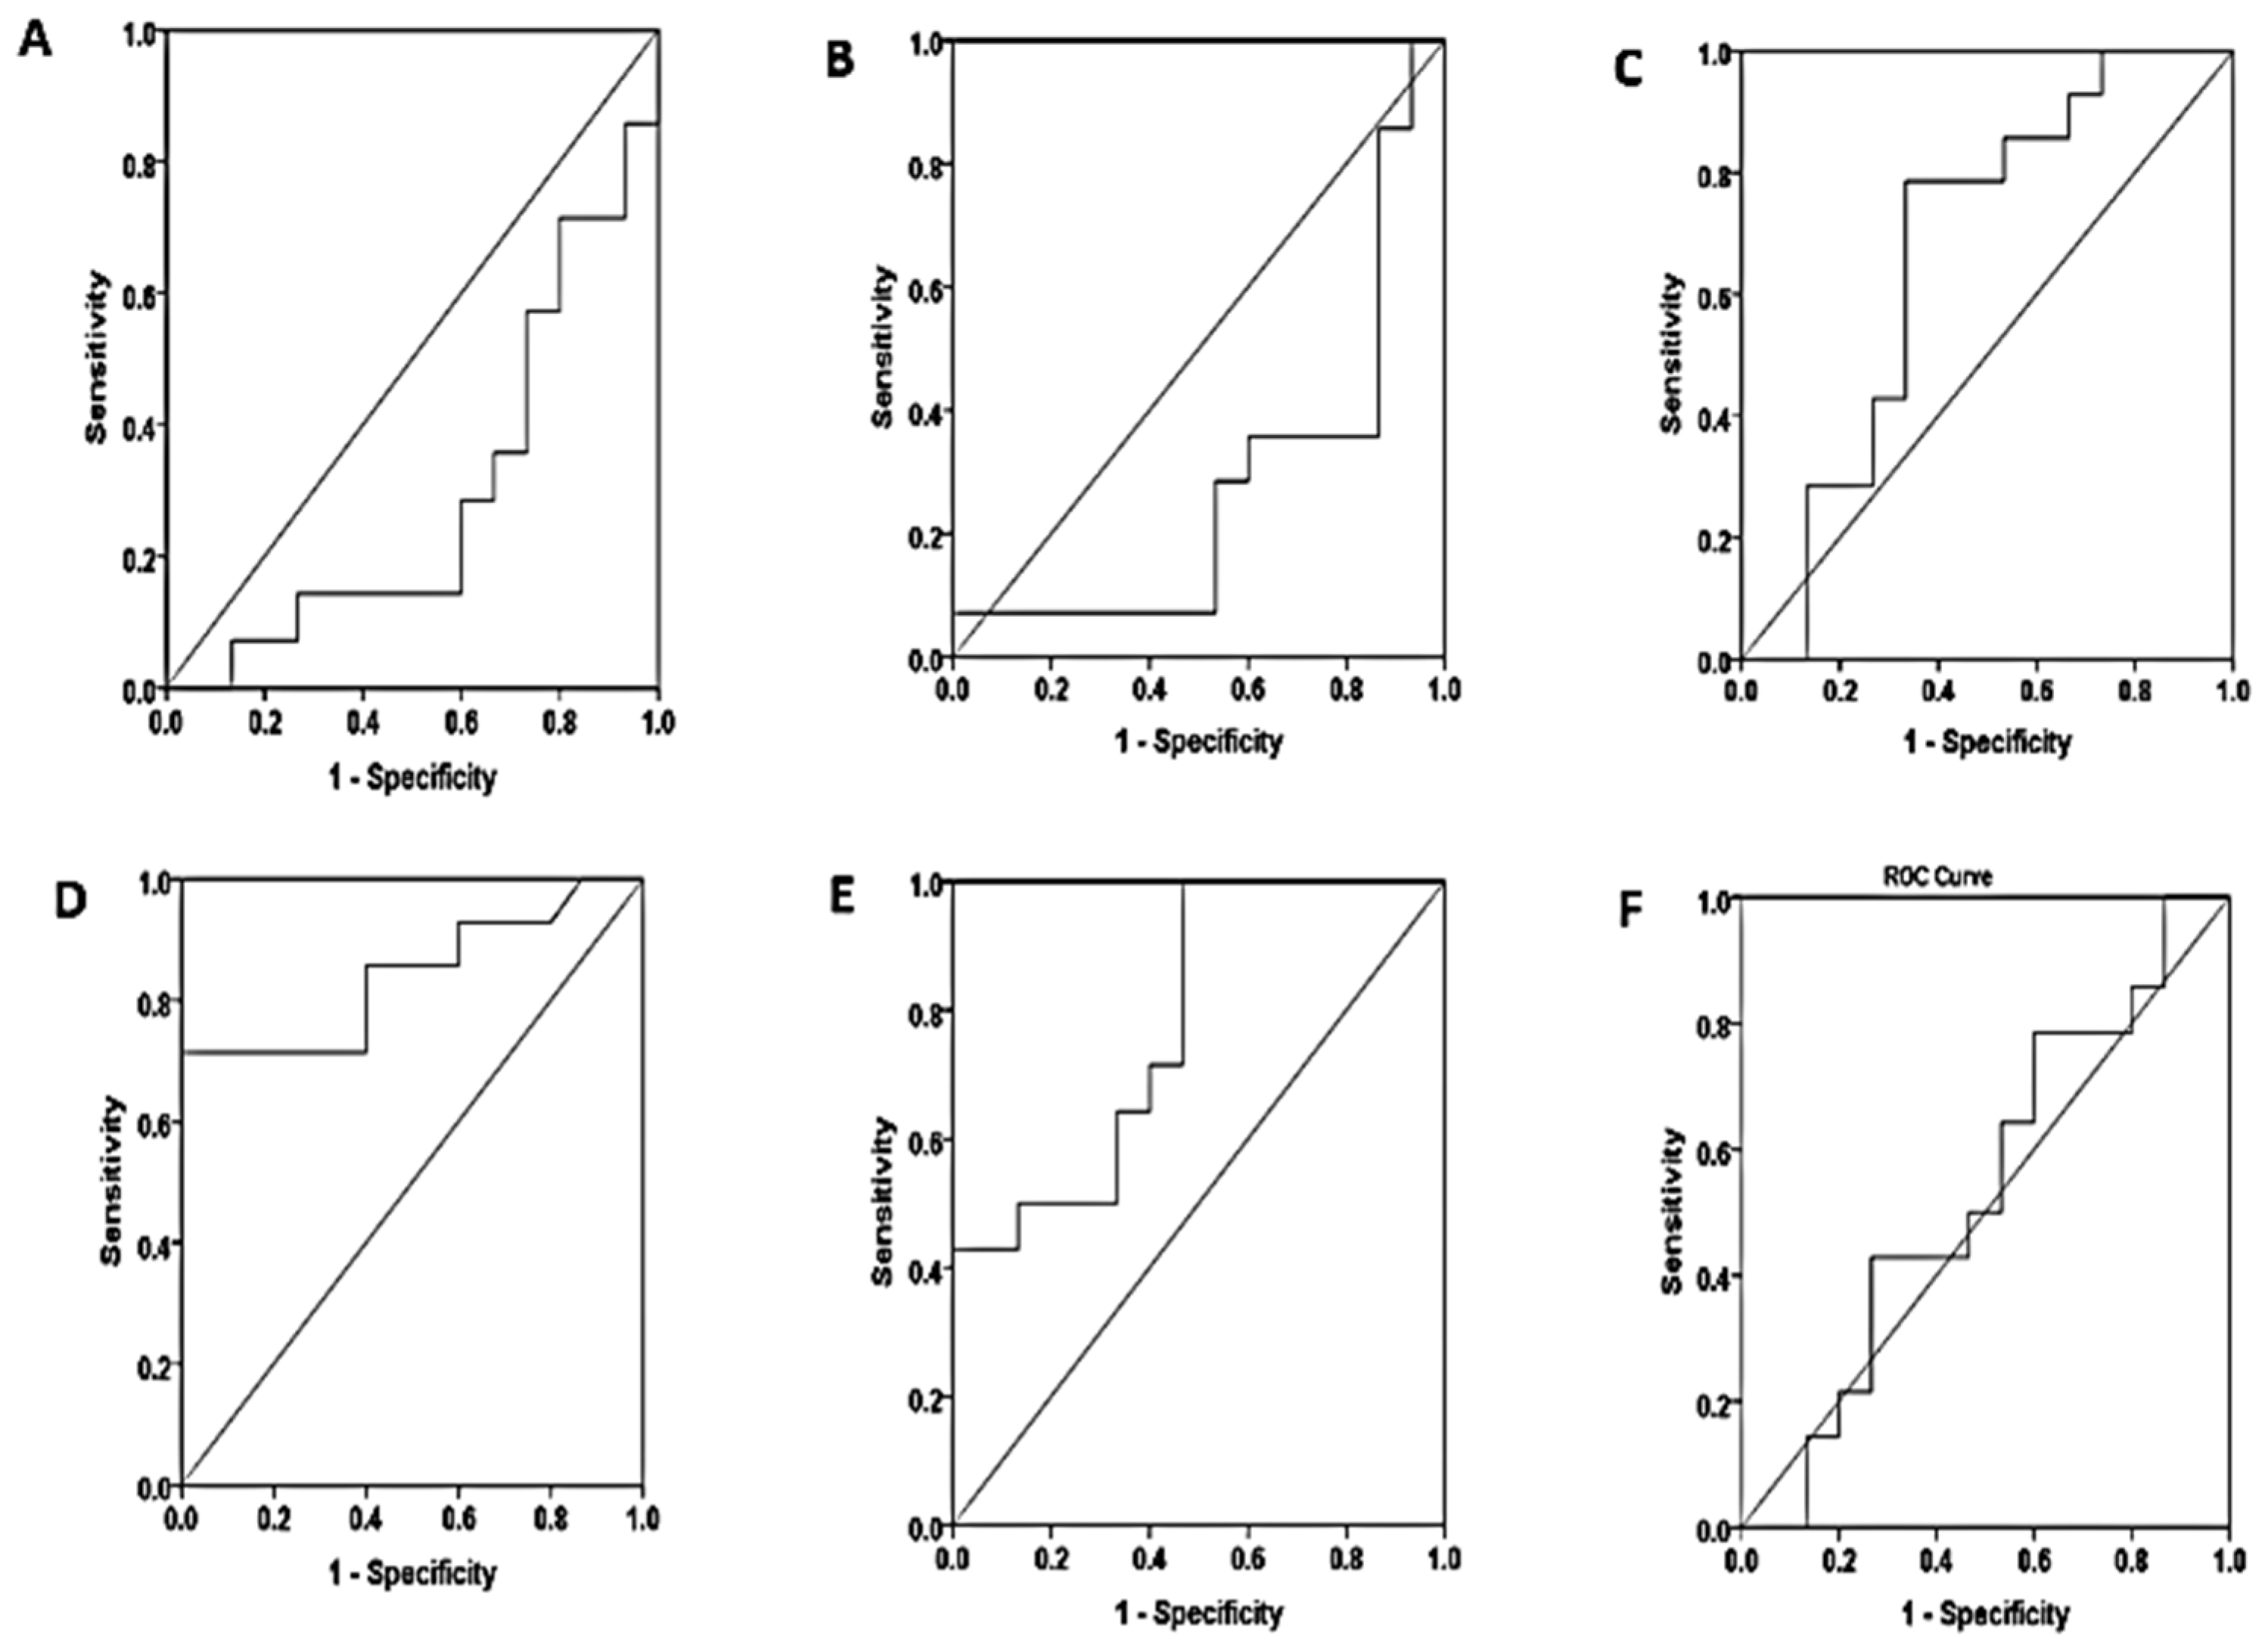
| Marker | sensitivity | specificity | Cutoff value | area | sig | |
| Non proteinuria – Mild proteinuria | ||||||
| serum | S.K.FLC | 73.3% | 42.9% | 56.01 | 0.562 | 0.570 |
| S.L.FLC | 86.7% | 21.4% | 7.71 | 0.433 | 0.541 | |
| S.K/l ratio | 80.0% | 50.0% | 0.33 | 0.605 | 0.337 | |
| saliva | SA.K.FLC | 66.7% | 64.3% | 2.83 | 0.740 | 0.028 |
| SA.L.FLC | 80.0% | 50.0% | 16.03 | 0.657 | 0.150 | |
| SA.K/l ratio | 73.3% | 42.9% | 0.012 | 0.552 | 0.631 | |
| Non proteinuria – Severe proteinuria | ||||||
| serum | S.K.FLC | 73.3% | 57.1% | 66.73 | 0.724 | 0.040 |
| S.L.FLC | 73.3% | 42.9% | 15.11 | 0.690 | 0.081 | |
| S.K/L ratio | 60.0% | 42.90% | 0.31 | 0.505 | 0.965 | |
| saliva | SA.K.FLC | 60% | 35.7% | 0.92 | 0.393 | 0.326 |
| SA.L.FLC | 53.3% | 35.7% | 10.65 | 0.362 | 0.206 | |
| SA.K/L ratio | 66.7% | 42.9% | 0.01 | 0.553 | 0.760 | |
| Mild proteinuria – Severe proteinuria | ||||||
| serum | S.K.FLC | 50.0% | 26.7% | 640.01 | 0.290 | 0.055 |
| S.L.FLC | 35.7% | 40.0% | 18.27 | 0.276 | 0.040 | |
| S.K/L ratio | 85.7% | 46.7% | 0.32 | 0.667 | 0.127 | |
| saliva | SA.K.FLC | 71.4% | 86.7% | 3.08 | 0.840 | 0.002 |
| SA.L.FLC | 92.9% | 53.3% | 14.91 | 0.781 | 0.010 | |
| SA.K/L ratio | 78.6% | 40.0% | 0.01 | 0.533 | 0.760 | |
| Saliva | |||||
| serum | K.FLC | L.FLC | K/L ratio | ||
| K.FLC | -0.306* | -0.097 | -0.415** | Pearson Correlation | |
| 0.043 | 0.533 | 0.005 | Sig. (2-tailed) | ||
| L.FLC | -0.334* | -0.063 | 0.011 | Pearson Correlation | |
| 0.027 | 0.686 | 0.944 | Sig. (2-tailed) | ||
| K/L ratio | 0.010 | -0.078 | -0.110 | Pearson Correlation | |
| 0.950 | 0.615 | 0.478 | Sig. (2-tailed) | ||
Disclaimer/Publisher’s Note: The statements, opinions and data contained in all publications are solely those of the individual author(s) and contributor(s) and not of MDPI and/or the editor(s). MDPI and/or the editor(s) disclaim responsibility for any injury to people or property resulting from any ideas, methods, instructions or products referred to in the content. |
© 2024 by the authors. Licensee MDPI, Basel, Switzerland. This article is an open access article distributed under the terms and conditions of the Creative Commons Attribution (CC BY) license (http://creativecommons.org/licenses/by/4.0/).


