Submitted:
17 May 2024
Posted:
20 May 2024
You are already at the latest version
Abstract
Keywords:
1. Introduction
2. Battery Modelling and State of the Art
2.1. Technology Comparison
2.2. The Optimization Model
- Lithium battery
- Vanadium Redox Flow Battery (VRFB)
- Lead Acid battery
- Niquel Cadmium battery (NiCd)
- Sodium-Sulphur battery (NaS)
- Flywheel
- Supercapacitors
2.3. Degradation
2.4. Environmental Weight in the Model
3. Demonstrations and Results
3.1. Model Simulation
3.2. Field Data and Demonstration


4. Conclusions
Author Contributions
Funding
Data Availability Statement
Conflicts of Interest
Nomenclature
| Indices and sets | |
| t T | Set of time intervals |
| J J | Horizon: if 1, variable is within optimization horizon, if 2, variable is part of the next horizon |
| s | Segment of inverter’s linearization curve; |
| Parameters | |
| Length of time intervals (h) | |
| Forecasted market prices (€/kWh) | |
| Maximum power injection/absorption at the point of common coupling (kW) | |
| BESS initial energy content (kWh) | |
| BESS maximum energy content (kWh) | |
| BESS minimum energy content (kWh) | |
| BESS degradation curve linearization slope | |
| Constant charging efficiency ( | |
| Constant discharging efficiency ( | |
| BESS maximum charging power (inverters’ limits) (VA) | |
| BESS maximum discharging power (inverters’ limits) (VA) | |
| BESS minimum charging power (inverters’ limits) (VA) | |
| BESS minimum discharging power (inverters’ limits) (VA) | |
| Variables | |
| Active power absorption at PCC (kW) | |
| BESS charging active power set point at AC side (kW) for battery one | |
| BESS discharging active power set point at AC side (kW) for battery one | |
| BESS charging active power set point at AC side (kW) for battery two | |
| BESS discharging active power set point at AC side (kW) for battery two | |
| BESS charging active power set point at AC side (kW) | |
| BESS discharging active power set point at AC side (kW) | |
| Auxiliary binary variable for non-simultaneity of inverse flows at BESS | |
| Auxiliary binary variable for non-simultaneity of inverse flows at PCC | |
| BESS energy content (kWh) | |
| BESS degraded energy content as a result of a discharge event (Wh) |
References
- European Commission, “Communication from the Commission to the European Parliament, the European Council, the Council, the European Economic and Social committee and the committee of the regions,” Dec. 2019. Accessed: Oct. 26, 2023. [Online]. Available: https://eur-lex.europa.eu/resource.html?uri=cellar:b828d165-1c22-11ea-8c1f-01aa75ed71a1.0002.02/DOC_1&format=PDF.
- European Commission, “Fit for 55,” 2023, Accessed: Oct. 26, 2023. [Online]. Available: https://www.consilium.europa.eu/en/policies/green-deal/fit-for-55-the-eu-plan-for-a-green-transition/.
- European Commission, “Economic and social committee and the committee of the regions REPowerEU: Joint European Action for more affordable, secure and sustainable energy,” Strasbourg, Mar. 2022.
- Energy Agency, “Net Zero by 2050 - A Roadmap for the Global Energy Sector,” 2050. [Online]. Available: www.iea.org/t&c/.
- Energy Storage,” International Energy Agency: IEA, 2023, Accessed: Sep. 12, 2023. [Online]. Available: https://www.iea.org/energy-system/electricity/grid-scale-storage.
- Leon, J.I.; Dominguez, E.; Wu, L.; Alcaide, A.M.; Reyes, M.; Liu, J. Hybrid Energy Storage Systems: Concepts, Advantages, and Applications. IEEE Ind. Electron. Mag. 2021, 15, 74–88. [Google Scholar] [CrossRef]
- Wu, X.; Zhao, W.; Wang, X.; Li, H. An MILP-Based Planning Model of a Photovoltaic/Diesel/Battery Stand-Alone Microgrid Considering the Reliability. IEEE Trans. Smart Grid 2021, 12, 3809–3818. [Google Scholar] [CrossRef]
- Andrychowicz, M. The Impact of Energy Storage along with the Allocation of RES on the Reduction of Energy Costs Using MILP. Energies 2021, 14, 3783. [Google Scholar] [CrossRef]
- Farrokhifar, M.; Aghdam, F.H.; Alahyari, A.; Monavari, A.; Safari, A. Optimal energy management and sizing of renewable energy and battery systems in residential sectors via a stochastic MILP model. Electr. Power Syst. Res. 2020, 187, 106483. [Google Scholar] [CrossRef]
- Liu, P.; Cai, Z.; Xie, P.; Li, X.; Zhang, Y. A Computationally Efficient Optimization Method for Battery Storage in Grid-connected Microgrids Based on a Power Exchanging Process. Energies 2019, 12, 1512. [Google Scholar] [CrossRef]
- Pippia, T.; Sijs, J.; De Schutter, B. A Single-Level Rule-Based Model Predictive Control Approach for Energy Management of Grid-Connected Microgrids. IEEE Trans. Control. Syst. Technol. 2020, 28, 2364–2376. [Google Scholar] [CrossRef]
- A MILP optimization model for assessing the participation of distributed residential PV-battery systems in the ancillary services market. CSEE J. Power Energy Syst. 2021, 7, 348–357. [CrossRef]
- Li, Y.; Wu, J. Optimum Integration of Solar Energy With Battery Energy Storage Systems. IEEE Trans. Eng. Manag. 2022, 69, 697–707. [Google Scholar] [CrossRef]
- IEEE Power & Energy Society. and Institute of Electrical and Electronics Engineers, ICPEA 2019 : 2019 IEEE 2nd International Conference on Power and Energy Applications (ICPEA) : April 27-30, 2019, Singapore.
- Reniers, J.M.; Mulder, G.; Ober-Blöbaum, S.; Howey, D.A. Improving optimal control of grid-connected lithium-ion batteries through more accurate battery and degradation modelling. J. Power Sources 2018, 379, 91–102. [Google Scholar] [CrossRef]
- Rahman, M.; Oni, A.O.; Gemechu, E.; Kumar, A. Assessment of energy storage technologies: A review. Energy Convers. Manag. 2020, 223, 113295. [Google Scholar] [CrossRef]
- Zakeri, B.; Syri, S. Electrical energy storage systems: A comparative life cycle cost analysis. ISSN 1364-0321. Renew. Sustain. Energy Rev. 2015, 42, 569–596. [Google Scholar] [CrossRef]
- R. Silva, C. Gouveia, L. Carvalho, and J. Pereira, “Improved battery storage systems modeling for predictive energy management applications,” 22 Power Systems Computation Conference, Jul. 2022.
- Swierczynski, M.; Stroe, D.I.; Stan, A.-I.; Teodorescu, R.; Sauer, D.U. Selection and Performance-Degradation Modeling of LiMO$_{2}$/Li$_{4}$Ti$_{5}$O$_{12}$ and LiFePO$_{4}$/C Battery Cells as Suitable Energy Storage Systems for Grid Integration With Wind Power Plants: An Example for the Primary Frequency Regulation Service. IEEE Trans. Sustain. Energy 2014, 5, 90–101. [Google Scholar] [CrossRef]
- Entsoe Transparency Platform”, Accessed: Oct. 26, 2023. [Online]. Available: https://transparency.entsoe.eu/.
- Englberger, S.; Jossen, A.; Hesse, H. Unlocking the Potential of Battery Storage with the Dynamic Stacking of Multiple Applications. Cell Rep. Phys. Sci. 2020, 1. [Google Scholar] [CrossRef]
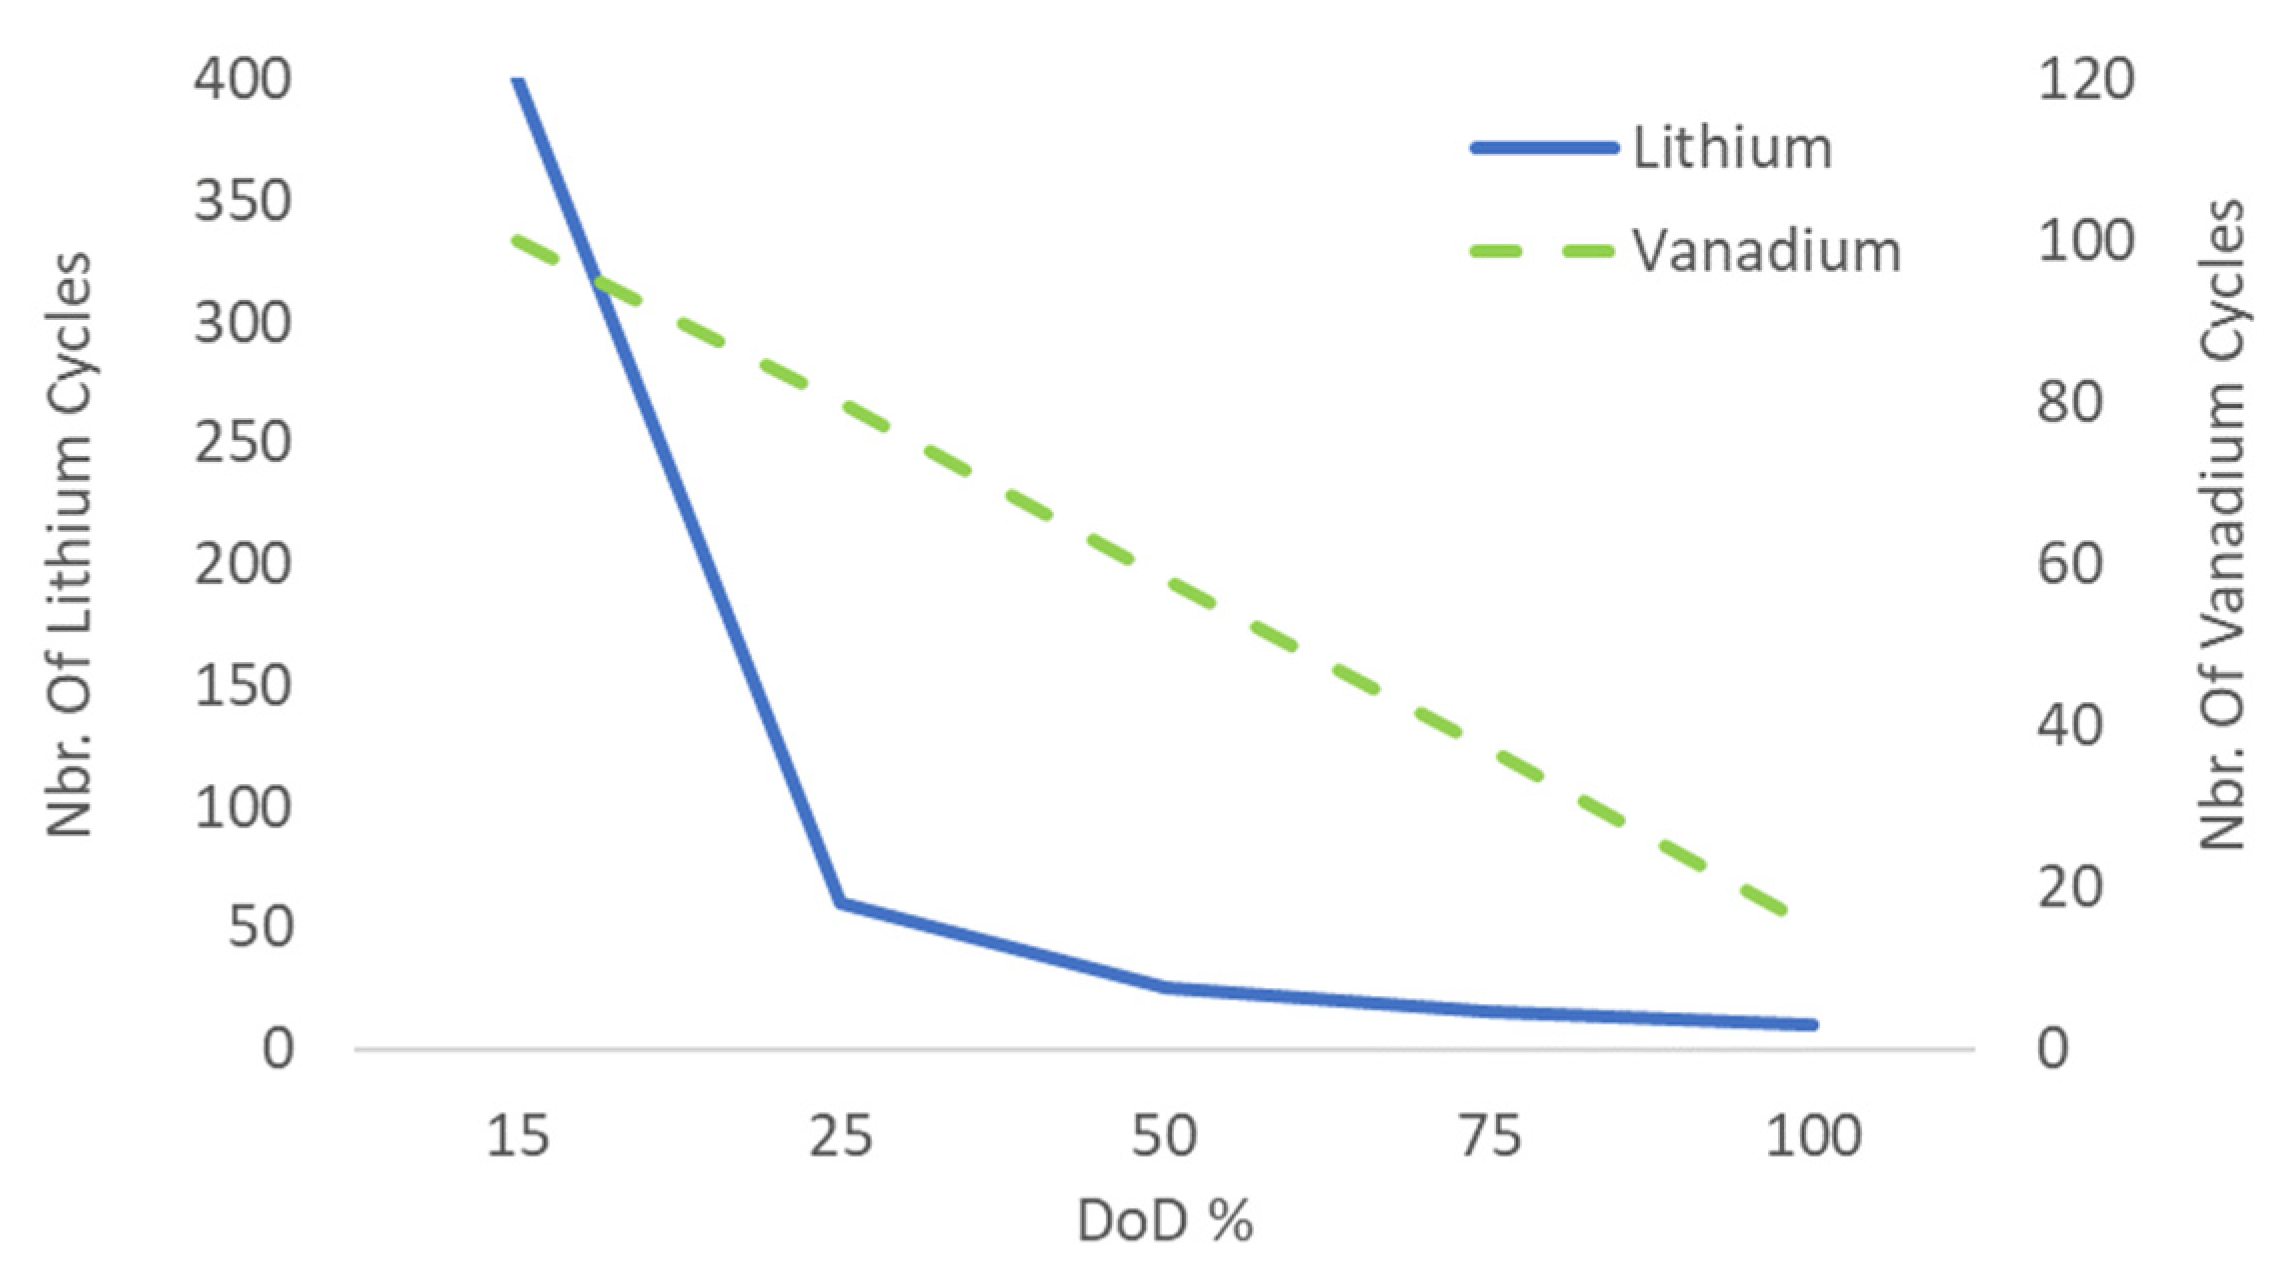
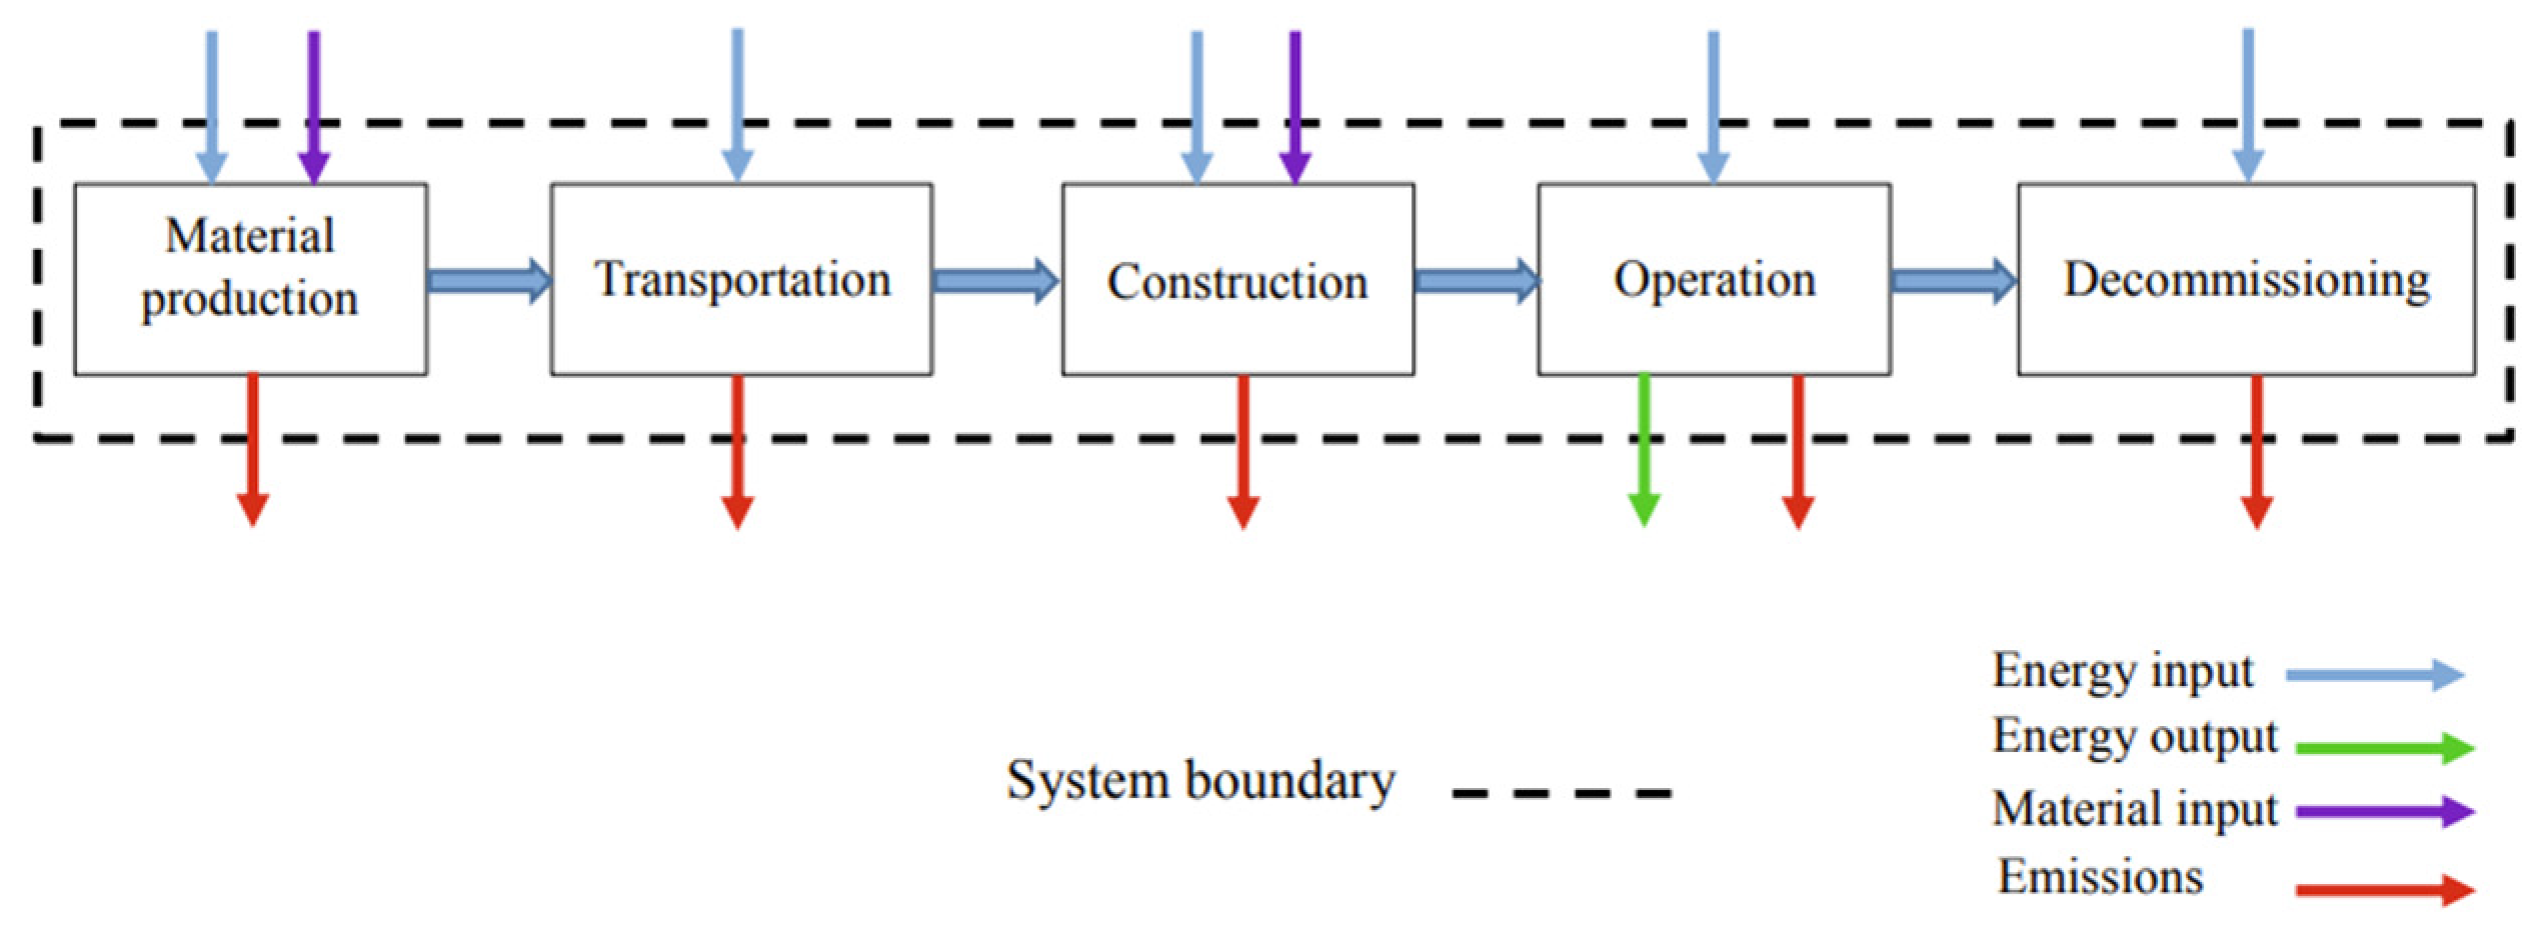

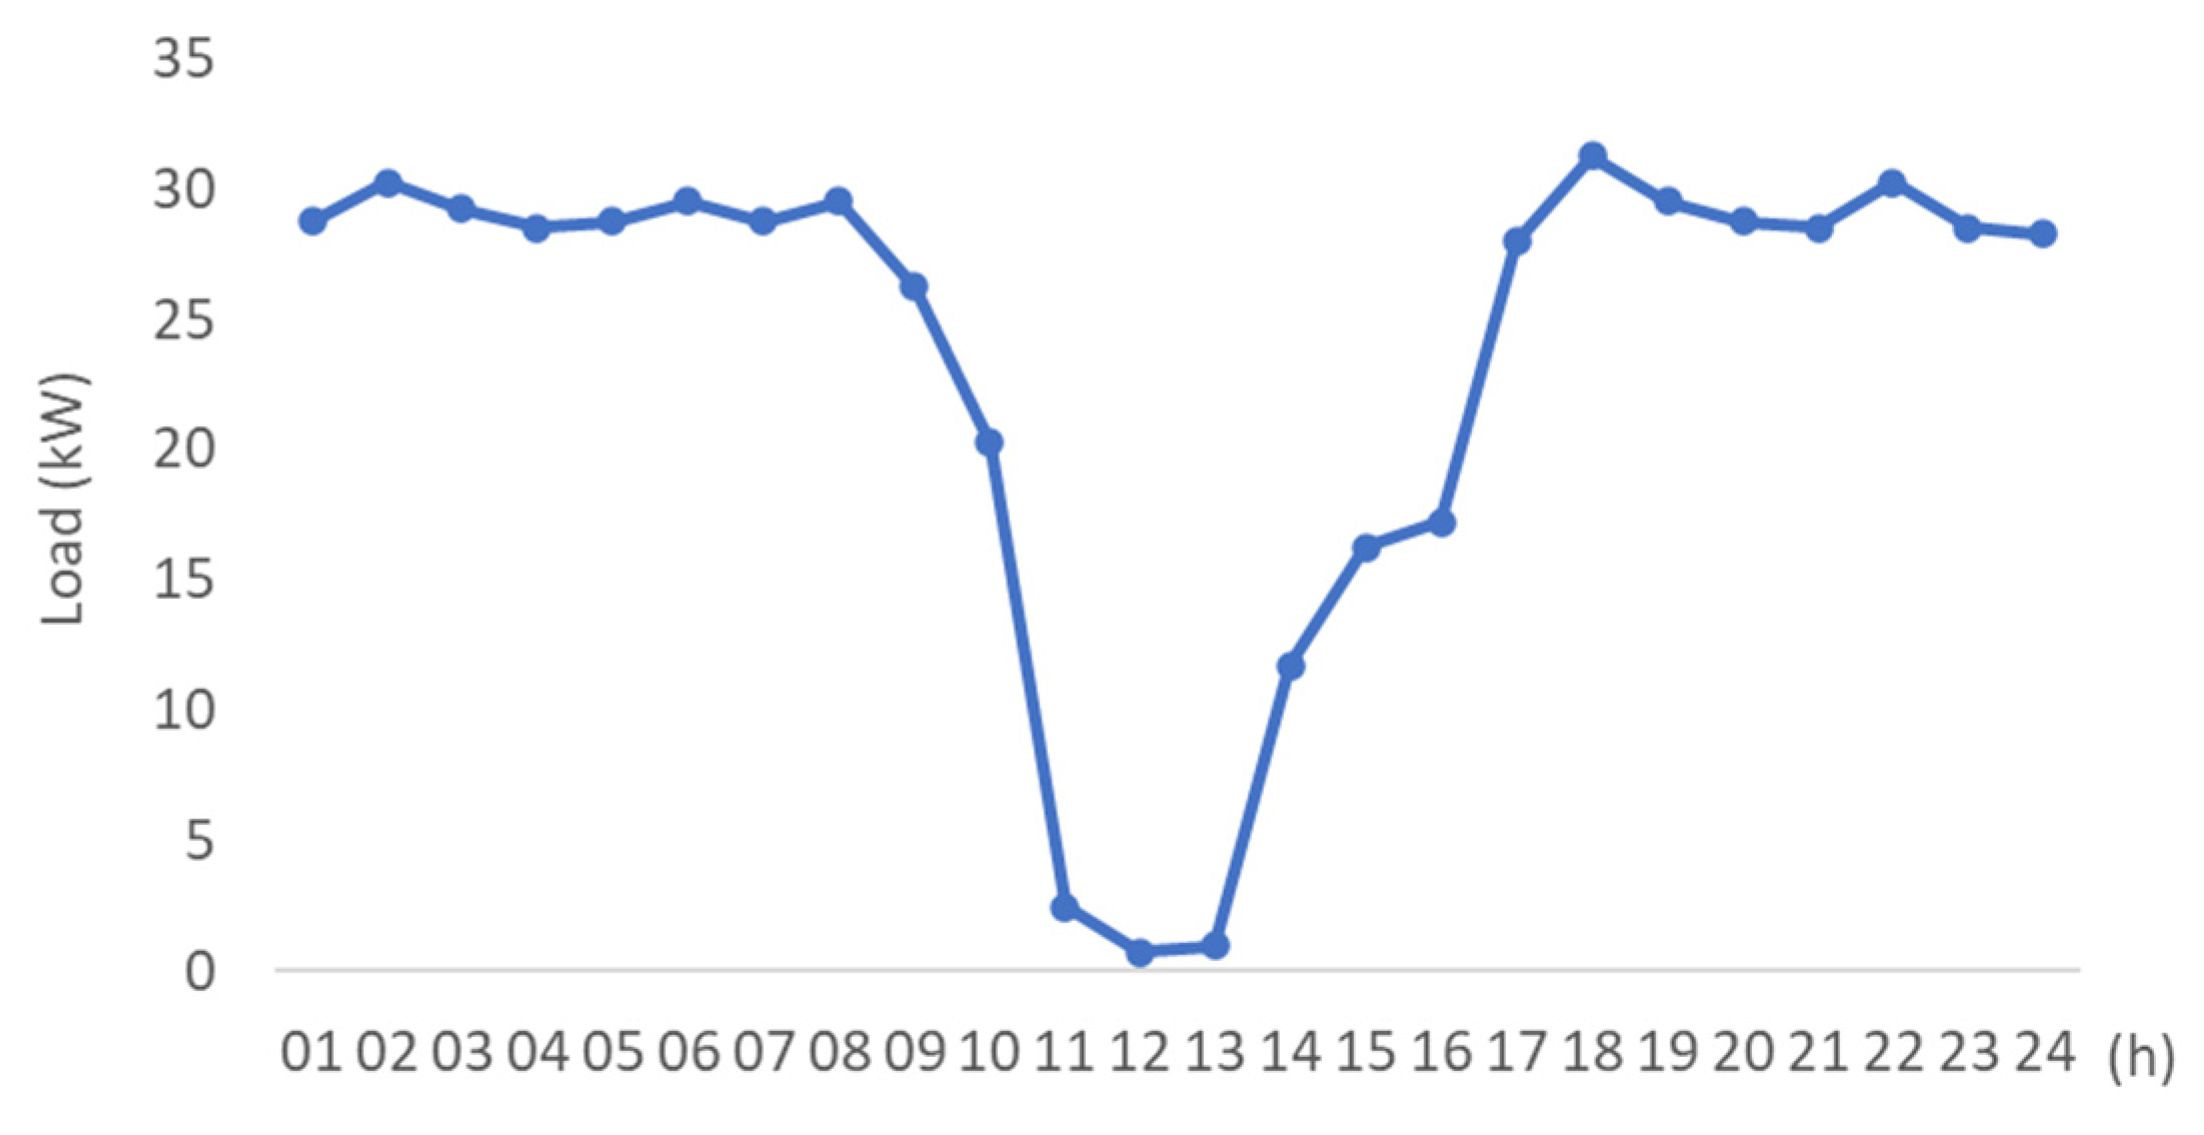
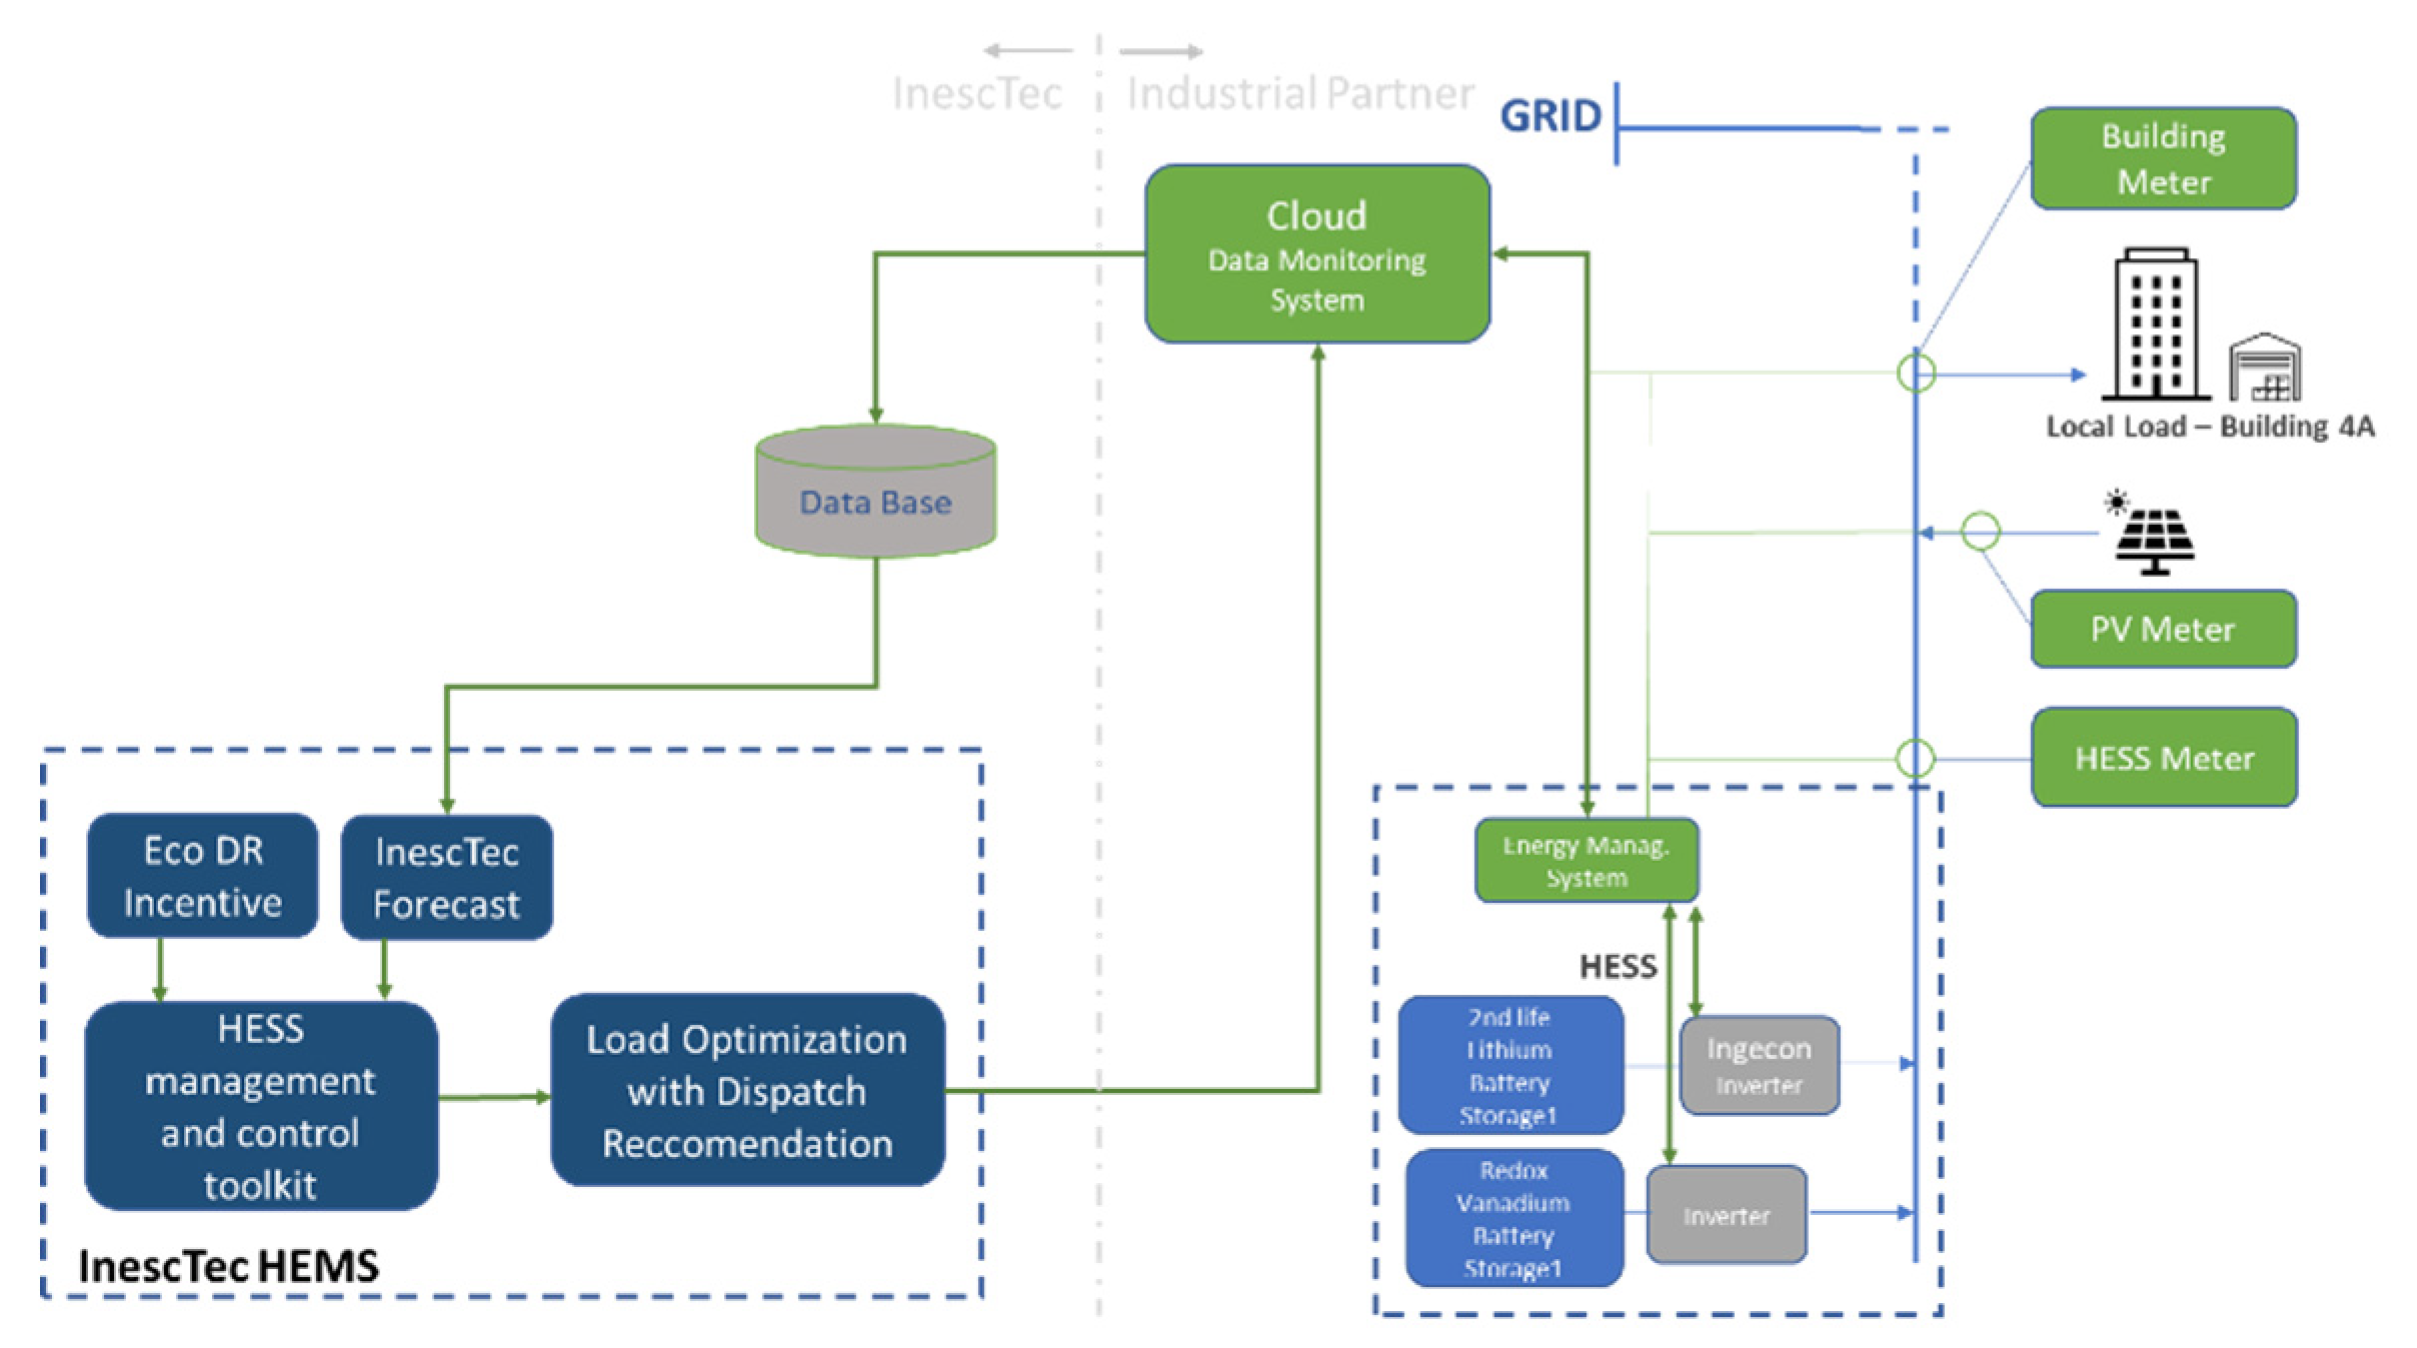
| ESS Technology | Power range (MW) | Efficiency | Power density (W/kg) | Energy density (Wh/kg) | Lifetime (year) | Nbr. Life cycles | Discharge time | Self-discharge (%) |
| Flywheel | Up to 0.25 | 0.80-0.93 | 1000 | 5-100 | 15-20 | 20,000-100,000 | ms-15 m | 100 |
| Lead-acid | Up to 20 | 0.75-0.85 | 75-300 | 30-50 | 5-15 | 2000-4500 | s-h | 0.1-0.3 |
| NaS | 0.05-8 | 0.80-0.90 | 150-230 | 150-250 | 10-15 | 2500-4500 | s-h | 20 |
| Ni-Cd | Up to 40 | 0.60-0.70 | 50-1000 | 15-300 | 10-20 | 2000-2500 | s-h | 0.2-0.6 |
| Li-ion | Up to 0.01 | 0.85-0.95 | 50-2000 | 150-350 | 5-15 | 1500-4500 | m-h | 0.1-0.3 |
| VRFB | 0.03-3 | 0.75-0.85 | 166 | 10-35 | 5-10 | 10,000-13,000 | s-10 h | Small |
| Supercapacitors | Up to 0.05 | 0.85-0.98 | 100,000 | 0.05-5 | 5-8 | 50,000 | ms-60 m | 40 |
| ESS technology | Configuration | Total capital cost (TCC) per unit of power rating €/kW | Total capital cost (TCC) per unit of storage capacity €/kW | ||||
| Min | Average | Max | Min | Average | Max | ||
| Flywheel | High-speed | 590 | 867 | 1446 | |||
| Lead-acid | Advanced | 1388 | 2140 | 3254 | 346 | 437 | 721 |
| NaS | - | 1863 | 2254 | 2361 | 328 | 343 | 398 |
| Ni-Cd | - | 2279 | 3376 | 4182 | 596 | 699 | 808 |
| Li-ion | - | 2109 | 2512 | 2746 | 459 | 546 | 560 |
| VRFB | - | 1277 | 1360 | 1649 | 257 | 307 | 433 |
| Supercapacitors | Double layer | 214 | 229 | 247 | 691 | 765 | 856 |
| Functional unit | System boundary | Data sources and models | Impact categories considered | Sensitivity/ Uncertainty analysis | Emissions (gCO2eq/kWh) |
|
|---|---|---|---|---|---|---|
| Pb-A | 1 kWh | Cradle to gate and operation | Industry and ecoinvent database | GWP | Y/Y | 170-740 |
| Li-ion | 1 kWh | Cradle to grave | Existing studies and ecoinvent studies | GWP | Y/N | 170-740 |
| Na-S | 1 MWh | Cradle to gate and emission | Existing literature and ecoinvent database | CED and GWP | Y/N | 170-740 |
| VRFB | 1 MWh | Cradle to grave | Ecoinvent database | GWP, HT, acidification and abiotic depletion | N/N | 170-740 |
| Flywheel | 150 kWh | Cradle to gate | Existing literature | GHG | NA | 173 |
| Supercapacitors | 150 kWh | Cradle to gate | Existing literature | GHG | NA | 416 |
| Technology | Efficiency % | Scenario 1 (OF1) | ||
| Energy cost € | Degradation cost € | Total Cost € | ||
| One Lithium Battery | 0.85-0.95 | 1185.8-1143.5 | 55.6 -74.1 | 1241.3-1217.6 |
| Two Lithium batteries | 0.85-0.95 | 1190.4- 1145.7 | 52.4-73.1 | 1242.8-1218.8 |
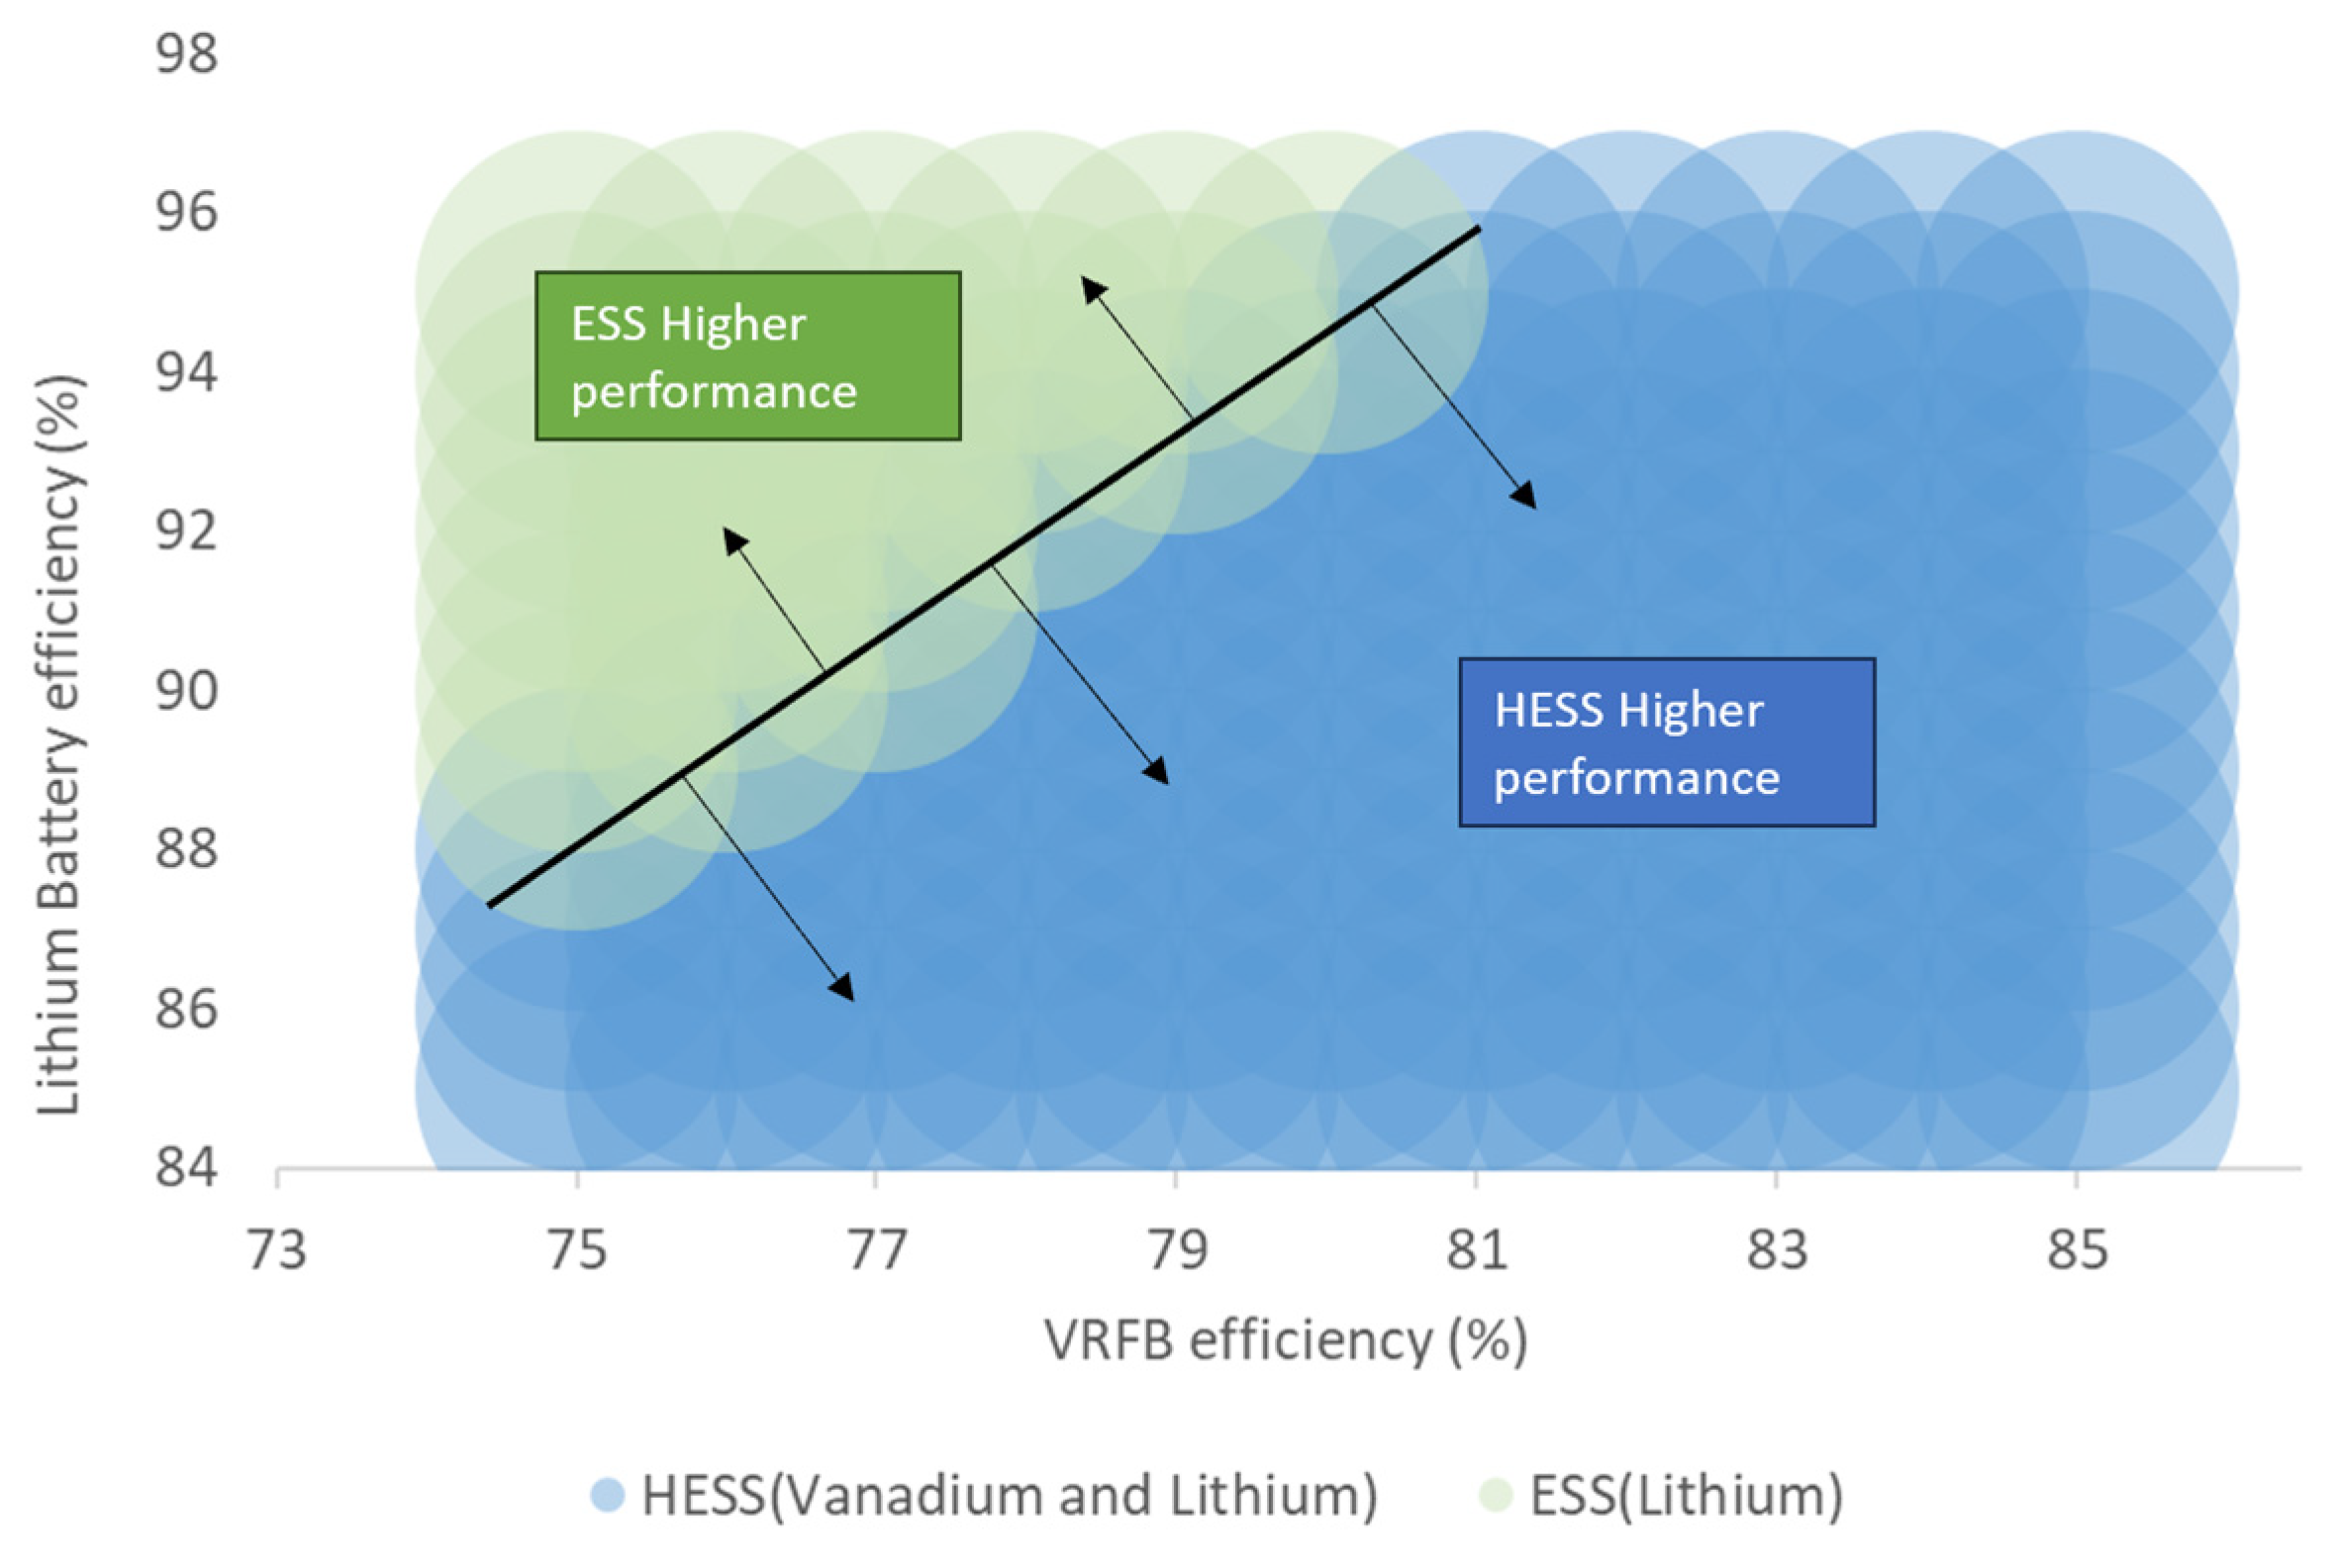
| Lithium and Vanadium batteries | 0.75-0.85 | 1195.1-1152.9 | 44.4-60.6 | 1239.5-1213.5 |
| Lithium and Lead-Acid batteries | 0.75-0.85 | 1208.2-1175.0 | 41.1-55.4 | 1249.3-1230.4 |
| Lithium and Ni_Cd batteries | 0.60-0.70 | 1208.2-1175.0 | 41.1-55.4 | 1249.3-1230.4 |
| Lithium and NaS batteries | 0.80-0.90 | 1203.9-1166.1 | 43.7-62.0 | 1247.5-1228.1 |
| Lithium battery and flywheel | 0.80-0.95 | 1208.1-1173.3 | 41.1-57.0 | 1249.2-1230.3 |
| Lithium battery and supercapacitors | 0.85-0.98 | 1184.1-1134.4 | 40.7-54.5 | 1224.8-1188.8 |
| Technology | Efficiency % | Scenario 2 (OF2) | ||
| Energy term (kgCO2) | Degradation term (kgCO2) | Total Emissions (kgCO2) | ||
| One Lithium Battery | 0.85-0.95 | 5123.7- 4877.2 | 19.1- 91.8 | 5142.8-4968.0 |
| Two Lithium batteries | 0.85-0.95 | 5124.2-4879.8 | 18.8.3-91.8 | 5143.0-4971.6 |
| Lithium and Vanadium batteries | 0.75-0.85 | 5125.2-4891.7 | 18.3-87,4 | 5143.5-4979.1 |
| Lithium and Lead-Acid batteries | 0.75-0.85 | 5125.2-4891.9 | 18.3-87.4 | 5143.5-4979.3 |
| Lithium and NaS batteries | 0.80-0.90 | 5125.2-4891.9 | 18.3-87.4 | 5143.5-4979.3 |
| Lithium battery and flywheel | 0.80-0.95 | 5125.2-4877.8 | 18.2-80.4 | 5143.4-4958.2 |
| Lithium battery and supercapacitors | 0.85-0.98 | 5123.2-4853.6 | 16.1-75.0 | 5139.3-4928.6 |
| Technology | Efficiency % | Scenario 1 (OF1) | ||
| Energy cost € | Degradation cost € | Total Cost € | ||
| One Lithium Battery | 0.85-0.95 | 1185.8-1143.5 | 55.6 -74.1 | 1241.3-1217.6 |
| Lithium and Vanadium batteries | 0.75-0.85 | 1196.9-1157.6 | 35.6-48.4 | 1232.5-1206 |
| Technology | Efficiency % | Scenario 2 (OF2) | ||
| Energy term (kgCO2) | Degradation term (kgCO2) | Total Emissions (kgCO2) | ||
| One Lithium Battery | 0.85-0.95 | 5123.7- 4877.2 | 19.1- 91.8 | 5142.8-4968.0 |
| Lithium and Vanadium batteries | 0.75-0.85 | 5134.3-4945.9 | 14.0-67.9 | 5148.3-5013.8 |
Disclaimer/Publisher’s Note: The statements, opinions and data contained in all publications are solely those of the individual author(s) and contributor(s) and not of MDPI and/or the editor(s). MDPI and/or the editor(s) disclaim responsibility for any injury to people or property resulting from any ideas, methods, instructions or products referred to in the content. |
© 2024 by the authors. Licensee MDPI, Basel, Switzerland. This article is an open access article distributed under the terms and conditions of the Creative Commons Attribution (CC BY) license (http://creativecommons.org/licenses/by/4.0/).


