Preprint
Article

Vehicle to Vehicle Communication with LoRa network

Altmetrics

Downloads

113

Views

74

Comments

0

This version is not peer-reviewed

Submitted:

20 May 2024

Posted:

20 May 2024

You are already at the latest version

Alerts
Abstract
The primary objective of this experiment is to enhance road safety and mitigate the occurrence of accidents by leveraging Low Power Wide Area Networks (LPWAN), specifically focusing on the Long Range (LoRa) network. Through comprehensive research into LPWANs and their various applications, we have designed and implemented a novel approach employing two mobile robots. These robots are utilized to emulate a typical traffic scenario, with one robot leading the way, skillfully maneuvering around obstacles, while the other robot closely follows behind, tracing the same path. The leading robot is tasked with collecting data from its internal environment, the external surroundings, and its operator through an array of sensors. Subsequently, this data is transmitted to the trailing robot. The follower robot's role is to analyze the data received and formulate decisions based on this information. Its objective is to mimic safe driving behavior, particularly when the received data deviates from the expected norms. In such instances, the follower robot will opt to decelerate significantly, thereby minimizing the risk of collision. By implementing this innovative system, we aim to significantly enhance driving safety and reduce the occurrence of accidents on the road.
Keywords: 
Subject: Engineering  -   Electrical and Electronic Engineering

1. Introduction

The development of Internet of Things (IoT) and low-power networks has encouraged more and more sectors to implement these types of solutions to monitor their systems and increase productivity. In the automotive industry, IoT has manifested itself in an emerging concept based on communication from one vehicle to another, which aims to increase road safety and reduce the number of annual fatal accidents by providing a better driving experience. Communication between vehicles allows each car to be aware of the presence of others around it, and to exchange information in real time, such as its position, speed, or alerts in the event of an accident.
Based on communication between vehicles and the LoRa network, this experiment aims to develop two mobile robots that act as a prototype to simulate a case of point-to-point communication between two vehicles. The leading robot has several sensors built into it to measure the humidity and temperature of the environment, the driver's pulse and the level of gas inside the vehicle. To avoid obstacles, it also has two ultrasound sensors to measure its distance from objects. The second robot, the follower, also has an ultrasound sensor, but it is used to measure the distance to the robot (vehicle) in front, and will adjust its behavior, reducing its speed, depending on the values received from the first robot.
In addition to simulating a traffic situation between two vehicles, the aim is also to assess the influence of certain LoRa modulation parameters, with a particular focus on the spreading factor, on the received signal strength indicator at different distances, both with and without obstacles, to be able to infer in which situation a lower or higher value of the spreading factor is more appropriate.

2. State of the Art and Methods

In this section we contextualize the experiment carried out in terms of the state of the art and explain the methodology used, highlighting some theoretical aspects that support LoRa technology, as well as the components used to test the experiment.

2.1. State of the Art

With the emergence of low-power networks and the commercial interest in IoT devices, the LoRa network has been gaining in popularity as it satisfies the vast number of users in communication networks between vehicles. The term Internet of Vehicles [1] (IoV) has emerged, where authors Yuke Li, S. Han, L. Yang, F. Wang and Hui Zhang report the need for a new paradigm to guarantee connectivity for a large number of devices, low cost and consumption, and wide coverage, while resisting the noise caused by the Doppler effect when devices are in motion.
The authors carried out Monte Carlo simulations to analyze the performance of the bit error rate (BER) compared to the signal to noise ratio (SNR), in six different Vehicle-To-Everything (V2X) communication scenarios, where the car moves at different speeds and is subject to signal frequency changes due to Doppler effects. In this study, they concluded that to resist greater Doppler effects, a wider bandwidth and lower spreading factor should be selected.
Ana Torres, Claudio Silva and Horácio Filho also explored in "An Experimental Study on the Use of LoRa Technology in Vehicle Communication" [2] the opportunity that the LoRa network provides to meet the difficult requirements for V2V communication, including reliability, high speed, and low communication latency. The primary objective of their study was to evaluate V2X communication by measuring signal strength, SNR, and message reception ratio when changing the spreading factor, also considering the inherent Doppler effect.
With these tests they concluded that the influence of speed is evident given the Doppler effect, so using a lower spreading factor provides greater resistance to this effect, but compromises in terms of range and SNR. On the other hand, when the vehicles are stationary, they performed better using SF12 than SF7, proving the theory of the influence of the Doppler effect, since it is smaller.

2.2. Methods and Experiment

LPWANs are used in many different areas, particularly in the Internet of Things, such as environmental monitoring, smart cities, security and many others. As the name suggests, these networks have a relatively large coverage and require low consumption from the devices, but they also have advantages in terms of reduced costs and connectivity in remote or hard-to-reach areas.
Within the realm of LPWANs, there exists a diverse array of options, with the LoRa network emerging as the preferred choice in this project, owing to its distinct advantages when compared to alternative networks.
The LoRa network, short for Long Range network, represents a wireless communication technology originally developed by Semtech [3]. It exhibits a particular suitability for the remote monitoring and control of sensors and actuators distributed across extensive geographical areas. The network itself is structured around a physical layer implementation, typically adopting a star architecture. This intricate system comprises three key components: the sensor nodes, often referred to as IoT devices, serving as the sensors; the intermediary sensor nodes, known as network gateways; and finally, the LoRa network server [4].
This network operates on unlicensed frequency spectrum values, which vary depending on the continent, being between 863 MHz and 870 MHz in Europe. These values belong to a band called Industrial, Scientific, and Medical (ISM) which contains free values for the use of industrial, scientific and medical equipment.
In addition to the advantages of being an LPWAN, this network also provides other advantages, such as reduced costs as it is an implementation of the physical layer of the network, using air as a means of communication instead of cables, and operating in unlicensed frequency values.
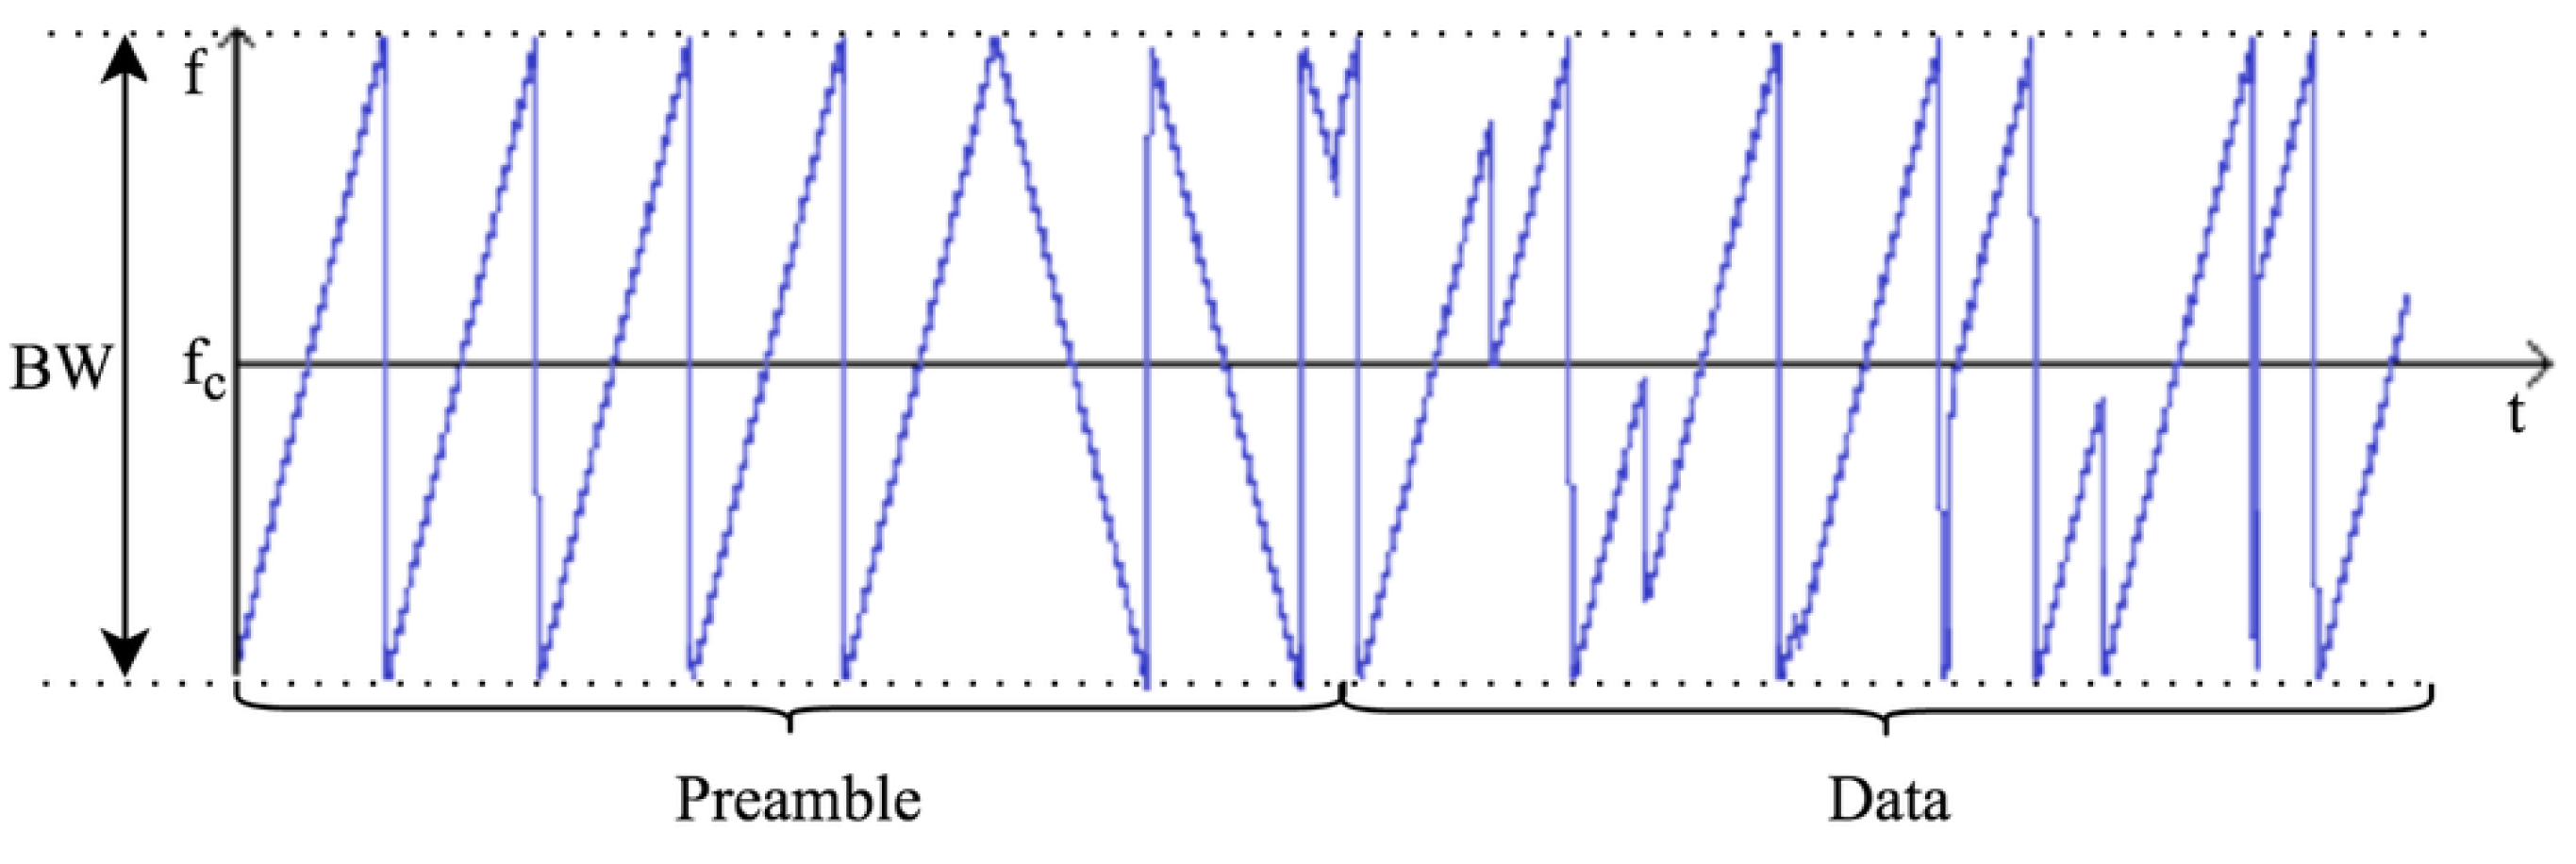
To prepare the information to be transmitted, it needs to be coded. To do this, LoRa uses Chirp Spread Spectrum (CSS) modulation. CSS modulation encodes information using frequency chirps, where a chirp is a signal that varies linearly in frequency over time. The following figure shows an example of a signal encoded with CSS modulation, where fc is the center frequency of the channel [5].
Figure 1. Data coding through chirps (adapted from [5]).
Preprints 106958 g001
Bearing in mind that this is the physical layer of the network, certain parameters must be taken into account if communication is to be carried out as intended, namely bandwidth (BW), Spreading Factor (SF) and Coding Rate (CR), as these influence the binary rate of the modulation, the resistance of the transmitted signal to interference and noise and the ease with which the received signal can be decoded.
The use of chirps in the coding of the signal to be transmitted allows it to be spread out over the frequency spectrum, i.e. the frequency changes continuously over time, which increases the signal's resistance to noise and interference and gives the advantage of the signal being easily detected in dense urban environments or other areas with various obstacles in the way.
To choose the values of the different parameters, the environment in which the network will be applied must be considered, as well as the distance between the transmitter and receiver. The spreading factor can vary between 7 and 12 depending on this distance, i.e. the closer the transceivers are to each other, the lower the SF value, otherwise the higher the value, because with higher SF values, the processing gain and reception sensitivity increase, however, it also results in a lower binary throughput.
The following table shows the different possible values of the spreading factor and their relationship with the binary throughput, the transmission range, and the time the message spends in the air [6].
From the point of view of transmission, the spreading factor corresponds to the number of bits that each symbol encodes, and each symbol can be made up of 2 S F possible values, which corresponds to the entire frequency band.
The BW used is an indication of the channel on which you are operating by measuring the number of frequencies that can be used for data transmission on a given communication channel. The different values of this parameter directly affect the data transmission rate, the modulation rate, and the spreading factor, with higher BW values allowing for a higher transmission rate, but also requiring greater energy consumption for data transmission. As with the choice of values for the spreading factor, the bandwidth values must be chosen according to the needs of the application and considering the environment in question.
As previously mentioned, the LoRa network uses air as a means of communication. This leads to a high probability of error, which can result in various communication failures between the different nodes in the network. To "combat" this obstacle, it is necessary to treat errors, which is done by a technology called Forward Error Correction (FEC).
The CR makes it possible to correct any errors in communication between nodes, as it is a parameter that is directly related to the signal's resistance to noise and the ease with which the symbols can be decoded. The way this correction is carried out is by adding redundancy bits to the transmitted information bits, these bits being represented by a fraction, for example, a CR of 4⁄5 indicates that out of every five bits transmitted, four of these are data bits and one bit is redundancy. Therefore, the higher the CR value, the more reliable the data transmission, but the lower the spectral efficiency (lower transmission rate). Once again, the choice of CR values involves considering the application and the environment in question; however, this choice can be made in real time, which is an advantage compared to the conditions mentioned above [7].
With the spreading factor, bandwidth and code rate valued, it is possible to determine the binary transmission rate and the period of each transmitted symbol.
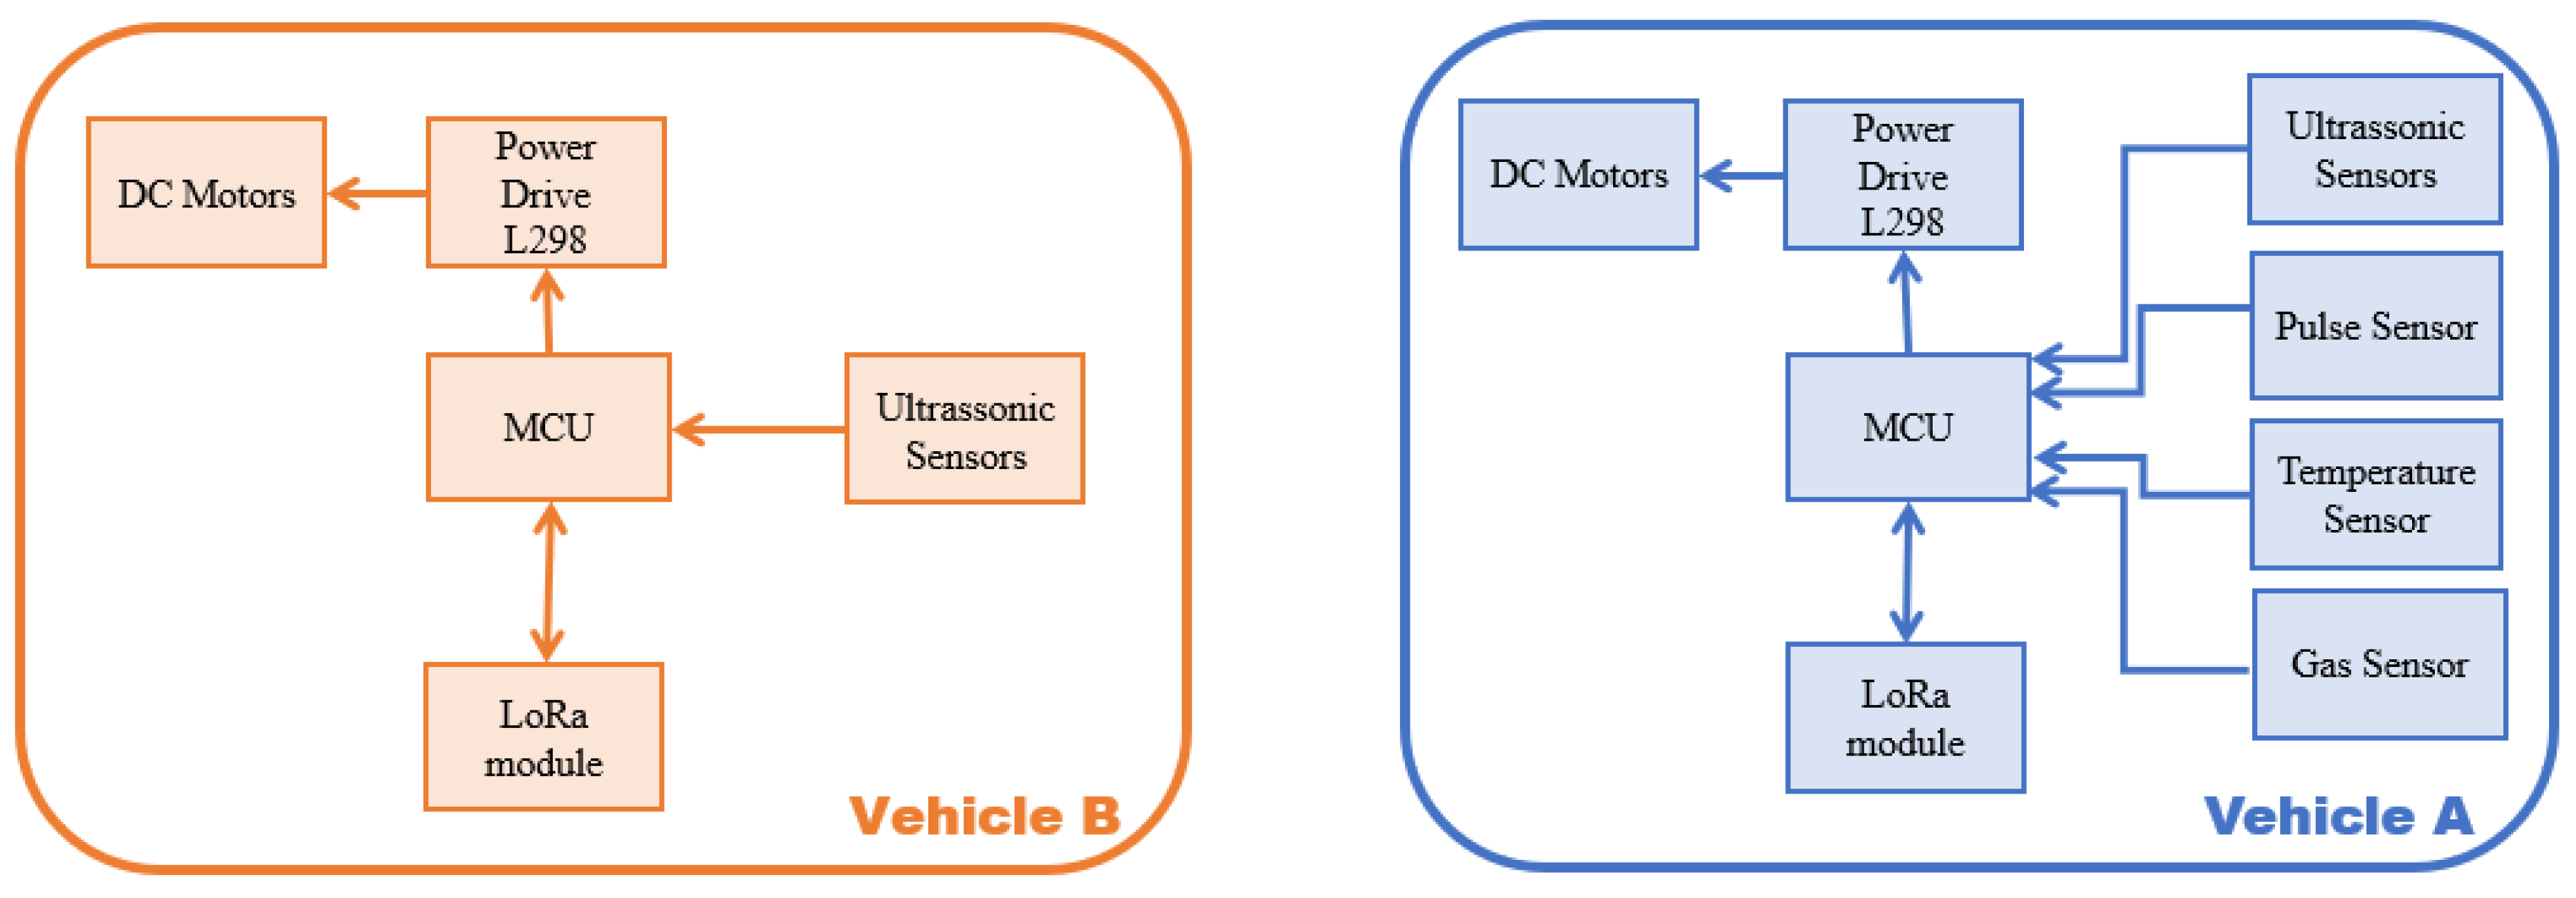
This experiment (see Figure 2) was based on LoRa communication between the two robots, one a transmitter and the other a receiver. As such, there are elements common to both robots, such as the Arduino development board and the LoRa communication module.
The front robot (vehicle A) is made up of an Arduino Mega, while the follower (vehicle B) has an Arduino Uno. This difference stems from the number of sensors incorporated in the former, namely: humidity and temperature sensor, pulse, gas, and ultrasonic.
In vehicle A, include temperature sensor connected to a digital pin on Arduino Mega, Pulse sensor using Inter-Integrated Circuit (I2C) protocol (Serial Data (SDA) and Serial Clock (SCL) pins on Arduino Mega), Gas sensor connected to analog pin using 10 bits Analog Digital Convert (ADC) integrated on microcontroller resident on Arduino Mega board and finally the two ultrasonic sensors connected to digital pins. In vehicle B, ultrasonic sensor, only one, is connected to 2 digital pins on Arduino Uno. For both vehicles we used L298 drive motor, using three bits (corresponding to 3 pins, digital pins for direction of the DC motor and enable pin, that use Pulse Width Modulation (PWM) to modulate velocity of the DC motor) for each DC motor. LoRa module in each Arduino is connected to Serial Peripheral Interface (SPI) pins.

2.2.1. Hardware used for proving of concept

This experiment was based on LoRa communication between the two robots, one a transmitter and the other a receiver. As such, there are elements common to both robots, such as the Arduino development board and the LoRa communication module.
The front robot is made up of an Arduino Mega, while the follower has an Arduino Uno. This difference comes from the number of sensors incorporated in the former, namely: humidity and temperature sensor, pulse, gas, and ultrasound.
Arduino development boards are based on high-performance, low-power RISC microcontrollers. They have flash, EEPROM and SRAM memory. For peripherals, these boards have PWM digital I/O pins, USART and SPI programmable interfaces and analogue pins. The information obtained from the sensors is interpreted by Arduino, which allows the robot's behavior to be adjusted using the algorithm.
Mobile robots adapt their behavior to certain parameters in their environment, so they need to collect this information via sensors. This information is converted into an electrical quantity so that it can be implemented by the microcontroller and control the actuators.
In the driving environment, the eyes are responsible for more than 90 % of the information gathered from the environment, allowing the driver to adjust their behavior and maintain safety. In mobile robotics, there are several ways to ensure that a robot recognizes its environment, from the use of GPS systems, cameras, or sensors, which allow it to dodge obstacles or meet its target.
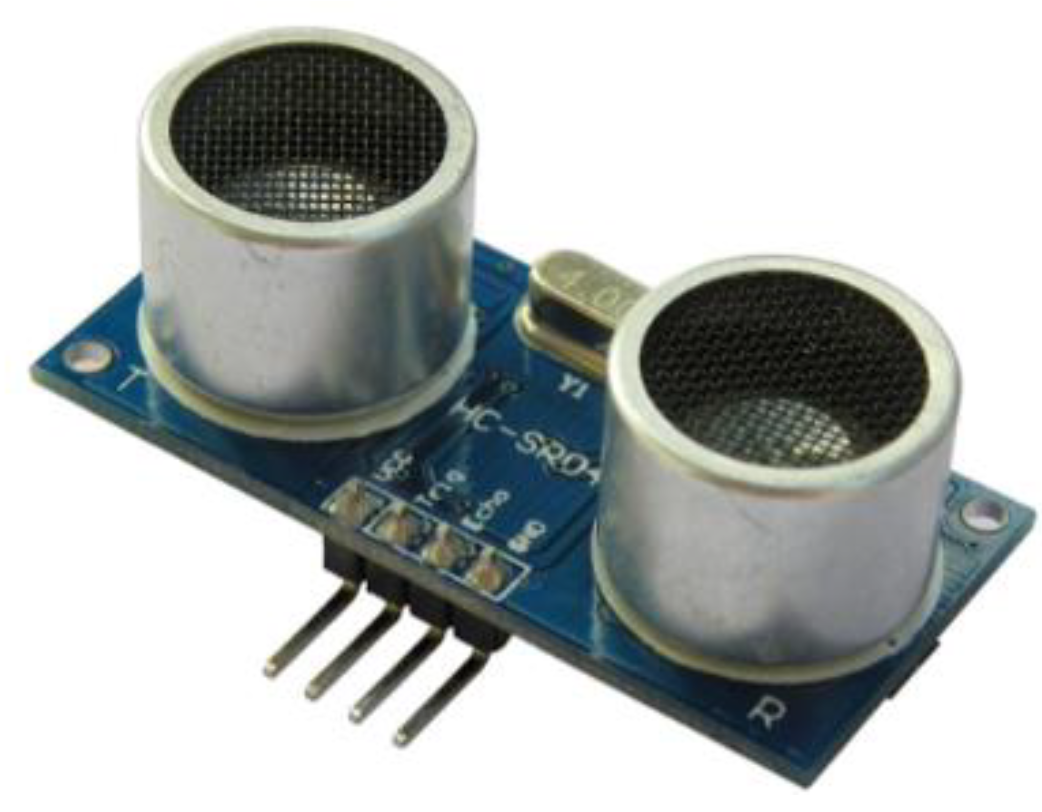
In this experiment, it was intended that the two robots would each use a pair of HC-SR04 ultrasonic sensors. One would be responsible for dodging obstacles, while the other would act as a follower, simulating a traffic lane with two cars and no obstacles between them.
Figure 3. Ultrasonic sensor HC-SR04 (adapted from [8]).
Preprints 106958 g003
Table 1 presents the technical characteristics of HC-SR04 and the pins connected to Arduino board.
Fatigue is one of the main factors in road accidents and can be divided into three categories: cyclical, psychological or physiological [9]. Cyclic fatigue is caused by too little rest, resulting in drowsiness. In this state, the driver's heart rate begins to slow down. On the other hand, psychological fatigue occurs when there is too much strain on the nervous system, resulting in distraction and, in some cases, an increase in heart rate.
Another factor that can lead to a sudden increase in heart rate occurs in unexpected risk situations, such as losing control of the car due to oil on the floor.
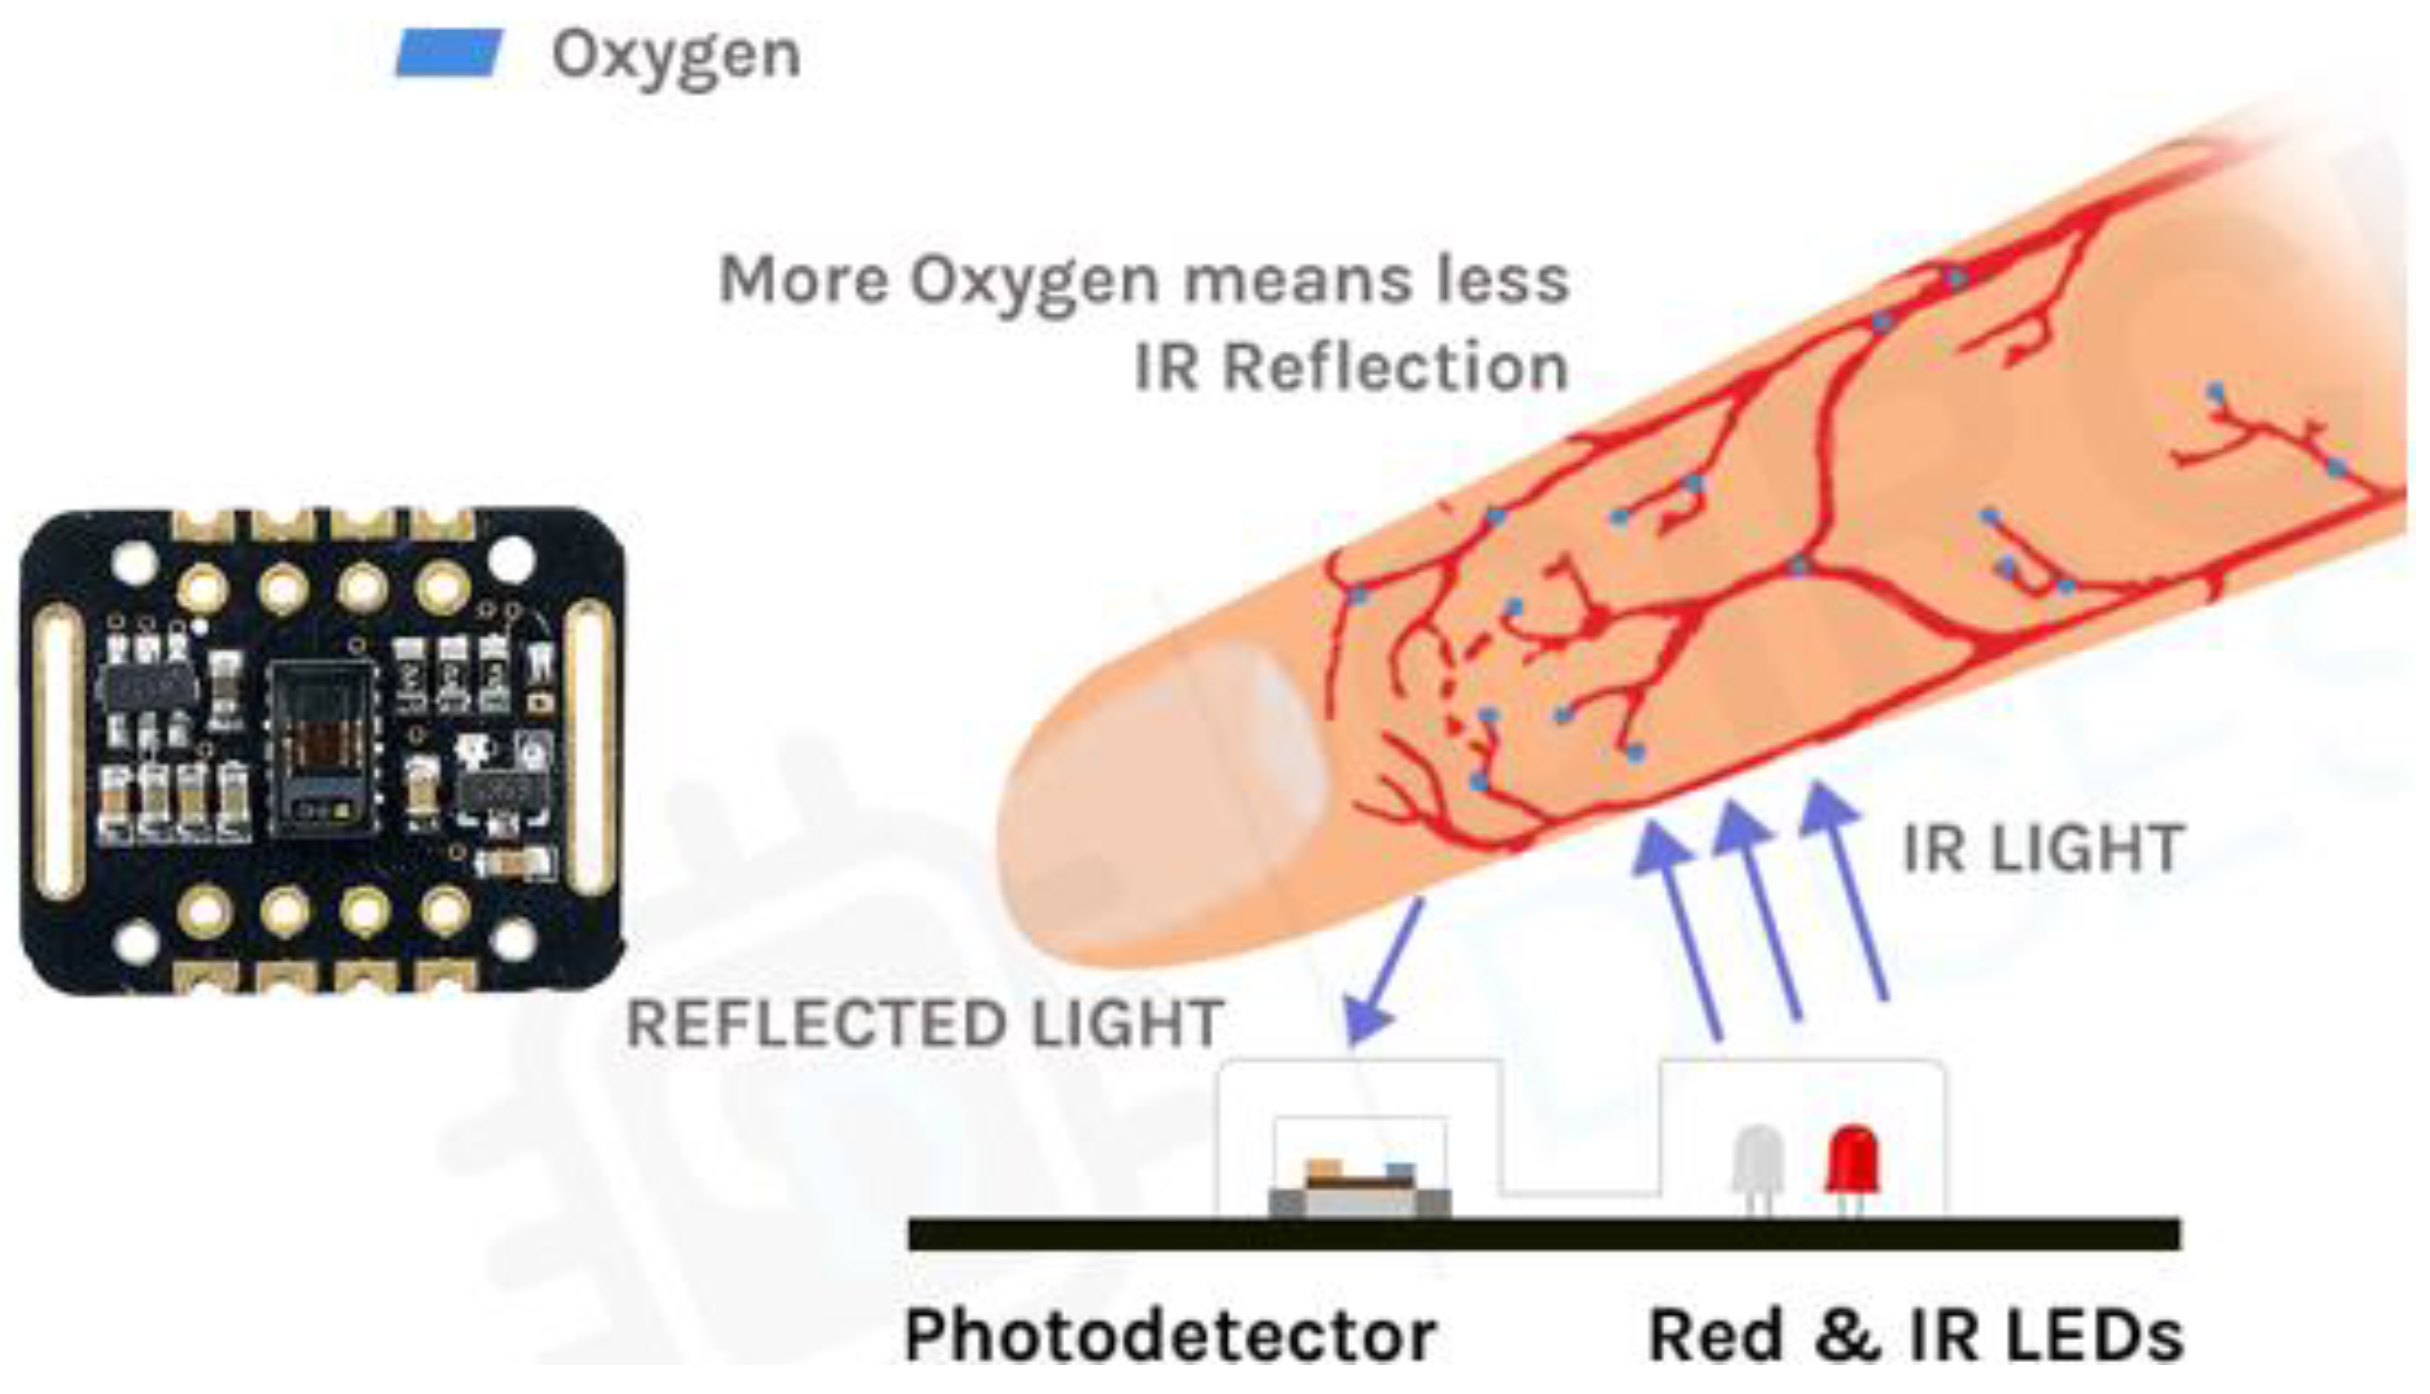
Therefore, for the purpose under study, the decision was made to incorporate a MAX30102 heartbeat sensor into one of the robots so that these variations could be detected and communicated to the robot following so that it could adjust its speed and avoid a collision.
Figure 4. Pulse sensor MAX30102 (adapted from [10]).
Preprints 106958 g004
Table 2 presents the technical characteristics of MAX30102 and the pins connected to Arduino board.
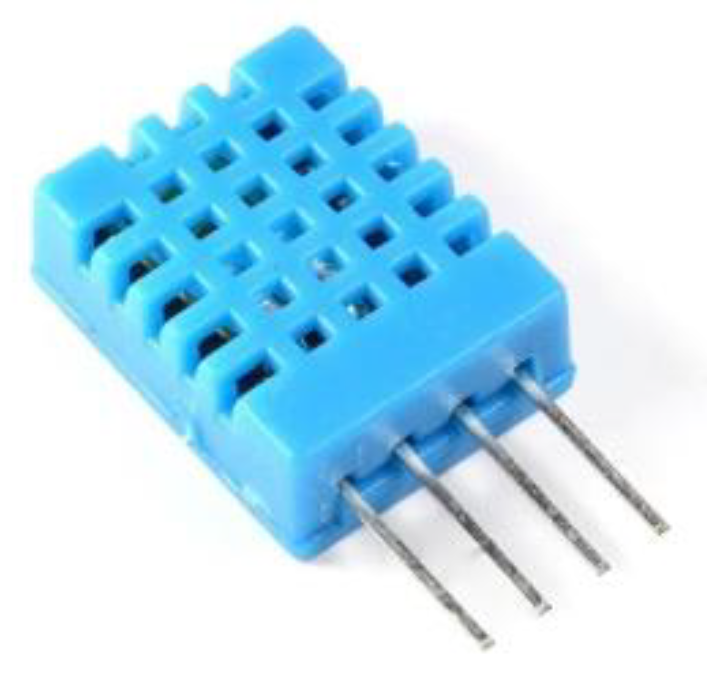
The humidity and temperature inside a vehicle can affect the driver's health and comfort, and consequently their ability to concentrate and react to stimuli. A hot and humid interior can lead to feelings of tiredness and drowsiness, as the body needs to work harder to regulate the temperature.
Figure 5. DHT11 sensor.
Preprints 106958 g005
Table 3 presents the technical characteristics of DHT11 and the pins connected to Arduino board.
When the interior of the car is cold and damp, limb mobility can be affected, making it difficult to manipulate the steering wheel and pedals, resulting in loss of control of the car. Measuring humidity and temperature can help prevent accidents, especially on long journeys, as fatigue can build up over time. We chose to use the previously mentioned sensor, DHT-11, to monitor these two variables.
There are numerous causes that contribute to increased environmental pollution and consequently poorer air quality, one of the biggest being the burning of fossil fuels by motor vehicles. The emission of these particles fuses with the air we breathe and can cause respiratory health problems. A car's fan consists of a blower that ensures the flow of air from the outside to the inside of the vehicle. It consists of a fan, a drive motor and a device that controls the power. In a traffic queue scenario, the car in front burns fuel and releases gases and toxins through the exhaust, so the air that enters through the fan.
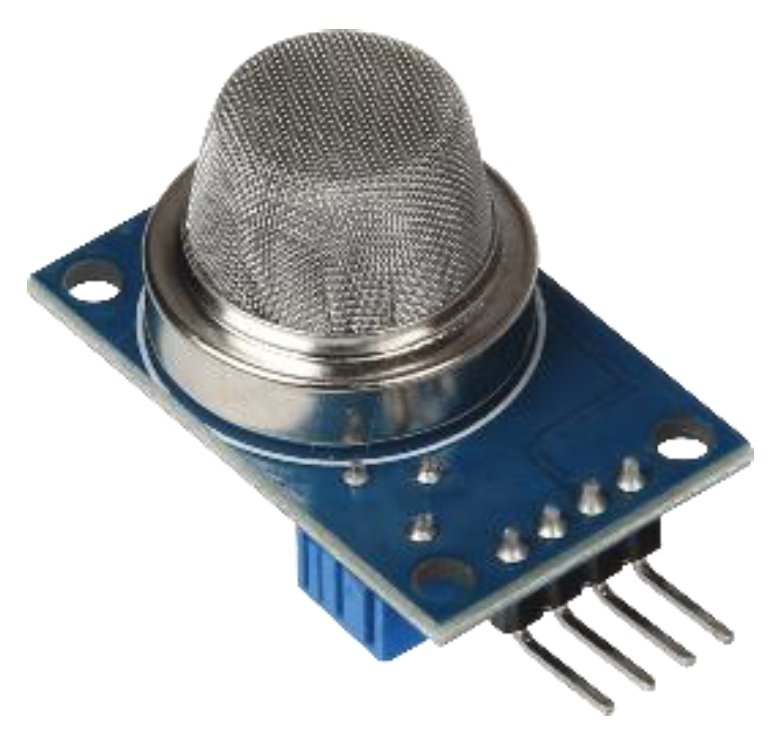
Vehicle exhaust produces a cocktail of harmful gases, one of which is Carbon Monoxide (CO), which is known to cause fatigue and drowsiness [11].
Figure 6. MQ2 sensor.
Preprints 106958 g006
Table 4 presents the technical characteristics of MQ2 and the pins connected to Arduino board.
In view of this risk, a combustible gas and alcohol detection sensor, MQ2, was used.
Since LoRa is the communication technology implemented in this experiment to achieve point-to-point information exchange between the two robots, we carried out a series of tests on its performance by changing some CSS modulation parameters and in different test environments.
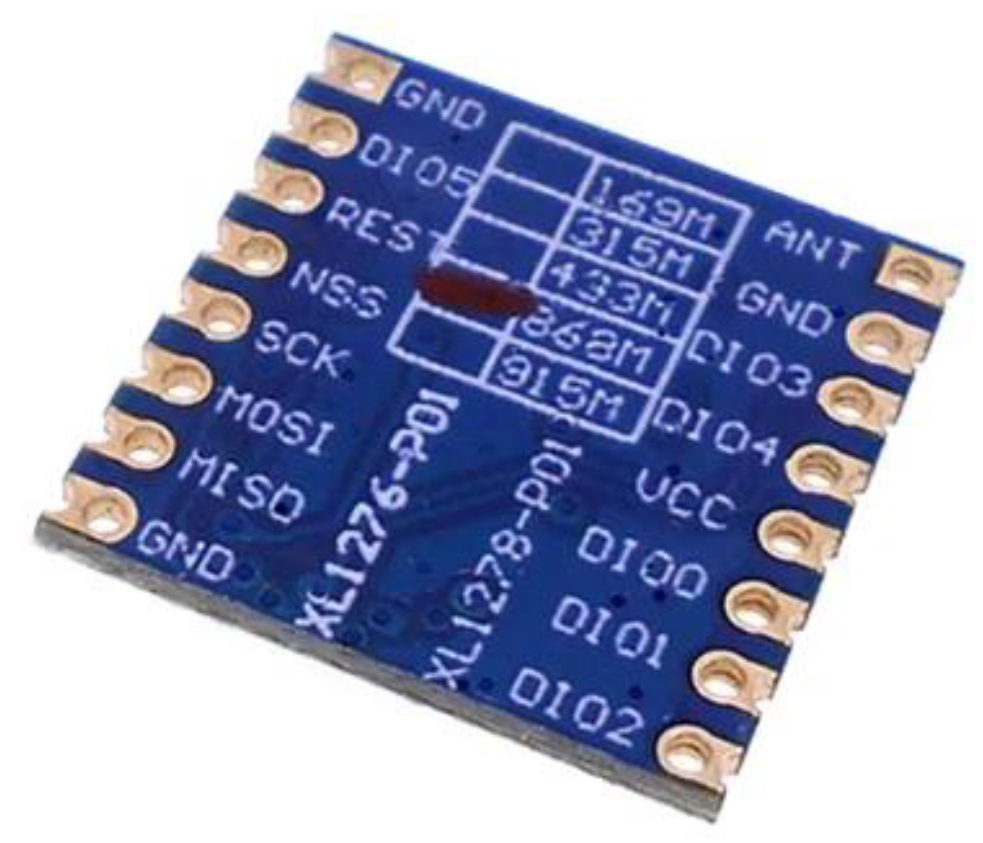
Figure 7. SX1276 – LoRa module.
Preprints 106958 g007
Table 5 presents the technical characteristics of SX1276 and the pins connected to Arduino board.
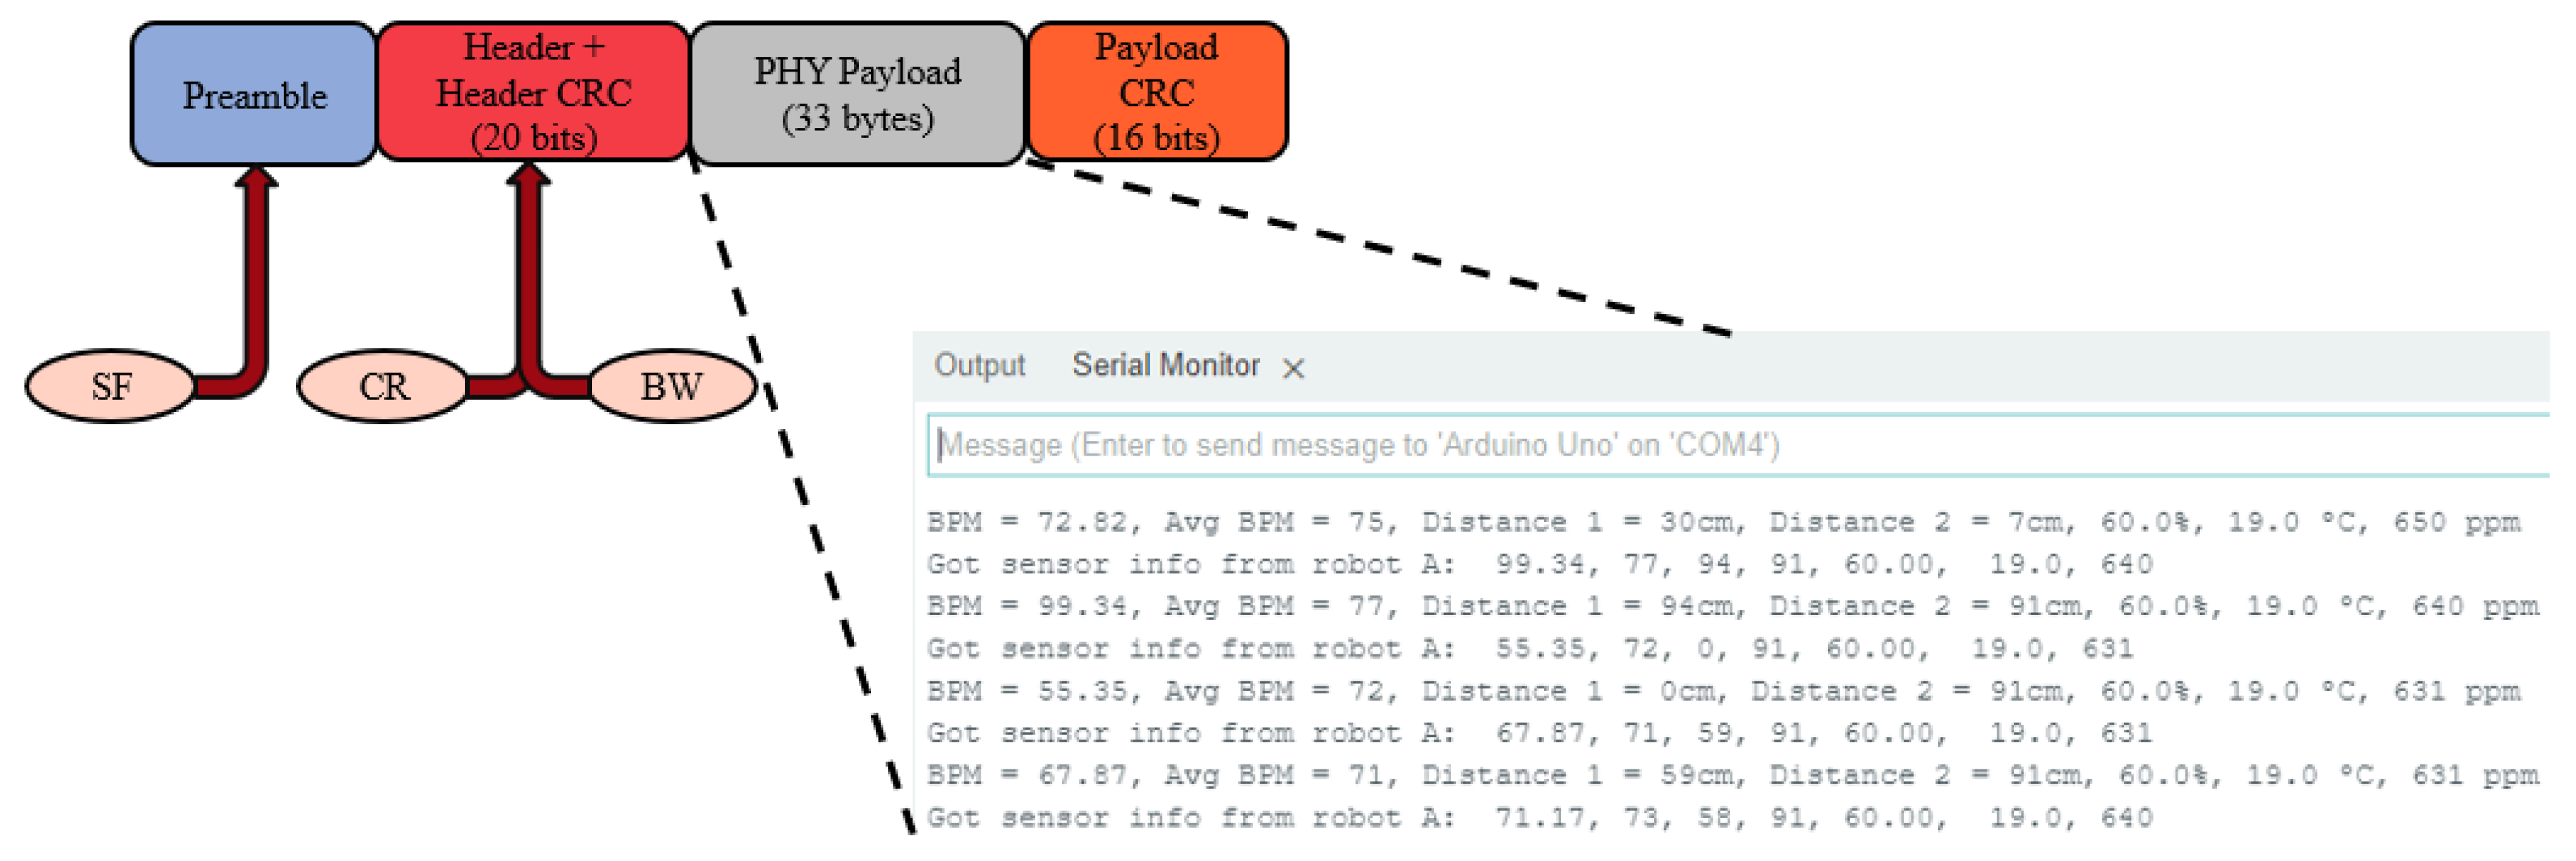
Once an SF7 had been established to carry out the experiment, the LoRa communication network payload to be sent from the lead robot to the follower was built. The size of the payload is defined according to the type of variables used to construct the message (int, float, string). The payload has 33 bytes with sensor information, as well as a byte dedicated to informing the direction in which the robot in front has turned.
Since the entire plot is also made up of the preamble and the respective headers, which have predefined sizes, this results in a total size of 69 bytes. Based on the formula presented above, which allows the binary throughput to be calculated using the spreading factor and the coding rate, the following value was obtained for the maximum transmission rate.
R b = 7 × 4 ( 4 + 4 5 ) 2 7 125 k = 5.70 K b i t / s 713 b y t e / s
The time the message is in the air is influenced by the bandwidth (125 kHz) and the total number of bytes in the plot, so it cannot be directly inferred that we have 713 bytes being transmitted every second. Therefore, when testing the robots, a message transmission interval of half a second was set.
Figure 8. LoRa frame structure at the physical layer of the network.
Preprints 106958 g008

3. Results

In this section we describe all the tests carried out on the various sensors that make up the robots, complementing the results with graphs and their interpretation. The LoRa communication test plots between the prototypes are also demonstrated, with calculations of the maximum transmission rates and the size of the plot in bytes.

3.1. HC-SR04 Sensor

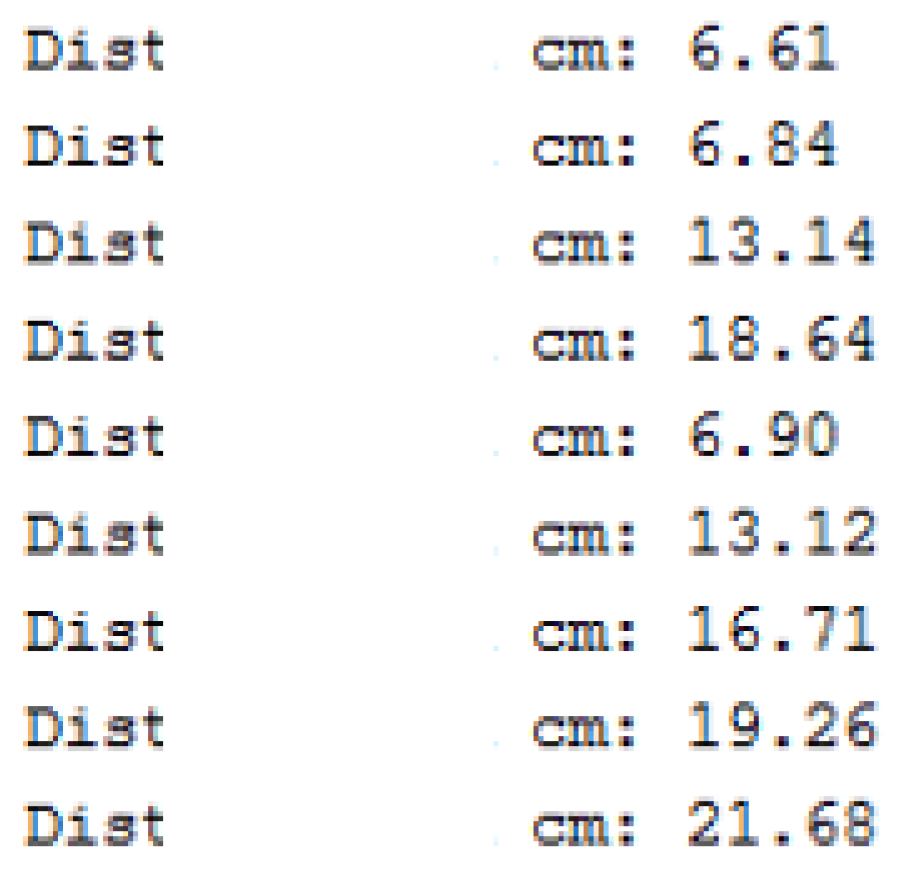
The distance of an obstacle from the position of the HC-SR04 sensor was varied. It's important to mention that in the final robot, we chose to store the measured distance in an integer variable, since we didn't consider it necessary to have a level of precision in the order of a tenth to do obstacle avoidance. We defined 40 cm as the minimum distance at which the robot in front reacts to dodge an obstacle. This value was obtained through ‘trial and error’ tests, which showed the best results. A higher value would make the robot too sensitive to obstacles, resulting in zigzag behavior. For shorter distances, given the robot's structure and dimensions, it would result in collisions with obstacles.
Figure 9. HC-SR04 ultrasonic sensor measurements.
Preprints 106958 g009

3.2. MAX30102 Pulse Sensor

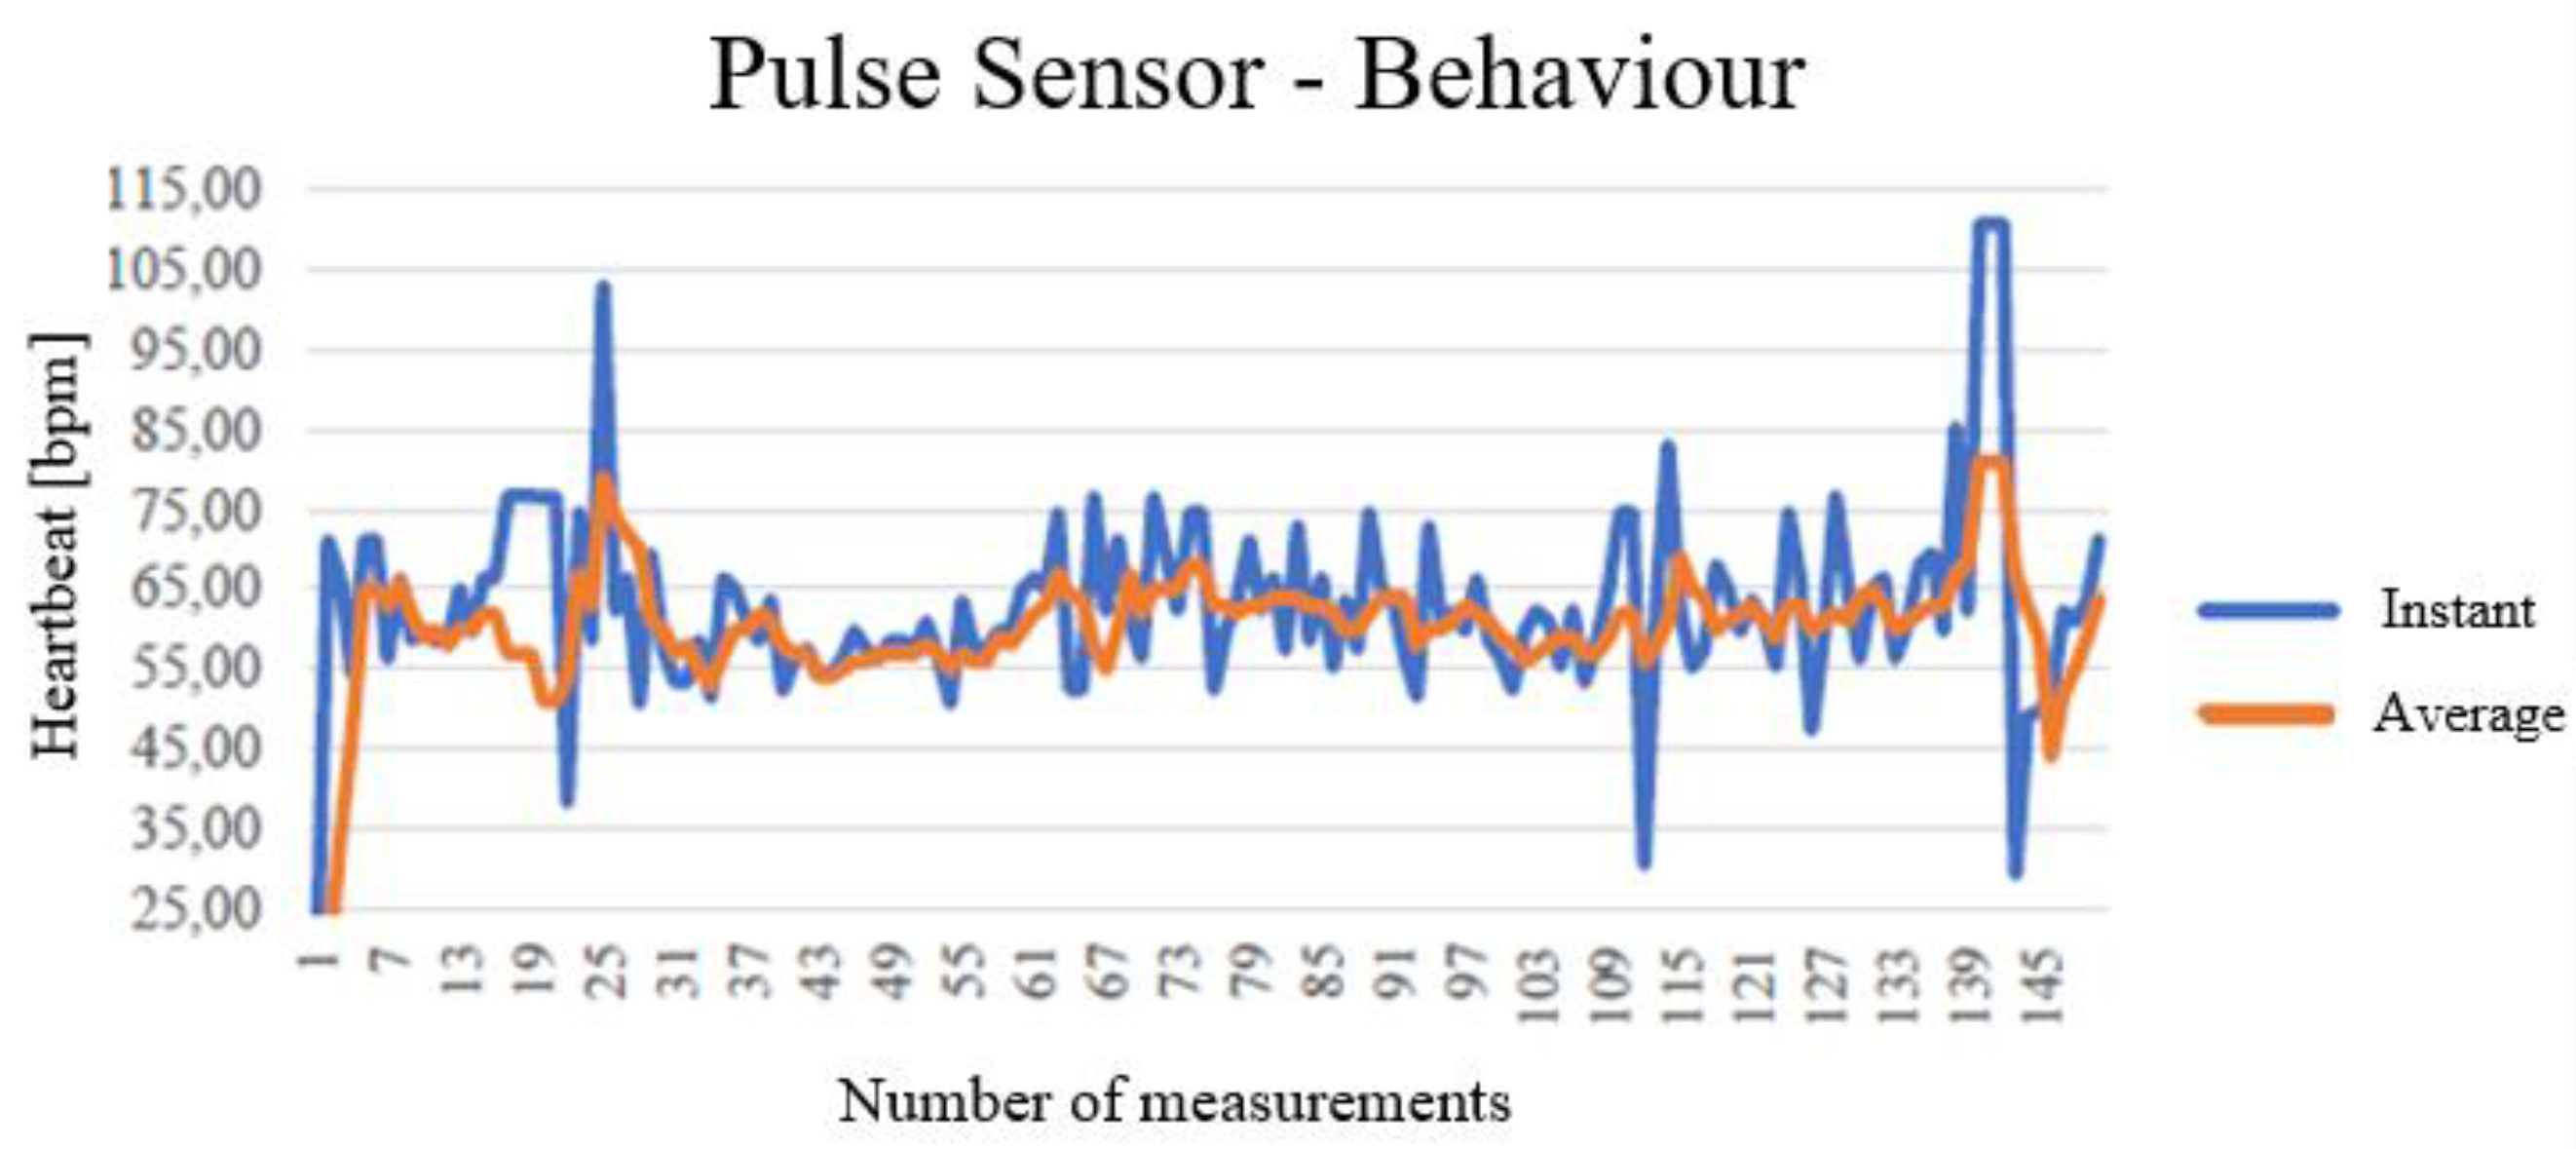
Using the MAX30102 schematic, the number of heart beats per minute (bpm) was measured by placing the sensor in an area that was easily accessible to the blood vessels, in this case covering the sensor with the index finger, as shown in Figure 4. The instantaneous and average heartbeat values per minute were recorded on a line graph, Figure 10.
It is useful to use the average values of the measurements as they help to counteract noisy or fluctuating readings, which also results in greater precision and stability. In the graph above, you can see some moments where there is a rapid fluctuation in the measurements (blue line) and which are somewhat attenuated in the average (orange line). The results obtained were compared to the heart rate measured by a smartwatch, and there was no great difference. From a critical point of view, this sensor gives quite good results considering its cost, however, for a real application it is not ergonomic enough to be implemented in a car steering wheel, so in the future we would look for a more ergonomic alternative.

3.3. DHT-11 Sensor

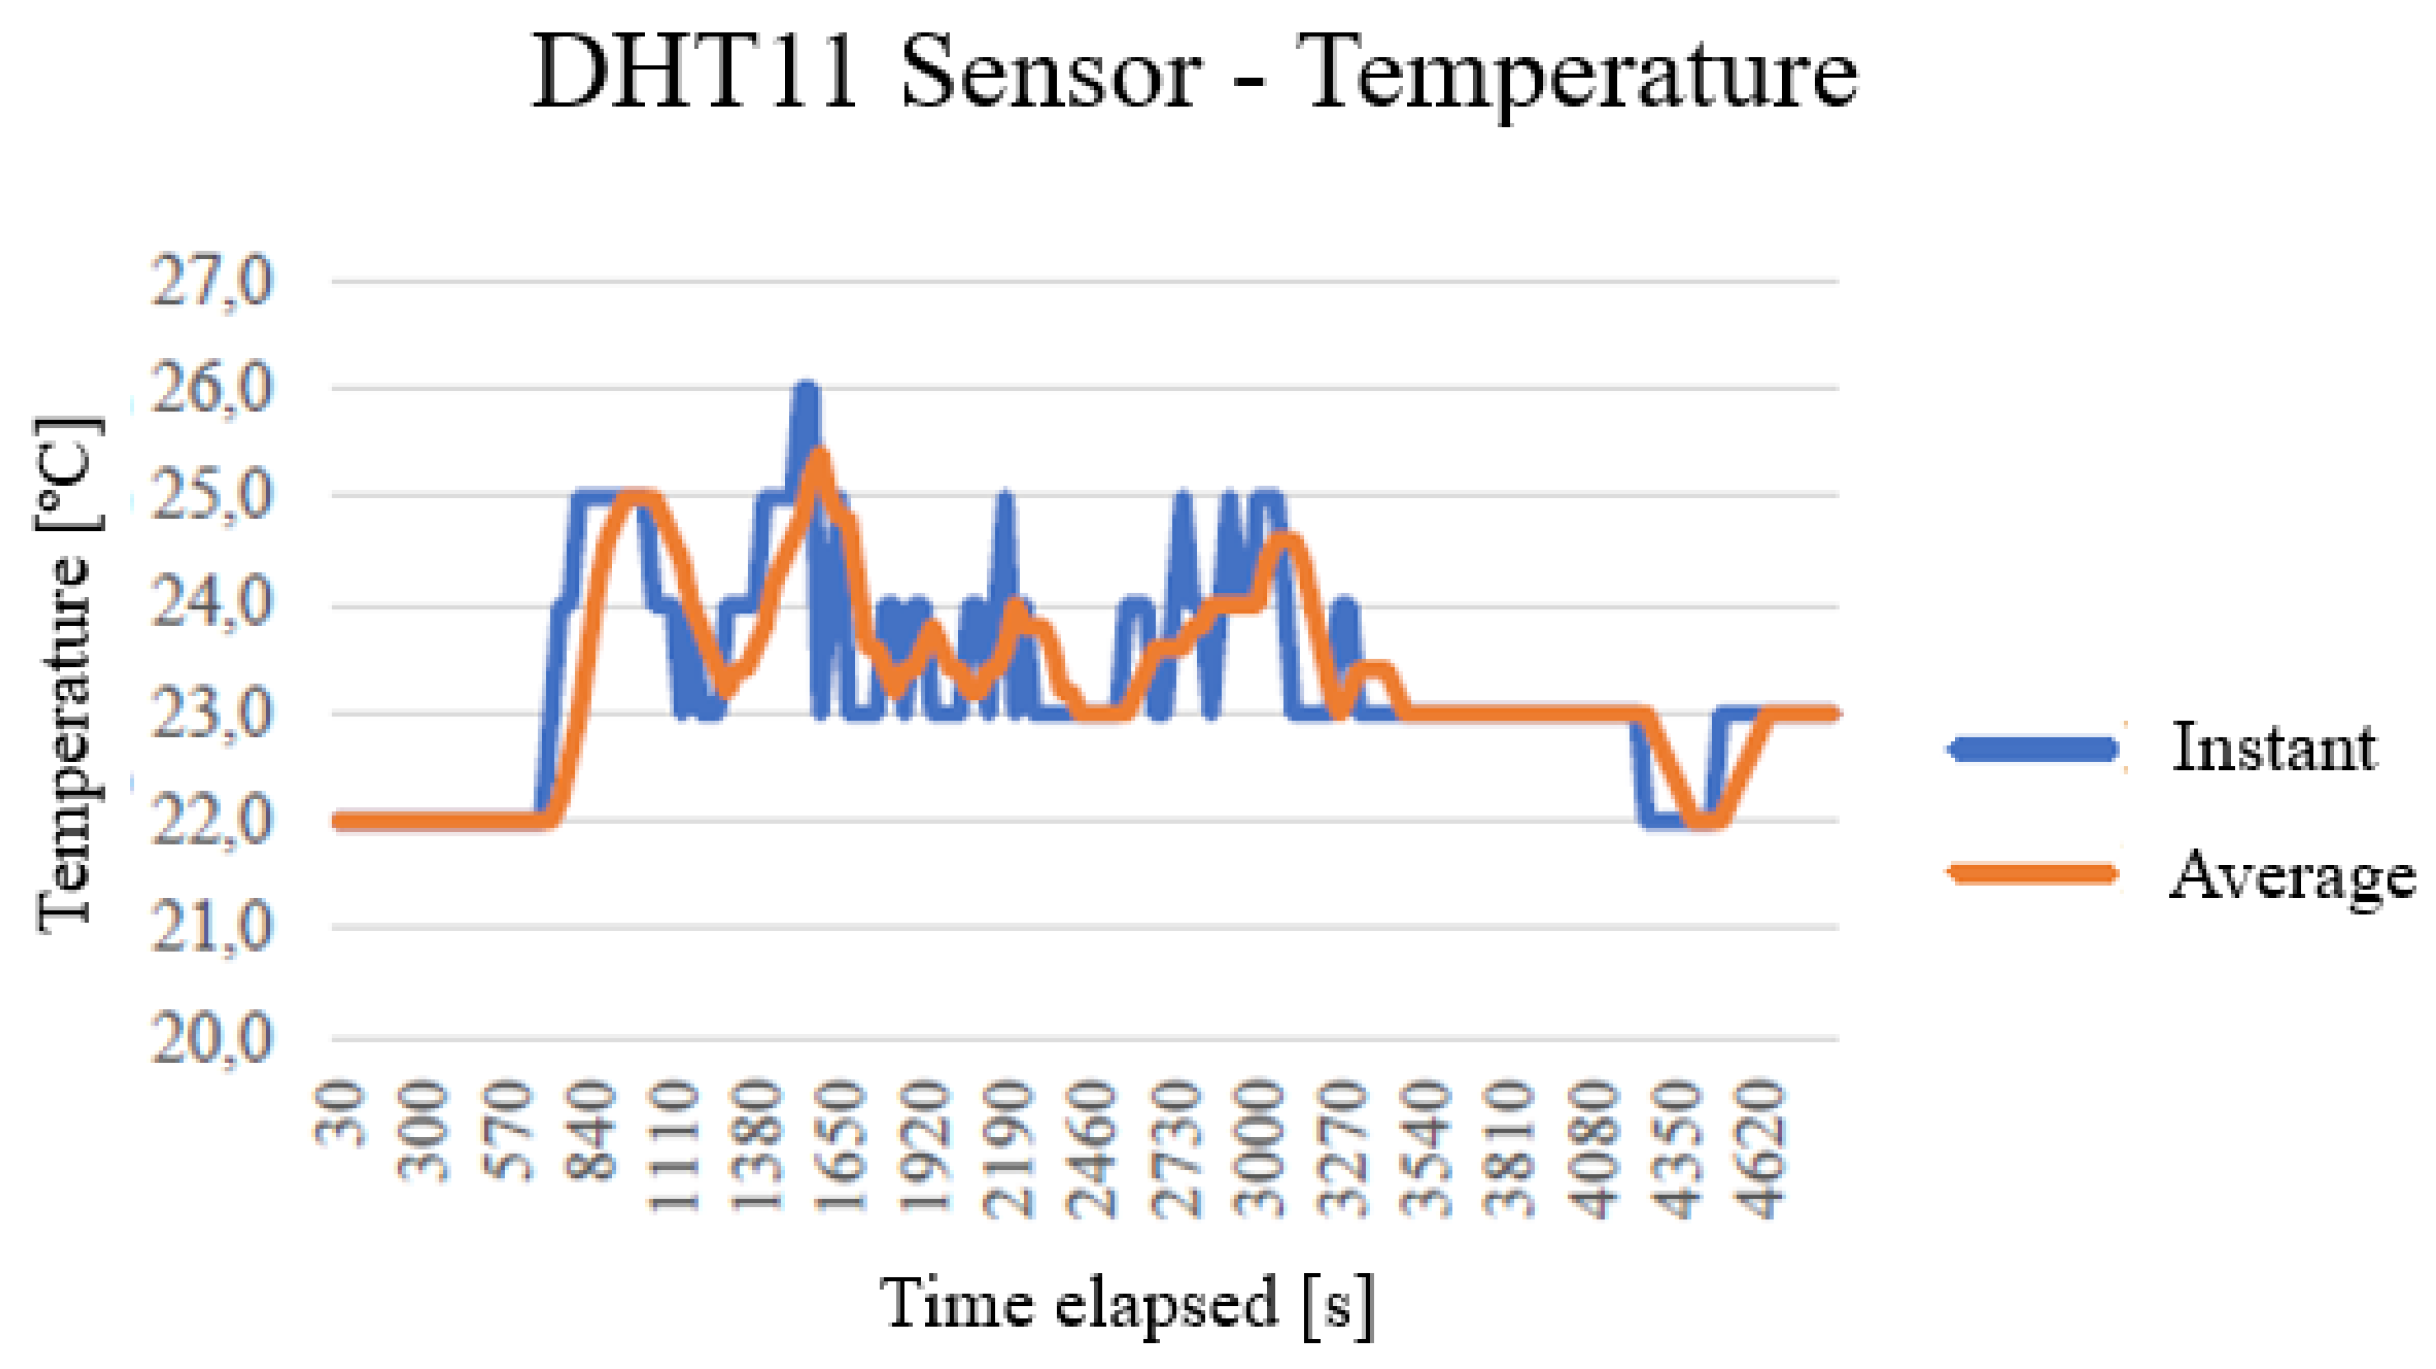
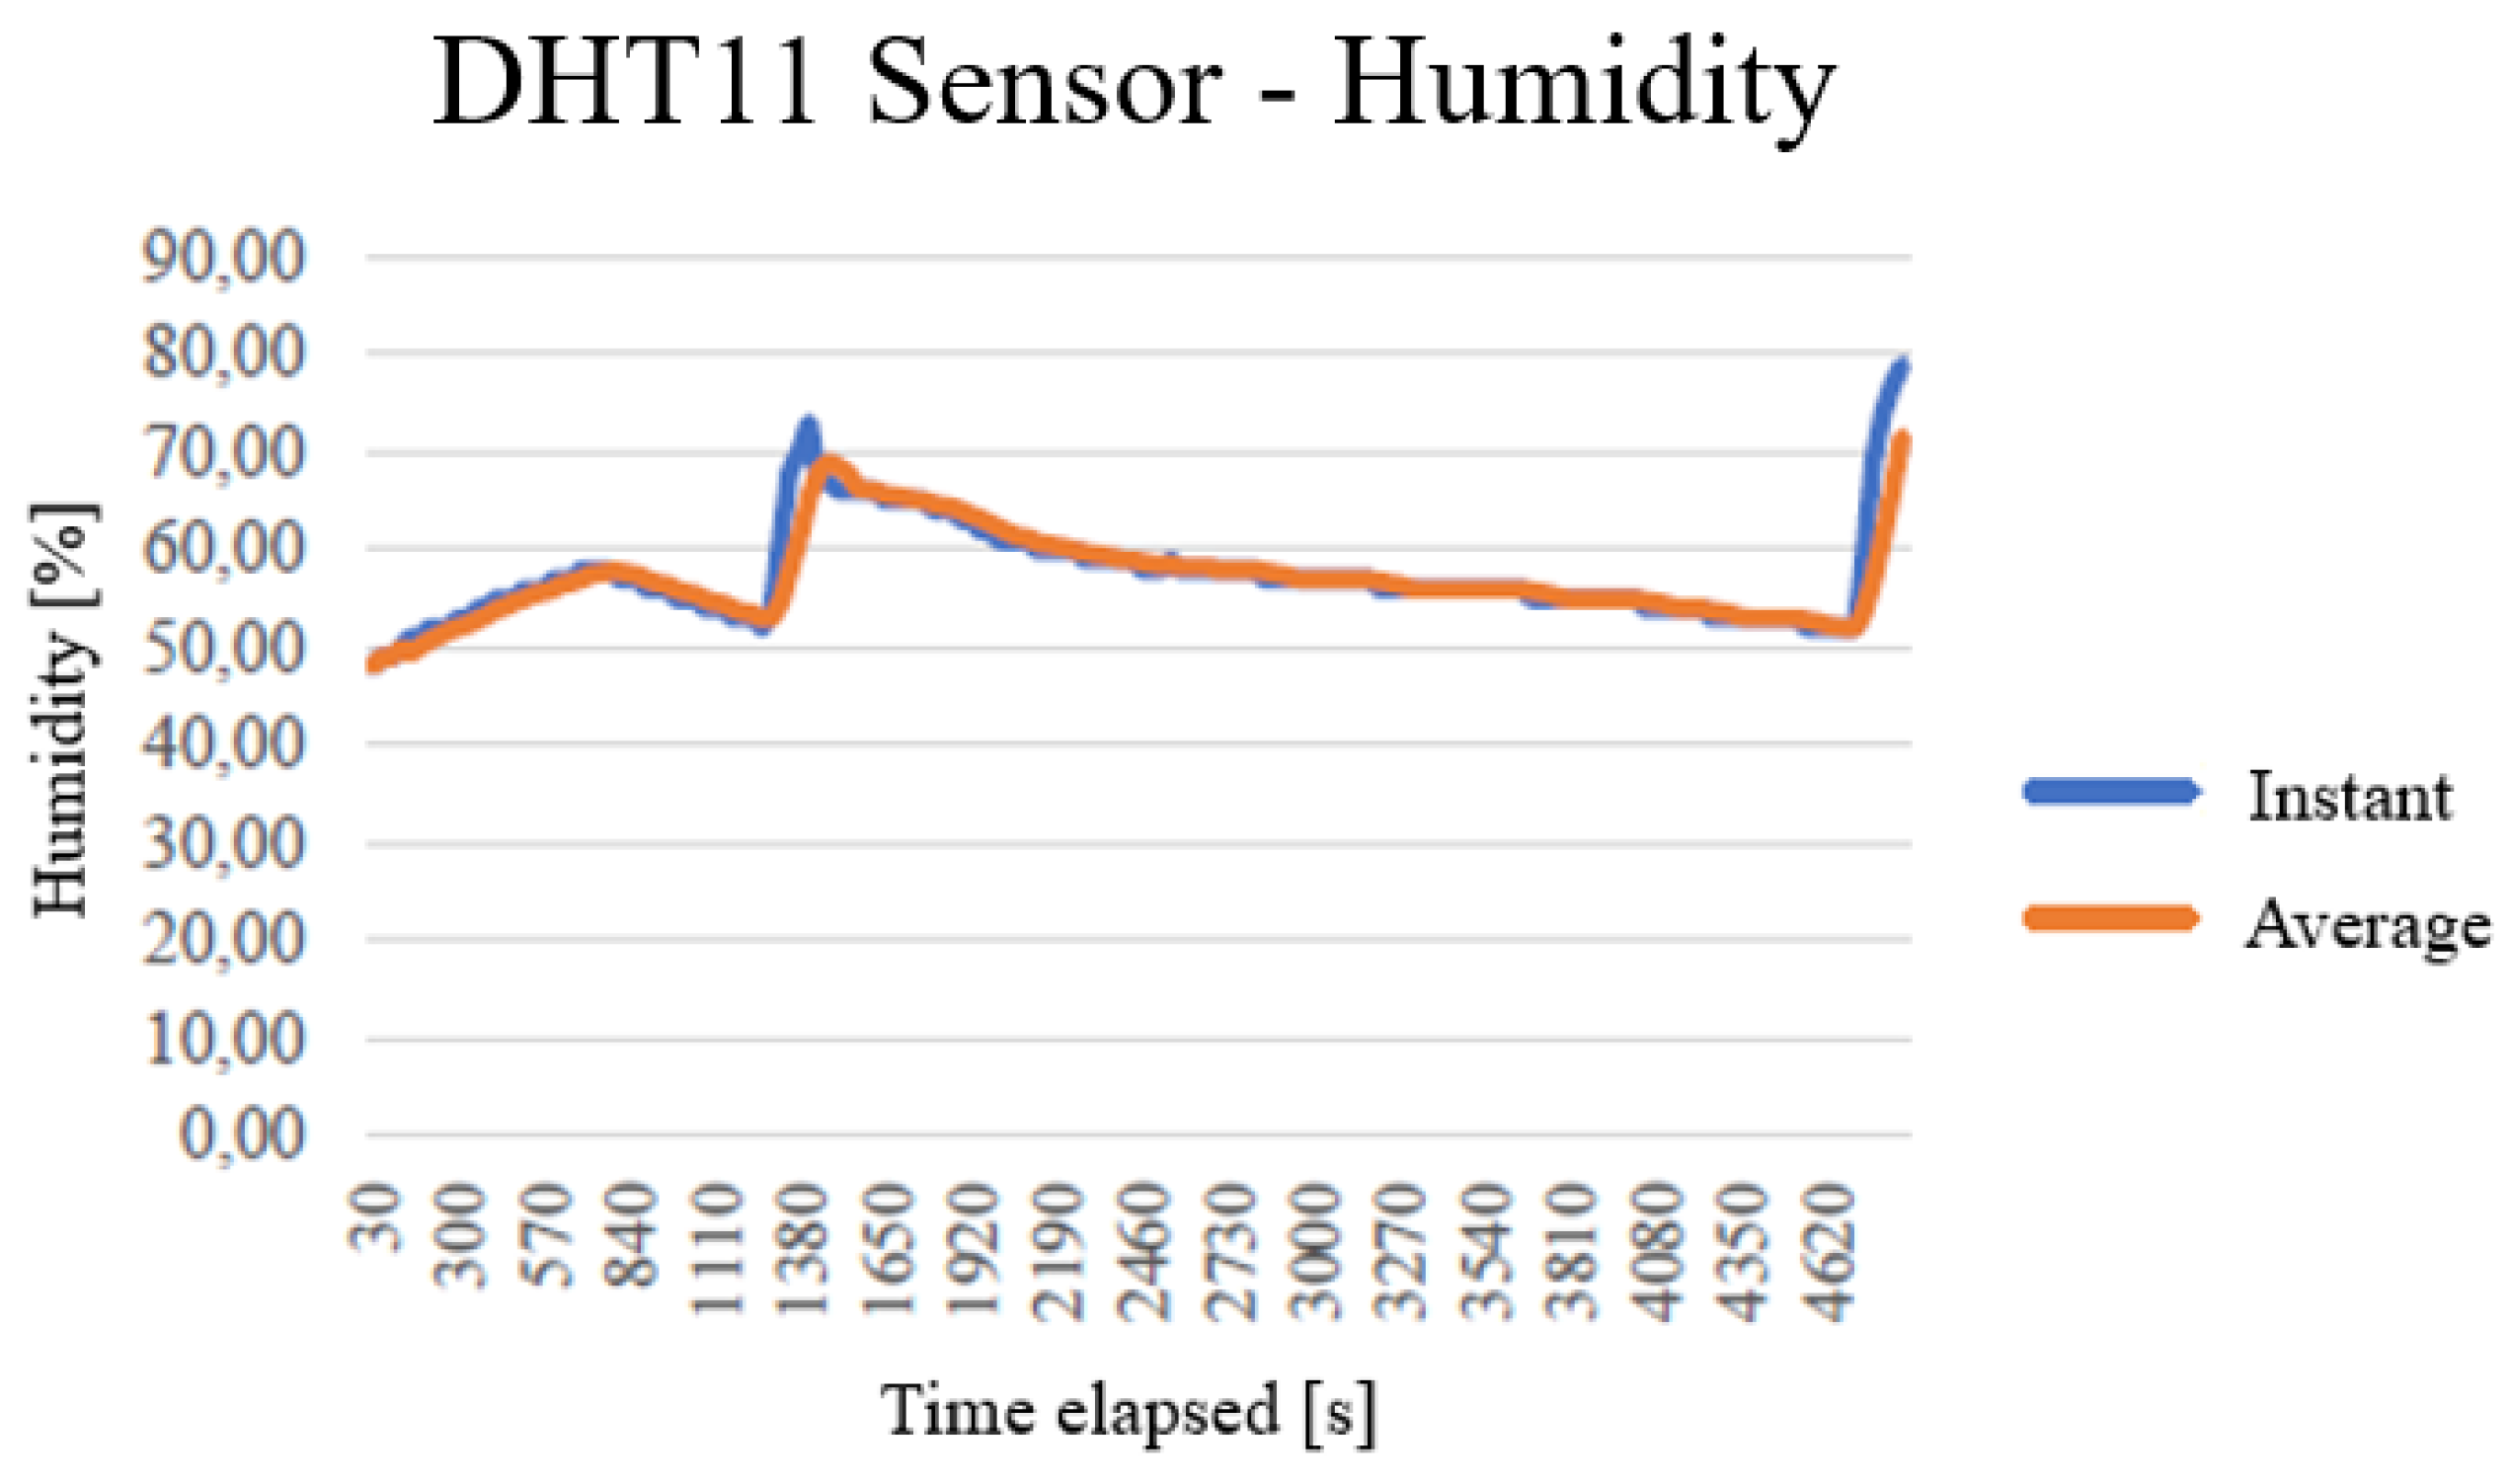
Following the same procedure, tests were carried out on the DHT-11 sensor. The results were obtained by leaving the sensor in a room at room temperature and taking humidity and temperature readings every 30 seconds. As mentioned, in addition to the instantaneous values, the average values were also recorded. For the reader's better understanding, graphs have been drawn up based on the results, comparing the average and instantaneous values, shown in Figure 11 and Figure 12.
Comparing the temperature measurements of the DHT11 sensor to a digital thermometer, this sensor only measures in the order of the units, although somewhat similar to the digital thermometer. As for humidity, when compared to a digital dehumidifier, the values measured by the sensor show some deviation from the dehumidifier, and as with temperature, the sensor only measures in the order of units.
From a critical point of view, this sensor would be one of the main elements to change, and could be replaced by two better resolution sensors, one dedicated only to temperature, and the other to humidity.

3.4. Gas MQ2 Sensor

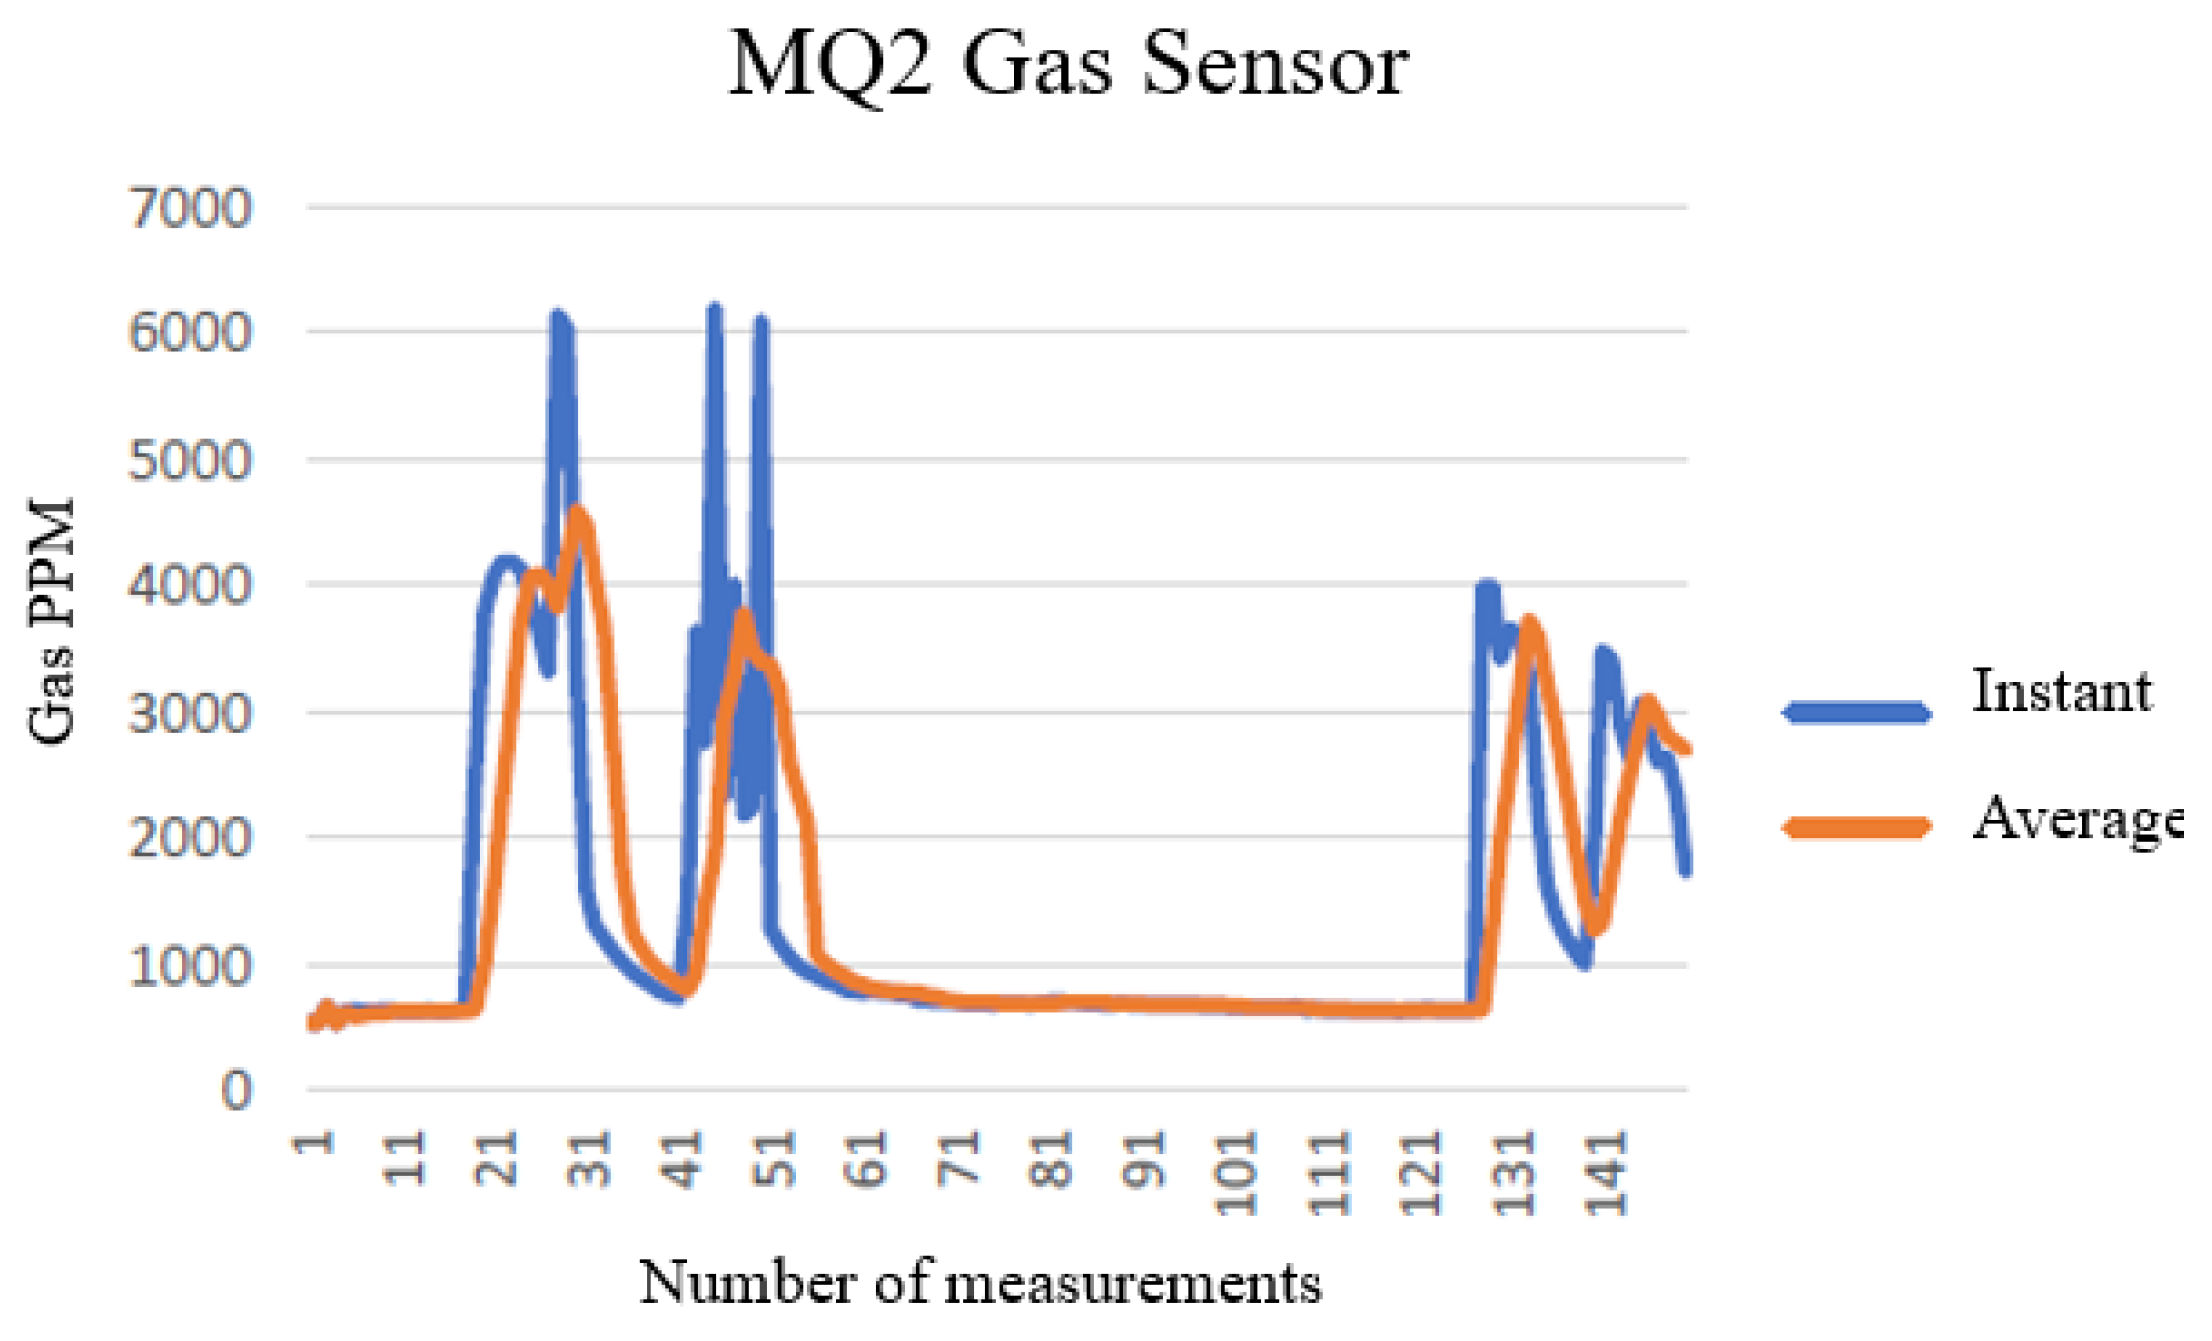
The MQ2 sensor tests were carried out using the gas from a cigarette lighter. This sensor can detect different gases, but it doesn't distinguish between them, so the group chose to map the values measured on the Arduino board's analogue input to the minimum of 300ppm and maximum of 10000ppm shown on the sensor's datasheet [12].
During the tests, when releasing gas into the sensor, there were large fluctuations in the measurements, however, it is important to note that in a real traffic situation, the gases measured do not show variations of such magnitudes, so it is still necessary to monitor them.
The results obtained are shown in Figure 13, where you can see the moments when the gas was released, characterized by large variations.
One of the disadvantages of this sensor is that it is not possible to distinguish the ppm of each gas measured, so it is not possible to characterize which of the gases most influences this measurement. Given this characteristic, this sensor would also be subject to change in a future work, requiring a greater investment.

3.5. SX1276 LoRa Module

Since LoRa is the communication technology implemented in this experiment to realize the point-to-point exchange of information between the two prototypes, we carried out a series of tests on its performance by changing some parameters of the CSS modulation.
Since communication between the two robots is point-to-point, a test was carried out with the exchange of 'Hello world' text messages. In this test, no settings were changed in terms of bandwidth, spreading factor and communication rate, so the default values from the RH_RF95 library were used, SF=7, BW=125 kHz and CR=4/5.
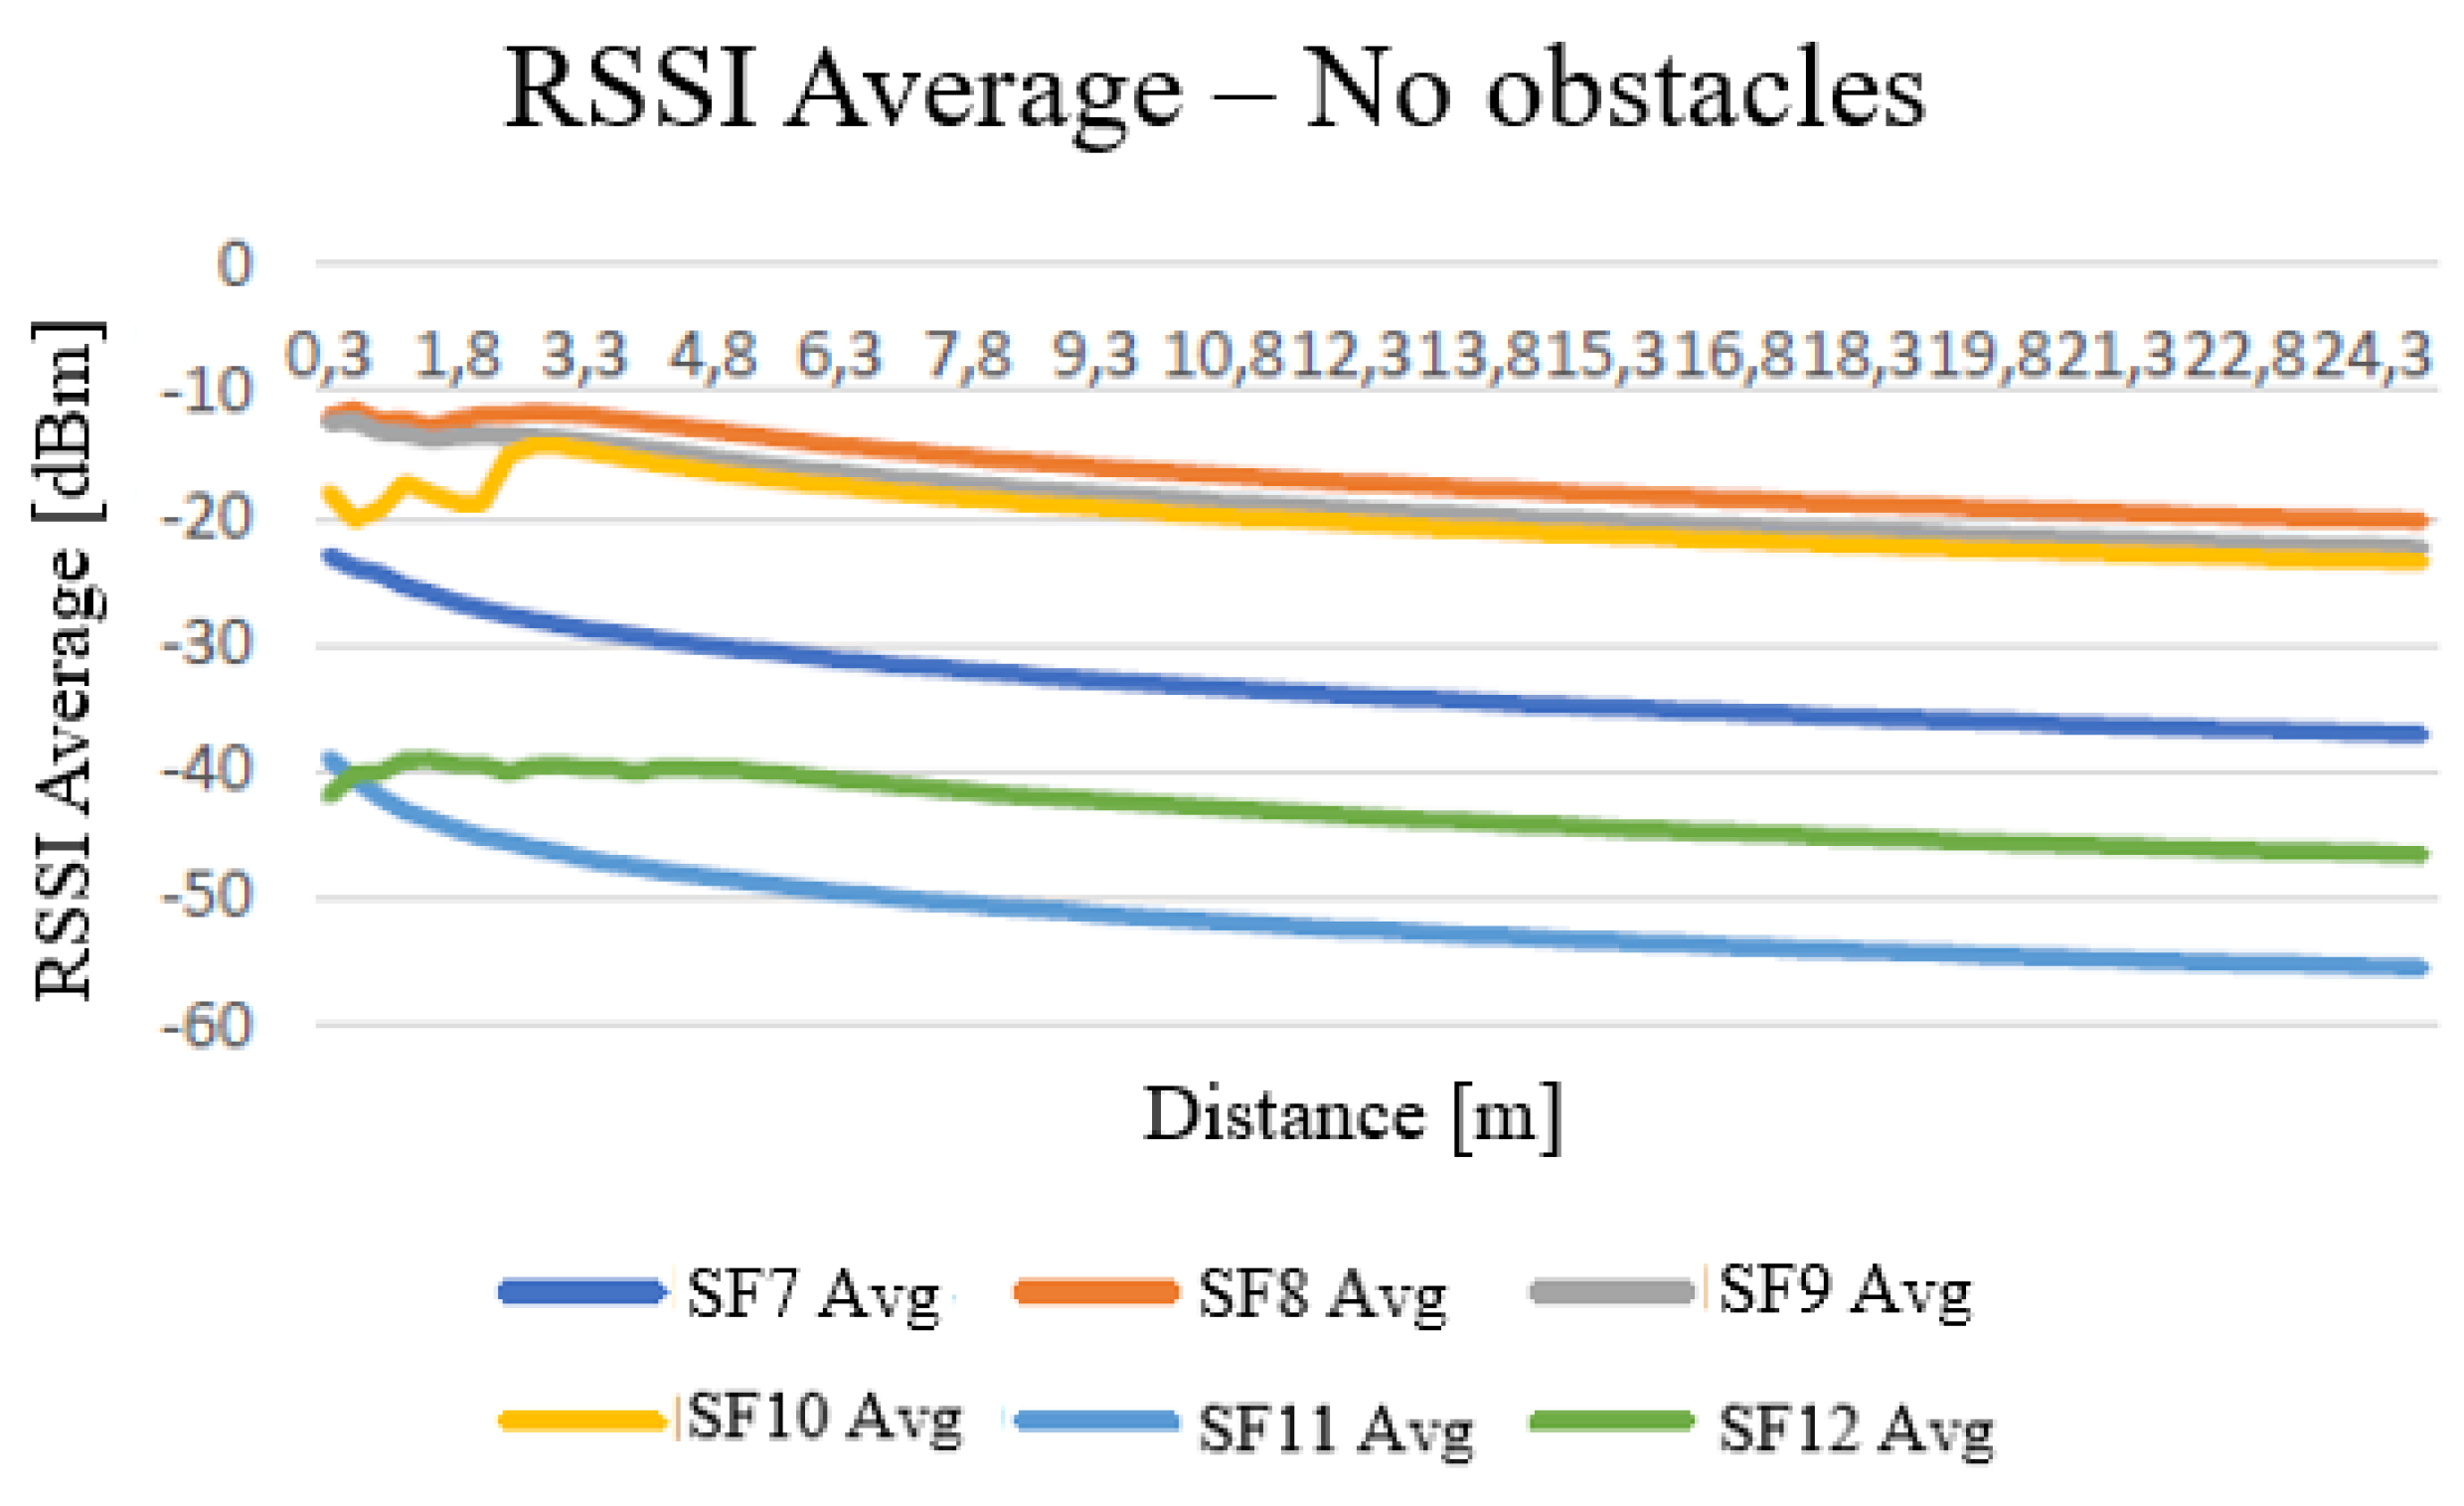
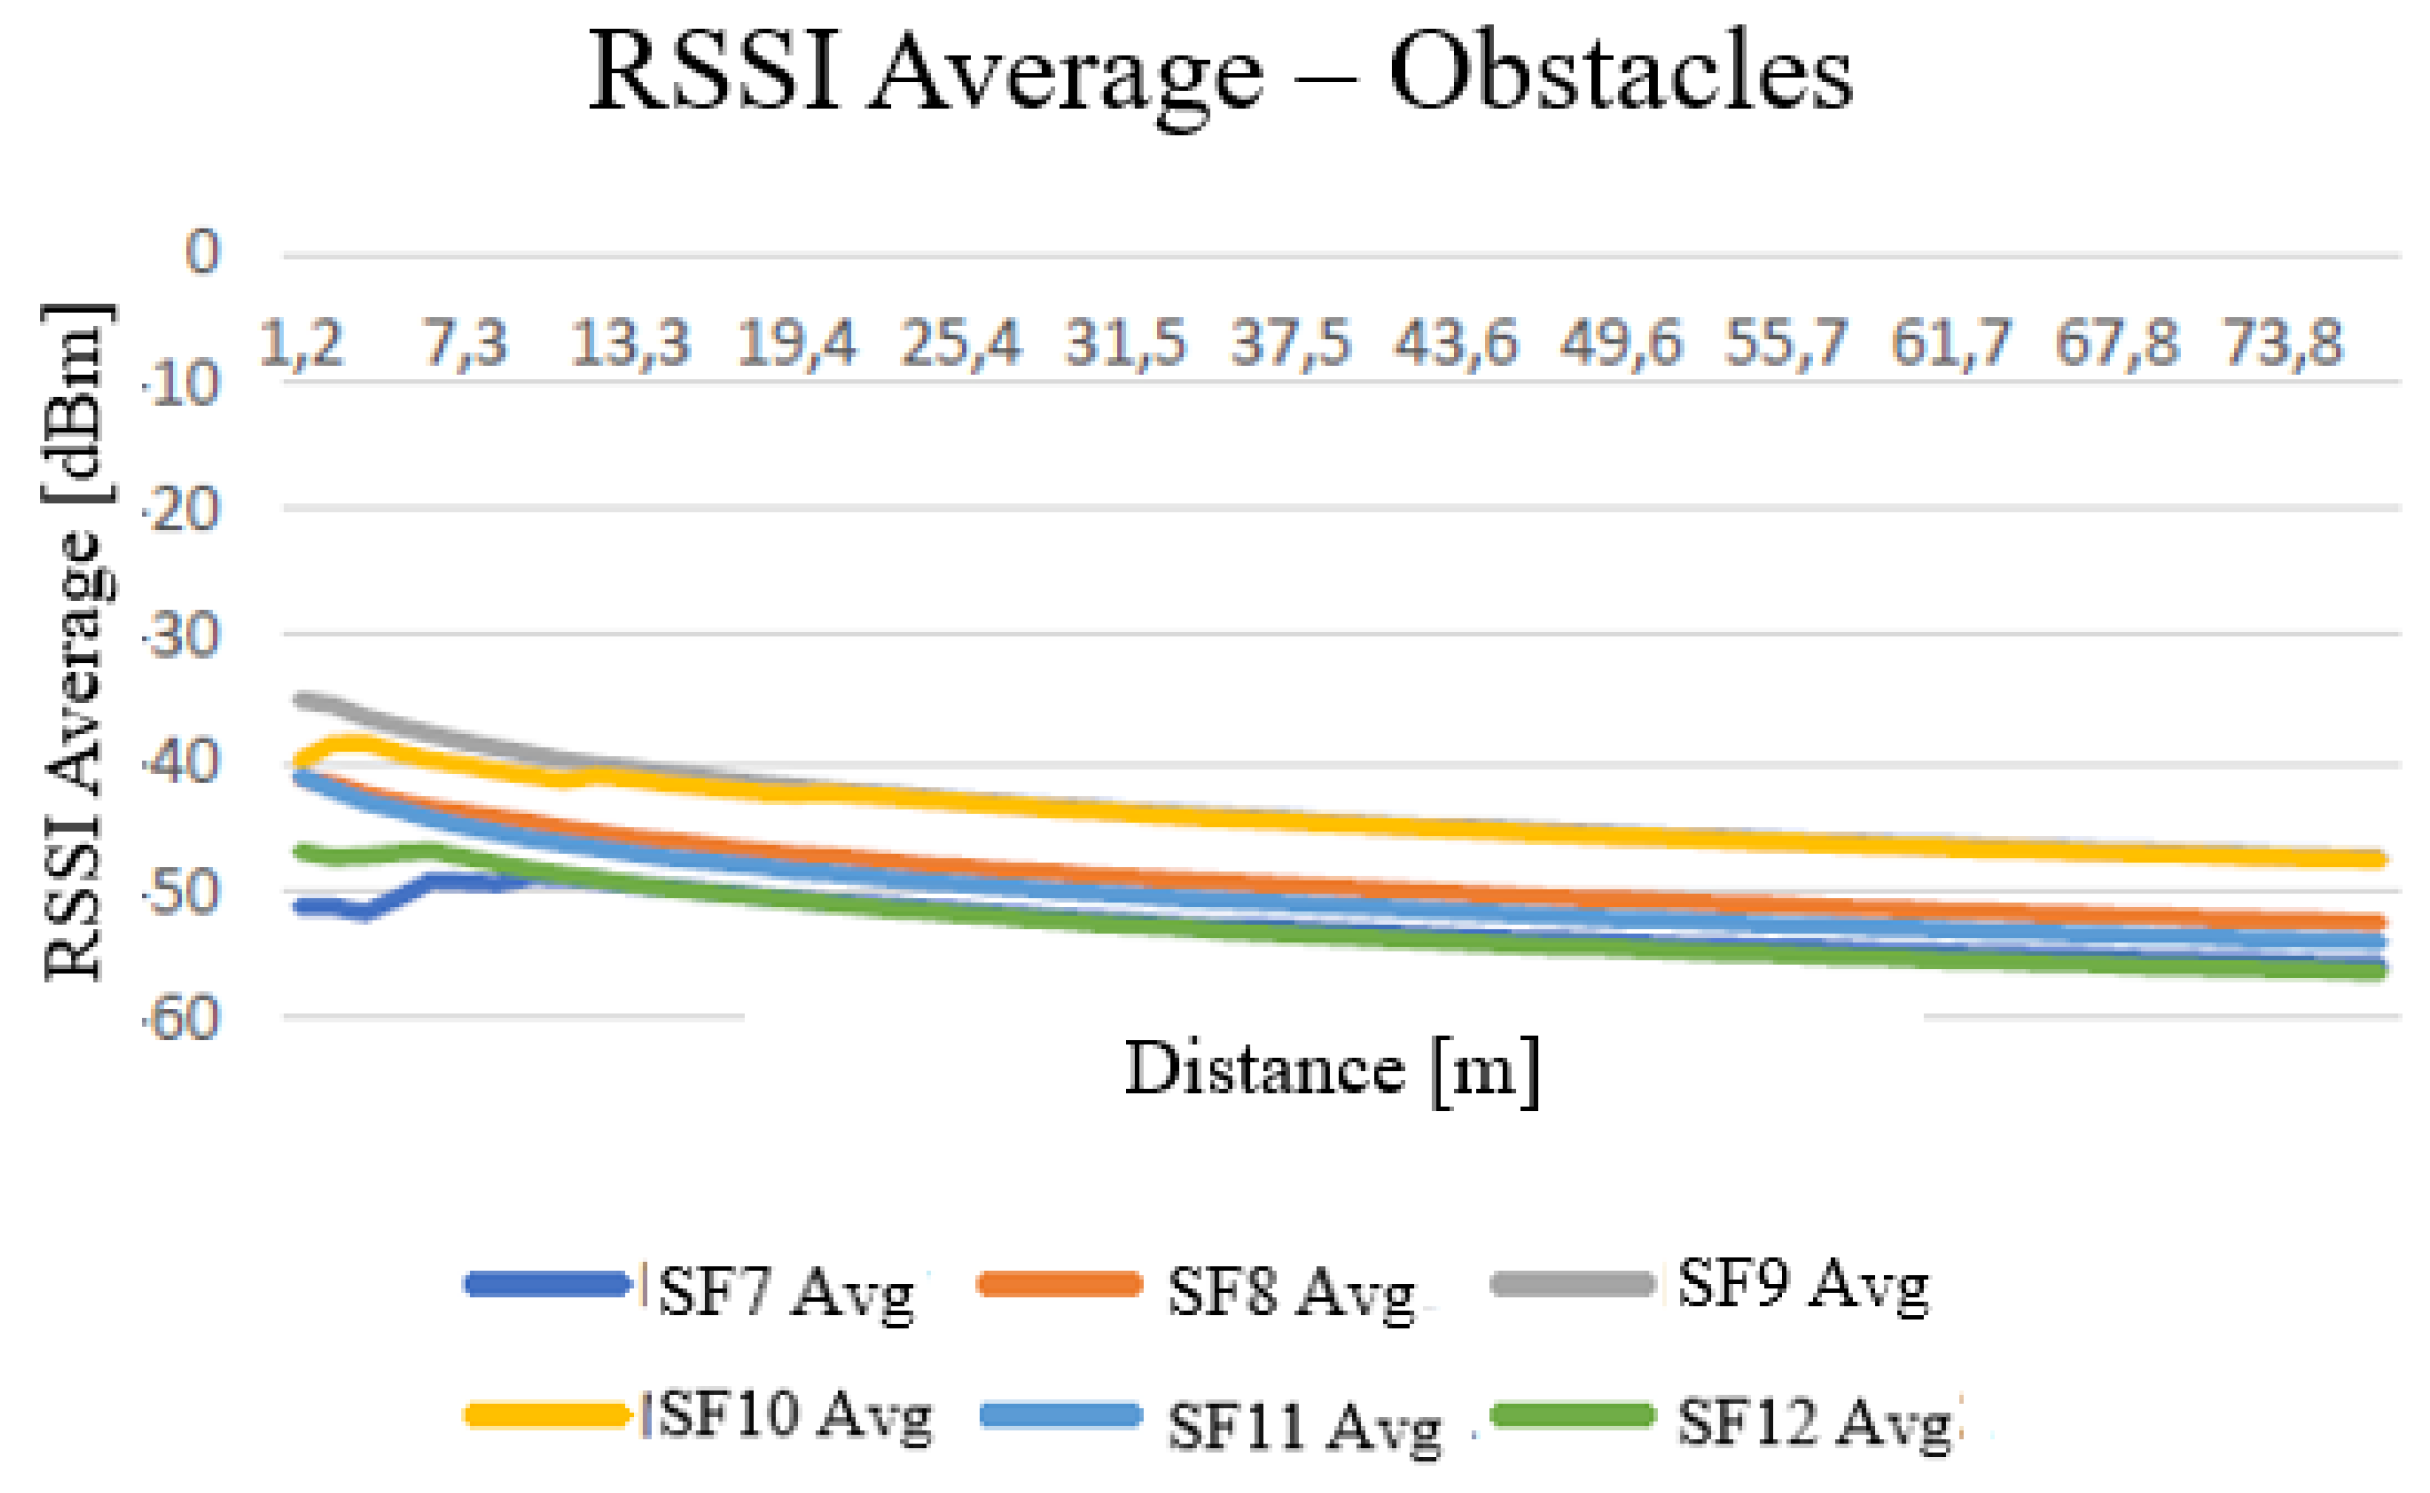
Once point-to-point communication was guaranteed, we moved on to evaluating the performance of the spreading factor. The aim of the tests was to assess the influence of the CSS modulation spreading factor on LoRa communication in open space, with and without line-of-sight obstacles. During the tests, the Received Signal Strength Indicator (RSSI) values were measured to analyze the quality of the signal with the different configurations. The results of these tests are shown in Figure 14 and Figure 15 to conclude which Spread Factor is best for this experiment. This parameter makes it possible to calculate the maximum transmission rate, considering the size, in bytes, of the final frame (see Figure 18).
It can be inferred that the Spread Factor has a direct influence on the RSSI measurement of the signal, and as the distance between the transmitter and receiver point increases, the lower the value of this indicator. It can also be concluded that, as indicated in some of the related studies, a smaller SF is more suitable for relatively shorter distances, compromising only on possible throughputs.
It can be inferred that the Spreading Factor has a direct influence on the RSSI measurement of the signal and, as the distance between the transmitter and receiver point increases, the lower the value of this indicator. For the SF7 and SF8 values, in some cases the results are worse, which could be a situation where the receiver is saturated. In the final experiment it was opted to use SF9 for this experiment.
Figure 16. LoRa frame with the different data on payload field.
Preprints 106958 g016

3.6. Experiment Final Tests

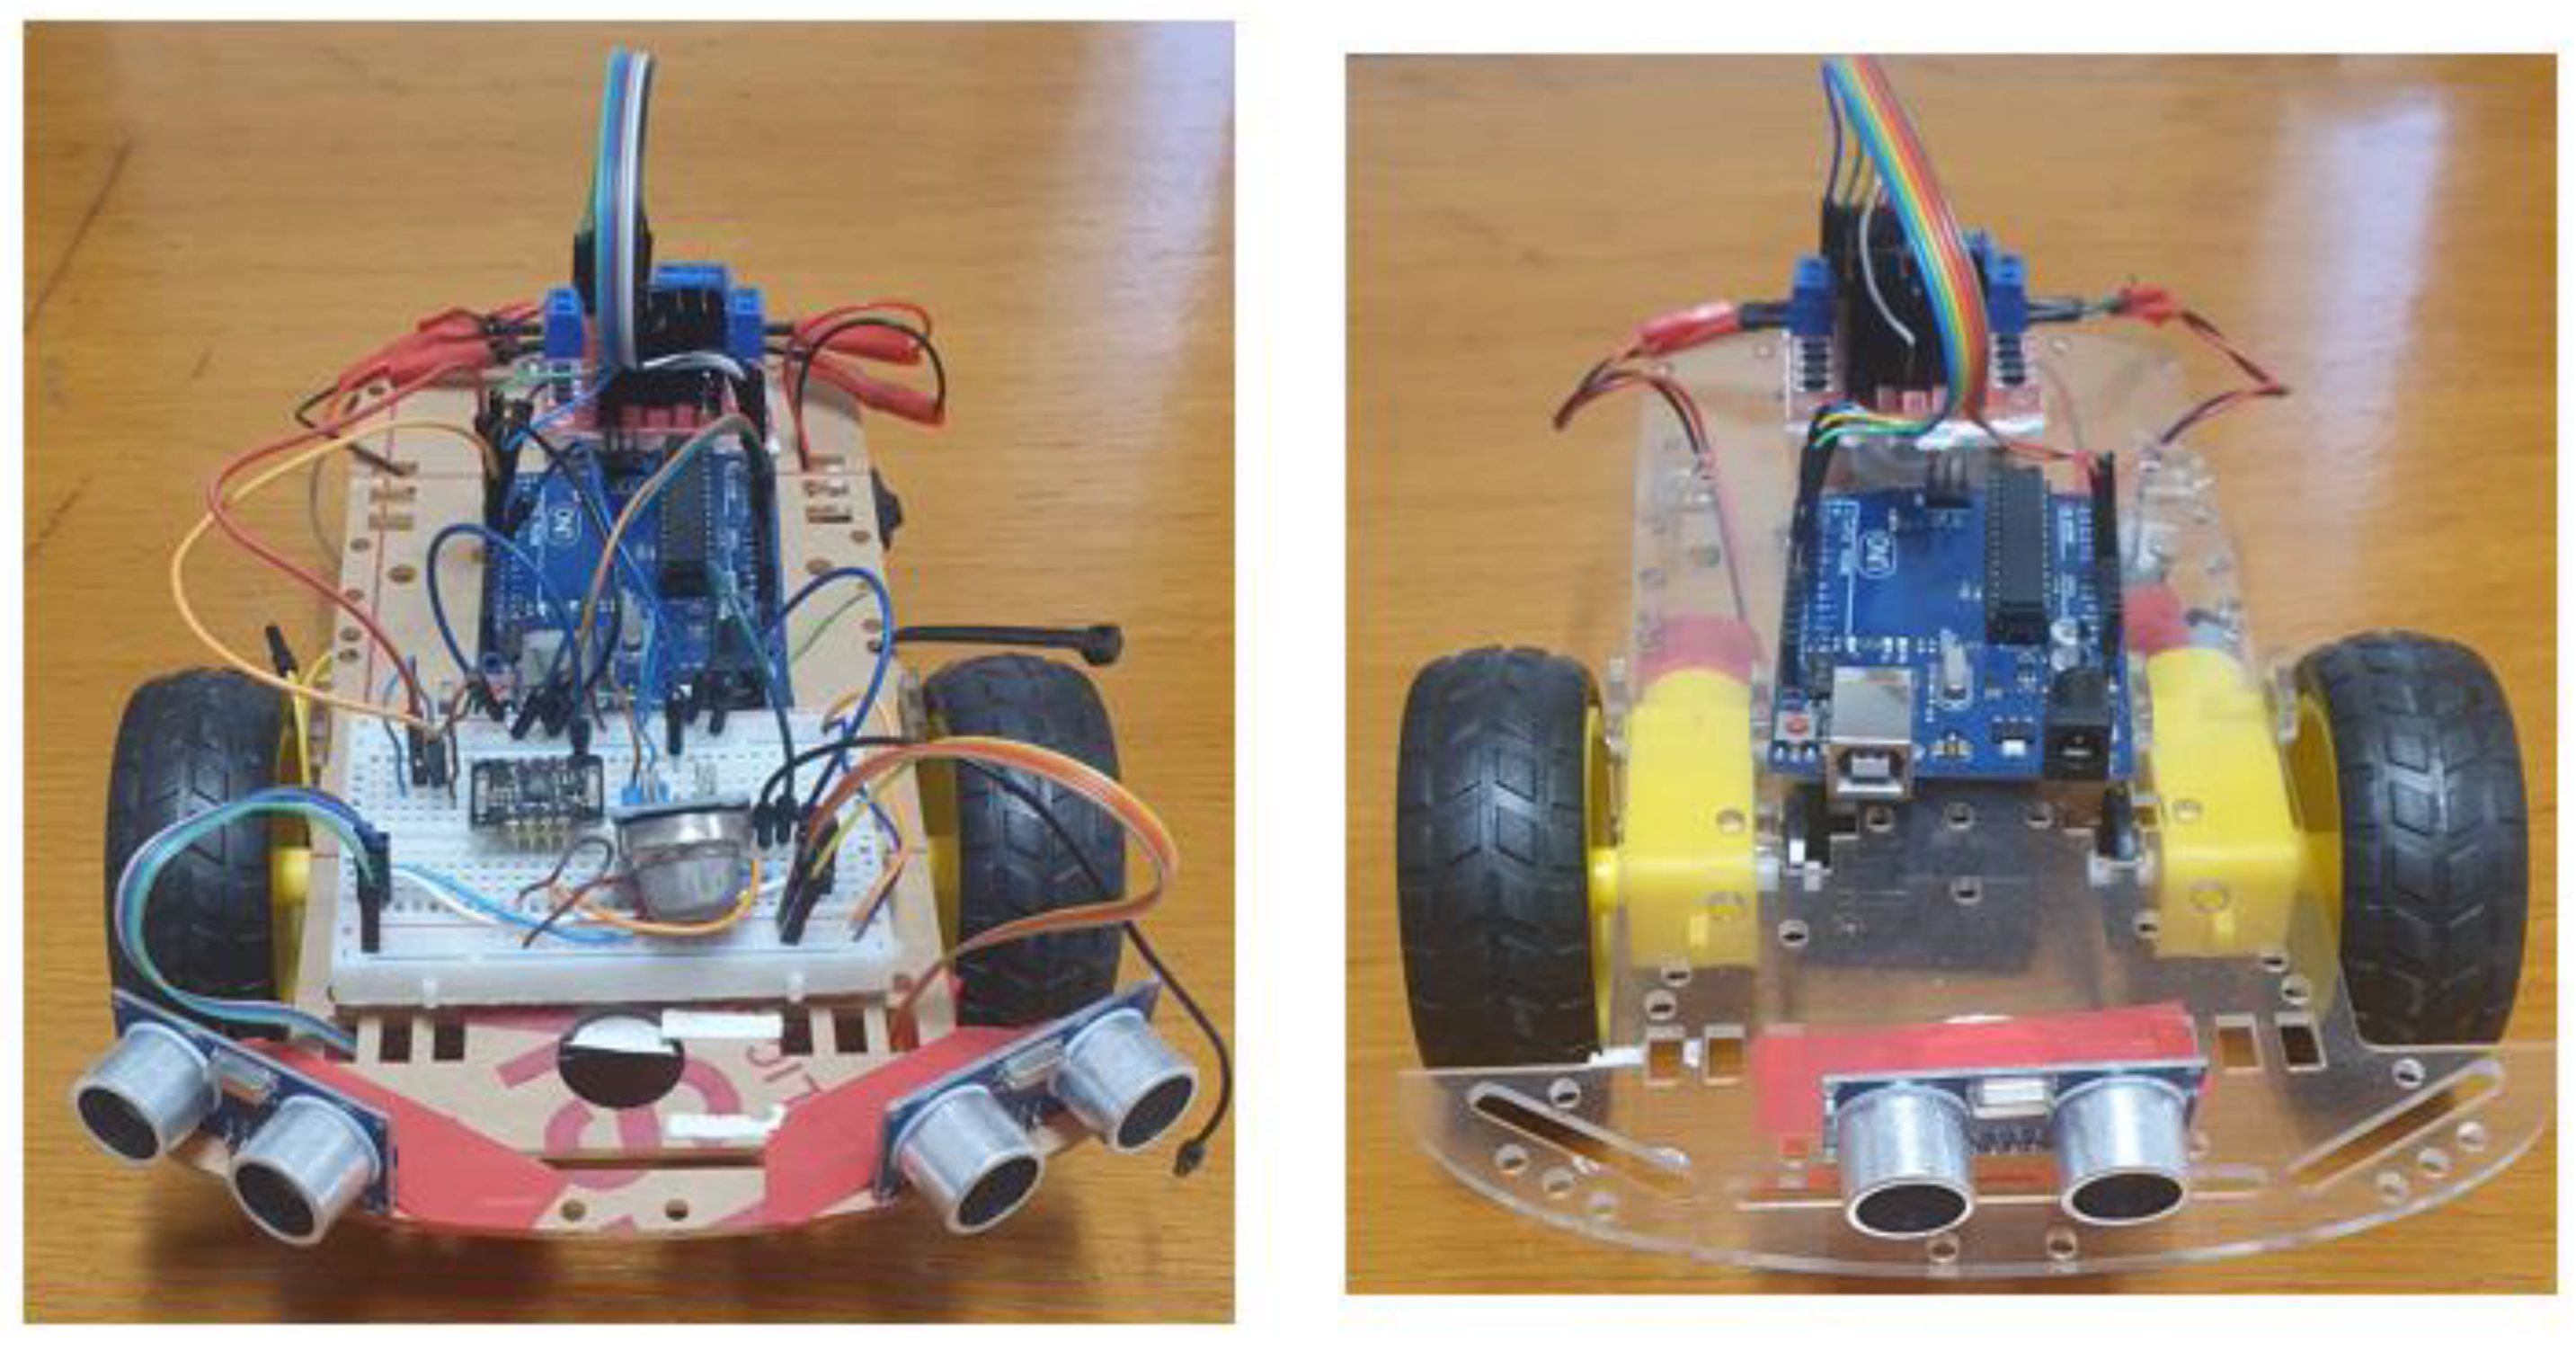
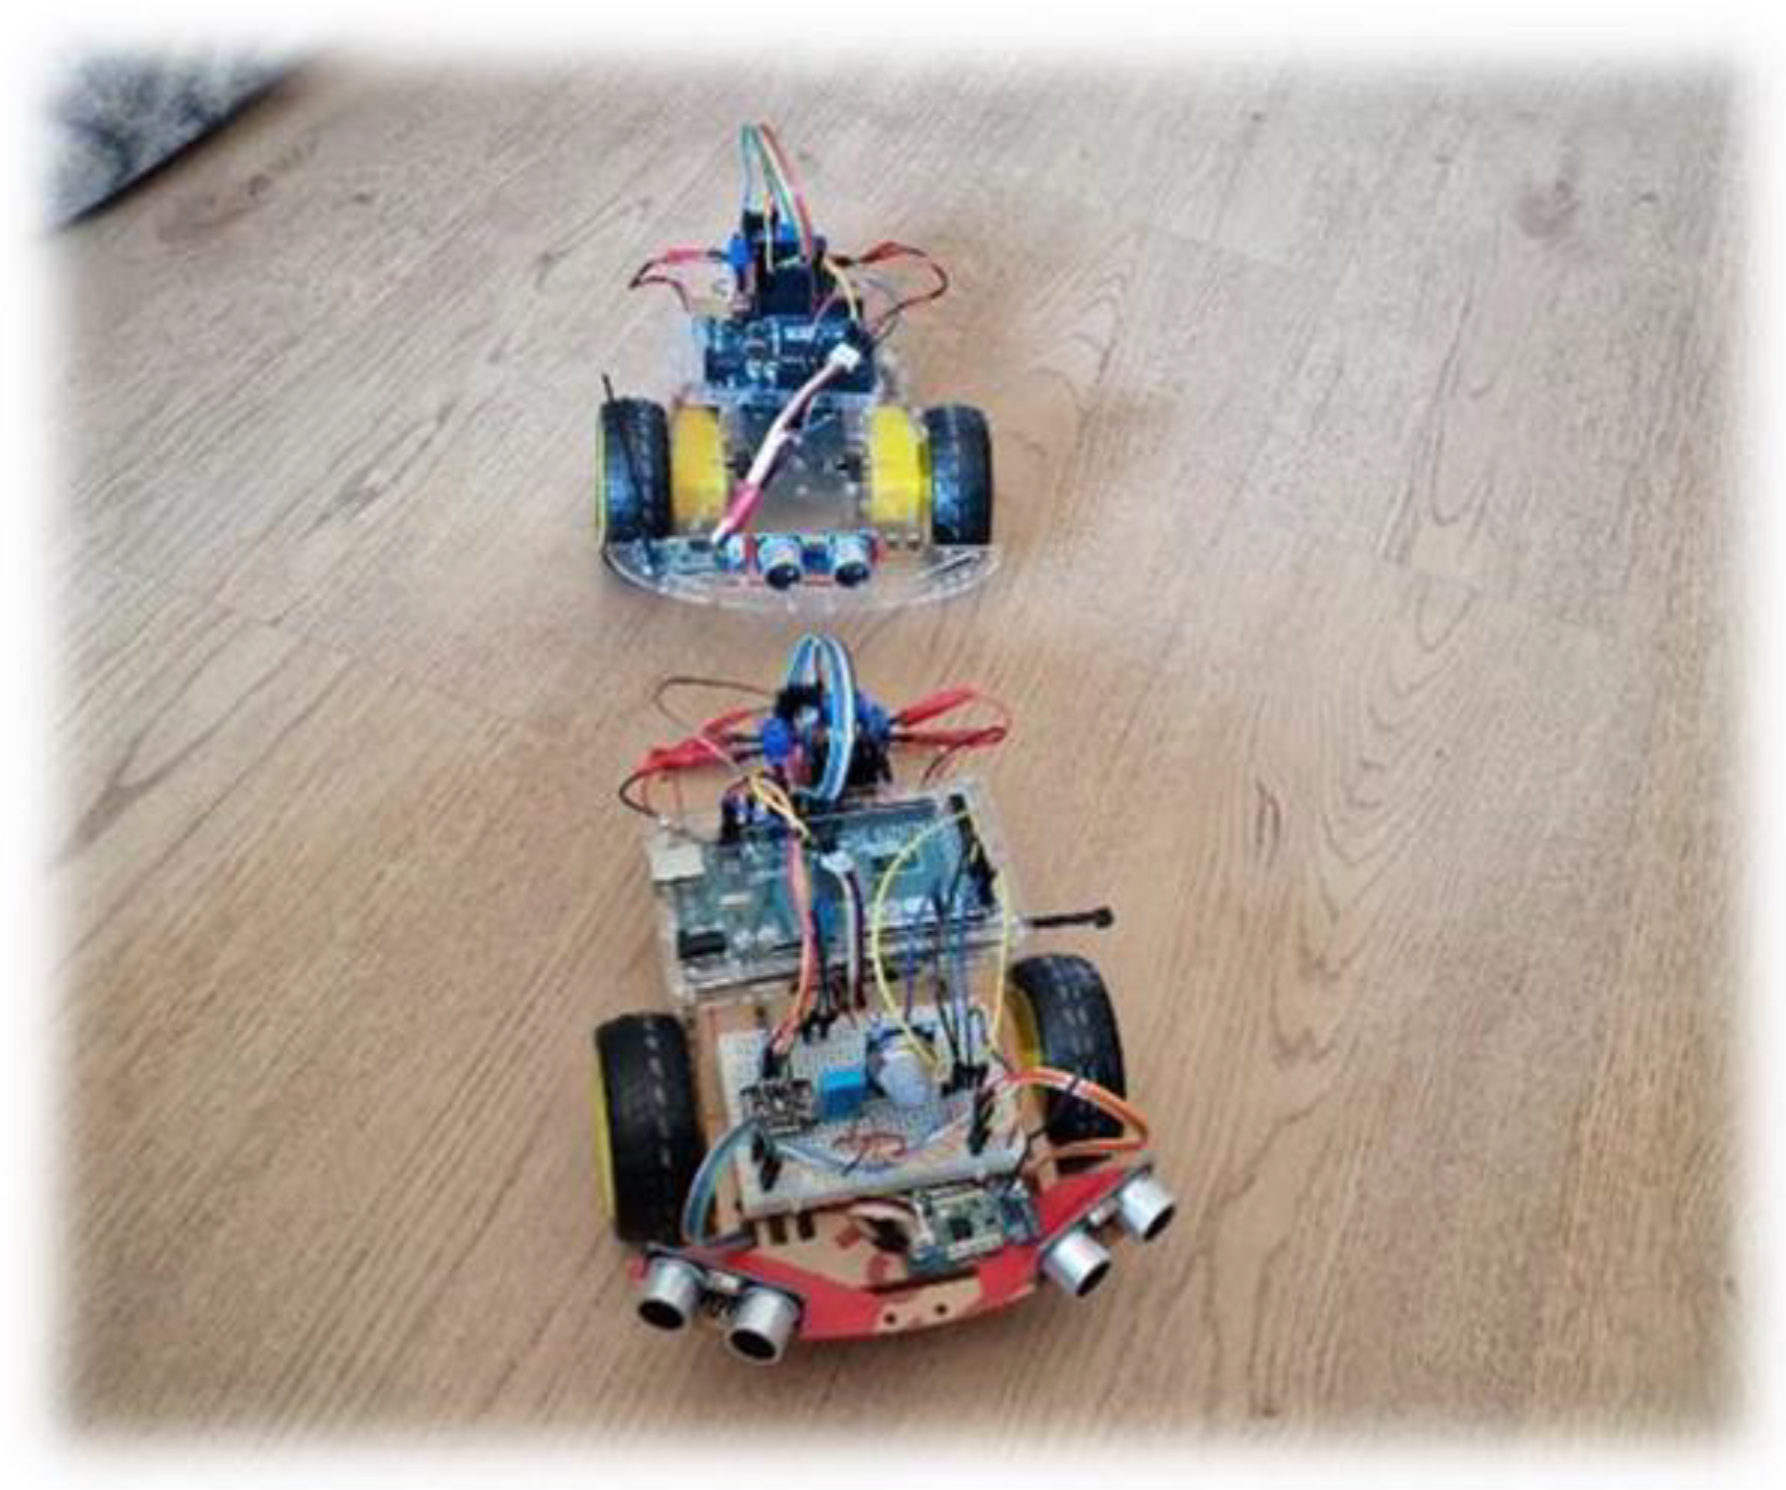
The support structure for the two robots is based on a pre-made acrylic kit of a two-wheeled robot (2WD). It was opted for this solution as it made it possible to avoid any problems that might arise structurally, as it has dedicated cut-outs for attaching the motors and the support wheel. The remaining components were arranged in such a way as to balance the center of mass, and the result is shown in Figure 17 and Figure 18.
Once the assembly phase was complete, we carried out various tests on the tracking robots. Initially, the possibility of using the ultrasound sensor that the follower robot already had was tested, however, this sensor has limitations in range and, when the robot in front changes its direction, the follower robot no longer has its objective obstacle in its "field of vision", so this possibility could not be put into practice. Subsequently, infrared sensors were used which, with their beam of light, can not only detect the presence of the robot in front, but also its distance from it, which would allow the follower robot to control its speed automatically to maintain a fixed distance. However, as with the ultrasound sensor, there is the problem that if the follower robot loses sight of the robot in front of it, these sensors can't tell which way the robot in front has turned.
Having said this, the necessary tests were carried out to verify a scenario in which the robots simulated a traffic queue, with one of them following the other. Some difficulties were encountered, namely due to the weight imbalance and some limitations of the hardware that makes up the robots, which resulted in them not walking completely in a straight line, which is one of the tasks to be perfected in the future. In view of this difficulty, the group opted for speed control based on sensor measurements, and if reached a critical threshold value, both would enter a "safety mode", reducing speed until they came to a complete stop.

4. Conclusions and Future Work

With a view to reducing the number of annual deaths caused by traffic accidents, the aim of this work was to study the possible advantages and applications of V2V communication in road safety. One of the possible applications of V2V communication is to regulate traffic automatically, adjusting the speed of vehicles based on the information they gather from their surroundings, such as the presence of obstacles on the road, unexpected behavior, or adverse driving conditions.
Focusing on adverse conditions, we experiment two mobile robots, one that leads and one that follows, to simulate the behavior of two vehicles circulating in a traffic lane.
In the LoRa network, the CSS modulation was studied and the influence of its parameters on the rate of message transmission, range, and resistance to noise and interference caused by the Doppler effect. With a focus on the SF, exhaustive tests were carried out on communication with and without line of sight, changing this parameter. The aim of these tests was to analyze the RSSI received at different distances.
It was concluded that, as mentioned in some related works to the LoRa network, for shorter distances, a lower spreading factor produces better results, with greater resistance to noise, and a higher level of RSSI. Implementing V2V communication, in this experiment on a large scale can reduce the number of road accidents, so V2V communication can help develop Smart Cities, for example, using LoRa network to communication between vehicles, but using LoRaWAN to a macro-control supported by The Things Network (TTN), as a cloud to monitoring vehicles.
In this experiment, our aim was to check the feasibility of sending data about a driver's state: pulse, the environment inside the car, as well as obstacle detection, so that in the future this data can influence the (automatic) behavior of the car, with the aim of always driving autonomously and minimizing the number of accidents as much as possible. We are unable to suggest the best position for the pulse sensor, as it is directly related to the driver; the other sensors inside the vehicle should be inside the vehicle and ‘invisible’.
Possible improvements for a real implementation as a proof of concept:
- Better quality hardware (motors with encoder and metal gear, use LiDAR sensors for obstacles or Time of Flight sensors)
- Speed control of motors using PID control.
- Miniaturize the schematic develop a PCB board.

Conflicts of Interest

The authors declare no conflicts of interest.

References

  1. Y. Li, S. Han, L. Yang, F. -Y. Wang and H. Zhang, "LoRa on the Move: Performance Evaluation of LoRa in V2X Communications," 2018 IEEE Intelligent Vehicles Symposium (IV), Changshu, China, 2018, pp. 1107–1111. [CrossRef]
  2. P. A. Torres, C. B. D. Silva and H. T. Filho An Experimental Study on the Use of LoRa Technology in Vehicle Communication. IEEE Access 2021, 9, 26633–26640. [CrossRef]
  3. Semtech. Available online: https://www.semtech.com (accessed on 24 April 2024).
  4. LoRaWAN. Available online: https://lora-developers.semtech.com/documentation/tech-papers-and-guides/loraand-lorawan/ (accessed on 2 March 2024).
  5. Augustin, A.; Yi, J.; Clausen, T.; Townsley, W.M. A Study of LoRa: Long Range & Low Power Networks for the Internet of Things. Sensors 2016, 16, 1466. [Google Scholar] [CrossRef]
  6. GTA, Available online:. Available online: https://www.gta.ufrj.br/ensino/eel878/redes1-2019-1/vf/lora/modulacao.html (accessed on 10 February 2024).
  7. TTN, Available online:. Available online: https://www.thethingsnetwork.org/docs/lorawan/duty-cycle/ (accessed on 12 January 2024).
  8. HC-SR04. 2024. Available online: https://www.electronicoscaldas.com/datasheet/HC-SR04.pdf (accessed on 3 April 2024).
  9. S. Hongchang, Z. Zhijing, J. Xin, D. Sanpeng, J. Yongxiang and Z. Zhongpeng Monitoring Driving Psychological Fatigue Through Unconstrained Heartbeat Signal Extraction by Using Pressure Sensor Array. IEEE Access 2020, 8, 22193–22202. [CrossRef]
  10. Circuit Digest, Available online:. Available online: https://circuitdigest.com/microcontroller-projects/how-max30102-pulse-oximeter-and-heart-rate-sensor-works-and-how-to-interface-with-arduino (accessed on 3 December 2023).
  11. IQAIR, Available online:. Available online: https://www.iqair.com/newsroom/in-car-pollution (accessed on 3 January 2023).
  12. Components, Available online:. Available online: https://components101.com/sensors/mq2-gas-sensor (accessed on 25 March 2023).
Figure 2. Experiment architecture for the two vehicles.
Preprints 106958 g002
Figure 10. Pulse sensor MAX30102 measurements.
Preprints 106958 g010
Figure 11. Temperature behaviour of the DHT11 sensor.
Preprints 106958 g011
Figure 12. DHT11 sensor humidity behavior.
Preprints 106958 g012
Figure 13. MQ2 gas sensor measurements.
Preprints 106958 g013
Figure 14. Tests without obstacles.
Preprints 106958 g014
Figure 15. Tests with obstacles.
Preprints 106958 g015
Figure 17. Final robots: front robot (vehicle A) on the left and follower robot (vehicle B) on the right.
Preprints 106958 g017
Figure 18. Robots on action: front robot (vehicle A) on the left and follower robot (vehicle B) on the right.
Preprints 106958 g018
Table 1. Technical characteristics HC-SR04.
Power supply 5 VDC
Current 15 mA
Frequency 40 kHz
Range 3 cm to 300 cm
Aperture angle 15°
Interface 1 digital pin to Tx
1 digital pin to RX
Table 2. Technical characteristics MAX30102.
Power supply 3.3 to 5 VDC
Current 600 µA
Interface I2C
Table 3. Technical characteristics DTH11.
Power supply 3.3 to 5.5 VDC
Humidity range 20 to 90 % ± 5%
Temperature range 0 to 50° ± 2°
Interface 1 digital pin
Table 4. Technical characteristics MQ2.
Power supply 5 VDC
Particle concentration range 200 to 10000 ppm
Interface 1 analog pin
Table 5. Technical characteristics SX1276.
Power supply 3.3 to 5 VDC
Current consumption TX 28 mA @ 20dBm
Current consumption RX 20 mA @ BW – 500 kHz
TX power +20 dBm
Interface SPI
Disclaimer/Publisher’s Note: The statements, opinions and data contained in all publications are solely those of the individual author(s) and contributor(s) and not of MDPI and/or the editor(s). MDPI and/or the editor(s) disclaim responsibility for any injury to people or property resulting from any ideas, methods, instructions or products referred to in the content.
Copyright: This open access article is published under a Creative Commons CC BY 4.0 license, which permit the free download, distribution, and reuse, provided that the author and preprint are cited in any reuse.
Prerpints.org logo

Preprints.org is a free preprint server supported by MDPI in Basel, Switzerland.

Subscribe

© 2024 MDPI (Basel, Switzerland) unless otherwise stated