1. Introduction to Solar Panel Technology
Solar energy is a form of renewable energy derived from sunlight. Since there are no greenhouse gases produced throughout the process and fewer materials that could cause pollution are used, which could be harmful to our environment, as explained in an article by Ewim et al. (2023) [
1], it is therefore considered the cleanest type of renewable energy. Research and technological advancements are also driving growth in the renewable energy sector. Solar energy can be considered a basic human need that can be processed into secondary forms such as heat, light, and electricity, which has experienced considerable growth in Uganda, as well as worldwide as explained by Mugagga et al. (2019) [
2]. In comparison, with other forms of renewable energy, solar and wind energy outperform other forms of renewable energy. Solar panels are a medium for converting solar energy into electricity using photovoltaic materials. This system is widely used in many fields, such as for powering rural schools, homes, etc, according to an article by Behera et al. (2017) [
3], Samad et al. (2013) [
4]. for space-based fused deposition modelling (FDM) 3D printers powered by solar photovoltaics, according to an article by Wong et al. (2015) [
5]; and for solar-powered vehicles, according to Khan et al. (2018) [
6]. This is generally because it is easily engineered and ecologically friendly and can reduce consumer dependence on state power companies. Further application of solar energy can be found in an article by Parvez et al. (2024) [
6] on the energy, exergy, economic, and environmental evaluation of a trigeneration system for integrated power, cooling, and desalinating water fueled by solar energy and by Hasan et al. (2019) [
8], who designed and built a solar thermal hybrid variable refrigerant flow (VRF) air conditioning system, estimated the system’s energy savings, and contrasted it with a standard VRF system.
Despite advancements in technology, the most significant problem in solar energy systems is the rate at which sunlight is absorbed by solar panels. The amount of sunshine that the solar panel absorbs determines the amount of electricity that it can generate.
The relationship between sunlight energy and solar panel design needs to be studied to increase the absorption rate of sunlight energy into solar panels. The simplest example of ensuring that a solar panel absorbs sunlight is by considering the angle of installation, as explained by Zhong et al. (2020) [
9] and Chen et al. (2005) [
10]. The best angle for solar panel installation is important for maximum energy production. In addition to the angle, solar panel design also covers the types and sizes of solar panels and solar panel components. Different types of solar panels work perfectly in the same or different ways. Solar panel components mainly determine the lifespan of the panels. Proper solar panel components can increase the absorption of sunlight and the longevity of solar panels. For the installation, after studying the relationship between solar panel design and sunlight energy absorption, the angle will be chosen by considering the environmental aspect and electricity requirements.
Optimisation techniques as explained by Okello (2021) [
11] especially in solar energy enables increased performance of solar panels and thermal collectors, such as those presented by Qazi et al. (2019) [
12].
Many high-quality solutions provide high solar yields in places such as shadow areas or non-optimal spatial conditions. Currently, the standard solar panel installation angle is placed completely perpendicular to the ground, but at low latitudes, such as the equator, this assumption is sometimes incorrect.
El-Khozondar et al. (2024) [
13] conducted an analysis of different off-grid solar PV system architectures for the lighting of the Kuwaiti roundabout. They solve critical issues like power consumption, space constraints, and network load issues. They also provided novel solutions, such as dual-voltage lights and charge controllers, which identified optimal design techniques for roadway applications and have significance for sustainable urban illumination models.
Ubando et al. (2022) [
14] explored the idea of concentrated solar power, which is a form of sustainable energy that uses a solar concentrating device and a solar receiver to transform solar energy into electricity. They applied computational fluid dynamics to simulate concentrated solar power. They went on to thoroughly examine the optical models of solar concentrators such as hyperbolic and parabolic discs, as well as solar receivers.
Visa et al. (2015) [
15] designed an optimum solar thermal absorber for facade integration. The collector’s isosceles trapeze design allows for a multicoloured absorption panel. They investigated inside in steady-state settings and revealed an approximate performance of 62.38%, whereas the initial outdoor examination yielded a collector performance of 62%.
Cox et al. (1985) [
16] investigated many potentially beneficial characteristics in the conceptualisation of photovoltaic/thermal (PV/T) devices to establish their efficacy and interaction. Their research focused on air-type collectors with single-crystalline silicon photovoltaic cells. This research focuses on two major areas: improving solar absorptance and decreasing infrared emittance. The simulation results were then stated as follows. When combined with a gridded-back cell, a selective absorber affects the thermal efficiency of PV cells, which cover more than approximately 65% of the total collector area. The low-emissivity coating required an infrared radiation emissivity below 0.25 and a solar transmissivity of at least 0.85. The best combination for airborne PV/T was determined to be gridded-back PV cells, a nonselective tertiary absorber, and a high-trans-emissivity/low-emissivity covering across photovoltaic cells.
A computational model aimed at optimising the layout of polymer solar collectors with flat plates by Do Ango et al. (2013) [
17] revealed that solar energy absorbers are often constructed of copper or aluminium, and while they provide excellent efficiency, they are also expensive. In contrast, utilising polymers can increase the financial viability of solar collectors. They presented a numerical assessment of an innovative solar power collector construction to determine how the design variables (air gap thickness and collector length) and operational variables (mass flow rate, incident solar energy, and inlet temperature) affect efficiency. Their research showed the major trends in the key parameters that influence the efficiency of polymer flat plate solar collectors.
The electrical and thermal efficiencies of the PV/T system were superior to those of standard separated systems. According to an article by Khare & Bunglowala (2020) [
18], the formula for calculating the power output of solar panels module is given as follows
, where
is the maximum power produced by a solar panel with
solar modules and the maximum voltage
and maximum current
over time
.
If we maximise the surface area of the panel, more modules can fit in the same panel; therefore, an increase in means that more power can be produced by the same solar panel occupying the same space with the given fixed dimensions. This is especially useful for a confined space in which the demand for the maximum is high.
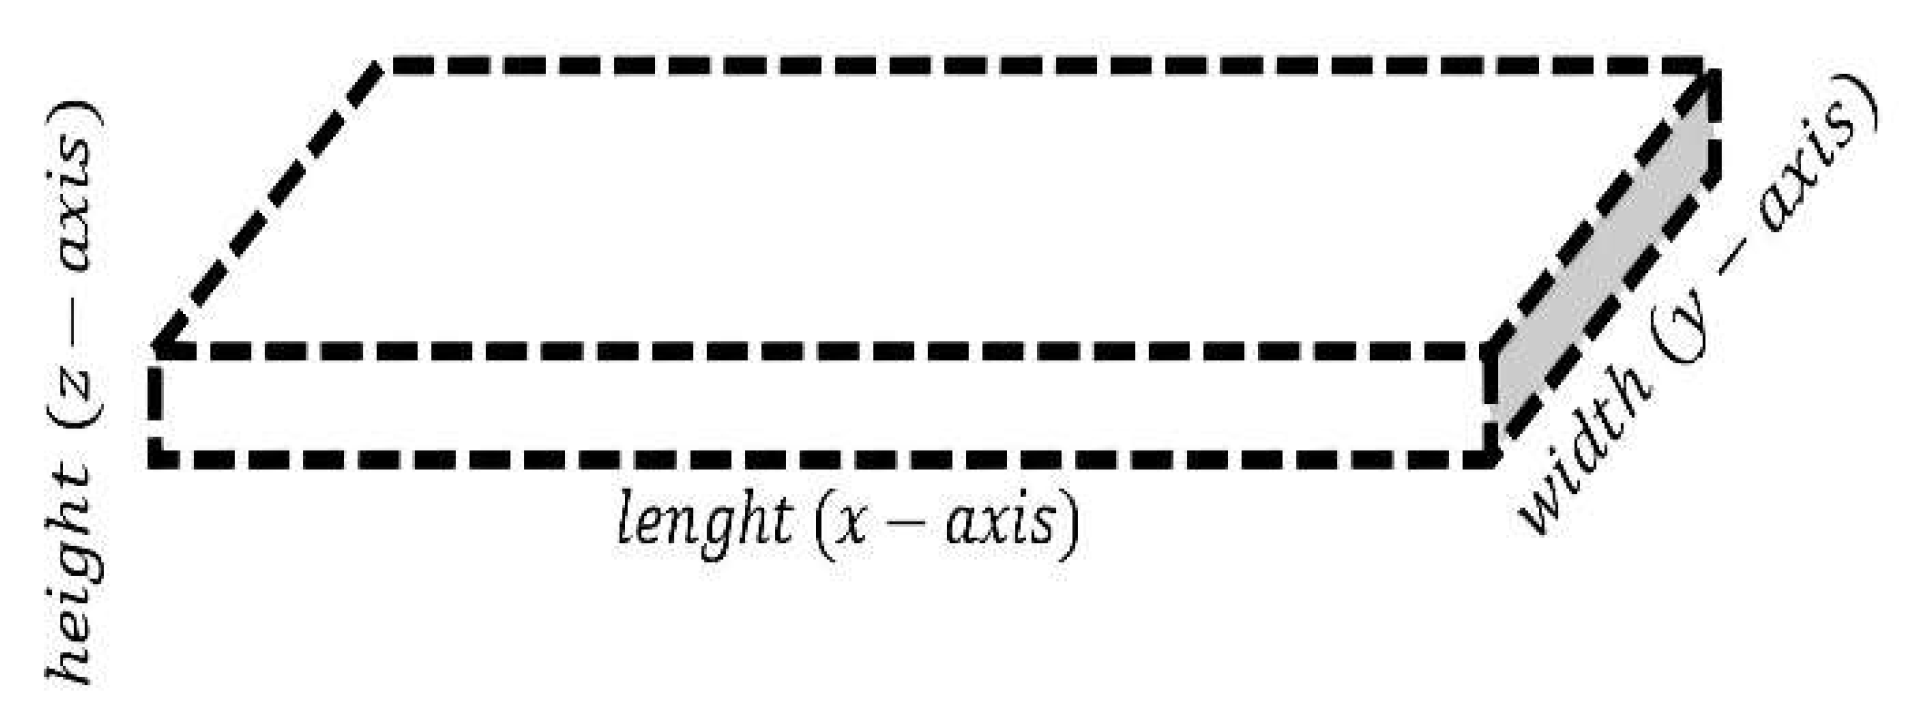
For example, in a densely populated area in some parts of Africa, in an urban setting where people live in apartments or have small plots of land, they need electricity to drive their daily home activities, but often there are constant electric grid power outages, or in some parts of Africa, some areas are without electricity connected to the central grid supply. Therefore, the entire area is without electricity, rendering them reliant on alternative electricity sources such as solar energy due to its cost-effectiveness. The amount of solar energy produced is directly proportional to the surface area of the solar panel exposed to the sun rays, so challenges arise for the space required to install solar panels to achieve maximum coverage of solar radiation energy absorption in constricted spaces such as vehicles powered by solar or small residential apartments. The challenges with solar energy are that once a plate is installed, the space under it or above it cannot be used for another solar panel installation. This is because the shadow cast by the above solar panel or structure prevents sun rays from reaching the below solar panel. The introduction of flexible solar panels that can take on any shape has given us the opportunity to explore the possibility of maximising the solar plate surface area using surface curving techniques. In this optimisation study, the constraint is that we have a space with fixed dimensions (length, width, and height), and the objective is to maximise the top surface area of the panel within the given dimensions to maximise the solar panel surface for sun energy absorption. This optimisation approach is possible due to the introduction of thin fabric printable and foldable solar panels, such as the one that was recently developed by MIT researcher “Paper-thin solar cells can turn any surface into a power source” by Adam Zewe (2022) [
19].
3. Solar Panel Performance Using System Advisor Model
In this subsection, an analysis using the System Advisor Model is provided based on a simplified geometry. The SAM has been extensively used to simulate solar energy by many scholars, for instance, in an article by Salem et al. (2004) [
22], because it provides real-world solar energy data. Here, concentrated solar energy is used, and the simulation file is provided along with the article by Okello (2024) [
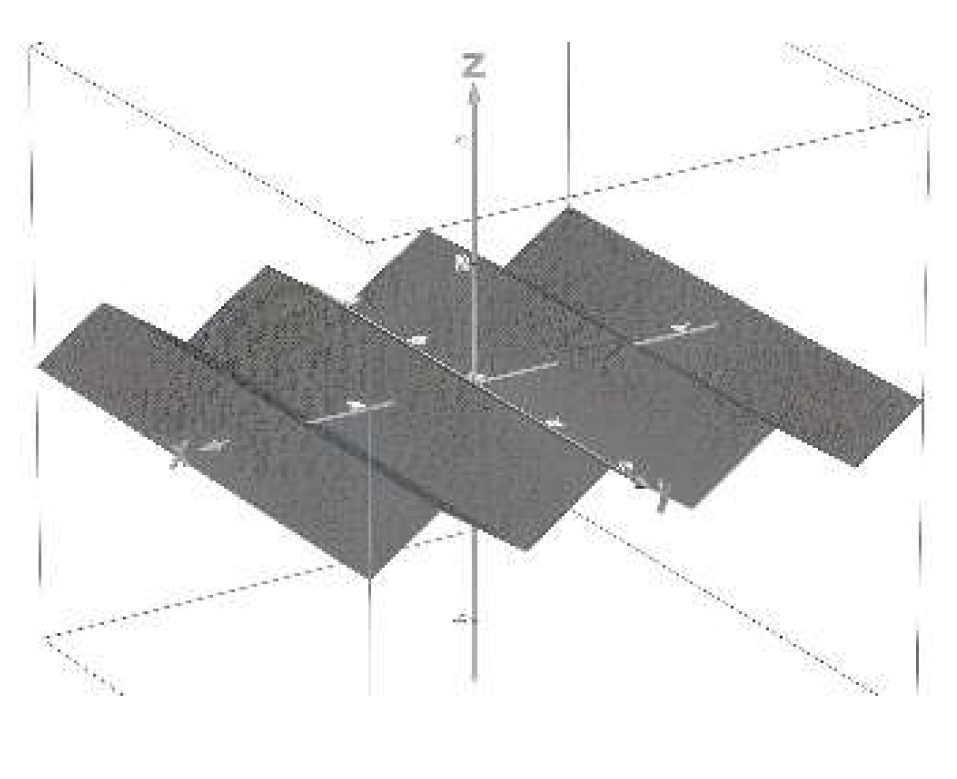
24]. Equation (1-ii) is used for this simulation. See Figure 7 for solar cell setup which arranged in zigzag pattern at an angle
of elevation.
The size of solar panels varies depending on the brand, but typically a residential panel is 5.5 feet by 3 feet (167.64 cm by 91.44 cm), and a commercial panel is 6.5 feet by 3 feet (198.12 cm by 91.44 cm), which is roughly a foot longer. However, for this study, commercial solar panel dimension is used having roughly 72 cells
The standard dimensions of a solar cell are approximately 6 by 6 inches, which is approximately (15.6 cm by 15.6 cm) surface area 243.36 cm
2. So, the length and width of the solar cell are
where
is the angle of elevation of the solar cell, as shown in
Figure 4.
By substituting (8) and (9) into (1-ii) we get (10).
Solution of the above equation when , , and .
Solution
The first approach is to use the integration approach provided in equation (6) using the equation (10). The floor function
is to remove any decimal point number to ensure that we have an exact number that accommodates solar cells not having half or less than one solar cell. So total number of solar cells
in a given solar module is given as below.
However, we can use direct calculation without using integration for solving equation (11) to find the total solar cells that fit withing a within a given space. Please note that solution (12) is specifically for solving equation (10) and (11) shown in Figure 7, any other function apart from (10) will require different solution design.
According to
Table 1, the calculated solar panel having flat surface area is 18,116.0928 cm
2, with 74 solar cells having a maximum power pump of 338159.626Wdc and an annual AC energy 1-year for flat surface solar panel of 2154901504 kWh. According to an article by Mamun et al. (2022) [
23], the overall solar panel efficiency is downgraded when tilted at an angle to the source radiation, i.e., the sun; it decreases by approximately 0.76% for every 5° increase in the angle of the solar tilted for an outdoor solar panel from 15
o. Therefore, in
Table 1, the Annual AC Energy kWh is decreased by 0.76% for every 5° increase in the solar curved angle
to determine the approximate solar efficiency decrease in performance. In
Table 1,
. For angle
is considered insignificant to affect solar panel productivity for solar mounted on tracker. Given initial flat solar panel Annual Energy
2154901504
. For this case the angle is incremented by 5
o, such that
.
This is done repeatedly for all value of
to find the final approximate Productivity after efficiency issue has been removed which is
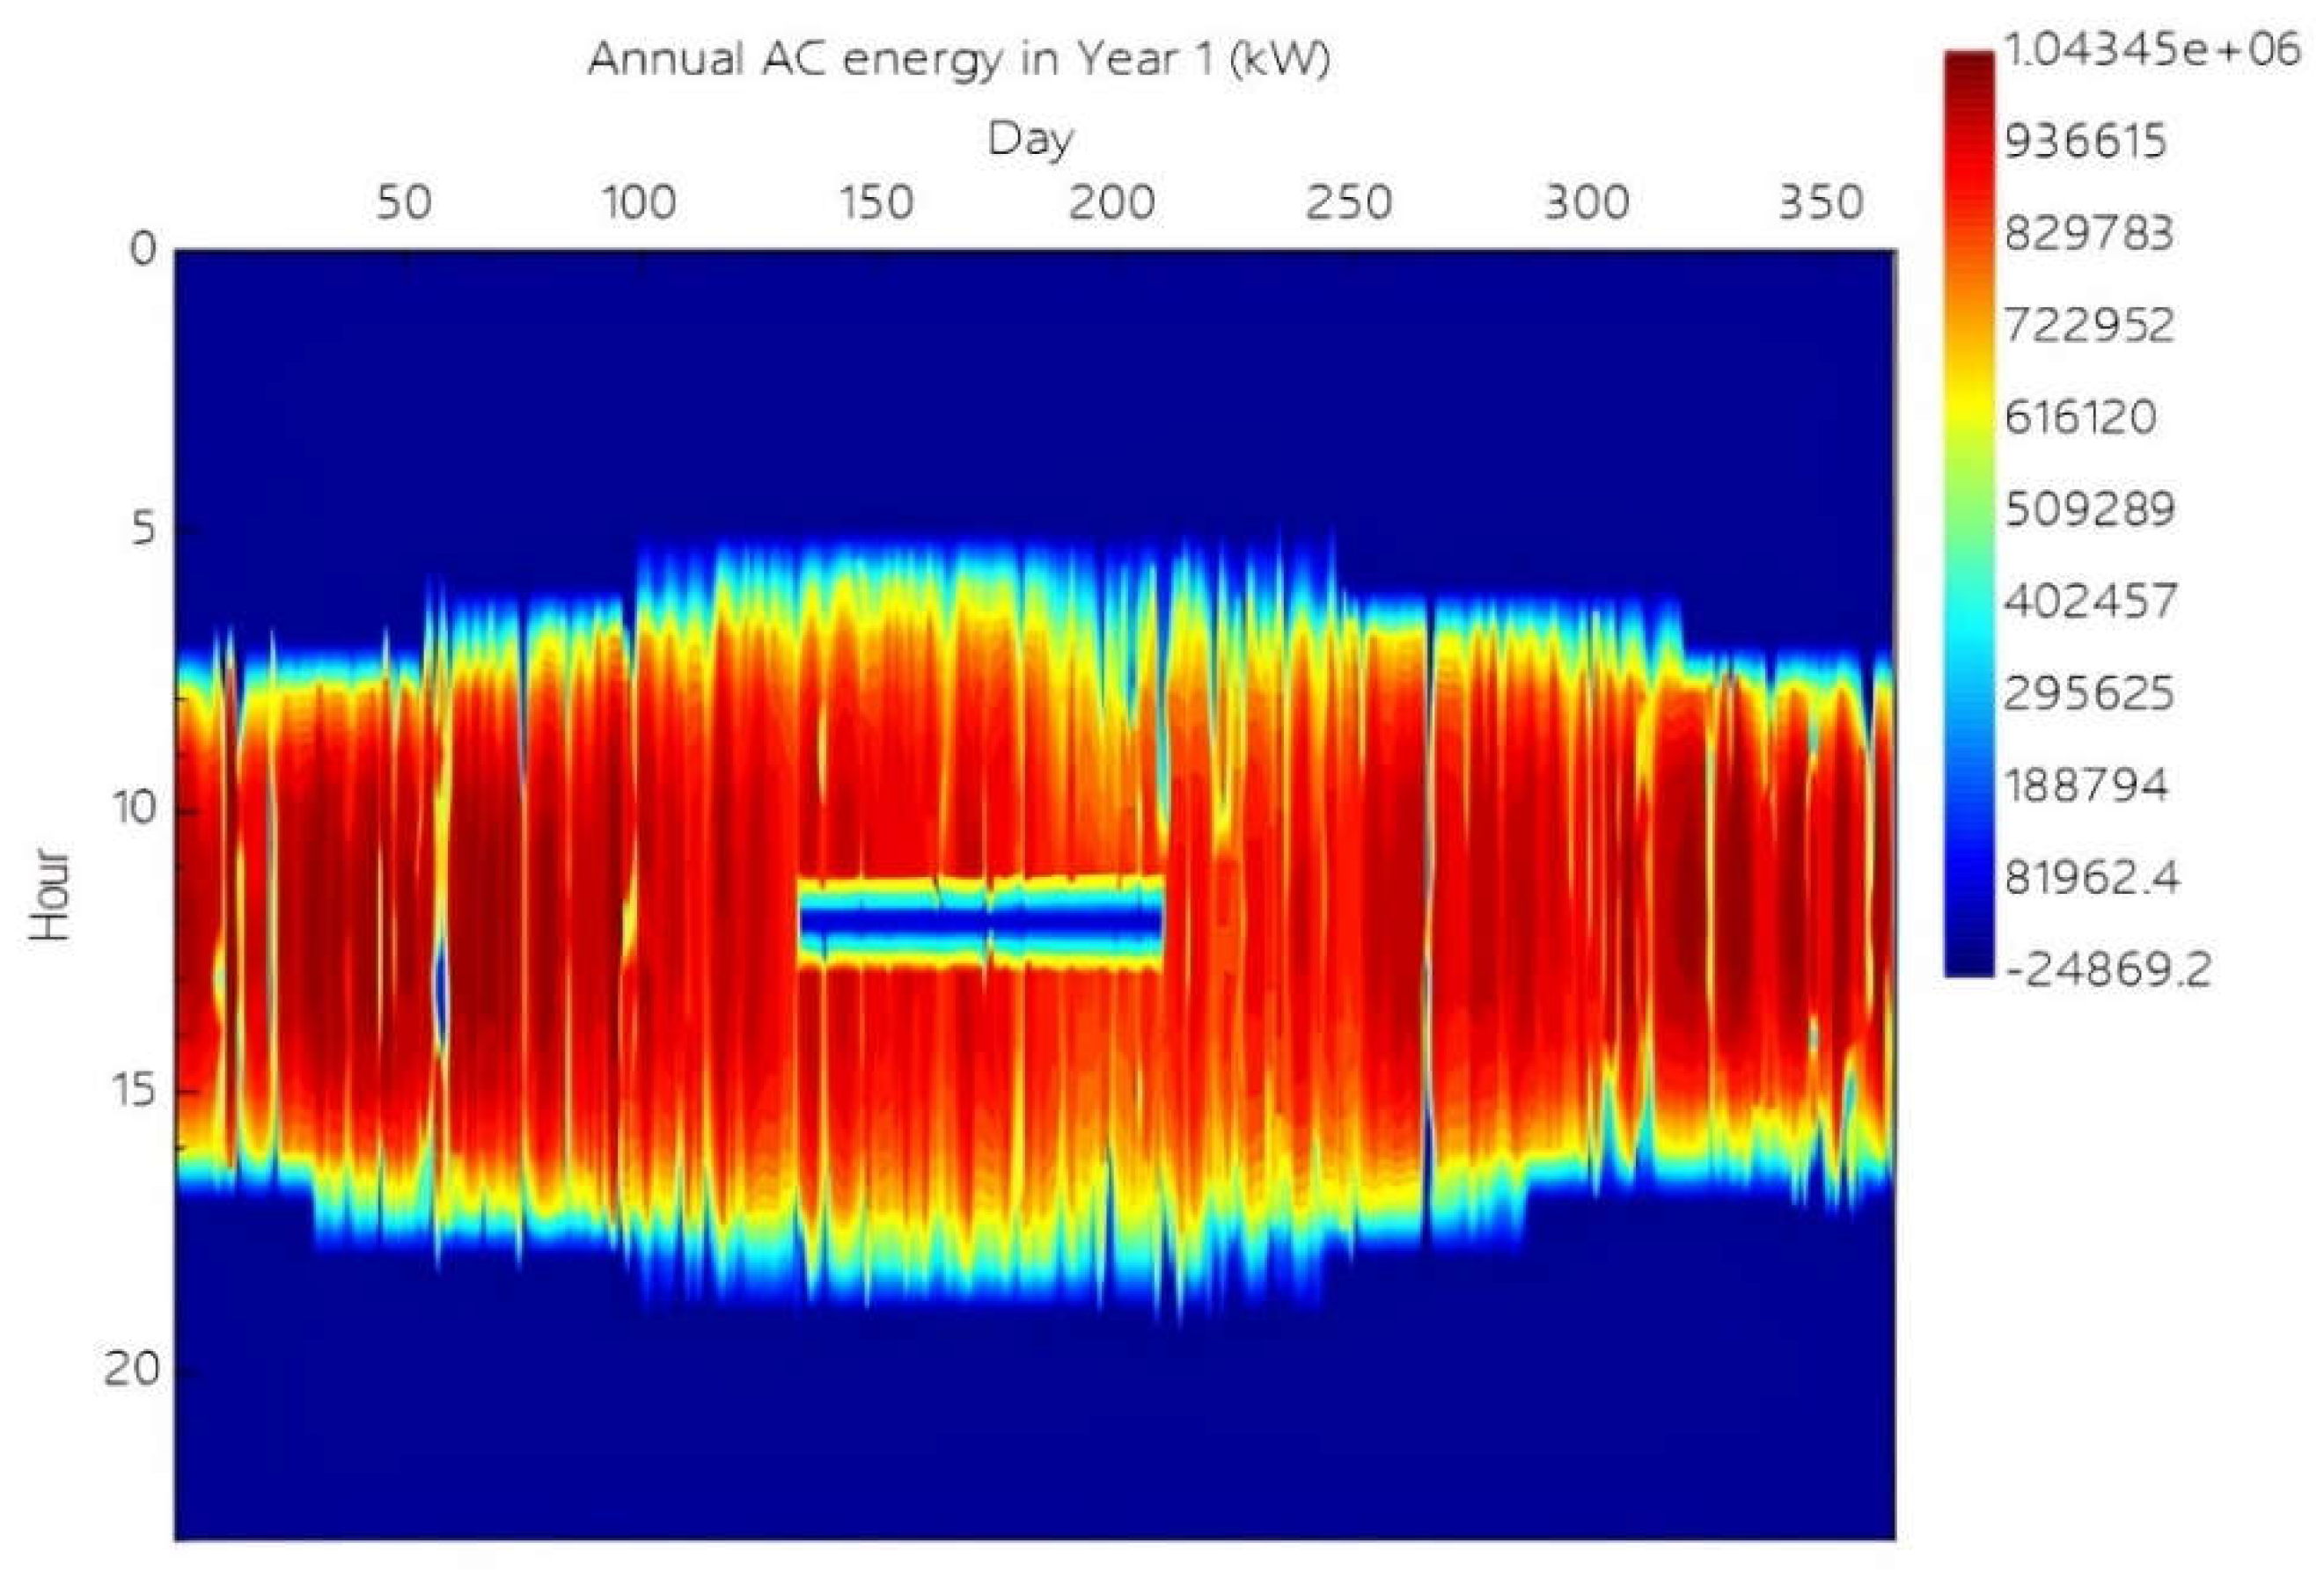
Figure 5, show sample figure taken from the SAM simulation software using the system advisor model SAM when the total number of cells in a module was set to 122; this was calculated using equations (11) and (12) when the angle
.
and single cell surface area is 243.36 cm2.
By using the above equation (8) and (9), we can substitute all of the equations in (1) and (2). See sample of zigzag panel on both x and y axis from equation (2-ii), see the modification below (14).
By using the angle approach given above, we can design the scenario from
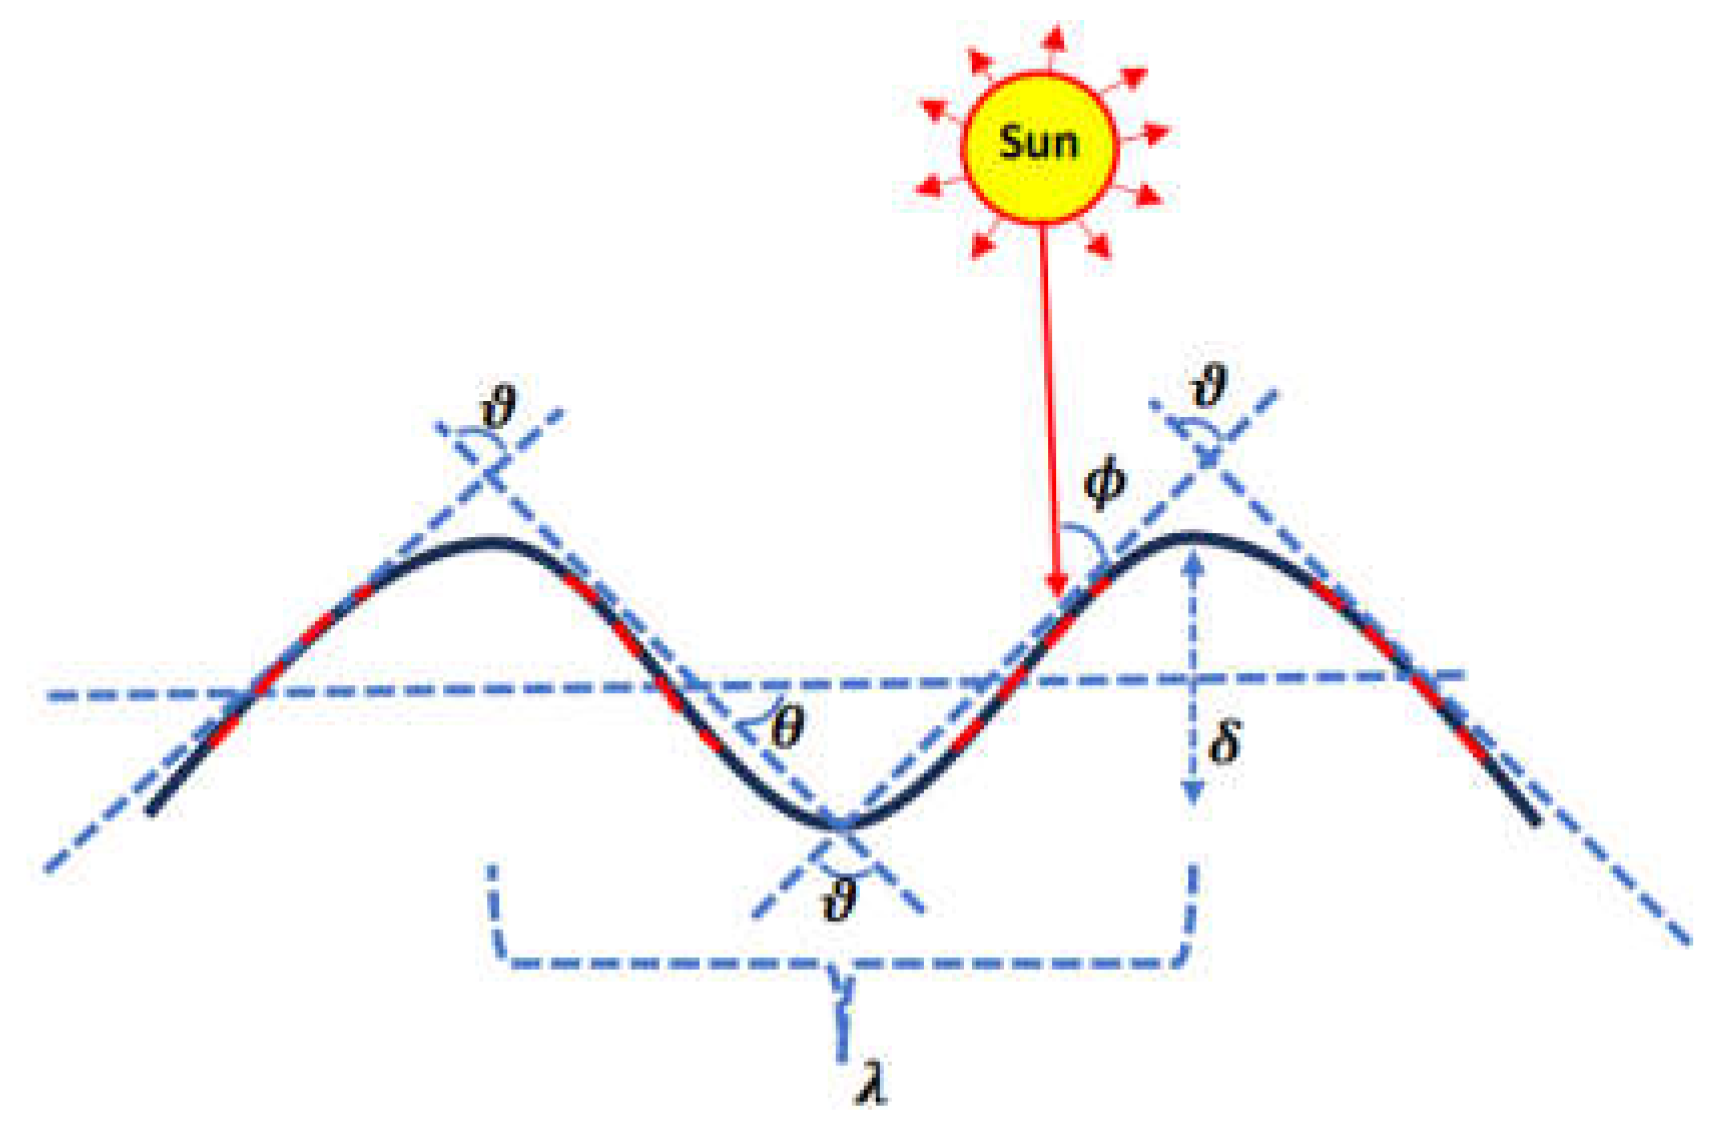
Figure 4 for zigzag to wavy curve like in
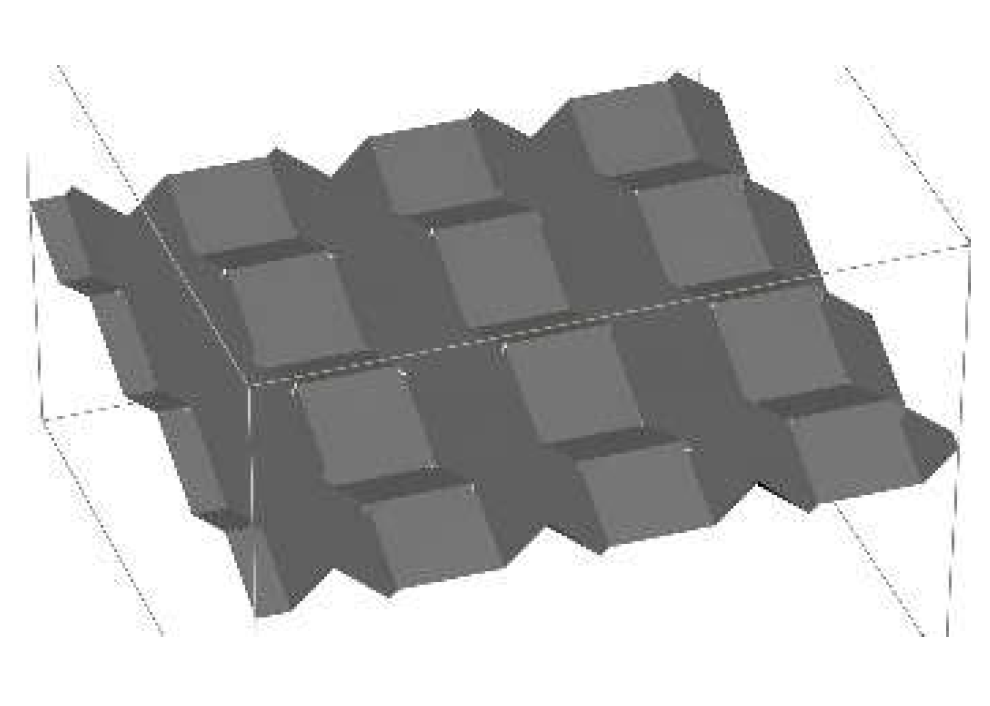
Figure 6 below where
and
.
This wavy curvation means not all parts are inclined to the sun’s rays at an angle
, like the top or bottom, which receives direct sunlight. So overall, this design experiences less efficiency problems due to curvation than the design in
Figure 4 using zigzag. Regions of curved solar panel in
Figure 6 dotted with red received sun rays angle
while for other region receive at angle
. On top and bottom region of curve when
4. Discussion
Although having a curved surface increases the surface area of a given plate and maximises solar energy output, it should be noted that the solar plate angle of inclination to the source of solar energy (the sun) for maximum energy output varies, but mostly solar rays from the sun should be perpendicular to the plate surface, i.e., when This presents a problem with the proposed method in that, due to the curved surface, for some parts of the curved surface, even if the entire solar plate is set facing the sun directly using a tracker, some parts of the curved surface will be tilted at an angle to the sun rays, i.e., , which may cause reflection and cast shadows on the neighbouring curved surface parts, reducing the energy absorption rate and efficiency of the solar panel. A protruding surface with a sharp pointing surface may not be good because it can be prone to breakage when hit, for instance, cone, pyramidal, or zigzag curved solar panels surface. Therefore, a gentle, curved protruding surface, such as a hemisphere or wavy curve, is a better choice.
a. Comparison of the Proposed Solar Design to a Flat Solar Panel
The proposed method enables solar panels to gain more surface area that is exposed to the sun’s rays, hence increasing their absorption rate and, consequently, their entire solar energy production efficiency.
For a conventional flat-surface solar panel, the surface area of the panel is exactly the same as the surface area exposed to the sun; hence, it has a smaller surface area in comparison to the proposed method of curving the surface of the solar panel.
On the other hand, curving the surface of the solar panel reduces the efficiency and productivity of the panel because some parts of the surface are not directly exposed to the sun. This in turn causes a decrease in solar efficiency, although overall, the decrease does not affect overall performance, which may still outperform that of the conventional flat solar panel design.
b. Impacts of the Research Results on the Economy, Environment, and Society
Solar power plants, compared to other energy sources, are not harmful to the air, water, or greenhouse gas emissions. Solar power plants can contribute to society and the environment by replacing harmful, non-renewable energy sources. Furthermore, economically, it reduces the cost of being dependent on non-renewable energy sources that are expensive, such as oil, coal, and the nation’s power grid, since solar energy is abundantly available at zero cost except for purchasing equipment.
c. Challenges and Future Research Extensions
The immediate challenge of this proposed method is that a curved solar surface means that the angle at which solar radiation hits the solar plate surface is not uniform. Therefore, based on the work of Mamun et al. (2022) [
23], the overall solar panel efficiency decreases when tilted at an angle to the source radiation, i.e., the sun; it decreases by approximately 0.76% for every 5° increase in the angle of the solar tilted for an outdoor solar panel. This means that some parts of the curved solar surface may experience efficiency issues due to the lower angle
, which subsequently decreases its performance. Overall, solar panel with curved surfaces having larger angles
and smaller angles
will have greater efficiency than those with flat surfaces.
The curvature angle should be small, or else the solar panel efficiency will decrease to less than that of a flat solar panel. And this type of solar needs to be mounted on a tracker to keep it upright, following the sun, to maintain efficiency. Furthermore maximum beyond which the solar panel efficiency Is equal to or less than that of flat solar panel need to be determine in future research practically. In addition, the solar panel needs to be mounted on a tracker to maximise efficiency under maximum curvation.
5. Conclusion
A solar panel with a curved surface can have a remarkable increase in surface area relative to its original flat surface area, depending on the chosen curvature method, as demonstrated in Tables 1, 2 & 3. This increases its surface area for maximising sunlight energy absorption, resulting in an increase in overall solar panel productivity.
Samples of solar cells with standard measurements of 6 by 6 inches set in zigzag patterns with varying inclination angles of 10°, 15°, 20°, 25°, 30°, and 35° were analysed using a system advisor model. The performance measurements of the maximum power pump and annual AC energy for 1 year achieved overall productivity increases of 1.4%, 4.2%, 6.8%, 10.8%, 14.9%, and 21.6%, respectively. However, by applying the concept of solar panel efficiency degradation due to tilting solar panels by Mamun et al. (2022) [
23], for each 5° increase in tilt angle beyond the ideal of 10°, the efficiency decreases by approximately 0.76%. In conclusion, the overall efficiency is greater than that of standard flat solar panels provided the tilt angle is within a reasonable range.
