
Submitted:
20 May 2024
Posted:
21 May 2024
You are already at the latest version
Abstract
As per the portfolio theory proposed by Markowitz (1952), diversification has the potential to mitigate portfolio risk. Further benefits can come from diversifying internationally since poor correlations among international markets can cause risks that are systematic in one market to become unsystematic in terms of the global economy. SEBI granted approval for Indian Mutual Funds to invest in ADR/GDR released by Indian Companies in 1999. Subsequently, SEBI has eased the rules for investment and several times it has now allowed Indian mutual funds to invest in foreign equity subject to certain limits. While SEBI had approved Indian mutual funds to invest in ADSs of Indian companies way back in 1999, the growth in investment in foreign securities started with the outbreak of COVID-19 in 2020. The exponential growth in the value of stocks in the US, driven largely by growth in technology stocks, propelled investment by Indian Mutual Funds that increased investment by ten-fold to over INR 30,000 Crores. While several focused funds with a mandate to invest in US stocks formed the bulk of the investment, other flexi cap and blue-chip funds, which had erstwhile fully invested in Indian stocks, also joined the bandwagon. While research on other developed economies has revealed the positive impact of international diversification, the Authors current research examined the advantages of international diversification on the Indian mutual funds’ performance. Authors used methods like t-test, F-test, Anova, Levene test for homogeneity and regression to check the validity of our results. Authors found that the international diversification by Indian equity mutual funds that invest in both US and Indian equities outperform benchmarks one third of the time. More importantly, by diversifying into international equities, these mutual funds are able to lower their volatility and therefore provide better risk reward returns. This is the first major study of this kind about Indian mutual funds investment in foreign equities and would be valuable investors, mutual fund managers and the regulator. As investments by Indians and Indian equity mutual funds are expected to increase significantly in the coming years, this study is timely and relevant at the current context of Indian mutual fund industry.
Keywords:
foreign equity
; international diversification
; mutual fund
1. Introduction
Equity mutual funds are a great vehicle for individual investors to invest and reap long-term gains from sustained growth in the stock market. A professionally controlled and diversified portfolio is available to both big and small investors via mutual funds, which is why individuals choose them over other investment choices. This portfolio offers superior returns while reducing risk (Rompotis, 2008). For ordinary investors interested in the capital market but without the time, knowledge, or experience to analyze market movements, mutual funds provide tax benefits, economies of scale, security liquidity, and professional fund management at cheaper prices, in addition to the aforementioned advantages. (Mishkin and Eakins, 2012; and Ramesh and Dhume, 2014). Investing in the capital market necessitates market forecasting knowledge, competence, and experience (Mishkin and Eakins, 2012). It is unrealistic to expect every investor to be well-versed in the financial markets and be able to time the market and make stock selections. But with a mutual fund, every plan is overseen by a group of experts and skilled investment managers who possess greater market knowledge and investment expertise.
The Indian mutual fund business also grew rapidly in the last ten years, and the Assets Under Management (AUM) witnessed more than six times growth during this period, i.e., from 5.87 tn on March 31, 2012, to 37.57 tn on March 31, 2022, through more than 1,400 schemes in operation. In comparison to their contemporaries and benchmarks, each scheme promises higher returns. For individual investors, selecting and evaluating these mutual fund schemes for investing has become a challenging job. Assessment of these mutual fund schemes' performance and identification of the elements leading to their favorable or negative performance is increasingly vital for investors and portfolio managers (Zabiulla, 2014).
The expansion of investors' options for foreign investments during the last 20 years has been one of the main developments in the financial markets. Global financial deregulation and the removal of institutional investors' investment constraints are to blame for this trend. Investors find international investment options appealing due to the higher potential for reducing portfolio risk compared to domestic strategies (Dimson et al., 2002). In the case of UK markets, Fletcher et al. discovered that combining the national equity or global industry equity portfolios to a domestic mean-variance strategy resulted in much higher CER and Sharpe's (1966) performance.
SEBI granted approval for Indian Mutual Funds to invest in ADR/GDR released by Indian Companies in 1999 SEBI Circular dated September 1999 (Link to Circular). Subsequently, SEBI (“SEBI /HO/ IMD/IMD-II/DOF3/P/CIR/2021/571 June 03, 2021”) has eased the rules for investment and several times it has now allowed Indian mutual funds to invest in foreign equity as per limits specified below:
- With a maximum of US $1 billion/mutual fund and an industry limit of US $7 billion, mutual funds are permitted to make foreign investments.
- Mutual funds are allowed to invest in foreign ETFs (“Exchange-Traded Funds”) up to a total of USD 300 million/mutual fund, with a US $1 billion industry limit.
While SEBI had approved Indian mutual funds to invest in ADSs of Indian companies way back in 1999, the growth in investment in foreign securities started with the outbreak of COVID-19 in 2020. The fiscal stimulus by the US Government and the monetary stimulus by the Federal Reserve resulted in the US S&P 500 gaining by 118% between March 2020 and December 2021. The exponential growth in the value of stocks, driven largely by growth in technology stocks, propelled investment by Indian Mutual Funds that increased investment by ten-fold to over INR 30,000 Crores.
The author's current research examined the advantages of international diversification on the Indian mutual funds’ performance. The authors also examined how mutual funds dealt with the currency risk due to investment in foreign equity. This is the first study done on Indian mutual funds and will provide critical insights as the quantum of international investment is forecast to grow rapidly in the coming years.
2. Literature Review
As per the portfolio theory proposed by Markowitz (1952), diversity has the potential to mitigate portfolio risk. Diversifying between nations is even more beneficial since there are weak connections across foreign markets, which means that risk that is systematic in one market may not be systematic in terms of the global economy. Grubel (1968) and Levy and Sarnat (1968) conducted the 1st study on the advantages of international diversification (1970). They discovered that investors with internationally diverse portfolios would reap significant gains. According to an early study by Solnik (1974), US investors that diversify their holdings among US and European securities as opposed to just US domestic securities can reduce half of the entire portfolio risk. According to Grauer and Hakansson's (1987) t-test analysis, international portfolios performed better than pure US portfolios. Diversification is beneficial despite growing financial integration, according to DeSantis and Gerard's (1997) research. International diversification may be advantageous for US and UK investors, but there is still evidence of home bias, according to Wickens (1999). Fletcher and Marshall's analysis of the benefits of international portfolio diversification for United Kingdom investors from Jan. 1985 to Dec. 2000 found that Sharpe and CER ("Certainty Equivalent Return") performance improved considerably when transitioning from a domestic to a global plan comprising country or global equity portfolios, despite restrictions on short selling.
According to Chan et al. (2005), there is strong evidence that funds as a whole devote a disproportionately higher percentage of their investment portfolio to domestic companies. The findings show that there are asymmetric influences on both domestic and overseas biases (Foreign investors can undervalue or overvalue global markets, while domestic investors place too much emphasis on domestic markets) and that the only significant effects of withholding tax variables, capital controls, and economic development are on the foreign bias.
The process of obtaining international diversification is through two methods. One is investment in multinationals that have operations across the globe and is through the indirect method. Investors in the US mutual funds that invest in multinationals get exposure to international diversification as over 40% of the revenues of these multinationals come from foreign sales. Demerci et al (2022) found that this percentage is even higher in the case of FTSE wherein it is 76%.
Indian investors through mutual funds also get indirect benefits of diversification as many of our technology leaders derive major revenue from exports. In this study, we focus on the direct method wherein Indian mutual funds invest directly in foreign equities
When compared to wealthy countries, developing countries' economies are often less diverse, and emerging financial markets are still in their infancy with a limited selection of financial goods. Additionally, these markets are subject to additional regulations, such as prohibitions against short sales and over-weighting, which could skew investors' best judgments. Because of this, investments made just domestically in developing countries are generally mean-variance inefficient. Because of this, some recent studies look into the advantages of diversity for investors in developing economies. Laeven and Driessen (2007) examine the advantages of diversification from the standpoint of a local investor in 52 developed as well as developing markets. They discover that capitalizing overseas is especially beneficial for developing country investors and that the majority of these advantages come from investing outside the home country’s areas.
Harvey (1995) demonstrates that because emerging and developed markets have little correlation, investing in securities from emerging markets helps US investors lower overall portfolio risk by 6%. The presence of substantial profits from international diversification is also confirmed by more studies (Huberman and Kandel, 1987; Lessard,1974). Numerous recent research also supports the notion that these diversification profits endure in the existence of the no-short-selling restriction (Li et al., 2003; Stambaugh and Pastor, 2000).
Developing markets, in comparison to established markets, are generally characterized by higher volatility, lower liquidity, and reduced informational efficiency, alongside notable structural and institutional distinctions. Consequently, investors from developed countries may gain significant diversification advantages by spreading their investments across emerging markets. Harvey (1995) reveals that the inclusion of securities from developing markets can lead to a 6 percent decrease in the overall portfolio risk for US investors owing to the low relationship between developed and developing markets. Numerous studies, including those by Li et al. (2003), and Ravazzaolo and Phylaktis (2005), verify the diversification profits arising from exposure to developing markets. However, in opposition to this viewpoint, de Roon et al. (2001) contend that the advantages of diversification could be readily offset by the high transaction costs and restrictions on short sales that are common in developing nations. Recent data, however, indicates that the advantages of diversification are eroding over time owing to a greater degree of global financial system interconnectedness (Chiou,2009; Laeven and Driessen, 2007). Specifically, You and Daigler (2010) discover that, over their sample period, the correlations across global markets fluctuate significantly and show a positive tendency over time, which reduces the value of international diversity. Opportunities for international diversification are investigated using a variety of methodologies in the majority of recent studies, such as copula and behavioural portfolio theory techniques (Chollete et al.,2011, Jiang et al.,2013).
Exchange rate risk is a risk that investors have when they invest in foreign stock portfolios. The magnitude of the investments made in those markets determines the possible positions in currencies that may arise from investing in international stock markets without evading the exchange rate risk; these positions may not be optimal. It is commonly recognized that international asset portfolio performance can be enhanced by using currency forwards or futures to hedge the ensuing currency risk. For example, Jorion and Glen (1993) investigate the “performance of mean-variance effective G5 stock and bond portfolios when the associated currency risk is hedged by currency futures. Similarly, DeSantis (1995) provides compelling evidence of the advantages of hedging for efficient portfolios comprising stocks from eighteen different nations by utilizing the duality between volatility limitations and
mean-Variance Frontiers.
Bachetta et al. (2023) estimated a portfolio expression originated from a traditional mean-variance portfolio paradigm expanded with portfolio frictions using data on global equity portfolio distributions by” United States mutual funds. The research revealed that whereas mutual fund portfolios react considerably to changes in projected returns, portfolio frictions cause the portfolio's response to fluctuate more slowly.
While there are advantages to international diversification, investment in foreign equities exposes mutual funds to foreign currency risk. Research has tested ways to lower foreign exchange risk in a global portfolio through hedging to study the risk. Forward contracts can yield substantial returns when used as a hedge against foreign exchange risk, as demonstrated by Jorion (1985) and Eun and Reusnick (1988). But their primary area of attention was the stock market. A different group of experts has also looked into the bond markets. In contrast to a portfolio of just domestic bonds, Thomas (1989), Levy and Hauser (1991a, b), Annaert (1995), and numerous other researchers discovered that a United States investor might have obtained a greater mean rate of return. The effect of interest rates on short- and long-term bond prices was another area of emphasis. Bonds with longer maturities can lower portfolio risk more successfully. Glen and Jorion (1993) examined the bond portfolios and “performance of mean-variance efficient stock” obtained from the G5 for the purpose of using forward contracts to hedge currency risk.
Currency speculation can yield substantial and alluring profits, as evidenced by research on international asset pricing. Asness et al. (2013), Menkhoff et al. (2012)b, Lustig and Verdelhan (2007), and other studies have demonstrated that FX value, FX momentum, and carry trade are three multicurrency investment plans that generate high Sharpe ratios. These results suggest that currency markets may provide investors with advantages beyond hedging. Interestingly, among the most well-liked FX investment approaches among seasoned currency fund managers are these multicurrency techniques (Pojarliev and Levich, 2008).
The basis of contemporary portfolio theory, the CAPM (“Capital Asset Pricing Model”), states that holding foreign assets should be inversely connected with the size of the domestic market in the international portfolio. Given that developing nations account for a very modest portion of global market capitalization, local investors' best allocation in these nations should predominantly favour international assets (Afanador et al 2021). According to Chan et al. (2005), it is clear that funds as a whole devote a disproportionately higher percentage of their investment portfolio to domestic companies.
3. Data and Methodology
The authors extracted data from the NAV India database of investment in foreign equity by Indian mutual funds for an interval of 30/09/2019 to 30/09/2023. We chose this period to capture investment in foreign equity before the onset of COVID. While COVID-19 started in 2020, the uptick in investment started in early 2020 but accelerated sharply from 2021. The quantum of investment in overseas equity grew 12 times during the period under study.
There is a huge amount of scholarly research on how to assess mutual fund performance. Some of them have undergone investigation. Sapar and Madava (2009) used risk-return analysis, the Treynor ratio, the Sharpe ratio, Jensen & Fama, and other methods to determine the Indian mutual fund sector performance during a bear market. From September 1998 to April 2002, AMFI provided statistics on monthly closing NAV. For the study, a sample of 58 open-ended designs was selected. The study's conclusions showed that, in terms of both total and systematic risk, the majority of the sample schemes were able to provide better returns than predicted returns. Kumar and Devi (2010) measured the investment performance of equity mutual funds within India during 2003 - 2007 by using mean rate of return, Standard Deviation (SD), and risk-return analysis. Furthermore, risk-adjusted measures of the performance assessment like the Treynor ratio, Sharpe ratio, and Jensen measure were also used. A total of 102 schemes were taken as sample schemes - 56 equity diversified funds, 18 equity tax saving funds, 21 equity index funds, and seven equity technology funds. The results of the study's comparative research of the investment mutual funds’ performance from the public and private sectors in India showed that there was no discernible difference between their performance. Using the rate of return, SD, beta, Treynor and Sharpe ratios, Dhanda, Batra, and Anjum (2012) evaluated the investment performance of a few open-ended mutual fund plans in terms of risk-adjusted returns and risk-return from April 2009 to March 2011. The results revealed that only 3 schemes, namely HDFC Capital Builder Fund, HDFC Top 200, and UTI Opportunities Fund had outperformed the market.
Reddy, Sivakumar, and Zaheeruddin (2013) examined the performance of 3 private-sector mutual funds from July 1, 2009, to April 2, 2012. Besides risk-return analysis, risk-adjusted measures of performance assessment like Treynor and Sharpe ratios and Jensen Alpha have been also applied to evaluate the performance. The findings of the present research showed that ICICI generated the highest returns; whereas, Birla Sun Life was the riskiest one. Chandani and Pal (2014) tried to determine the performance of the top ten equity mutual fund plans for an interval of 5 years, that is, from 2007 to 2012. With the support of statistical measures like Sharpe ratio, expense ratio, beta, R-square, and SD, the analysis revealed that among all the sample schemes, Quantum Long Term Equity and HDFC Mid Cap Opportunities emerged as top performers during the period of the analysis. Goyal (2015) assessed the efficiency of the top 10 mutual funds and contrasted it with that of the CNX Nifty and S&P benchmark indices. The research discovered that generally, all of the schemes worked well since they produced greater and better returns than the market index utilizing the Jensen measure, Treynor ratio, and Sharpe ratio. Franklin India Opportunities Fund was determined to be the top performer among all the sample schemes since it produced greater average returns while also having reduced risk. Tomer and Khan (2015) analyzed the mutual funds’ performance in India with risk-return measures, Treynor ratio, Jensen - -differential measure, Sharpe ratio, and Sharpe-differential measure from January 1, 2005, to December 30, 2010. The results showed mixed performance of sample schemes. Moreover, the funds related to the private sector performed better as compared to public sector funds in all aspects.
Measures Used for Performance Evaluation
Return Measures: Investments are done to earn a reward. Returns may be defined as the reward earned from an investment. Monthly returns of the selected mutual fund schemes were calculated with month-end NAVs by utilizing the formula mentioned below:
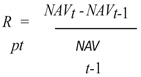 where, Rpt= fund returns, NAVt= NAV in current month, NAVt-1= NAV in previous month. Likewise, the benchmark index return was computed as :
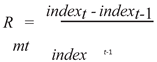 where, Rmt represents the market return, and Indext and Indext-1 present the market index in the current as well as in the previous month.
Risk Measures: Investments are risky. Risk may be defined as the potential for variability in returns. Risks are neither good nor bad. Risk in an investment usually refers to the probability that the actual returns may be lesser as compared to projected returns. The higher the risk in an investment, the higher the returns generated by it. There are 2 forms of risk - total risk, determined by SD(σ), and systematic risk, determined by beta coefficient (β). The risk involved with the chosen mutual fund schemes has been determined based on month-end NAV.
The research has used the following risk measures:
Standard Deviation (σ): It is a measure of “return volatility” since it compares the actual returns of a mutual fund to its predicted returns. Higher SD indicates higher risks involved in the investment.
Beta (β): Beta (β) measures the volatility in returns of an investment in terms of systematic risk and is calculated by relating the portfolio returns with the market returns.
Risk-Free Rate: Its return variability is zero. It has no association with risky assets. It is the base for performance evaluation of risky investments. In the present work, the average monthly production of 91 days of treasury bills was considered a risk-free rate, particularly because it is guilt-edged and of course, because of its easy accessibility.
Sharpe Ratio: Sharpe (1966) constructed an index to measure portfolio performance. It is recognized as a “reward-to-variability” ratio. It is the excess return ratio average of fund portfolios and the SD of the returns in a given period. It depends on the CML (“Capital Market Line”) and calculates the return in relation to the portfolio's overall risk. It estimates the efficacy of fund managers in the diversification of total risk and is a beneficial tool to assess the excess return/unit of overall risk. It is believed that the higher the Sharpe ratio, the better it is.
Treynor Ratio: Treynor (1965) gave another measure of performance evaluation, popularly known as the Treynor ratio. It is quite the same as the Sharpe ratio as it also determines excess returns generated by an investment over the risk-free rate. Treynor ratio evaluates excess returns per unit of systematic risk, unlike the Sharpe ratio which uses total risk. It is also recognized as the ratio of reward to volatility. Similar to the Sharpe ratio condition, the larger the “Treynor ratio”, the better it is.
Jensen Measure: Jensen (1968) developed another methodology to measure the average return of a fund portfolio (above or below) as predicted by SML (Security Market Line). It is commonly referred to as Jensen’s alpha. It is beneficial as it assesses the ability of fund managers to generate higher returns for investors. A positive as well as significant Jensen alpha value is an indication that the fund has generated higher returns than CAPM returns.
Authors tested the following hypothesis:
- 1)
- There is significant difference in performance, using various measures for return and risk, between Indian mutual funds that invest in both Indian and foreign equities and those that invest only in foreign equities?
- 2)
- Mutual funds that invest in foreign equities perform better, using various measures for return and performance than the major benchmarks? There are benefits to international diversification due to lowering of risk
- 3)
- Mutual funds that invest in foreign equities hedge their exchange risk
4. Analysis and Results
The authors extracted data from the NAV India database of investment in foreign equity by Indian mutual funds for the interval of 30/09/2019 to 30/09/2023. We chose this period to capture investment in foreign equity before the onset of COVID. While COVID-19 started in 2020, the uptick in investment started in early 2020 but accelerated sharply from 2021and grew 12 times during the period under study as shown in Figure 1.
To evaluate the mutual funds’ performance that predominantly invested in Indian equities but also invested in foreign equities and mutual funds that fully invested in foreign equities, the Authors calculated the one-year return, SD, Treynor ratio, Beta, Sharpe ratio, and Henson’s alpha. The Table 1 below gives the figures for 3 years.
The authors did a T-test to check if the mean returns were similar and the hypothesis was rejected in returns, SD, and Sharpe ratio. The results were mixed in the case of Beta, Treynor ratio. In the case of Jenson’s alpha, the null hypothesis could not be rejected (refer to Table 2 below)
The authors compared the returns of the Mutual funds that invest predominantly in Indian equities and also in foreign equities with key benchmark returns to check if investing in foreign equities produces superior returns (refer to Table 3)
There was a significant difference in returns only during the period Oct.2020 to Sep. 2021. We did similar tests with other major indices and the results were the same. To do robustness check of our results, we calculated the monthly returns of the equity mutual funds with foreign equity for a period of 3 years. We also calculated the foreign holding equity in percentage terms of these funds. We ran a regression with the average returns of mutual funds as the dependent variable and the average percentage of foreign equity and S & P 500 BSE as the dependent variable. The results are given below in Table 4:
As the percentage of foreign equity holdings are between 5-25% and are quite large as compared to the other variables, we did a test using dummy variables wherein the value of the dummy was 0 if the percentage of holding was less than 10% or 1 others. The results are given below in Table 5 :
It is clear that investment in foreign equity is not sufficient for the fund to beat equity benchmarks. We posit one reason for this anomaly. Both the Indian and US markets have risen significantly during the period under study and as a result mutual funds with foreign equity have not benefitted. We feel that difference in returns will be starker when the returns of the two major benchmarks wherein the mutual funds have invested differ significantly.
One of the reasons for international diversification is to decrease portfolio risk. We compared the standard deviations of mutual funds that invest in both foreign and Indian equities with key benchmarks and the results are given in Table 6. While two of the results are for the year 2019-20 and 2021-22 the third one is for the entire period between 2020-23.
The results revealed that investment in foreign equities does reduce portfolio risk and therefore funds with exposure to international equities while sometimes offering higher returns, definitely reduce the risk as compared to key benchmarks. We also performed Levine’s test to check for homogeneity of means and one-way ANOVA for the year 2020-21 and found that the difference in variance is significant. Results given below in Table 7
Hedging of foreign currency risk
The authors examined if the mutual funds that invested in overseas funds hedged their FX exposure and found that the majority of the funds do not hedge the risk. Parag Parikh Multicap is the only fund that has invested in FX derivatives to partially hedge their exposure. While the depreciation of the rupee in the past has benefitted the funds, any significant appreciation of the Indian Rupee in the future will dent the returns from overseas investment.
5. Conclusion and Limitation
International diversification by Indian mutual funds got a boost during COVID with investments in foreign stocks increasing more than ten times. The restriction placed by SEBI and the RBI on total investment limited the quantum of investment. However, with the sustained growth in the Indian economy and influx of FII and FDI investment into the Country, the current limits will be progressively increased in the coming. Therefore, the current study, which is the first one on investment by Indian mutual funds investment foreign equity provides insights to investors, mutuals and the regulator. Our analysis reveals that mutual funds that invest in foreign equity achieve significantly higher returns from foreign equity at least during one-third of the investment period. More importantly, the investment in foreign equity does reduce the volatility and therefore we can conclude that there are benefits to investors who invest in mutual funds that diversify into overseas equity. Our study revealed that majority of mutual funds do not hedge their foreign exchange exposure from investment in overseas marks. While this has benefitted to date as majority of investment is in US Dollars which has appreciated against the Indian Rupee. The main limitation of this study is that the period that the authors have studied is for three years. In the coming years, a study with longer time frame will be more robust and solidify our findings.
References
- Afanador, J. P., Davis, R., & Pedraza, A. (2021). Estimating the Gains from International Diversification.
- Annaert, A. 1995. Estimation Risk and International Bond Portfolio Selection. Journal of Portfolio Management, 5:47-71.
- Asness, C.S., Moskowitz, T.J., and Pedersen, L.H. (2013) Value and momentum everywhere, Journal of Finance, 68: 929–985. [CrossRef]
- Bacchetta, P., Tieche, S., & Van Wincoop, E. (2023). International portfolio choice with frictions: Evidence from mutual funds. The Review of Financial Studies, 36(10), 4233-4270. [CrossRef]
- Chan, K, Covrig, V & Ng, Lillian. 2005. What Determines the Domestic Bias and Foreign Bias? Evidence from Mutual Fund Equity Allocations Worldwide. Journal of Finance, 60: 1495-1534. [CrossRef]
- Chiou, W.P. (2009), “Benefits of international diversification with investment constraints: an. [CrossRef]
- over-time perspective”, Journal of Multinational Financial Management, Vol. 19 No. 2,. [CrossRef]
- pp. 93-110.
- Chollete, L., de la Pena, V. and Lu, C.C. (2011), “International diversification: a copula approach”, Journal of Banking & Finance, Vol. 35 No. 2, pp. 403-417. [CrossRef]
- Devi, V.R., & Kumar, N. L. (2010). Performance evaluation of equity mutual funds. The Journal of Indian M a n a g e m e n t & S t r a t e g y 8 M, 1 5 ( 2 ), 2 2 - 3 5.
- Demirci, I., Ferreira, M. A., Matos, P., & Sialm, C. (2022). How global is your mutual fund? International diversification from multinationals. The Review of Financial Studies, 35(7), 3337-3372. [CrossRef]
- de Roon, F.A., Nijman, T.E. and Werker, B.J.M. (2001), “Testing for mean-variance spanning with short sales constraints and transaction costs: the case of emerging markets”, Journal of. [CrossRef]
- Finance, Vol. 56 No. 2, pp. 721-742. [CrossRef]
- DeSantis, G. (1995). Volatility bounds for stochastic discount factors: Tests and implications from international financial markets, Working Paper, University of Southern California.
- DeSantis, G., and Gerrard, B. (1997). International Asset Pricing and Portfolio Diversification with time-varying risk. Journal of Finance, 52:1881-1912. [CrossRef]
- Dimson, E., Marsh, P., Staunton, M. (2002). Triumph of the Optimists: 101 Years of Global Investment Return. Princeton University Press.
- Driessen, J. and Laeven,L. (2007), “International portfolio diversification benefits: cross-country evidence from a local perspective”, Journal of Banking & Finance, Vol. 31 No. 6, pp.1693-1712. [CrossRef]
- Eun C., and, Resnick B . 1988. Exchange Rate Uncertainty, Forward Contracts, and International Portfolio Selection. Journal of Finance. XLIII:197-215. [CrossRef]
- Errunza, V., Hogan, K. and Hung, M. W. (1999), “Can the gains from international diversification be achieved without trading abroad?”, Journal of Finance, Vol.54 No.6, pp.2075-2107. [CrossRef]
- Flavin, T. J., & Wickens, M. R. (2006). Optimal International Asset Allocation With Time-Varying Risk. Scottish Journal of Political Economy, 53(5), 543-564. [CrossRef]
- Fletcher, J., & Marshall, A. (2005). An empirical examination of the benefits of international diversification. Journal of International Financial Markets, Institutions and Money, 15(5), 455-468. [CrossRef]
- Glen, J. and Jorion, Ph.1993.Currency Hedging for International Portfolios. Journal of Finance, 48(5):1865-1886. [CrossRef]
- Grauer, R.R., and Hakansson, N.H. 1987.Gains from international diversification: 1968-1985 Returns on Portfolios of Stocks and Bonds. Journal of Finance, 42(3):721741. [CrossRef]
- Goyal, M.M. (2015). Performance evaluation of top 10 mutual funds in India. Indian Journal of Commerce & Management Studies, 6 (1), 51 - 55.
- Grubel, H.(1968). Internationally Diversified portfolios: Welfare gains and Capital Flows. American Economic Review, 58:1299-1314.
- Harvey, C.R. (1995), “Predictable risk and returns in emerging markets”, Review of Financial Studies, Vol.8 No.3, pp. 773-816. [CrossRef]
- Hauser S., and Levy A. (1991 b). Optimal Forward coverage of international fixed-income portfolios. Journal of Portfolio Management, 17:54-59.
- Huberman, G. and Kandel, S. (1987), “Mean-variance spanning”, Journal of Finance, Vol.42 No.4, pp.873-888. [CrossRef]
- Li, K., Sarkar, A. and Wang, Z. (2003), “Diversification benefits of emerging markets subject to portfolio constraints”, Journal of Empirical Finance, Vol. 10 Nos 1/2, pp. 57-80. [CrossRef]
- Jiang, C., Ma, Y. and An, Y. (2013), “International portfolio selection with exchange rate risk: a behavioural portfolio theory approach”, Journal of Banking & Finance, Vol. 37 No. 2, pp. 648-659. [CrossRef]
- Jorion, Ph. (1985). International Portfolio Diversification with Estimation Risk. Journal of Business, 58(3):259-278.
- Lessard, D. (1974), “World, national, and industry factors in equity returns”, Journal of Finance, Vol.29 No.2, pp.379-391. [CrossRef]
- Li, K., Sarkar, A. and Wang, Z. (2003), “Diversification benefits of emerging markets subject to portfolio constraints”, Journal of Empirical Finance, Vol. 10 Nos 1/2, pp. 57-80. [CrossRef]
- Markowitz, H . (1952). Portfolio Selection. Journal of Finance, 7:77-91.
- Levy, H., and Sarnat, M. (1970). International Diversification in Investment Portfolios. American Economic Review, 60:668-675.
- Lustig, H., Roussanov, N., and Verdelhan, A. (2011) Common risk factors in currency markets, Review of Financial Studies, 24, 3731–3777. [CrossRef]
- Menkhoff, L., Sarno, L., Schmeling, M. and Schrimpf, A. (2012a) Carry trades and global foreign exchange volatility, Journal of Finance, 67, 681–718. [CrossRef]
- Mishkin F S and Eakins S G (2012), Financial Markets & Institutions, 7th Edition, Pearson Publications, Delhi.
- Pal, S., & Chandani, A. (2014). A critical analysis of selected mutual funds in India. Procedia Economics and Finance, 11, 481 - 494. [CrossRef]
- Pastor, L. and Stambaugh, R. (2000), “Comparing asset pricing models: an investment. [CrossRef]
- perspective”, Journal of Financial Economics, Vol. 56 No. 3, pp. 335-381. [CrossRef]
- Pojarliev, M and Levich ,R. M. (2008) Do professional currency managers beat the benchmark? Financial Analysts Journal, 64, 18–32. [CrossRef]
- Phylaktis, K. and Ravazzaolo, F. (2005), “Stock market linkages in emerging markets :. [CrossRef]
- implications for international portfolio diversification”, Journal of International Financial. [CrossRef]
- Markets, Institutions, and Money, Vol. 15 No. 2, pp. 91-106. [CrossRef]
- Ramesh B and Dhume P S (2015), “Performance Analysis of Initial Public Offering in Indian Context”, Splint International Journal of Professionals, Vol. 2, No. 9, pp. 47-64.
- Rompotis G G (2008), “A Cost-Performance Analysis of Greek Mutual Funds”, European Journal of Economics, Finance, and Administrative Sciences, Vol. 12, pp. 80-103.
- Sapar, N., & Madava, R. (2009). Performance evaluation of Indian mutual funds.
- Sharpe, W. F., “Mutual Fund Performance.” Journal of Business 39(1), 119–138, (1966).Solnik, B.H. (1974). Why not diversify internationally rather than domestically? CFA Institute Vol. 30. No. 4:48-54.
- Thomas, L., (1989). The Performance of Currency Hedged Foreign Bonds, Financial Analysts Journal, May/June. 25-31. [CrossRef]
- Tomer, J., & Khan, N. (2015). Performance evaluation of mutual funds in India. Finance India, XXIX(3), 855 - 878.
- You, L. and Daigler, R.T. (2010), “Is international diversification really beneficial?”, Journal of Banking & Finance, Vol. 34 No. 1, pp. 163-173. [CrossRef]
- Zaheeruddin, M., Sivakumar, P., & Reddy, K.S. (2013). Performance evaluation of mutual funds in India with special reference to selected financial intermediaries. IOSR Journal of Business and Management, 7 (2), 33- 40.
- Zabiulla (2014), “Portfolio Strategies of Fund Managers in the Indian Capital Market”, IIMB Management Review, Vol. 26, No. 1, pp. 28-58. [CrossRef]
Figure 1.
Average investment in the top 10 stocks during the period indicates the preference for top technology names. The top 10 stocks account for around 55% of the polio of investment in foreign equities. The data also revealed the popularity of the Indian IT stock Cognizant, not listed in India as shown in Figure 2 below.
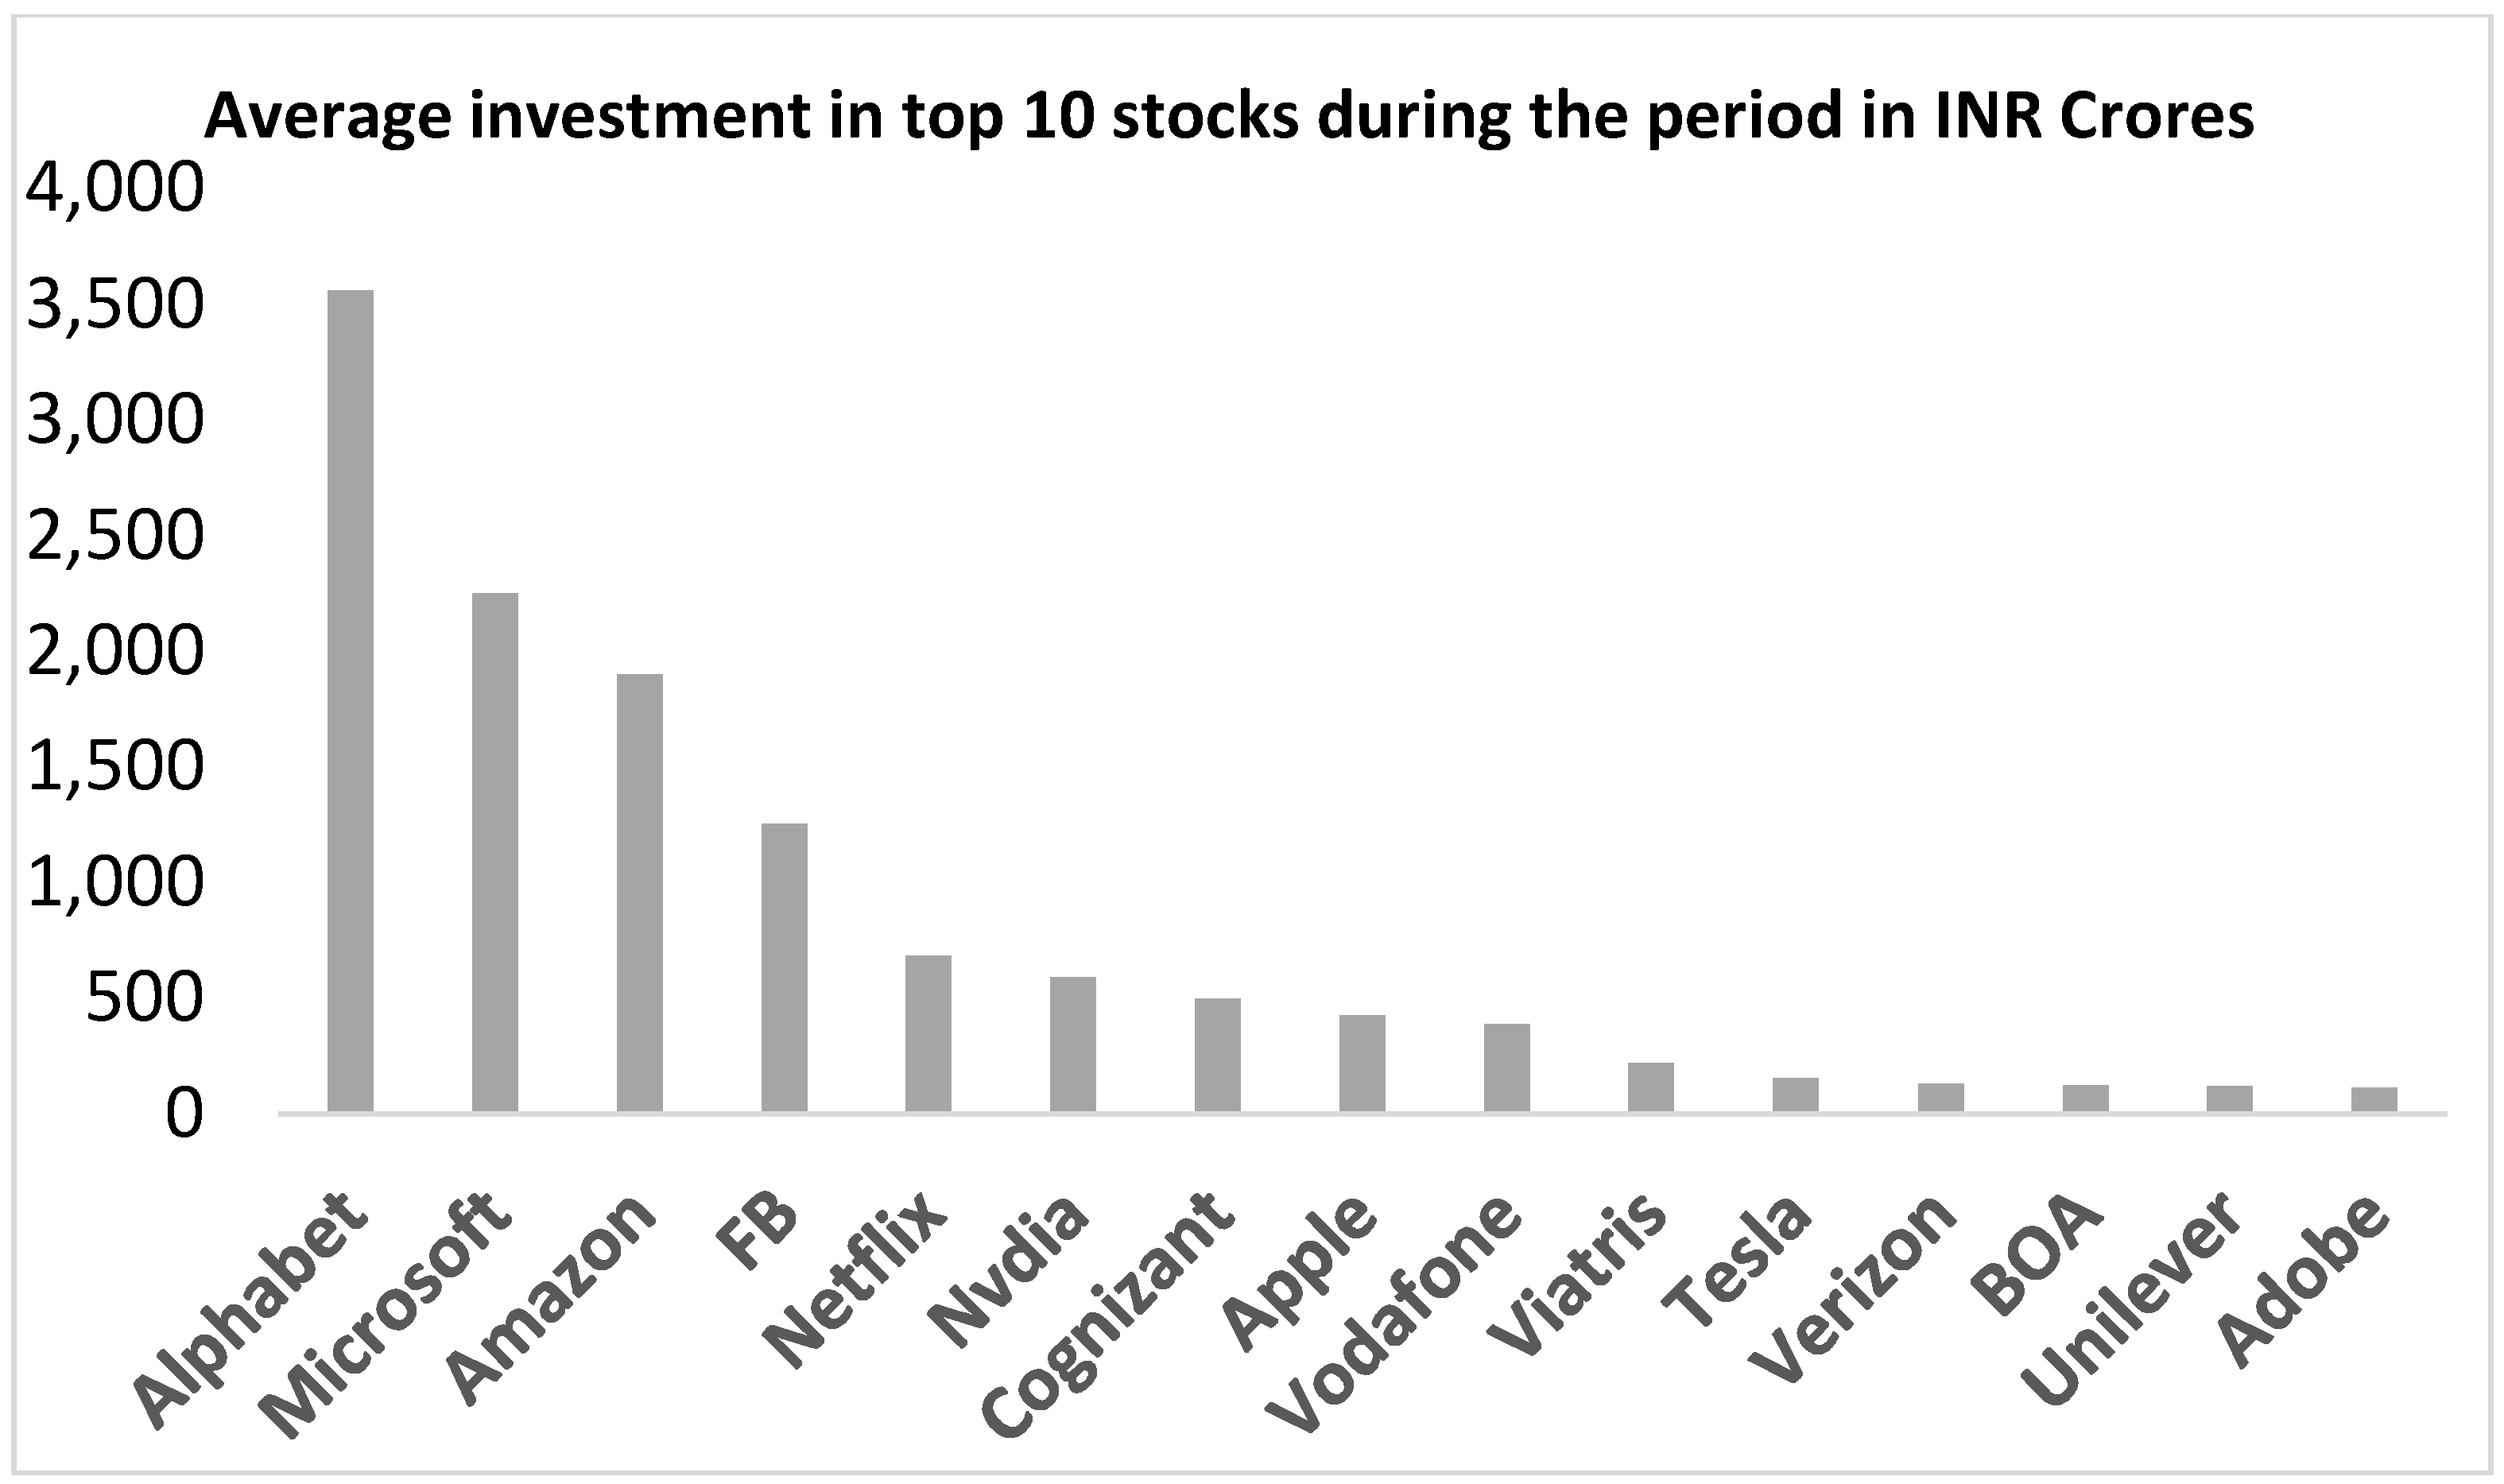

Table 1.
xxxxx.
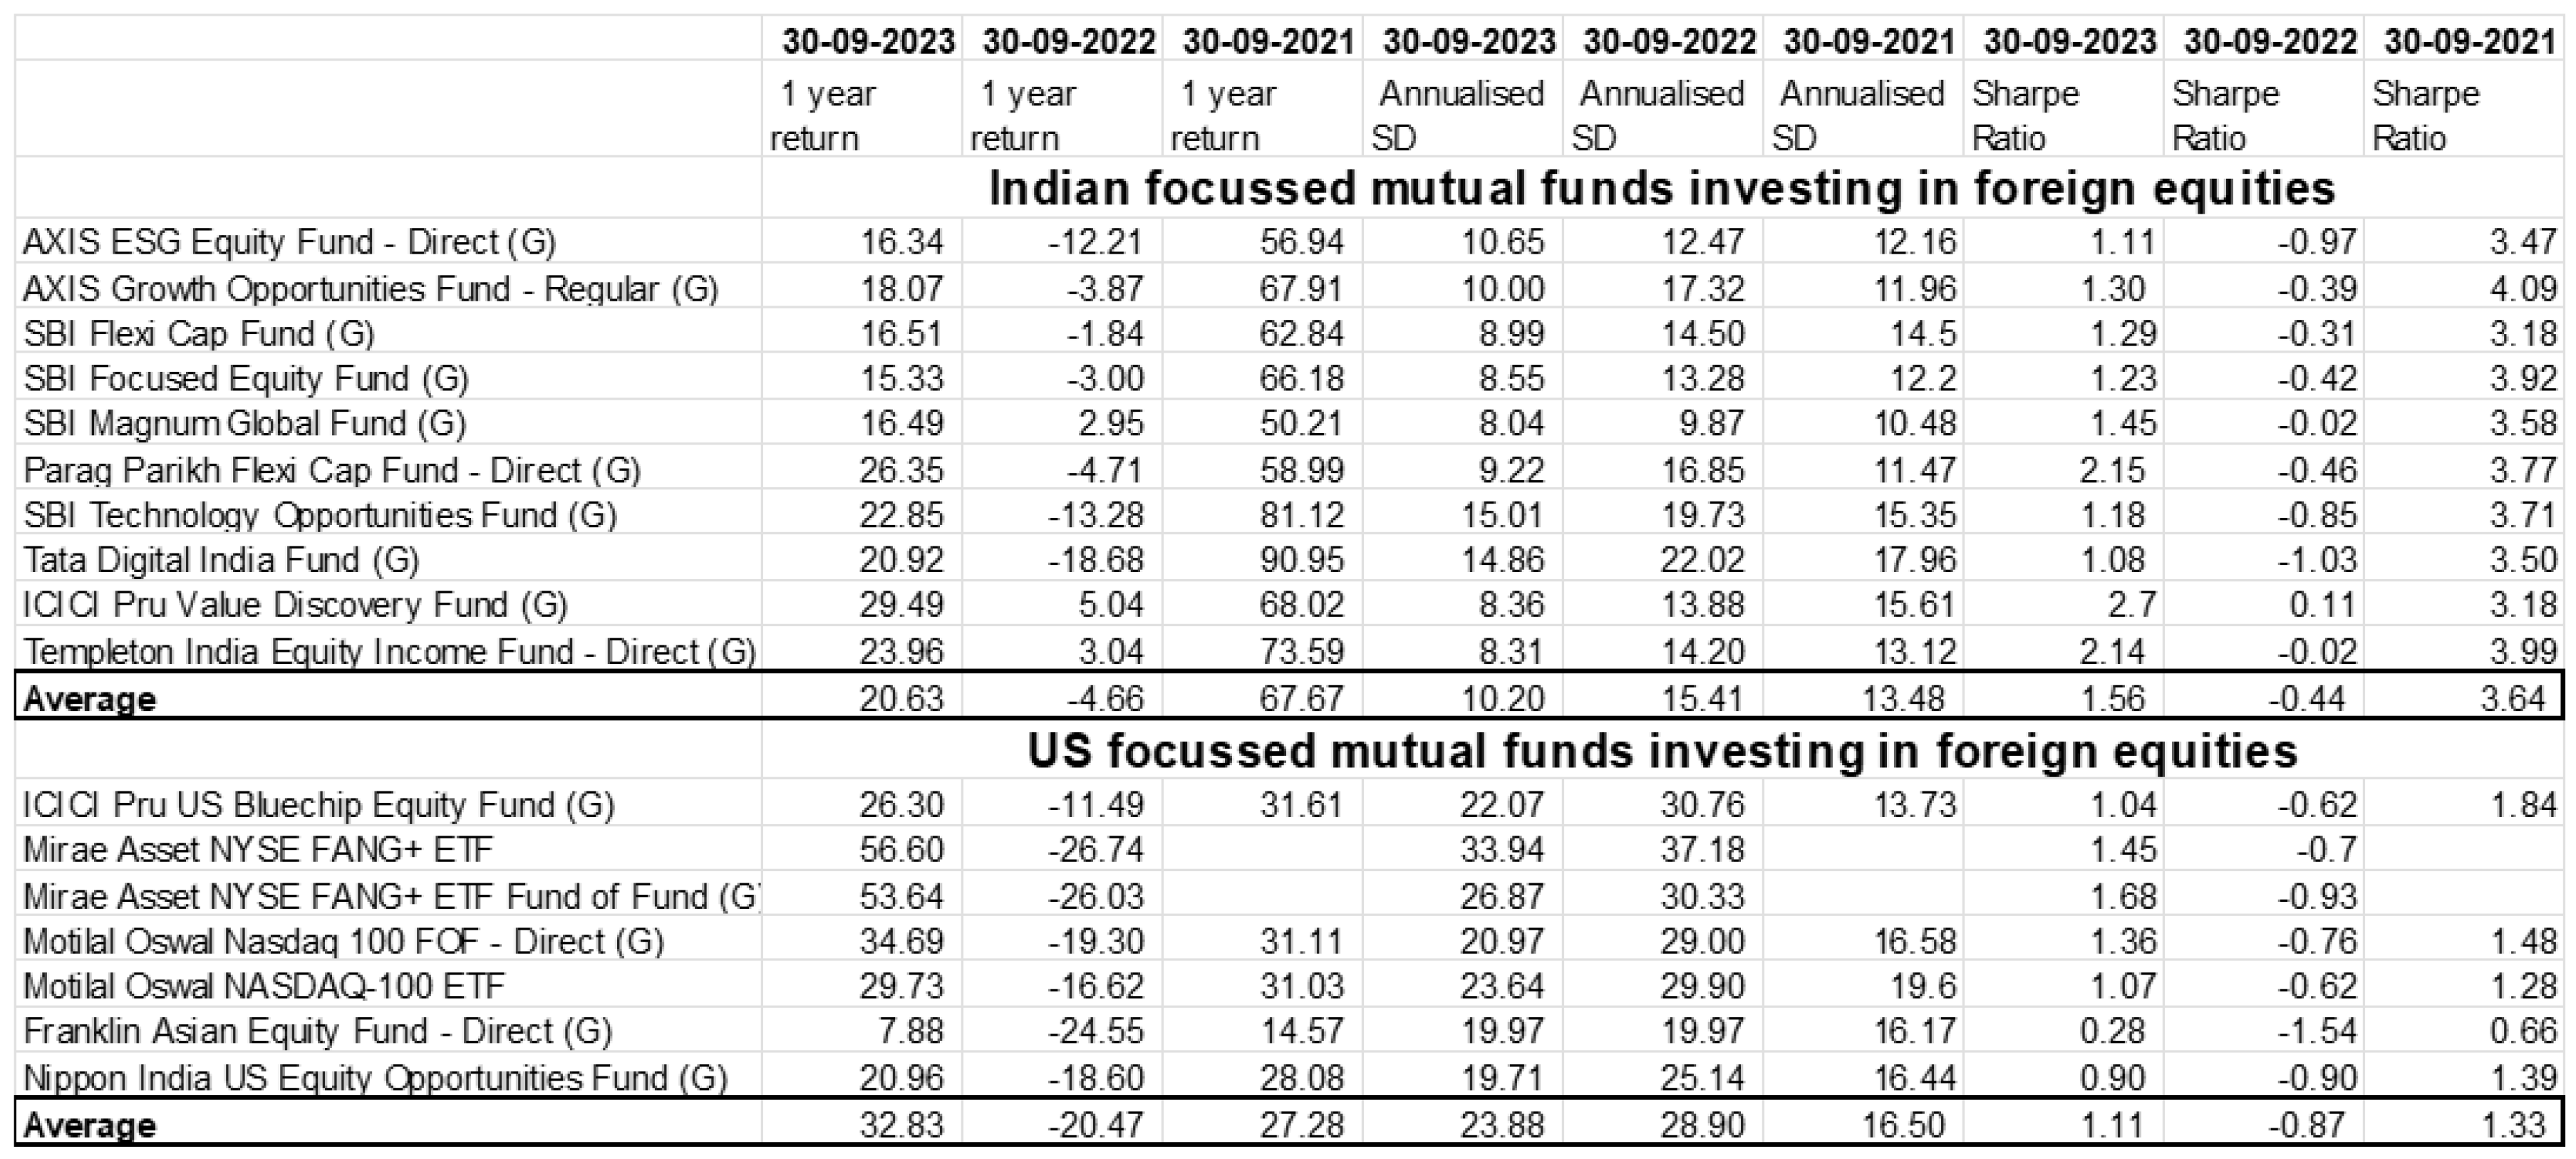
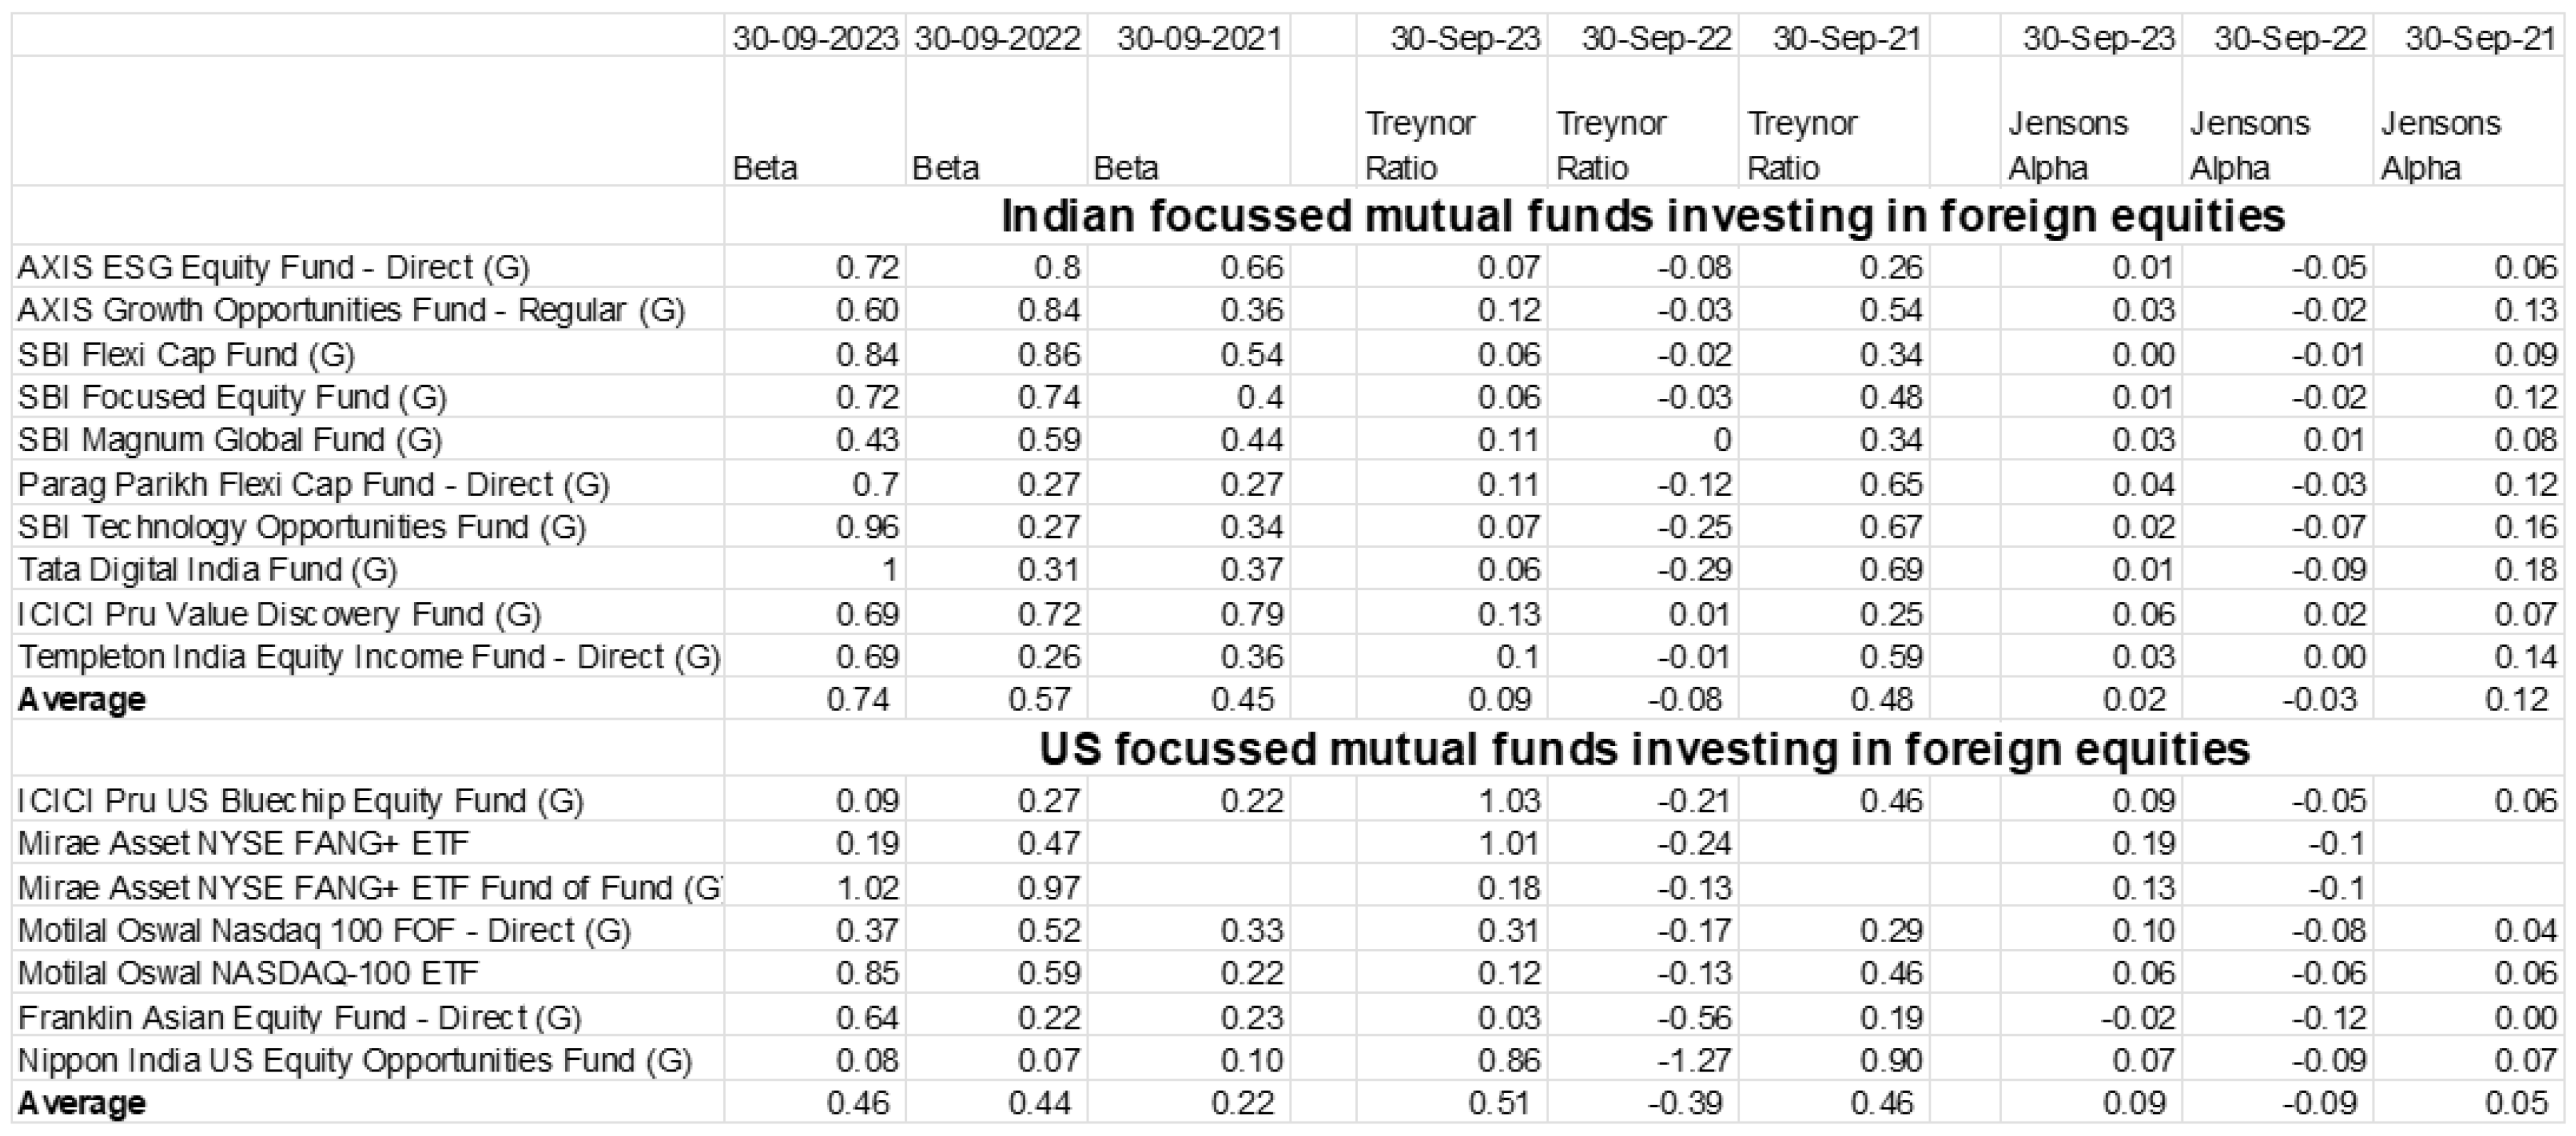
Table 2.
xxxx.
| T- Statistics | ||||
| 30-09-2023 | 1 Year return | 0.04 | Beta | 0.0570 |
| 30-09-2022 | 0.00 | Beta | 0.2001 | |
| 30-09-2021 | 0.00 | Beta | 0.0014 | |
| 30-09-2023 | SD | 0.00 | Treynor Ratio | 0.0235 |
| 30-09-2022 | SD | 0.00 | Treynor Ratio | 0.0512 |
| 30-09-2021 | SD | 0.02 | Treynor Ratio | 0.4456 |
| 30-09-2023 | Sharpe ratio | 0.04 | Jensons Alpha | 0.0192 |
| 30-09-2022 | 0.01 | Jensons Alpha | 0.0005 | |
| 30-09-2021 | 0.00 | Jensons Alpha | 0.0012 | |
Table 3.
xxxx.
| Average Indian + foreign equity mutual funds |
S & P BSE 500 TRI | T. Test | |
| Oct. 22 to Sep. 23 | 0.07 | 0.18 | 0.07 |
| Oct. 21 to Sep. 22 | -0.01 | 0.00 | 0.84 |
| Oct.20 to Sep. 21 | 0.21 | 0.06 | 0.01 |
Table 4.
xxxx.
| Regression Statistics | |||||
| Multiple R | 0.996910329 | ||||
| R Square | 0.993830204 | ||||
| Adjusted R Square | 0.993456277 | ||||
| Standard Error | 0.000495385 | ||||
| Observations | 36 | ||||
| ANOVA | |||||
| df | SS | MS | F | Significance F | |
| Regression | 2 | 0.001304491 | 0.000652246 | 2657.81858 | 0.00000000 |
| Residual | 33 | 8.09841E-06 | 2.45406E-07 | ||
| Total | 35 | 0.00131259 | |||
| Coefficients | Standard Error | t Stat | P-value | ||
| Intercept | -0.000297739 | 0.001046262 | -0.284573775 | 0.77774892 | |
| Average foreign equity | 0.000020 | 6.47466E-05 | 0.301902956 | 0.76462056 | |
| S & P 500 BSE | 0.994846413 | 0.013650568 | 72.87948834 | 0.0000000 | |
Table 5.
xxxx.
| Regression Statistics | |||||
| Multiple R | 0.99698654 | ||||
| R Square | 0.99398216 | ||||
| Adjusted R Square | 0.993617443 | ||||
| Standard Error | 0.000489247 | ||||
| Observations | 36 | ||||
| ANOVA | |||||
| df | SS | MS | F | Significance F | |
| Regression | 2 | 0.001304691 | 0.000652345 | 2725.34768 | 0.00000000 |
| Residual | 33 | 7.89895E-06 | 2.39362E-07 | ||
| Total | 35 | 0.00131259 | |||
| Coefficients | Standard Error | t Stat | P-value | ||
| Intercept | -0.000138756 | 0.000186825 | -0.742705271 | 0.46291464 | |
| S & P 500 BSE | 0.993157964 | 0.013570897 | 73.18292803 | 0.000000 | |
| Dummy Variable | 0.000199759 | 0.000207506 | 0.962667336 | 0.342716 | |
Table 6.
xxxx.
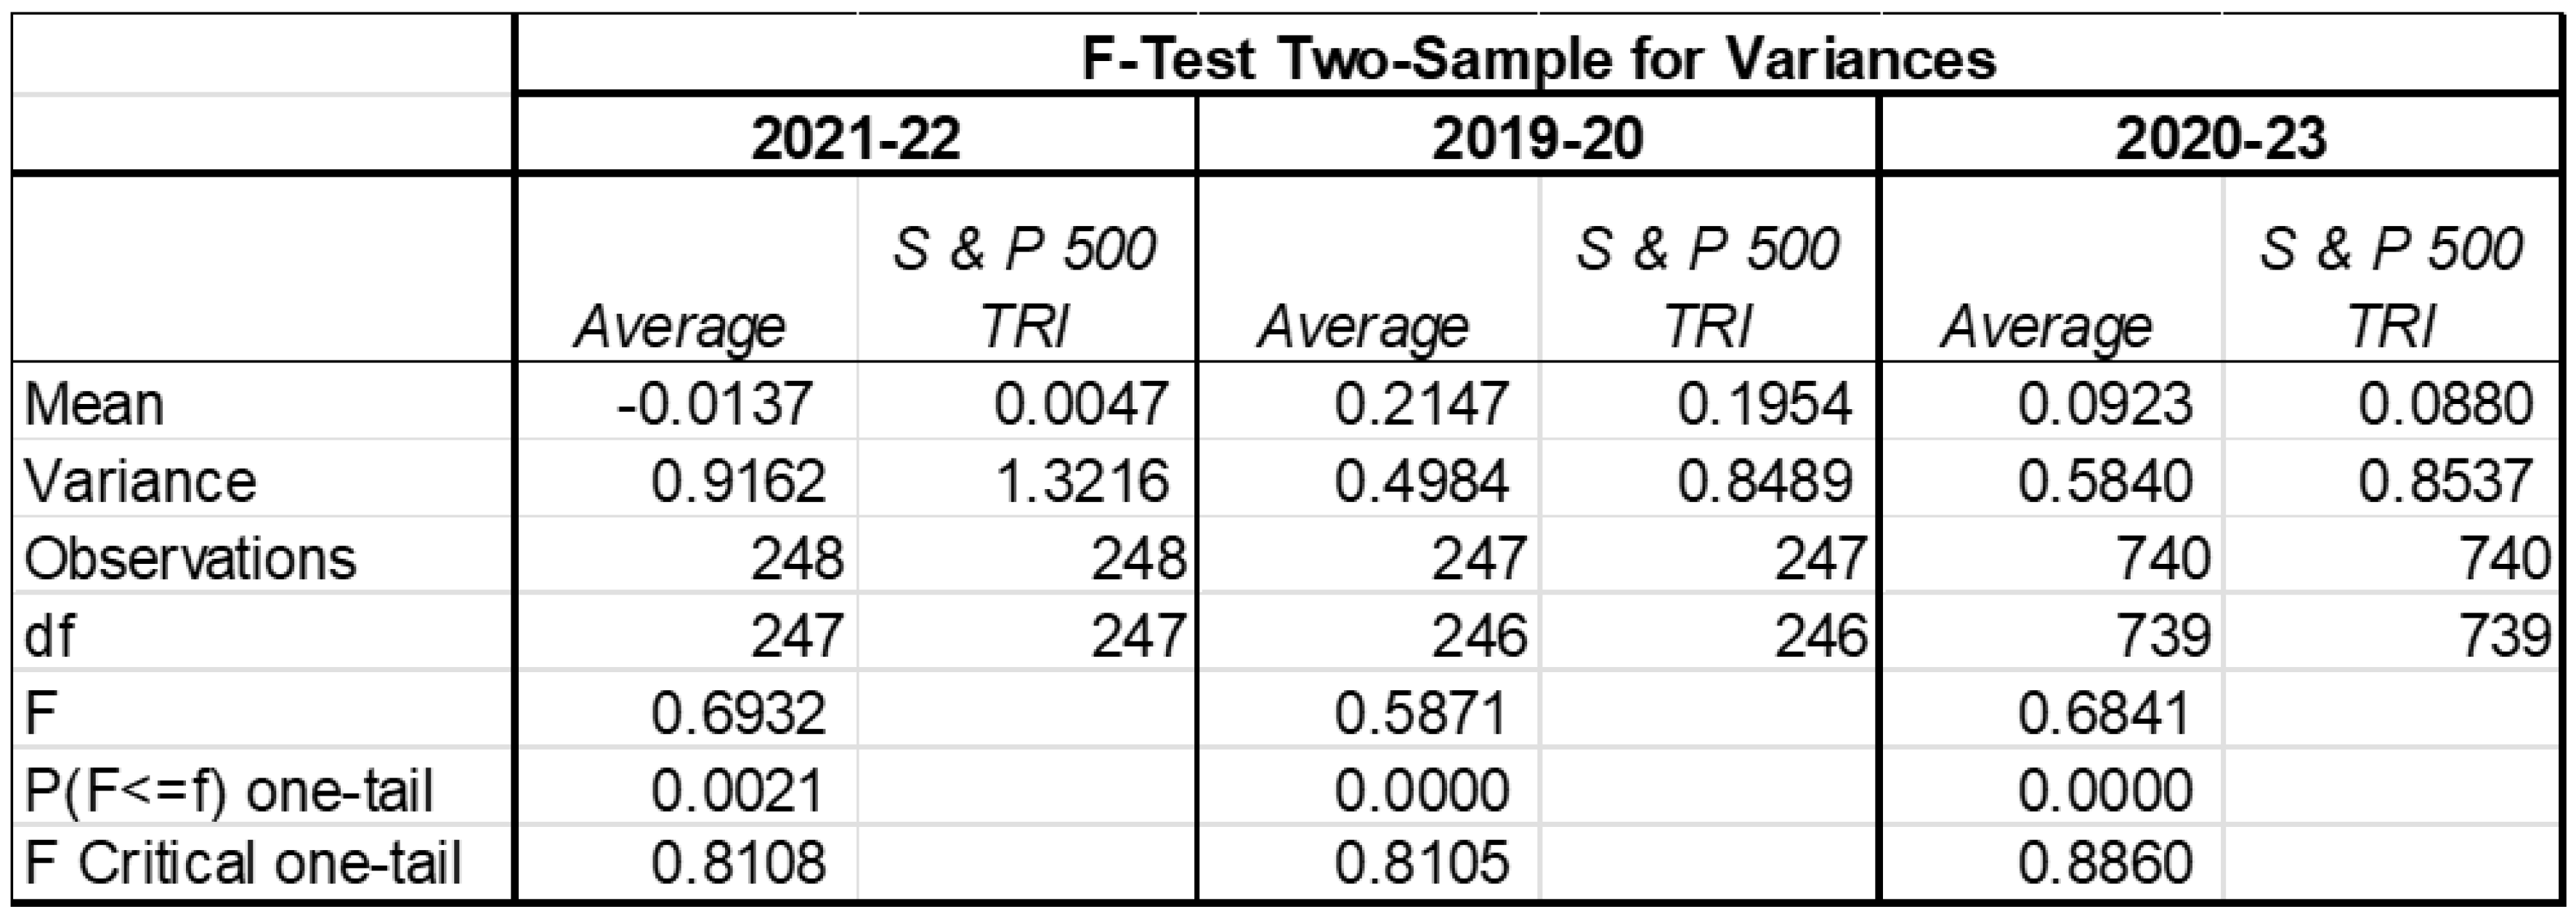
Table 7.
xxxx.
| Test of Variance Homogeneity | ||||||
| “Levene Statistic | df1 | df2 | Sig. | |||
| Based on Mean | 5.151 | 127 | 219 | .000 | ||
| Based on Median | 1.665 | 127 | 219 | .000 | ||
| Based on the Median and with adjusted df | 1.665 | 127 | 26.466 | .064 | ||
| Based on trimmed mean | 4.589 | 127 | 219 | .000” | ||
| ANOVA | ||||||
| Sum of Squares | df | Mean Square | F | Sig. | ||
| Between Groups | 360.491 | 275 | 1.311 | 1.463 | .002 | |
| Within Groups | 196.271 | 219 | .896 | |||
| Total | 556.763 | 494 | ||||
Disclaimer/Publisher’s Note: The statements, opinions and data contained in all publications are solely those of the individual author(s) and contributor(s) and not of MDPI and/or the editor(s). MDPI and/or the editor(s) disclaim responsibility for any injury to people or property resulting from any ideas, methods, instructions or products referred to in the content. |
© 2024 by the authors. Licensee MDPI, Basel, Switzerland. This article is an open access article distributed under the terms and conditions of the Creative Commons Attribution (CC BY) license (http://creativecommons.org/licenses/by/4.0/).
Copyright: This open access article is published under a Creative Commons CC BY 4.0 license, which permit the free download, distribution, and reuse, provided that the author and preprint are cited in any reuse.


