Submitted:
20 May 2024
Posted:
21 May 2024
You are already at the latest version
Abstract
Keywords:
1. Introduction
2. Results and Discussion
2.1. lrHNCO Experiments Detect H-bond 3hJNC’ and Sidechain 3JNCg Scalar Couplings
2.2. Agreement of H-Bonds Measured by NMR and cryoEM
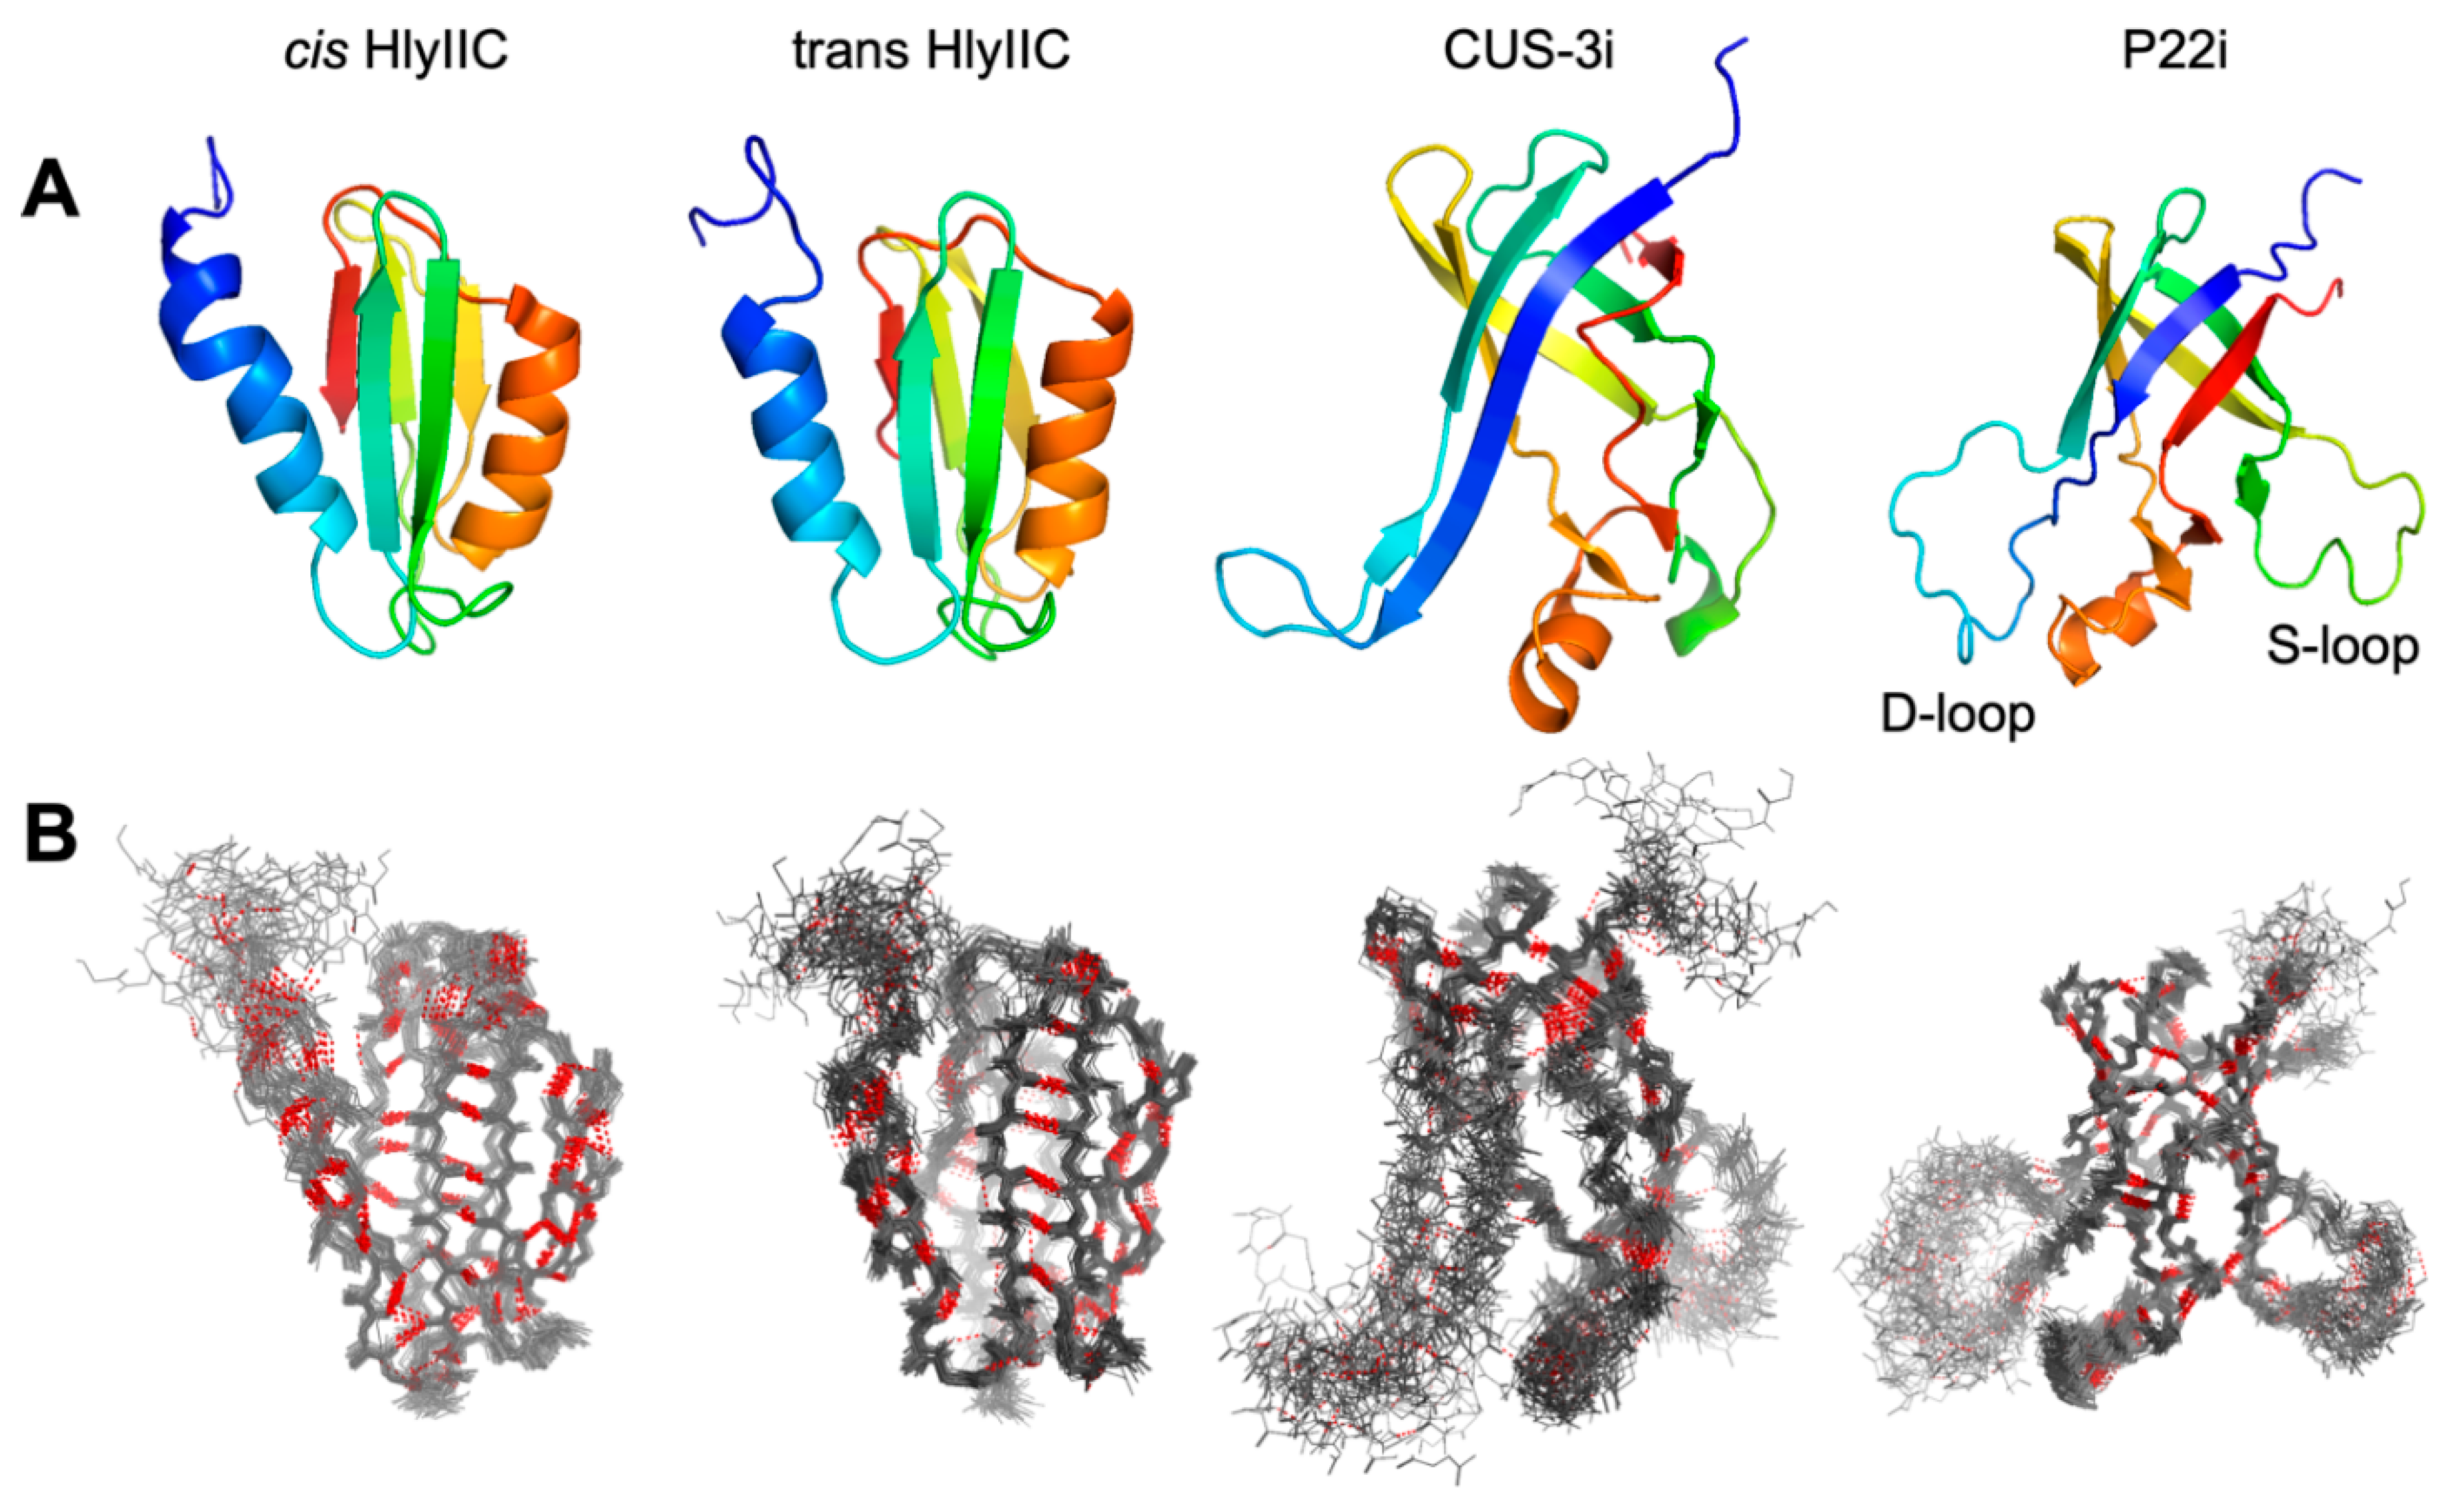
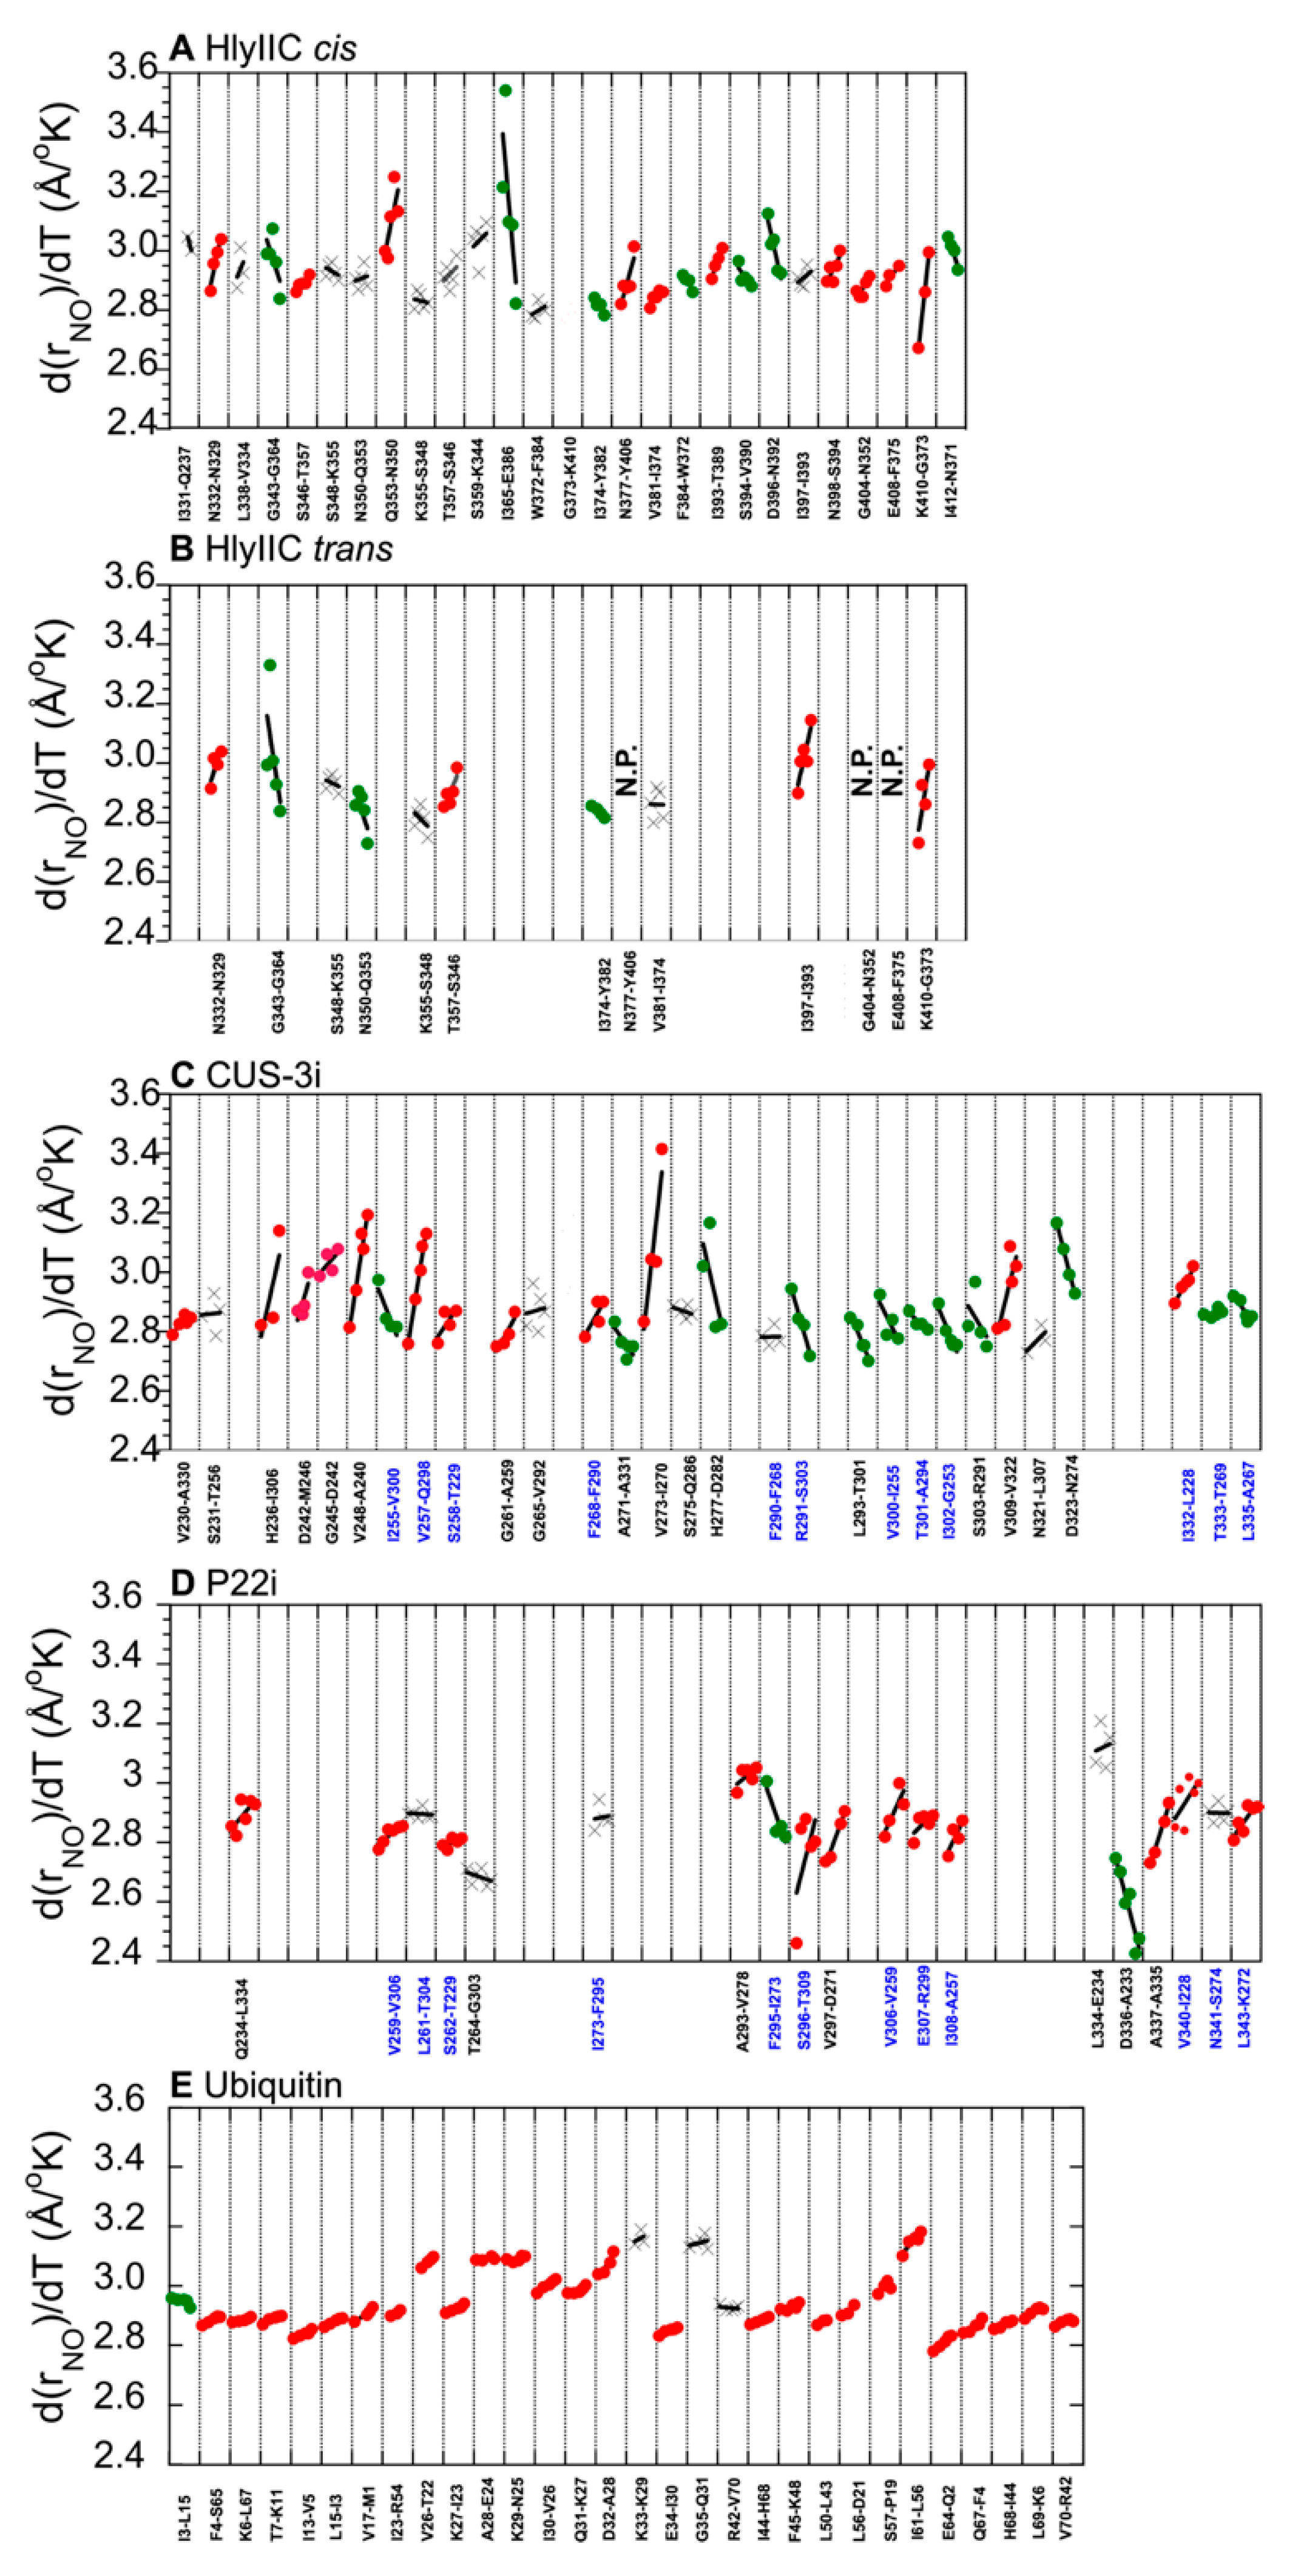
2.3. H-Bonds and Their Temperature Dependence Are Poorly Conserved between Related Proteins Structures
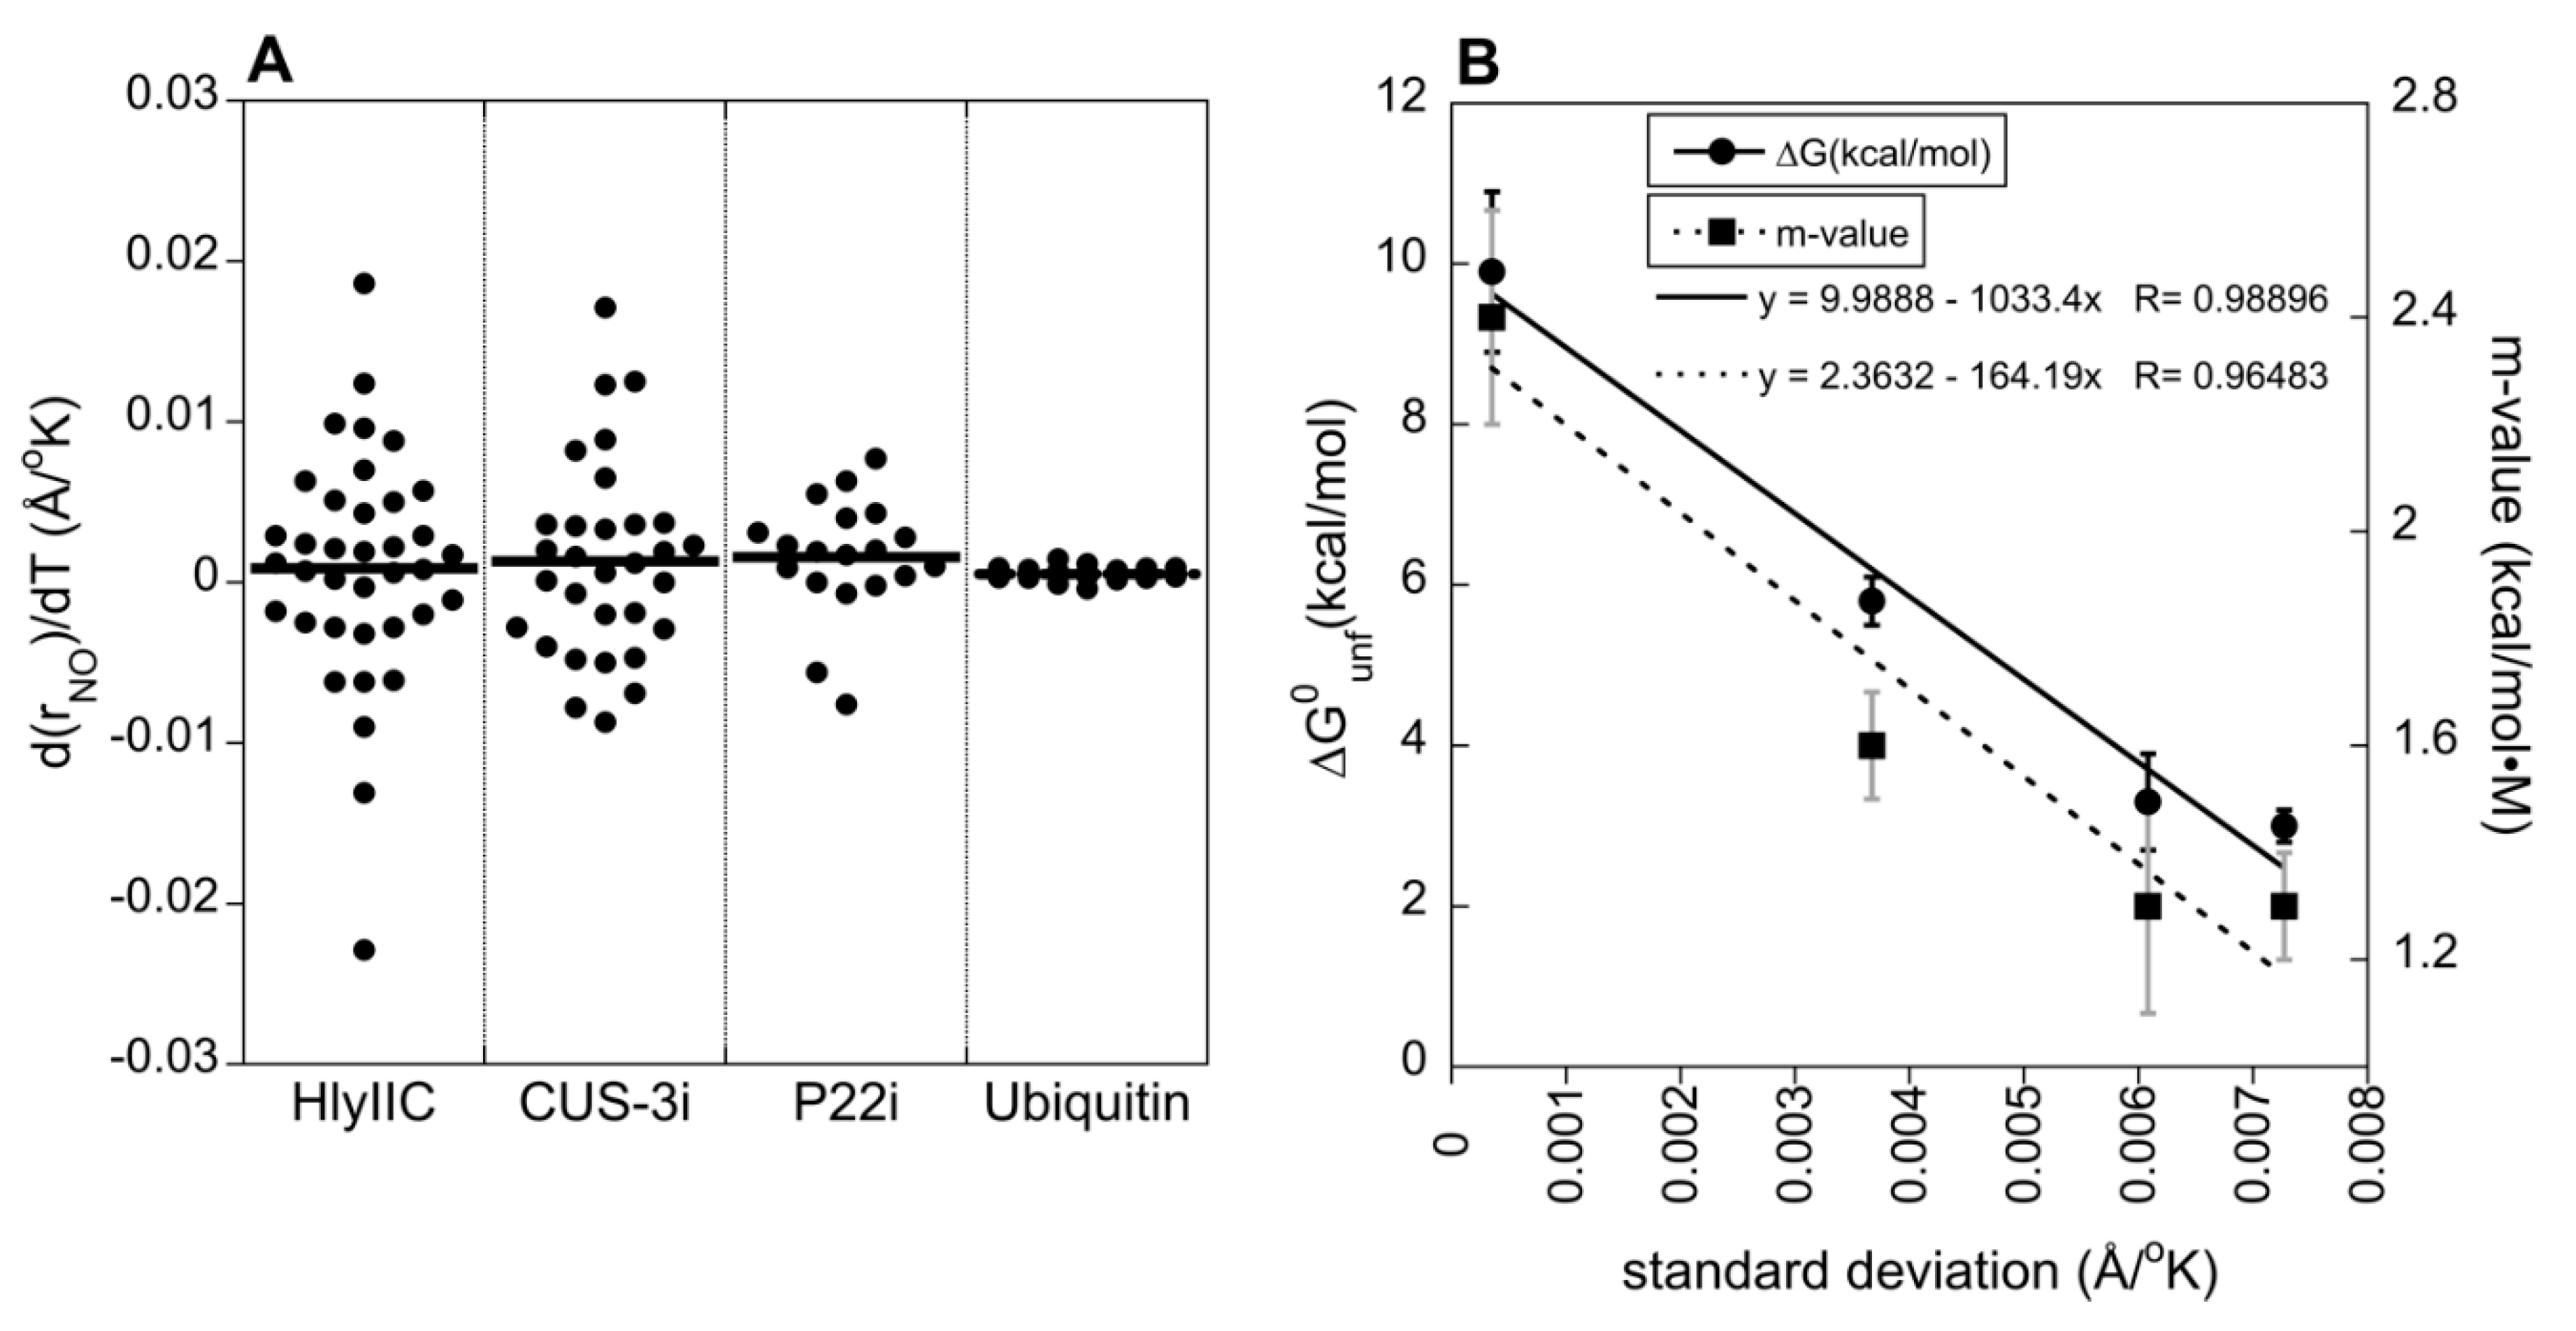
2.4. The Variability of H-Bond Temperature Responses Is Inversely Correlated with Global Folding Stability
3. Materials and Methods
3.1. Samples
3.2. NMR Data Acquisition and Analysis
3.3. Structure Analysis
Supplementary Materials
Author Contributions
Acknowledgments
Conflict of Interest
Abbreviations
References
- Branden, C.; Tooze, J. Introduction to Protein Structure, 2nd ed.; Garland Science: New York, 1998. [Google Scholar]
- Pauling, L. The hydrogen bond. In The Nature of the Chemical Bond, 3rd ed.; Pauling, L., Ed.; Cornell University Press: New York, NY, USA, 1960; pp. 449–504. [Google Scholar]
- Martin, T.W.; Derewenda, Z.S. The name is bond--H bond. Nat Struct Biol 1999, 6, 403–406. [Google Scholar] [CrossRef]
- Pace, C.N.; Fu, H.; Lee Fryar, K.; Landua, J.; Trevino, S.R.; Schell, D.; Thurlkill, R.L.; Imura, S.; Scholtz, J.M.; Gajiwala, K.; et al. Contribution of hydrogen bonds to protein stability. Protein Sci 2014, 23, 652–661. [Google Scholar] [CrossRef] [PubMed]
- Boresch, S.; Archontis, G.; Karplus, M. Free energy simulations: the meaning of the individual contributions from a component analysis. Proteins 1994, 20, 25–33. [Google Scholar] [CrossRef] [PubMed]
- Brady, G.P.; Szabo, A.; Sharp, K.A. On the decomposition of free energies. J Mol Biol 1996, 263, 123–125. [Google Scholar] [CrossRef]
- Mark, A.E.; van Gunsteren, W.F. Decomposition of the free energy of a system in terms of specific interactions. Implications for theoretical and experimental studies. J Mol Biol 1994, 240, 167–176. [Google Scholar] [CrossRef]
- Pauling, L. The Shared-Electron Chemical Bond. Proc Natl Acad Sci USA 1928, 14, 359–362. [Google Scholar] [CrossRef]
- Cordier, F.; Grzesiek, S. Direct observation of hydrogen bonds in proteins by interresidue 3HJNC' scalar couplings. J Am Chem Soc 1999, 121, 1601–1602. [Google Scholar] [CrossRef]
- Cordier, F.; Rogowski, M.; Grzesiek, S.; Bax, A. Observation of through-hydrogen-bond 2hJHC' in a perdeuterated protein. J Magn Reson 1999, 140, 510–512. [Google Scholar] [CrossRef]
- Cornilescu, G.; Hu, J.S.; Bax, A. Identification of the hydrogen bonding network in a protein by scalar couplings. J Am Chem Soc 1999, 121, 2949–2950. [Google Scholar] [CrossRef]
- Dingley, A.J.; Grzesiek, S. Direct Observation of Hydrogen Bonds in Nucleic Acid Base Pairs by Internucleotide 2JNN Couplings. J Am Chem Soc 1998, 120, 8293–8297. [Google Scholar] [CrossRef]
- Grzesiek, S.; Cordier, F.; Jaravine, V.A.; Barfield, M. Insights into biomolecular hydrogen bonds from hydrogen bond scalar couplings. Prog. Nucl. Magn. Reson. Spectrosc. 2004, 45, 275–300. [Google Scholar] [CrossRef]
- Pervushin, K.; Ono, A.; Fernandez, C.; Szyperski, T.; Kainosho, M.; Wuthrich, K. NMR scalar couplings across Watson-Crick base pair hydrogen bonds in DNA observed by transverse relaxation-optimized spectroscopy. Proc Natl Acad Sci U S A 1998, 95, 14147–14151. [Google Scholar] [CrossRef] [PubMed]
- Isaacs, E.D.; Shukla, A.; Platzman, P.M.; Hamann, D.R.; Barbiellini, B.; Tulk, C.A. Covalency of the Hydrogen Bond in Ice: A Direct X-Ray Measurement. Phys. Rev. Lett. 1999, 82, 600–603. [Google Scholar] [CrossRef]
- Englander, S.W.; Sosnick, T.R.; Englander, J.J.; Mayne, L. Mechanisms and uses of hydrogen exchange. Curr Opin Struct Biol 1996, 6, 18–23. [Google Scholar] [CrossRef] [PubMed]
- Alexandrescu, A.T. Strategy for supplementing structure calculations using limited data with hydrophobic distance restraints. Proteins 2004, 56, 117–129. [Google Scholar] [CrossRef] [PubMed]
- Sheftic, S.R.; Garcia, P.P.; White, E.; Robinson, V.L.; Gage, D.J.; Alexandrescu, A.T. Nuclear magnetic resonance structure and dynamics of the response regulator Sma0114 from Sinorhizobium meliloti. Biochemistry 2012, 51, 6932–6941. [Google Scholar] [CrossRef] [PubMed]
- Kaplan, A.R.; Kaus, K.; De, S.; Olson, R.; Alexandrescu, A.T. NMR structure of the Bacillus cereus hemolysin II C-terminal domain reveals a novel fold. Sci Rep 2017, 7, 3277. [Google Scholar] [CrossRef] [PubMed]
- Newcomer, R.L.; Schrad, J.R.; Gilcrease, E.B.; Casjens, S.R.; Feig, M.; Teschke, C.M.; Alexandrescu, A.T.; Parent, K.N. The phage L capsid decoration protein has a novel OB-fold and an unusual capsid binding strategy. Elife 2019, 8. [Google Scholar] [CrossRef]
- Tripler, T.N.; Kaplan, A.R.; Alexandrescu, A.T.; Teschke, C.M. Conservation and Divergence of the I-Domain Inserted into the Ubiquitous HK97 Coat Protein Fold in P22-Like Bacteriophages. J Virol 2019, 93. [Google Scholar] [CrossRef]
- Kanelis, V.; Rotin, D.; Forman-Kay, J.D. Solution structure of a Nedd4 WW domain-ENaC peptide complex. Nat Struct Biol 2001, 8, 407–412. [Google Scholar] [CrossRef]
- Jee, J.G.; Ikegami, T.; Hashimoto, M.; Kawabata, T.; Ikeguchi, M.; Watanabe, T.; Shirakawa, M. Solution structure of the fibronectin type III domain from Bacillus circulans WL-12 chitinase A1. J Biol Chem 2002, 277, 1388–1397. [Google Scholar] [CrossRef] [PubMed]
- Cornilescu, G.; Ramirez, B.E.; Frank, M.K.; Clore, G.M.; Gronenborn, A.M.; Bax, A. Correlation between 3hJNC' and hydrogen-bond length in proteins. J Am Chem Soc 1999, 121, 6275–6279. [Google Scholar] [CrossRef]
- Alexandrescu, A.T.; Snyder, D.R.; Abildgaard, F. NMR of hydrogen bonding in cold-shock protein A and an analysis of the influence of crystallographic resolution on comparisons of hydrogen bond lengths. Protein Sci 2001, 10, 1856–1868. [Google Scholar] [CrossRef] [PubMed]
- Li, H.; Yamada, H.; Akasaka, K.; Gronenborn, A.M. Pressure alters electronic orbital overlap in hydrogen bonds. J Biomol NMR 2000, 18, 207–216. [Google Scholar] [CrossRef] [PubMed]
- Jaravine, V.A.; Alexandrescu, A.T.; Grzesiek, S. Observation of the closing of individual hydrogen bonds during TFE-induced helix formation in a peptide. Protein Sci 2001, 10, 943–950. [Google Scholar] [CrossRef] [PubMed]
- Cordier, F.; Wang, C.; Grzesiek, S.; Nicholson, L.K. Ligand-induced strain in hydrogen bonds of the c-Src SH3 domain detected by NMR. J Mol Biol 2000, 304, 497–505. [Google Scholar] [CrossRef]
- Cordier, F.; Grzesiek, S. Temperature-dependence of protein hydrogen bond properties as studied by high-resolution NMR. J Mol Biol 2002, 317, 739–752. [Google Scholar] [CrossRef]
- Hong, J.; Jing, Q.; Yao, L. The protein amide (1)H(N) chemical shift temperature coefficient reflects thermal expansion of the N-H...O=C hydrogen bond. J Biomol NMR 2013, 55, 71–78. [Google Scholar] [CrossRef]
- Kaplan, A.R.; Olson, R.; Alexandrescu, A.T. Protein yoga: Conformational versatility of the Hemolysin II C-terminal domain detailed by NMR structures for multiple states. Protein Sci 2021, 30, 990–1005. [Google Scholar] [CrossRef]
- Rizzo, A.A.; Suhanovsky, M.M.; Baker, M.L.; Fraser, L.C.; Jones, L.M.; Rempel, D.L.; Gross, M.L.; Chiu, W.; Alexandrescu, A.T.; Teschke, C.M. Multiple functional roles of the accessory I-domain of bacteriophage P22 coat protein revealed by NMR structure and CryoEM modeling. Structure 2014, 22, 830–841. [Google Scholar] [CrossRef]
- Juranic, N.; Ilich, P.K.; Macura, S. Hydrogen Bonding Networks in Proteins As Revealed by the Amide 1JNC' Coupling Constant. J Am Chem Soc 1995, 117, 405–410. [Google Scholar] [CrossRef]
- Kay, L.E.; Ikura, M.; Tschudin, R.; Bax, A. Three-dimensional triple-resonance NMR Spectroscopy of isotopically enriched proteins. 1990. J Magn Reson 2011, 213, 423–441. [Google Scholar] [CrossRef] [PubMed]
- Juranic, N.; Moncrieffe, M.C.; Likic, V.A.; Prendergast, F.G.; Macura, S. Structural dependencies of h3JNC' scalar coupling in protein H-bond chains. J Am Chem Soc 2002, 124, 14221–14226. [Google Scholar] [CrossRef] [PubMed]
- Juranic, N.; Macura, S. Correlations among (1)J(NC)' and (h3)J(NC)' coupling constants in the hydrogen-bonding network of human ubiquitin. J Am Chem Soc 2001, 123, 4099–4100. [Google Scholar] [CrossRef] [PubMed]
- Juranic, N.; Dannenberg, J.J.; Cornilescu, G.; Salvador, P.; Atanasova, E.; Ahn, H.C.; Macura, S.; Markley, J.L.; Prendergast, F.G. Structural dependencies of protein backbone 2JNC' couplings. Protein Sci 2008, 17, 768–776. [Google Scholar] [CrossRef]
- Benirschke, R.C.; Thompson, J.R.; Nomine, Y.; Wasielewski, E.; Juranic, N.; Macura, S.; Hatakeyama, S.; Nakayama, K.I.; Botuyan, M.V.; Mer, G. Molecular basis for the association of human E4B U box ubiquitin ligase with E2-conjugating enzymes UbcH5c and Ubc4. Structure 2010, 18, 955–965. [Google Scholar] [CrossRef] [PubMed]
- Juranic, N.; Atanasova, E.; Moncrieffe, M.C.; Prendergast, F.G.; Macura, S. Calcium-binding proteins afford calibration of dihedral-angle dependence of 3J(NC(gamma)) coupling constant in aspartate and asparagine residues. J Magn Reson 2005, 175, 222–225. [Google Scholar] [CrossRef]
- Yamazaki, T.; Nicholson, L.K.; Torchia, D.A.; Wingfield, P.; Stahl, S.J.; Kaufman, J.D.; Eyermann, C.J.; Hodge, C.N.; Lam, P.Y.S.; Ru, Y.; et al. NMR and X-ray evidence that the HFV protease catalytic aspartyl groups are protonated in the complex formed by the protease and a non-peptide cyclic urea-based inhibitor. J Am Chem Soc 1994, 116, 10791–10792. [Google Scholar] [CrossRef]
- Wood, P.A.; Allen, F.H.; Pidock, E. Hydrogen-bond directionality at the donor H atom—analysis of interaction energies and database statistics. CrystEngComm 2009, 11, 1563–1571. [Google Scholar] [CrossRef]
- Xiao, H.; Zhou, J.; Yang, F.; Liu, Z.; Song, J.; Chen, W.; Liu, H.; Cheng, L. Assembly and Capsid Expansion Mechanism of Bacteriophage P22 Revealed by High-Resolution Cryo-EM Structures. Viruses 2023, 15. [Google Scholar] [CrossRef]
- Hryc, C.F.; Chen, D.H.; Afonine, P.V.; Jakana, J.; Wang, Z.; Haase-Pettingell, C.; Jiang, W.; Adams, P.D.; King, J.A.; Schmid, M.F.; et al. Accurate model annotation of a near-atomic resolution cryo-EM map. Proc Natl Acad Sci USA 2017, 114, 3103–3108. [Google Scholar] [CrossRef]
- Weissenberger, G.; Henderikx, R.J.M.; Peters, P.J. Understanding the invisible hands of sample preparation for cryo-EM. Nat Methods 2021, 18, 463–471. [Google Scholar] [CrossRef] [PubMed]
- Kaplan, A.R.; Maciejewski, M.W.; Olson, R.; Alexandrescu, A.T. NMR assignments for the cis and trans forms of the hemolysin II C-terminal domain. Biomol. NMR Assign. 2014, 8, 419–423. [Google Scholar] [CrossRef]
- Kraulis, P.J. Similarity of protein G and ubiquitin. Science 1991, 254, 581–582. [Google Scholar] [CrossRef] [PubMed]
- Alexander, P.; Fahnestock, S.; Lee, T.; Orban, J.; Bryan, P. Thermodynamic analysis of the folding of the streptococcal protein G IgG-binding domains B1 and B2: why small proteins tend to have high denaturation temperatures. Biochemistry 1992, 31, 3597–3603. [Google Scholar] [CrossRef] [PubMed]
- Granata, D.; Camilloni, C.; Vendruscolo, M.; Laio, A. Characterization of the free-energy landscapes of proteins by NMR-guided metadynamics. Proc Natl Acad Sci USA 2013, 110, 6817–6822. [Google Scholar] [CrossRef] [PubMed]
- Tripler, T.N. Conservation and Divergence between P22-like Bacteriophages Coat Protein’s I-Domains and Procapsid-like Particles. Doctoral Dissertation, University of Connecticut, Storrs, CT, USA, 2019. [Google Scholar]
- Newcomer, R.L.; Fraser, L.C.R.; Teschke, C.M.; Alexandrescu, A.T. Mechanism of Protein Denaturation: Partial Unfolding of the P22 Coat Protein I-Domain by Urea Binding. Biophysical journal 2015, 109, 2666–2677. [Google Scholar] [CrossRef] [PubMed]
- Surana, P.; Das, R. Observing a late folding intermediate of Ubiquitin at atomic resolution by NMR. Protein Sci 2016, 25, 1438–1450. [Google Scholar] [CrossRef]
- Wintrode, P.L.; Makhatadze, G.I.; Privalov, P.L. Thermodynamics of ubiquitin unfolding. Proteins 1994, 18, 246–253. [Google Scholar] [CrossRef]
- Myers, J.K.; Pace, C.N.; Scholtz, J.M. Denaturant m values and heat capacity changes: relation to changes in accessible surface areas of protein unfolding. Protein Sci 1995, 4, 2138–2148. [Google Scholar] [CrossRef]
- Shortle, D. Staphylococcal nuclease: a showcase of m-value effects. Adv Protein Chem 1995, 46, 217–247. [Google Scholar] [CrossRef] [PubMed]
- Alexandrescu, A.T.; Jaravine, V.A.; Dames, S.A.; Lamour, F.P. NMR hydrogen exchange of the OB-fold protein LysN as a function of denaturant: the most conserved elements of structure are the most stable to unfolding. J Mol Biol 1999, 289, 1041–1054. [Google Scholar] [CrossRef] [PubMed]
- Carra, J.H.; Privalov, P.L. Thermodynamics of denaturation of staphylococcal nuclease mutants: an intermediate state in protein folding. FASEB J 1996, 10, 67–74. [Google Scholar] [CrossRef] [PubMed]
- Smith, L.J.; Alexandrescu, A.T.; Pitkeathly, M.; Dobson, C.M. Solution structure of a peptide fragment of human alpha-lactalbumin in trifluoroethanol: a model for local structure in the molten globule. Structure 1994, 2, 703–712. [Google Scholar] [CrossRef] [PubMed]
- Nelson, J.W.; Kallenbach, N.R. Stabilization of the ribonuclease S-peptide alpha-helix by trifluoroethanol. Proteins 1986, 1, 211–217. [Google Scholar] [CrossRef] [PubMed]
- Rizzo, A.A.; Fraser, L.C.; Sheftic, S.R.; Suhanovsky, M.M.; Teschke, C.M.; Alexandrescu, A.T. NMR assignments for the telokin-like domain of bacteriophage P22 coat protein. Biomolecular NMR assignments 2013, 7, 257–260. [Google Scholar] [CrossRef] [PubMed]
- Tripler, T.N.; Maciejewski, M.W.; Teschke, C.M.; Alexandrescu, A.T. NMR assignments for the insertion domain of bacteriophage CUS-3 coat protein. Biomolecular NMR assignments, 1007. [Google Scholar] [CrossRef]
- Favier, A.; Brutscher, B. Recovering lost magnetization: polarization enhancement in biomolecular NMR. J Biomol NMR 2011, 49, 9–15. [Google Scholar] [CrossRef]
- Vranken, W.F.; Boucher, W.; Stevens, T.J.; Fogh, R.H.; Pajon, A.; Llinas, M.; Ulrich, E.L.; Markley, J.L.; Ionides, J.; Laue, E.D. The CCPN data model for NMR spectroscopy: development of a software pipeline. Proteins 2005, 59, 687–696. [Google Scholar] [CrossRef]
- McDonald, I.K.; Thornton, J.M. Satisfying hydrogen bonding potential in proteins. J Mol Biol 1994, 238, 777–793. [Google Scholar] [CrossRef]


| Protein | ∆G0unf (kcal/mol) |
m-value (kcal/mol•M) |
Tmelt (oC) |
References |
|---|---|---|---|---|
| HlyIIC | 3.0 ± 0.2 | 1.3 ± 0.1 | 52 | [19,31] |
| CUS-3i | 3.3 ± 0.6 | 1.3 ± 0.2 | 48 | [49] |
| P22 | 5.8 ± 0.3 | 1.6 ± 0.1 | 54 | [50] |
| ubiquitin | 9.9 ± 1.0 | 2.4 ± 0.2 | > 90 | [51,52] |
| GB3 | ~ 6 to 7 | N.D. | ≥ 90 | [47,48] |
Disclaimer/Publisher’s Note: The statements, opinions and data contained in all publications are solely those of the individual author(s) and contributor(s) and not of MDPI and/or the editor(s). MDPI and/or the editor(s) disclaim responsibility for any injury to people or property resulting from any ideas, methods, instructions or products referred to in the content. |
© 2024 by the authors. Licensee MDPI, Basel, Switzerland. This article is an open access article distributed under the terms and conditions of the Creative Commons Attribution (CC BY) license (http://creativecommons.org/licenses/by/4.0/).


