1. Introduction
Fracture process is a complex physical phenomenon which spans over various length scales from atomistic scale to continuum scale. If the fracture proceeds with little plastic deformation after crack initiation, it is called brittle fracture [
1]. Ductile fracture involves crack tip blunting, crack initiation followed by void nucleation and growth, then crack propagates with void coalescence [
2]. This fracture process can be affected by micro defects like second phase particles acting as nucleation sites for micro voids. Microvoids are formed due to decohesion from matrix, brittle fracture of these particles [
3], presence of any other micro defects or the interaction of slip bands. Often the size of void nucleating particles may be encapsulated inside the single grain of polycrystalline aluminium. Thus, in order to understand the effects of pre-existing voids on fracture response of aluminium, it is imperative to quantitatively analyse crack tip fields of aluminium single crystal.
Several investigators have reported crack tip fields for ductile single crystal aluminium in atomic and continuum scale. Rice [
4] proposed an asymptomatic solution for the crack tip stress field in ductile single crystals under mode I plane strain conditions within small strain, ideal plasticity framework. His analysis considered the cases of a crack on the (010) plane with crack front along [10-1] direction, and a crack on the (101) plane with crack front along [10-1] direction for face-centred-cubic (FCC) and body-centred-cubic (BCC) crystals, respectively. Similar study performed by varying orientation and lattice showed that crack tip fields in single crystal are influenced by grain orientation and lattice type [
5]. Similar studies in atomistic scale was carried out by various researchers, specifically to analyze stress evolution ahead of crack tip [
2] and study effect of void size, and void placement w.r.t crack tip on fracture response of FCC single crystal [
6]. In crack tip stress evolution study, a constrained 3D atomic model of aluminium was used to study crack tip field via von Mises stress, mean stress and stress triaxiality before and after crack initiation, and void nucleation leading to crack propagation.
Aluminium single crystal loaded at a strain rate of 1e8 per second in [010] direction (length 20nm) with crack front along [100] direction was simulated using approximate size of 40nm x 20nm x 1.6nm. The simulation clearly demarcates that, before crack initiation, von Mises stress has a minimum just ahead of crack tip and high values above and below the crack tip, whereas, mean stress and stress triaxiality achieve a peak.
This region of high stress triaxiality and a local minimum of Mises stress is a reliable indicator of crack initiation. Similar studies performed on continuum scale have brought out that stress triaxiality and stress concentration factor determines dominant slip system taking part in ductile fracture of FCC single crystal [
7]. Slip bands around crack tip fields was compared with 2D and 3D simulation using finite element model under crystal plasticity framework [
8]. They were found in good agreement with electron back scatter diffraction (EBSD) experimental data. Another study performed to identify damage factor indicating crack initiation in steel alloy, and found that, damage factor predicted using Rice and Tracey void growth model [
9] was independent of notch size of crack tip. Another experiment reported about effects of cylindrical voids head of crack tip in Aluminium single crystals [
10] in continuum scale. In this experiment, crystal plasticity (CP) simulation was performed to study and validate crack tip lattice rotation, equivalent plastic slip and void growth rate with experiments performed at quasi-static strain rate 1e4 per second on single-edged-notched-tensile (SENT) aluminium specimen with crack length to width (i.e., a/W) ratio of 0.5. It was noted that only first void, 0.5mm ahead of crack tip interacted with crack. Slip bands and void growth rates where concurrent with simulation results. Strong dependence of void growth rate on initial grain orientation was also noted [
10].
In the work presented here, experiments have been conducted on tensile specimens machined from an aluminium alloy block to evaluate the material stress strain curve. For evaluation of fracture properties, experiments have been conducted on disc shaped compact tension (CT) specimens to as to determine the fracture toughness of aluminium alloy. From finite element (FE) analysis and experimental data, a material damage parameter for prediction of crack initiation has been evaluated. The variation of the parameter for various values of initial a/W ratios of the disc-shaped CT specimens have been studied. In addition, the material damage parameter has also been used to study the crack initiation in single crystal fracture specimens with two different orientations (i.e., [100] and [111]).
2. Material Composition and Mechanical Properties
The material used in this work is aluminium and it is of grade Al-1100-O (O refers to annealed or without cold-work). The alloy is of nuclear reactor grade of pure aluminum. It is soft, ductile and it has excellent mechanical workability, making it ideal for applications with involves complex forming processes. It can be welded using any method, but it is non heat-treatable. It has an excellent resistance to corrosion and similar grade of material is also commonly used in the chemical, nuclear and food processing industries. With a minimum of 99.0% Aluminum, it is the most heavily alloyed among the 1000 series Aluminum alloys. It is also the mechanically strongest alloy in the series, and is the only 1000-series alloy commonly used. At the same time, it is also lightly alloyed (compared to other series) which imparts high electrical conductivity, thermal conductivity, corrosion resistance, and workability to the material. It can be hardened by cold working, but not by heat treatment. After different degrees of cold work or cold rolling, one can get increased strength for this alloy and the designation changes to Hxx grade. This alloy is also designated as Al99.0Cu and A91100. The compositions of this alloy confirm to the ASTM standards ASTM B241.
The chemical composition of Aluminum alloy Al-1100-O is given in (
Table 1). This is commercial grade of pure Aluminum with almost 99-99.5% of Al and the rest are trace elements. Among the trace elements, Fe and Si constitute the major fraction followed by Zn, Mn and Cu. The alloy is not heat-treatable and hence, the strength is mainly because of Al matrix with a very small fraction of second phase particles and inclusions.
The mechanical properties of this alloy have been evaluated through tensile tests of flat type specimens. The mechanical properties of the alloy at 25oC (room temperature) is given in
Table 2.
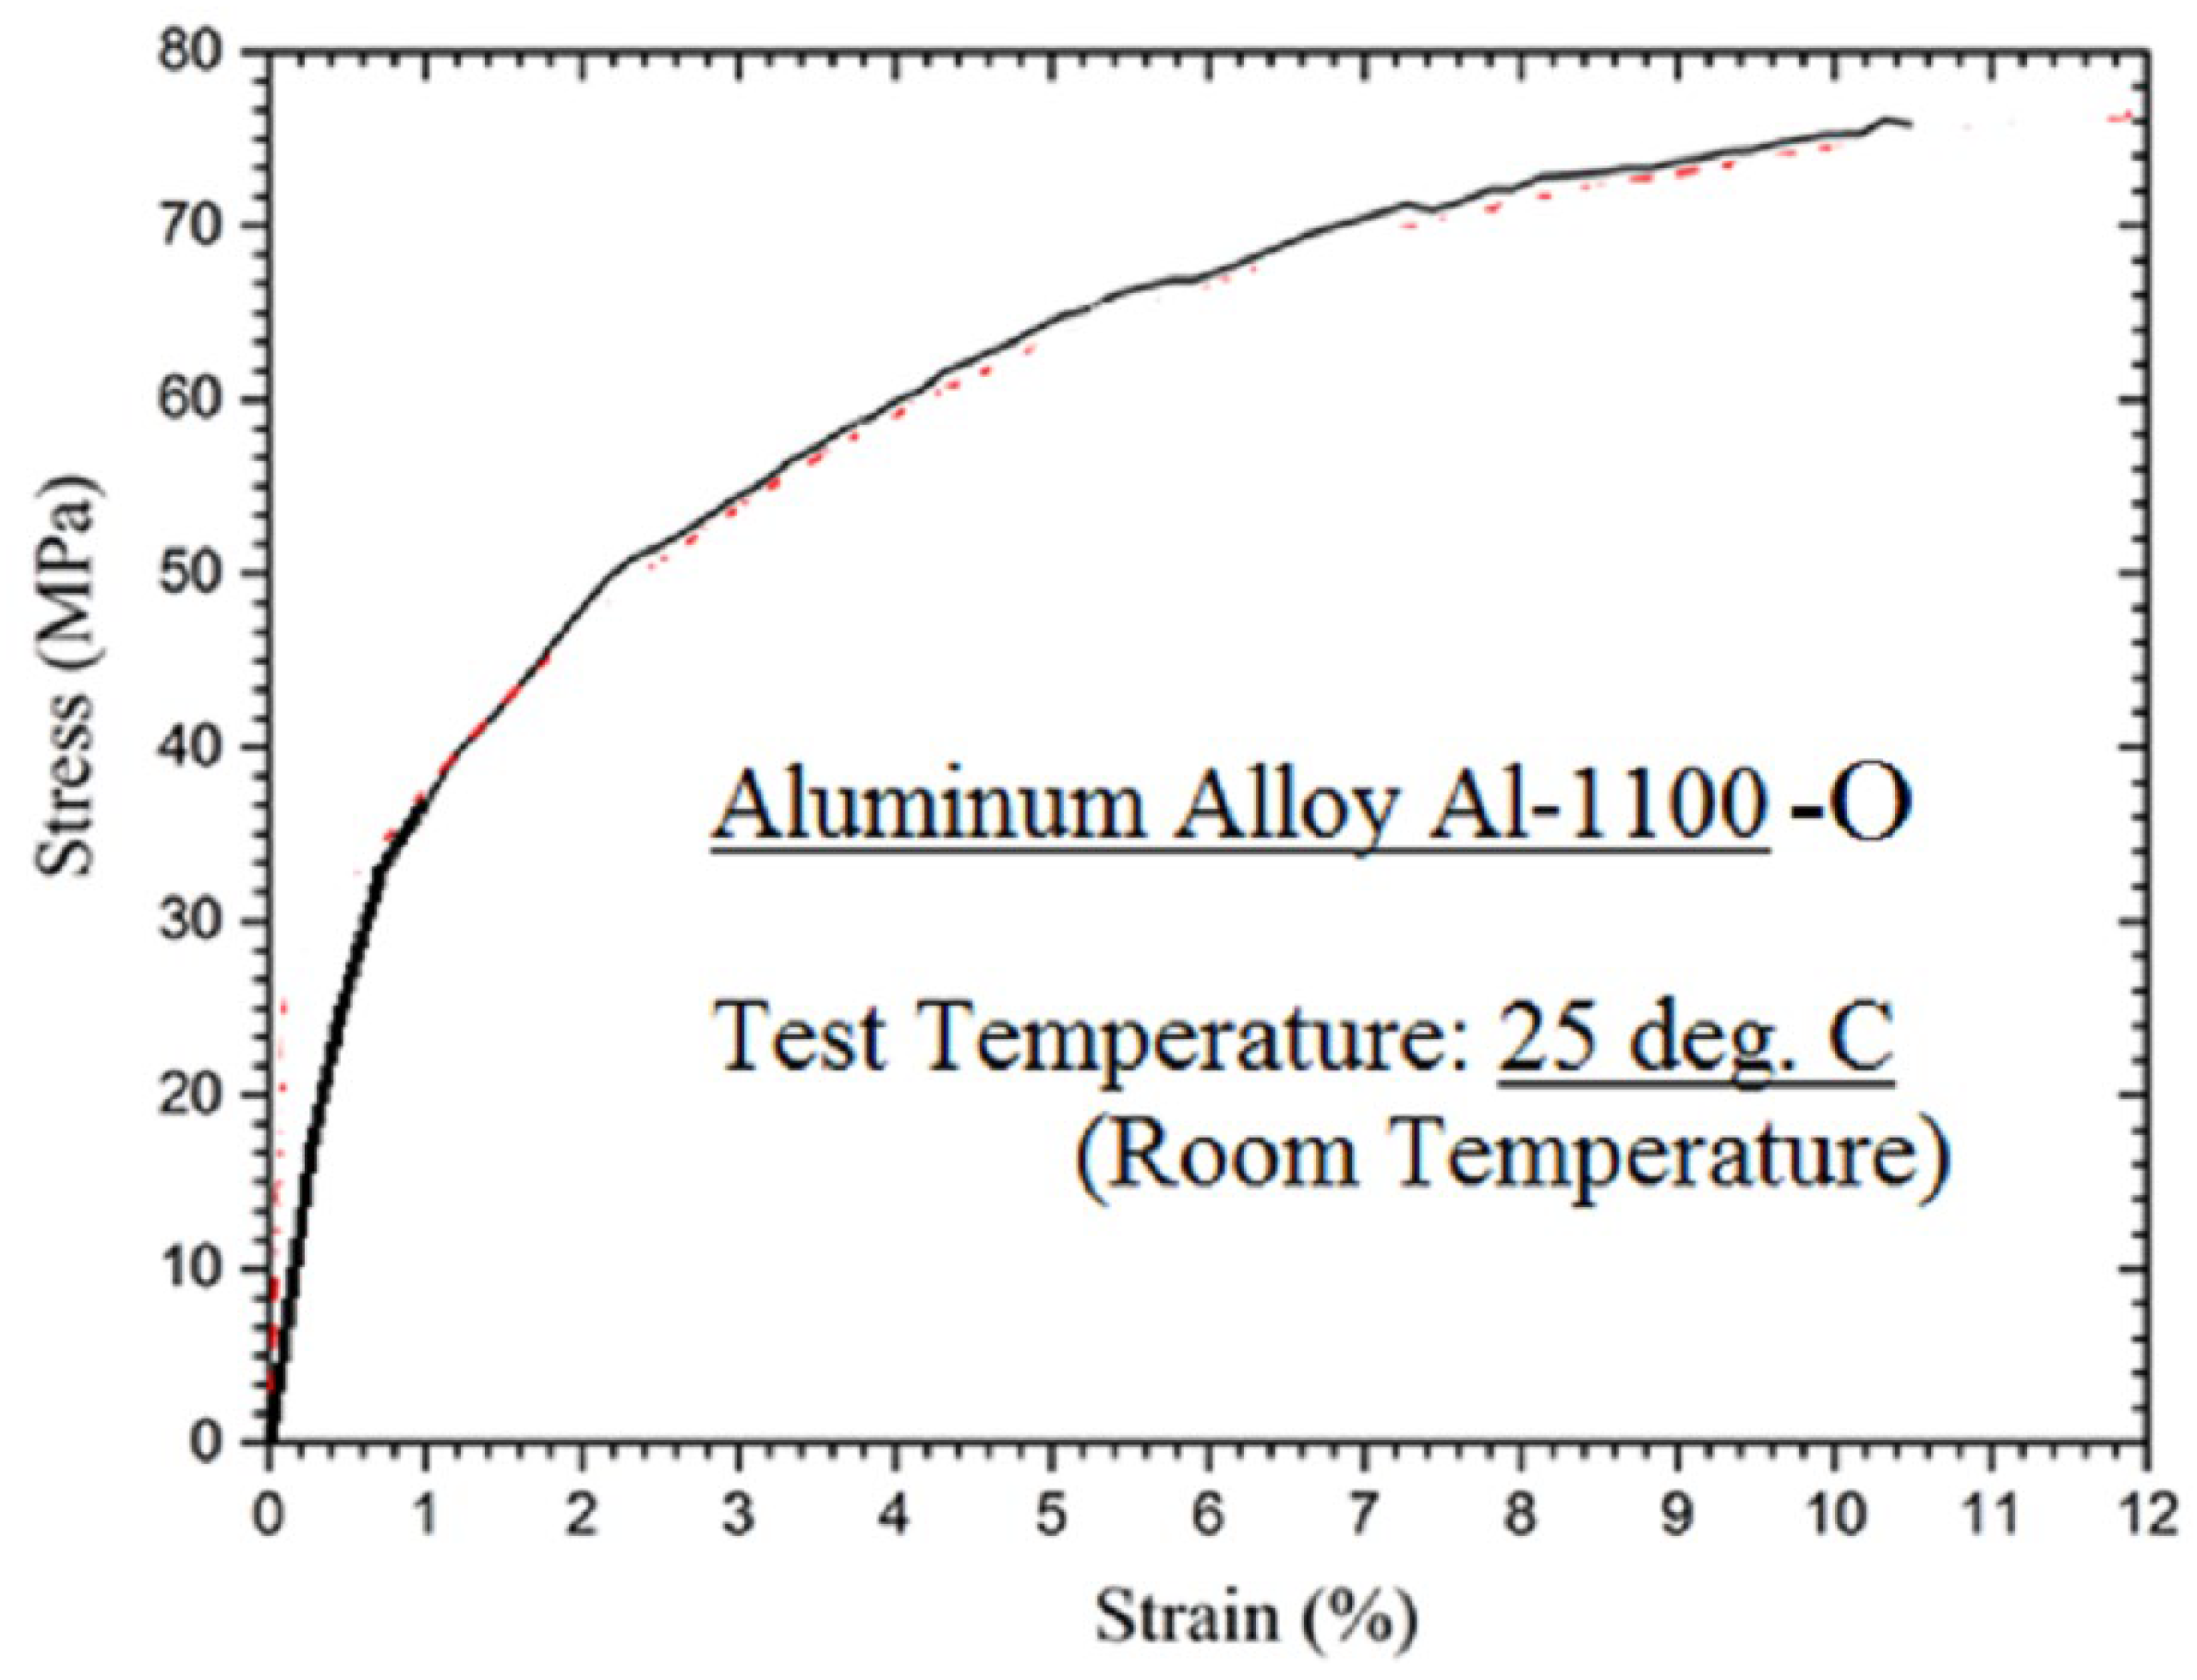
The true stress-strain curve of the alloy is required as input in nonlinear elastic-plastic finite element analysis of specimens or components made of this material. The corresponding stress-strain curve of this alloy is presented in
Figure 1 for the test conducted at 25
oC (room temperature condition).
3. Fracture Experiments Using Disc-Shaped Compact Tension Specimen
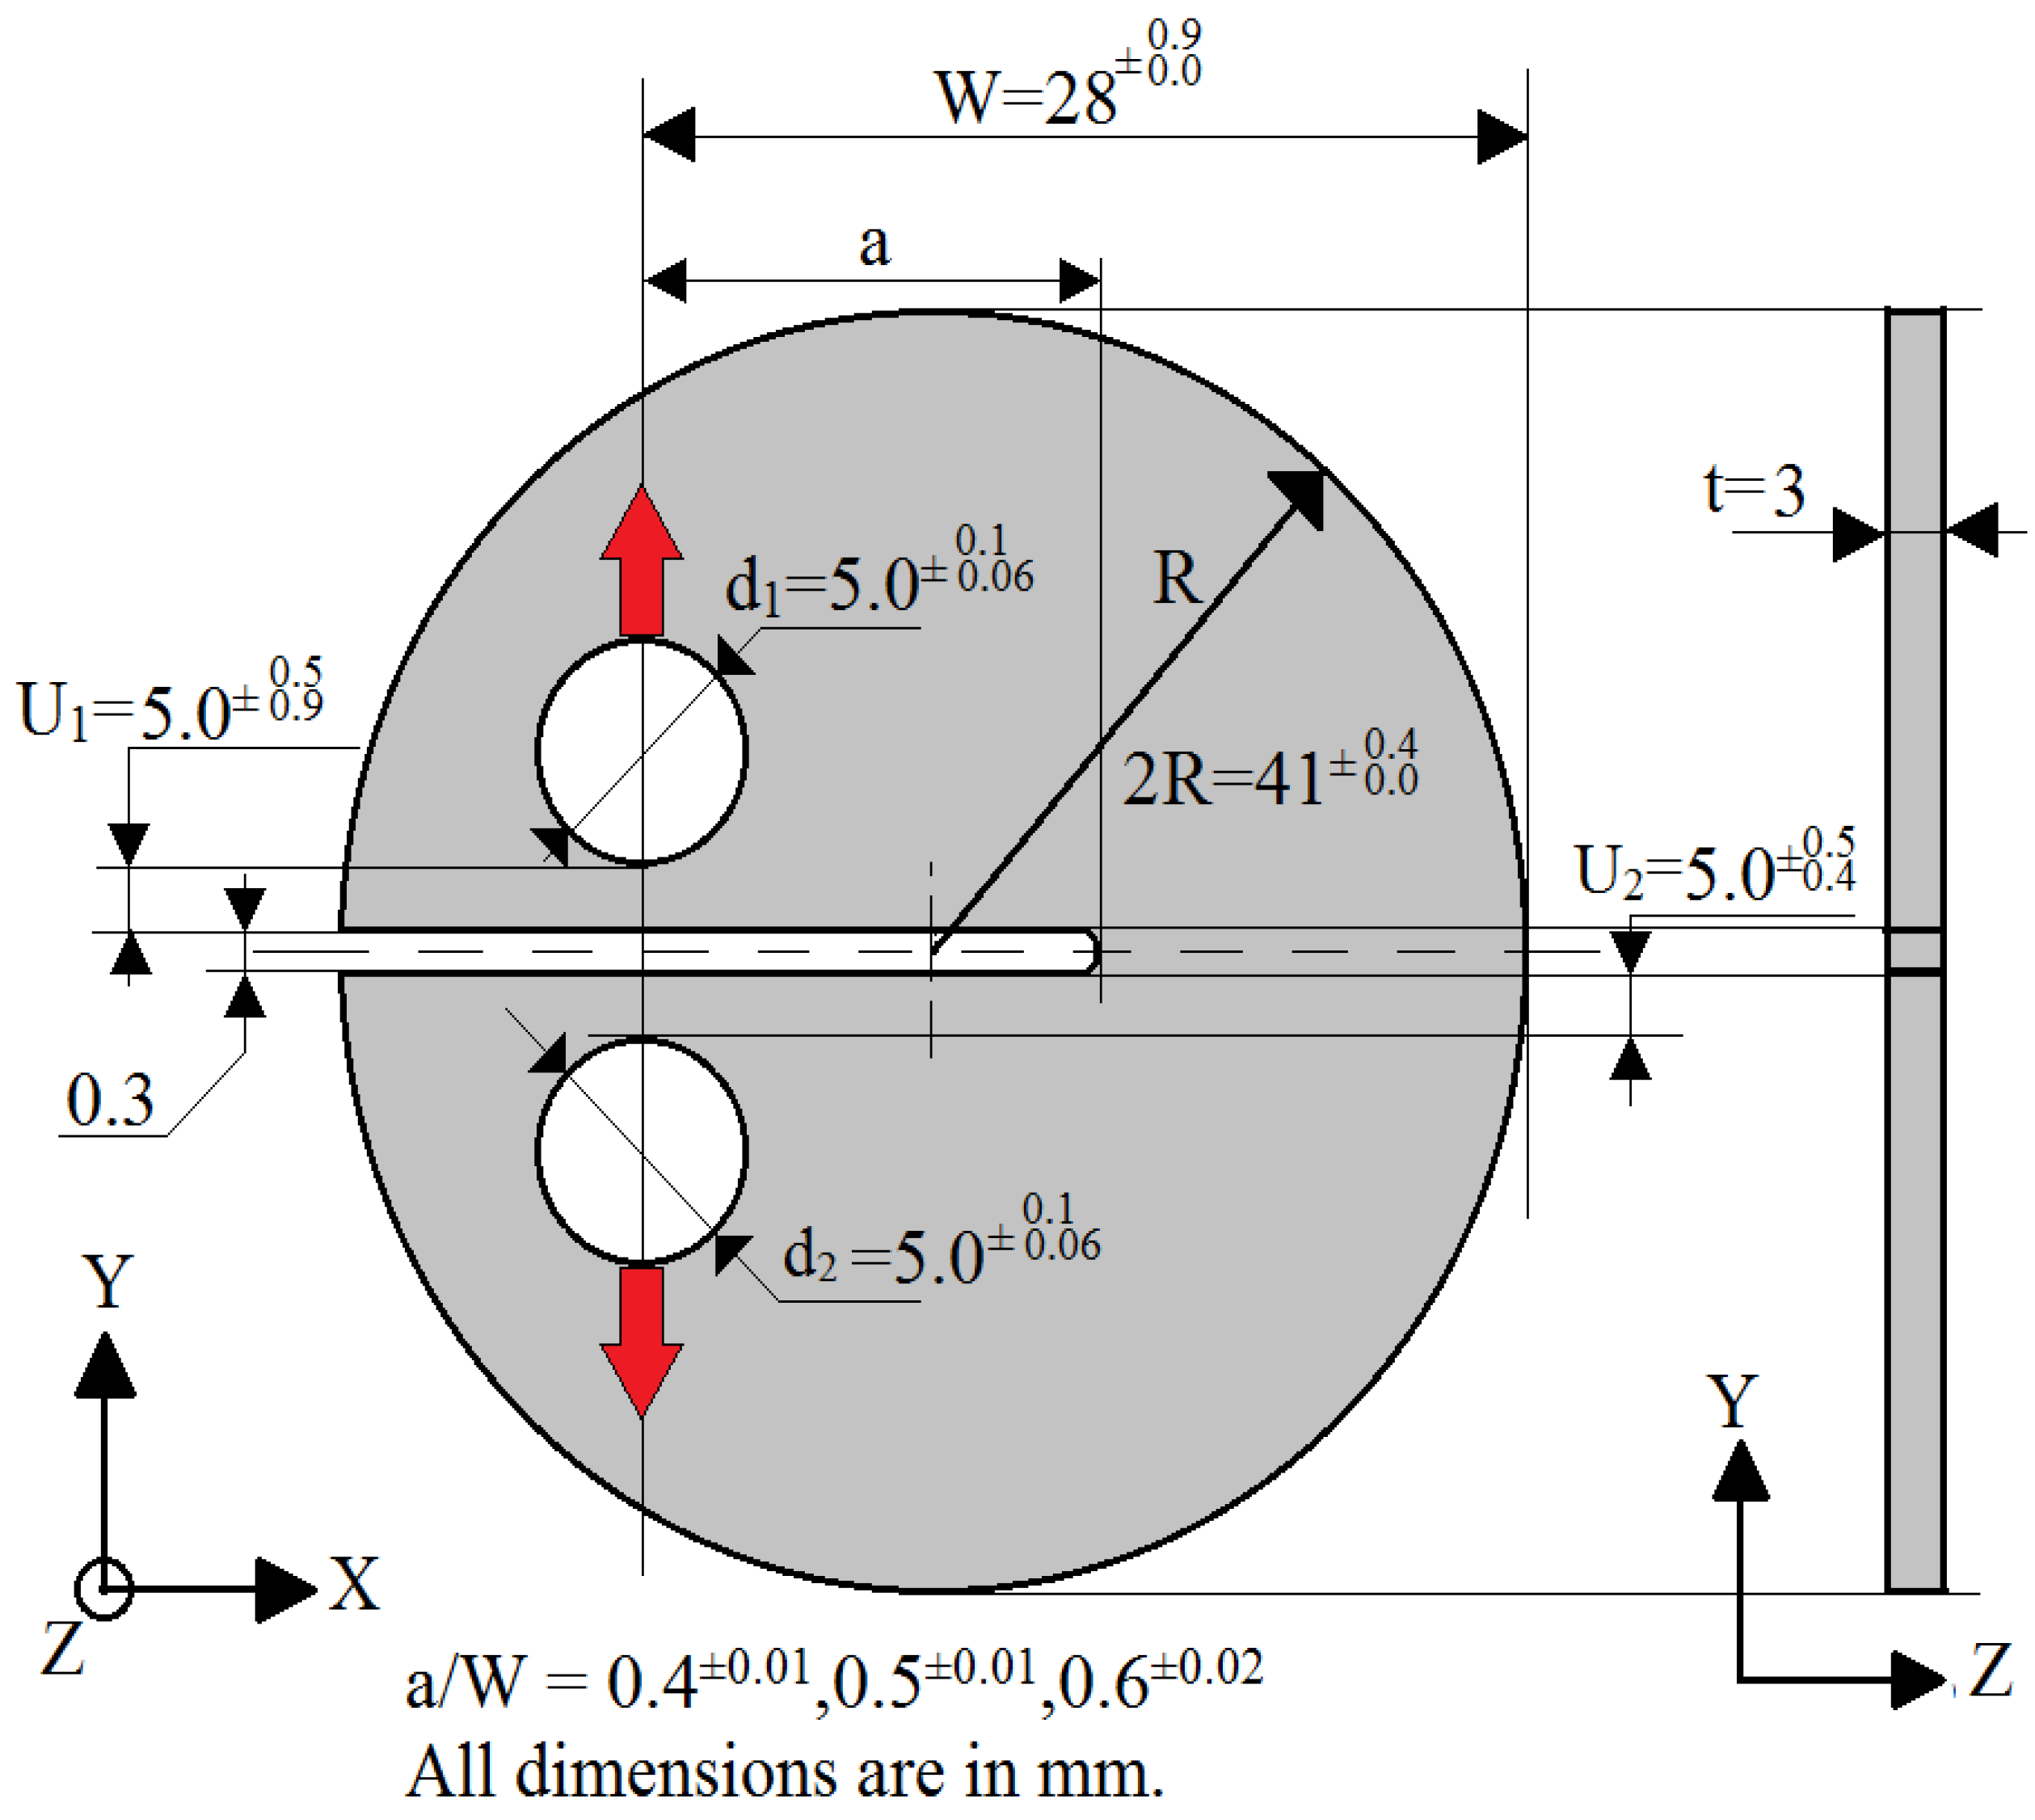
For evaluating fracture resistance of aluminium alloy, disc shaped specimens of 41 mm diameter and 3 mm thickness were machined from aluminium alloy cylindrical blocks (which are usually used for fabrication of fuel clad of research reactors). The geometrical dimensions of the specimens are shown in
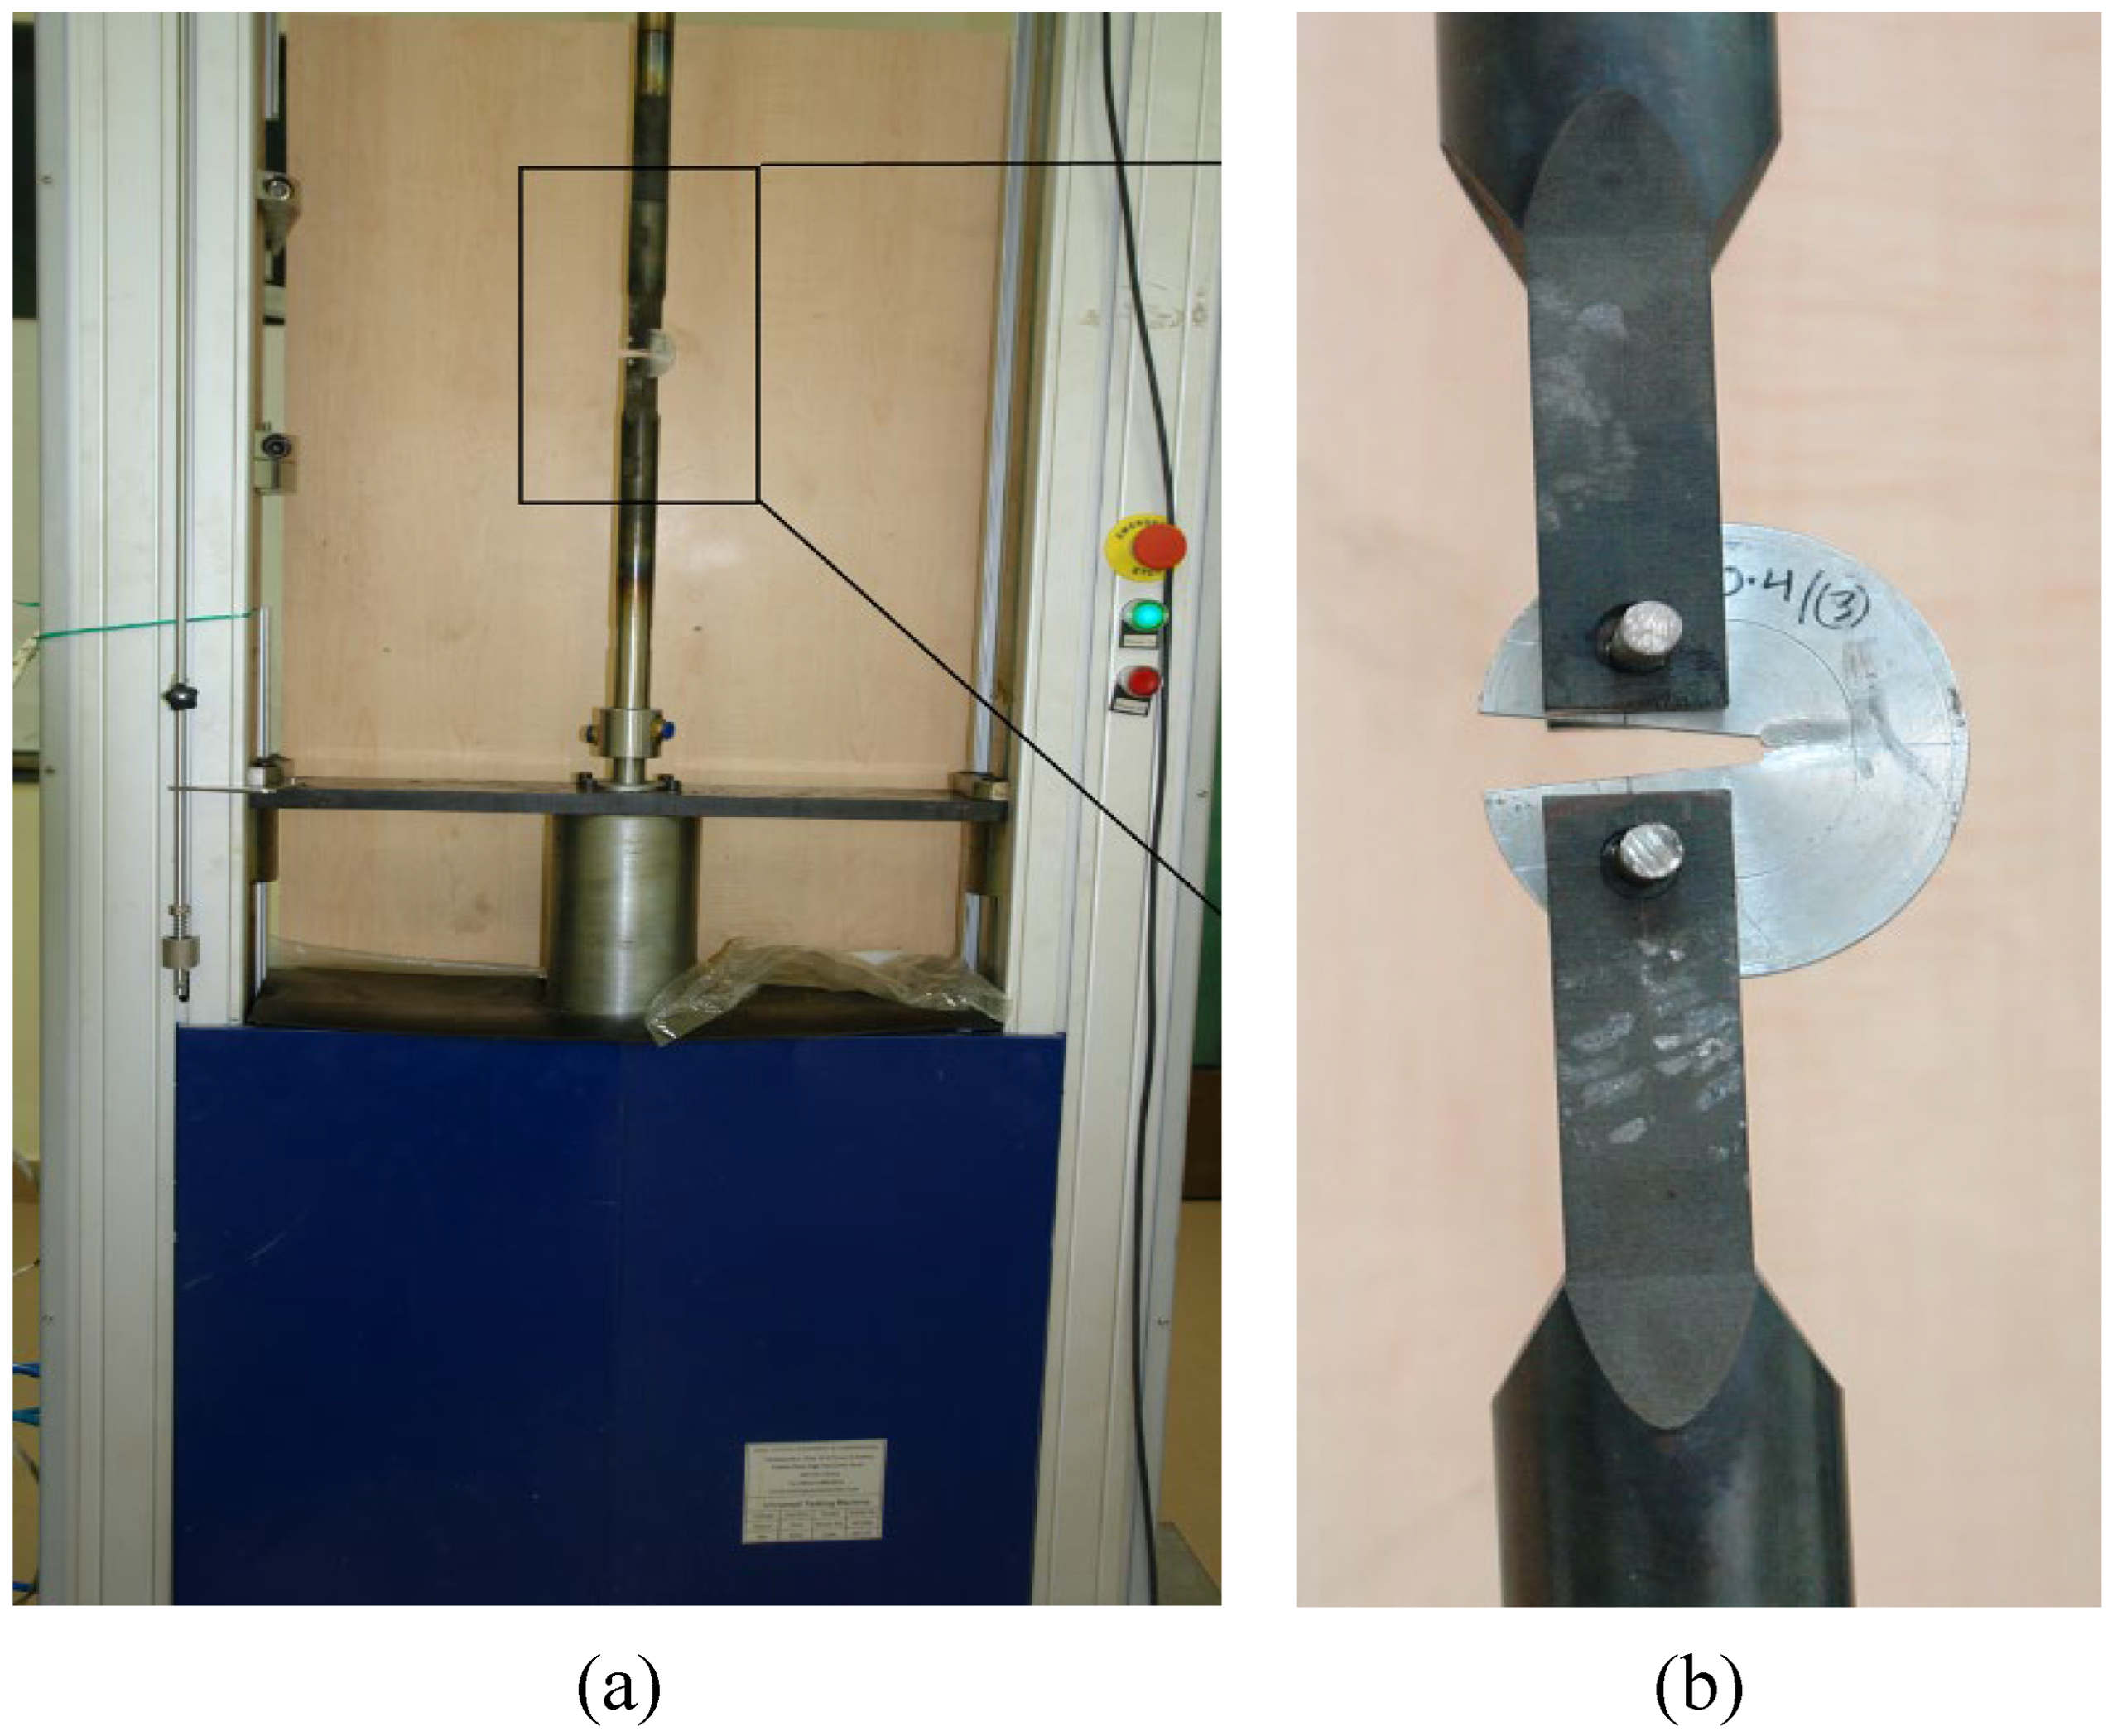
Figure 2. The specimen is loaded in fixtures for the fracture tests and the test setup is shown in
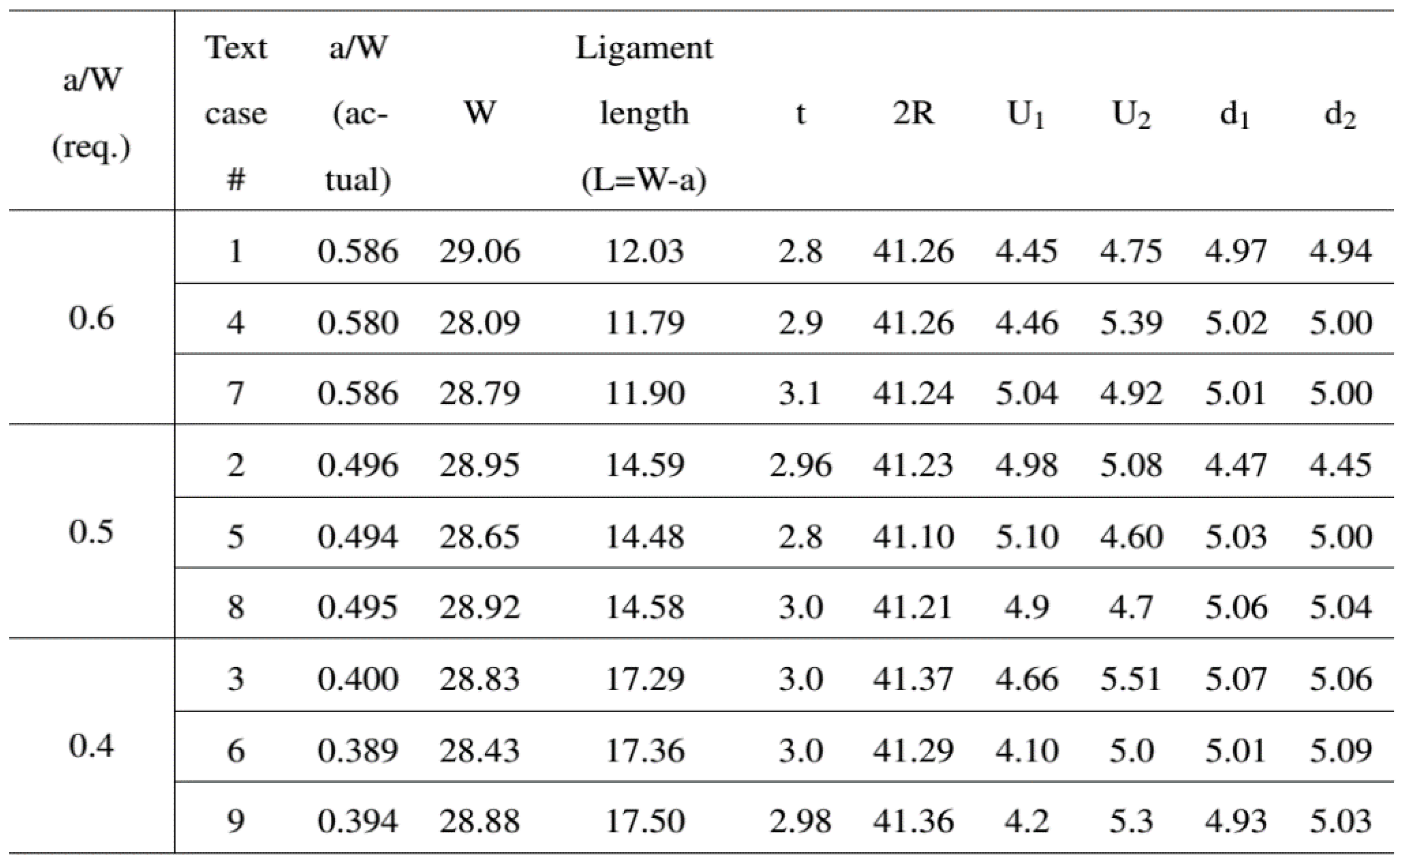
Figure 3. The exact dimensional details of the nine different disc-shaped specimens are shown in
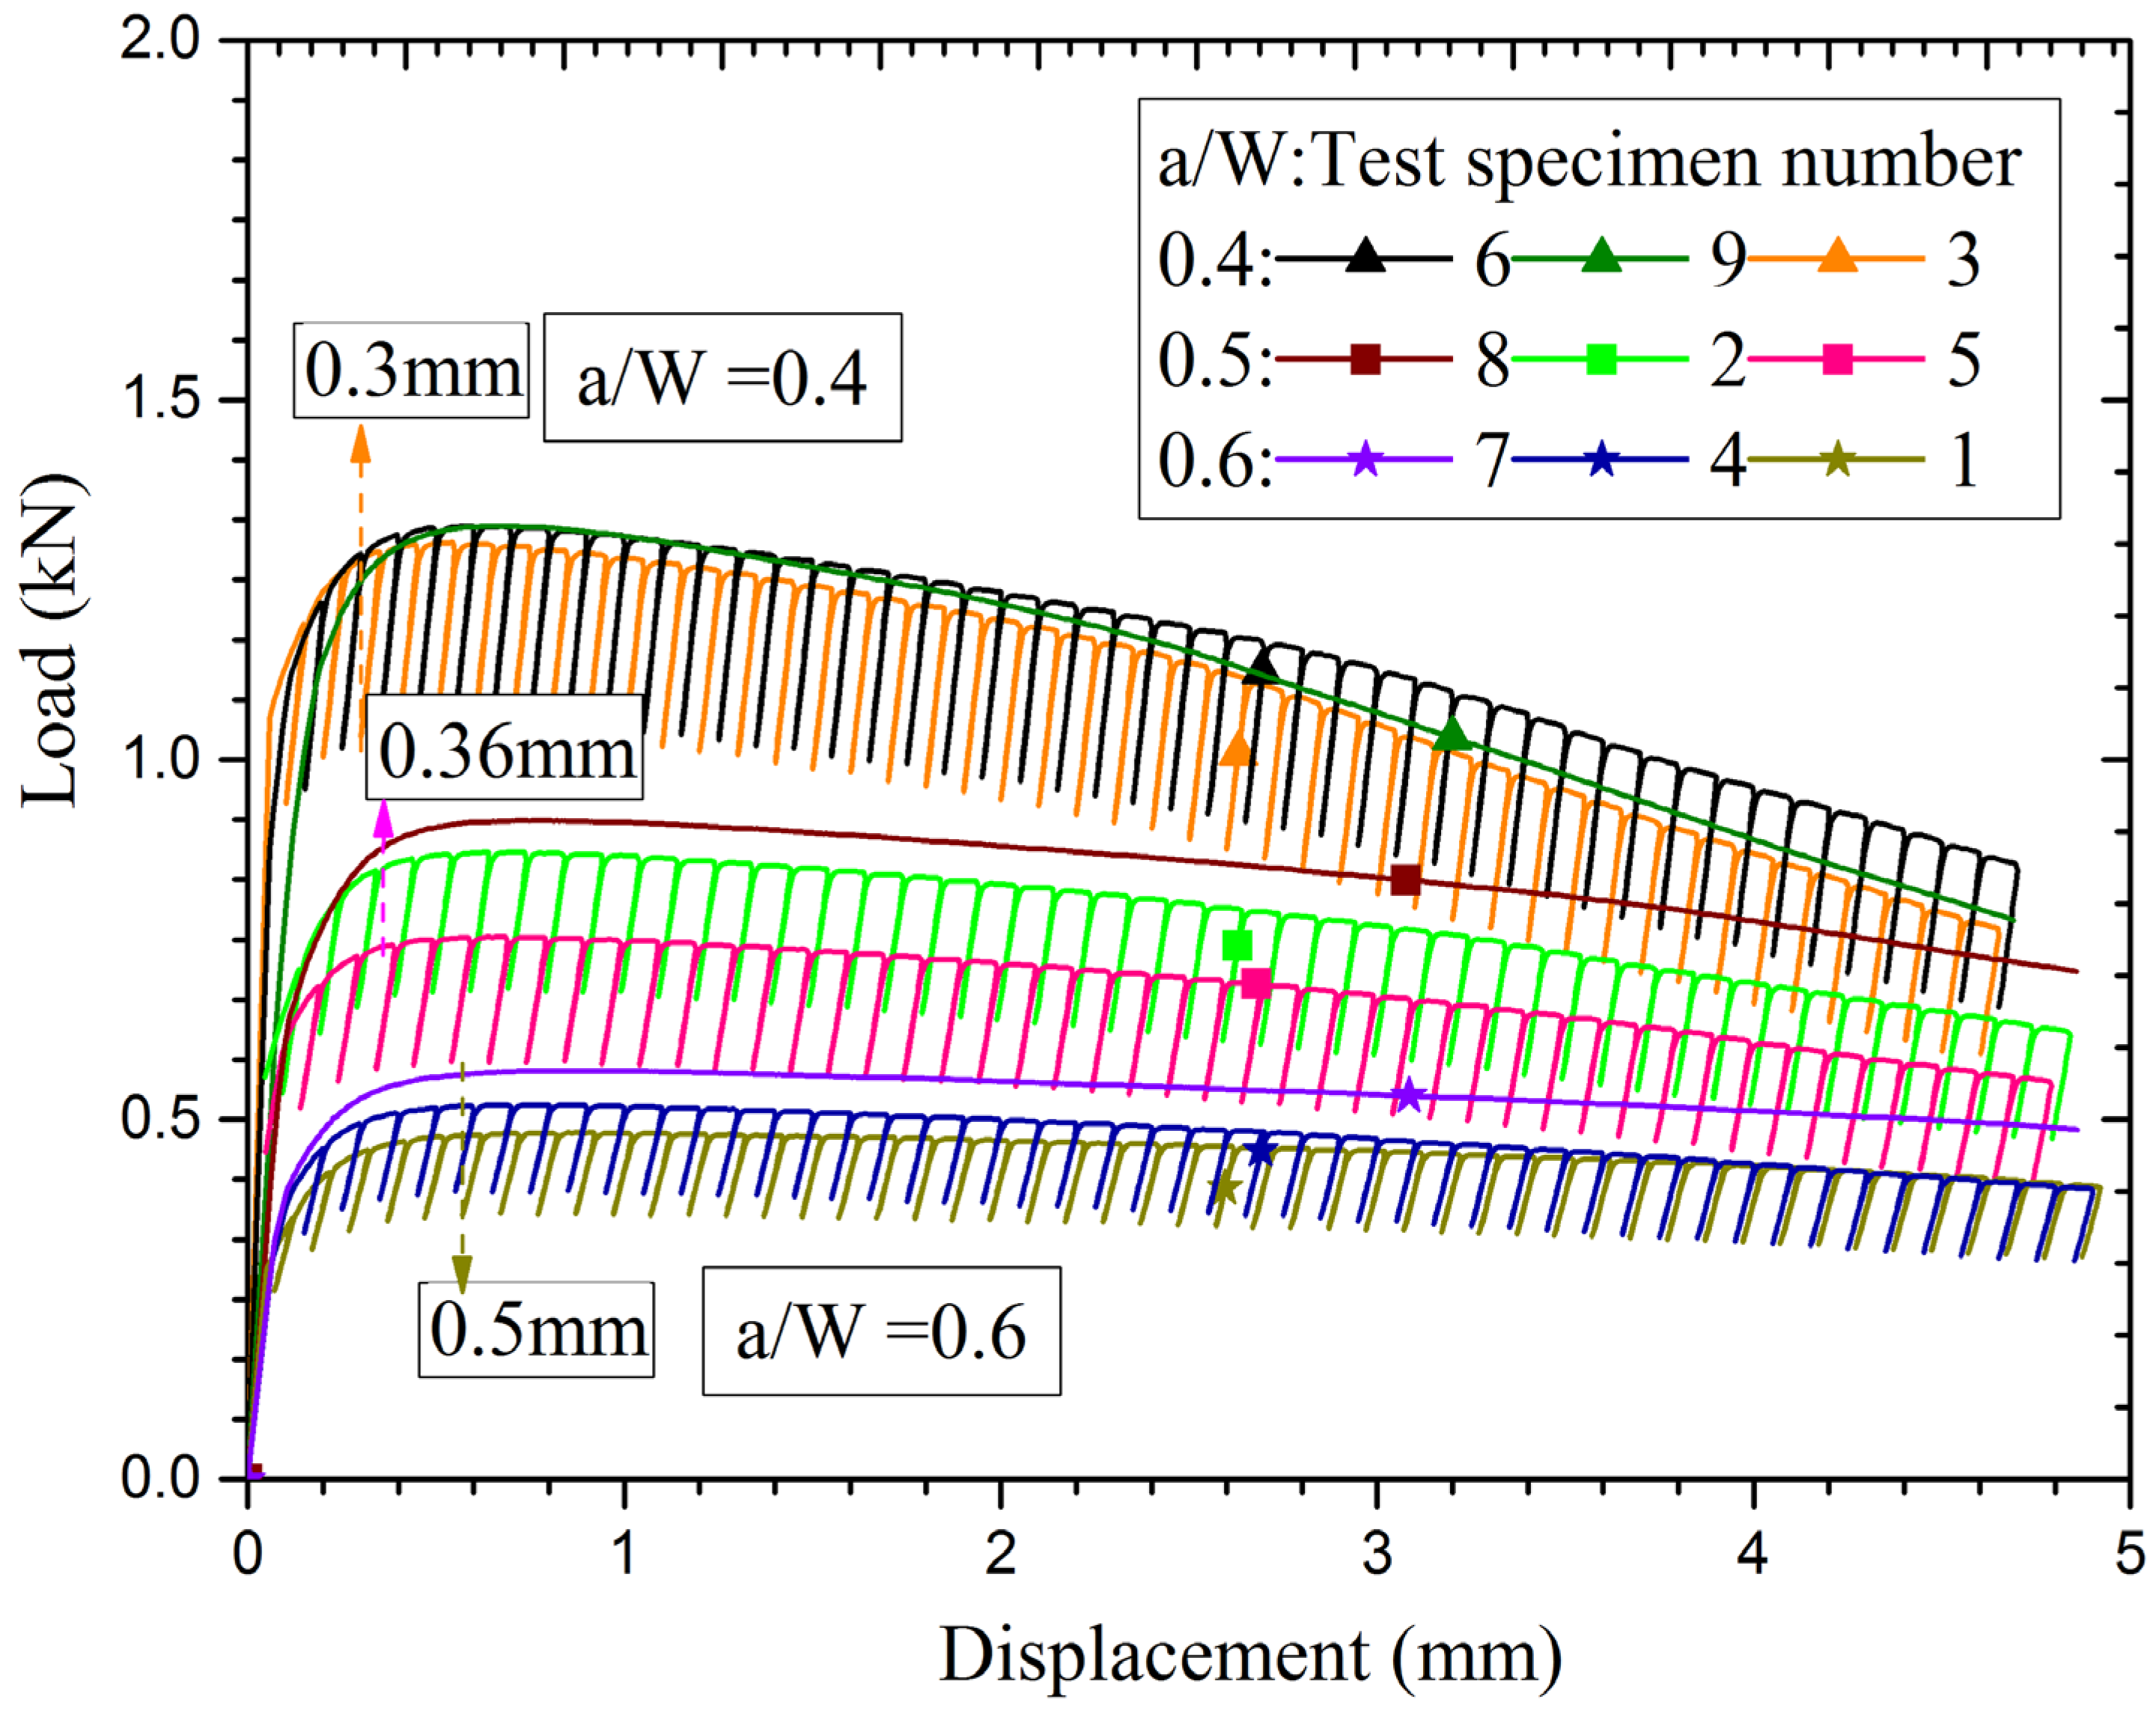
Table 3. These data have been obtained from measurement on the specimens after these are fabricated. The load-displacement data for all the nine specimens with different a/W ratios (0.4, 0.5 and 0.6 respectively) as obtained from experiments are shown in
Figure 4.
The repeated tests with a/W ratios 0.4, 0.5 and 0.6 are very close to each other except test no. 5. As expected, the load carrying capability of the specimens increases with decrease in a/W ratio, signifying more ligament to carry the load. However, the fracture resistance depends upon plastic deformation energy rate used for the crack growth as well as the rate of crack growth with loading which shall be reflected in the J-R curves.
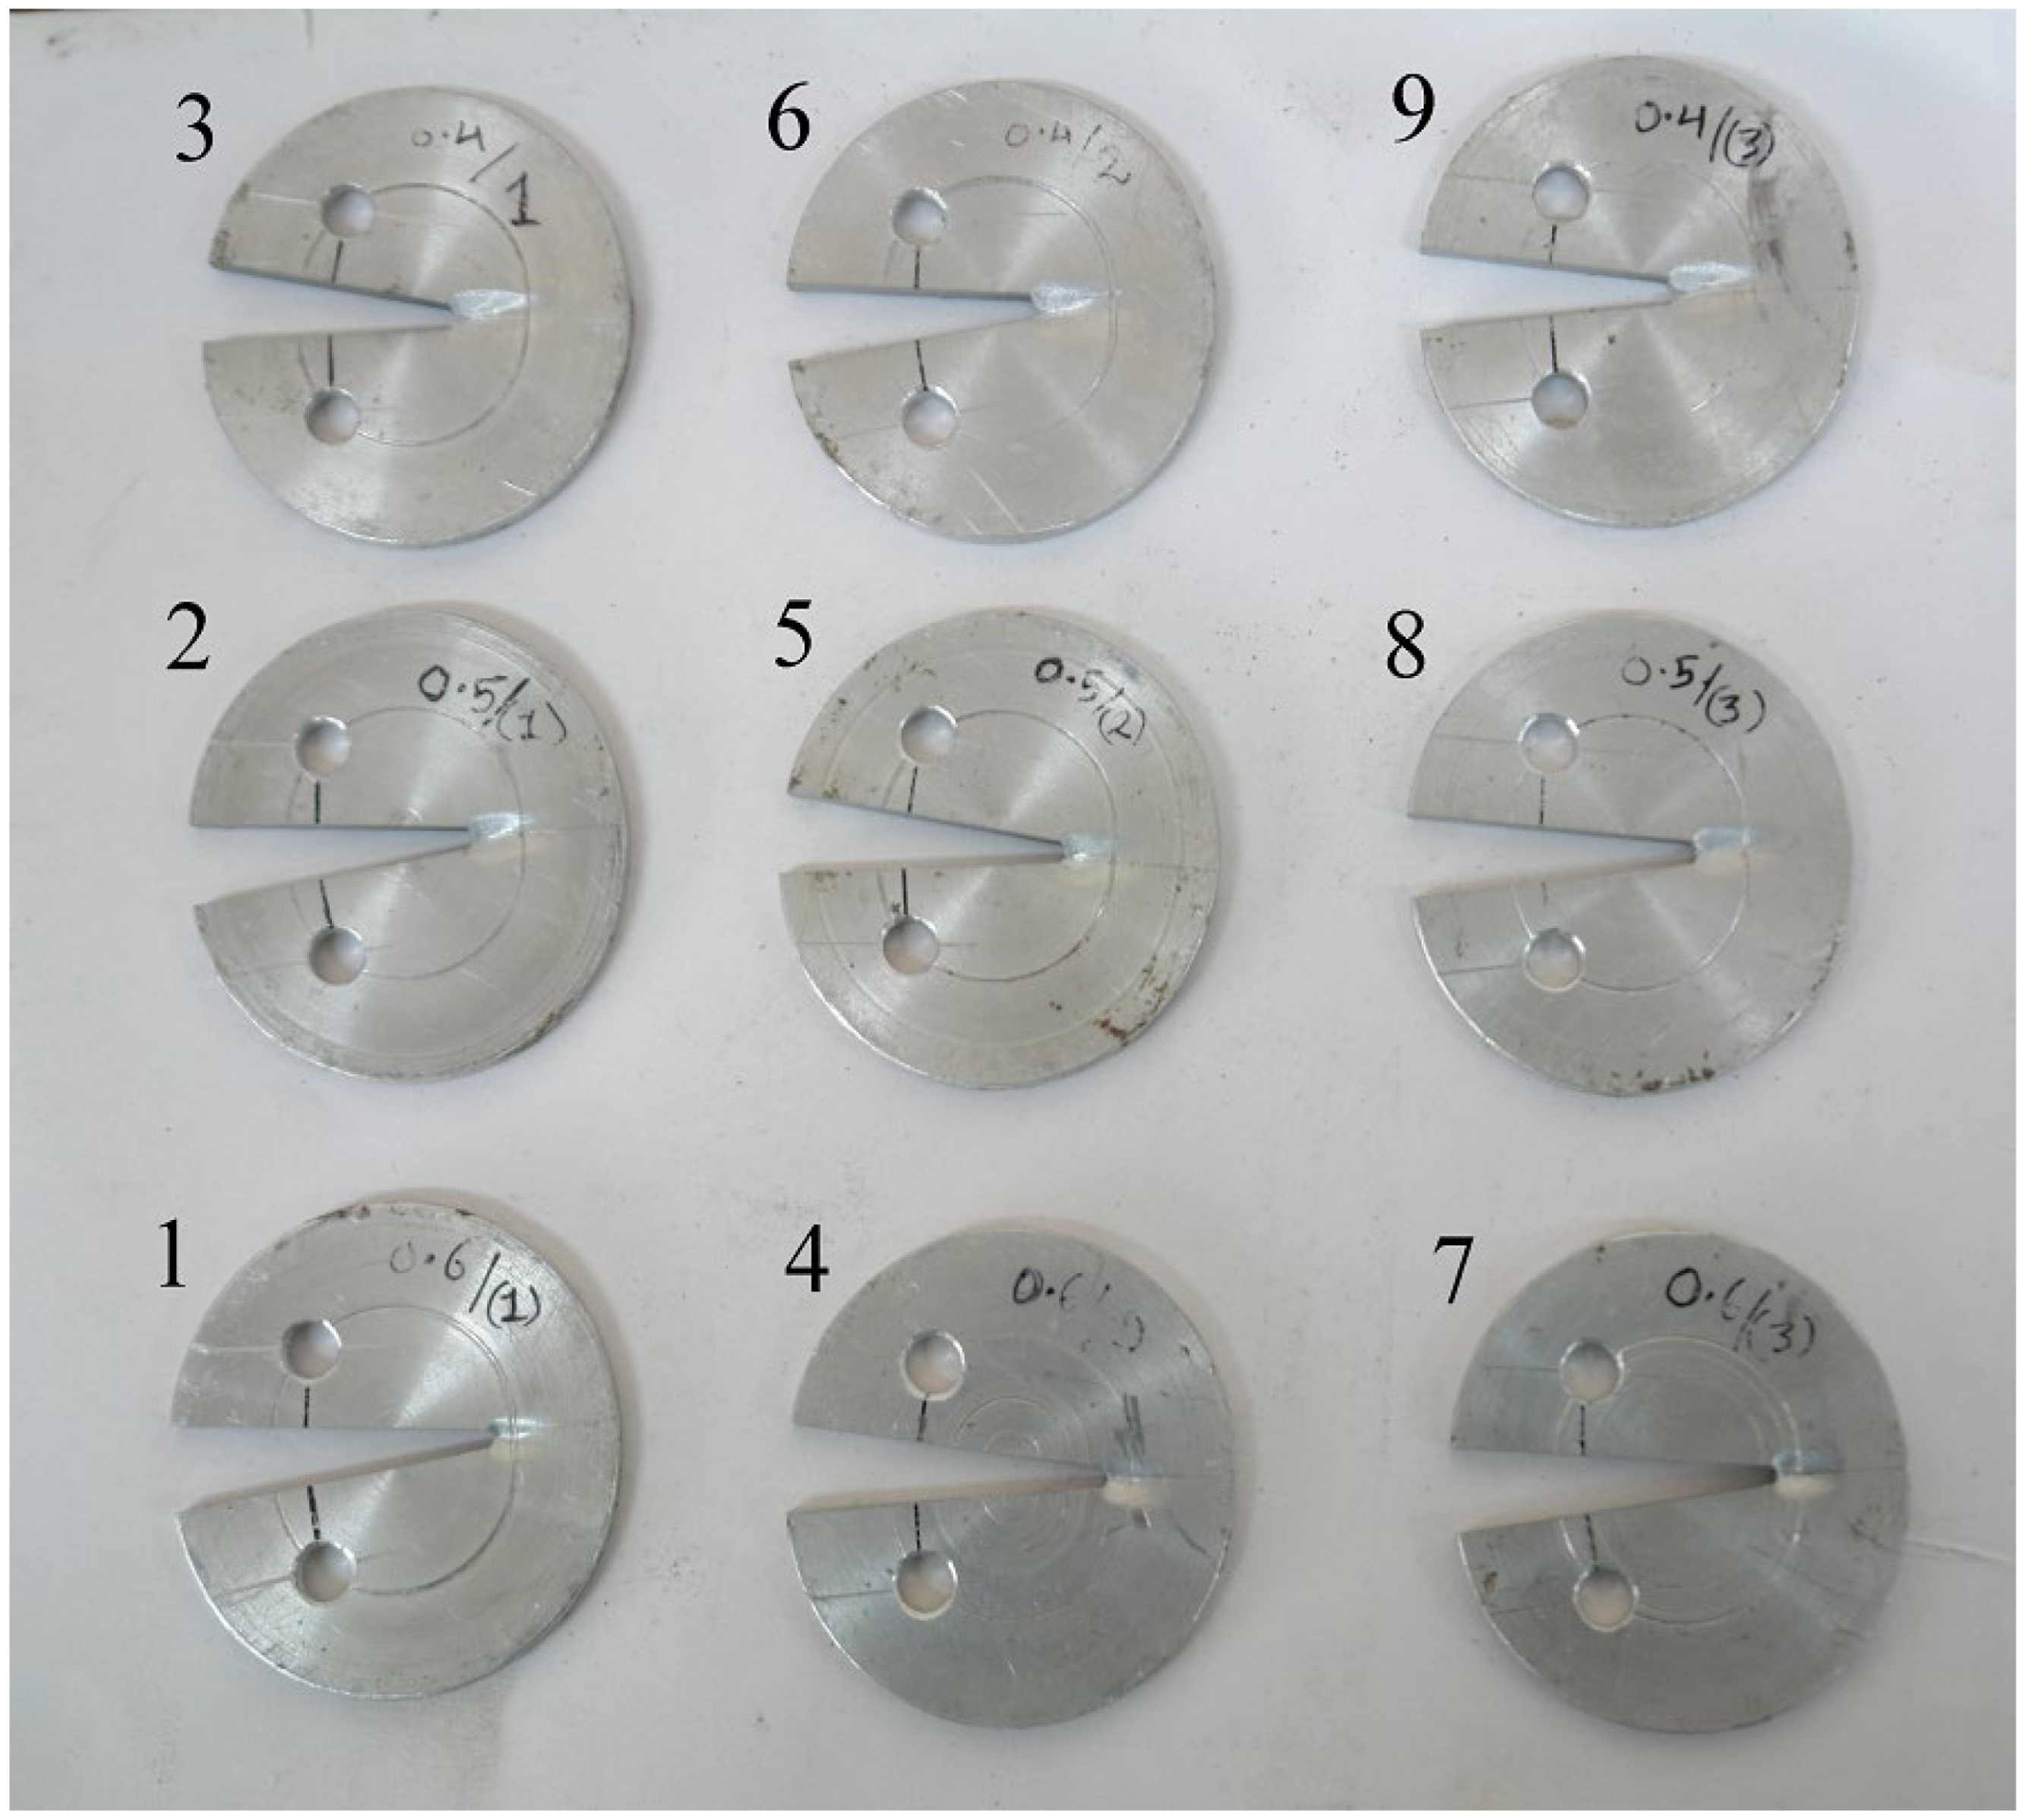
The photograph of the specimens after the test is shown in
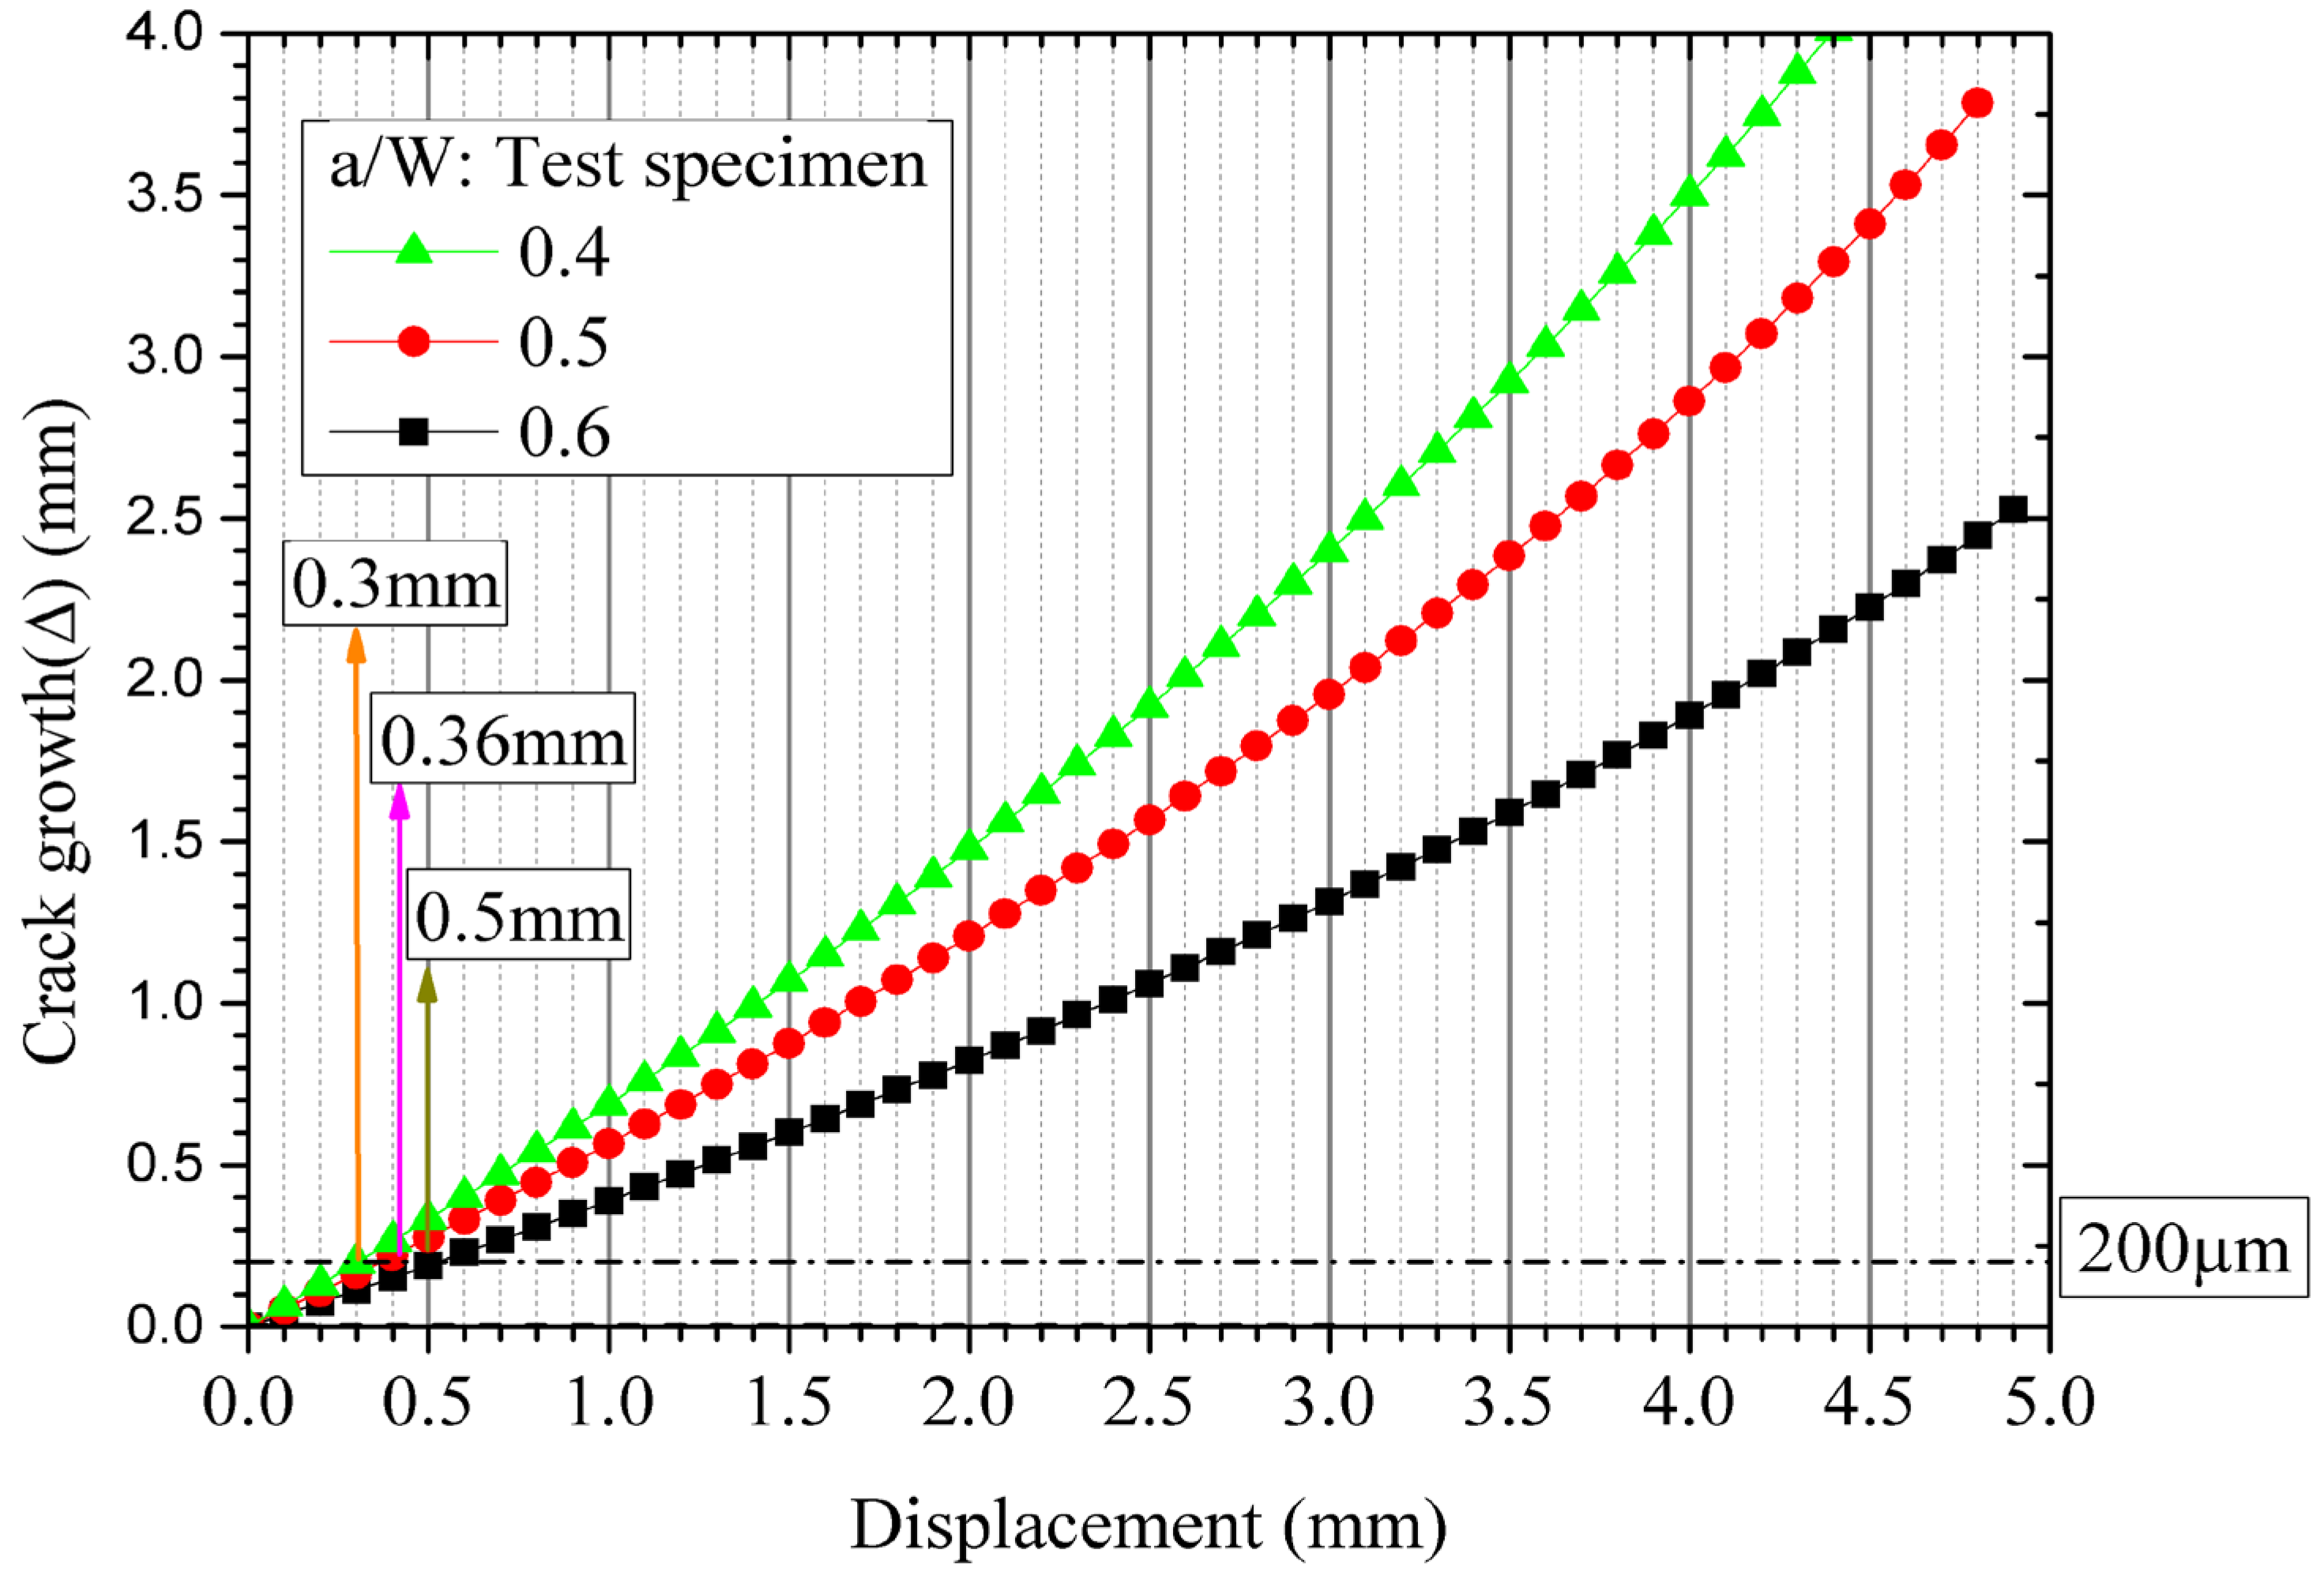
Figure 5. The crack growth in the specimens has been measured using unloading compliance technique and from these experimental data, the crack growth vs. displacement is plotted in
Figure 6 for specimens with different a/W ratios.
It was observed that crack growth is higher for the specimen with low a/W ratio compared to the other specimens with higher a/W ratio for a given value of applied displacement. For crack initiation, a crack growth of 200 micron is usually considered and corresponding to this data of crack growth, the applied displacements are 0.3, 0.36 and 0.5 mm respectively for specimens with a/W ratios of 0.4, 0.5 and 0.6 as can be seen from
Figure 6.
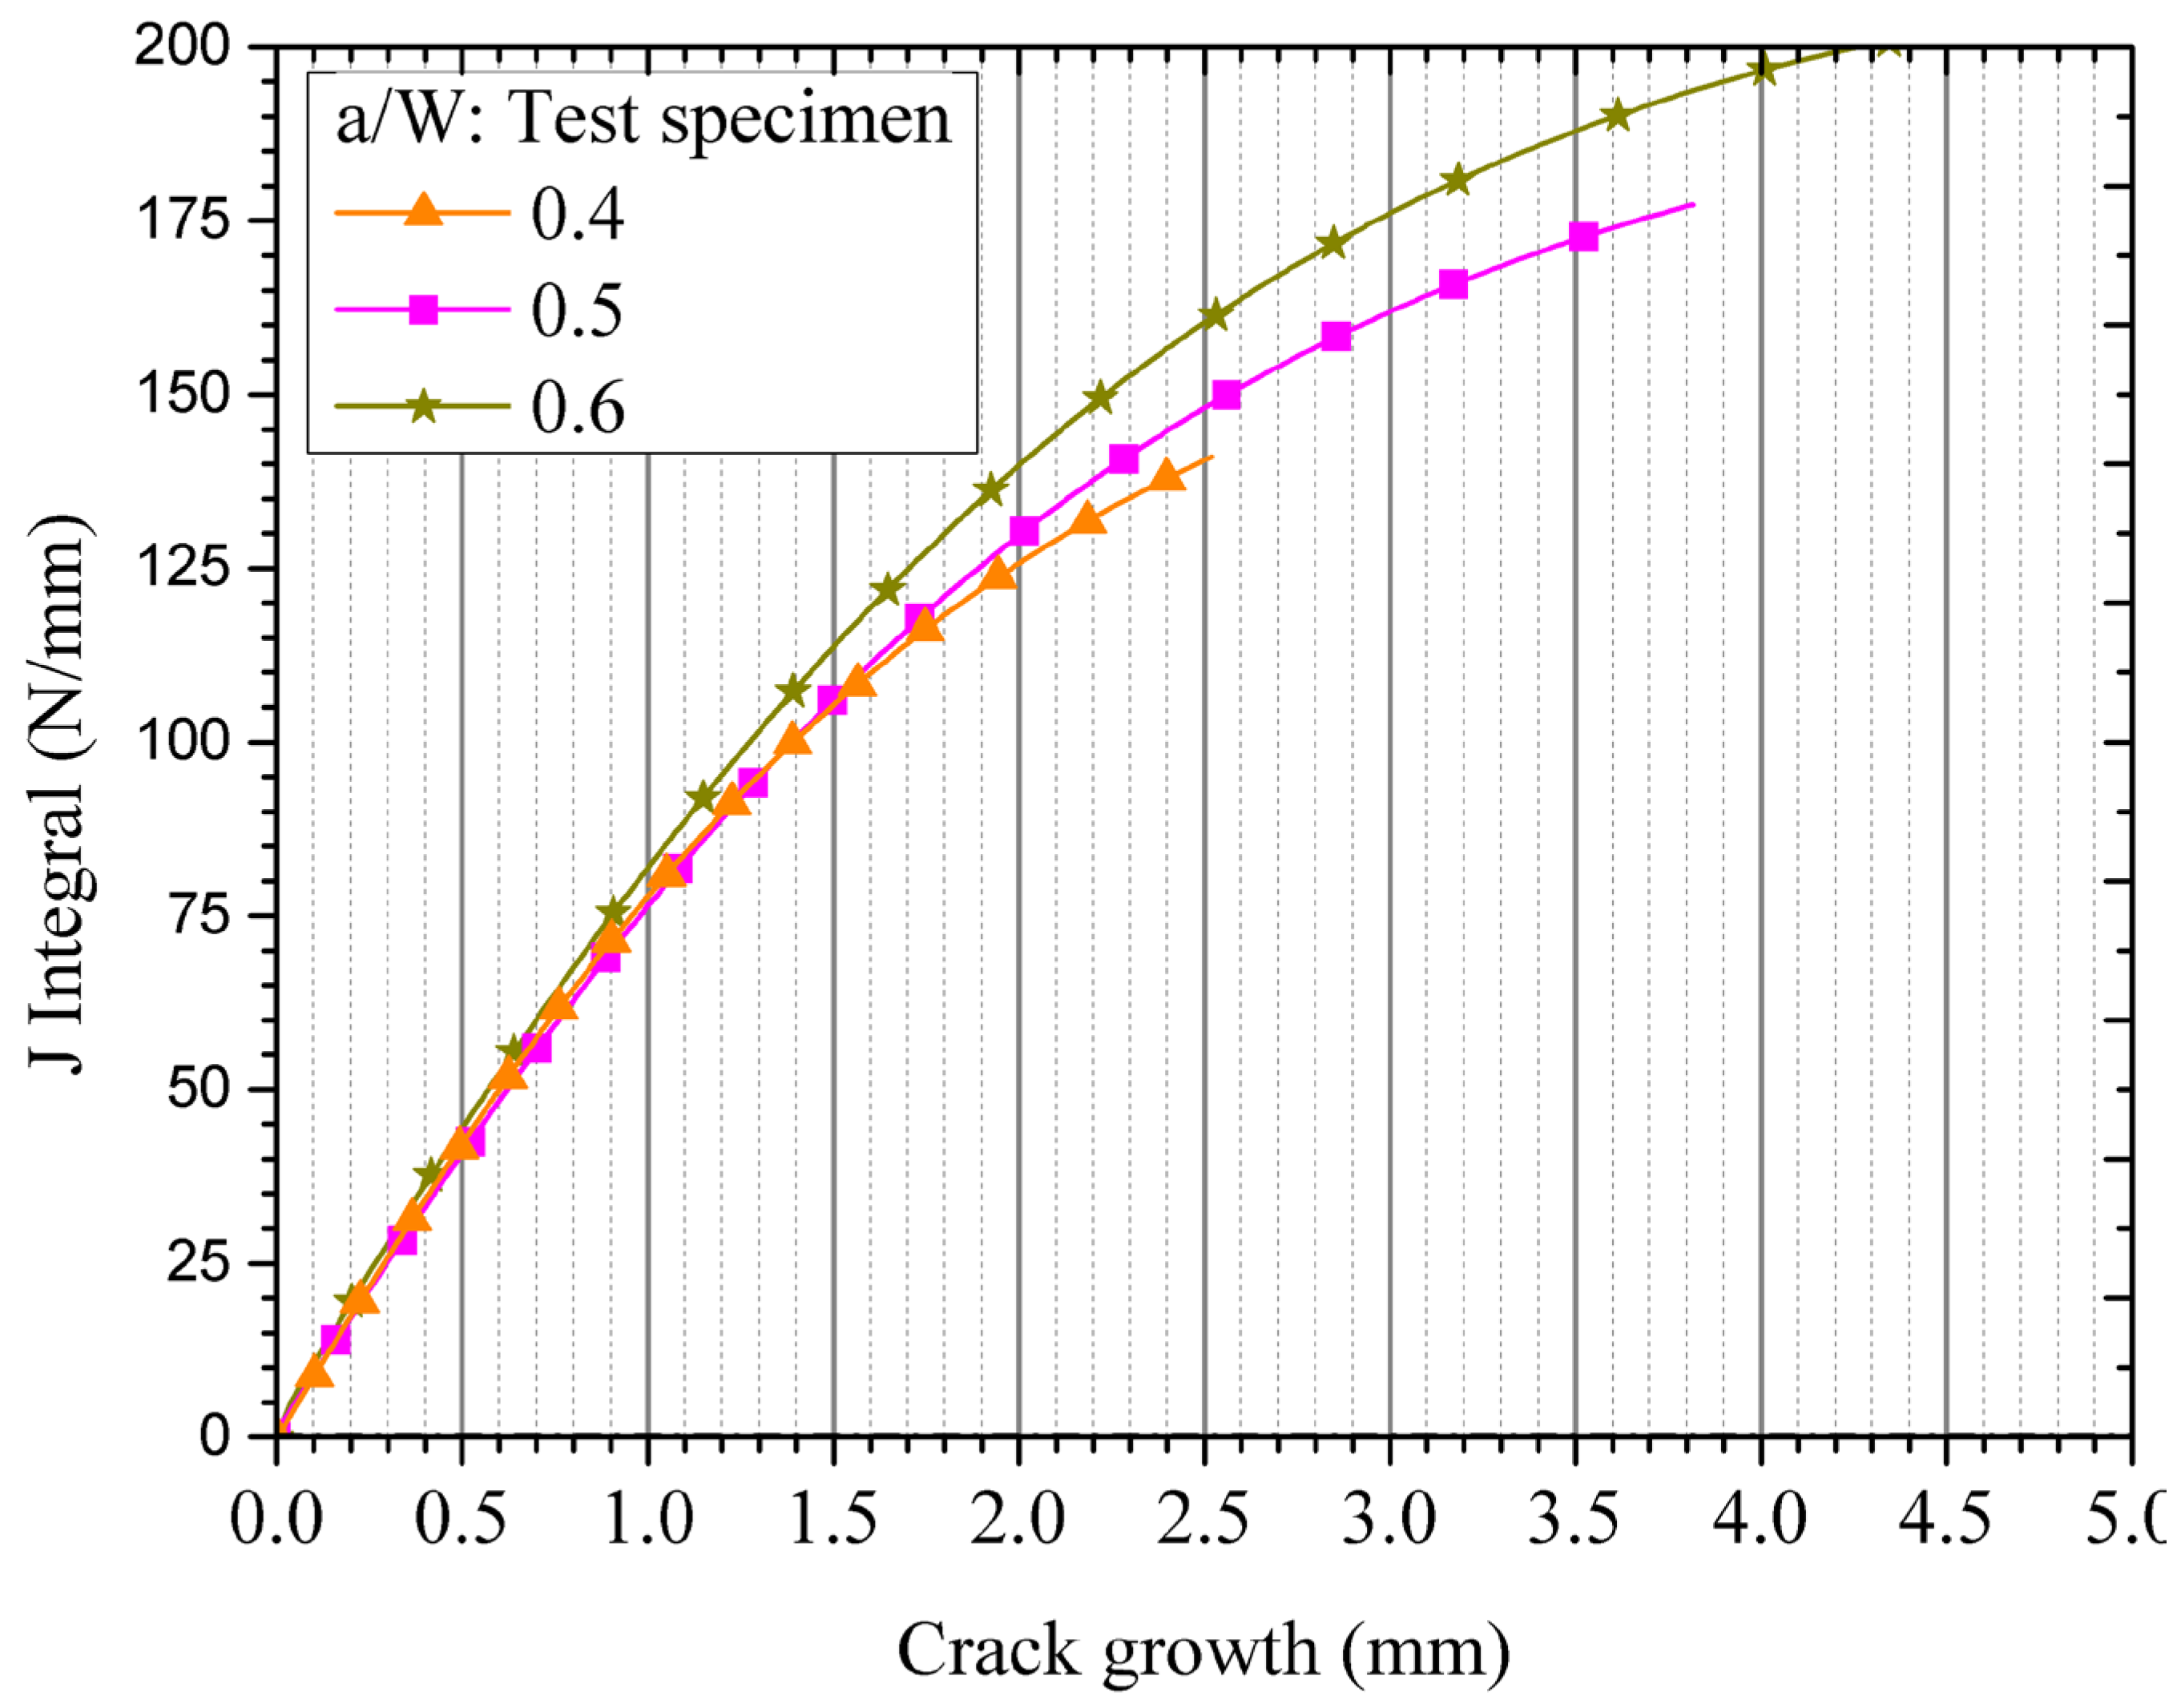
The load-displacement data along with the information on crack growth vs. displacement has been used to calculate the fracture resistance of the specimens in terms of J-R curve. The J-R curves of disc-shaped compact tension specimens for different a/W ratios are shown in
Figure 7. It can be observed that the J-R curves of the specimens with a/W ratios varying from 0.4 to 0.6 are almost constant and these results are also consistent with ASTM specifications where the initial a/W ratio is specified in the range of 0.45 to 0.55.
4. Crystal Plasticity Based Constitutive Model Used in the Numerical Simulation
Crystal plasticity simulations consider the material plastic deformation at the grain scale where deformation behaviour of single crystal as well as polycrystalline materials can be considered. In this work, the FE simulations have been carried out using an in-house finite element based code CRYSP. The calculation of all the constitutive state variables are carried out at a material point except the geometrically necessary dislocation density
which is a nonlocal parameter and depends upon the gradient of the product
, where
is the plastic part of the deformation gradient
. The deformation gradient is written as a product of elastic and plastic parts (i.e.,
and
). The plastic velocity gradient
is calculated as summation of contribution of each slip system (the contributions being the product of shear rate
in each slip system and Schmidt’s tensor
), i.e.,
and the plastic deformation gradient is updated based on
the plastic shear accumulation in each slip system as follows.
The parameter
at each material point of integration of a finite element is extrapolated to the nodes of that element and in this way, the local variable are converted into a nodal variable so that the nonlocal parameter can be evaluated at the material integration point in the next iteration step. The slip rate in terms of shear strain rate at slip system
can be written in terms of the following equations, i.e., Eqs. (3) to (6) respectively. The details can be found in Ref. [
11,
12].
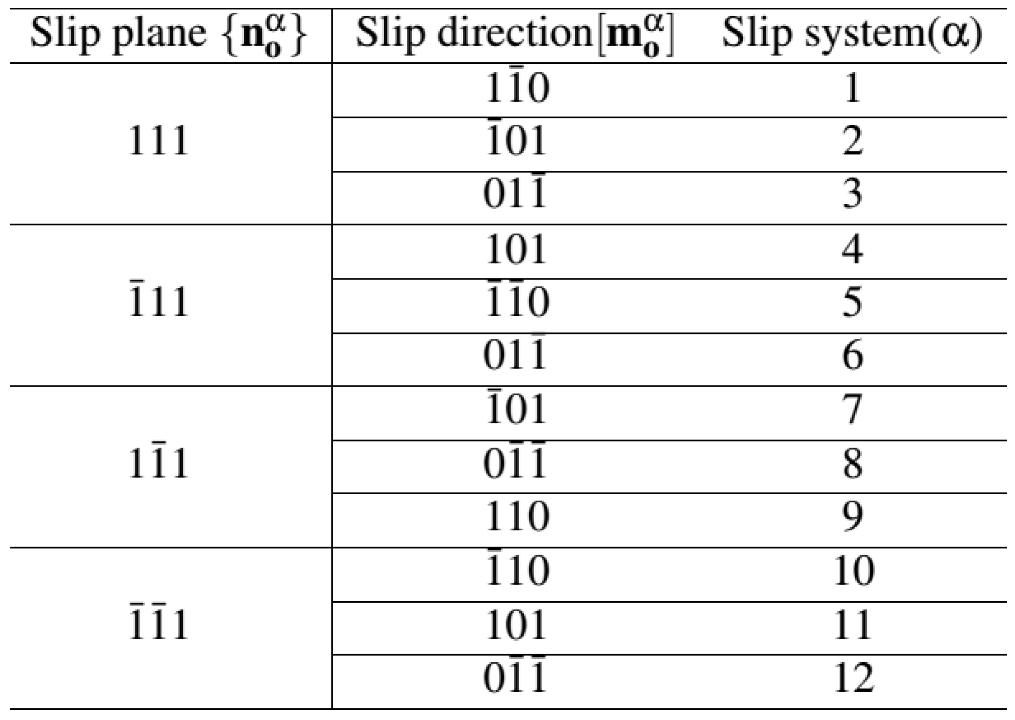
For the FCC materials like aluminium, there are 12 slip systems and the slip plane and slip directions are given by vectors as shown in
Table 1.
5. Evaluation of a Critical Damage Parameter to Predict Crack Initiation
The information of displacement value at crack initiation (
Figure 6) and its variation with a/W ratio along with the load-displacement data has been used in the FE analysis to derive a critical damage parameter for this material. This damage parameter is a material constant for this aluminium alloy and it is shown in later sections that it is transferable across specimens with different geometrical dimensions with reasonable accuracy and hence, it can used to predict crack initiation in components subjected to different types of loading conditions.
In Eq. (7), A is a constant whose value is 0.283, is the mean hydrostatic stress,
is the von Mises equivalent stress and
is the von Mises equivalent plastic strain. This equation is integrated till the crack initiation displacement as given in
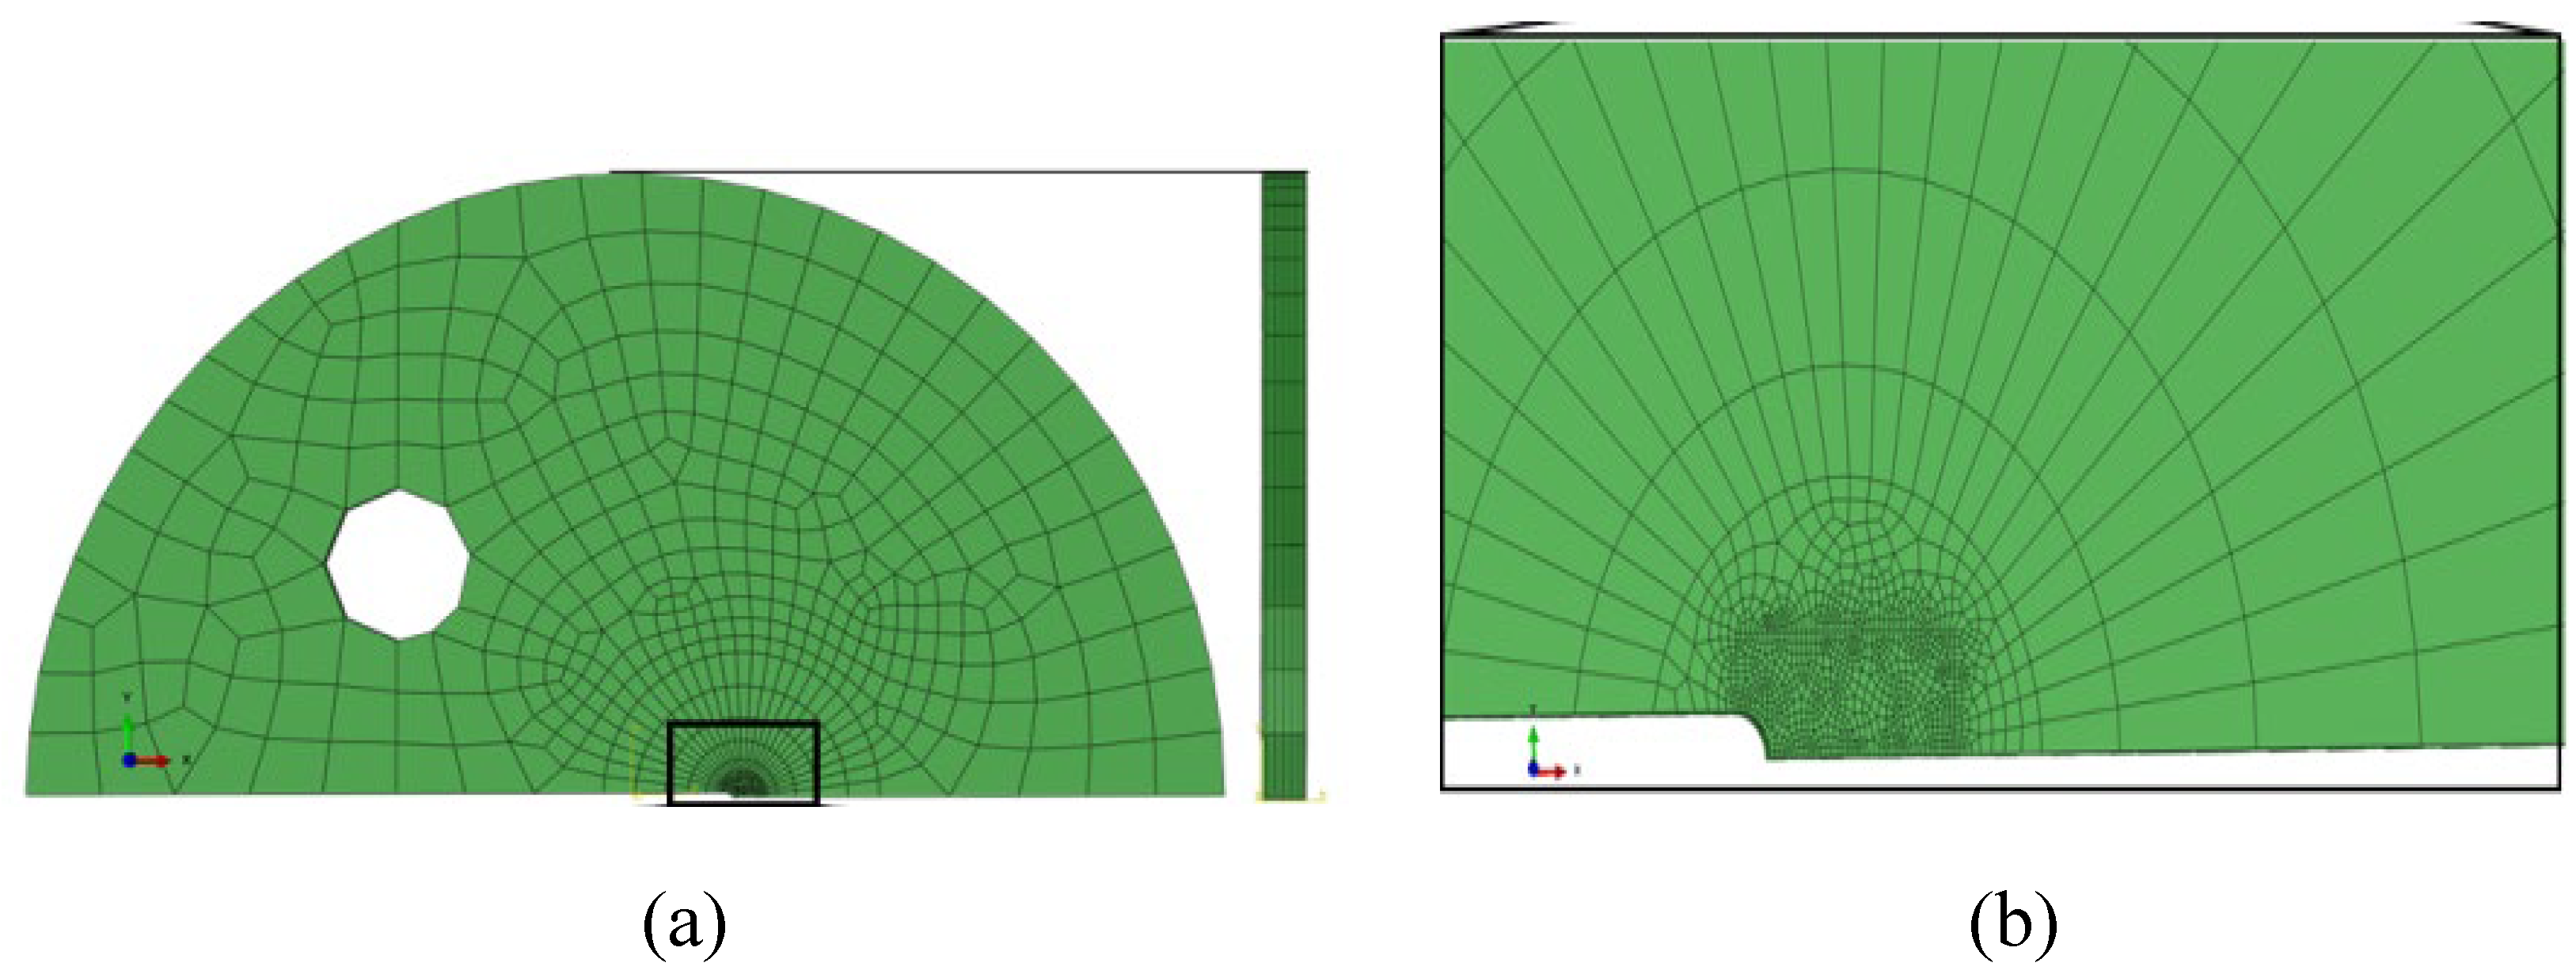
Figure 6. The front view of finite element mesh used for FE simulation is shown
Figure 8a along with the enlarged view near the crack-tip in
Figure 8b. The 3D FE analysis has been carried out using 3D isoparametric 8-noded brick elements with appropriate symmetric boundary conditions. The details of slip systems for the FCC aluminium as used in the crystal plasticity simulation are presented in
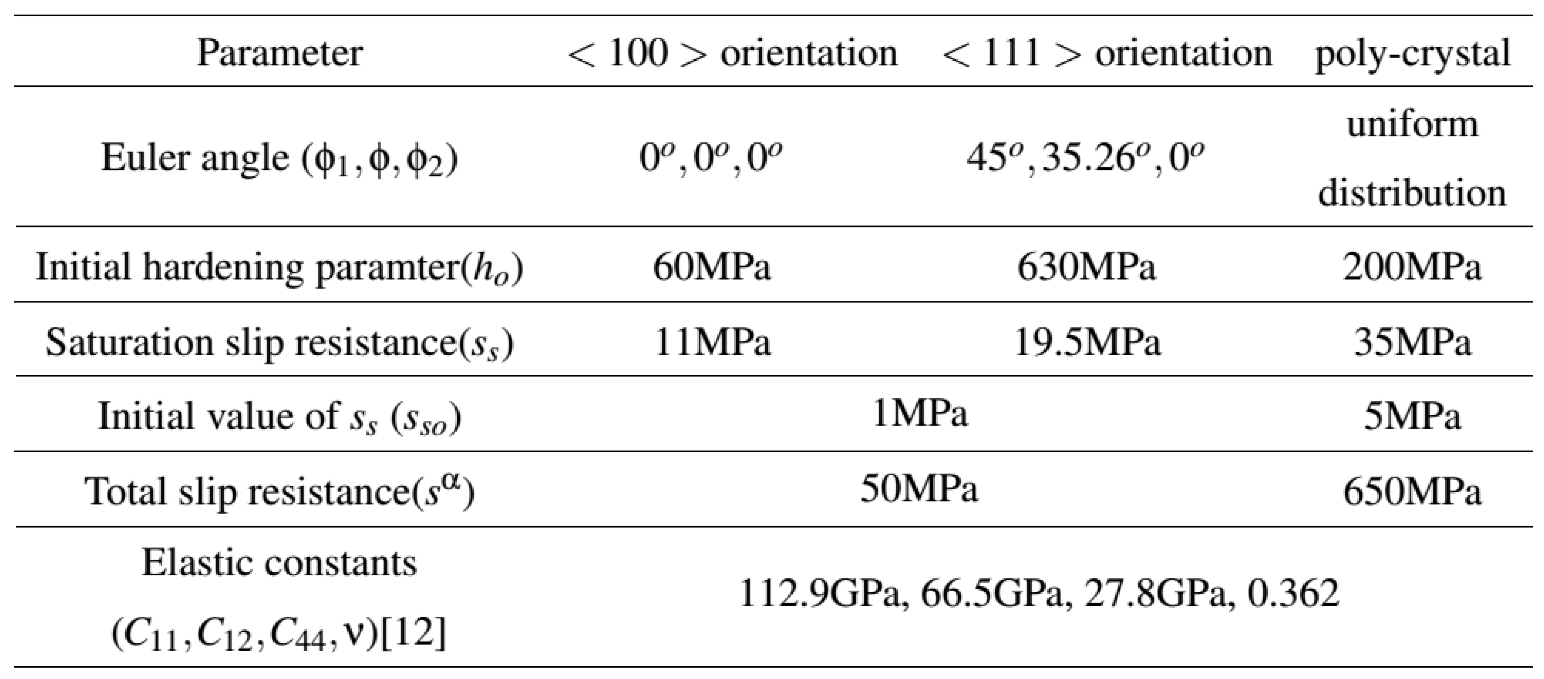
Table 4. The material properties used in crystal plasticity based FE simulations are shown in
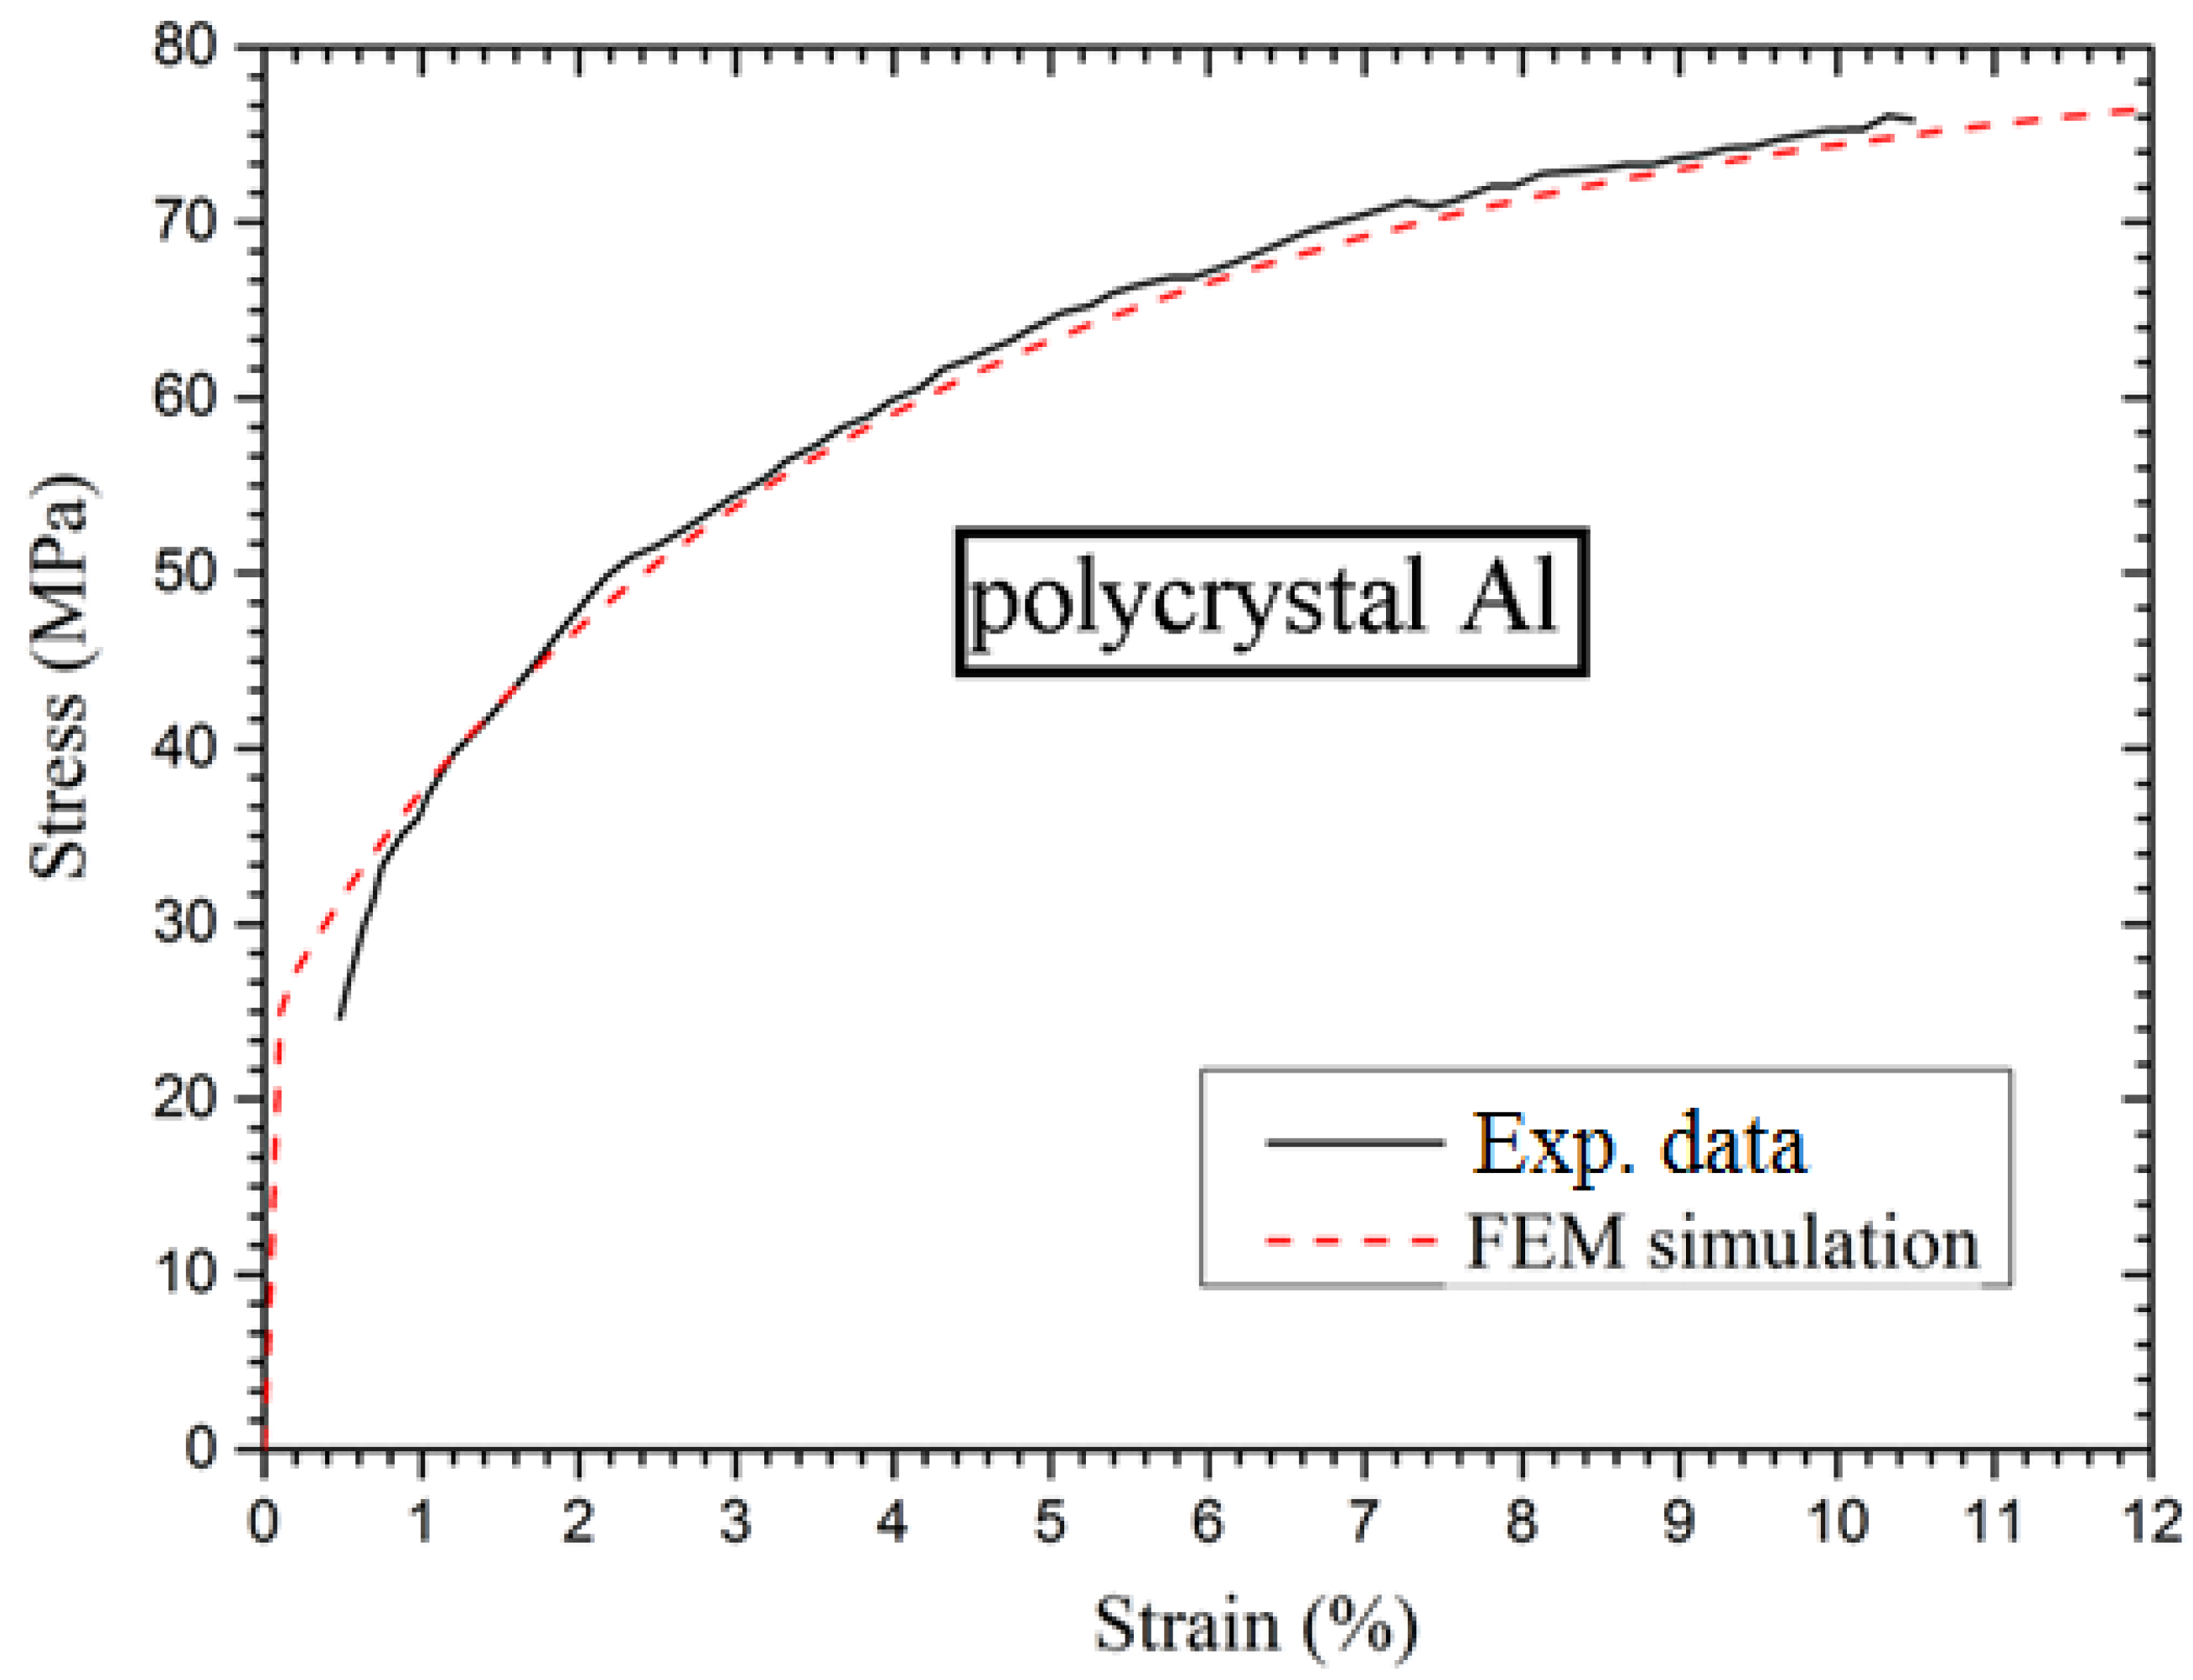
Table 5. These material parameters of the crystal plasticity model are used to simulate the material stress-strain curve using the simulation of a tensile specimen. The results of analysis are shown in
Figure 9 along with experimental data and it can be seen that the crystal plasticity model has been able to closely predict the tensile deformation behaviour and hence, these parameters can now be used to numerically simulate the load-displacement data of the disc-shaped CT specimens with various a/W ratios.
6. Results and Discussion
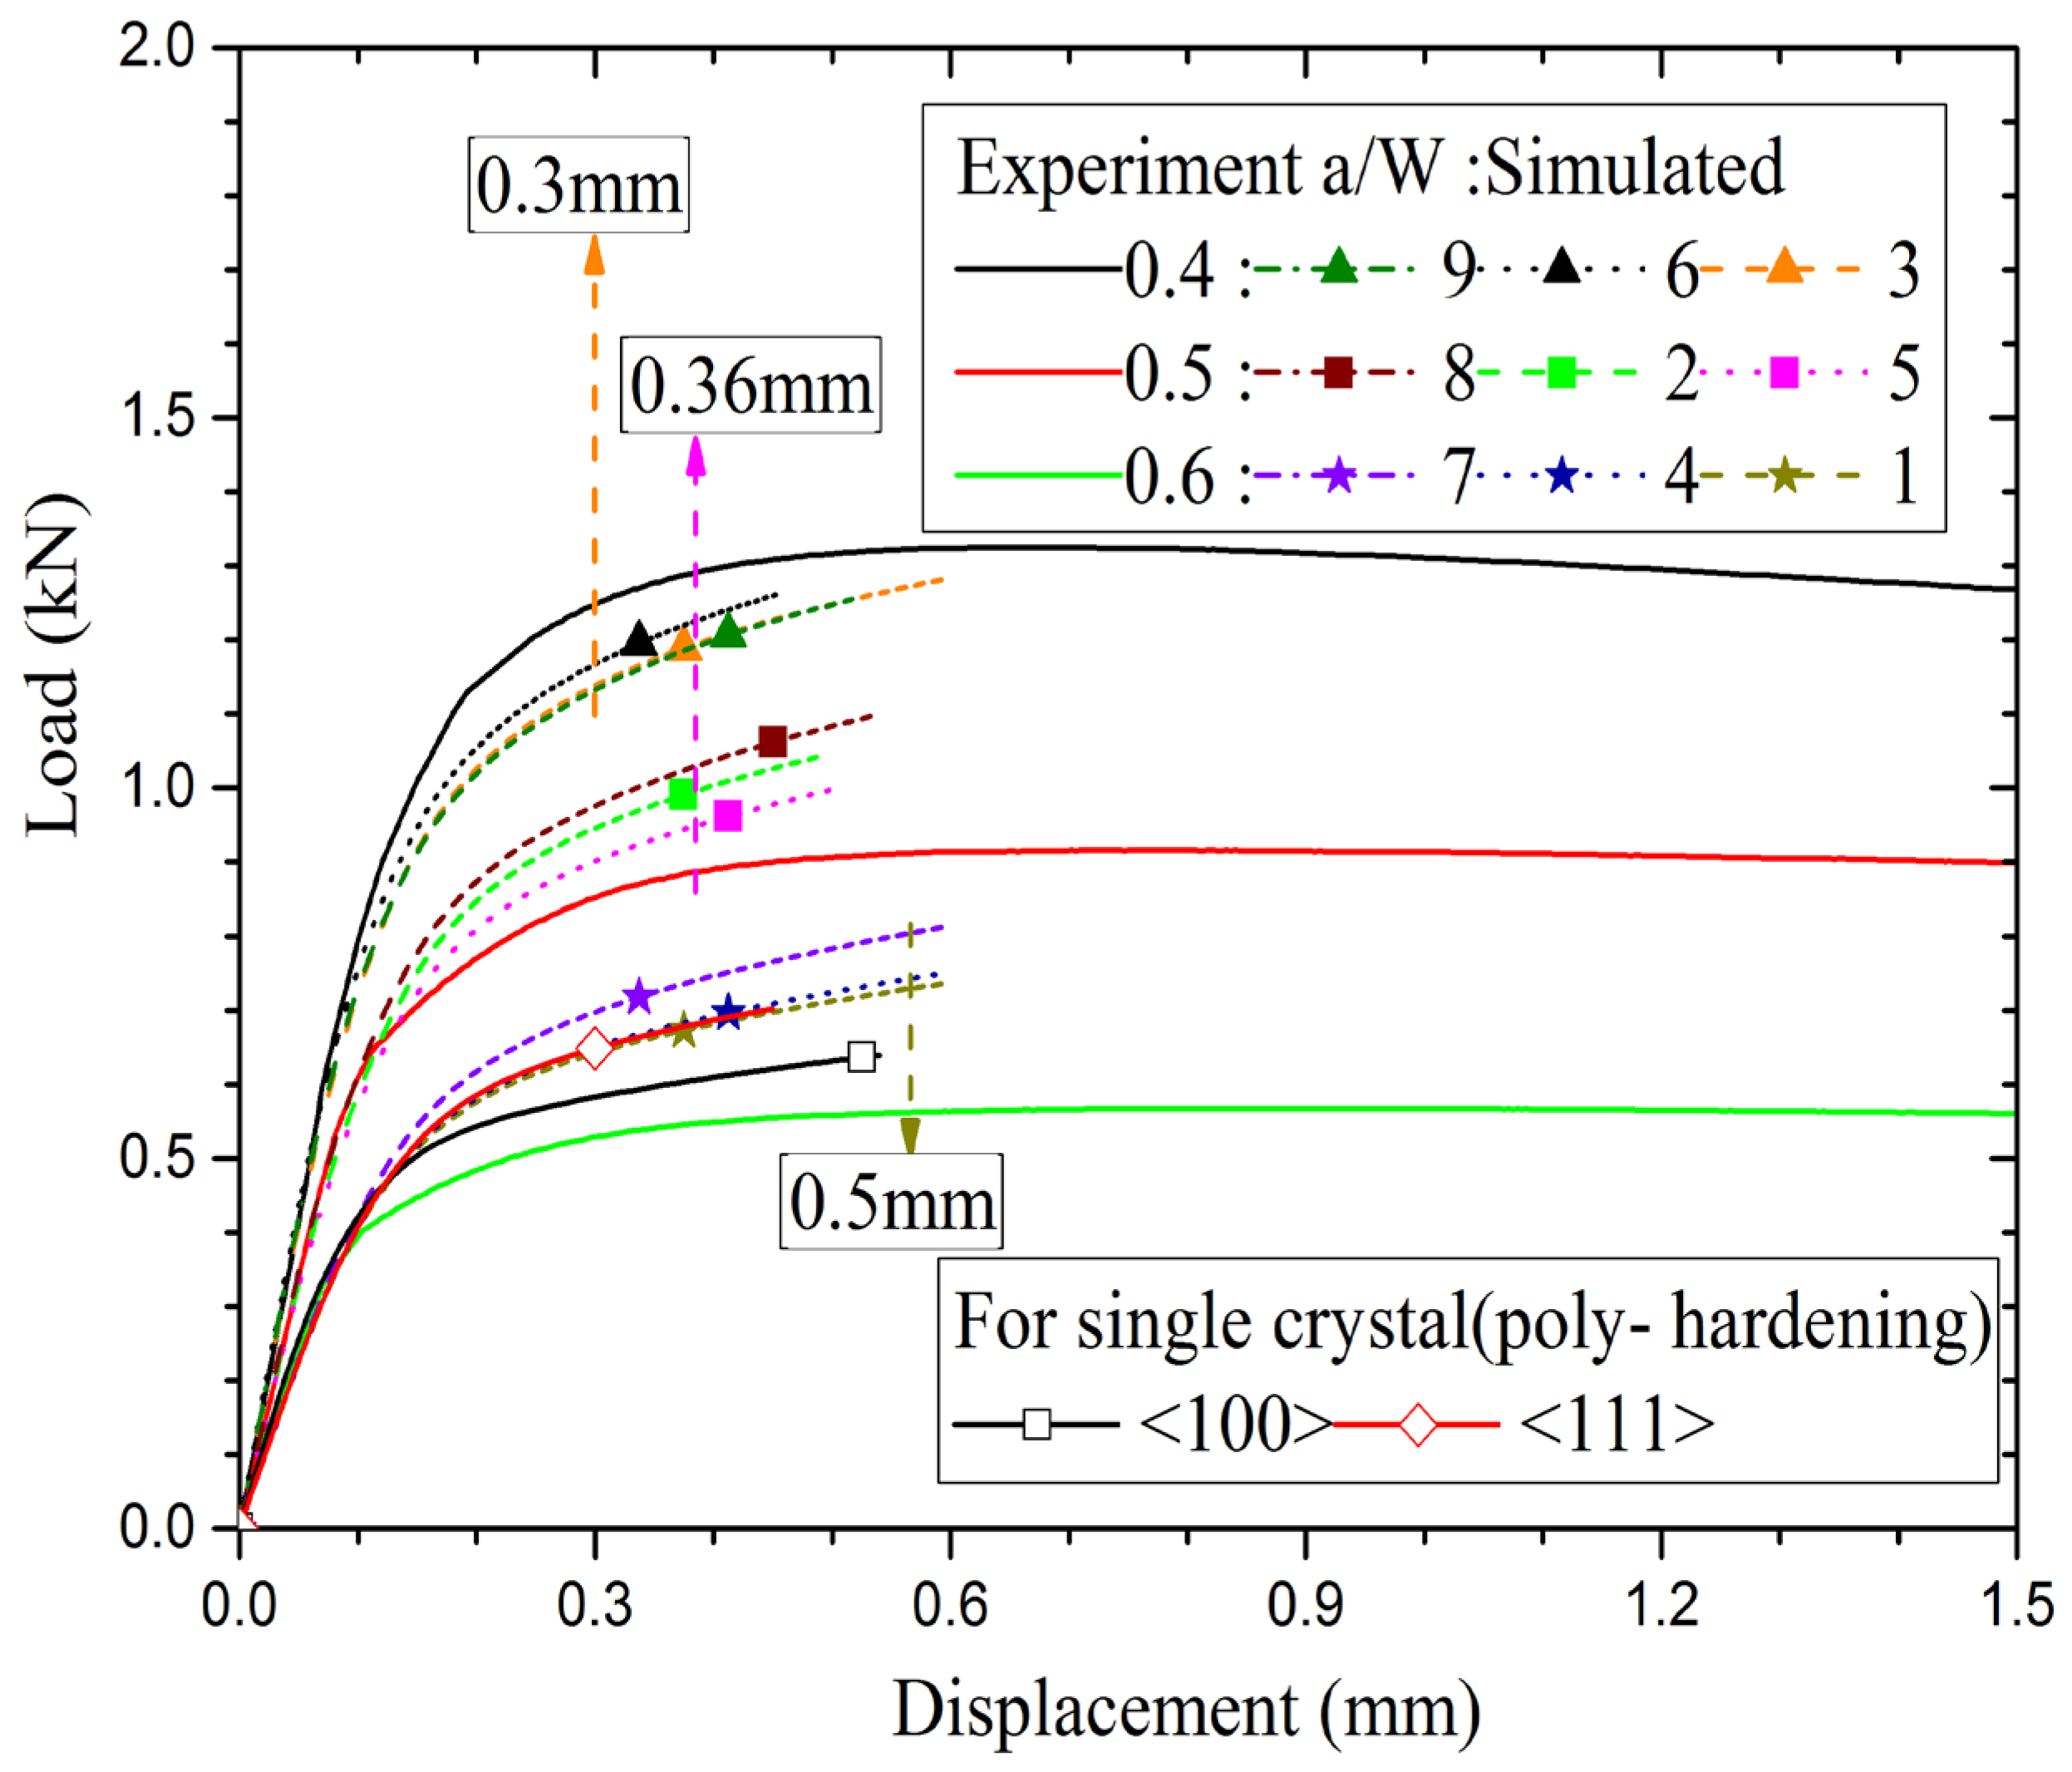
The load-displacement curves of disc-shaped CT specimens as predicted by 3D crystal plasticity simulations are shown in
Figure 10. The load-displacement data from FE simulations have been compared with experimental data for various values of a/W ratios. The results of FE simulations are without consideration of crack growth, whereas, there is crack growth in actual experiment. Hence, the load-displacement data from simulations have been compared with experimental data upto crack initiation point only.
It can be observed from
Figure 10 that the crystal plasticity based FE model is able to predict the experimentally observed load-displacement behaviour satisfactorily within the experimentally observed scatter band. The material damage factor
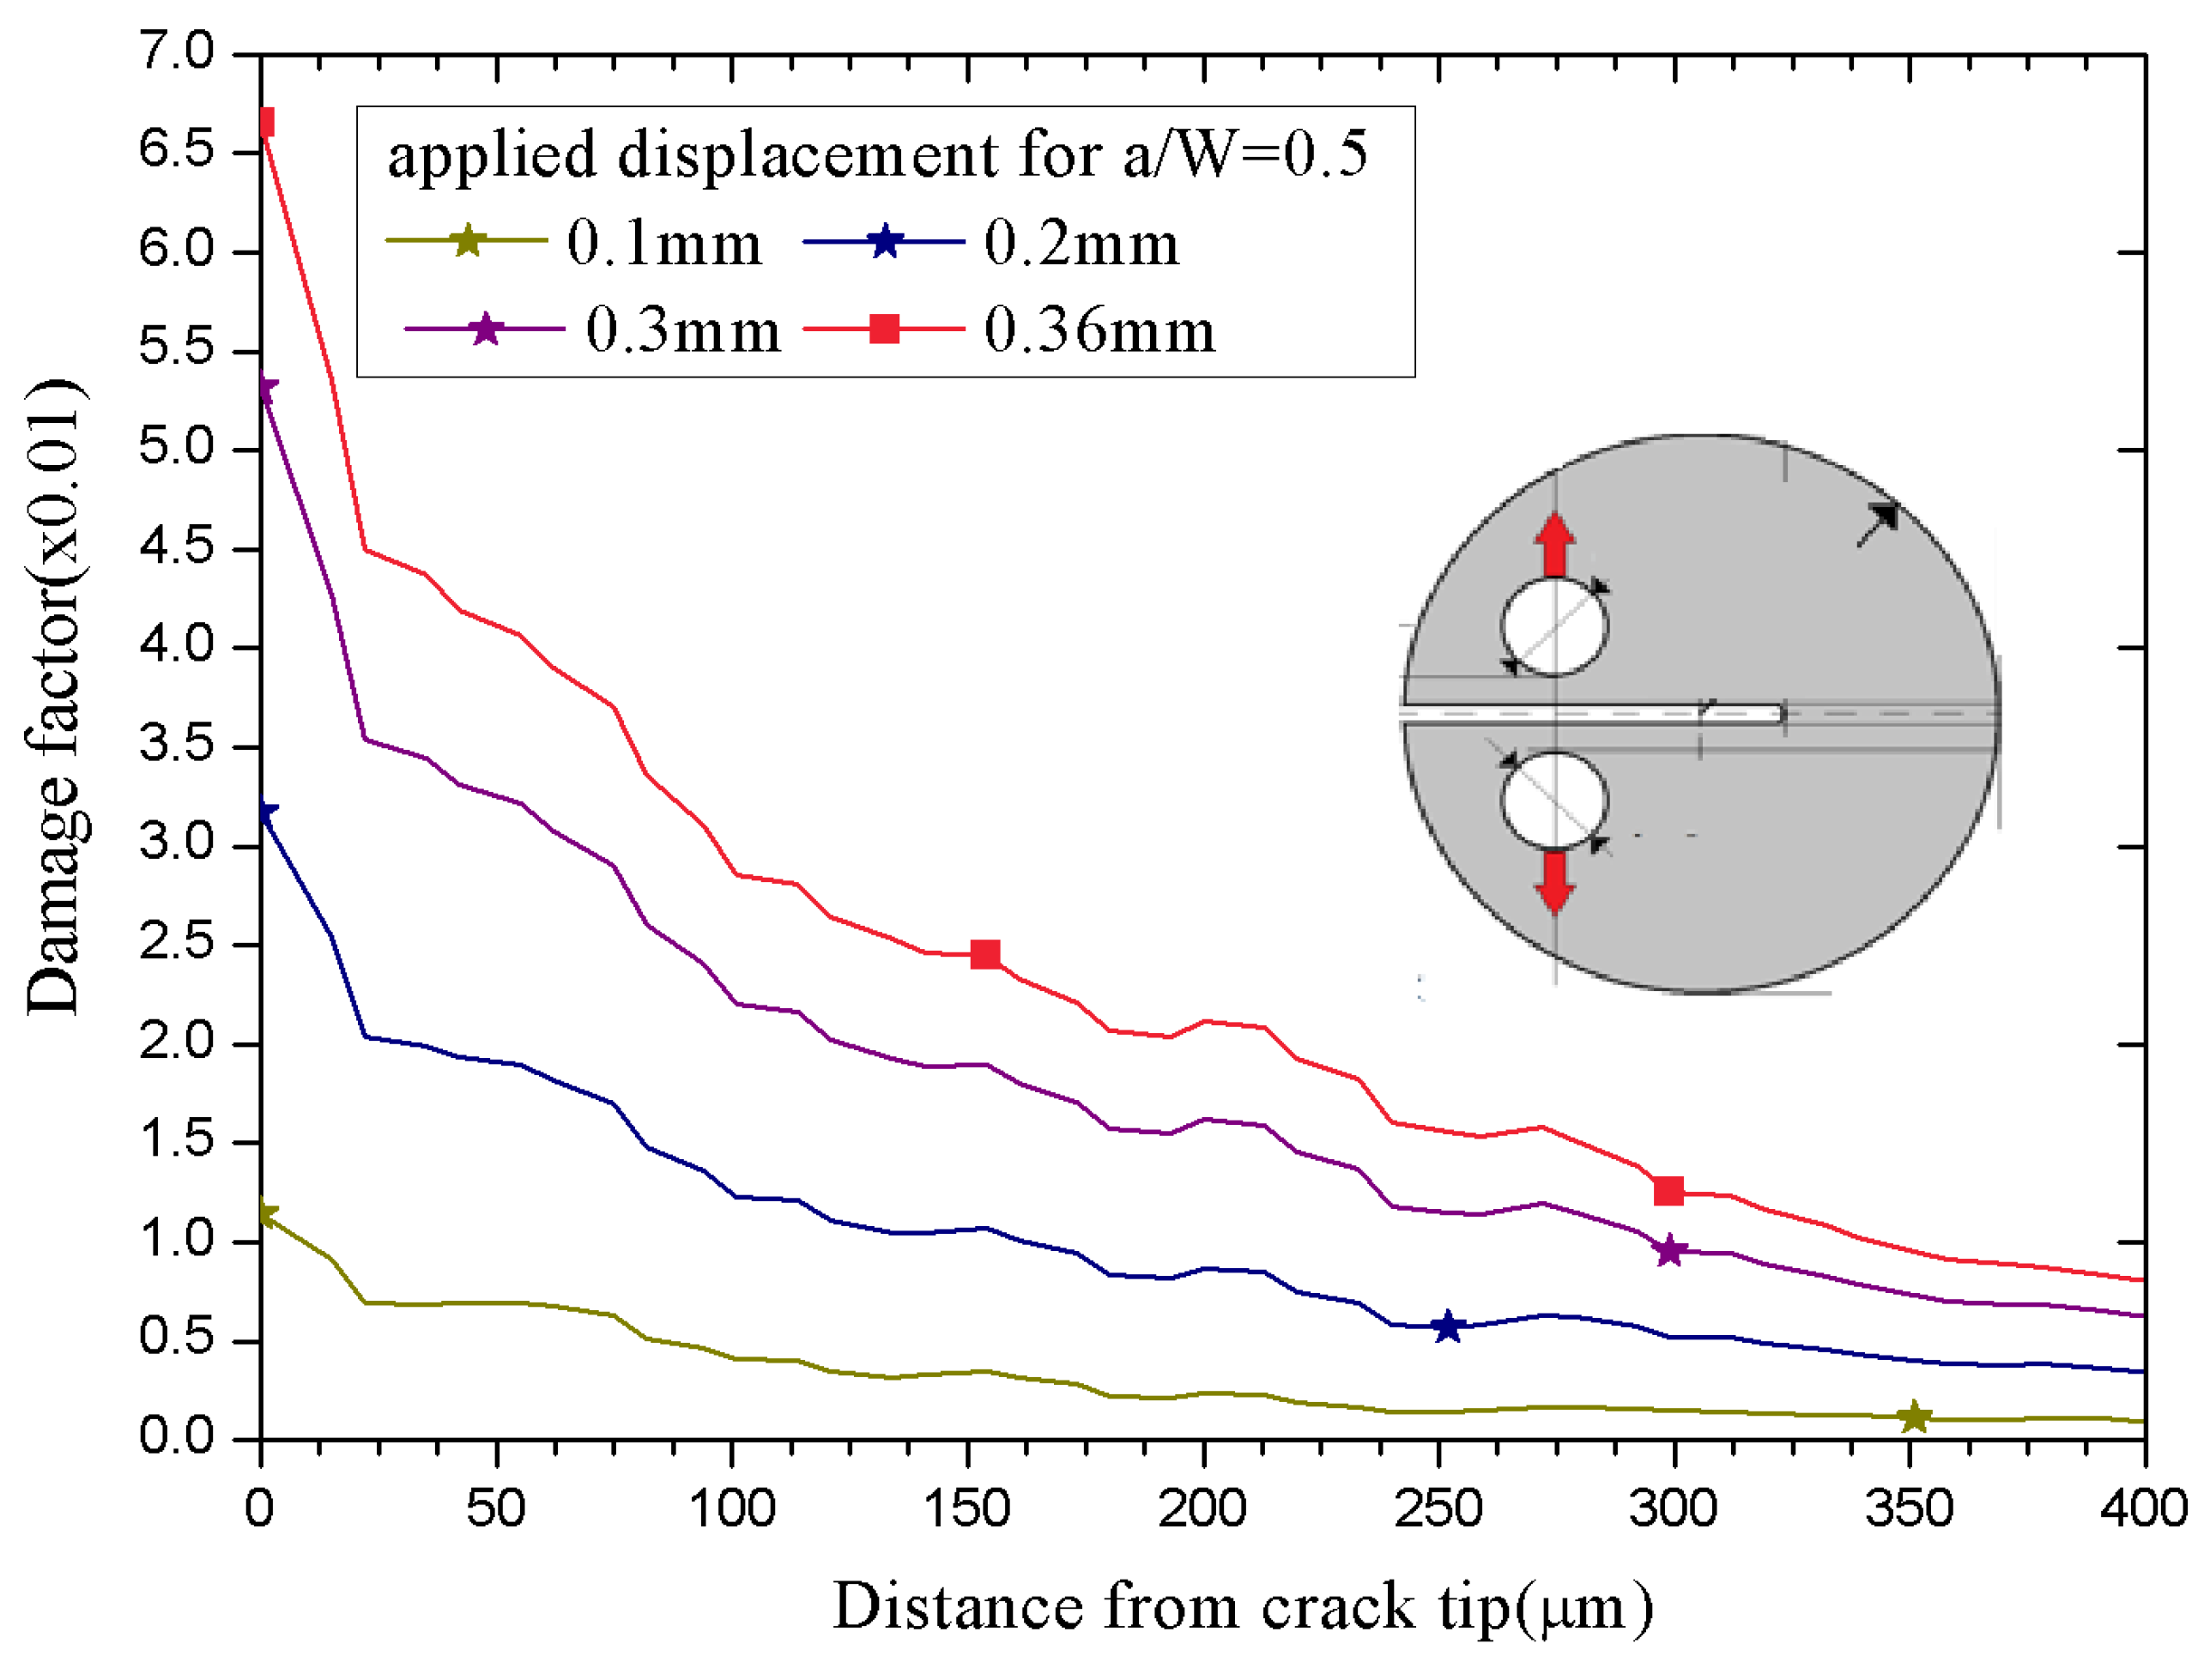
D as been calculated from FE calculated stress and plastic strain field ahead of crack tip using Eq. (7) and the variation of material damage parameter is plotted in
Figure 11 as a function of distance from crack-tip for various values of applied displacement. As we move away from the crack-tip, the stress and plastic strain fields decay and hence, similar trend is also observed for the material damage parameter, which has a maximum value at the crack-tip.
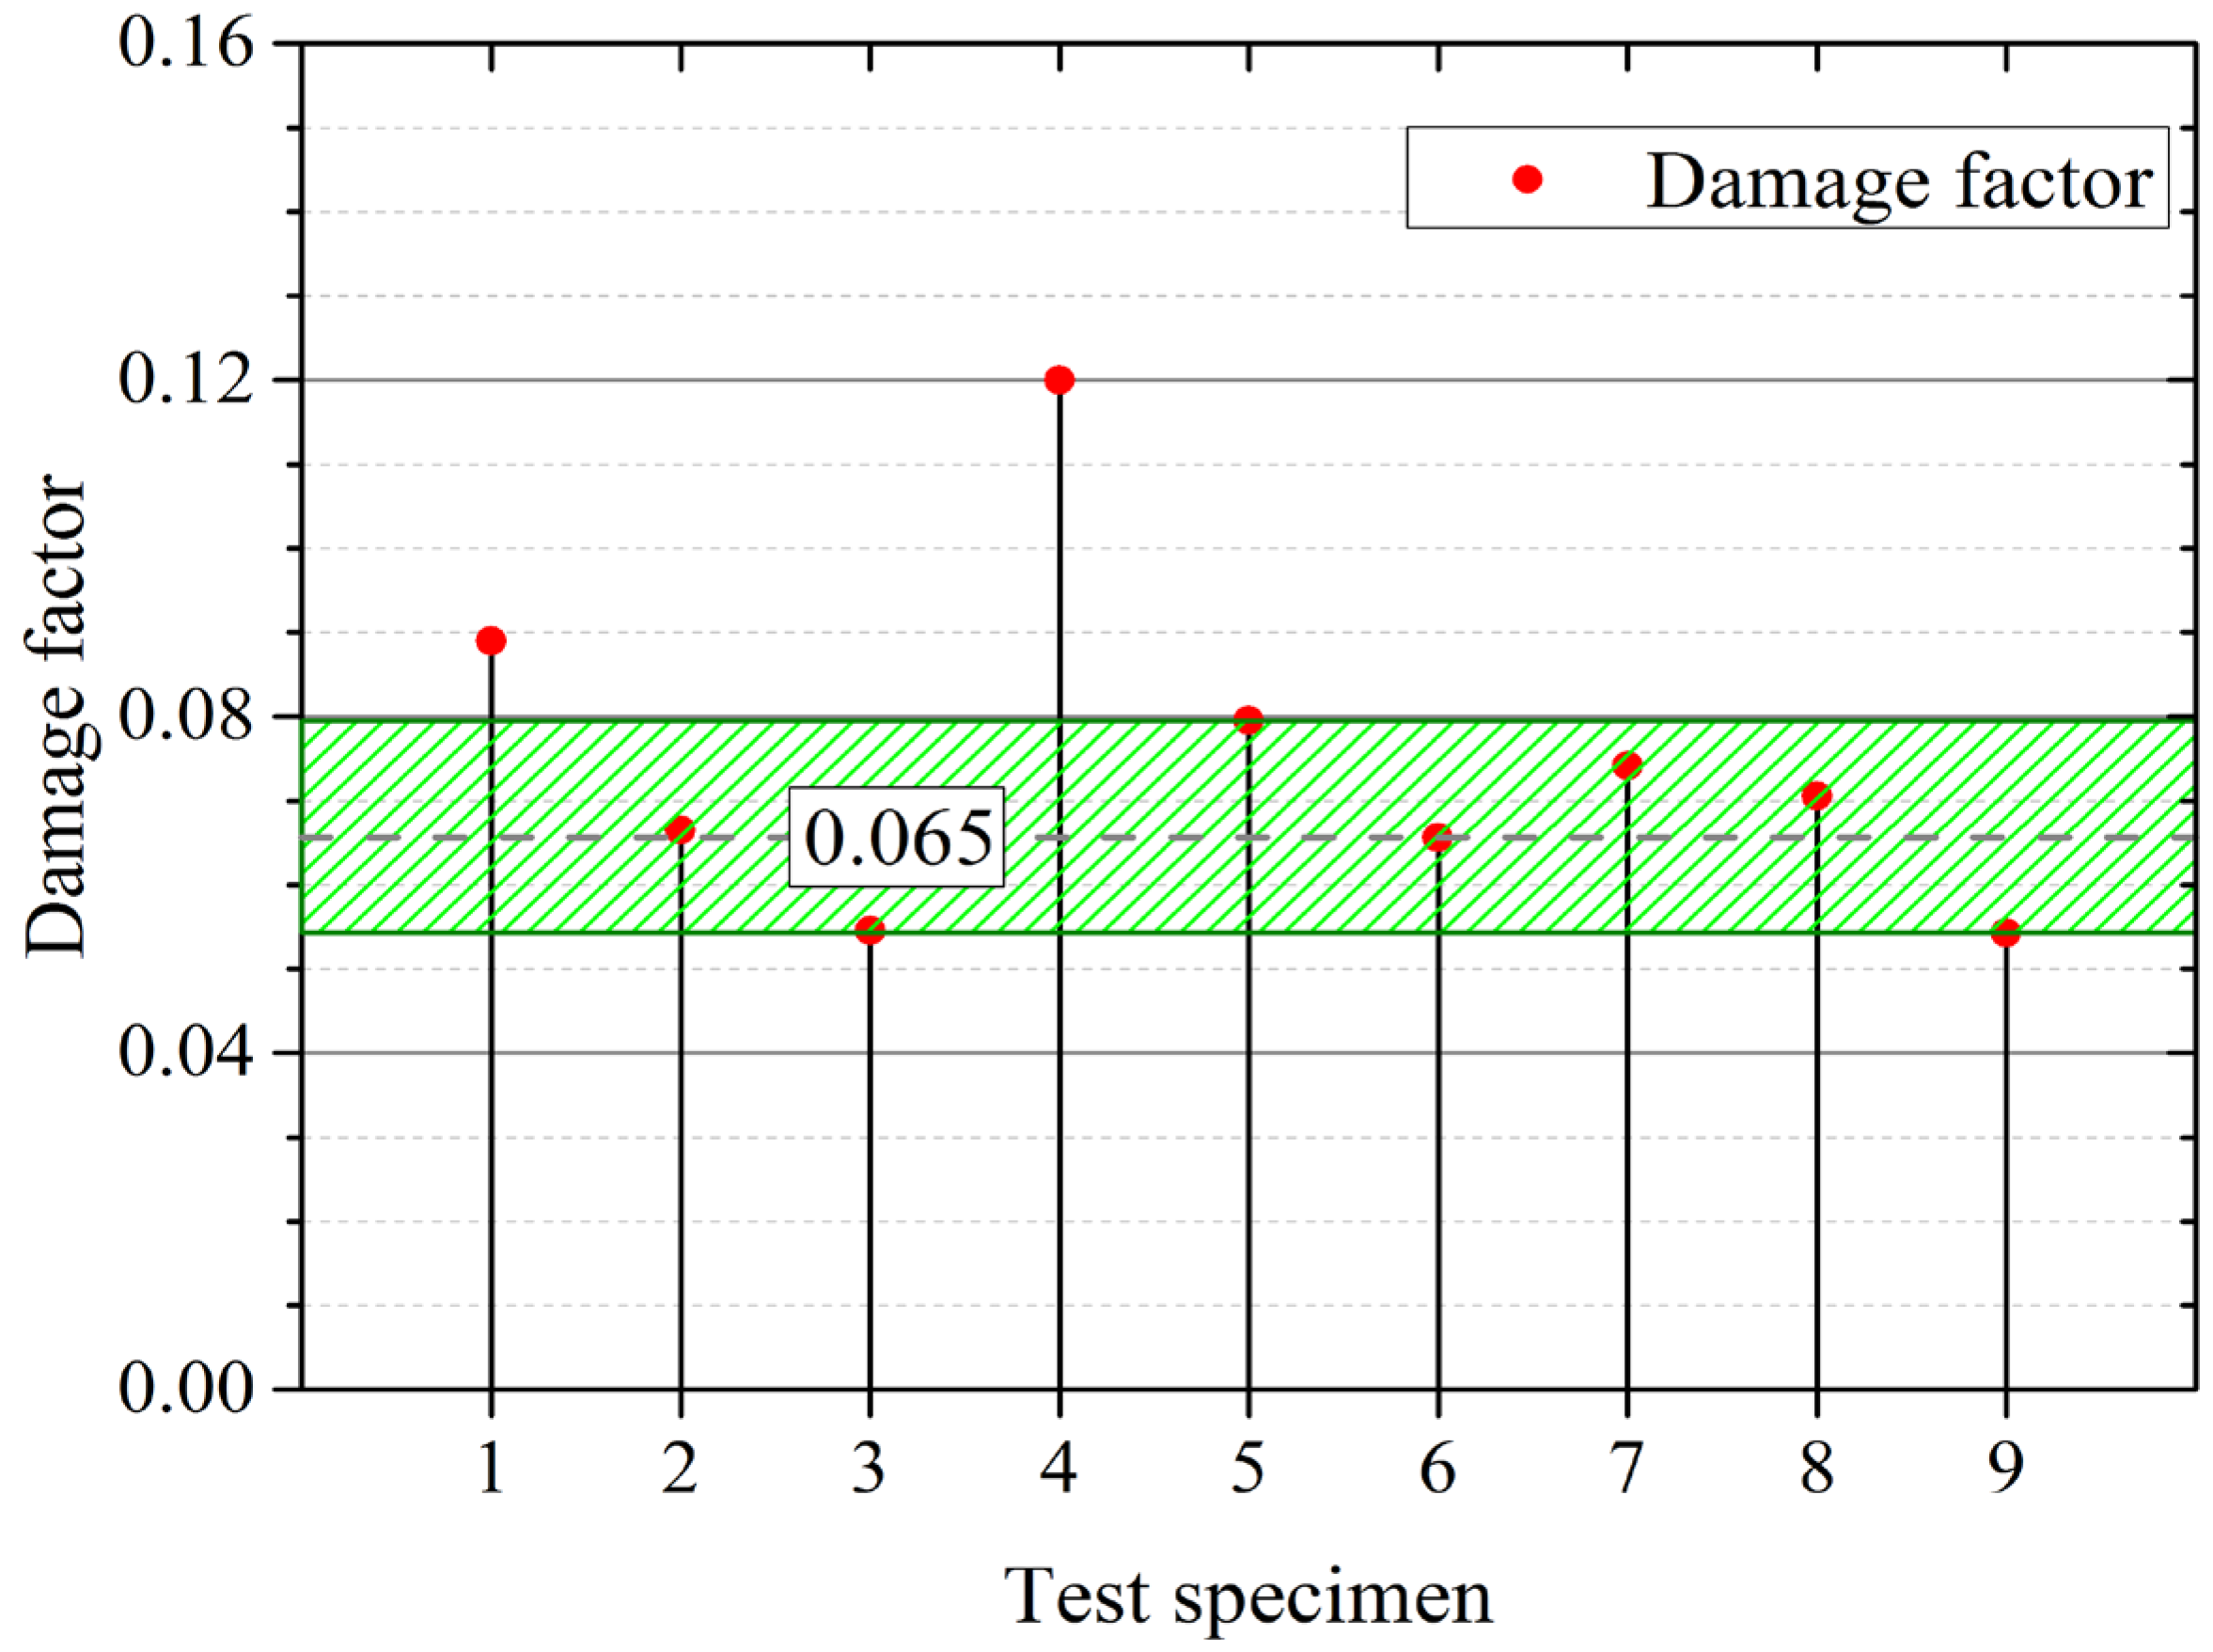
The crack initiation shall occur when this material damage parameter reaches a critical value. This critical value of damage parameter
Dc has been obtained from results of FE simulations and these are plotted for all the nine different specimens in
Figure 12 and listed in
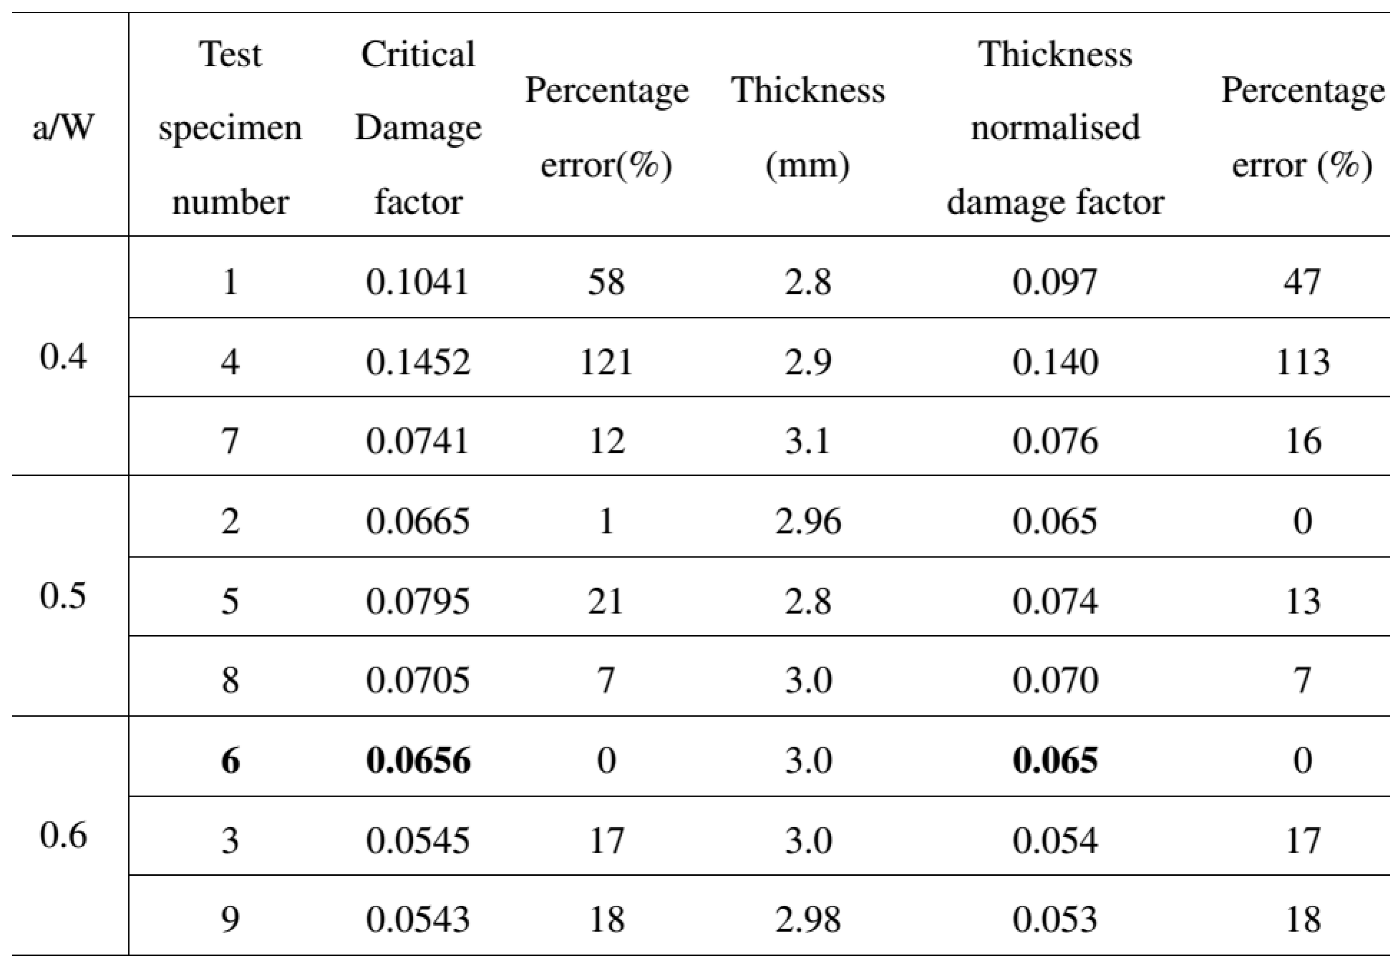
Table 6. The thickness normalized critical damage factor is also listed in
Table 6 to take into account of the differences in the thickness values of the specimens. The average value of critical damage factor
Dc as been evaluated as 0.065 for this aluminium alloy.
As see from
Figure 12 and
Table 6, all the values of
Dc lie in a close band with mean value of 0.065 and variation of 15% except two data points. This mean value of
Dc is a material parameter and it is transferable from specimen level to component. It can be used to predict ductile crack initiation in a component of this material subjected to any loading conditions.
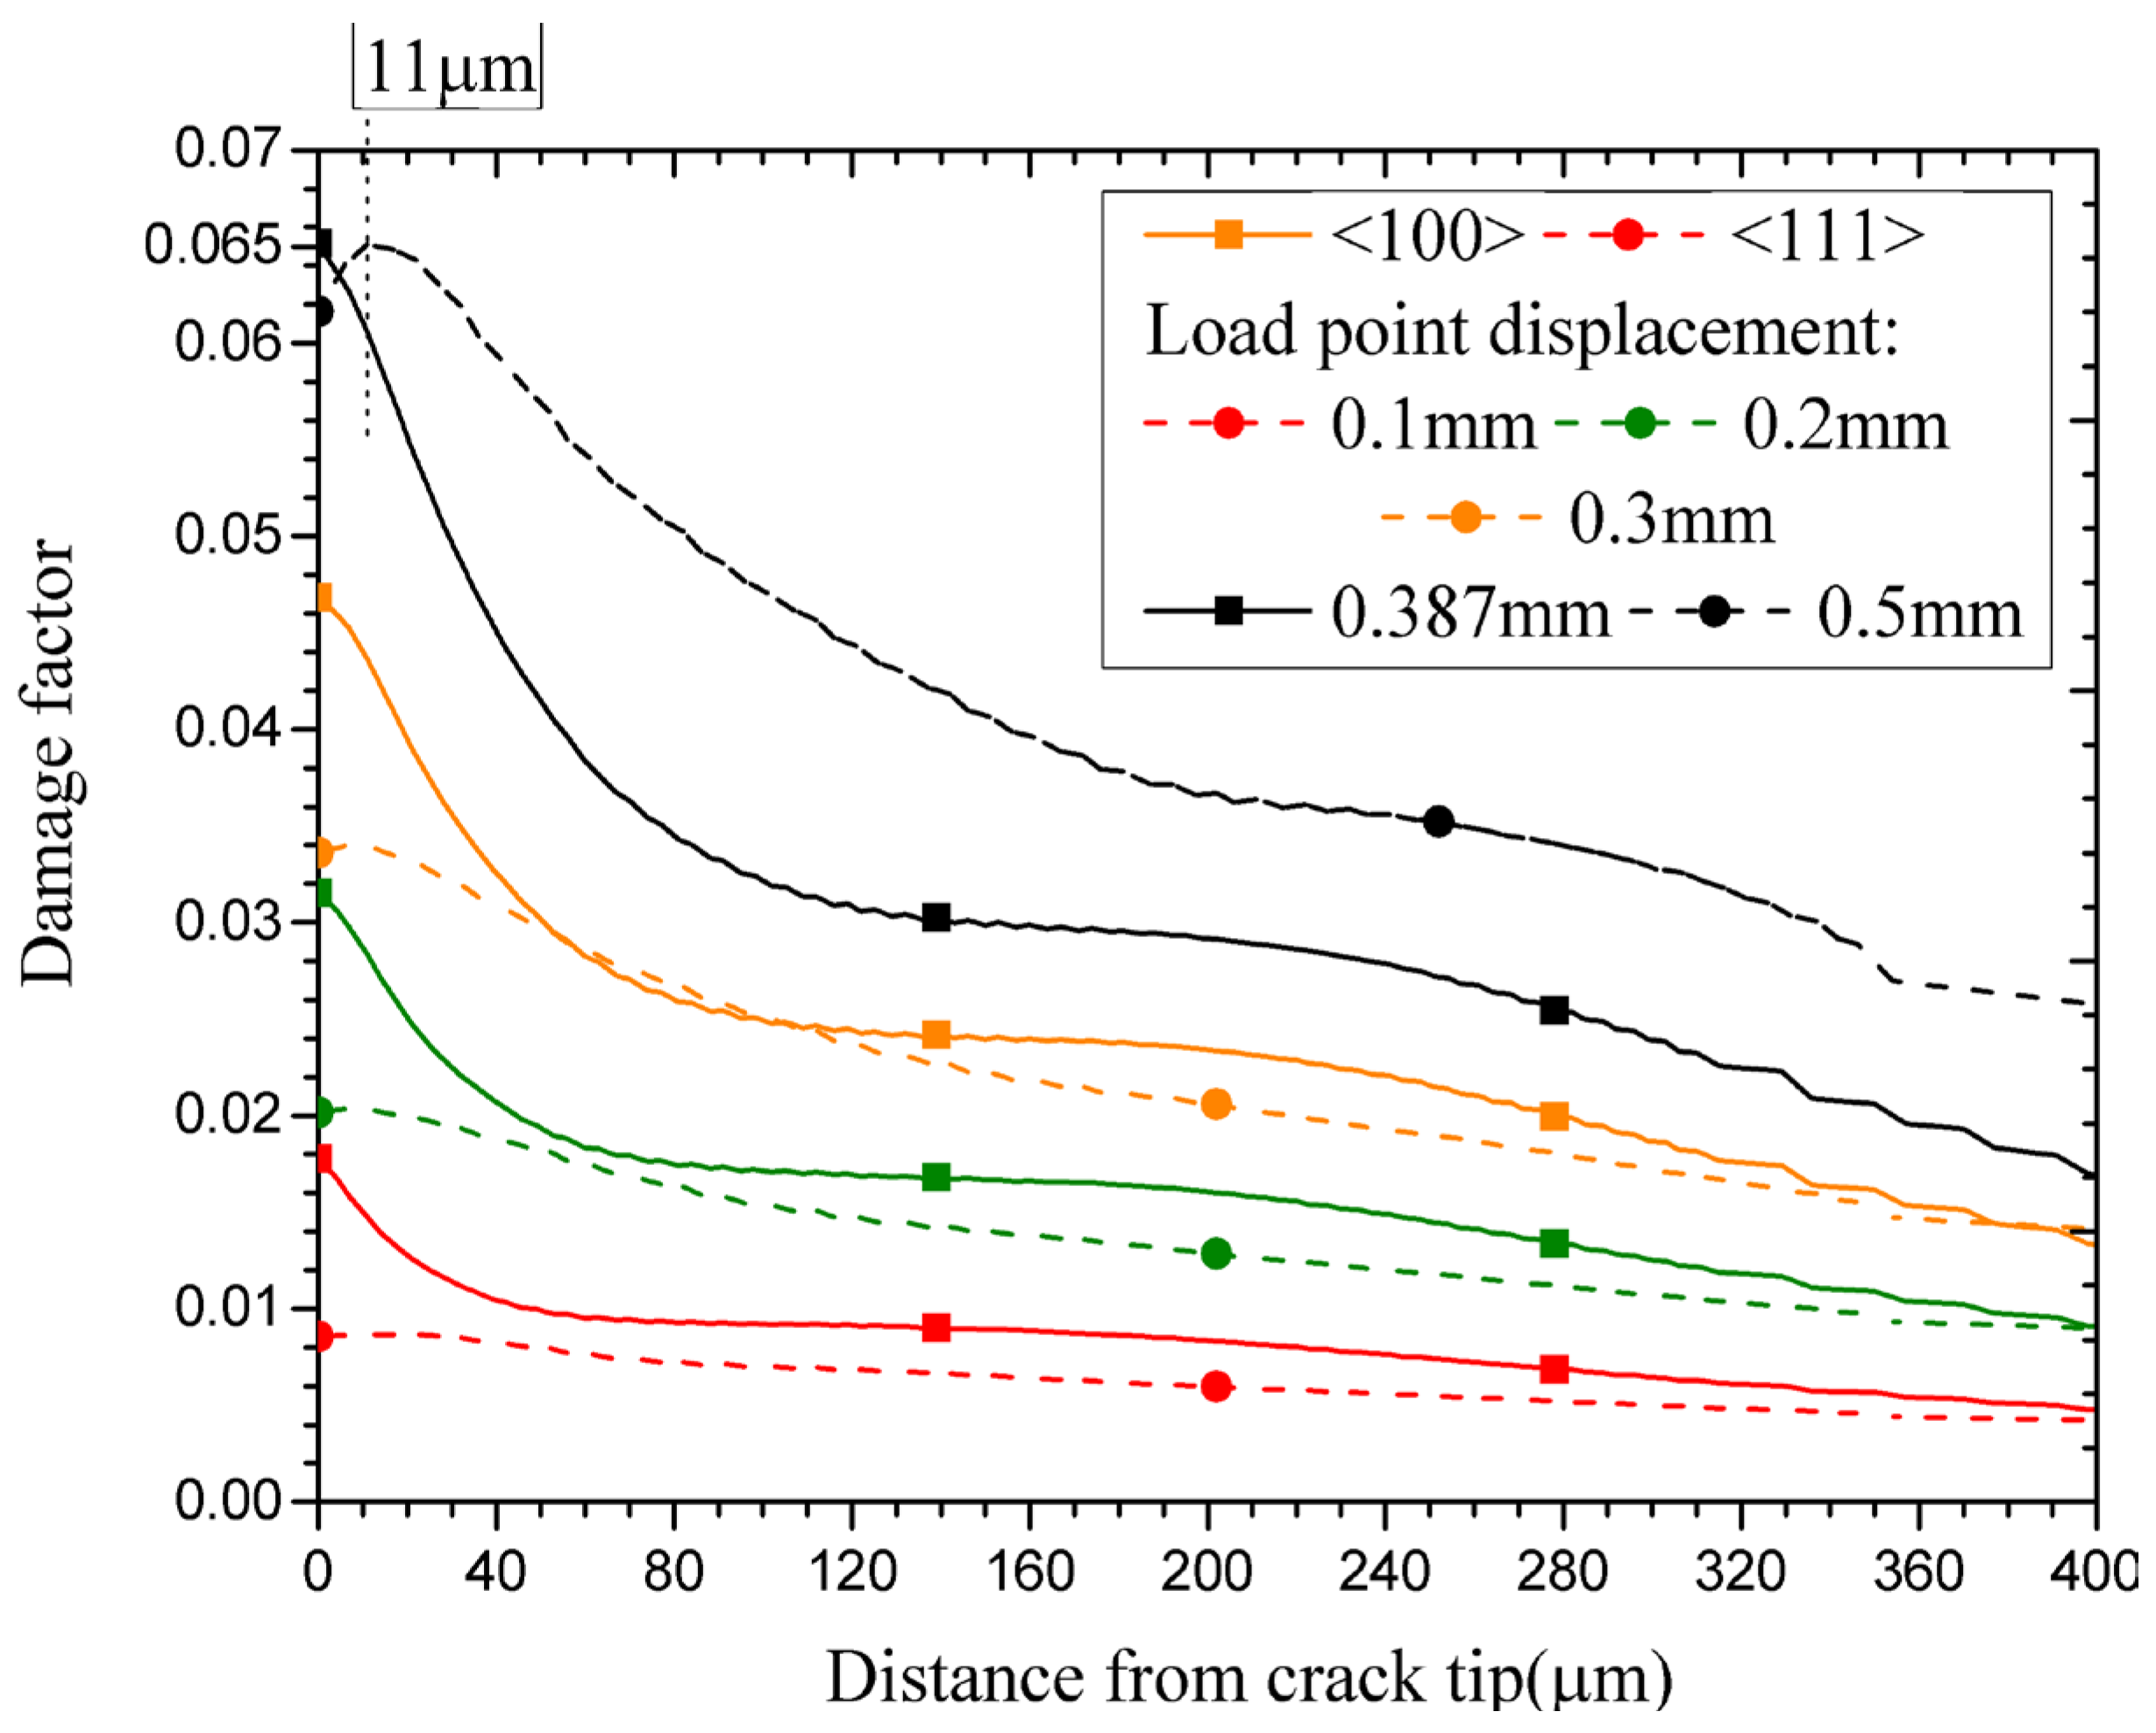
The effect of crystal orientation on the fracture initiation toughness of aluminium single crystals has now been studied using this critical damage paramater as derived earlier. It may be noted that the mean value of this critical damage parameter is 0.065 for this alloy and the the ranges are provided in
Figure 12. Using the crsytal plasticty material model, two different kinds of orientations have been considered, i.e., crack along [100] and [111] planes respectively. As the loading direction is perpendicular to the crack plane, the loading directions are also denoted as <100> and <111> for the two cases considered in this work. The results of variation of damage parameter ahead of crack tip as a function of distance from crack-tip are presented in
Figure 13 for the two orientations as mentioned above.
As the applied displacement is increased, the damage parameter along the ligament increases and it decerases as one moves away from crack-tip. It can be observed that the damage parameter for both the crystal orientations attain a critical value of 0.065 for an applied displacement of 0.5 mm, which is very similar to that of polycrystalline experimental data as presented in
Figure 10. However, for the crystal with [111] crack plane and <111> loading direction, the damage parameter across the ligament is of much higher level when compared to that of the crystal with [100] crack plane and <100> loading direction. Hence, it can be concluded that the crystal with <111> loading direction is more prone to crack initiation (hence, lower crack initiation toughness) and propagation compared to that of the crystal with <100> loading direction. This information can be used in order to tailor the texture of alloys so as to increase the fracture toughess property.
7. Conclusions
In this work, experiments have been conducted on disc-shaped compact tension specimens machined from an aluminium alloy block which is used for manufacture of fuel clad components of research type nuclear reactors. To study ductile crack initiation in this material, a material damage parameter has been calculated from results of crystal plasticity based FE simulations and the critical value of the damage parameter has been obtained. The following conclusions can be obtained from this study.
With increasing a/W ratio, the load bearing capacity of the disc-shaped specimen becomes lower for a given value of applied displacement.
The fracture resistance curve was seen to be almost independent of a/W ratio in the range of 0.4 to 0.6 mm.
The critical damage parameter, as evaluated from crack-tip stress and strain fields of crystal plasticity based FE simulation results is almost similar for different specimens with different a/W ratios.
The mean value of critical damage parameter Dc was determined to 0.065 for this material. The scatter in the results is within 15% of the mean value.
The crystal with <111> loading direction is more prone to crack initiation (hence, lower crack initiation toughness) and propagation compared to that of the crystal with <100> loading direction.
Author Contributions
Conceptualization, MKS; methodology, MKS, TS, AS; software, TS; validation, MKS, TS and AS; formal analysis, MKS, TS, AS; investigation, MKS, AS; resources, MKS; data curation, MKS, TS; writing—original draft preparation, MKS, TS; writing—review and editing, MKS, TS, AS; visualization, MKS, TS; supervision, MKS; project administration, MKS; funding acquisition, MKS. All authors have read and agreed to the published version of the manuscript.” Please turn to the CRediT taxonomy for the term explanation. Authorship must be limited to those who have contributed substantially to the work reported.
Funding
This research received no external funding.
Data Availability Statement
Data shall be available on request.
Acknowledgments
The authors acknowledge Head, Reactor Safety Division, BARC Mumbai, for his constant encouragement for this research.
Conflicts of Interest
The authors declare no conflicts of interest.
References
- Hicks, J. Fundamentals of the strength of materials. 1999, 1-16.
- Xu, S.; Deng, X. Nanoscale void nucleation and growth and crack tip stress evolution ahead of a growing crack in a single crystal. Nanotechnology 2008, 19, 115705. [Google Scholar] [CrossRef] [PubMed]
- Liu, T. and Groh, S. Atomistic modelling of the crack–void interaction in Fe. 2014, 609, 255–265. [Google Scholar]
- Rice, J.R. Tensile crack tip fields in elastic-ideally plastic crystals. Mech. Mater. 1987, 6, 317–335. [Google Scholar] [CrossRef]
- Biswas, P.; Narasimhan, R.; Tewari, A. Influence of crack tip constraint on void growth in ductile FCC single crystals. Mater. Sci. Eng. A 2011, 528, 823–831. [Google Scholar] [CrossRef]
- Chandra, S.; Samal, M.K.; Kumar, N.N.; Chavan, V.M.; Raghunathan, S. An atomistic modelling and statistical analysis study of crack–void interaction in Aluminum. Philos. Mag. Lett. 2017, 97, 504–514. [Google Scholar] [CrossRef]
- Patil, S.D.; Narasimhan, R.; Mishra, R. A numerical study of crack tip constraint in ductile single crystals. J. Mech. Phys. Solids 2008, 56, 2265–2286. [Google Scholar] [CrossRef]
- Patil, S.D.; Narasimhan, R.; Biswas, P.; Mishra, R.K. Crack Tip Fields in a Single Edge Notched Aluminum Single Crystal Specimen. J. Eng. Mater. Technol. 2008, 130, 021013. [Google Scholar] [CrossRef]
- Rice, J.R.; Tracey, D.M. On the ductile enlargement of voids in triaxial stress fields. J. Mech. Phys. Solids 1969, 17, 201–217. [Google Scholar] [CrossRef]
- Biswas, P.; Narasimhan, R.; Kumar, A. Interaction between a notch and cylindrical voids in aluminum single crystals: Experimental observations and numerical simulations. J. Mech. Phys. Solids 2013, 61, 1027–1046. [Google Scholar] [CrossRef]
- Balasubramanian, S.; Anand, L. Elasto-viscoplastic constitutive equations for polycrystalline fcc materials at low homologous temperatures. J. Mech. Phys. Solids 2002, 50, 101–126. [Google Scholar] [CrossRef]
- Ma, A. , Roters F. A constitutive model for fcc single crystals based on dislocation densities and its application to uniaxial compression of aluminium single crystals. Acta Materialia 2004, 52, 3603–3612. [Google Scholar] [CrossRef]
- Rice, J.R. , Tracey D.M. On the ductile enlargement of voids in triaxial stress fields. Journal of Mechanics and Physics of Solids 1969, 17, 201–17. [Google Scholar] [CrossRef]
Figure 1.
True stress-strain data of Aluminium grade Al-1100-O tested at room temperature condition (i.e., 25oC).
Figure 1.
True stress-strain data of Aluminium grade Al-1100-O tested at room temperature condition (i.e., 25oC).
Figure 2.
Geometrical details of the disc-shaped compact tension fracture specimen used in the test.
Figure 2.
Geometrical details of the disc-shaped compact tension fracture specimen used in the test.
Figure 3.
a): Picture of test setup to carry out fracture tests on disc-shaped compact tension fracture specimen, (b) Fixtures and the specimen loaded in the test setup.
Figure 3.
a): Picture of test setup to carry out fracture tests on disc-shaped compact tension fracture specimen, (b) Fixtures and the specimen loaded in the test setup.
Figure 4.
Load-displacement data of all the nine specimens with different a/W ratios as obtained from experiments.
Figure 4.
Load-displacement data of all the nine specimens with different a/W ratios as obtained from experiments.
Figure 5.
Photographs of nine disc-shaped compact tension fracture specimens with different a/W ratios after the test.
Figure 5.
Photographs of nine disc-shaped compact tension fracture specimens with different a/W ratios after the test.
Figure 6.
Crack growth vs. displacement data of disc-shaped compact tension specimens with different a/W ratios (0.4 to 0.6) as obtained from experiments.
Figure 6.
Crack growth vs. displacement data of disc-shaped compact tension specimens with different a/W ratios (0.4 to 0.6) as obtained from experiments.
Figure 7.
Fracture resistance (J-R) curves of disc-shaped compact tension specimens with different a/W ratios (0.4 to 0.6) as calculated from load-displacement and crack growth data.
Figure 7.
Fracture resistance (J-R) curves of disc-shaped compact tension specimens with different a/W ratios (0.4 to 0.6) as calculated from load-displacement and crack growth data.
Figure 8.
(a) Front view of the symmetric model of finite element mesh of the disc-shaped compact tension specimen (the side view is shown in the right); (b) enlarged view near the crack tip.
Figure 8.
(a) Front view of the symmetric model of finite element mesh of the disc-shaped compact tension specimen (the side view is shown in the right); (b) enlarged view near the crack tip.
Figure 9.
Stress -strain curve of the aluminium alloy as obtained from FE simulation with crystal plasticity model and its comparison with experimental data.
Figure 9.
Stress -strain curve of the aluminium alloy as obtained from FE simulation with crystal plasticity model and its comparison with experimental data.
Figure 10.
Load-displacement curves of disc-shaped CT specimens as predicted by 3D crystal plasticity simulations and their comparison with experimental data for various values of a/W ratios.
Figure 10.
Load-displacement curves of disc-shaped CT specimens as predicted by 3D crystal plasticity simulations and their comparison with experimental data for various values of a/W ratios.
Figure 11.
Variation of material damage parameter as a function of distance from crack-tip and its evolution for various values of applied displacement for a given a/W ratio of 0.5.
Figure 11.
Variation of material damage parameter as a function of distance from crack-tip and its evolution for various values of applied displacement for a given a/W ratio of 0.5.
Figure 12.
Variation of critical value of material damage parameter signifying crack initiation in specimens with different a/W ratios across the nine different specimens.
Figure 12.
Variation of critical value of material damage parameter signifying crack initiation in specimens with different a/W ratios across the nine different specimens.
Figure 13.
Variation of damage factor as a function of distance from crack-tip for single crystal fracture specimens for two different crystal orientations and for various levels of applied displacement loading.
Figure 13.
Variation of damage factor as a function of distance from crack-tip for single crystal fracture specimens for two different crystal orientations and for various levels of applied displacement loading.
Table 1.
Chemical composition of Aluminium used for tests in this work.
Table 1.
Chemical composition of Aluminium used for tests in this work.
Table 2.
Mechanical properties of Aluminium used for tests in this work at 25oC.
Table 2.
Mechanical properties of Aluminium used for tests in this work at 25oC.
Table 3.
Dimensional details of all disc-shaped CT specimens in the tests (all dimensions are in mm).
Table 3.
Dimensional details of all disc-shaped CT specimens in the tests (all dimensions are in mm).
Table 4.
Slip systems of an FCC crystal like aluminium.
Table 4.
Slip systems of an FCC crystal like aluminium.
Table 5.
Values of different parameters used in phenomenological model.
Table 5.
Values of different parameters used in phenomenological model.
Table 6.
Comparison of damage factor for different types of discshaped CT specimens.
Table 6.
Comparison of damage factor for different types of discshaped CT specimens.
|
Disclaimer/Publisher’s Note: The statements, opinions and data contained in all publications are solely those of the individual author(s) and contributor(s) and not of MDPI and/or the editor(s). MDPI and/or the editor(s) disclaim responsibility for any injury to people or property resulting from any ideas, methods, instructions or products referred to in the content. |
© 2024 by the authors. Licensee MDPI, Basel, Switzerland. This article is an open access article distributed under the terms and conditions of the Creative Commons Attribution (CC BY) license (https://creativecommons.org/licenses/by/4.0/).


