
You are currently viewing a beta version of our website. If you spot anything unusual, kindly let us know.
Preprint
Article
Changes in the Epilimnion Ciliate Assemblage Reflect the Reduction of the Nutrient Load of the Reservoir for Two Decades
Altmetrics
Downloads
117
Views
28
Comments
0
A peer-reviewed article of this preprint also exists.


This version is not peer-reviewed
Abstract
The awareness of ciliate importance in freshwater has changed dramatically in the last decades, reflecting methodological attempts. We analysed two decades (1994-2018) of data on the surface (0-3 m) ciliate assemblage in the Slapy reservoir (Vltava River, Czech Republic) during two different nutrient-load defined periods. We identified, quantified, and evaluated the biomass of ciliates in the quantitative protargol-stained preparations. We used water age, nutrients, bacteria, heterotrophic nanoflagellates and rhodomonads as the main explanatory background variables. The sampling median and interquartile range data analysis and a non-metric multidimensional scaling were applied. Ciliates were grouped according to their feeding behaviour. The picoplankton filtering species dominated the assemblages in an annual mean (halteriids and minute strobilidiids followed by peritrichs). Algae hunters Balanion planctonicum, urotrichs and nanoplankton filtering tintinnids were important before the spring phytoplankton peak when a maximum of ciliate biomass reflected mixotrophic nanoplankton filtering pelagostrombidiids. Only there, ciliate biomass tightly followed their quantified prey. Heterotrophic and mixotrophic Askenasia and Lagynophrya were typical raptorial/flagellate hunters; only Mesodinium spp. peaked during autumn. The oligotrophication increased the ciliate assemblage biomass in the surface layer during the stratification in concordance with the PEG model.
Keywords:
Subject: Biology and Life Sciences - Aquatic Science
1. Introduction
The awareness of ciliate importance in the lotic environment has been changing dramatically since the 1980s, reflecting both the improvement of plankton ecology methods [1,2,3] and a revised plankton ecology paradigm of the PEG model [4]. However, the pilot methods already used in experimental works were only slowly replacing the traditional ones, e.g., in monitoring programs using the same method for long periods.
The application of epifluorescence methods based on both autofluorescence of photosynthetic pigments and direct staining of microorganisms (acridine orange [5]; primulin [6]; DAPI [7]) has led to the conceptualisation of the ciliate role in a microbial loop within the plankton food web [8]. Numerous articles quantified in situ feeding rates of the heterotrophic, autotrophic and/or mixotrophic ciliates based on the direct methods enumerating either fluorescent particles mimicking edible food or fluorescently stained genuine prey [9]. Since then, the importance of ciliates has proven, and the boom of studies emerged, highlighting significant correlations between the abundance and activity of ciliates, their prey (mainly bacteria), or predators (mainly copepods) in different layers of the water column of aquatic ecosystems [10,11,12]
On the other hand, a routine ciliate counting method for bulk samples of ciliates has not been widely approved for a long time. Since the re-describing a valuable combination of Lugol iodine and Utermöhl methods for ciliates [13], it was followed by the eventual decolorising of the sample with thiosulphate and formalin for its inspecting in an epifluorescence microscope [14,15]. It became the first reliable method for studying pelagic ciliates that was used so far, the most complete ciliate monitoring program in Lake Constance [16,17] integrating plankton-tube samples throughout a deep epilimnion (to 20 m). Other groups preferred an application of DAPI staining for the ciliate quantification [18,19,20,21]. However, another methodological improvement was needed for a parallel satisfactory identification of the specimens. Quantitative Protargol Stain (QPS; [22,23,24]) enabled the direct application of protargol stain to samples concentrated on membrane filters. The method has been routinely applied since the original publication (e.g., [18,25,26,27,28,29]) and become worth combining modern molecular methods [30,31].
Even though the ciliate vertical distribution is well known in small water bodies (e.g., [32]), we still lack detailed information on the whole-year stratification of ciliates from deep water bodies [13,29,33,34,35,36]. The sampling strategy following such information usually looked for the layers with the maximum ciliate occurrence in the water column (such as the metalimnetic bottom, chlorophyll or deep-chlorophyll maxima, oxycline, or a limit of anoxia). It was employed in short-term studies [18,20,21,28].
In many other cases, however, only ciliate samples from the surface layer or shallow epilimnion have been processed because such layers have been typically sampled for monitoring; moreover, due to the change in ciliate analysis to molecular methods, the possible number of processed samples has decreased (recently, [37]). However, adding ciliate analysis to zooplankton and/or phytoplankton-based sampling programs would be inappropriate [2]
Our study aims to analyse two decades of ciliate monitoring in the 3-m surface/epilimnion layer of the mesotrophic dimictic/monomictic reservoir Slapy (Czechia).
2. Materials and Methods
2.1. Study Site
The Slapy reservoir is a narrow, canyon-type reservoir approx. 43 km long, with a maximum depth of 58 m and a volume of 2.70×10⁸ m³; mean retention time <40 days [38,39,40,41]. The limnological regime of the Slapy reservoir is controlled by the temperature and water quality of the hypolimnetic discharge from the reservoir Orlík (max. depth 74 m, mean water residence time of 89 days) located only 9 km upstream of the Slapy; only between August 2002 and June 2003 was all water discharged through the upper outlets. In the cold season, the Orlík water warms the reservoir, and consequently, the water column often circulates from autumn to spring [41]. The studied Slapy reservoir has recently behaved as a warm monomictic lake [42] instead of a naturally dimictic water body [38]. Since the 1990s, the reservoir has undergone remarkable changes in limnological variables as a result of socioeconomic changes in the watershed and climate change [39,40,43]. A gradual increase in total phosphorus (TP) concentration continued during the first decade of our study (1994–2004), but the trend has reverted since 2004, followed by reduced primary production. Dissolved inorganic nitrogen (DIN) concentrations were dominated by nitrate, while ammonium and nitrite were negligible. A gradual decline in nitrate concentration since the 1990s reflected reduced atmospheric deposition, de-intensification and greening of agricultural production and improvements in wastewater treatment. The effect of regional climate change results in earlier thermal stratification of the water column, which causes primary production in the epilimnion to start earlier and last longer [40]. On the other hand, early destratification in September stops the summer growth of phytoplankton.
2.2. Limnology Variables, Sampling and Plankton Analysis
The basic physical-chemical properties were analysed as described by Kopáček et al. [40] in the surface samples taken at 0.5 m. The water quality and hydrodynamic model CE-QUAL-W2 v. 4.0 (Portland State University, Oregon, USA; [44]) was used to calculate the seasonal stratification period with the epilimnion formed and water age. Water age is a model variable used to describe the time water parcels have spent in the reservoir since entering from inflows and is calculated as a time accumulation at a rate of 1.0 1/d for all new water entering the reservoir [45].
Integrated water biological samples were taken using a 3 m plankton tube sampler at 3-week intervals.
Chlorophyll a (Chl a) was determined spectrophotometrically after acetone extraction, according to Lorenzen [46]. Bacteria and heterotrophic nanoflagellates (HNF) were formalin-fixed (2%), filtered onto black polycarbonate membranes (0.2- and 1.0-μm pore-sized, respectively), DAPI stained [7] and counted using an epifluorescence microscope (Olympus). Phytoplankton was fixed with acid Lugol iodine and counted in sedimentation chambers (Utermöhl method); in this study, only the numbers of minute rhodomonads were used as a possible prey of algivorous ciliates [17,47].
2.3. Ciliates
From 1994 to January 2018, the integrated samples were fixed with acid Lugol iodine on the boat; in the laboratory, they were post-fixed with a Bouin’s fixative (to 7%) according to the modified QPS protocol [22,23]. Ciliates were harvested by a soft pressure filtration of 5 to 20 mL of the sample onto a mixed cellulose ester membrane filter with a gridded surface (pore size 1.2 μm), agar mounted, and formalin fixed. The impregnation was performed at ∼60°C. The processed and thiosulfate-stabilised preparations were passed through ethanol, carbol-xylol (phenol and xylene), and xylene dehydration series to be mounted in neutral Canada balsam [18]. The whole surface of the membrane was inspected using the microscopes equipped with Nomarski (DIC) contrast and oil immersion objectives 40× and 100× (Olympus BH2, Japan; Nikon, USA; Leica DMLB, Germany). The impregnation and counting were repeated to obtain approx. 10% of error in the sum of ciliates. In some cases, however, the taxa were represented by a single specimen.
The ciliate biomass was calculated (using simple shape models) from dimensions measured in the protargol preparations, and it was periodically actualised because it varied during the season. The cell volume was converted to organic carbon biomass by the factor of 0.368 pg C/μm3 [48].
Foissner et al. [1] and the keys mentioned therein were used for ciliate identification at the genus level (on some occasions, species were identified). Higher taxa classification according to Adl et al. [49] was applied.
Even though we obtained data on the taxonomic composition of the ciliate assemblage, we centre the result analysis on a distribution of feeding behaviour groups of ciliates derived from the classification of Macek et al. [27] presented in the table (Table 1). Large and rare ciliates such as Stentor sp., haptorids or pelagic colonial peritrichs were not included in the analysis of the ciliate biomass composition because of their too-high standard deviation of data.
2.4. Data Treatment
Almost without any exception, the sampling interval was 21 days, but the sampling week varied during the study. Every year, sampling started between 2 and 13 January, i.e., the shift of sampling Julian day was < 11 days, but in 1996 (< 17 days), we pooled the data to the scale starting Julian day 6 (median). Graphs were constructed using Microsoft Excel or GraphPad Prism 10.2.2 (GraphPad Software, LLC).
To normalise the annual microbial-loop component growth, Straškrábová et al. [50] used criteria of Chl a >5 μg/L, <7 μg/L and <10 μg/L for the spring phytoplankton peak, clear water phase, and the end of summer phytoplankton peak, respectively; we followed them to define the phytoplankton growth periods. However, we have applied a stratification criterion to normalise the microbial-loop growth, as described above.
The evaluated period was divided into two segments, according to the findings of Kopáček et al. [40], who defined total phosphorus increasing trend breakpoint in 2004, while nitrogen had already decreased before. Throughout the text, the analysed periods 1994–2003 and 2004–2018 are assigned as periods A and B, respectively; the calculated period of a stable stratification is named stratification.
The data were statistically analysed using Prism 10; we applied the programme automatic plot of medians with the interquartile range (IQR) based on raw data to construct a representative seasonal curve of the ciliates and limnology variables [51,52]. Non-metric multidimensional scaling (NMDS) with Bray–Curtis distance measure was used to find a configuration of years in the ordination space where distances between years correspond to dissimilarity within the explanatory variables or ciliate composition. NMDS was done using Canoco 5.15 [53].
3. Results
3.1. Long-Term Trends in the Reservoir
3.1.1. Physical-Chemical Variables
Kopáček et al. [40] published long-term trends of physical-chemical variables (Figure S1). The mean annual temperature of the surface layer increased from a minimum of 10.9 °C in 1996 to a maximum of 14.1 °C in 2017. The stratification period means oscillated about 20°C with a minimum of 18.5 °C and a maximum of 23.0 °C in 2009 and 2003, respectively. The annual means of dissolved oxygen (DO) were close to saturation throughout the almost entire study period. However, at the start of period A, concentrations below saturation were observed. The stratification period means showed oversaturation, except for some years during period A. During period B, DO slightly dropped.
Total phosphorus (including particles <40 µm) annual means were roughly above - and below 50 µg/L during periods A and B, respectively, finishing at 34 µg/L in 2017. The stratification means oscillated around 25 µg/L throughout the study. Dissolved inorganic nitrogen (DIN) annual means were slightly lower than those from stratification, between 2 and 4 mg/L and 1.5 and 3 mg/L, during periods A and B, respectively. However, concentrations remained below 2 mg/L for the last three years.
3.1.2. Plankton
To define the ciliate position within the plankton food webs, first, we plotted the chlorophyll a (Chla) concentrations as a proxy of phytoplankton biomass and possible ciliate prey abundances: minute cryptomonads (Rhodomonas spp.), heterotrophic nanoflagellates (HNF), and bacteria (Figure 1).
An apparent drop in annual means of Chl a concentration (from 20 to 10 μg/L) likely followed a significant drop in total phosphorus load starting in 2004 [40]. Local Chl a maxima were observed as spring and summer peaks during April–May and August–September, respectively, surpassing 20 μg/L. During period A, they were frequently between 50 and 100 μg/L), while during period B, they have been decreasing below 35 μg/L after 2009. It resulted in the annual- and stratification-mean of 14.5 and 27 μg/L, and 7.0 and 29 μg/L, during periods A and B, respectively. The clear water phase following the spring peak of chlorophyll was observed shortly after, covering only one sampling period.
Rhodomonads’ annual abundances had reached nearly 1×10³ cells/mL during period A but dropped down 0.2×10³ cells/mL during period B, while have been increasing again since 2015, reaching 0.6×10³ cells/mL in 2017. However, the stratification abundances over 1×10³ cells/mL had been observed till 2010, dropping down 0.3×10³ cells/mL in 2014 and increasing again.
Annual means of HNF numbers were low (< 1×10³ cells/mL) until 2000, while from 2001 to 2003, they reached their maximum (up to 2.4×10³ cells/mL), then dropping < 1.7×10³ cells/mL (except for 2012 and 2013 with > 1.8×10³ cells/mL) again. If their annual mean numbers were higher than the mean, it was due to a broader period of their peaking either during spring or summer/autumn.
Bacteria varied between 2.7 and 4 ×10⁶ cells/mL until 2008 (except for 4.8 ×10⁶ cells/mL in 1998). A maximum of 5.2×10⁶ was observed in 2009, but then bacteria varied roughly within a 3 to 4×10⁶ cells/mL interval.
Both ciliate numbers and biomass were lower before 2004 (Figure 2); the annual maximum was reached in 2006 (15.8 cells/mL and 29.6 μg/L, respectively). Generally, we observed increasing peaks of ciliate biomass toward 2018 (40 μg/L). Annual ciliate maxima fell typically to April–May, though longer peaking has been observed since 2006. Longer-observed elevated abundances and biomass of ciliates are reflected in the increasing mean values from the stratification. An additional autumn peak was not observed every year.
Among the ciliate feeding behaviour groups, we found alternatively biomass dominating the picoplankton filtering (halteriids and minute strobilidiids, scuticociliates and small non-colonial peritrichs) and algivorous species (prostomes, Histiobalantium spp.) during the warmer stratification, and the winter and mixing period, respectively. If we sum both heterotrophs (mainly tintinnids) and mixotrophs (mainly pelagostrombidiids), nanoplankton filtering ciliates frequently dominated the assemblage biomass at the end of the spring peak of chlorophyll. Among raptorial/flagellate hunters, Askenasia and related genera, both heterotrophic and mixotrophic, and Mesodinium spp. were the most frequent. Scarce, very large ciliates and large colony-forming species were discarded from the analysis (e.g., pelagic Epistylis spp., Stentor sp., Pelagodileptus sp., Lacrymaria sp.) because they could not be well quantified using the QPS.
3.2. Seasonality
3.2.1. Physical-Chemical Variables
Plots of the annual cycles of temperature, water age, dissolved oxygen, and nutrients reveal their periodicity with the peaks tightly related to the calculated stratification limits (Figure S2). During period A (1994-2003), stratification started in May almost without an observed variation (median May 5, interquartile range May 7 to 11) and finished within a 6-week total range from late August to September (median September 13, interquartile range August 29 to September 28). During period B, the stratification came earlier (median May 7, interquartile range April 23 to May 8), but it finished every time in September (median September 13, interquartile range September 8 to 16).
The temperature (Figure S2e,f) quickly rose just before the stratification, where the climax of about 21°C was reached, dropping gradually from its end. The annual minimum temperature occurred in February (< 3°C). Dissolved oxygen, DO (Figure S2e,f), was usually oversaturated in the epilimnion and reached its maximum just at the start of stratification. Only during October – November did DO drop to < 5 mg/L.
A hydrodynamic model shows the stability of the sampled three-metre surface layer since the water age during the stratification reached 80 days there. In contrast, in the below 4 m layers, it overpassed 40 days or approached it in periods A and B, respectively. Mixing of the surface and deeper layers occurs outside the stratification period, even during winter.
Annual/seasonal nutrient dynamics were related to the mixing-stratification, but their concentrations decreased in period B. The maximum concentration of dissolved inorganic nitrogen (DIN) was observed following the start of stratification, and then it gradually declined. However, the total phosphorus (TP, including the seston <40 μm) was the highest during mixing, steeply dropped just before stratification and the lowest during it (for more details, [40]).
3.2.2. Chlorophyll a, Bacteria, Rhodomonads, and HETEROTROPHIC NANOFLAGELLATES
Two Chl a maximums were confirmed (Figure 3c,d). Considering the criteria used by Straškrabová et al. [50] the spring phytoplankton peak lasted from the first week of April to the end or the middle of May during periods A and B, respectively; the maximum median values of 39 μg/L (early May of A) and 12.9 μg/L (end of April). The clear water phase likely did not last more than one sampling period. We found the summer phytoplankton peak from June, culminating in August, nearly as high as the spring one during both periods (42 and 14.5 μg/L, respectively). While the peak was well pronounced in period A, a percentual variation of Chl a during period B was broader, and the median of the peak was nearly insignificant. However, Chl a concentrations always dropped below 5 μg/L after the stratification towards October.
Only during period A (Figure 3c,d) was a pronounced peak of bacteria (7×10⁶ cells/mL) observed. During both periods, bacteria maintained roughly constant abundances (5×10⁶ cells/mL) throughout the stratification.
Possible algivorous ciliate-prey rhodomonads (Figure 3a,b) were peaking during and/or after the spring peak of Chl a (4.5×10³ cells/mL and 0.8×10³ cells/mL during A and B, respectively). During both periods, rhodomonads dropped during the stratification and have been observed in their median abundances from roughly 0.5×10³ cells/mL even during the summer Chl a peak.
Other hunting or raptorial ciliate prey, HNF, reached their maxima along with- or after those of rhodomonads in late May (4×10³ cells/mL and 2×10³ cells/mL during A and B, respectively). On the other hand, they also accompanied the summer Chl a peak (1.8×10³ cells/mL), and during period B, another peak of 2.5×10³ cells/mL was registered during the stratification.
3.2.3. Ciliates’ Assemblage Abundance and Biomass
Analysing the ciliates, first, we plotted medians of the ciliate biomass (corrected, i.e., without large but scarce species) and abundances (without correction) throughout the studied periods (Figure 4a,b). The ciliate maximum peak median was observed in the spring just about the breakpoint of water column stratification in both periods. Ciliates occurred in 6.15 and 9.45 cells/mL abundances and biomasses of 13.2 and 39.4 μg/L during periods A and B, respectively. However, the following trend in abundance and biomass was different. A small abundance peak was observed before the stratification A end (4.6 cells/mL) and a biomass one at the end (4.6 μg/L). During stratification B, the interquartile range upper limit was nearly as high as the spring peak, reaching a pronounced peak in the middle of stratification (10.4 cells/mL and 24.0 μg/L) and another small peak at the end (16.0 cells/mL and 12.0 μg/L).
Since the interval of dates when stratification used to start was more comprehensive for period B and the ciliate maximum values lasted longer, we tried to normalise the data using the every-year stratification first sampling as a referential “0“ (Figure 4c,d)
We observed the sharp annual maximum at the start of stratification in May or late April. The ciliate biomass development trend was smoother if we normalised the yearly cycle using the start day of stratification (Figure 5c,d), particularly before the end of stratification. However, the transformation could have offered better data interpretation. We did not correct plots of the total ciliates and the feeding behaviour groups' annual cycles in such a way.
The graph (Figure 5) shows the importance of stratification and its limnological variables for ciliate biomass growth. Except for mixing the reservoir at temperatures between 5 and 10°C, we have found maximum biomasses during stratification. Significant ciliate biomasses were not observed in the oxygen-undersaturated layer.
3.2.4. Annual Growth of Feeding-Behaviour Ciliate Groups
The most biomass-important ciliates in the surface layer of the Slapy reservoir were those of nanoplankton filtering behaviour (traditionally called coarse filter feeders), reaching the median of carbon biomass >10 μg/L (Figure 6 and Figure S3). Among them, mixotrophic nanoplankton filtering (MN) ciliate genera Limnostrombidium and Pelagostrombidium (Pelagostrombidiidae; Song et al., 2019; Agatha et al., 2023), accompanied sometimes by Rimostrombidium velox (Strobilidiidae) typically dominated start of the stratification. During period A, their biomass rapidly dropped down, but during period B stratification and at its end (>2 μg/L), we registered other biomass peaks (>10 μg/L and >2 μg/L, respectively). Heterotrophic nanoplankton feeders (HN) were less important but frequently observed: Tintinnidium spp., Tintinnopsis spp. and, Codonella cratera (Tintinniidae), and Rimostrombidium lacustris (Strobiliidae). However, tintinnids were responsible for the peak of the ciliate group preceding the stratification.
During both periods, we observed large filtering Stentor sp. (Stentoridae) periodically in the spring phytoplankton bloom (about April) and/or during stratification (from June to August). However, its median abundance was zero; we did not concentrate a sufficient volume of samples to quantify it. The ciliate was discarded from the assemblage analysis.
The second most important ciliate group were the minute picoplankton filtering (PF), omnivorous (bacteria, picocyanobacteria, picoeukaryotes) ciliates (Figure 7 and Figure S4); they peaked at the end of mixing or the start of the stratification (median biomass >4 μg/L). Among them, Halteria grandinella and a mixotrophic Pelagohalteria viridis (Halteriidae), Rimostrombidium brachykinetum, R. humile and other similar species, some of them with kleptoplasts (Strobilidiidae), and Vorticella aqua-dulcis complex, Vorticella spp. and Pseudohaplocaulus sp. (Peritrichidae) were the most important.
Halteriids and strobilidiids followed the whole group dynamics before and during stratification, reaching the median biomass >1.5 μg/L (Figure 7). The maximum of peritrichs was lower (>1 μg/L), but the IQR was much more variable. They peaked just before or during stratification during both studied periods. Almost all found species were attached, but we also found free-swimming peritrichs (e.g., Vorticella mayeri, Hastatella spp., Astylozoon sp.) and de-attached ectobionts Trichodina cf. diaptomi.
Pelagic colonial Epistylis spp. were the most common during stratification. Their large colonies were never observed intact, and their segments observed in QPS preparations varied in size and number in repeatedly processed preparations. Because of the insufficient volume of samples for their analysis, it was impossible to quantify them accurately, so we discarded them from the biomass analysis.
Minute picoplankton-feeding scuticociliates formed the third component of picoplanktivorous ciliates (not shown). The genus Cyclidium, mostly C. glaucoma (Cyclidiidae) and Cinetochilum margaritaceum (Cinetochilidae) were the most frequent. We found them repeatedly, even in high abundance, but their biomass median was very low and frequently zero. On the other hand, their presence increased the ciliate group biomass (median) at the end of stratification.
Phytoplankton non-filter food harvesting (algivores; algae hunters, AH) ciliates formed the third most important group (Figure 8 and Figure S5), reaching a median maximum just before the spring phytoplankton peak, i.e., before stratification (2.4 and 10.8 μg/L during periods A and B, respectively); higher biomass (about 1.5 μg/L) was observed during stratification in period B.
Minute one-tailed urotrichs resembling Urotricha agilis, doble-tailed U. furcata or U. pseudofurcata and multiple-tailed U. castalia or U. pelagica (Urotrichidae) were distinguished. The position of Balanion planctonicum (Balanionidae) was uncertain using a median attempt: the ciliate repeatedly reached very high abundances, which was apparent in the group's total biomass but not in the ciliate median biomass value. A similar data behaviour was observed for the scuticociliates Histiobalantium spp. (Histiobalantiidae), which were not so numerous but of high individual cell biomass while giving a median zero value during period A (data not shown in the graph). In the spring chlorophyll peak of period B, the ciliate median was 0.5 μg/L, increasing the total algivorous ciliates’ biomass during the autumn column mixing (October).
We have excluded from the algivorous species category a large prostome genus Holophrya (Holophryidae) found in low numbers with ingested algae. At the same time, we included Coleps spp., which are sometimes mixotrophic, within raptorial species. Diatom-feeding ciliates Phascolodon vorticella and Trithigmostoma spp. were scarcely observed, too.
Raptorial ciliates or flagellate hunters (RH; several scarce and large species such as haptorids not included) reached the lowest biomass among the analysed feeding behaviour ciliate groups (Figure 9 and Figure S6), particularly during period A. However, during period B, they presented a constant biomass of about 1 μg/L from March to December.
The genus Askenasia (incertae sedis, CON-threeP) was one of the most important among raptorial ciliates. We observed frequently minute Askenasia spp., the species resembling A. acrostomia, Askenasia volvox, and a mixotrophic A. chlorelligera, to which different cell biomasses were assigned. Rhabdoaskenasia minima was probably included, though the species-typical extrusomes were not recognised. During period A, they were unimportant except for the end of stratification and the following autumn mixing. However, during period B, they dominated during the formation and the end of the stratification. A minute Mesodinium spp. (incertae sedis, SAL) was very important during the autumn mixing in the A and B periods, though its minute cell biomass was very low.
Among other raptorial species were notable Lagynophrya spp. (Trachelophyllidae), both heterotrophic and mixotrophic, Enchelys spp. (Enchelyidae), a minute Monodinium spp. (Didinidae), and Pelagolacrymaria sp. (Lacrymariidae). However, they were observed in much less than 50% of samples.
Among the excluded large predatory species, the most important were dileptids (mostly resembling Pelagodileptus sp., Dileptidae); they used to appear typically by June. The scarcest but repeatedly observed large ciliate was Lacrymaria sp. (Lacrymariidae) during the spring phytoplankton peak (April).
3.3. Predator-Prey Relation and Importance of Different Feeding Behaviour Patterns within Ciliates
We characterized the years of the study using a non-metric multidimensional scaling (NMDS) based on explanatory variables composed of temperature, concentrations of dissolved oxygen, total phosphorus (with particles <40 µm), DIN, chlorophyll a, and abundances of ciliate prey bacteria, HNF and Rhodomonas spp. (Figure 10a). We did not draw round-the-year sampling data to the graph but those covering all principal ciliate peaks: from spring phytoplankton peak-related, i.e., two sampling dates before the event of stratification, to the end of summer phytoplankton peak with two ciliate local maximums, i.e., to the end of stratification). Only a possible winter (February-March) B. planctonicum and autumn (November) Mesodinium spp. maximums were not included.
According to the physical-chemical and ciliate-prey analysis, years from periods A and B form well-defined clusters with only small overlapping (Figure 10a). However, the same procedure with the ciliate data gave a less pronounced grouping (Figure 10b). According to vector directions, AH ciliates were driven in the same direction as MN ciliates, while HN showed a contrasting direction to them. PF and RH showed a trend similar to the ciliate assemblage biomass (corrected; without scarce and large species).
We combined the concluding results of the annual growth of ciliate feeding behaviour groups graphically (Figure 11). In the following text, medians and interquartile ranges are mentioned.
PF ciliates (mainly halteriids, strobilidiids, peritrichs and less important minute scuticociliates) were the most biomass-important from the end of mixing through the end of stratification or throughout the year in periods A and B, respectively, reaching a maximum of 3.2 (6.7; 0.82) and 4.7 (20.0; 1.2) μg/L (Figure 11a,b). Nanoplankton filtering heterotrophs’ peak (of tintinnids, Rimostrombidium lacustris) occurred before- or about the stable stratification (3.1 (9.6; 0.66) and 3.4 (10.5; 0.90) μg/L during periods A and B, respectively). Filtering mixotrophs were the most abundant during stratification (maximum of 8.6 (16.1; 3.2) and 8.7 (18.7; 4.8) μg/L, respectively).
A maximum of AH occurred during a spring phytoplankton peak before the event of stratification (2.4 (14.4: 0.3) and 10.8 (44.5; 1.4) μg/L, respectively) when mostly urotrichs dominated (Figure 11c,d). Sometimes, a year maximum of B. planctonicum was observed in winter/spring or towards the end of stratification, and that of Histiobalantium spp. before the stratification and during the autumn mixing; however, medians of the species were near zero.
Flagellate hunters Mesodinium spp. (Figure 11c,d) were the only ciliates peaking during autumn mixing (reaching biomass of 0.47 (1.3: 0.00) μg/L during period B). Other RH (mainly of genera Askenasia, Lagynophrya, Enchelys, minute Monodinium) were essential during the spring peak of phytoplankton and then during stratification, reaching another maximum at the end of it (maximum of 0.37 (0.83; 0.00) and 1.0 (2.1; 0.11) μg/L during periods A and B, respectively).
The difference between periods A and B was apparent when we analyse the assemblage composition from the view of heterotrophy and mixotrophy (Figure 12), summing species with zoochlorelae or kleptoplasts. During A, a maximum of mixotrophs occurred at the beginning of stratification (4.46 (10.1; 2.53) μg/L) but dropped quickly and significantly below the heterotrophic biomass. On the other hand, during period B, heterotrophs reached their maximum during a spring phytoplankton peak (30.6 (50.4; 13.3) μg/L), but then mixotrophs were of the same or even higher biomass throughout the stratification (maximum of 15.5 (22.1; 4.9) μg/L comparing to heterotrophs of 8.1 (15.6; 2.86) μg/L).
4. Discussion
4.1. Hydrodynamics of the Surface Layer and a Legacy of Defined Periods A and B
Three-metre samples covered mostly the entire epilimnion and did not penetrate to metalimnion during the stratification of the Slapy reservoir. The same monitoring approach has persisted over the past decades, focusing on the surface or epilimnion layer despite variations in water bodies worldwide (recently, e.g., [37]). Notably, this method is not universal, particularly in water bodies with shallow epilimnion that do not align perfectly with the euphotic zone.
Compared to great lakes with abundant ciliate data [16,25,26,30,54], the sampled layer depth is shallow in the Slapy reservoir. However, hydrodynamic studies have proven its separation from deeper layers and homogeneity of the epilimnion during stratification periods (Figure S2c,d). The water age was gradually increased until the end of stratification, reaching about 80 days, compared to a maximum of 40 days in the layer below <4 m, which is like the whole reservoir mean retention time <40 days [38,39,41]. The difference in water ages in the layers was more pronounced in period B. Resulting layer separation also means a physical separation of the layers’ ciliate assemblages, which may be completely independent of the metalimnetic processes. We could compare our data with those obtained in the surface layers of shallow but stratified lakes or lakes with shallow epilimnion. In another studied case, the Římov reservoir ciliates assemblage composition and activity in the epilimnion was also independent of a separated layer, into which the river incorporated [35,55,56].
The general challenge in biological monitoring arises from shifts in a water body's hydrodynamics and related biological processes, prompting us to employ different analytical approaches due to variations in the onset of stratification. While attempts were made to normalise sampling timing, the resulting projections did not substantially alter the observed curves (Figure 4). In period A, the ciliates presented two pronounced biomass peaks during stratification; a summer phytoplankton peak at the end moved backwards, and the abundance and biomass peaks coincided. During B, the stratification intermediate biomass peak lasted longer but decreased towards the culmination of a summer Chl a peak, which was two-fold lower (Figure 1). The observed changes towards the end of stratification may be influenced by differences in stratification duration (number of samplings during it). Thus, we did not apply such normalisation to the ciliate feeding behaviour groups.
Gaedke and Wickham [17] normalised the processes related to a spring peak using the position of clear water. However, if the Slapy reservoir was sampled once every three weeks, we would have only one clear-water sampling. We partly applied the attempt of Straškrábová [50], who normalised timing based on the Chl a concentration marked in the graphs (Figure 3). We found such a criterion useful when looking for the “ciliate season” covering principle ciliate peaks. The spring phytoplankton peak was put at Chl a >5 μg/L, i.e., two sampling dates before the event of stratification; clear water was defined by Chl a <7 μg/L, and the end of summer phytoplankton peak by Chl a <10 μg/L, i.e., the end of stratification. It covered algivorous and nanoplankton-feeding ciliate spring peaks and summer ciliate maximums. Only autumn mixing /winter maximum of Mesodinium spp. was excluded.
We applied the Chl a criterion to characterise the years of the study using a non-metric multidimensional scaling (NMDS) based on explanatory variables (T, DO, total phosphorus (with particles <40 µm), DIN, chlorophyll a, and abundances of bacteria, HNF and Rhodomonas spp. (Figure 10a). Years from periods A and B form distinct clusters with several exceptions. During period A, the unusual year 1998 presented significant drops in DIN (Figure S1), chlorophyll a and HNF abundance, but bacteria abundance reached the highest value (Figure 1). Contrary to this, the years 2006 and 2009 were of the highest DIN, chlorophyll a and HNF abundance (Figure 1 and Figure S1) during period B. According to Jeppesen et al. [57], recently, nitrogen has become a limited nutrient in various water bodies, sometimes surpassing the limitation of phosphorus. Though there was proven a different hydrodynamic separation in periods A and B, chosen through a phosphorus load drop before 2004 [39,40,43], nitrogen limitation is another factor probably controlling the whole plankton growth, including ciliates.
4.2. Environment Ciliates’ Identification Issues
The taxonomy of plankton ciliates has changed during the study, partly due to QPS application, and the ciliate taxa frequently published from plankton in the 90s “disappeared”, being replaced by other names, sometimes based on an identification priority. In our work, this is the case of urotrichs, where our criteria for evaluating them were again limited to the size distribution (compare, [16,26,58-59). The problem cannot be solved simply using molecular methods since such an attempt would describe more cryptic species, which are probably both morphologically and ecologically the same or very similar; only scarce comparative studies between the identification methods were carried out in the environmental samples [2,28,30,60]. Also, the minute oligotrich species are challenging to identify according to their morphology in the samples [58,61].
Very similar cases are freshwater mixotrophic oligotrichs, where both genera Pelagostrombidium and Limnostrombidium were put to the same taxon (Pelagostrombidiidae). In theory, distinguishing them is easy, but there are some doubts that their morphology could vary according to the environmental conditions [1]. On the species level of Pelogostrombidium, molecular information on P. fallax and P. mirabile was also obtained using isolates, but the morphological details are challenging to observe in uncultured populations. Commonly, Pelagostrombidium sp. is contrasted to Limnostrombidium sp., but not P. fallax vs. P. mirabile or L. pelagicum vs. L. viride [26,62,63,64,65]. Additionally, one may find significantly different two size categories of the cells within the population (this study).
Within tintinnids, the genera Tintinnidium and Tintinnopsis are well-defined [1] based on protargol stain. However, identifying them by routinely counting the plankton samples is nearly impossible, while Codonella cratera and Membranicola could be well distinguished [28]. The same is valid for the genera Askenasia and related Rhabdoaskenasia [25] [26,66,67,68,69]. It is easier to define mixotrophic and heterotrophic species, supposing that they represent Askenasia chlorelligera, and according to the size, Askenasia volvox and the others, which might not be correct [1].
4.3. Ciliate Ecology in the Reservoir
The absolute biomasses of peaking ciliates in our study (interquartile range up to 30 μg/L) are well comparable with the results from, e.g., Lake Constance [16,54,70,71] but lower than in shallow eutrophic lakes [59,72,73,74]. This aligns with the observed oligotrophication trend in the Slapy reservoir [40].
For the assortment of the ciliate species to feeding behaviour groups, we used detailed information on morphologically identified genera or species in QPS preparations (Table 1). We applied an epifluorescence examination of the ciliate vacuole content in parallel for a long time. Additionally, we used fluorescently labelled prey to confirm direct picoplankton ingestion by different ciliates in various water bodies [18,20,21,75] and our results were cross-checked with publications from other groups, specialised on the investigation of the ciliate role in the microbial loop [19,76,77].
Comparing the limnological variables, possible ciliate prey abundances, and the ciliates in the graphical presentation, one can state that everything is tightly coupled with the stratification of the reservoir along with a spring Chl a peak (April to May). Generally, phytoplankton and the ciliate growth concurred with the revised PEG model [4] but less with a scenario that Posch et al. [78] proposed because of a weakened summer phytoplankton peak in the Slapy reservoir. However, periods A and B present different patterns, and in particular, apparent relations between the variables might be different throughout the year (Figures S2, 3–5 and 9). During period A a typical eutrophic pattern was evident [4]. In contrast, period B exhibited characteristics more akin to oligotrophic conditions, like those found in Trauensee or Lake Zurich [26,28]. However, Pfister et al. [59], based on a well-supported database on fresh- and brackish water ciliates, stated that the species composition is not significantly different in water bodies of different phosphorus and chlorophyll concentrations, which control, however, the abundance of ciliates. It could apply to the annual means or medinas of the ciliate distribution, but according to our results, it may differ during the annual growth cycle.
The NMDS analysis identifies possible causal relations between the study years using the ciliate data covering all the assemblage annual peaks (for data selection, see Chapter 3.3; Figure 10). However, the grouping of years from periods A and B did not form such distinct clusters in the graph as in the case of environmental variables and possible ciliate prey.
The analysis identifies similar vector directions of the ciliate assemblage biomass, picoplankton filtering (PF) and raptorial and flagellate hunting ciliates (RH). PF were biomass dominating or important through the whole analysed period. Depending on the species composition, their first peak appeared before or during the stratification event, and the second passed the clear water phase until the end of the stratification. A common, halteriids (Halteria grandinella, Pelagohalteria viridis), and small strobilidiids (Rimostrombidium humile, R. brachykinetum and other unidentified species) were the most common bacterivores/omnivores of the lake communities [16,18,26,28,73,75]. On the other hand, the low importance of minute scuticociliates would be surprising if we did not consider the nearly permanent DO oversaturation of the Slapy reservoir surface while their optimum layer should be a local DO minimum [29,67]. Minute scuticociliates (Cyclidium glaucoma, Cinetochilum margaritaceum) were the most important species; it concurs with the observation of, e.g., Müller [16]. Solitary peritrichs, mainly Vorticella aqua-dulcis and Vorticella sp. colonising diatoms Fragillaria sp., and Pseudohaplocaulus sp. on cyanobacteria Anabaena sp. were the most common within the group [26]. Recently, a new observation confirmed the omnivory of peritrichs and, in the case of pelagic free-swimming vorticellids also, efficient ingestion of nanoplanktonic, e.g., cryptomonads [79,80].
RH did not reach high biomass (except for scarce, e.g., Pelagodileptus sp. or Lacrymaria sp., which were excluded from the analysis). Their occurrence with their food, e.g., HNF and related bacterioplankton is logical. As in other water bodies, Askenasia sp. and Lagynophrya spp., both heterotrophic and mixotrophic were common [18,26,81]. Minute Mesodinium spp. biomass replaced other RH during autumn-winter mixing (not included in the NMDS analysis). Though the median from period A was very low, in period B it was of the same value as the others with quite a high range. Freshwater mesodinia data are scarce [82].
Heterotrophic nanoplankton filtering ciliates (HN) presented the vector direction very differently. The group dominated by tintinnids presented the biomass peak before the stratification event. However, their feeding preference should be like those of mixotrophic nanoplankton filtering ciliates (MN), culminating just at the event of stratification. It is probable that tintinnids were entering the surface layer of the Slapy reservoir with the water inlet. In the Římov reservoir, the tinitinnid peak was localised at the temperature of the inlet river water flow [35,55]). Rimostrombidium lacustris should have the same feeding preferences as MN [47], but also, the ciliate maximum was observed when Rhodomonas spp. abundances would not support the ciliate growth.
The algae hunting (AH) ciliates´ vector is almost the same as that of MN. It could be related to their preferred prey, minute photosynthetic cryptomonads, including Rhodomonas spp. [47,79,81,83], but strombidiids use them mainly as a source of kleptoplasts [84,85]. On the other, the feeding group maximums occurred in different periods. AH winter/spring peaks were composed first of B. planctonicum, which should prefer temperatures below 18 °C [86]. It was followed by Urotricha spp. and, particularly in period B, by Histiobalantium spp. during the spring phytoplankton peak [26,28,30,47] but already dropping with the stable stratification, when MN reached their maximum.
After a short clear water phase (periodically observed in one sampling date), both AH and MN could develop again, though their growth was not already supported by rhodomonads; the discrepancy was already observed by Müller et al. [81]. We suppose both groups were eating also upon HNF, which were invisible in the feeding vacuoles. Ingestion of bacteria by minute prostomes (urotrichs, B. planctonicum) was negligible [18], and we never observed ingestion of them by Histiobalantium spp., as proven in cultures [81] but discarded, when suitable flagellate food was present [79,87]. Contrary to the above-mentioned experiments, we observed B. planctonicum at water temperatures up 22 °C during the summer phytoplankton peak.
However, feeding of strombidiids is not limited to nanophytoplankton, and they are efficient HNF and bacteria feeders [18,77,88,89], which explains their elevated biomass even in a lack of cryptomonads.
Median sampling results showing the annual cycle of the ciliate behavioural groups (Figure 11) could not be generalised because the range of data in any long-term monitored water body is wide due to “unusual years” (Figure 2 and Figure 10). The problem behind such observation is related to the “wished sampling period”, according to the ciliate generation times and monitoring programme possibilities. It was repeatedly shown that significant changes in the ciliate assemblage used to take place within a week period.
In other short studies carried out by our team, e.g., in the Římov reservoir, we sampled either the surface/epilimnion layer or the phase limits (thermocline/oxycline) or directly the river body within the reservoir water column [18,56,67,88]. It was proven that our reservoirs’ ciliate assemblage activity is not located on the surface, in the DO oversaturated layer, and that its importance is in the below-metalimnion layers with frequent DO depletion. On the one hand, it explains a predictable ciliate assemblage growth and observed discrepancies between the ciliates and their supposed prey abundance. The same pattern is known from the water bodies worldwide [19,21,25,26,28,29,32,33,34].
5. Conclusions
- The presented results as part of the long-term monitoring of reservoir Slapy, to which the ciliate analysis was added in 1994, is one of the longest from freshwater bodies.
- An application of the most straightforward statistical approach of median and interquartile range on a two-decade monitoring data on ciliates in the Slapy reservoir gave results which confirmed ciliate position in the updated PEG model, showing two main peaks related to a spring and summer phytoplankton maximums.
- The observation period was divided into two sections, which differed in terms of the reservoir's nutrient load and were associated with different patterns. In the first period, with higher nutrient loading, the spring peak of ciliate biomass was much higher than the summer one. Apparently, the phytoplankton suppressed the ciliate growth. During the lower nutrient loading period, two similarly high peaks were observed, consisting mainly of mixotrophic species.
- If the ciliate biomass data were time-normalised using a calculated day of stratification, a spring peak and a clear water phase would be very well defined. However, no adequate improvement was observed at the end of the stratification as the duration of the stratification varied.
- It has been shown that the empirical chlorophyll a concentrations marking the beginning of the spring peak at 5 µg/L and the end of the summer peak at 7 µg/L coincide with the main peak of the ciliates: The spring peak of algae-hunting ciliates (Balanion planctonicum, urotrichs; more recently also Histiobalantium spp.) and heterotrophic nanoplankton-filtering tintinnids before stratification, and a peak of mixotrophic nanoplankton filtering ciliates in the stratification event, which lasted longer during the period of lower nutrient load. However, the ciliates showed a higher biomass before the summer peak of chlorophyll a. Only one ciliate, the genus Mesodinium, reached its maximum during the autumn mixing.
- Using the hydrodynamic model to calculate the water age in the epilimnion/surface layer proved useful for understanding ciliate growth there; the layer was well separated, which explains the straightforward behaviour of the ciliates and the composition assemblage changes with increasing nutrient limitation. On the other hand, no information can be extrapolated about the composition and activity of the ciliate assemblage in other parts of the water column.
- By monitoring the ciliate assemblages in the surface layers of different freshwater bodies, we gained valuable insights into their role within the microbial loop of the plankton food web. Our findings revealed an annual periodicity and long-term variations. It is recommended that future monitoring cover additional layers, such as deep chlorophyll a maximum or oxygen local minimum, if present, to capture the complexity of water bodies such as reservoirs or lakes with continuous river flow.
Supplementary Materials
The following supporting information can be downloaded at the website of this paper posted on Preprints.org, Figure S1: Physical-chemical variables in Slapy reservoir, annual and stratification periods’ means. Figure S2: Median and interquartile range of data during the periods A and B. Figure S3: Nanoplankton filtering ciliates. Figure S4: Picoplankton filtering ciliates. Figure S5: Algae hunting ciliates. Figure S6: Raptorial and flagellate hunting ciliates.
Author Contributions
Conceptualization, M.M. and J.V.; methodology, M.M., J.H., K.Ř. ; software, J.J., M.M. and M.Š.; validation, M.M., J.H. and K.Ř.; formal analysis, M.M., J.J. and M.Š.; investigation, J.V., M.M. and M.Š; data curation, M.M.; writing—original draft preparation, M.M.; writing—review and editing, J.V., J.H., K.Ř.; visualization, M.M. and M.Š.; supervision, we have not got any; project administration, J.V.; funding acquisition, J.V. and past members of today Institute of Hydrobiology, České Budějovice. All authors have read and agreed to the published version of the manuscript.
Funding
This research was funded by the long-term reservoir monitoring funded by the IHB BC CAS, and J.V., J.H., M.M. and M.Š, were partly granted by Czech Science Foundation (GA ČR) grant 15-04034S (2015–2017) “Do long-term zooplankton data in the Slapy reservoir reflect land use and/or climate changes in the past 50 years?”.
Institutional Review Board Statement
Not applicable.
Data Availability Statement
The data, including total ciliate assemblage abundance and biomass, are deposited in the IHB BC CAS. If collaborative analysis is required, ciliate species data are available on demand from M.M.
Acknowledgements
The research would not be possible without the leadership of Viera Straškrábová, D.Sc., the founder of today's Dept. Aquatic Microbial Ecology and then director of the Institute. In introducing the modern microbial ecology methods, Prof. Karel Šimek was another key investigator behind the evaluation of ciliates’ behaviour. M.M. thank the IHB BC CAS and UNAM México, which made possible so long active collaboration, partly supported by the academic exchange programme of CONACYT, México.
Conflicts of Interest
The authors declare no conflicts of interest. The funders had no role in the design of the study; in the collection, analyses, or interpretation of data; in the writing of the manuscript; or in the decision to publish the results.
References
- Foissner, W.; Berger, H.; Schaumburg, J. Identification and Ecology of Limnetic Plankton Ciliates; Informationsberichte; Informationberichte des Bayerischen Landesamtes Institut für Wasserwirtschaft: Munich, 1999; ISBN 978-3-930253-79-1.
- Weisse, T.; Montagnes, D.J.S. Ecology of Planktonic Ciliates in a Changing World: Concepts, Methods, and Challenges. J. Eukaryot. Microbiol. 2022, 69, e12879. [CrossRef]
- Plattner, H. Ciliate Research: From Myth to Trendsetting Science. J. Eukaryot. Microbiol. 2022, 69, e12926. [CrossRef]
- Sommer, U.; Adrian, R.; De Senerpont Domis, L.; Elser, J.J.; Gaedke, U.; Ibelings, B.; Jeppesen, E.; Lürling, M.; Molinero, J.C.; Mooij, W.M.; et al. Beyond the Plankton Ecology Group (PEG) Model: Mechanisms Driving Plankton Succession. Annu. Rev. Ecol. Evol. Syst. 2012, 43, 429–448. [CrossRef]
- Zimmermann, R.; Meyer-Reil, L.-A. A New Method for Fluorescence Staining of Bacterial Populations on Membrane Filters. 30, 24–27. https://oceanrep.geomar.de/id/eprint/56019.
- Caron, D.A. Technique for Enumeration of Heterotrophic and Phototrophic Nanoplankton, Using Epifluorescence Microscopy, and Comparison with Other Procedures. Appl. Environ. Microbiol. 1983, 46, 491–498. [CrossRef]
- Porter, K.G.; Feig, Y.S. The Use of DAPI for Identifying and Counting Aquatic Microflora1. Limnol. Oceanogr. 1980, 25, 943–948. [CrossRef]
- Azam, F.; Fenchel, T.; Field, J.; Gray, J.; Meyer-Reil, L.; Thingstad, F. The Ecological Role of Water-Column Microbes in the Sea. Mar. Ecol. Prog. Ser. 1983, 10, 257–263. [CrossRef]
- Sherr, E.B.; Sherr, B.F. Protistan Grazing Rates via Uptake of Fluorescently Labeled Prey. In Handbook of Methods on Aquatic Microbial Ecology; Kemp, P.F., Sherr, B.F., Sherr, E.B., Cole, J.J., Eds.; Lewis Publishers: London, 1993; pp. 695–701.
- Sherr, E.B.; Sherr, B.F.; Berman, T.; Hadas, O. High Abundance of Picoplankton-Ingesting Ciliates during Late Fall in Lake Kinneret, Israel. J. Plankton Res. 1991, 13, 789–799. [CrossRef]
- Gifford, D.J. Consumption of Protozoa by Copepods Feeding on Natural Microplankton Assemblages. In Handbook of Methods on Aquatic Microbial Ecology; Kemp, P.F., Sherr, B.F., Sherr, E.B., Cole, J.J., Eds.; Lewis Publishers: London, 1993; pp. 723–729.
- Stoecker, D.; Pierson, J. Predation on Protozoa: Its Importance to Zooplankton Revisited. J. Plankton Res. 2019, 41, 367–373. [CrossRef]
- Hecky, R.E.; Kling, H.J. The Phytoplankton and Protozooplankton of the Euphotic Zone of Lake Tanganyika: Species Composition, Biomass, Chlorophyll Content, and Spatio-temporal Distribution1. Limnol. Oceanogr. 1981, 26, 548–564. [CrossRef]
- Sherr, E.B.; Sherr, B.F. Preservation and Storage of Samples for Enumeration of Heterotrophic Protists. In Handbook of Methods on Aquatic Microbial Ecology; Kemp, P.F., Sherr, B.F., Sherr, E.B., Cole, J.J., Eds.; Lewis Publishers: London, 1993; pp. 207–212.
- Stoecker, D.K.; Gifford, D.J.; Putt, M. Preservation of Marine Planktonic Ciliates: Losses and Cell Shrinkage during Fixation. Mar. Ecol. Prog. Ser. 1994, 110, 293–299. [CrossRef]
- Müller, H. The Relative Importance of Different Ciliate Taxa in the Pelagic Food Web of Lake Constance. Microb. Ecol. 1989, 18, 261–273. [CrossRef]
- Gaedke, U.; Wickham, S.A. Ciliate Dynamics in Response to Changing Biotic and Abiotic Conditions in a Large, Deep Lake (Lake Constance). Aquat. Microb. Ecol. 2004, 34, 247–261. [CrossRef]
- Šimek, K.; Bobková, J.; Macek, M.; Nedoma, J.; Psenner, R. Ciliate grazing on Picoplankton in a Eutrophic Reservoir during the Summer Phytoplankton Maximum: A Study at the Species and Community Level. Limnol. Oceanogr. 1995, 40, 1077–1090. [CrossRef]
- Hadas, O.; Berman, T. Seasonal Abundance and Vertical Distribution of Protozoa (Flagellates, Ciliates), and Bacteria in Lake Kinneret, Israel. Aquat. Microb. Ecol. 1998, 14, 161–170. [CrossRef]
- Peštová, D.; Macek, M.; Martínez-Pérez, M.E. Ciliates and Their Picophytoplankton-Feeding Activity in a High-Altitude Warm-Monomictic Saline Lake. Eur. J. Protistol. 2008, 44, 13–25. [CrossRef]
- Bautista-Reyes, F.; Macek, M. Ciliate Food Vacuole Content and Bacterial Community Composition in the Warm-Monomictic Crater Lake Alchichica, México. FEMS Microbiol. Ecol. 2012, 79, 85–97. [CrossRef]
- Montagnes, D.J.S.; Lynn, D.H. A Quantitative Protargol Stain (QPS) for Ciliates and Other Protists. In Handbook of Methods on Aquatic Microbial Ecology; Kemp, P.F., Sherr, B.F., Sherr, E.B., Cole, J.J., Eds.; Lewis Publishers: London, 1993; pp. 229–240.
- Skibbe, O. An Improved Quantitative Protargol Stain for Ciliates and Other Planktonic Protists. Arch. Hydrobiol. 1994, 130, 339–347. [CrossRef]
- Pfister, G.; Sonntag, B.; Posch, T. Comparison of a Direct Live Count and an Improved Quantitative Protargol Stain (QPS) in Determining Abundance and Cell Volumes of Pelagic Freshwater Protozoa. Aquat. Microb. Ecol. 1999, 18, 95–103. [CrossRef]
- Sonntag, B.; Posch, T.; Klammer, S.; Griebler, C.; Psenner, R. Protozooplankton in the Deep Oligotrophic Traunsee (Austria) Influenced by Discharges of Soda and Salt Industries. Water Air Soil Pollut. Focus 2002, 2, 211–226. [CrossRef]
- Sonntag, B.; Posch, T.; Klammer, S.; Teubner, K.; Psenner, R. Phagotrophic Ciliates and Flagellates in an Oligotrophic, Deep, Alpine Lake: Contrasting Variability with Seasons and Depths. Aquat. Microb. Ecol. 2006, 43, 193–207. [CrossRef]
- Macek, M.; Callieri, C.; Šimek, K.; Lugo-Vázquez, A. Seasonal Dynamics, Composition and Feeding Patterns of Ciliate Assemblages in Oligotrophic Lakes Covering a Wide pH Range. Arch. Für Hydrobiol. 2006, 166, 261–287. [CrossRef]
- Posch, T.; Eugster, B.; Pomati, F.; Pernthaler, J.; Pitsch, G.; Eckert, E.M. Network of Interactions Between Ciliates and Phytoplankton During Spring. Front. Microbiol. 2015, 6. [CrossRef]
- Sánchez Medina, X.; Macek, M.; Bautista-Reyes, F.; Perz, A.; Bonilla Lemus, P.; Chávez Arteaga, M. Inter-Annual Ciliate Distribution Variation within the Late Stratification Oxycline in a Monomictic Lake, Lake Alchichica (Mexico). J. Limnol. 2016, 75. [CrossRef]
- Pitsch, G.; Bruni, E.P.; Forster, D.; Qu, Z.; Sonntag, B.; Stoeck, T.; Posch, T. Seasonality of Planktonic Freshwater Ciliates: Are Analyses Based on V9 Regions of the 18S rRNA Gene Correlated with Morphospecies Counts? Front. Microbiol. 2019, 10, 248. [CrossRef]
- Dirren-Pitsch, G.; Bühler, D.; Salcher, M.M.; Bassin, B.; Le Moigne, A.; Schuler, M.; Pernthaler, J.; Posch, T. FISHing for Ciliates: Catalyzed Reporter Deposition Fluorescence in Situ Hybridization for the Detection of Planktonic Freshwater Ciliates. Front. Microbiol. 2022, 13, 1070232. [CrossRef]
- Finlay, B.J.; Esteban, G.F. Planktonic Ciliate Species Diversity as an Integral Component of Ecosystem Function in a Freshwater Pond. Protist 1998, 149, 155–165. [CrossRef]
- Taylor, W.D.; Heynen, M.L. Seasonal and Vertical Distribution of Ciliophora in Lake Ontario. Can. J. Fish. Aquat. Sci. 1987, 44, 2185–2191. [CrossRef]
- Madoni, P. The Ciliated Protozoa of the Monomictic Lake Kinneret (Israel): Species Composition and Distribution during Stratification. Hydrobiologia 1990, 190, 111–120. [CrossRef]
- Macek, M. Distribution of Ciliates in the Římov Reservoir. Ergeb. Limnol. 1994, 40, 137–141.
- Qu, Z.; Forster, D.; Bruni, E.P.; Frantal, D.; Kammerlander, B.; Nachbaur, L.; Pitsch, G.; Posch, T.; Pröschold, T.; Teubner, K.; et al. Aquatic Food Webs in Deep Temperate Lakes: Key Species Establish through Their Autecological Versatility. Mol. Ecol. 2021, 30, 1053–1071. [CrossRef]
- Abdullah Al, M.; Wang, W.; Jin, L.; Chen, H.; Xue, Y.; Jeppesen, E.; Majaneva, M.; Xu, H.; Yang, J. Planktonic Ciliate Community Driven by Environmental Variables and Cyanobacterial Blooms: A 9-Year Study in Two Subtropical Reservoirs. Sci. Total Environ. 2023, 858, 159866. [CrossRef]
- Straškraba, M.; Hrbáček, J.; Javornický, P. Effect of an Upstream Reservoir on the Stratification Conditions in Slapy Reservoir. In Hydrobiological Studies 2; Hrbáček, J., Straškraba, M., Eds.; Academia, Prague, 1973; pp. 7–82.
- Kopáček, J.; Hejzlar, J.; Porcal, P.; Posch, M. Trends in Riverine Element Fluxes: A Chronicle of Regional Socio-Economic Changes. Water Res. 2017, 125, 374–383. [CrossRef]
- Kopáček, J.; Hejzlar, J.; Porcal, P.; Znachor, P. Biogeochemical Causes of Sixty-Year Trends and Seasonal Variations of River Water Properties in a Large European Basin. Biogeochemistry 2021, 154, 81–98. [CrossRef]
- Fott, J.; Nedbalová, L.; Brabec, M.; Kozáková, R.; Řeháková, K.; Hejzlar, J.; Šorf, M.; Vrba, J. Light as a Controlling Factor of Winter Phytoplankton in a Monomictic Reservoir. Limnologica 2022, 95, 125995. [CrossRef]
- Lewis Jr., W.M. A Revised Classification of Lakes Based on Mixing. Can. J. Fish. Aquat. Sci. 1983, 40, 1779–1787. [CrossRef]
- Vystavna, Y.; Hejzlar, J.; Kopáček, J. Long-Term Trends of Phosphorus Concentrations in an Artificial Lake: Socio-Economic and Climate Drivers. PLoS ONE 2017, 12, e0186917. [CrossRef]
- Cole, T.M. CE-QUAL-W2: A Two-Dimensional, Laterally Averaged, Hydrodynamic and Water Quality Model 2016.
- Monsen, N.E.; Cloern, J.E.; Lucas, L.V.; Monismith, S.G. A Comment on the Use of Flushing Time, Residence Time, and Age as Transport Time Scales. Limnol. Oceanogr. 2002, 47, 1545–1553. [CrossRef]
- Lorenzen, C.J. Determination of Chlorophyll and Pheo-Pigments: Spectrophotometric Equations. Limnol. Oceanogr. 1967, 12, 343–346. [CrossRef]
- Müller, H.; Schlegel, A. Responses of Three Freshwater Planktonic Ciliates with Different Feeding Modes to Cryptophyte and Diatom Prey. Aquat. Microb. Ecol. 1999, 17, 49–60. [CrossRef]
- Jerome, C.A.; Montagnes, D.J.S.; Taylor, F.J.R. The Effect of the Quantitative Protargol Stain and Lugol’s and Bouin’s Fixatives On Cell Size: A More Accurate Estimate of Ciliate Species Biomass. J. Eukaryot. Microbiol. 1993, 40, 254–259. [CrossRef]
- Adl, S.M.; Bass, D.; Lane, C.E.; Lukeš, J.; Schoch, C.L.; Smirnov, A.; Agatha, S.; Berney, C.; Brown, M.W.; Burki, F.; et al. Revisions to the Classification, Nomenclature, and Diversity of Eukaryotes. J. Eukaryot. Microbiol. 2019, 66, 4–119. [CrossRef]
- Straškrábová, V. Long-Term Development of Reservoir Ecosystems - Changes in Pelagic Food Webs and Their Microbial Component. Limnetica 2005, 24, 9–20. [CrossRef]
- Hyndman, R.J.; Fan, Y. Sample Quantiles in Statistical Packages. Am. Stat. 1996, 50, 361–365. [CrossRef]
- Motulsky, H.J. GraphPad Statistics Guide.; 2016.
- Ter Braak, C.J.F.; Šmilauer, P. Canoco Reference Manual and User’s Guide: Software for Ordination, Version 5.1x.; Microcomputer Power: Ithaca, USA, 2018.
- Weisse, T.; Müller, H.; Pinto-Coelho, R.M.; Schweizer, A.; Springmann, D.; Baldringer, G. Response of the Microbial Loop to the Phytoplankton Spring Bloom in a Large Prealpine Lake. Limnol. Oceanogr. 1990, 35, 781–794. [CrossRef]
- Macek, M.; Jezbera, J.; Sed’a, J.; Straškrábová, V.; Šimek, K.; Han, D. Distribution and Growth Rates of Ciliates along a Longitudinal Profile of the Římov Reservoir. In Proceedings of the ResLim 2002; Hydrobiol. Inst. Acad. Sci. Czech Rep. & Fac. Biol. Sci. Univ. South Bohemia: České Budějovice, Czech Republic, 2002; pp. 196–199.
- Jezbera, J.; Nedoma, J.; Šimek, K. Longitudinal Changes in Protistan Bacterivory and Bacterial Production in Two Canyon-Shaped Reservoirs of Different Trophic Status. Hydrobiologia 2003, 504, 115–130. [CrossRef]
- Jeppesen, E.; Sørensen, P.B.; Johansson, L.S.; Søndergaard, M.; Lauridsen, T.L.; Nielsen, A.; Mejlhede, P. Recovery of Lakes from Eutrophication: Changes in Nitrogen Retention Capacity and the Role of Nitrogen Legacy in 10 Danish Lakes Studied over 30 Years. Hydrobiologia 2024. [CrossRef]
- Krainer, K.-H. Taxonomische Untersuchungen an neuen und wenig be kannten planktischen Ciliaten (Protozoa: Ciliophora) aus Baggerseen in Österreich. Luterbornia 1995, 21, 39–68.
- Pfister, G.; Auer, B.; Arndt, H. Pelagic Ciliates (Protozoa, Ciliophora) of Different Brackish and Freshwater Lakes — a Community Analysis at the Species Level. Limnologica 2002, 32, 147–168. [CrossRef]
- Frantal, D.; Agatha, S.; Beisser, D.; Boenigk, J.; Darienko, T.; Dirren-Pitsch, G.; Filker, S.; Gruber, M.; Kammerlander, B.; Nachbaur, L.; et al. Molecular Data Reveal a Cryptic Diversity in the Genus Urotricha (Alveolata, Ciliophora, Prostomatida), a Key Player in Freshwater Lakes, With Remarks on Morphology, Food Preferences, and Distribution. Front. Microbiol. 2022, 12, 787290. [CrossRef]
- Humby, P.L.; Lynn, D.H. Taxonomic Description of Six Species of Pelagic, Freshwater Ciliates from the Order Choreotrichida Collected from Lake Ontario, Canada. Aquat. Ecosyst. Health Manag. 2020, 23, 45–57. [CrossRef]
- Krainer, K.-H. Contributions to the Morphology, Infraciliature and Ecology of the Planktonic Ciliates Strombidium pelagicum n.sp., Pelagostrombidium mirabile (Penard, 1916) n.g., n. comb., and Pelagostrombidium fallax (Zacharias, 1896) n.g., n. comb. (Ciliophora, Oligotrichida). Eur. J. Protistol. 1991, 27, 60–70. [CrossRef]
- Gao, F.; Li, J.; Song, W.; Xu, D.; Warren, A.; Yi, Z.; Gao, S. Multi-Gene-Based Phylogenetic Analysis of Oligotrich Ciliates with Emphasis on Two Dominant Groups: Cyrtostrombidiids and Strombidiids (Protozoa, Ciliophora). Mol. Phylogenet. Evol. 2016, 105, 241–250. [CrossRef]
- Ganser, M.H.; Santoferrara, L.F.; Agatha, S. Molecular Signature Characters Complement Taxonomic Diagnoses: A Bioinformatic Approach Exemplified by Ciliated Protists (Ciliophora, Oligotrichea). Mol. Phylogenet. Evol. 2022, 170, 107433. [CrossRef]
- Agatha, S.; Weißenbacher, B.; Kirschner, M.; Ganser, M.H. Trichite Features Contribute to the Revision of the Genus Strombidium (Alveolata, Ciliophora, Spirotricha). J. Eukaryot. Microbiol. 2024, 71, e13001. [CrossRef]
- Krainer, K.; Foissner, W. Revision of the Genus Askenasia Blochmann, 1895, with Proposal of Two New Species, and Description of Rhabdoaskenasia minima N. G., N. Sp. (Ciliophora, Cyclotrichida). J. Protozool. 1990, 37, 414–427. [CrossRef]
- Macek, M.; Šimek, K.; Pernthaler, J.; Vyhnálek, V.; Psenner, R. Growth Rates of Dominant Planktonic Ciliates in Two Freshwater Bodies of Different Trophic Degree. J. Plankton Res. 1996, 18, 463–481. [CrossRef]
- Küppers, G.C.; Lopretto, E.C.; Claps, M.C. Morphological Aspects and Seasonal Changes of Some Planktonic Ciliates (Protozoa) from a Temporary Pond in Buenos Aires Province, Argentina. Pan-Am. J. Aquat. Sci. 2006.
- Sommer, F.; Sonntag, B.; Rastl, N.; Summerer, M.; Tartarotti, B. Ciliates in Man-Made Mountain Reservoirs. Front. Environ. Sci. 2022, 10, 903095. [CrossRef]
- Cleven, E. Pelagic Ciliates in a Large Mesotrophic Lake: Seasonal Succession and Taxon-Specific Bacterivory in Lake Constance. Int. Rev. Hydrobiol. 2004, 89, 289–304. [CrossRef]
- Tirok, K.; Gaedke, U. Regulation of Planktonic Ciliate Dynamics and Functional Composition during Spring in Lake Constance. Aquat. Microb. Ecol. 2007, 49, 87–100. [CrossRef]
- Lischke, B.; Weithoff, G.; Wickham, S.A.; Attermeyer, K.; Grossart, H.-P.; Scharnweber, K.; HIlt, S.; Gaedke, U. Large Biomass of Small Feeders: Ciliates May Dominate Herbivory in Eutrophic Lakes. J. Plankton Res. 2016, 38, 2–15. [CrossRef]
- Šimek, K.; Grujčić, V.; Nedoma, J.; Jezberová, J.; Šorf, M.; Matoušů, A.; Pechar, L.; Posch, T.; Bruni, E.P.; Vrba, J. Microbial Food Webs in Hypertrophic Fishponds: Omnivorous Ciliate Taxa Are Major Protistan Bacterivores. Limnol. Oceanogr. 2019, 64, 2295–2309. [CrossRef]
- Liu, Y.; Dong, Y.; Zhao, F.; Zheng, S.; Wang, C.; Zhang, W. Distinct Distribution Patterns of Planktonic Ciliate Communities along Environmental Gradients in a Semi-Enclosed Bay. Ecol. Indic. 2022, 144, 109513. [CrossRef]
- Šimek, K.; Macek, M.; Pernthaler, J.; Straškrabová, V.; Psenner, R. Can Freshwater Planktonic Ciliates Survive on a Diet of Picoplankton? J. Plankton Res. 1996, 18, 597–613. [CrossRef]
- Fenchel, T. Protozoan Filter Feeding. Prog. Protistol. 1986, 1, 65–113.
- Bernard, C.; Rassoulzadegan, F. Bacteria or Microflagellates as a Major Food Source for Marine Ciliates: Possible Implications for the Microzooplankton. Mar. Ecol. Prog. Ser. 1990, 64, 147–155. [CrossRef]
- Posch, T.; Pitsch, G.; Bruni, E.P. Protists: Ciliates. In Encyclopedia of Inland Waters; Elsevier, 2022; pp. 639–649 ISBN 978-0-12-822041-2.
- Lu, X.; Gao, Y.; Weisse, T. Functional Ecology of Two Contrasting Freshwater Ciliated Protists in Relation to Temperature. J. Eukaryot. Microbiol. 2021, 68, e12823. [CrossRef]
- Weisse, T.; Jezberová, J.; Moser, M. Picoplankton Feeding by the Ciliate Vorticella similis in Comparison to Other Peritrichs Emphasizes Their Significance in the Water Purification Process. Ecol. Indic. 2021, 121, 106992. [CrossRef]
- Müller, H.; Schöne, A.; Pinto-Coelho, R.M.; Schweizer, A.; Weisse, T. Seasonal Succession of Ciliates in Lake Constance. Microb. Ecol. 1991, 21, 119–138. [CrossRef]
- Kammerlander, B.; Koinig, K.A.; Rott, E.; Sommaruga, R.; Tartarotti, B.; Trattner, F.; Sonntag, B. Ciliate Community Structure and Interactions within the Planktonic Food Web in Two Alpine Lakes of Contrasting Transparency. Freshw. Biol. 2016, 61, 1950–1965. [CrossRef]
- Müller, H. Laboratory Study of the Life Cycle of a Freshwater Strombidiid Ciliate. Aquat. Microb. Ecol. 2002, 29, 189–197. [CrossRef]
- Stoecker, D.K.; Johnson, M.D.; de Vargas, C.; Not, F. Acquired Phototrophy in Aquatic Protists. Aquat. Microb. Ecol. 2009, 57, 279–310. [CrossRef]
- Schoener, D.; McManus, G. Plastid Retention, Use, and Replacement in a Kleptoplastidic Ciliate. Aquat. Microb. Ecol. 2012, 67, 177–187. [CrossRef]
- Müller, H.; Geller, W. Maximum Growth Rates of Aquatic Ciliated Protozoa: The Dependence on Body Size and Temperature Reconsidered. Arch. Hydrobiol. 1993, 126, 315–327. [CrossRef]
- Müller, H.; Weisse, T. Laboratory and Field Observations on the Scuticociliate Histiobalantium from the Pelagic Zone of Lake Constance, FRG. J. Plankton Res. 1994, 16, 391–401. [CrossRef]
- Macek, M.; Šimek, K.; Bittl, T. Conspicuous Peak of Oligotrichous Ciliates Following Winter Stratification in a Bog Lake. J. Plankton Res. 2001, 23, 353–363. [CrossRef]
- Chen, W.-L.; Chiang, K.-P.; Tsai, S.-F. Neglect of Presence of Bacteria Leads to Inaccurate Growth Parameters of the Oligotrich Ciliate Strombidium Sp. During Grazing Experiments on Nanoflagellates. Front. Mar. Sci. 2020, 7, 569309. [CrossRef]
Figure 1.
Three weeks-interval values, and the annual- and stratification-mean of biological variables in the Slapy Reservoir (the mean points are drawn on the last period-day, either at the end of the year or the end of stratification). (a) Bacteria abundance (10⁶ cells/mL); (b) HNF abundance (10³ cells/mL); (c) Rhodomonas spp. abundance (10³ cells/mL); (d) Chlorophyll a (Chl a) concentration (μg/L).
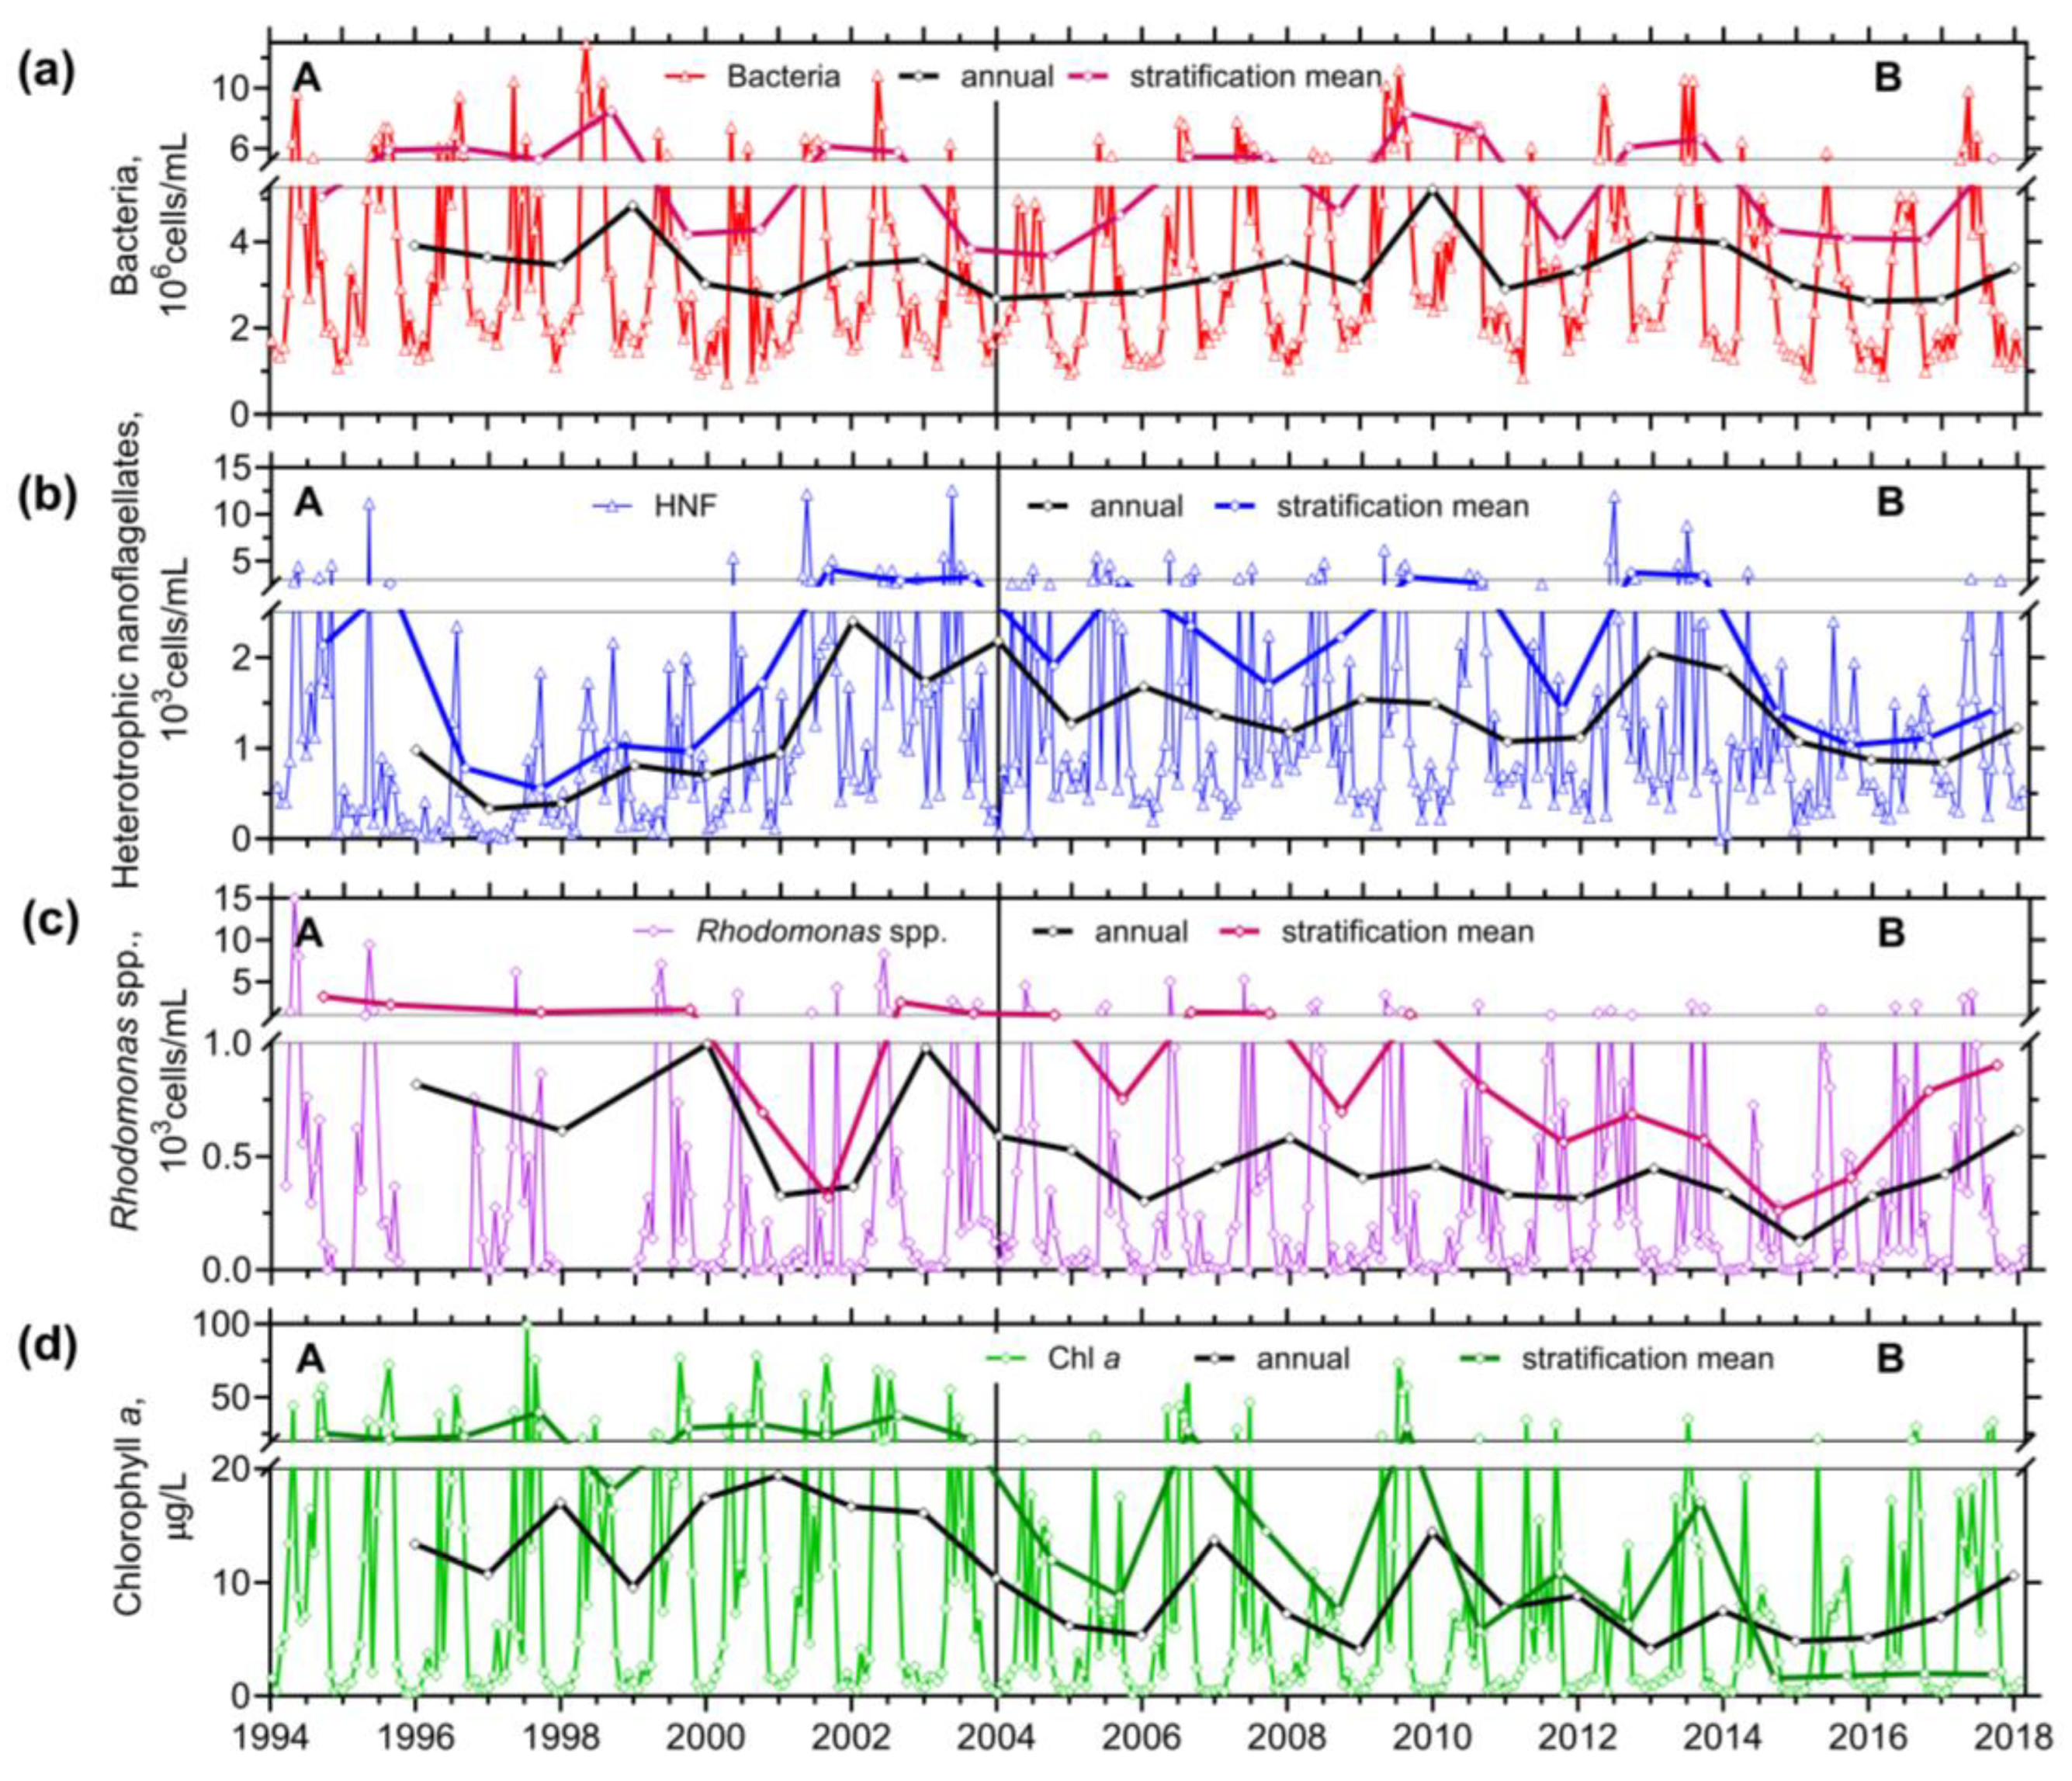
Figure 2.
Three weeks-interval values, and the annual- and stratification-mean of (a) ciliate abundance and (b) ciliate organic carbon biomass (the mean-points are drawn on the last period-day, either at the end of the year or the end of stratification); (c) the proportion of ciliate biomass of feeding behaviour groups in the Slapy Reservoir.
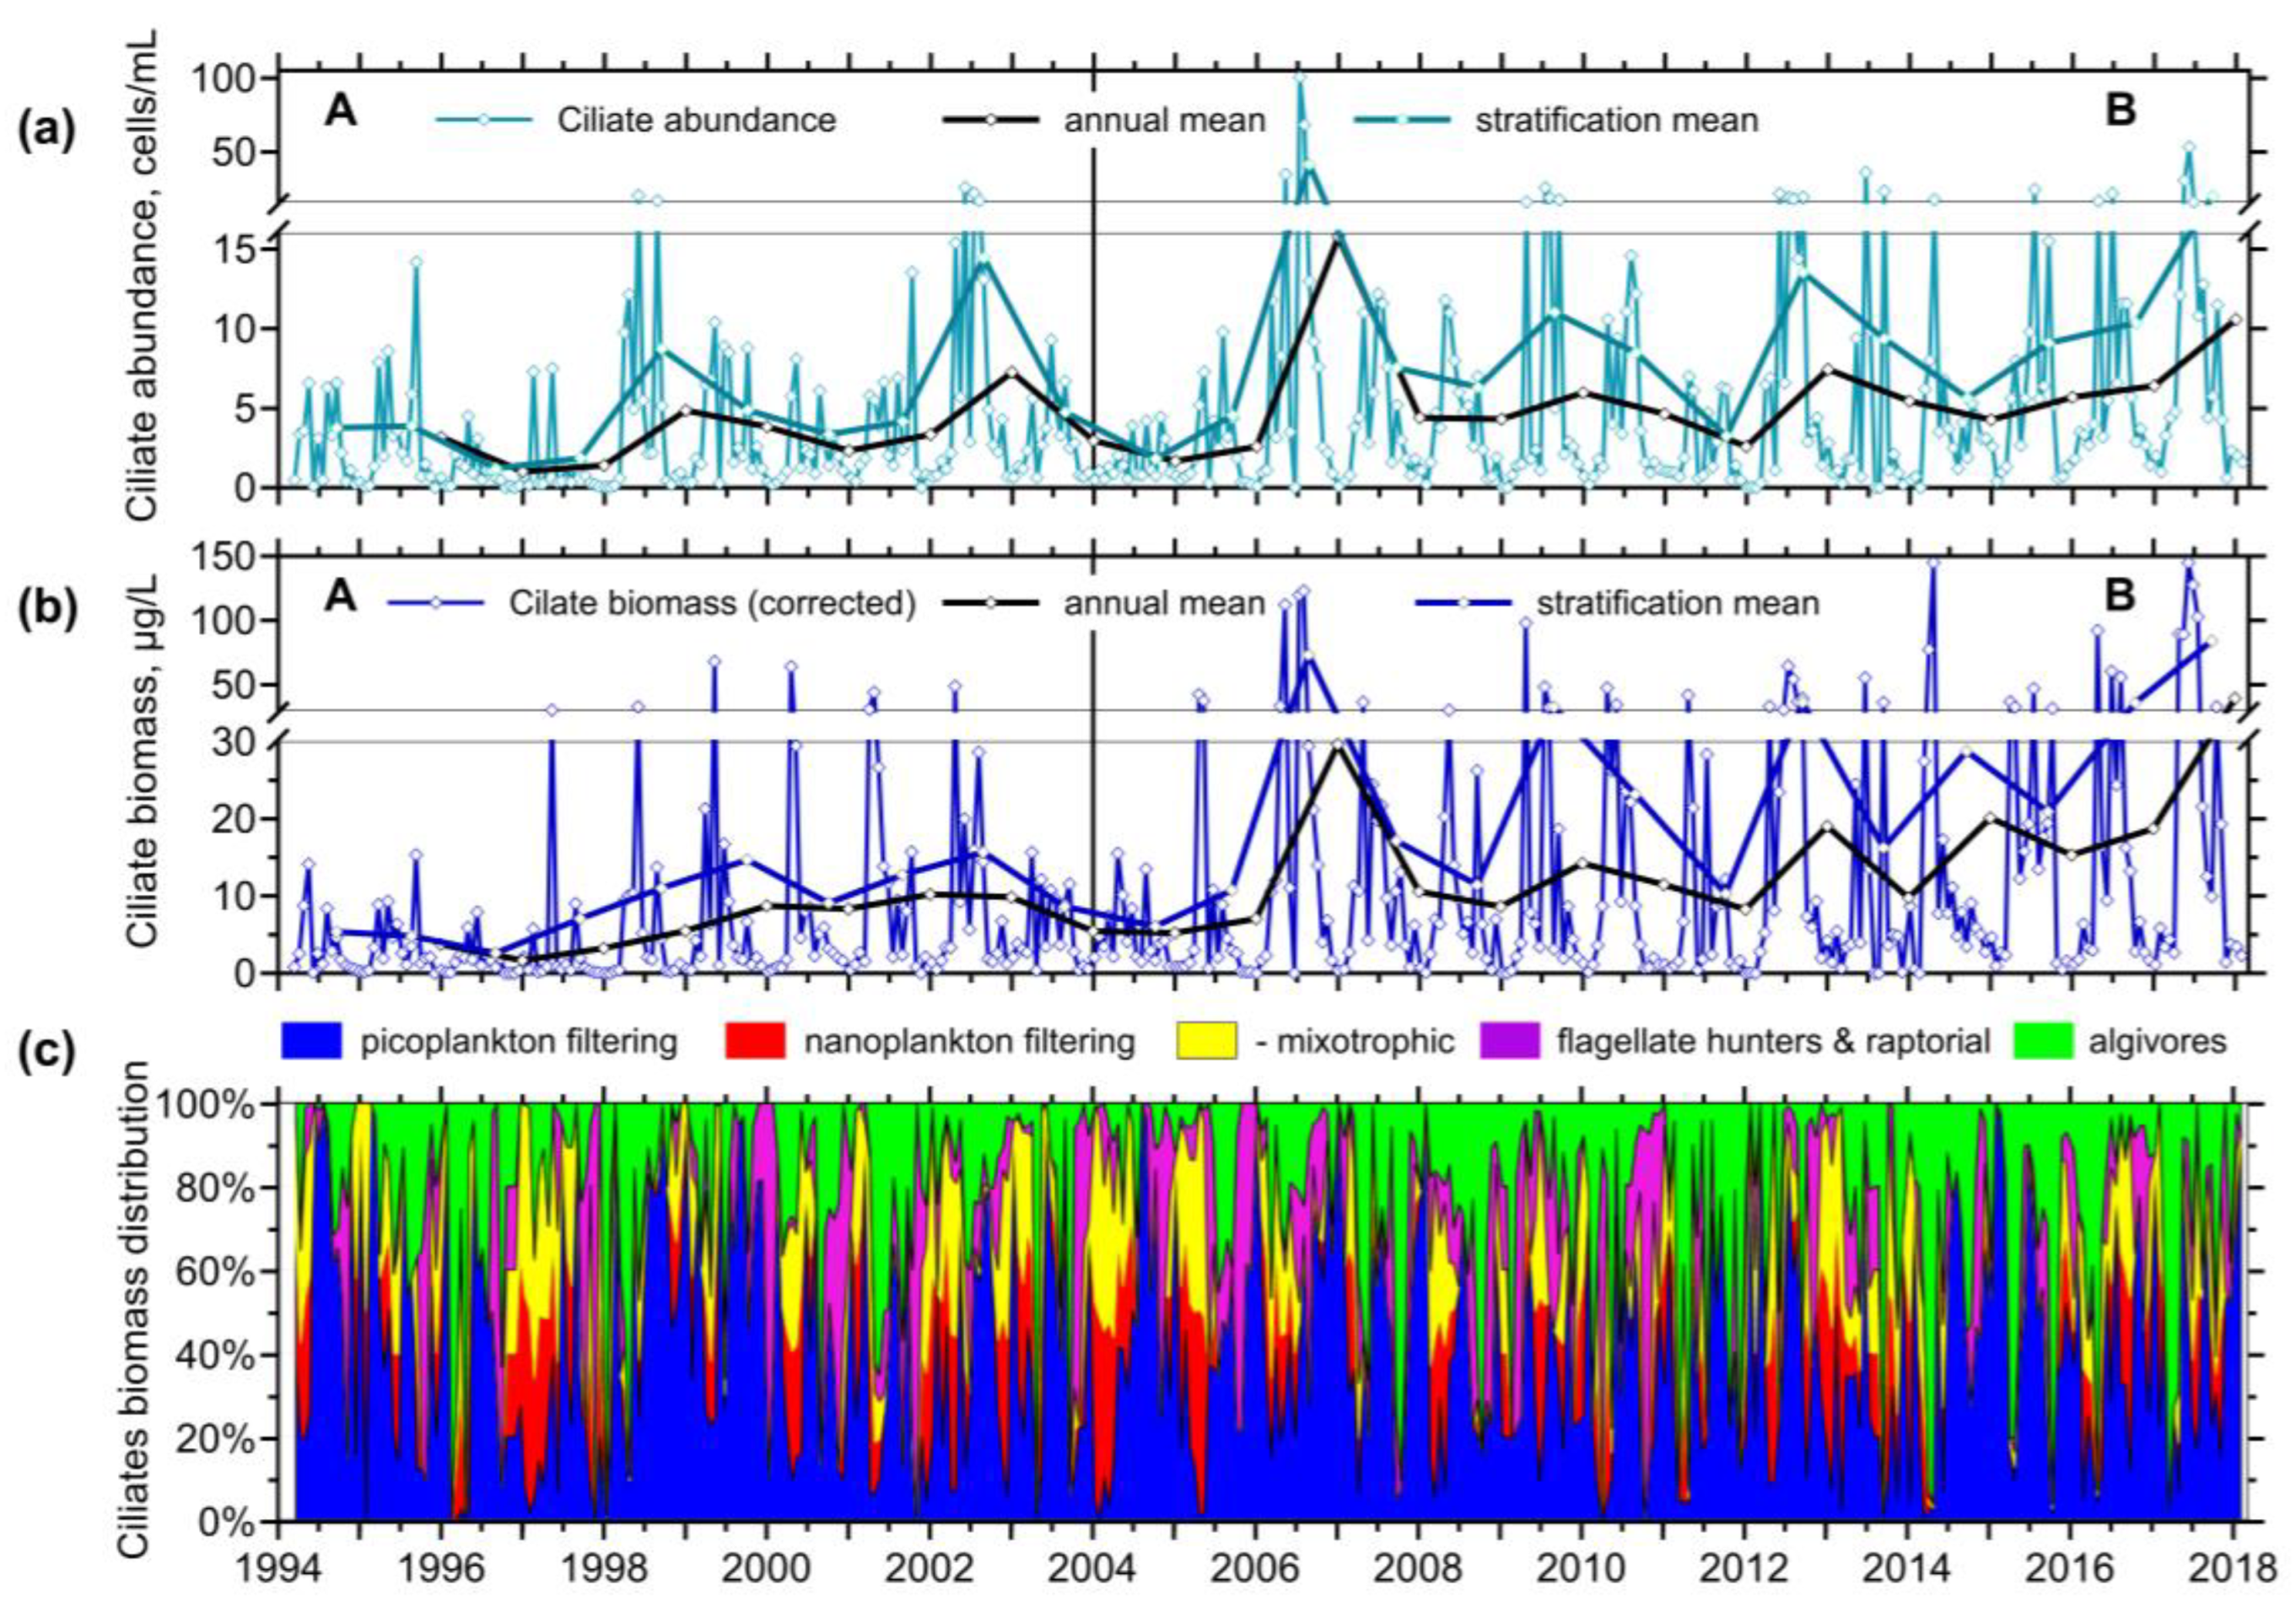
Figure 3.
Median and interquartile range data during the periods A and B: (a), (b) Rhodomonas spp. abundance and heterotrophic nanoflagellates (HNF); (c), (d) Chlorophyll a concentration (left axes) and abundances of bacteria (right axes). Criteria of Straškrábová et al. [50] of Chl a >5 μg/L, <7 μg/L, and <10 μg/L for the spring phytoplankton peak, a clear water phase, and the end of summer phytoplankton peak, respectively, were applied.
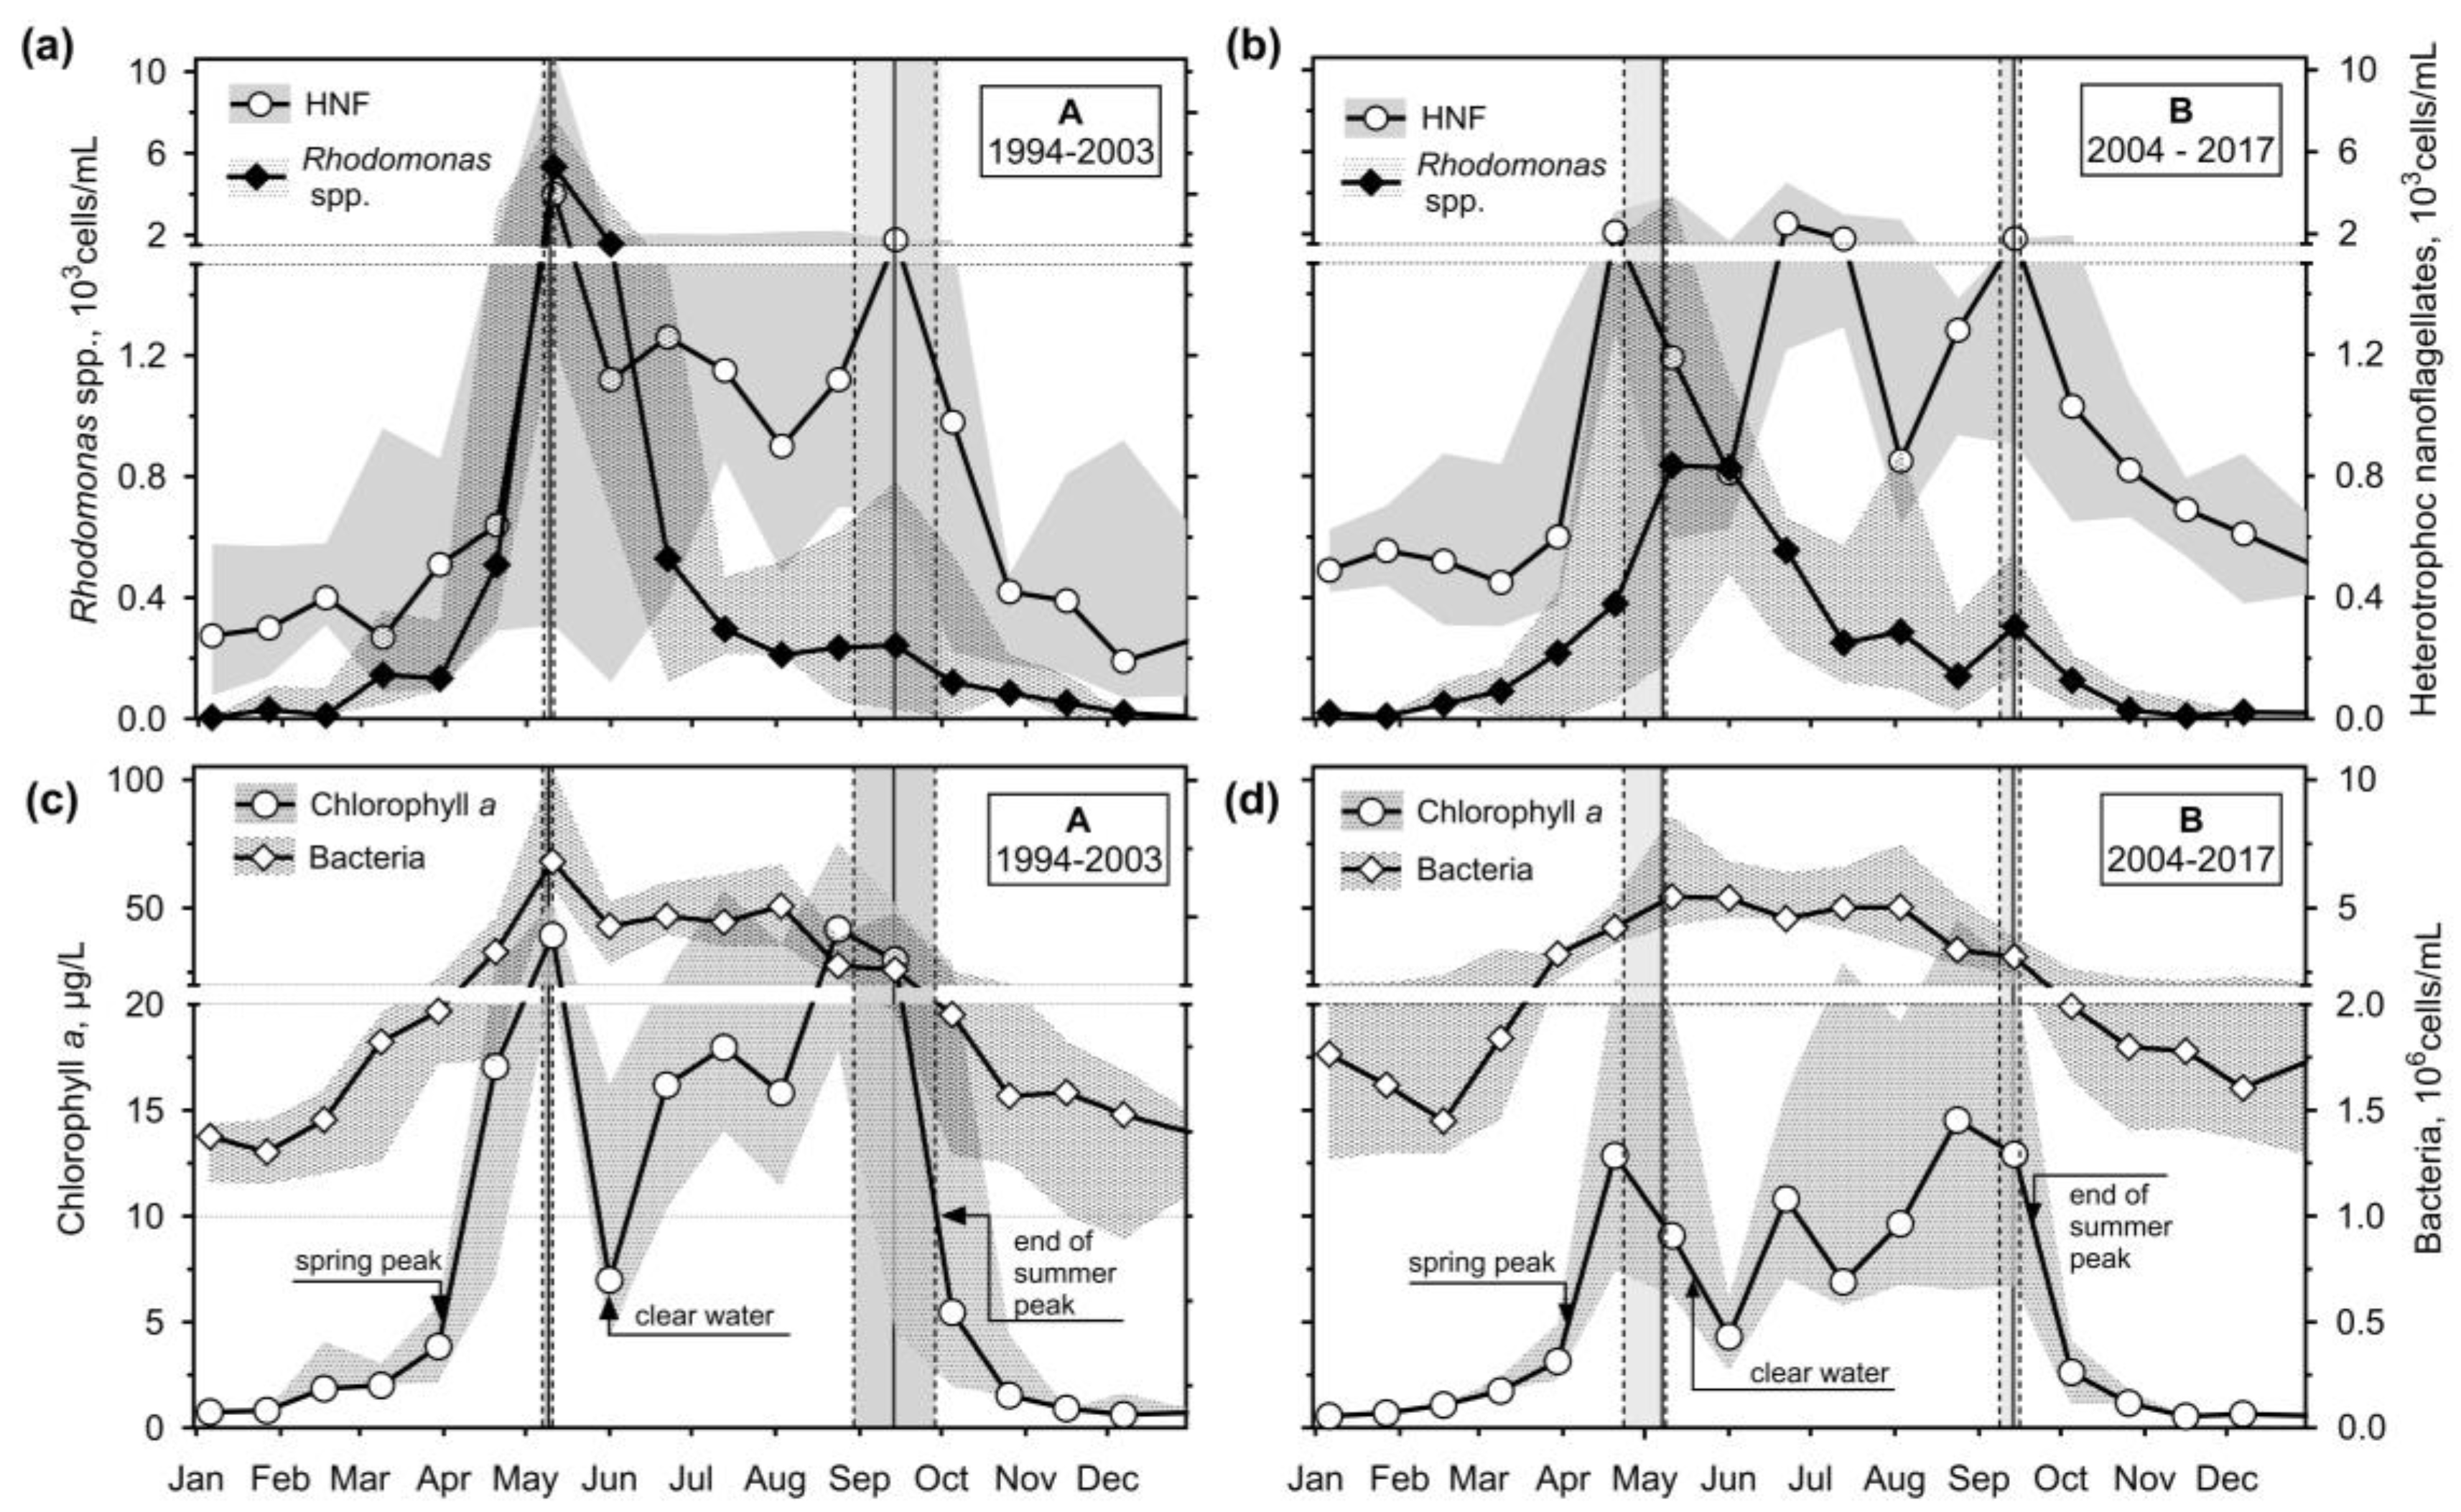
Figure 4.
Median and interquartile range ciliate abundance (left axes) and organic carbon biomass (right axes) throughout the study: (a), (b) Untreated sampling data from periods A and B; Vertical lines define the interval of found transition sampling days between the mixing and stratification; (c), ( d) stratification starting day normalised samplings; Vertical lines defined the chosen transition sampling Julian day between the mixing and stratification.
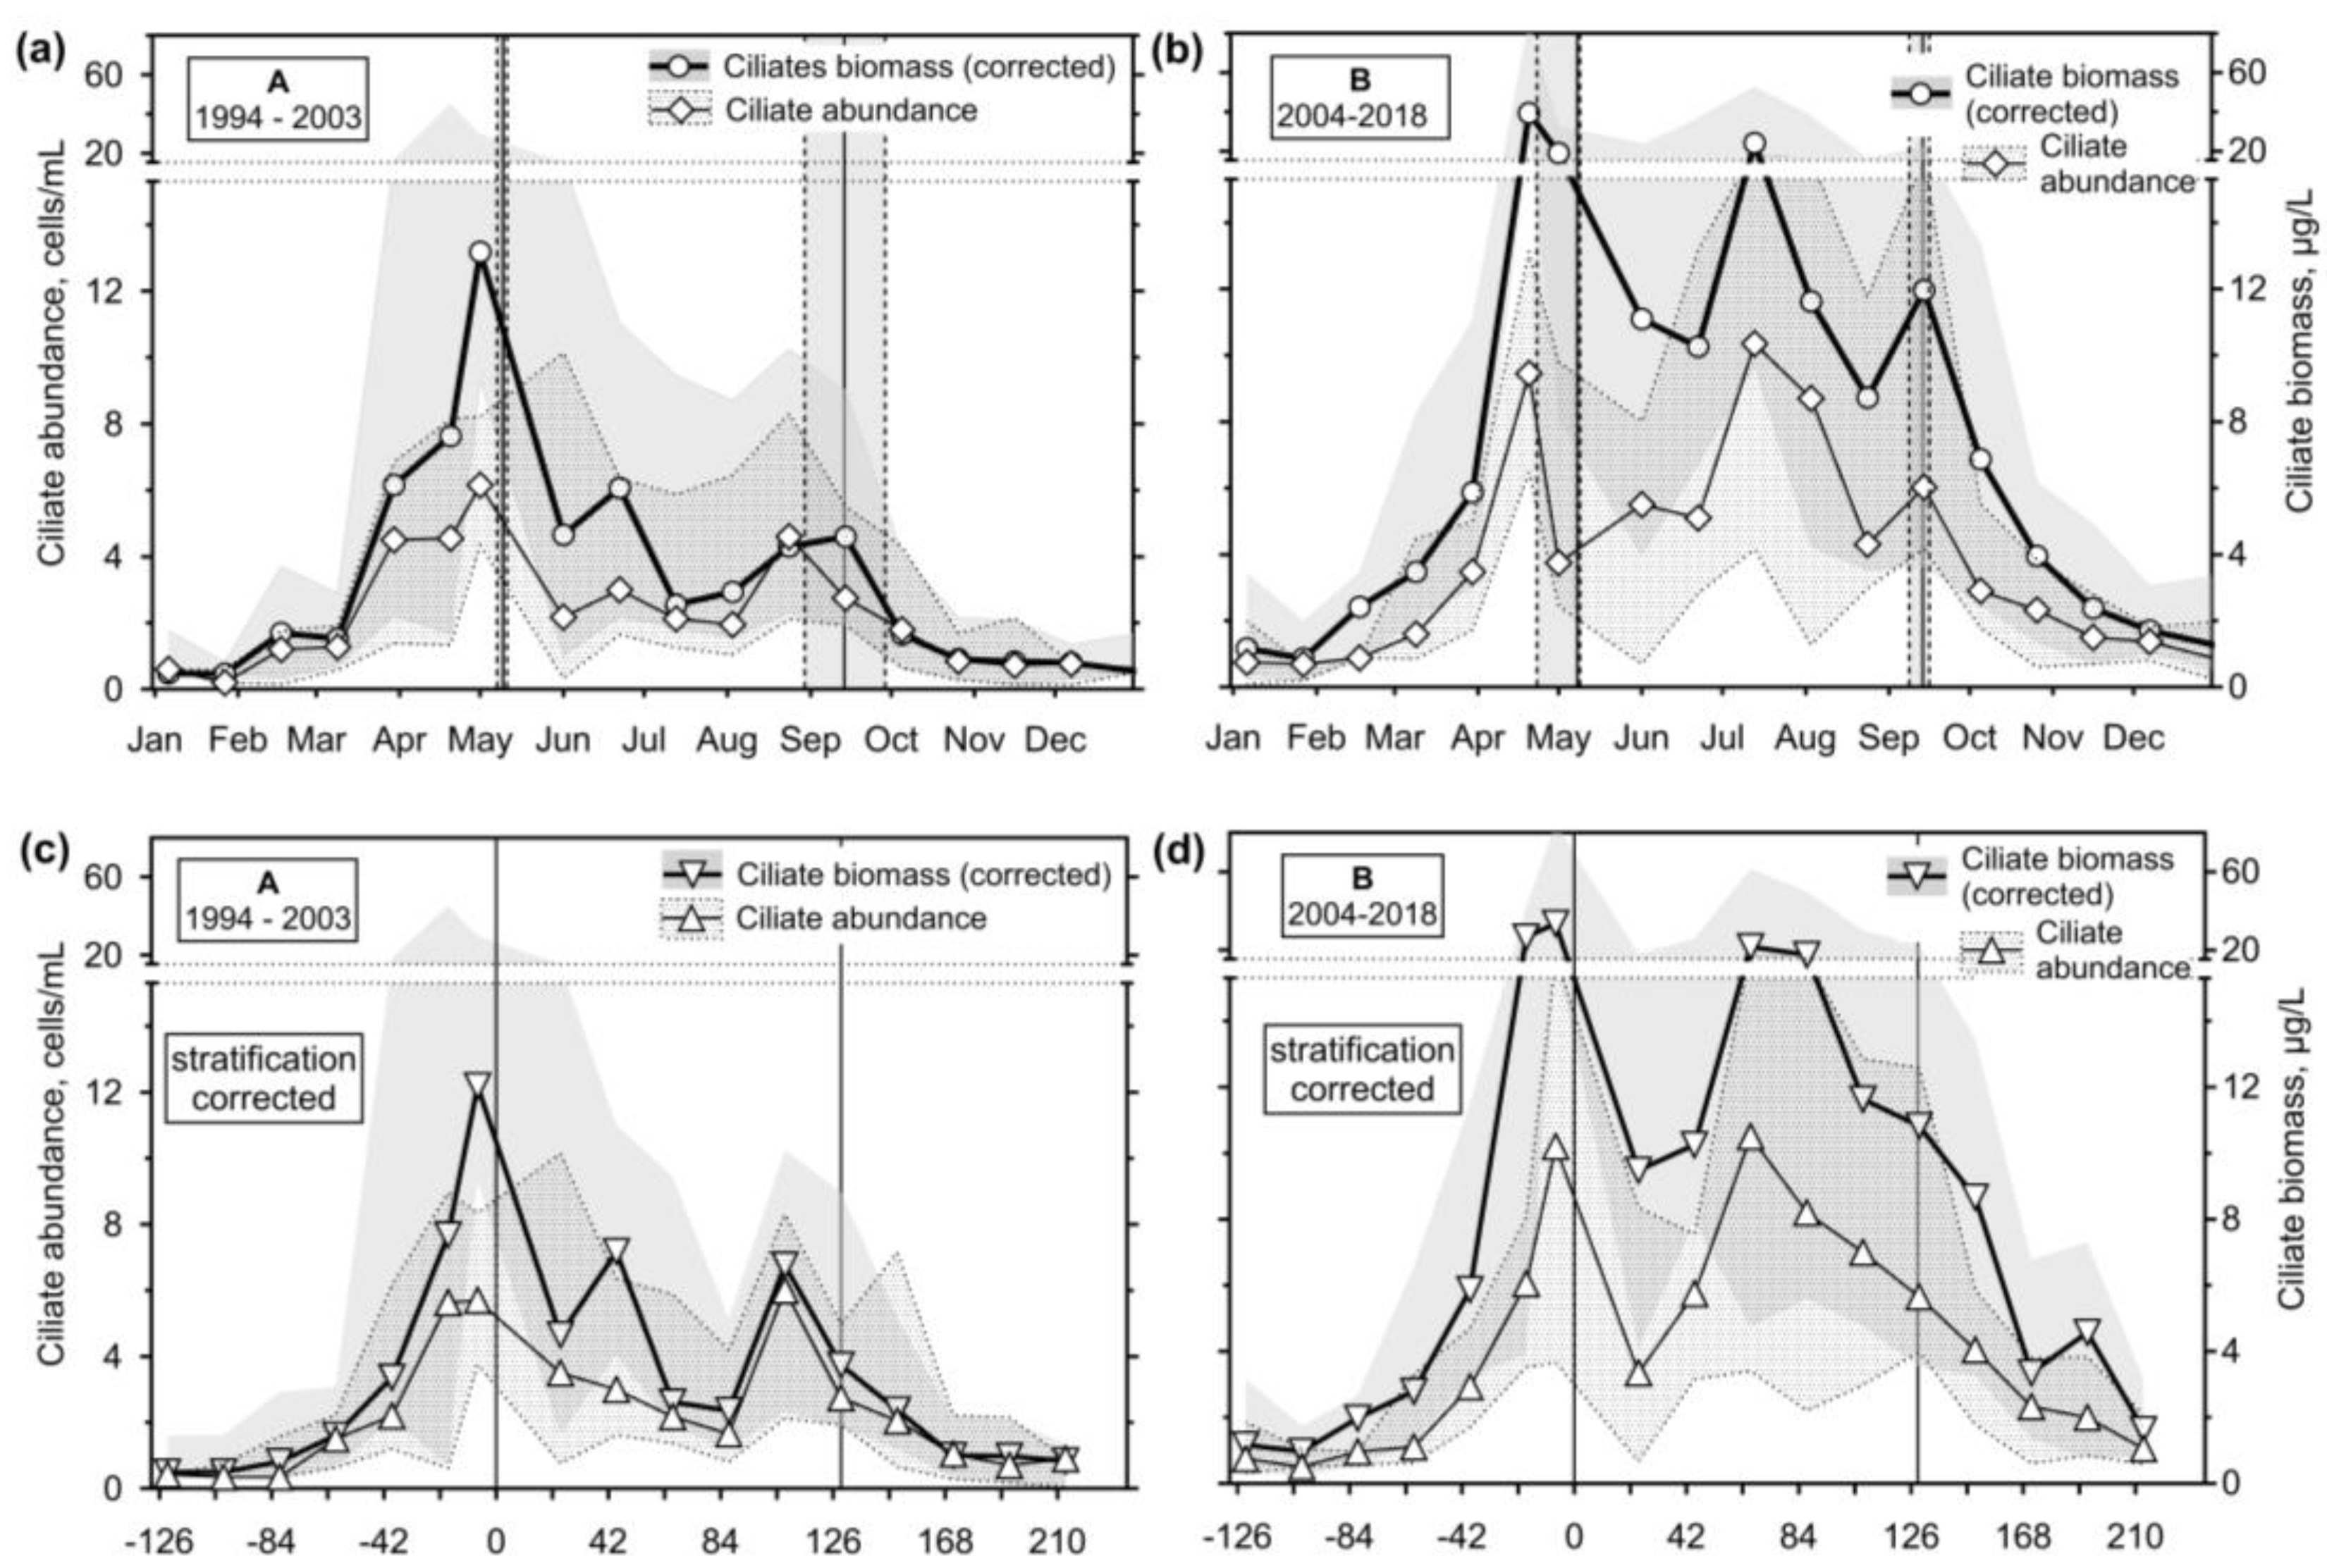
Figure 5.
Ciliate carbon biomass plot vs. dissolved oxygen (DO) and temperature (T) during the stratification and rest of the season.
Figure 5.
Ciliate carbon biomass plot vs. dissolved oxygen (DO) and temperature (T) during the stratification and rest of the season.
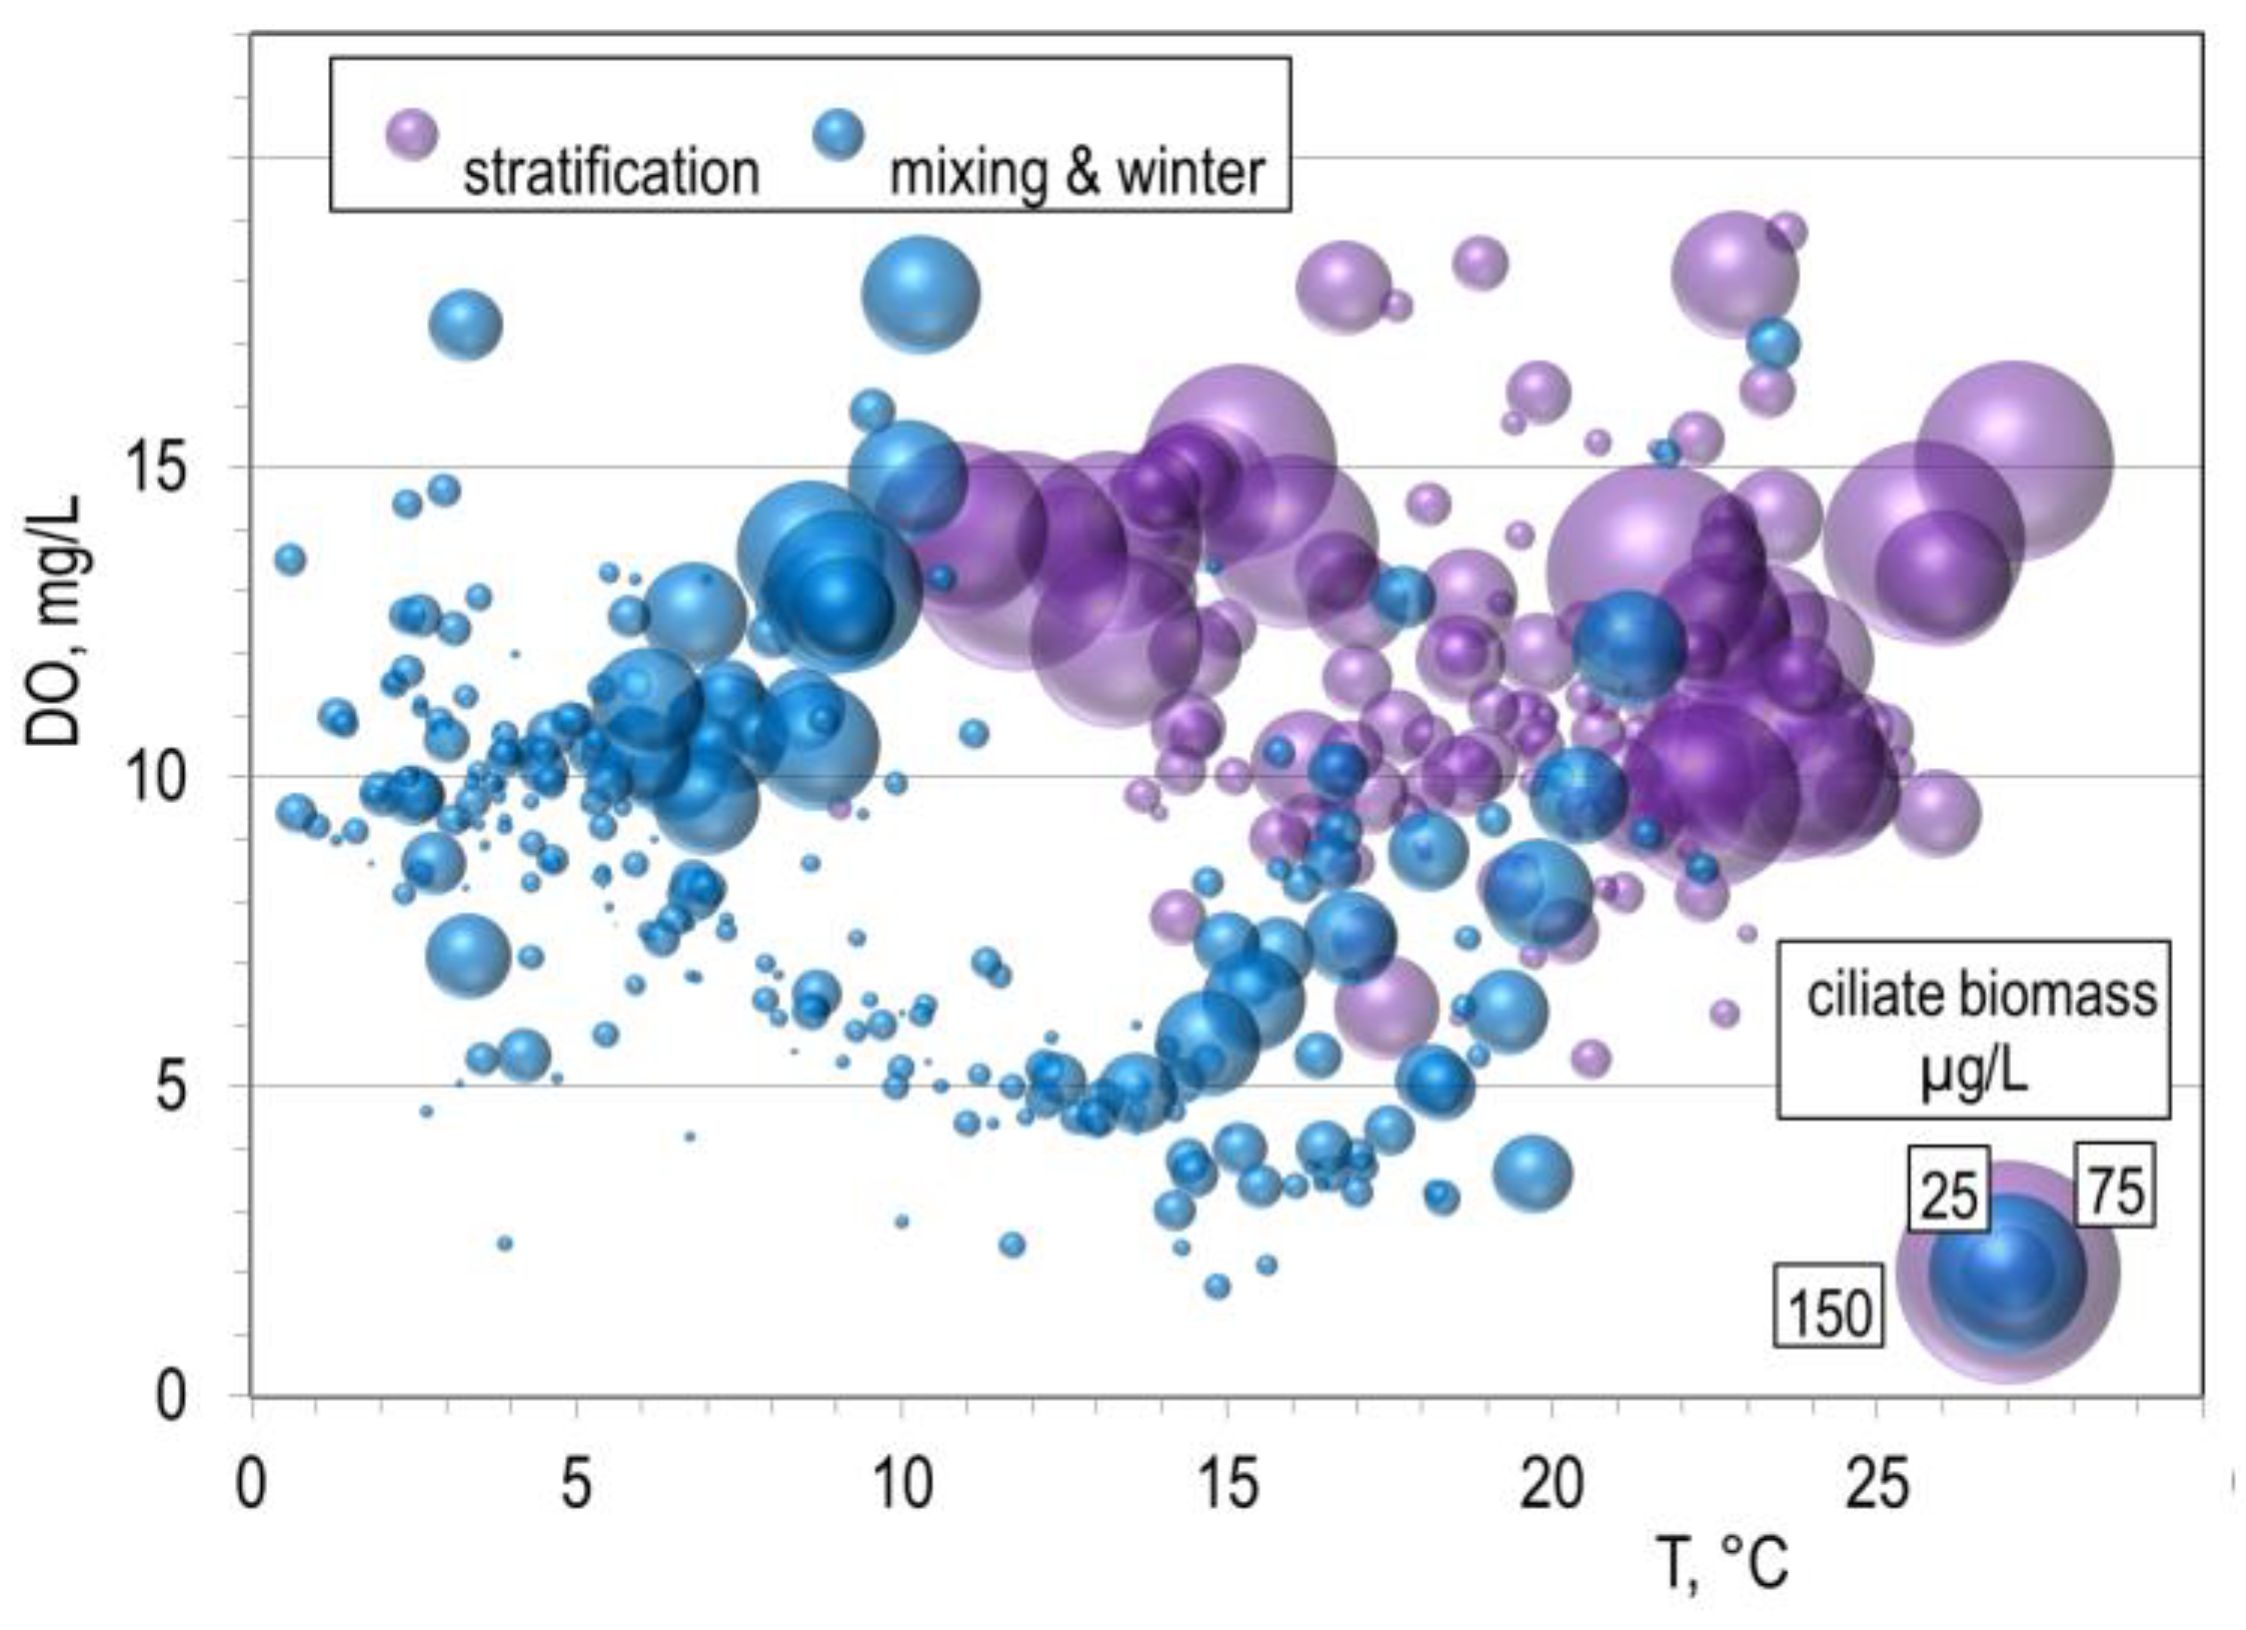
Figure 6.
The median and interquartile range of heterotrophic nanoplankton filtering ciliate organic carbon biomass (μg/L) and that of mixotrophic ones throughout the study; vertical lines define the median of transition sampling between mixing and stratification.
Figure 6.
The median and interquartile range of heterotrophic nanoplankton filtering ciliate organic carbon biomass (μg/L) and that of mixotrophic ones throughout the study; vertical lines define the median of transition sampling between mixing and stratification.
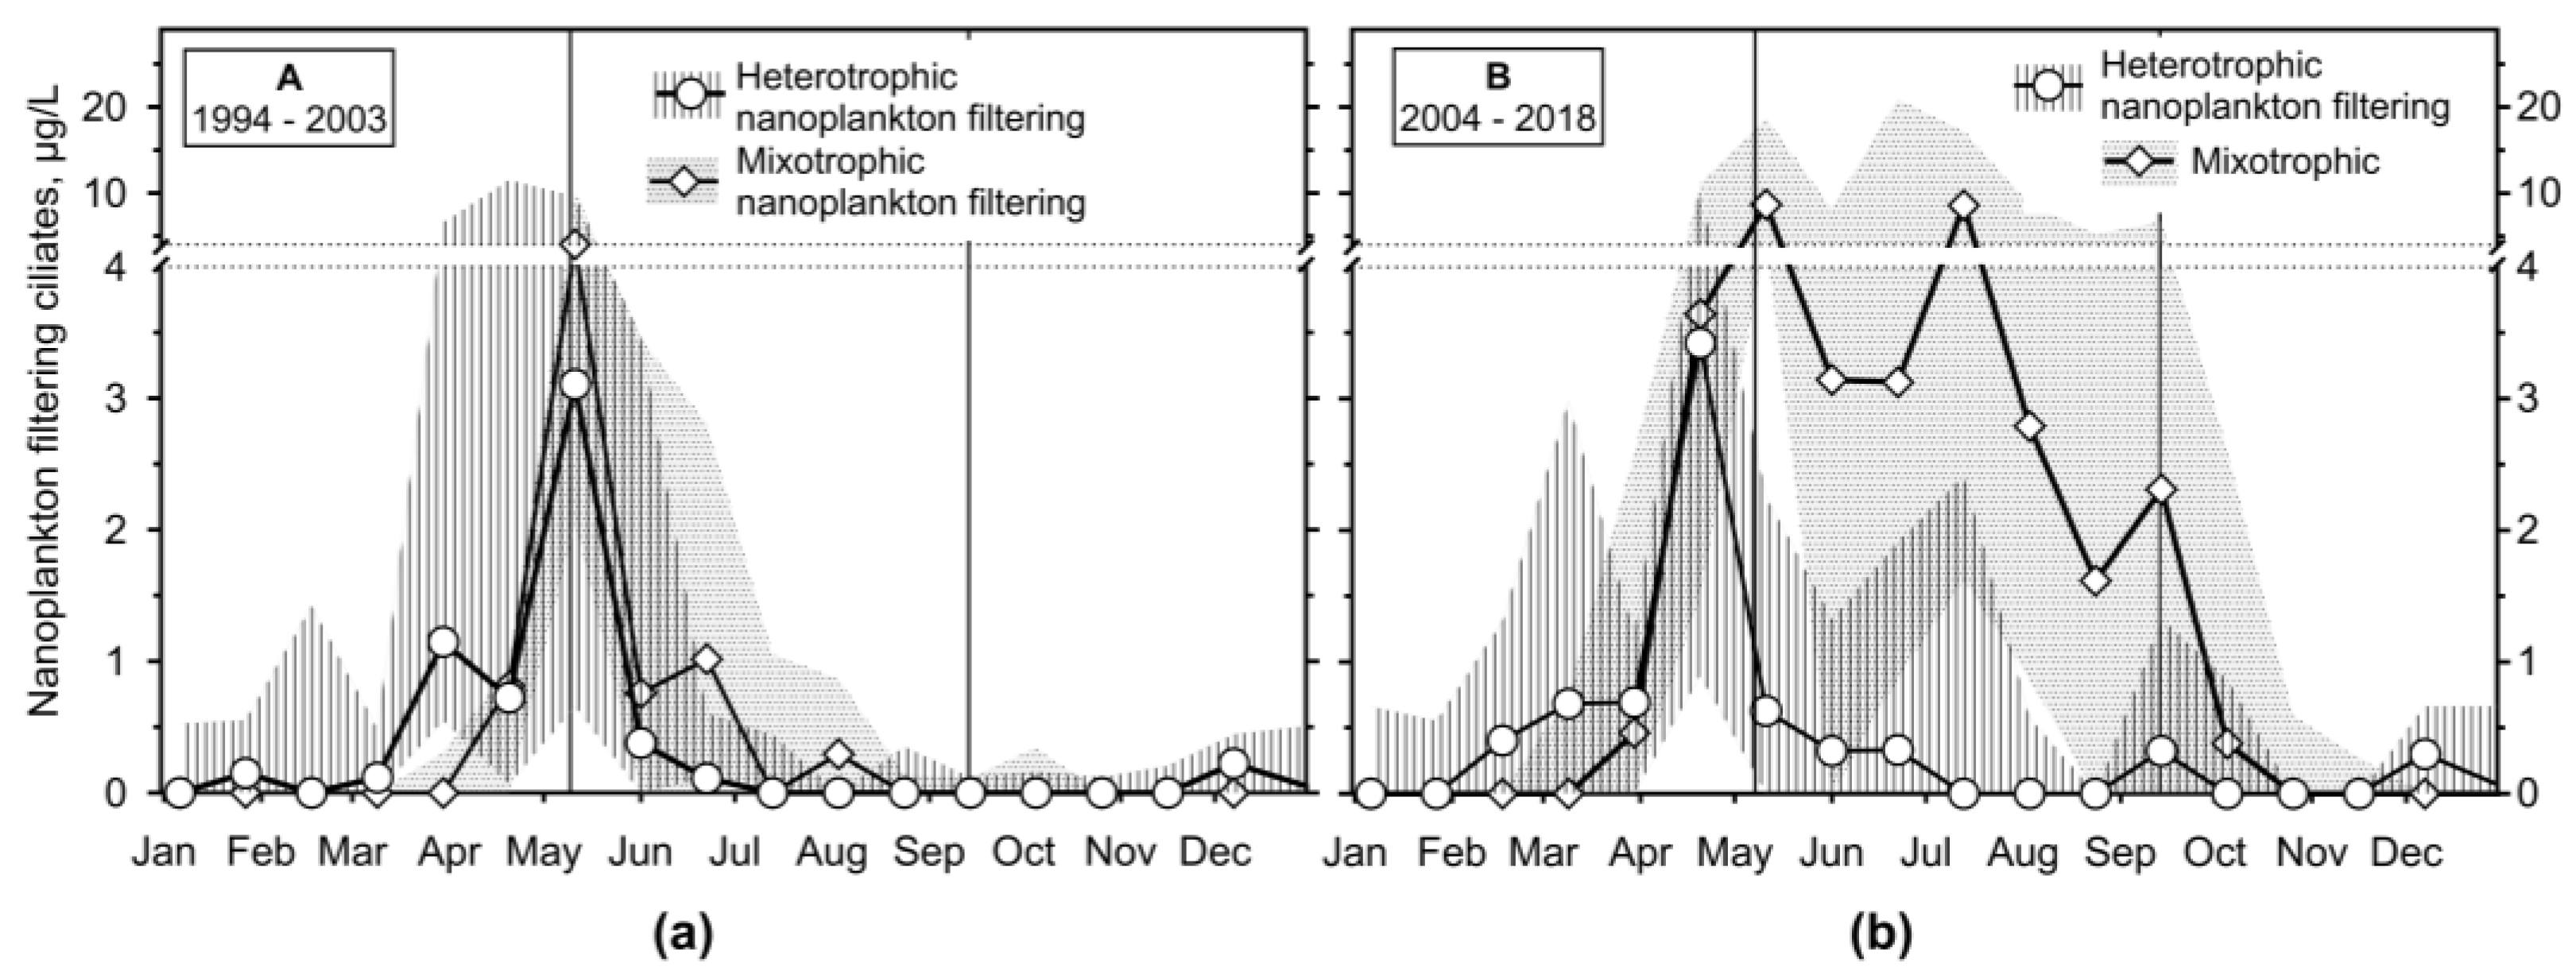
Figure 7.
The median and interquartile range of a sum of picoplankton filtering ciliate organic carbon biomass throughout the study and that of halteriids with minute strobilidiids and solitary peritrichs. Vertical lines define the median of transi-tion sampling between mixing and stratification.
Figure 7.
The median and interquartile range of a sum of picoplankton filtering ciliate organic carbon biomass throughout the study and that of halteriids with minute strobilidiids and solitary peritrichs. Vertical lines define the median of transi-tion sampling between mixing and stratification.
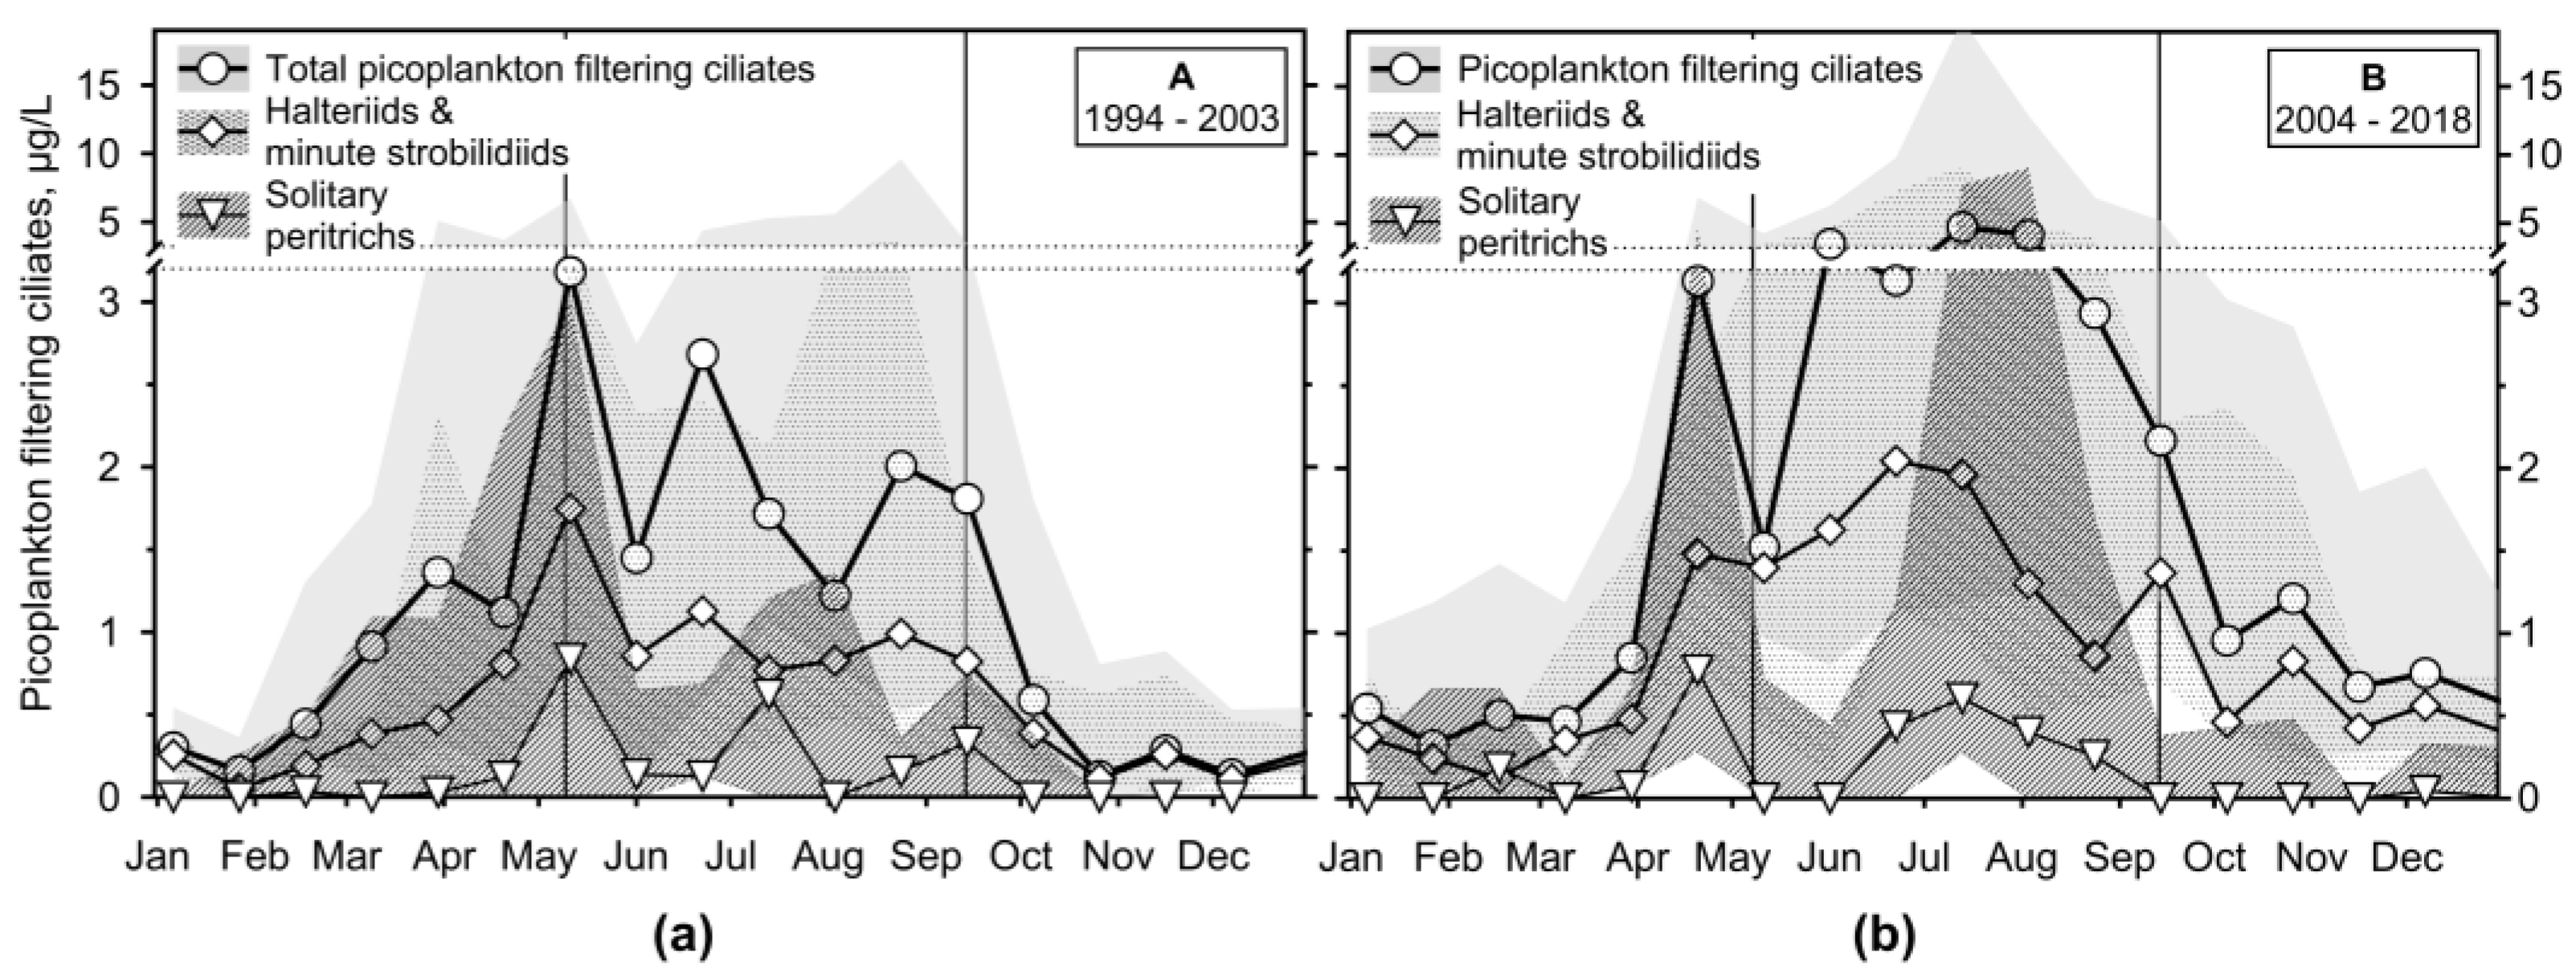
Figure 8.
The median and interquartile range of a sum of algivores (not filtering) organic carbon biomass (μg/L) throughout the study and that of the genus Urotricha and B. planctonicum; vertical lines define the median of transition sampling between mixing and stratification.
Figure 8.
The median and interquartile range of a sum of algivores (not filtering) organic carbon biomass (μg/L) throughout the study and that of the genus Urotricha and B. planctonicum; vertical lines define the median of transition sampling between mixing and stratification.
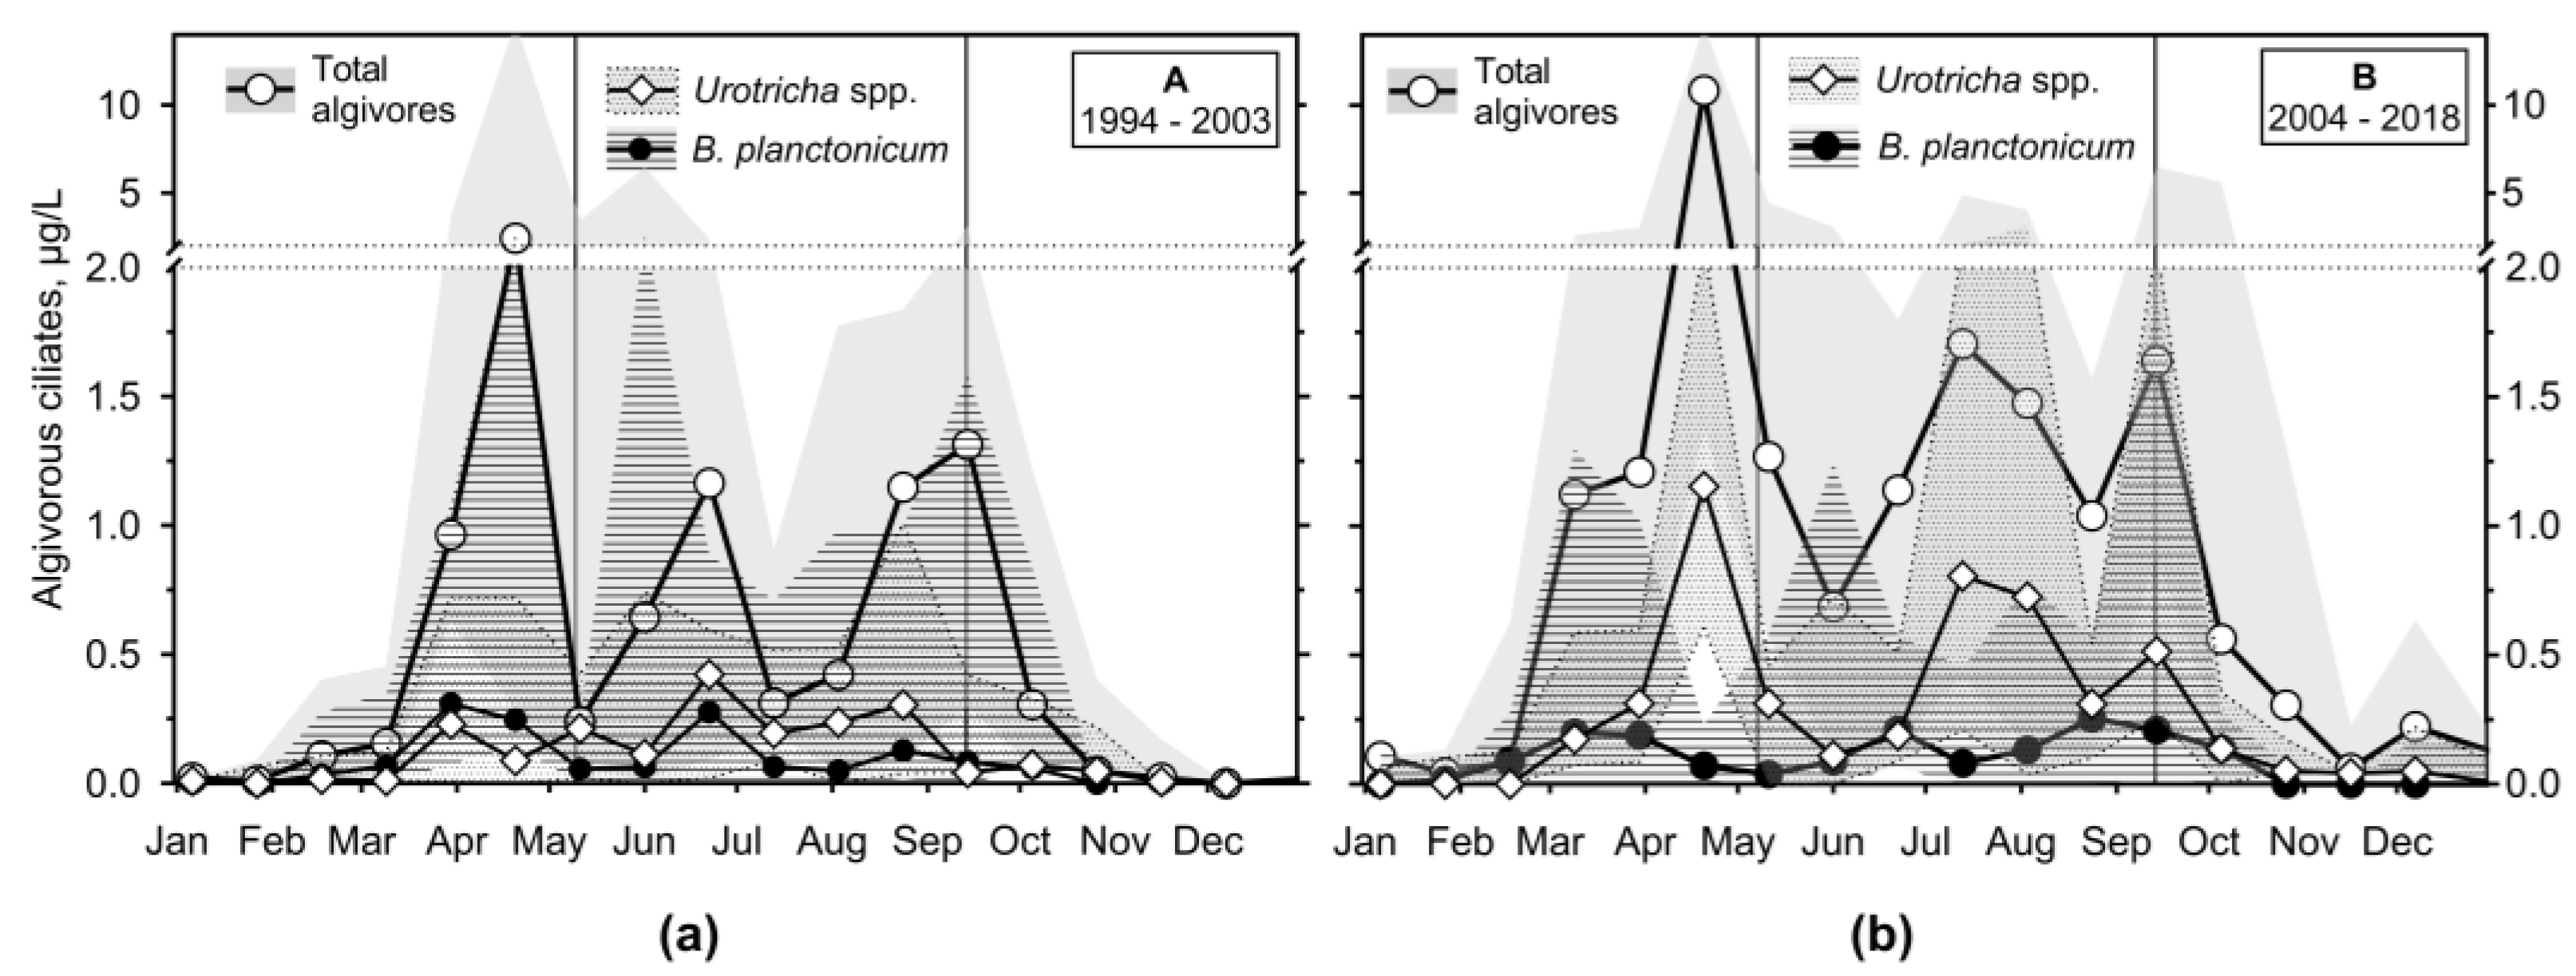
Figure 9.
The median and interquartile range of a sum of raptorial ciliates and flagellate hunters’ organic carbon biomass (μg/L) throughout the study; a sum of genera Askenasia with Rhabdoaskenasia, and Mesodinium sp. Vertical lines define the median of transition sampling between mixing and stratification.
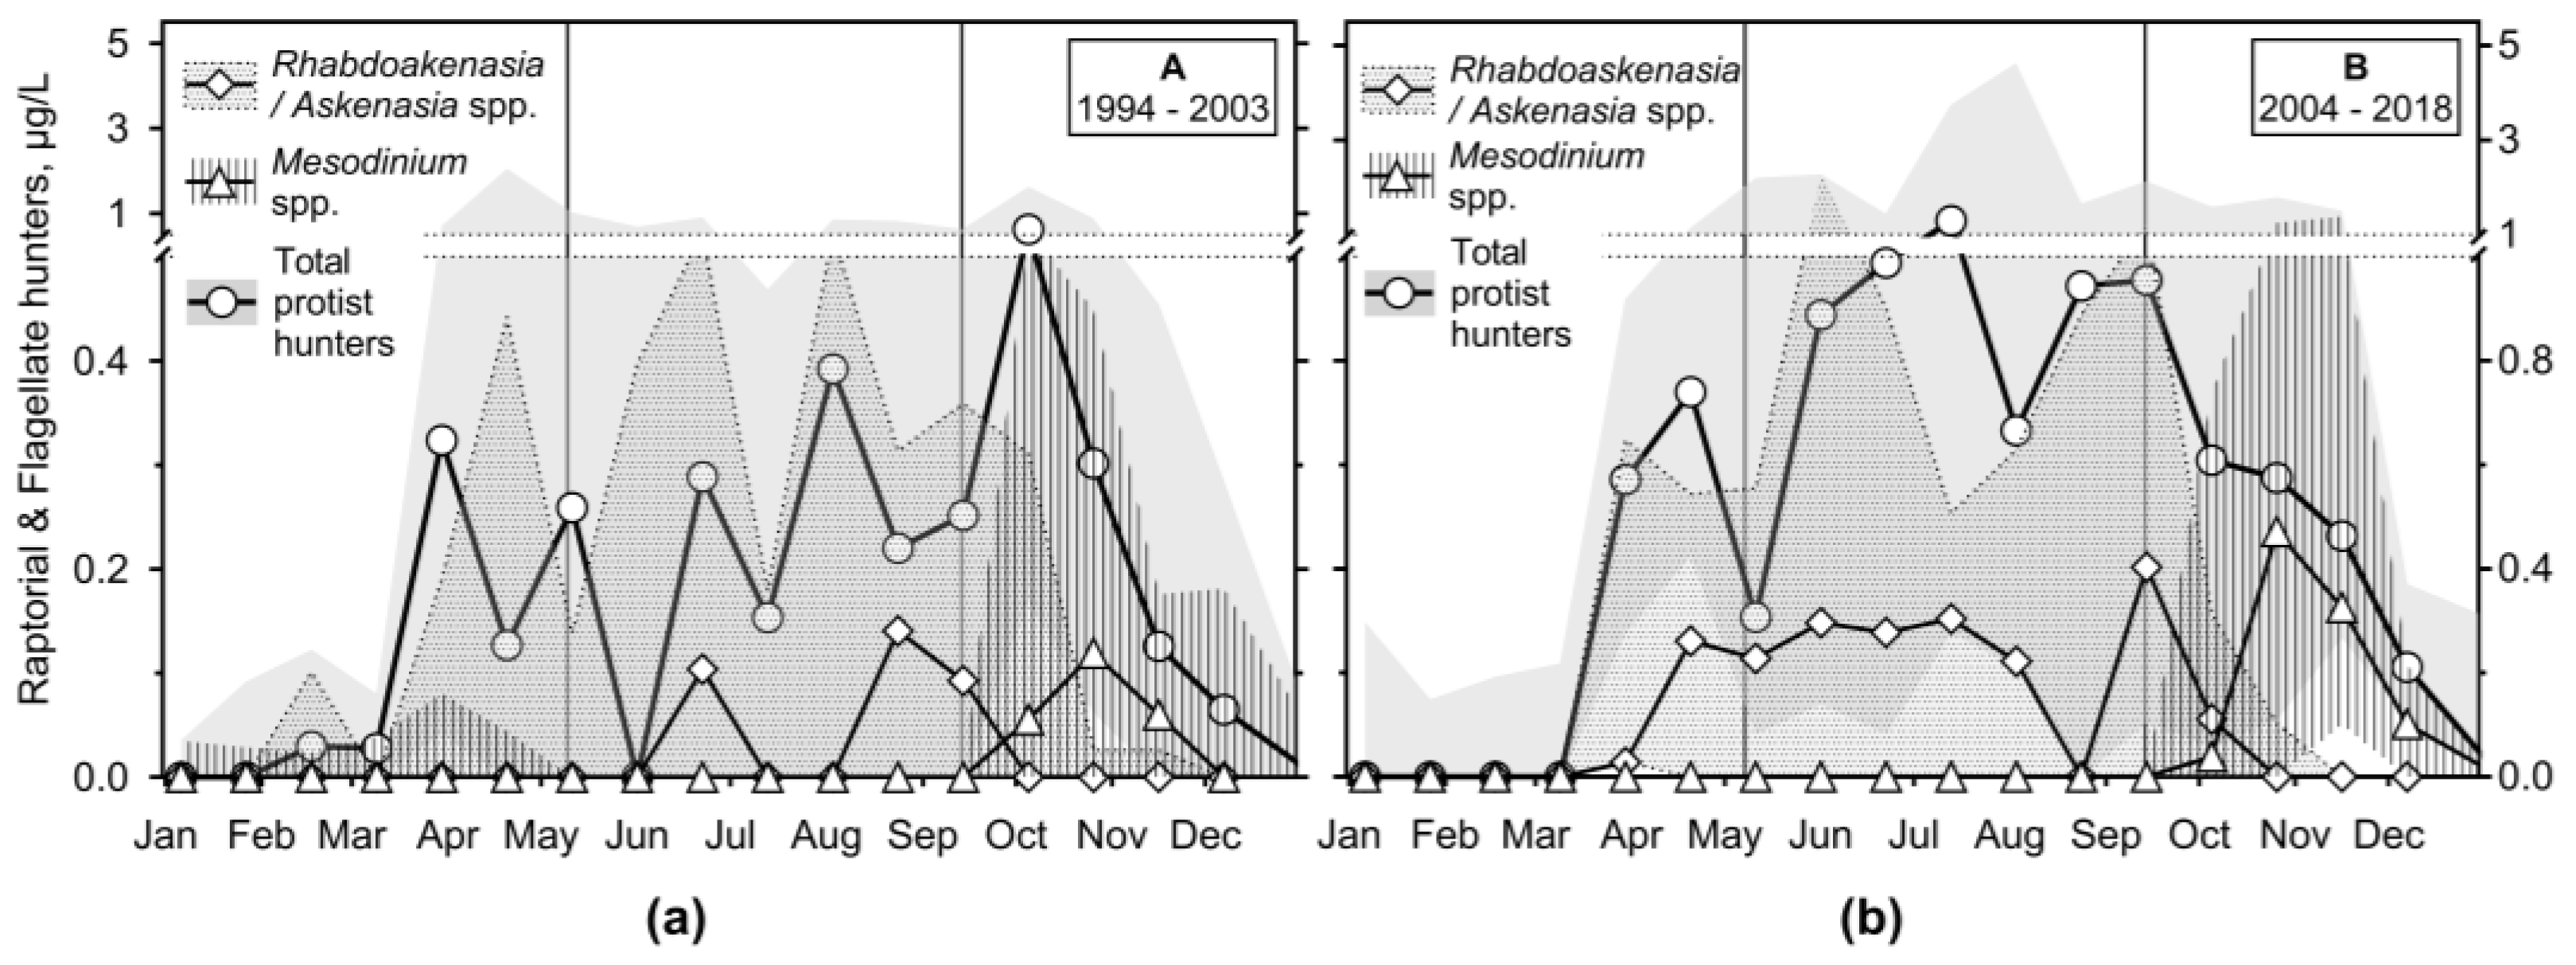
Figure 10.
Results of non-metric multidimensional scaling (NMDS) divided according to period (1994-2003 - circles, full line; and 2004-2017 - squares, hatched line). (a) based on explanatory variables (temperature, concentrations of dissolved oxygen, total phosphorus <40µm, DIN, chlorophyll a, and ciliate prey - bacteria abundances, HNF and Rhodomonas spp.); (b) ciliate functional groups (as carbon biomass).
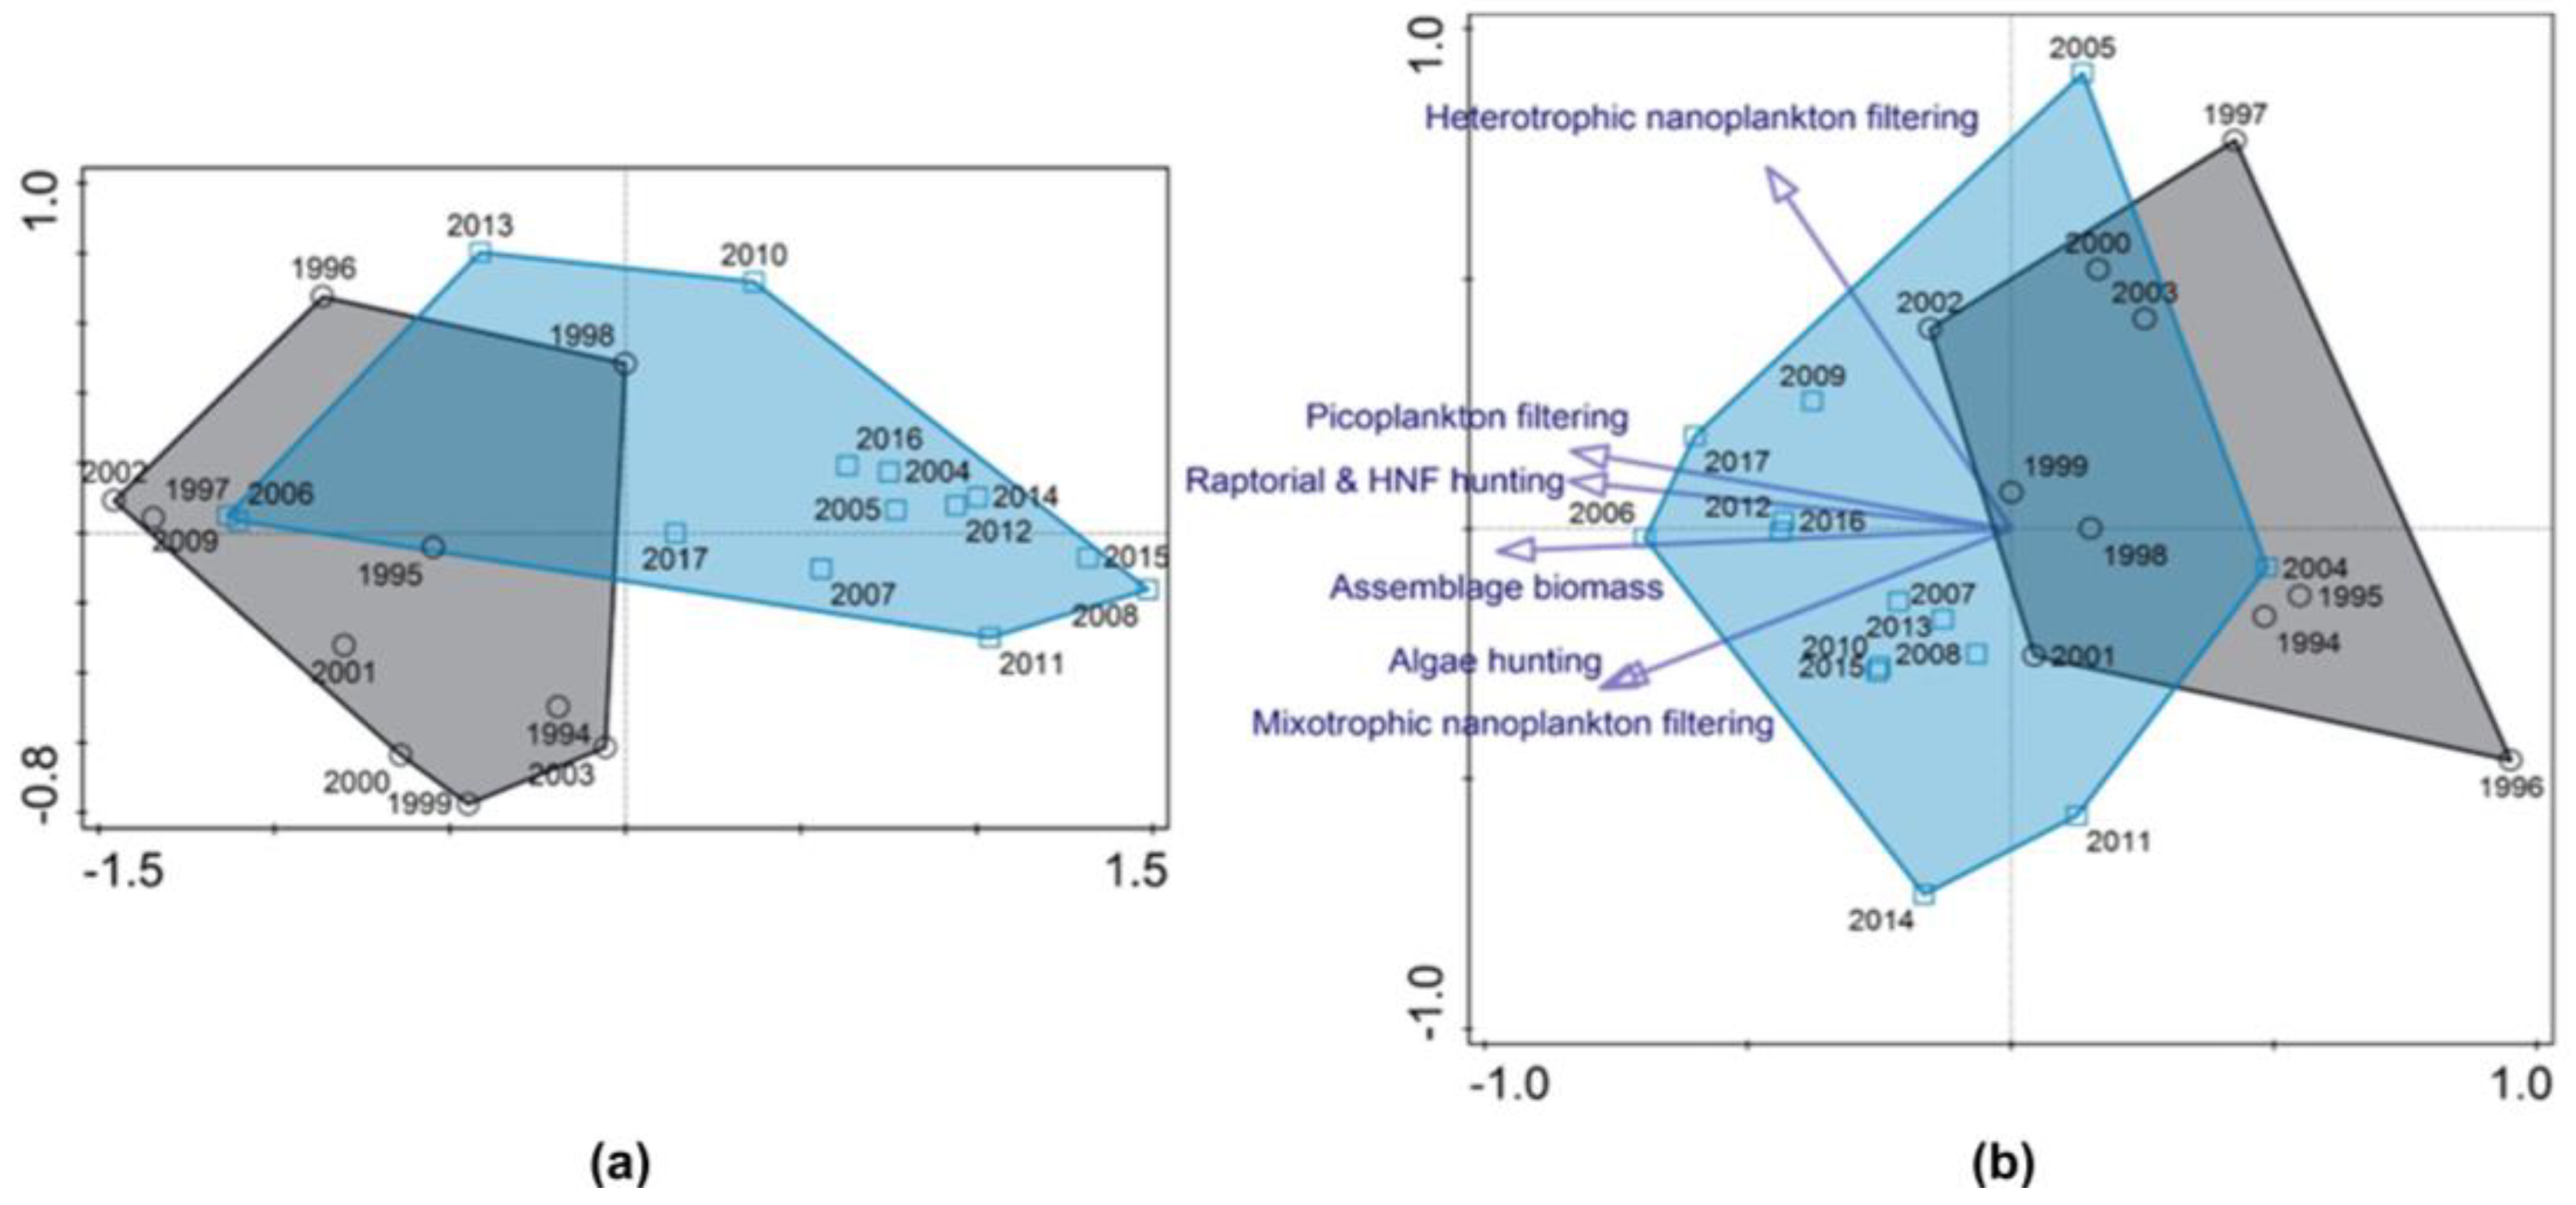
Figure 11.
Median biomass of the analysed groups during periods A and B. (a), (b) Ciliates filtering picoplankton (bacterivorous and omnivorous) and nanoplankton (mainly photosynthetic and heterotrophic flagellates), which are heterotrophic and mixotrophic; (c), (d) Ciliates hunting for algae (algivores), Mesodinium sp. and other raptorial (mainly flagellate hunting) ciliates.
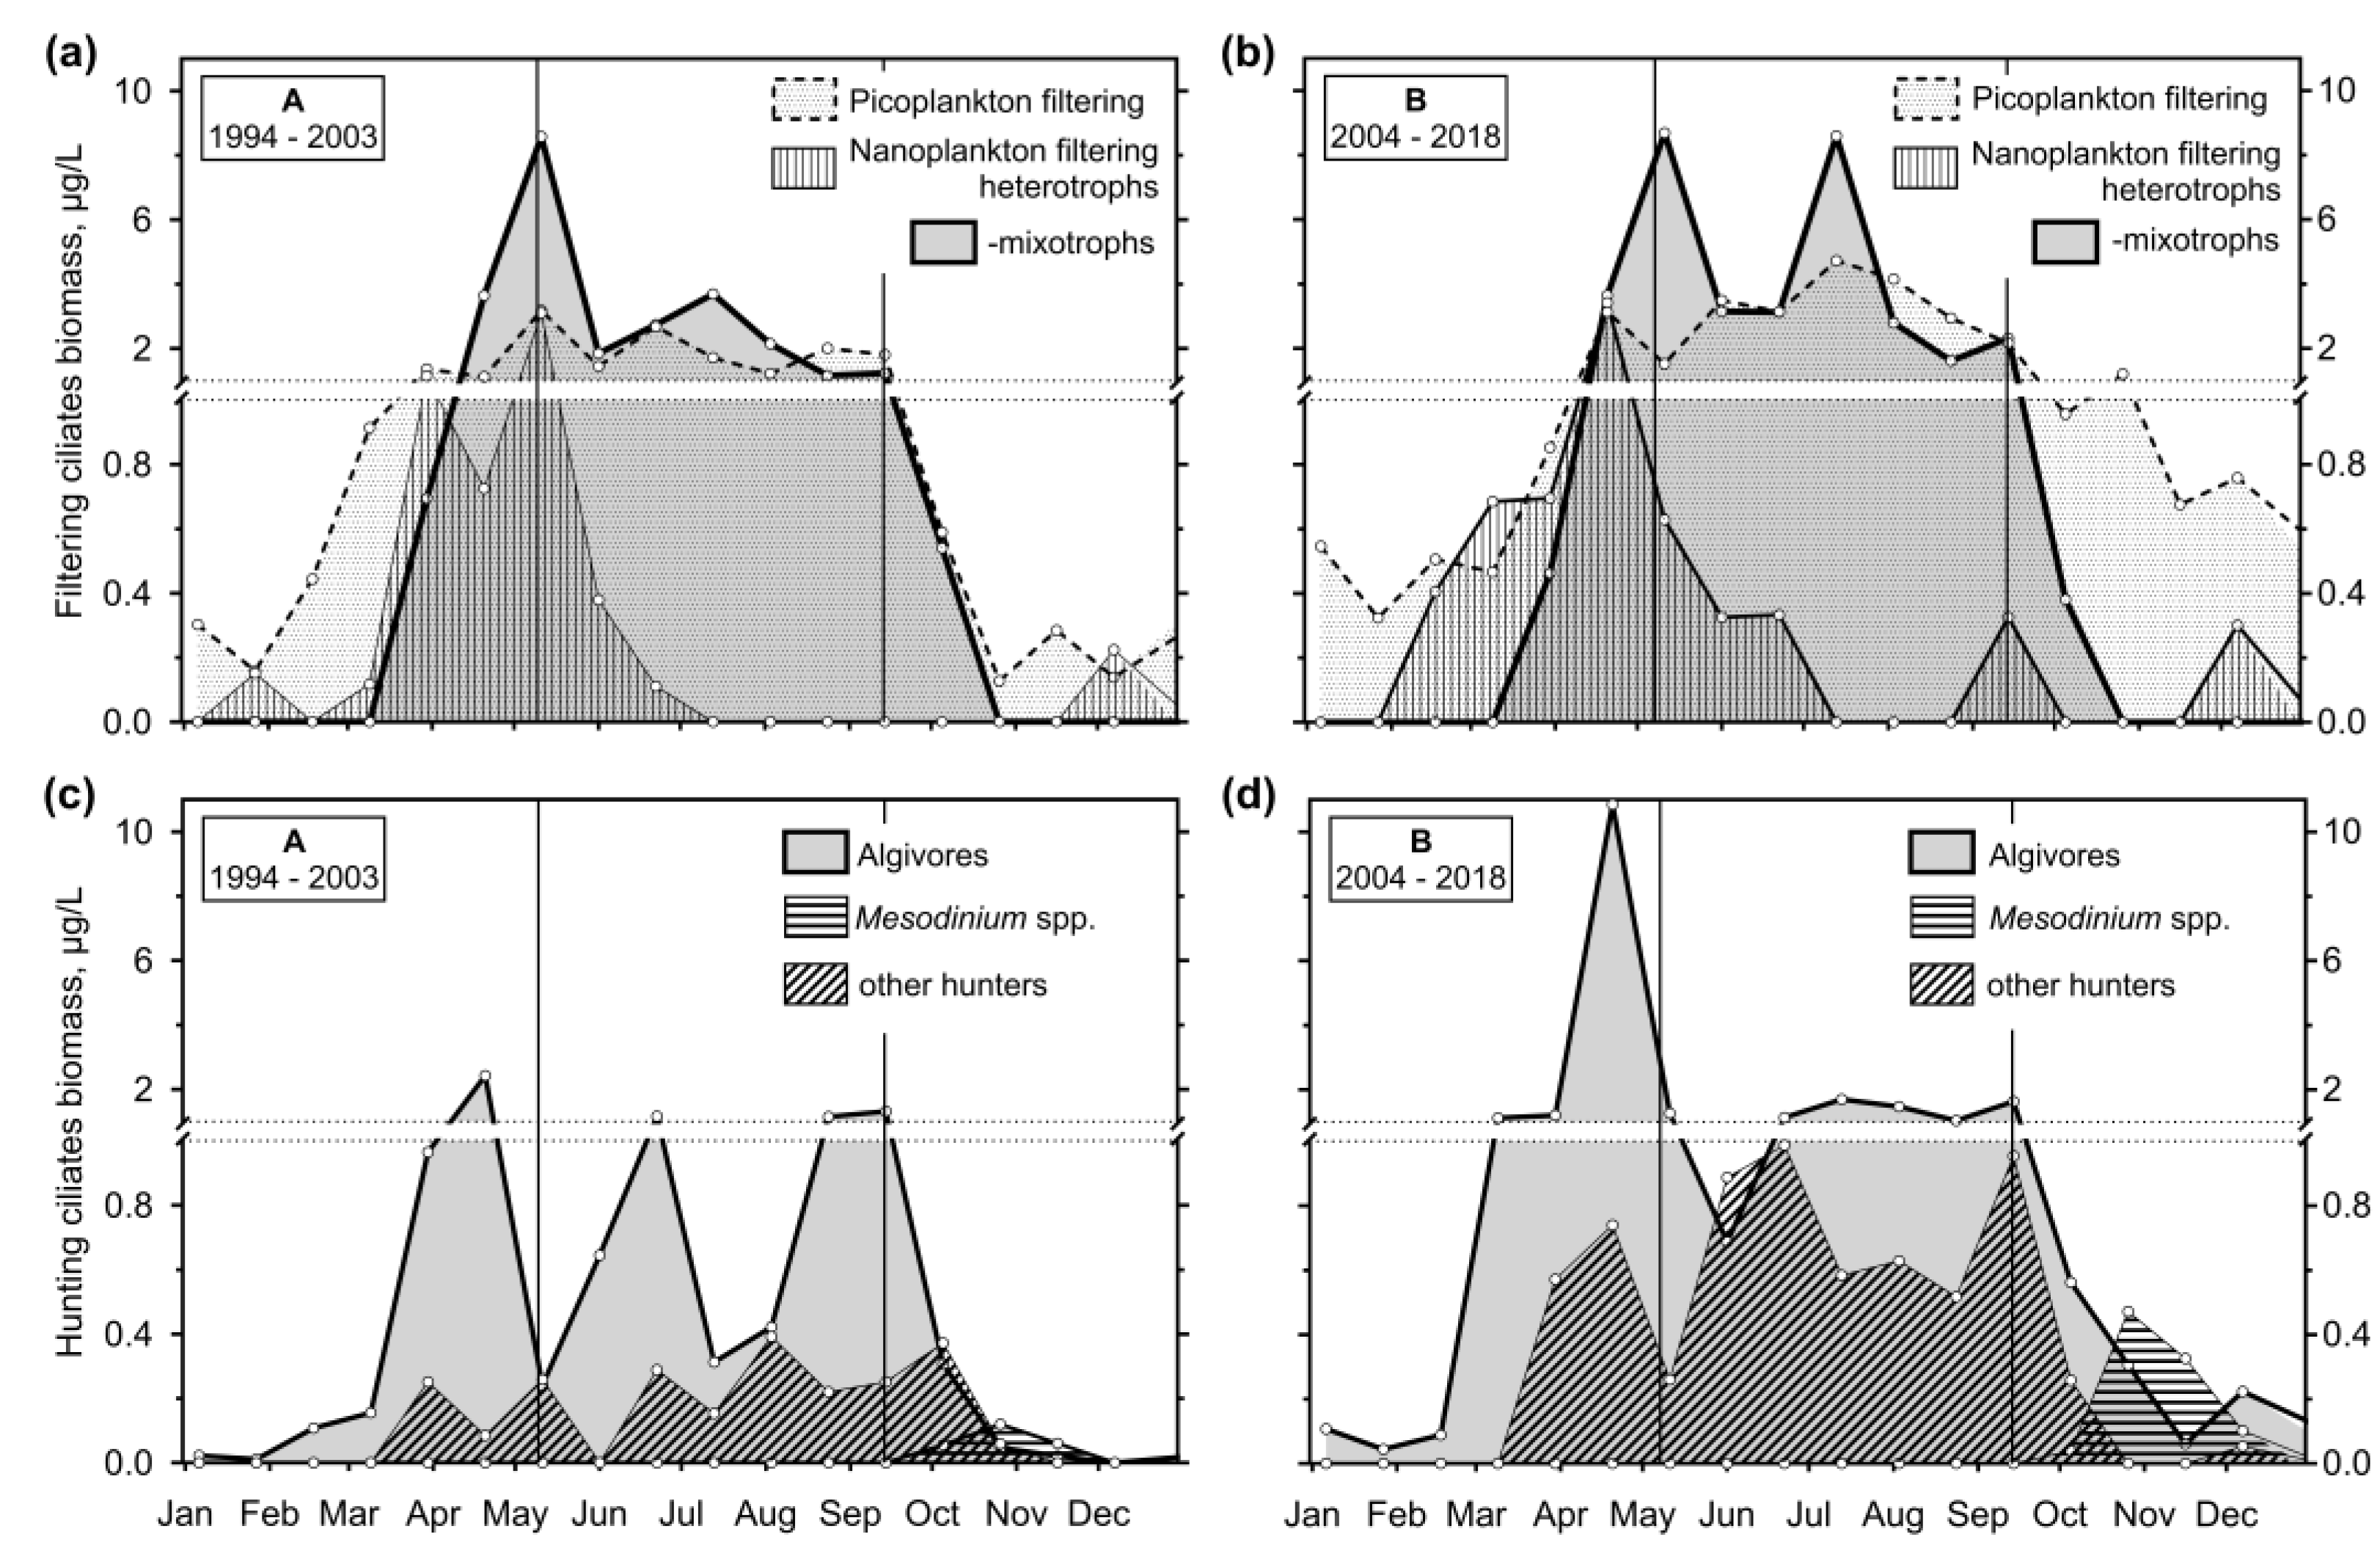
Figure 12.
The median and interquartile range of ciliate organic carbon biomass (μg/L) of sums of heterotrophic and mixotrophic species (with zoochlorellae or kleptoplasts) during periods A and B.
Figure 12.
The median and interquartile range of ciliate organic carbon biomass (μg/L) of sums of heterotrophic and mixotrophic species (with zoochlorellae or kleptoplasts) during periods A and B.
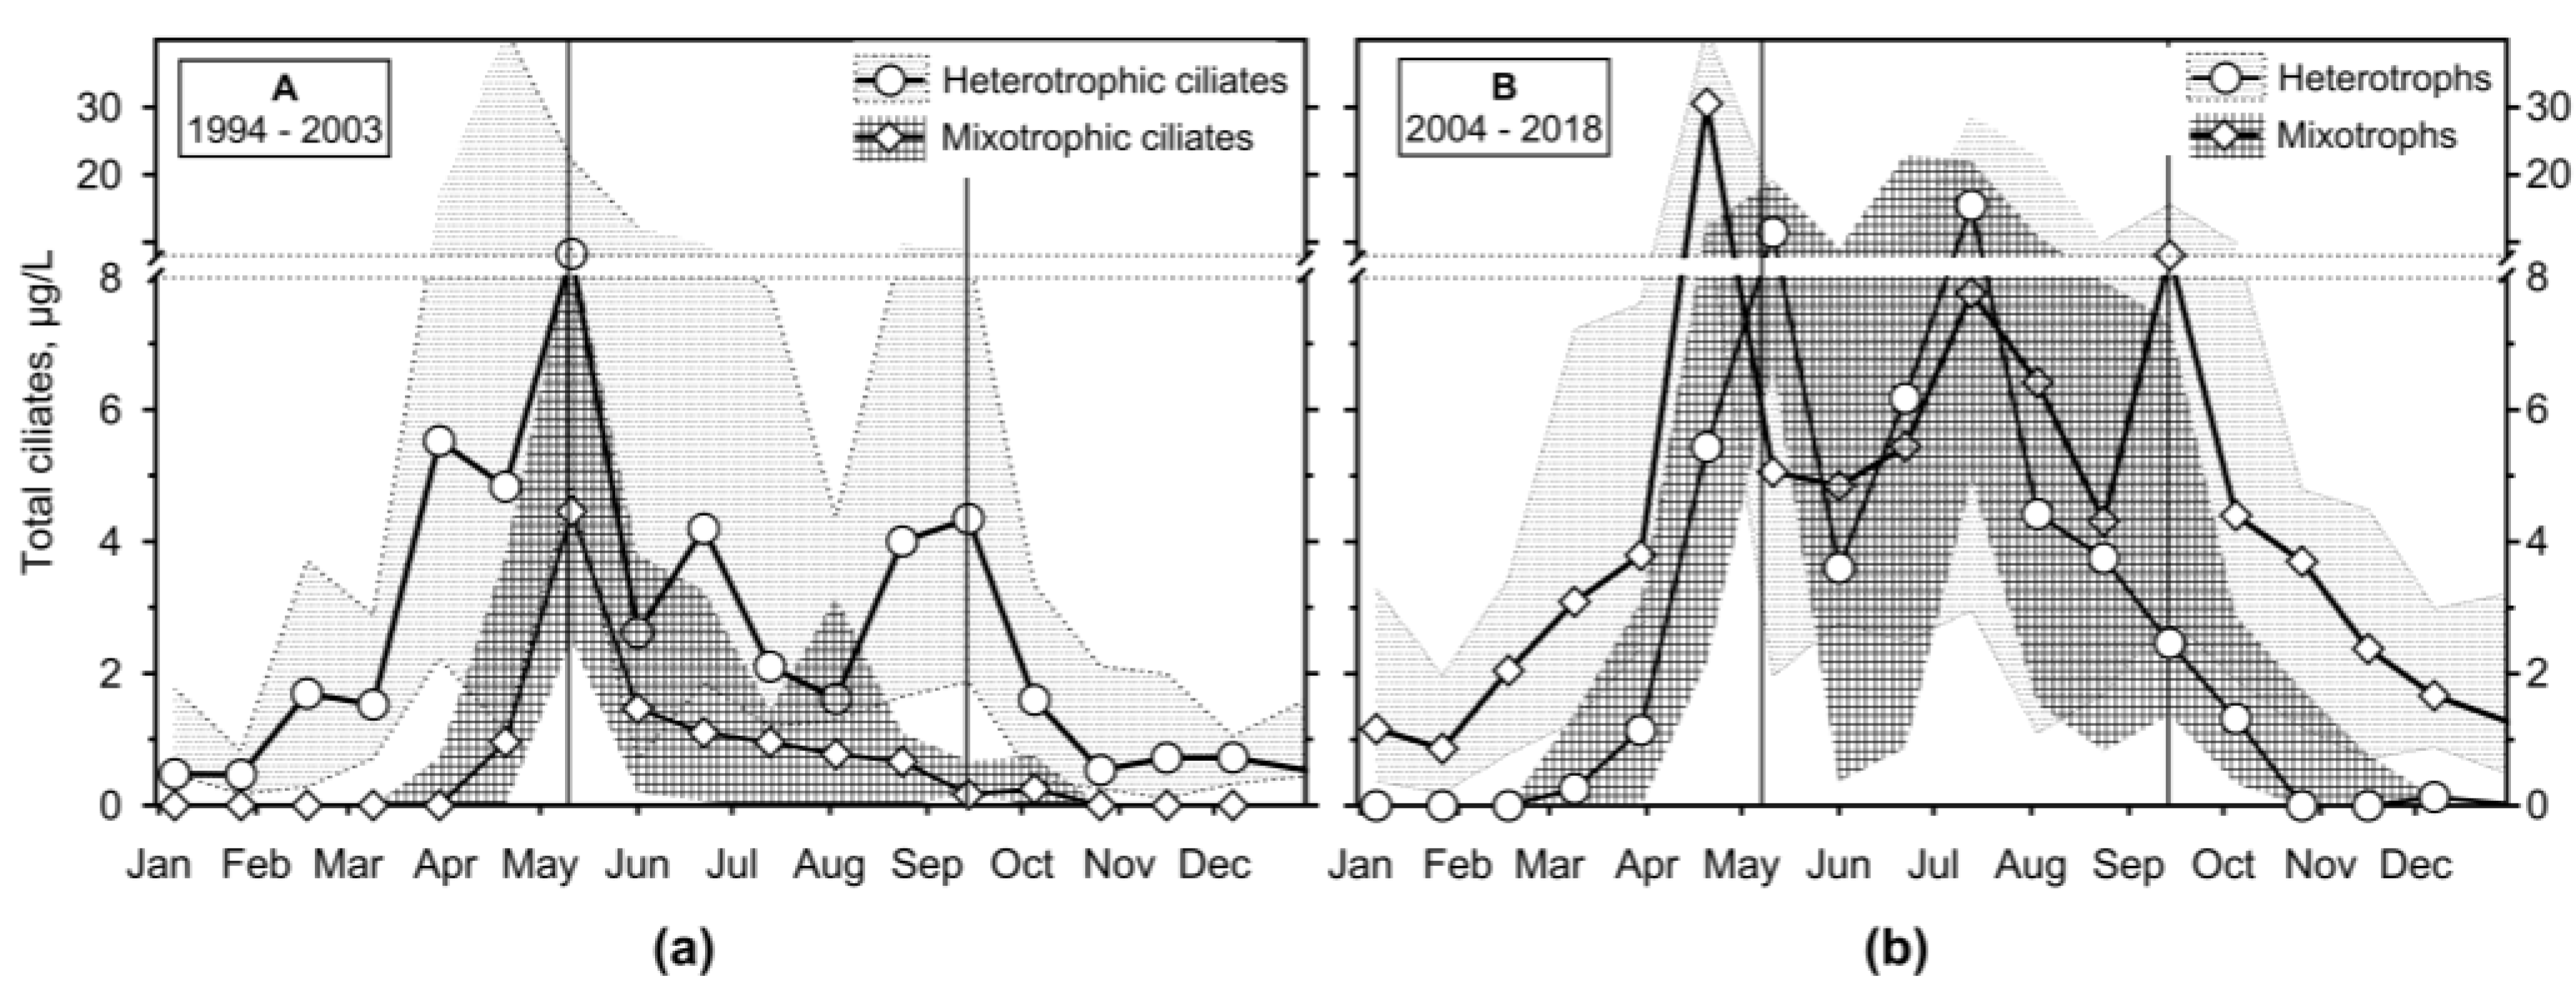

Table 1.
Feeding behaviour grouping of ciliates and their taxonomical position (for images of representative ciliates from the respective groups, see, Figures 3–6).
Table 1.
Feeding behaviour grouping of ciliates and their taxonomical position (for images of representative ciliates from the respective groups, see, Figures 3–6).
| Feeding behaviour | Family | Genus / species |
|---|---|---|
| Picoplankton filtering PF |
Halteriidae Claparède & Lachmann 1858 |
Halteria grandinella (Müller, 1773) Halteria — mixotrophic Pelagohalteria viridis (Fromentel, 1876) |
| Strobilidiidae Kahl in Doflein & Reichenow 1929 |
Rimostrombidium brachykinetum Krainer, 1995 Rimostrombidium humile (Penard, 1922) Rimostrombidium— mixotrophic |
|
| Vorticellidae Ehrenberg 1838 |
Vorticella — minute Vorticella — large Vorticella aqua-dulcis-complex Stokes, 1887 Vorticella mayeri Faure-Fremiet, 1920 |
|
| Zoothamniidae Sommer, 1951 | Pseudohaplocaulus sp. | |
| Astylozoidae Kahl 1935 |
Astylozoon sp. Hastatella sp. |
|
| Trichodinidae Claus 1874 | Trichodina cf. diaptomi Basson and Van As, 1991 | |
| Cinetochilidae Perty 1852 | Cinetochilum margaritaceum Perty, 1852 | |
| Cyclidiidae Ehrenberg 1838 | Cyclidium spp. | |
| other minute scuticociliates | ||
| Heterotrophic nanoplankton filtering HF |
Strobilidiidae Kahl in Doflein & Reichenow 1929 | Rimostrombidium lacustris (Foissner, Skogstad & Pratt, 1988) |
| Tintinnidiidae Kofoid & Campbell 1929 |
Tintinnidium spp. Tintinnopsis spp. Codonella cratera Leidy, 1887 |
|
| Mixotrophic nanoplankton filtering MF |
Pelagostrombidiidae Agatha 2004 |
Pelagostrombidium spp. Limnostrombidium spp. |
| Strobilidiidae Kahl in Doflein & Reichenow 1929 | Rimostrombidium velox (Faurè-Fremiet, 1924) | |
| Algae hunters AH |
Balanionidae Small & Lynn 1985 | Balanion planctonicum (Foissner, Oleksiv &Müller, 1990) |
| Urotrichidae Small & Lynn 1985 |
Urotricha ~10µm Urotricha globosa Schewiakoff, 1892 Urotricha furcata Schewiakoff, 1892 Urotricha pseudofurcata Krainer 1995 Urotricha pelagica Kahl, 1932 Urotricha castalia Muñoz, Tellez & Fernandez-Galiano, 1987 |
|
| Histiobalantiidae de Puytorac & Corliss in Corliss 1979 | Histiobalantium spp. | |
| Chilodonellidae Deroux 1970 |
Phascolodon vorticella Stein, 1859 Trithigmostoma sp. |
|
| Raptorial & Flagellate hunters RH |
Colepidae Ehrenberg 1838 | Coleps spp. |
| Actinobolinidae Kahl 1930 | Actinobolina spp. | |
| Enchelyidae Ehrenberg 1838 | Enchelys spp. | |
| Trachelophyllidae Kent 1882 | Lagynophrya spp. — heterotrophicLagynophrya spp. — nixotrophic | |
| Didiniidae Poche 1913 |
Monodinium spp. Monodinium spp. — large |
|
| Incertae sedis CON-threeP |
Askenasia chlorelligera Krainer & Foissner, 1990 Askenasia volvox (Penard 1922) Askenasia spp. — minute Askenasia spp. — large Rhabdoaskenasia minima Krainer & Foissner, 1990 |
|
| Incertae sedis SAL |
Mesodinium spp. Litonotus spp. — minute |
|
| Oversized biomass | Epistylididae Kahl 1933 | Epistylis spp. — pelagic, colonial |
| Stentoridae Carus 1863 | Stentor sp. | |
| Holophryidae Perty 1852 | Holophrya spp. — large | |
| Cyclotrichiidae Jankowski 1980 | Cyclotrichium sp. | |
| Lacrymariidae de Fromentel 1876 | Lacrymaria spp. | |
| Dileptidae Jankowski 1980 | Pelagodileptus spp. | |
Disclaimer/Publisher’s Note: The statements, opinions and data contained in all publications are solely those of the individual author(s) and contributor(s) and not of MDPI and/or the editor(s). MDPI and/or the editor(s) disclaim responsibility for any injury to people or property resulting from any ideas, methods, instructions or products referred to in the content. |
© 2024 by the authors. Licensee MDPI, Basel, Switzerland. This article is an open access article distributed under the terms and conditions of the Creative Commons Attribution (CC BY) license (http://creativecommons.org/licenses/by/4.0/).
Copyright: This open access article is published under a Creative Commons CC BY 4.0 license, which permit the free download, distribution, and reuse, provided that the author and preprint are cited in any reuse.
supplementary.zip (4.96MB )
Submitted:
17 May 2024
Posted:
23 May 2024
You are already at the latest version
Alerts
A peer-reviewed article of this preprint also exists.
supplementary.zip (4.96MB )
This version is not peer-reviewed
Submitted:
17 May 2024
Posted:
23 May 2024
You are already at the latest version
Alerts
Abstract
The awareness of ciliate importance in freshwater has changed dramatically in the last decades, reflecting methodological attempts. We analysed two decades (1994-2018) of data on the surface (0-3 m) ciliate assemblage in the Slapy reservoir (Vltava River, Czech Republic) during two different nutrient-load defined periods. We identified, quantified, and evaluated the biomass of ciliates in the quantitative protargol-stained preparations. We used water age, nutrients, bacteria, heterotrophic nanoflagellates and rhodomonads as the main explanatory background variables. The sampling median and interquartile range data analysis and a non-metric multidimensional scaling were applied. Ciliates were grouped according to their feeding behaviour. The picoplankton filtering species dominated the assemblages in an annual mean (halteriids and minute strobilidiids followed by peritrichs). Algae hunters Balanion planctonicum, urotrichs and nanoplankton filtering tintinnids were important before the spring phytoplankton peak when a maximum of ciliate biomass reflected mixotrophic nanoplankton filtering pelagostrombidiids. Only there, ciliate biomass tightly followed their quantified prey. Heterotrophic and mixotrophic Askenasia and Lagynophrya were typical raptorial/flagellate hunters; only Mesodinium spp. peaked during autumn. The oligotrophication increased the ciliate assemblage biomass in the surface layer during the stratification in concordance with the PEG model.
Keywords:
Subject: Biology and Life Sciences - Aquatic Science
1. Introduction
The awareness of ciliate importance in the lotic environment has been changing dramatically since the 1980s, reflecting both the improvement of plankton ecology methods [1,2,3] and a revised plankton ecology paradigm of the PEG model [4]. However, the pilot methods already used in experimental works were only slowly replacing the traditional ones, e.g., in monitoring programs using the same method for long periods.
The application of epifluorescence methods based on both autofluorescence of photosynthetic pigments and direct staining of microorganisms (acridine orange [5]; primulin [6]; DAPI [7]) has led to the conceptualisation of the ciliate role in a microbial loop within the plankton food web [8]. Numerous articles quantified in situ feeding rates of the heterotrophic, autotrophic and/or mixotrophic ciliates based on the direct methods enumerating either fluorescent particles mimicking edible food or fluorescently stained genuine prey [9]. Since then, the importance of ciliates has proven, and the boom of studies emerged, highlighting significant correlations between the abundance and activity of ciliates, their prey (mainly bacteria), or predators (mainly copepods) in different layers of the water column of aquatic ecosystems [10,11,12]
On the other hand, a routine ciliate counting method for bulk samples of ciliates has not been widely approved for a long time. Since the re-describing a valuable combination of Lugol iodine and Utermöhl methods for ciliates [13], it was followed by the eventual decolorising of the sample with thiosulphate and formalin for its inspecting in an epifluorescence microscope [14,15]. It became the first reliable method for studying pelagic ciliates that was used so far, the most complete ciliate monitoring program in Lake Constance [16,17] integrating plankton-tube samples throughout a deep epilimnion (to 20 m). Other groups preferred an application of DAPI staining for the ciliate quantification [18,19,20,21]. However, another methodological improvement was needed for a parallel satisfactory identification of the specimens. Quantitative Protargol Stain (QPS; [22,23,24]) enabled the direct application of protargol stain to samples concentrated on membrane filters. The method has been routinely applied since the original publication (e.g., [18,25,26,27,28,29]) and become worth combining modern molecular methods [30,31].
Even though the ciliate vertical distribution is well known in small water bodies (e.g., [32]), we still lack detailed information on the whole-year stratification of ciliates from deep water bodies [13,29,33,34,35,36]. The sampling strategy following such information usually looked for the layers with the maximum ciliate occurrence in the water column (such as the metalimnetic bottom, chlorophyll or deep-chlorophyll maxima, oxycline, or a limit of anoxia). It was employed in short-term studies [18,20,21,28].
In many other cases, however, only ciliate samples from the surface layer or shallow epilimnion have been processed because such layers have been typically sampled for monitoring; moreover, due to the change in ciliate analysis to molecular methods, the possible number of processed samples has decreased (recently, [37]). However, adding ciliate analysis to zooplankton and/or phytoplankton-based sampling programs would be inappropriate [2]
Our study aims to analyse two decades of ciliate monitoring in the 3-m surface/epilimnion layer of the mesotrophic dimictic/monomictic reservoir Slapy (Czechia).
2. Materials and Methods
2.1. Study Site
The Slapy reservoir is a narrow, canyon-type reservoir approx. 43 km long, with a maximum depth of 58 m and a volume of 2.70×10⁸ m³; mean retention time <40 days [38,39,40,41]. The limnological regime of the Slapy reservoir is controlled by the temperature and water quality of the hypolimnetic discharge from the reservoir Orlík (max. depth 74 m, mean water residence time of 89 days) located only 9 km upstream of the Slapy; only between August 2002 and June 2003 was all water discharged through the upper outlets. In the cold season, the Orlík water warms the reservoir, and consequently, the water column often circulates from autumn to spring [41]. The studied Slapy reservoir has recently behaved as a warm monomictic lake [42] instead of a naturally dimictic water body [38]. Since the 1990s, the reservoir has undergone remarkable changes in limnological variables as a result of socioeconomic changes in the watershed and climate change [39,40,43]. A gradual increase in total phosphorus (TP) concentration continued during the first decade of our study (1994–2004), but the trend has reverted since 2004, followed by reduced primary production. Dissolved inorganic nitrogen (DIN) concentrations were dominated by nitrate, while ammonium and nitrite were negligible. A gradual decline in nitrate concentration since the 1990s reflected reduced atmospheric deposition, de-intensification and greening of agricultural production and improvements in wastewater treatment. The effect of regional climate change results in earlier thermal stratification of the water column, which causes primary production in the epilimnion to start earlier and last longer [40]. On the other hand, early destratification in September stops the summer growth of phytoplankton.
2.2. Limnology Variables, Sampling and Plankton Analysis
The basic physical-chemical properties were analysed as described by Kopáček et al. [40] in the surface samples taken at 0.5 m. The water quality and hydrodynamic model CE-QUAL-W2 v. 4.0 (Portland State University, Oregon, USA; [44]) was used to calculate the seasonal stratification period with the epilimnion formed and water age. Water age is a model variable used to describe the time water parcels have spent in the reservoir since entering from inflows and is calculated as a time accumulation at a rate of 1.0 1/d for all new water entering the reservoir [45].
Integrated water biological samples were taken using a 3 m plankton tube sampler at 3-week intervals.
Chlorophyll a (Chl a) was determined spectrophotometrically after acetone extraction, according to Lorenzen [46]. Bacteria and heterotrophic nanoflagellates (HNF) were formalin-fixed (2%), filtered onto black polycarbonate membranes (0.2- and 1.0-μm pore-sized, respectively), DAPI stained [7] and counted using an epifluorescence microscope (Olympus). Phytoplankton was fixed with acid Lugol iodine and counted in sedimentation chambers (Utermöhl method); in this study, only the numbers of minute rhodomonads were used as a possible prey of algivorous ciliates [17,47].
2.3. Ciliates
From 1994 to January 2018, the integrated samples were fixed with acid Lugol iodine on the boat; in the laboratory, they were post-fixed with a Bouin’s fixative (to 7%) according to the modified QPS protocol [22,23]. Ciliates were harvested by a soft pressure filtration of 5 to 20 mL of the sample onto a mixed cellulose ester membrane filter with a gridded surface (pore size 1.2 μm), agar mounted, and formalin fixed. The impregnation was performed at ∼60°C. The processed and thiosulfate-stabilised preparations were passed through ethanol, carbol-xylol (phenol and xylene), and xylene dehydration series to be mounted in neutral Canada balsam [18]. The whole surface of the membrane was inspected using the microscopes equipped with Nomarski (DIC) contrast and oil immersion objectives 40× and 100× (Olympus BH2, Japan; Nikon, USA; Leica DMLB, Germany). The impregnation and counting were repeated to obtain approx. 10% of error in the sum of ciliates. In some cases, however, the taxa were represented by a single specimen.
The ciliate biomass was calculated (using simple shape models) from dimensions measured in the protargol preparations, and it was periodically actualised because it varied during the season. The cell volume was converted to organic carbon biomass by the factor of 0.368 pg C/μm3 [48].
Foissner et al. [1] and the keys mentioned therein were used for ciliate identification at the genus level (on some occasions, species were identified). Higher taxa classification according to Adl et al. [49] was applied.
Even though we obtained data on the taxonomic composition of the ciliate assemblage, we centre the result analysis on a distribution of feeding behaviour groups of ciliates derived from the classification of Macek et al. [27] presented in the table (Table 1). Large and rare ciliates such as Stentor sp., haptorids or pelagic colonial peritrichs were not included in the analysis of the ciliate biomass composition because of their too-high standard deviation of data.
2.4. Data Treatment
Almost without any exception, the sampling interval was 21 days, but the sampling week varied during the study. Every year, sampling started between 2 and 13 January, i.e., the shift of sampling Julian day was < 11 days, but in 1996 (< 17 days), we pooled the data to the scale starting Julian day 6 (median). Graphs were constructed using Microsoft Excel or GraphPad Prism 10.2.2 (GraphPad Software, LLC).
To normalise the annual microbial-loop component growth, Straškrábová et al. [50] used criteria of Chl a >5 μg/L, <7 μg/L and <10 μg/L for the spring phytoplankton peak, clear water phase, and the end of summer phytoplankton peak, respectively; we followed them to define the phytoplankton growth periods. However, we have applied a stratification criterion to normalise the microbial-loop growth, as described above.
The evaluated period was divided into two segments, according to the findings of Kopáček et al. [40], who defined total phosphorus increasing trend breakpoint in 2004, while nitrogen had already decreased before. Throughout the text, the analysed periods 1994–2003 and 2004–2018 are assigned as periods A and B, respectively; the calculated period of a stable stratification is named stratification.
The data were statistically analysed using Prism 10; we applied the programme automatic plot of medians with the interquartile range (IQR) based on raw data to construct a representative seasonal curve of the ciliates and limnology variables [51,52]. Non-metric multidimensional scaling (NMDS) with Bray–Curtis distance measure was used to find a configuration of years in the ordination space where distances between years correspond to dissimilarity within the explanatory variables or ciliate composition. NMDS was done using Canoco 5.15 [53].
3. Results
3.1. Long-Term Trends in the Reservoir
3.1.1. Physical-Chemical Variables
Kopáček et al. [40] published long-term trends of physical-chemical variables (Figure S1). The mean annual temperature of the surface layer increased from a minimum of 10.9 °C in 1996 to a maximum of 14.1 °C in 2017. The stratification period means oscillated about 20°C with a minimum of 18.5 °C and a maximum of 23.0 °C in 2009 and 2003, respectively. The annual means of dissolved oxygen (DO) were close to saturation throughout the almost entire study period. However, at the start of period A, concentrations below saturation were observed. The stratification period means showed oversaturation, except for some years during period A. During period B, DO slightly dropped.
Total phosphorus (including particles <40 µm) annual means were roughly above - and below 50 µg/L during periods A and B, respectively, finishing at 34 µg/L in 2017. The stratification means oscillated around 25 µg/L throughout the study. Dissolved inorganic nitrogen (DIN) annual means were slightly lower than those from stratification, between 2 and 4 mg/L and 1.5 and 3 mg/L, during periods A and B, respectively. However, concentrations remained below 2 mg/L for the last three years.
3.1.2. Plankton
To define the ciliate position within the plankton food webs, first, we plotted the chlorophyll a (Chla) concentrations as a proxy of phytoplankton biomass and possible ciliate prey abundances: minute cryptomonads (Rhodomonas spp.), heterotrophic nanoflagellates (HNF), and bacteria (Figure 1).
An apparent drop in annual means of Chl a concentration (from 20 to 10 μg/L) likely followed a significant drop in total phosphorus load starting in 2004 [40]. Local Chl a maxima were observed as spring and summer peaks during April–May and August–September, respectively, surpassing 20 μg/L. During period A, they were frequently between 50 and 100 μg/L), while during period B, they have been decreasing below 35 μg/L after 2009. It resulted in the annual- and stratification-mean of 14.5 and 27 μg/L, and 7.0 and 29 μg/L, during periods A and B, respectively. The clear water phase following the spring peak of chlorophyll was observed shortly after, covering only one sampling period.
Rhodomonads’ annual abundances had reached nearly 1×10³ cells/mL during period A but dropped down 0.2×10³ cells/mL during period B, while have been increasing again since 2015, reaching 0.6×10³ cells/mL in 2017. However, the stratification abundances over 1×10³ cells/mL had been observed till 2010, dropping down 0.3×10³ cells/mL in 2014 and increasing again.
Annual means of HNF numbers were low (< 1×10³ cells/mL) until 2000, while from 2001 to 2003, they reached their maximum (up to 2.4×10³ cells/mL), then dropping < 1.7×10³ cells/mL (except for 2012 and 2013 with > 1.8×10³ cells/mL) again. If their annual mean numbers were higher than the mean, it was due to a broader period of their peaking either during spring or summer/autumn.
Bacteria varied between 2.7 and 4 ×10⁶ cells/mL until 2008 (except for 4.8 ×10⁶ cells/mL in 1998). A maximum of 5.2×10⁶ was observed in 2009, but then bacteria varied roughly within a 3 to 4×10⁶ cells/mL interval.
Both ciliate numbers and biomass were lower before 2004 (Figure 2); the annual maximum was reached in 2006 (15.8 cells/mL and 29.6 μg/L, respectively). Generally, we observed increasing peaks of ciliate biomass toward 2018 (40 μg/L). Annual ciliate maxima fell typically to April–May, though longer peaking has been observed since 2006. Longer-observed elevated abundances and biomass of ciliates are reflected in the increasing mean values from the stratification. An additional autumn peak was not observed every year.
Among the ciliate feeding behaviour groups, we found alternatively biomass dominating the picoplankton filtering (halteriids and minute strobilidiids, scuticociliates and small non-colonial peritrichs) and algivorous species (prostomes, Histiobalantium spp.) during the warmer stratification, and the winter and mixing period, respectively. If we sum both heterotrophs (mainly tintinnids) and mixotrophs (mainly pelagostrombidiids), nanoplankton filtering ciliates frequently dominated the assemblage biomass at the end of the spring peak of chlorophyll. Among raptorial/flagellate hunters, Askenasia and related genera, both heterotrophic and mixotrophic, and Mesodinium spp. were the most frequent. Scarce, very large ciliates and large colony-forming species were discarded from the analysis (e.g., pelagic Epistylis spp., Stentor sp., Pelagodileptus sp., Lacrymaria sp.) because they could not be well quantified using the QPS.
3.2. Seasonality
3.2.1. Physical-Chemical Variables
Plots of the annual cycles of temperature, water age, dissolved oxygen, and nutrients reveal their periodicity with the peaks tightly related to the calculated stratification limits (Figure S2). During period A (1994-2003), stratification started in May almost without an observed variation (median May 5, interquartile range May 7 to 11) and finished within a 6-week total range from late August to September (median September 13, interquartile range August 29 to September 28). During period B, the stratification came earlier (median May 7, interquartile range April 23 to May 8), but it finished every time in September (median September 13, interquartile range September 8 to 16).
The temperature (Figure S2e,f) quickly rose just before the stratification, where the climax of about 21°C was reached, dropping gradually from its end. The annual minimum temperature occurred in February (< 3°C). Dissolved oxygen, DO (Figure S2e,f), was usually oversaturated in the epilimnion and reached its maximum just at the start of stratification. Only during October – November did DO drop to < 5 mg/L.
A hydrodynamic model shows the stability of the sampled three-metre surface layer since the water age during the stratification reached 80 days there. In contrast, in the below 4 m layers, it overpassed 40 days or approached it in periods A and B, respectively. Mixing of the surface and deeper layers occurs outside the stratification period, even during winter.
Annual/seasonal nutrient dynamics were related to the mixing-stratification, but their concentrations decreased in period B. The maximum concentration of dissolved inorganic nitrogen (DIN) was observed following the start of stratification, and then it gradually declined. However, the total phosphorus (TP, including the seston <40 μm) was the highest during mixing, steeply dropped just before stratification and the lowest during it (for more details, [40]).
3.2.2. Chlorophyll a, Bacteria, Rhodomonads, and HETEROTROPHIC NANOFLAGELLATES
Two Chl a maximums were confirmed (Figure 3c,d). Considering the criteria used by Straškrabová et al. [50] the spring phytoplankton peak lasted from the first week of April to the end or the middle of May during periods A and B, respectively; the maximum median values of 39 μg/L (early May of A) and 12.9 μg/L (end of April). The clear water phase likely did not last more than one sampling period. We found the summer phytoplankton peak from June, culminating in August, nearly as high as the spring one during both periods (42 and 14.5 μg/L, respectively). While the peak was well pronounced in period A, a percentual variation of Chl a during period B was broader, and the median of the peak was nearly insignificant. However, Chl a concentrations always dropped below 5 μg/L after the stratification towards October.
Only during period A (Figure 3c,d) was a pronounced peak of bacteria (7×10⁶ cells/mL) observed. During both periods, bacteria maintained roughly constant abundances (5×10⁶ cells/mL) throughout the stratification.
Possible algivorous ciliate-prey rhodomonads (Figure 3a,b) were peaking during and/or after the spring peak of Chl a (4.5×10³ cells/mL and 0.8×10³ cells/mL during A and B, respectively). During both periods, rhodomonads dropped during the stratification and have been observed in their median abundances from roughly 0.5×10³ cells/mL even during the summer Chl a peak.
Other hunting or raptorial ciliate prey, HNF, reached their maxima along with- or after those of rhodomonads in late May (4×10³ cells/mL and 2×10³ cells/mL during A and B, respectively). On the other hand, they also accompanied the summer Chl a peak (1.8×10³ cells/mL), and during period B, another peak of 2.5×10³ cells/mL was registered during the stratification.
3.2.3. Ciliates’ Assemblage Abundance and Biomass
Analysing the ciliates, first, we plotted medians of the ciliate biomass (corrected, i.e., without large but scarce species) and abundances (without correction) throughout the studied periods (Figure 4a,b). The ciliate maximum peak median was observed in the spring just about the breakpoint of water column stratification in both periods. Ciliates occurred in 6.15 and 9.45 cells/mL abundances and biomasses of 13.2 and 39.4 μg/L during periods A and B, respectively. However, the following trend in abundance and biomass was different. A small abundance peak was observed before the stratification A end (4.6 cells/mL) and a biomass one at the end (4.6 μg/L). During stratification B, the interquartile range upper limit was nearly as high as the spring peak, reaching a pronounced peak in the middle of stratification (10.4 cells/mL and 24.0 μg/L) and another small peak at the end (16.0 cells/mL and 12.0 μg/L).
Since the interval of dates when stratification used to start was more comprehensive for period B and the ciliate maximum values lasted longer, we tried to normalise the data using the every-year stratification first sampling as a referential “0“ (Figure 4c,d)
We observed the sharp annual maximum at the start of stratification in May or late April. The ciliate biomass development trend was smoother if we normalised the yearly cycle using the start day of stratification (Figure 5c,d), particularly before the end of stratification. However, the transformation could have offered better data interpretation. We did not correct plots of the total ciliates and the feeding behaviour groups' annual cycles in such a way.
The graph (Figure 5) shows the importance of stratification and its limnological variables for ciliate biomass growth. Except for mixing the reservoir at temperatures between 5 and 10°C, we have found maximum biomasses during stratification. Significant ciliate biomasses were not observed in the oxygen-undersaturated layer.
3.2.4. Annual Growth of Feeding-Behaviour Ciliate Groups
The most biomass-important ciliates in the surface layer of the Slapy reservoir were those of nanoplankton filtering behaviour (traditionally called coarse filter feeders), reaching the median of carbon biomass >10 μg/L (Figure 6 and Figure S3). Among them, mixotrophic nanoplankton filtering (MN) ciliate genera Limnostrombidium and Pelagostrombidium (Pelagostrombidiidae; Song et al., 2019; Agatha et al., 2023), accompanied sometimes by Rimostrombidium velox (Strobilidiidae) typically dominated start of the stratification. During period A, their biomass rapidly dropped down, but during period B stratification and at its end (>2 μg/L), we registered other biomass peaks (>10 μg/L and >2 μg/L, respectively). Heterotrophic nanoplankton feeders (HN) were less important but frequently observed: Tintinnidium spp., Tintinnopsis spp. and, Codonella cratera (Tintinniidae), and Rimostrombidium lacustris (Strobiliidae). However, tintinnids were responsible for the peak of the ciliate group preceding the stratification.
During both periods, we observed large filtering Stentor sp. (Stentoridae) periodically in the spring phytoplankton bloom (about April) and/or during stratification (from June to August). However, its median abundance was zero; we did not concentrate a sufficient volume of samples to quantify it. The ciliate was discarded from the assemblage analysis.
The second most important ciliate group were the minute picoplankton filtering (PF), omnivorous (bacteria, picocyanobacteria, picoeukaryotes) ciliates (Figure 7 and Figure S4); they peaked at the end of mixing or the start of the stratification (median biomass >4 μg/L). Among them, Halteria grandinella and a mixotrophic Pelagohalteria viridis (Halteriidae), Rimostrombidium brachykinetum, R. humile and other similar species, some of them with kleptoplasts (Strobilidiidae), and Vorticella aqua-dulcis complex, Vorticella spp. and Pseudohaplocaulus sp. (Peritrichidae) were the most important.
Halteriids and strobilidiids followed the whole group dynamics before and during stratification, reaching the median biomass >1.5 μg/L (Figure 7). The maximum of peritrichs was lower (>1 μg/L), but the IQR was much more variable. They peaked just before or during stratification during both studied periods. Almost all found species were attached, but we also found free-swimming peritrichs (e.g., Vorticella mayeri, Hastatella spp., Astylozoon sp.) and de-attached ectobionts Trichodina cf. diaptomi.
Pelagic colonial Epistylis spp. were the most common during stratification. Their large colonies were never observed intact, and their segments observed in QPS preparations varied in size and number in repeatedly processed preparations. Because of the insufficient volume of samples for their analysis, it was impossible to quantify them accurately, so we discarded them from the biomass analysis.
Minute picoplankton-feeding scuticociliates formed the third component of picoplanktivorous ciliates (not shown). The genus Cyclidium, mostly C. glaucoma (Cyclidiidae) and Cinetochilum margaritaceum (Cinetochilidae) were the most frequent. We found them repeatedly, even in high abundance, but their biomass median was very low and frequently zero. On the other hand, their presence increased the ciliate group biomass (median) at the end of stratification.
Phytoplankton non-filter food harvesting (algivores; algae hunters, AH) ciliates formed the third most important group (Figure 8 and Figure S5), reaching a median maximum just before the spring phytoplankton peak, i.e., before stratification (2.4 and 10.8 μg/L during periods A and B, respectively); higher biomass (about 1.5 μg/L) was observed during stratification in period B.
Minute one-tailed urotrichs resembling Urotricha agilis, doble-tailed U. furcata or U. pseudofurcata and multiple-tailed U. castalia or U. pelagica (Urotrichidae) were distinguished. The position of Balanion planctonicum (Balanionidae) was uncertain using a median attempt: the ciliate repeatedly reached very high abundances, which was apparent in the group's total biomass but not in the ciliate median biomass value. A similar data behaviour was observed for the scuticociliates Histiobalantium spp. (Histiobalantiidae), which were not so numerous but of high individual cell biomass while giving a median zero value during period A (data not shown in the graph). In the spring chlorophyll peak of period B, the ciliate median was 0.5 μg/L, increasing the total algivorous ciliates’ biomass during the autumn column mixing (October).
We have excluded from the algivorous species category a large prostome genus Holophrya (Holophryidae) found in low numbers with ingested algae. At the same time, we included Coleps spp., which are sometimes mixotrophic, within raptorial species. Diatom-feeding ciliates Phascolodon vorticella and Trithigmostoma spp. were scarcely observed, too.
Raptorial ciliates or flagellate hunters (RH; several scarce and large species such as haptorids not included) reached the lowest biomass among the analysed feeding behaviour ciliate groups (Figure 9 and Figure S6), particularly during period A. However, during period B, they presented a constant biomass of about 1 μg/L from March to December.
The genus Askenasia (incertae sedis, CON-threeP) was one of the most important among raptorial ciliates. We observed frequently minute Askenasia spp., the species resembling A. acrostomia, Askenasia volvox, and a mixotrophic A. chlorelligera, to which different cell biomasses were assigned. Rhabdoaskenasia minima was probably included, though the species-typical extrusomes were not recognised. During period A, they were unimportant except for the end of stratification and the following autumn mixing. However, during period B, they dominated during the formation and the end of the stratification. A minute Mesodinium spp. (incertae sedis, SAL) was very important during the autumn mixing in the A and B periods, though its minute cell biomass was very low.
Among other raptorial species were notable Lagynophrya spp. (Trachelophyllidae), both heterotrophic and mixotrophic, Enchelys spp. (Enchelyidae), a minute Monodinium spp. (Didinidae), and Pelagolacrymaria sp. (Lacrymariidae). However, they were observed in much less than 50% of samples.
Among the excluded large predatory species, the most important were dileptids (mostly resembling Pelagodileptus sp., Dileptidae); they used to appear typically by June. The scarcest but repeatedly observed large ciliate was Lacrymaria sp. (Lacrymariidae) during the spring phytoplankton peak (April).
3.3. Predator-Prey Relation and Importance of Different Feeding Behaviour Patterns within Ciliates
We characterized the years of the study using a non-metric multidimensional scaling (NMDS) based on explanatory variables composed of temperature, concentrations of dissolved oxygen, total phosphorus (with particles <40 µm), DIN, chlorophyll a, and abundances of ciliate prey bacteria, HNF and Rhodomonas spp. (Figure 10a). We did not draw round-the-year sampling data to the graph but those covering all principal ciliate peaks: from spring phytoplankton peak-related, i.e., two sampling dates before the event of stratification, to the end of summer phytoplankton peak with two ciliate local maximums, i.e., to the end of stratification). Only a possible winter (February-March) B. planctonicum and autumn (November) Mesodinium spp. maximums were not included.
According to the physical-chemical and ciliate-prey analysis, years from periods A and B form well-defined clusters with only small overlapping (Figure 10a). However, the same procedure with the ciliate data gave a less pronounced grouping (Figure 10b). According to vector directions, AH ciliates were driven in the same direction as MN ciliates, while HN showed a contrasting direction to them. PF and RH showed a trend similar to the ciliate assemblage biomass (corrected; without scarce and large species).
We combined the concluding results of the annual growth of ciliate feeding behaviour groups graphically (Figure 11). In the following text, medians and interquartile ranges are mentioned.
PF ciliates (mainly halteriids, strobilidiids, peritrichs and less important minute scuticociliates) were the most biomass-important from the end of mixing through the end of stratification or throughout the year in periods A and B, respectively, reaching a maximum of 3.2 (6.7; 0.82) and 4.7 (20.0; 1.2) μg/L (Figure 11a,b). Nanoplankton filtering heterotrophs’ peak (of tintinnids, Rimostrombidium lacustris) occurred before- or about the stable stratification (3.1 (9.6; 0.66) and 3.4 (10.5; 0.90) μg/L during periods A and B, respectively). Filtering mixotrophs were the most abundant during stratification (maximum of 8.6 (16.1; 3.2) and 8.7 (18.7; 4.8) μg/L, respectively).
A maximum of AH occurred during a spring phytoplankton peak before the event of stratification (2.4 (14.4: 0.3) and 10.8 (44.5; 1.4) μg/L, respectively) when mostly urotrichs dominated (Figure 11c,d). Sometimes, a year maximum of B. planctonicum was observed in winter/spring or towards the end of stratification, and that of Histiobalantium spp. before the stratification and during the autumn mixing; however, medians of the species were near zero.
Flagellate hunters Mesodinium spp. (Figure 11c,d) were the only ciliates peaking during autumn mixing (reaching biomass of 0.47 (1.3: 0.00) μg/L during period B). Other RH (mainly of genera Askenasia, Lagynophrya, Enchelys, minute Monodinium) were essential during the spring peak of phytoplankton and then during stratification, reaching another maximum at the end of it (maximum of 0.37 (0.83; 0.00) and 1.0 (2.1; 0.11) μg/L during periods A and B, respectively).
The difference between periods A and B was apparent when we analyse the assemblage composition from the view of heterotrophy and mixotrophy (Figure 12), summing species with zoochlorelae or kleptoplasts. During A, a maximum of mixotrophs occurred at the beginning of stratification (4.46 (10.1; 2.53) μg/L) but dropped quickly and significantly below the heterotrophic biomass. On the other hand, during period B, heterotrophs reached their maximum during a spring phytoplankton peak (30.6 (50.4; 13.3) μg/L), but then mixotrophs were of the same or even higher biomass throughout the stratification (maximum of 15.5 (22.1; 4.9) μg/L comparing to heterotrophs of 8.1 (15.6; 2.86) μg/L).
4. Discussion
4.1. Hydrodynamics of the Surface Layer and a Legacy of Defined Periods A and B
Three-metre samples covered mostly the entire epilimnion and did not penetrate to metalimnion during the stratification of the Slapy reservoir. The same monitoring approach has persisted over the past decades, focusing on the surface or epilimnion layer despite variations in water bodies worldwide (recently, e.g., [37]). Notably, this method is not universal, particularly in water bodies with shallow epilimnion that do not align perfectly with the euphotic zone.
Compared to great lakes with abundant ciliate data [16,25,26,30,54], the sampled layer depth is shallow in the Slapy reservoir. However, hydrodynamic studies have proven its separation from deeper layers and homogeneity of the epilimnion during stratification periods (Figure S2c,d). The water age was gradually increased until the end of stratification, reaching about 80 days, compared to a maximum of 40 days in the layer below <4 m, which is like the whole reservoir mean retention time <40 days [38,39,41]. The difference in water ages in the layers was more pronounced in period B. Resulting layer separation also means a physical separation of the layers’ ciliate assemblages, which may be completely independent of the metalimnetic processes. We could compare our data with those obtained in the surface layers of shallow but stratified lakes or lakes with shallow epilimnion. In another studied case, the Římov reservoir ciliates assemblage composition and activity in the epilimnion was also independent of a separated layer, into which the river incorporated [35,55,56].
The general challenge in biological monitoring arises from shifts in a water body's hydrodynamics and related biological processes, prompting us to employ different analytical approaches due to variations in the onset of stratification. While attempts were made to normalise sampling timing, the resulting projections did not substantially alter the observed curves (Figure 4). In period A, the ciliates presented two pronounced biomass peaks during stratification; a summer phytoplankton peak at the end moved backwards, and the abundance and biomass peaks coincided. During B, the stratification intermediate biomass peak lasted longer but decreased towards the culmination of a summer Chl a peak, which was two-fold lower (Figure 1). The observed changes towards the end of stratification may be influenced by differences in stratification duration (number of samplings during it). Thus, we did not apply such normalisation to the ciliate feeding behaviour groups.
Gaedke and Wickham [17] normalised the processes related to a spring peak using the position of clear water. However, if the Slapy reservoir was sampled once every three weeks, we would have only one clear-water sampling. We partly applied the attempt of Straškrábová [50], who normalised timing based on the Chl a concentration marked in the graphs (Figure 3). We found such a criterion useful when looking for the “ciliate season” covering principle ciliate peaks. The spring phytoplankton peak was put at Chl a >5 μg/L, i.e., two sampling dates before the event of stratification; clear water was defined by Chl a <7 μg/L, and the end of summer phytoplankton peak by Chl a <10 μg/L, i.e., the end of stratification. It covered algivorous and nanoplankton-feeding ciliate spring peaks and summer ciliate maximums. Only autumn mixing /winter maximum of Mesodinium spp. was excluded.
We applied the Chl a criterion to characterise the years of the study using a non-metric multidimensional scaling (NMDS) based on explanatory variables (T, DO, total phosphorus (with particles <40 µm), DIN, chlorophyll a, and abundances of bacteria, HNF and Rhodomonas spp. (Figure 10a). Years from periods A and B form distinct clusters with several exceptions. During period A, the unusual year 1998 presented significant drops in DIN (Figure S1), chlorophyll a and HNF abundance, but bacteria abundance reached the highest value (Figure 1). Contrary to this, the years 2006 and 2009 were of the highest DIN, chlorophyll a and HNF abundance (Figure 1 and Figure S1) during period B. According to Jeppesen et al. [57], recently, nitrogen has become a limited nutrient in various water bodies, sometimes surpassing the limitation of phosphorus. Though there was proven a different hydrodynamic separation in periods A and B, chosen through a phosphorus load drop before 2004 [39,40,43], nitrogen limitation is another factor probably controlling the whole plankton growth, including ciliates.
4.2. Environment Ciliates’ Identification Issues
The taxonomy of plankton ciliates has changed during the study, partly due to QPS application, and the ciliate taxa frequently published from plankton in the 90s “disappeared”, being replaced by other names, sometimes based on an identification priority. In our work, this is the case of urotrichs, where our criteria for evaluating them were again limited to the size distribution (compare, [16,26,58-59). The problem cannot be solved simply using molecular methods since such an attempt would describe more cryptic species, which are probably both morphologically and ecologically the same or very similar; only scarce comparative studies between the identification methods were carried out in the environmental samples [2,28,30,60]. Also, the minute oligotrich species are challenging to identify according to their morphology in the samples [58,61].
Very similar cases are freshwater mixotrophic oligotrichs, where both genera Pelagostrombidium and Limnostrombidium were put to the same taxon (Pelagostrombidiidae). In theory, distinguishing them is easy, but there are some doubts that their morphology could vary according to the environmental conditions [1]. On the species level of Pelogostrombidium, molecular information on P. fallax and P. mirabile was also obtained using isolates, but the morphological details are challenging to observe in uncultured populations. Commonly, Pelagostrombidium sp. is contrasted to Limnostrombidium sp., but not P. fallax vs. P. mirabile or L. pelagicum vs. L. viride [26,62,63,64,65]. Additionally, one may find significantly different two size categories of the cells within the population (this study).
Within tintinnids, the genera Tintinnidium and Tintinnopsis are well-defined [1] based on protargol stain. However, identifying them by routinely counting the plankton samples is nearly impossible, while Codonella cratera and Membranicola could be well distinguished [28]. The same is valid for the genera Askenasia and related Rhabdoaskenasia [25] [26,66,67,68,69]. It is easier to define mixotrophic and heterotrophic species, supposing that they represent Askenasia chlorelligera, and according to the size, Askenasia volvox and the others, which might not be correct [1].
4.3. Ciliate Ecology in the Reservoir
The absolute biomasses of peaking ciliates in our study (interquartile range up to 30 μg/L) are well comparable with the results from, e.g., Lake Constance [16,54,70,71] but lower than in shallow eutrophic lakes [59,72,73,74]. This aligns with the observed oligotrophication trend in the Slapy reservoir [40].
For the assortment of the ciliate species to feeding behaviour groups, we used detailed information on morphologically identified genera or species in QPS preparations (Table 1). We applied an epifluorescence examination of the ciliate vacuole content in parallel for a long time. Additionally, we used fluorescently labelled prey to confirm direct picoplankton ingestion by different ciliates in various water bodies [18,20,21,75] and our results were cross-checked with publications from other groups, specialised on the investigation of the ciliate role in the microbial loop [19,76,77].
Comparing the limnological variables, possible ciliate prey abundances, and the ciliates in the graphical presentation, one can state that everything is tightly coupled with the stratification of the reservoir along with a spring Chl a peak (April to May). Generally, phytoplankton and the ciliate growth concurred with the revised PEG model [4] but less with a scenario that Posch et al. [78] proposed because of a weakened summer phytoplankton peak in the Slapy reservoir. However, periods A and B present different patterns, and in particular, apparent relations between the variables might be different throughout the year (Figures S2, 3–5 and 9). During period A a typical eutrophic pattern was evident [4]. In contrast, period B exhibited characteristics more akin to oligotrophic conditions, like those found in Trauensee or Lake Zurich [26,28]. However, Pfister et al. [59], based on a well-supported database on fresh- and brackish water ciliates, stated that the species composition is not significantly different in water bodies of different phosphorus and chlorophyll concentrations, which control, however, the abundance of ciliates. It could apply to the annual means or medinas of the ciliate distribution, but according to our results, it may differ during the annual growth cycle.
The NMDS analysis identifies possible causal relations between the study years using the ciliate data covering all the assemblage annual peaks (for data selection, see Chapter 3.3; Figure 10). However, the grouping of years from periods A and B did not form such distinct clusters in the graph as in the case of environmental variables and possible ciliate prey.
The analysis identifies similar vector directions of the ciliate assemblage biomass, picoplankton filtering (PF) and raptorial and flagellate hunting ciliates (RH). PF were biomass dominating or important through the whole analysed period. Depending on the species composition, their first peak appeared before or during the stratification event, and the second passed the clear water phase until the end of the stratification. A common, halteriids (Halteria grandinella, Pelagohalteria viridis), and small strobilidiids (Rimostrombidium humile, R. brachykinetum and other unidentified species) were the most common bacterivores/omnivores of the lake communities [16,18,26,28,73,75]. On the other hand, the low importance of minute scuticociliates would be surprising if we did not consider the nearly permanent DO oversaturation of the Slapy reservoir surface while their optimum layer should be a local DO minimum [29,67]. Minute scuticociliates (Cyclidium glaucoma, Cinetochilum margaritaceum) were the most important species; it concurs with the observation of, e.g., Müller [16]. Solitary peritrichs, mainly Vorticella aqua-dulcis and Vorticella sp. colonising diatoms Fragillaria sp., and Pseudohaplocaulus sp. on cyanobacteria Anabaena sp. were the most common within the group [26]. Recently, a new observation confirmed the omnivory of peritrichs and, in the case of pelagic free-swimming vorticellids also, efficient ingestion of nanoplanktonic, e.g., cryptomonads [79,80].
RH did not reach high biomass (except for scarce, e.g., Pelagodileptus sp. or Lacrymaria sp., which were excluded from the analysis). Their occurrence with their food, e.g., HNF and related bacterioplankton is logical. As in other water bodies, Askenasia sp. and Lagynophrya spp., both heterotrophic and mixotrophic were common [18,26,81]. Minute Mesodinium spp. biomass replaced other RH during autumn-winter mixing (not included in the NMDS analysis). Though the median from period A was very low, in period B it was of the same value as the others with quite a high range. Freshwater mesodinia data are scarce [82].
Heterotrophic nanoplankton filtering ciliates (HN) presented the vector direction very differently. The group dominated by tintinnids presented the biomass peak before the stratification event. However, their feeding preference should be like those of mixotrophic nanoplankton filtering ciliates (MN), culminating just at the event of stratification. It is probable that tintinnids were entering the surface layer of the Slapy reservoir with the water inlet. In the Římov reservoir, the tinitinnid peak was localised at the temperature of the inlet river water flow [35,55]). Rimostrombidium lacustris should have the same feeding preferences as MN [47], but also, the ciliate maximum was observed when Rhodomonas spp. abundances would not support the ciliate growth.
The algae hunting (AH) ciliates´ vector is almost the same as that of MN. It could be related to their preferred prey, minute photosynthetic cryptomonads, including Rhodomonas spp. [47,79,81,83], but strombidiids use them mainly as a source of kleptoplasts [84,85]. On the other, the feeding group maximums occurred in different periods. AH winter/spring peaks were composed first of B. planctonicum, which should prefer temperatures below 18 °C [86]. It was followed by Urotricha spp. and, particularly in period B, by Histiobalantium spp. during the spring phytoplankton peak [26,28,30,47] but already dropping with the stable stratification, when MN reached their maximum.
After a short clear water phase (periodically observed in one sampling date), both AH and MN could develop again, though their growth was not already supported by rhodomonads; the discrepancy was already observed by Müller et al. [81]. We suppose both groups were eating also upon HNF, which were invisible in the feeding vacuoles. Ingestion of bacteria by minute prostomes (urotrichs, B. planctonicum) was negligible [18], and we never observed ingestion of them by Histiobalantium spp., as proven in cultures [81] but discarded, when suitable flagellate food was present [79,87]. Contrary to the above-mentioned experiments, we observed B. planctonicum at water temperatures up 22 °C during the summer phytoplankton peak.
However, feeding of strombidiids is not limited to nanophytoplankton, and they are efficient HNF and bacteria feeders [18,77,88,89], which explains their elevated biomass even in a lack of cryptomonads.
Median sampling results showing the annual cycle of the ciliate behavioural groups (Figure 11) could not be generalised because the range of data in any long-term monitored water body is wide due to “unusual years” (Figure 2 and Figure 10). The problem behind such observation is related to the “wished sampling period”, according to the ciliate generation times and monitoring programme possibilities. It was repeatedly shown that significant changes in the ciliate assemblage used to take place within a week period.
In other short studies carried out by our team, e.g., in the Římov reservoir, we sampled either the surface/epilimnion layer or the phase limits (thermocline/oxycline) or directly the river body within the reservoir water column [18,56,67,88]. It was proven that our reservoirs’ ciliate assemblage activity is not located on the surface, in the DO oversaturated layer, and that its importance is in the below-metalimnion layers with frequent DO depletion. On the one hand, it explains a predictable ciliate assemblage growth and observed discrepancies between the ciliates and their supposed prey abundance. The same pattern is known from the water bodies worldwide [19,21,25,26,28,29,32,33,34].
5. Conclusions
- The presented results as part of the long-term monitoring of reservoir Slapy, to which the ciliate analysis was added in 1994, is one of the longest from freshwater bodies.
- An application of the most straightforward statistical approach of median and interquartile range on a two-decade monitoring data on ciliates in the Slapy reservoir gave results which confirmed ciliate position in the updated PEG model, showing two main peaks related to a spring and summer phytoplankton maximums.
- The observation period was divided into two sections, which differed in terms of the reservoir's nutrient load and were associated with different patterns. In the first period, with higher nutrient loading, the spring peak of ciliate biomass was much higher than the summer one. Apparently, the phytoplankton suppressed the ciliate growth. During the lower nutrient loading period, two similarly high peaks were observed, consisting mainly of mixotrophic species.
- If the ciliate biomass data were time-normalised using a calculated day of stratification, a spring peak and a clear water phase would be very well defined. However, no adequate improvement was observed at the end of the stratification as the duration of the stratification varied.
- It has been shown that the empirical chlorophyll a concentrations marking the beginning of the spring peak at 5 µg/L and the end of the summer peak at 7 µg/L coincide with the main peak of the ciliates: The spring peak of algae-hunting ciliates (Balanion planctonicum, urotrichs; more recently also Histiobalantium spp.) and heterotrophic nanoplankton-filtering tintinnids before stratification, and a peak of mixotrophic nanoplankton filtering ciliates in the stratification event, which lasted longer during the period of lower nutrient load. However, the ciliates showed a higher biomass before the summer peak of chlorophyll a. Only one ciliate, the genus Mesodinium, reached its maximum during the autumn mixing.
- Using the hydrodynamic model to calculate the water age in the epilimnion/surface layer proved useful for understanding ciliate growth there; the layer was well separated, which explains the straightforward behaviour of the ciliates and the composition assemblage changes with increasing nutrient limitation. On the other hand, no information can be extrapolated about the composition and activity of the ciliate assemblage in other parts of the water column.
- By monitoring the ciliate assemblages in the surface layers of different freshwater bodies, we gained valuable insights into their role within the microbial loop of the plankton food web. Our findings revealed an annual periodicity and long-term variations. It is recommended that future monitoring cover additional layers, such as deep chlorophyll a maximum or oxygen local minimum, if present, to capture the complexity of water bodies such as reservoirs or lakes with continuous river flow.
Supplementary Materials
The following supporting information can be downloaded at the website of this paper posted on Preprints.org, Figure S1: Physical-chemical variables in Slapy reservoir, annual and stratification periods’ means. Figure S2: Median and interquartile range of data during the periods A and B. Figure S3: Nanoplankton filtering ciliates. Figure S4: Picoplankton filtering ciliates. Figure S5: Algae hunting ciliates. Figure S6: Raptorial and flagellate hunting ciliates.
Author Contributions
Conceptualization, M.M. and J.V.; methodology, M.M., J.H., K.Ř. ; software, J.J., M.M. and M.Š.; validation, M.M., J.H. and K.Ř.; formal analysis, M.M., J.J. and M.Š.; investigation, J.V., M.M. and M.Š; data curation, M.M.; writing—original draft preparation, M.M.; writing—review and editing, J.V., J.H., K.Ř.; visualization, M.M. and M.Š.; supervision, we have not got any; project administration, J.V.; funding acquisition, J.V. and past members of today Institute of Hydrobiology, České Budějovice. All authors have read and agreed to the published version of the manuscript.
Funding
This research was funded by the long-term reservoir monitoring funded by the IHB BC CAS, and J.V., J.H., M.M. and M.Š, were partly granted by Czech Science Foundation (GA ČR) grant 15-04034S (2015–2017) “Do long-term zooplankton data in the Slapy reservoir reflect land use and/or climate changes in the past 50 years?”.
Institutional Review Board Statement
Not applicable.
Data Availability Statement
The data, including total ciliate assemblage abundance and biomass, are deposited in the IHB BC CAS. If collaborative analysis is required, ciliate species data are available on demand from M.M.
Acknowledgements
The research would not be possible without the leadership of Viera Straškrábová, D.Sc., the founder of today's Dept. Aquatic Microbial Ecology and then director of the Institute. In introducing the modern microbial ecology methods, Prof. Karel Šimek was another key investigator behind the evaluation of ciliates’ behaviour. M.M. thank the IHB BC CAS and UNAM México, which made possible so long active collaboration, partly supported by the academic exchange programme of CONACYT, México.
Conflicts of Interest
The authors declare no conflicts of interest. The funders had no role in the design of the study; in the collection, analyses, or interpretation of data; in the writing of the manuscript; or in the decision to publish the results.
References
- Foissner, W.; Berger, H.; Schaumburg, J. Identification and Ecology of Limnetic Plankton Ciliates; Informationsberichte; Informationberichte des Bayerischen Landesamtes Institut für Wasserwirtschaft: Munich, 1999; ISBN 978-3-930253-79-1.
- Weisse, T.; Montagnes, D.J.S. Ecology of Planktonic Ciliates in a Changing World: Concepts, Methods, and Challenges. J. Eukaryot. Microbiol. 2022, 69, e12879. [CrossRef]
- Plattner, H. Ciliate Research: From Myth to Trendsetting Science. J. Eukaryot. Microbiol. 2022, 69, e12926. [CrossRef]
- Sommer, U.; Adrian, R.; De Senerpont Domis, L.; Elser, J.J.; Gaedke, U.; Ibelings, B.; Jeppesen, E.; Lürling, M.; Molinero, J.C.; Mooij, W.M.; et al. Beyond the Plankton Ecology Group (PEG) Model: Mechanisms Driving Plankton Succession. Annu. Rev. Ecol. Evol. Syst. 2012, 43, 429–448. [CrossRef]
- Zimmermann, R.; Meyer-Reil, L.-A. A New Method for Fluorescence Staining of Bacterial Populations on Membrane Filters. 30, 24–27. https://oceanrep.geomar.de/id/eprint/56019.
- Caron, D.A. Technique for Enumeration of Heterotrophic and Phototrophic Nanoplankton, Using Epifluorescence Microscopy, and Comparison with Other Procedures. Appl. Environ. Microbiol. 1983, 46, 491–498. [CrossRef]
- Porter, K.G.; Feig, Y.S. The Use of DAPI for Identifying and Counting Aquatic Microflora1. Limnol. Oceanogr. 1980, 25, 943–948. [CrossRef]
- Azam, F.; Fenchel, T.; Field, J.; Gray, J.; Meyer-Reil, L.; Thingstad, F. The Ecological Role of Water-Column Microbes in the Sea. Mar. Ecol. Prog. Ser. 1983, 10, 257–263. [CrossRef]
- Sherr, E.B.; Sherr, B.F. Protistan Grazing Rates via Uptake of Fluorescently Labeled Prey. In Handbook of Methods on Aquatic Microbial Ecology; Kemp, P.F., Sherr, B.F., Sherr, E.B., Cole, J.J., Eds.; Lewis Publishers: London, 1993; pp. 695–701.
- Sherr, E.B.; Sherr, B.F.; Berman, T.; Hadas, O. High Abundance of Picoplankton-Ingesting Ciliates during Late Fall in Lake Kinneret, Israel. J. Plankton Res. 1991, 13, 789–799. [CrossRef]
- Gifford, D.J. Consumption of Protozoa by Copepods Feeding on Natural Microplankton Assemblages. In Handbook of Methods on Aquatic Microbial Ecology; Kemp, P.F., Sherr, B.F., Sherr, E.B., Cole, J.J., Eds.; Lewis Publishers: London, 1993; pp. 723–729.
- Stoecker, D.; Pierson, J. Predation on Protozoa: Its Importance to Zooplankton Revisited. J. Plankton Res. 2019, 41, 367–373. [CrossRef]
- Hecky, R.E.; Kling, H.J. The Phytoplankton and Protozooplankton of the Euphotic Zone of Lake Tanganyika: Species Composition, Biomass, Chlorophyll Content, and Spatio-temporal Distribution1. Limnol. Oceanogr. 1981, 26, 548–564. [CrossRef]
- Sherr, E.B.; Sherr, B.F. Preservation and Storage of Samples for Enumeration of Heterotrophic Protists. In Handbook of Methods on Aquatic Microbial Ecology; Kemp, P.F., Sherr, B.F., Sherr, E.B., Cole, J.J., Eds.; Lewis Publishers: London, 1993; pp. 207–212.
- Stoecker, D.K.; Gifford, D.J.; Putt, M. Preservation of Marine Planktonic Ciliates: Losses and Cell Shrinkage during Fixation. Mar. Ecol. Prog. Ser. 1994, 110, 293–299. [CrossRef]
- Müller, H. The Relative Importance of Different Ciliate Taxa in the Pelagic Food Web of Lake Constance. Microb. Ecol. 1989, 18, 261–273. [CrossRef]
- Gaedke, U.; Wickham, S.A. Ciliate Dynamics in Response to Changing Biotic and Abiotic Conditions in a Large, Deep Lake (Lake Constance). Aquat. Microb. Ecol. 2004, 34, 247–261. [CrossRef]
- Šimek, K.; Bobková, J.; Macek, M.; Nedoma, J.; Psenner, R. Ciliate grazing on Picoplankton in a Eutrophic Reservoir during the Summer Phytoplankton Maximum: A Study at the Species and Community Level. Limnol. Oceanogr. 1995, 40, 1077–1090. [CrossRef]
- Hadas, O.; Berman, T. Seasonal Abundance and Vertical Distribution of Protozoa (Flagellates, Ciliates), and Bacteria in Lake Kinneret, Israel. Aquat. Microb. Ecol. 1998, 14, 161–170. [CrossRef]
- Peštová, D.; Macek, M.; Martínez-Pérez, M.E. Ciliates and Their Picophytoplankton-Feeding Activity in a High-Altitude Warm-Monomictic Saline Lake. Eur. J. Protistol. 2008, 44, 13–25. [CrossRef]
- Bautista-Reyes, F.; Macek, M. Ciliate Food Vacuole Content and Bacterial Community Composition in the Warm-Monomictic Crater Lake Alchichica, México. FEMS Microbiol. Ecol. 2012, 79, 85–97. [CrossRef]
- Montagnes, D.J.S.; Lynn, D.H. A Quantitative Protargol Stain (QPS) for Ciliates and Other Protists. In Handbook of Methods on Aquatic Microbial Ecology; Kemp, P.F., Sherr, B.F., Sherr, E.B., Cole, J.J., Eds.; Lewis Publishers: London, 1993; pp. 229–240.
- Skibbe, O. An Improved Quantitative Protargol Stain for Ciliates and Other Planktonic Protists. Arch. Hydrobiol. 1994, 130, 339–347. [CrossRef]
- Pfister, G.; Sonntag, B.; Posch, T. Comparison of a Direct Live Count and an Improved Quantitative Protargol Stain (QPS) in Determining Abundance and Cell Volumes of Pelagic Freshwater Protozoa. Aquat. Microb. Ecol. 1999, 18, 95–103. [CrossRef]
- Sonntag, B.; Posch, T.; Klammer, S.; Griebler, C.; Psenner, R. Protozooplankton in the Deep Oligotrophic Traunsee (Austria) Influenced by Discharges of Soda and Salt Industries. Water Air Soil Pollut. Focus 2002, 2, 211–226. [CrossRef]
- Sonntag, B.; Posch, T.; Klammer, S.; Teubner, K.; Psenner, R. Phagotrophic Ciliates and Flagellates in an Oligotrophic, Deep, Alpine Lake: Contrasting Variability with Seasons and Depths. Aquat. Microb. Ecol. 2006, 43, 193–207. [CrossRef]
- Macek, M.; Callieri, C.; Šimek, K.; Lugo-Vázquez, A. Seasonal Dynamics, Composition and Feeding Patterns of Ciliate Assemblages in Oligotrophic Lakes Covering a Wide pH Range. Arch. Für Hydrobiol. 2006, 166, 261–287. [CrossRef]
- Posch, T.; Eugster, B.; Pomati, F.; Pernthaler, J.; Pitsch, G.; Eckert, E.M. Network of Interactions Between Ciliates and Phytoplankton During Spring. Front. Microbiol. 2015, 6. [CrossRef]
- Sánchez Medina, X.; Macek, M.; Bautista-Reyes, F.; Perz, A.; Bonilla Lemus, P.; Chávez Arteaga, M. Inter-Annual Ciliate Distribution Variation within the Late Stratification Oxycline in a Monomictic Lake, Lake Alchichica (Mexico). J. Limnol. 2016, 75. [CrossRef]
- Pitsch, G.; Bruni, E.P.; Forster, D.; Qu, Z.; Sonntag, B.; Stoeck, T.; Posch, T. Seasonality of Planktonic Freshwater Ciliates: Are Analyses Based on V9 Regions of the 18S rRNA Gene Correlated with Morphospecies Counts? Front. Microbiol. 2019, 10, 248. [CrossRef]
- Dirren-Pitsch, G.; Bühler, D.; Salcher, M.M.; Bassin, B.; Le Moigne, A.; Schuler, M.; Pernthaler, J.; Posch, T. FISHing for Ciliates: Catalyzed Reporter Deposition Fluorescence in Situ Hybridization for the Detection of Planktonic Freshwater Ciliates. Front. Microbiol. 2022, 13, 1070232. [CrossRef]
- Finlay, B.J.; Esteban, G.F. Planktonic Ciliate Species Diversity as an Integral Component of Ecosystem Function in a Freshwater Pond. Protist 1998, 149, 155–165. [CrossRef]
- Taylor, W.D.; Heynen, M.L. Seasonal and Vertical Distribution of Ciliophora in Lake Ontario. Can. J. Fish. Aquat. Sci. 1987, 44, 2185–2191. [CrossRef]
- Madoni, P. The Ciliated Protozoa of the Monomictic Lake Kinneret (Israel): Species Composition and Distribution during Stratification. Hydrobiologia 1990, 190, 111–120. [CrossRef]
- Macek, M. Distribution of Ciliates in the Římov Reservoir. Ergeb. Limnol. 1994, 40, 137–141.
- Qu, Z.; Forster, D.; Bruni, E.P.; Frantal, D.; Kammerlander, B.; Nachbaur, L.; Pitsch, G.; Posch, T.; Pröschold, T.; Teubner, K.; et al. Aquatic Food Webs in Deep Temperate Lakes: Key Species Establish through Their Autecological Versatility. Mol. Ecol. 2021, 30, 1053–1071. [CrossRef]
- Abdullah Al, M.; Wang, W.; Jin, L.; Chen, H.; Xue, Y.; Jeppesen, E.; Majaneva, M.; Xu, H.; Yang, J. Planktonic Ciliate Community Driven by Environmental Variables and Cyanobacterial Blooms: A 9-Year Study in Two Subtropical Reservoirs. Sci. Total Environ. 2023, 858, 159866. [CrossRef]
- Straškraba, M.; Hrbáček, J.; Javornický, P. Effect of an Upstream Reservoir on the Stratification Conditions in Slapy Reservoir. In Hydrobiological Studies 2; Hrbáček, J., Straškraba, M., Eds.; Academia, Prague, 1973; pp. 7–82.
- Kopáček, J.; Hejzlar, J.; Porcal, P.; Posch, M. Trends in Riverine Element Fluxes: A Chronicle of Regional Socio-Economic Changes. Water Res. 2017, 125, 374–383. [CrossRef]
- Kopáček, J.; Hejzlar, J.; Porcal, P.; Znachor, P. Biogeochemical Causes of Sixty-Year Trends and Seasonal Variations of River Water Properties in a Large European Basin. Biogeochemistry 2021, 154, 81–98. [CrossRef]
- Fott, J.; Nedbalová, L.; Brabec, M.; Kozáková, R.; Řeháková, K.; Hejzlar, J.; Šorf, M.; Vrba, J. Light as a Controlling Factor of Winter Phytoplankton in a Monomictic Reservoir. Limnologica 2022, 95, 125995. [CrossRef]
- Lewis Jr., W.M. A Revised Classification of Lakes Based on Mixing. Can. J. Fish. Aquat. Sci. 1983, 40, 1779–1787. [CrossRef]
- Vystavna, Y.; Hejzlar, J.; Kopáček, J. Long-Term Trends of Phosphorus Concentrations in an Artificial Lake: Socio-Economic and Climate Drivers. PLoS ONE 2017, 12, e0186917. [CrossRef]
- Cole, T.M. CE-QUAL-W2: A Two-Dimensional, Laterally Averaged, Hydrodynamic and Water Quality Model 2016.
- Monsen, N.E.; Cloern, J.E.; Lucas, L.V.; Monismith, S.G. A Comment on the Use of Flushing Time, Residence Time, and Age as Transport Time Scales. Limnol. Oceanogr. 2002, 47, 1545–1553. [CrossRef]
- Lorenzen, C.J. Determination of Chlorophyll and Pheo-Pigments: Spectrophotometric Equations. Limnol. Oceanogr. 1967, 12, 343–346. [CrossRef]
- Müller, H.; Schlegel, A. Responses of Three Freshwater Planktonic Ciliates with Different Feeding Modes to Cryptophyte and Diatom Prey. Aquat. Microb. Ecol. 1999, 17, 49–60. [CrossRef]
- Jerome, C.A.; Montagnes, D.J.S.; Taylor, F.J.R. The Effect of the Quantitative Protargol Stain and Lugol’s and Bouin’s Fixatives On Cell Size: A More Accurate Estimate of Ciliate Species Biomass. J. Eukaryot. Microbiol. 1993, 40, 254–259. [CrossRef]
- Adl, S.M.; Bass, D.; Lane, C.E.; Lukeš, J.; Schoch, C.L.; Smirnov, A.; Agatha, S.; Berney, C.; Brown, M.W.; Burki, F.; et al. Revisions to the Classification, Nomenclature, and Diversity of Eukaryotes. J. Eukaryot. Microbiol. 2019, 66, 4–119. [CrossRef]
- Straškrábová, V. Long-Term Development of Reservoir Ecosystems - Changes in Pelagic Food Webs and Their Microbial Component. Limnetica 2005, 24, 9–20. [CrossRef]
- Hyndman, R.J.; Fan, Y. Sample Quantiles in Statistical Packages. Am. Stat. 1996, 50, 361–365. [CrossRef]
- Motulsky, H.J. GraphPad Statistics Guide.; 2016.
- Ter Braak, C.J.F.; Šmilauer, P. Canoco Reference Manual and User’s Guide: Software for Ordination, Version 5.1x.; Microcomputer Power: Ithaca, USA, 2018.
- Weisse, T.; Müller, H.; Pinto-Coelho, R.M.; Schweizer, A.; Springmann, D.; Baldringer, G. Response of the Microbial Loop to the Phytoplankton Spring Bloom in a Large Prealpine Lake. Limnol. Oceanogr. 1990, 35, 781–794. [CrossRef]
- Macek, M.; Jezbera, J.; Sed’a, J.; Straškrábová, V.; Šimek, K.; Han, D. Distribution and Growth Rates of Ciliates along a Longitudinal Profile of the Římov Reservoir. In Proceedings of the ResLim 2002; Hydrobiol. Inst. Acad. Sci. Czech Rep. & Fac. Biol. Sci. Univ. South Bohemia: České Budějovice, Czech Republic, 2002; pp. 196–199.
- Jezbera, J.; Nedoma, J.; Šimek, K. Longitudinal Changes in Protistan Bacterivory and Bacterial Production in Two Canyon-Shaped Reservoirs of Different Trophic Status. Hydrobiologia 2003, 504, 115–130. [CrossRef]
- Jeppesen, E.; Sørensen, P.B.; Johansson, L.S.; Søndergaard, M.; Lauridsen, T.L.; Nielsen, A.; Mejlhede, P. Recovery of Lakes from Eutrophication: Changes in Nitrogen Retention Capacity and the Role of Nitrogen Legacy in 10 Danish Lakes Studied over 30 Years. Hydrobiologia 2024. [CrossRef]
- Krainer, K.-H. Taxonomische Untersuchungen an neuen und wenig be kannten planktischen Ciliaten (Protozoa: Ciliophora) aus Baggerseen in Österreich. Luterbornia 1995, 21, 39–68.
- Pfister, G.; Auer, B.; Arndt, H. Pelagic Ciliates (Protozoa, Ciliophora) of Different Brackish and Freshwater Lakes — a Community Analysis at the Species Level. Limnologica 2002, 32, 147–168. [CrossRef]
- Frantal, D.; Agatha, S.; Beisser, D.; Boenigk, J.; Darienko, T.; Dirren-Pitsch, G.; Filker, S.; Gruber, M.; Kammerlander, B.; Nachbaur, L.; et al. Molecular Data Reveal a Cryptic Diversity in the Genus Urotricha (Alveolata, Ciliophora, Prostomatida), a Key Player in Freshwater Lakes, With Remarks on Morphology, Food Preferences, and Distribution. Front. Microbiol. 2022, 12, 787290. [CrossRef]
- Humby, P.L.; Lynn, D.H. Taxonomic Description of Six Species of Pelagic, Freshwater Ciliates from the Order Choreotrichida Collected from Lake Ontario, Canada. Aquat. Ecosyst. Health Manag. 2020, 23, 45–57. [CrossRef]
- Krainer, K.-H. Contributions to the Morphology, Infraciliature and Ecology of the Planktonic Ciliates Strombidium pelagicum n.sp., Pelagostrombidium mirabile (Penard, 1916) n.g., n. comb., and Pelagostrombidium fallax (Zacharias, 1896) n.g., n. comb. (Ciliophora, Oligotrichida). Eur. J. Protistol. 1991, 27, 60–70. [CrossRef]
- Gao, F.; Li, J.; Song, W.; Xu, D.; Warren, A.; Yi, Z.; Gao, S. Multi-Gene-Based Phylogenetic Analysis of Oligotrich Ciliates with Emphasis on Two Dominant Groups: Cyrtostrombidiids and Strombidiids (Protozoa, Ciliophora). Mol. Phylogenet. Evol. 2016, 105, 241–250. [CrossRef]
- Ganser, M.H.; Santoferrara, L.F.; Agatha, S. Molecular Signature Characters Complement Taxonomic Diagnoses: A Bioinformatic Approach Exemplified by Ciliated Protists (Ciliophora, Oligotrichea). Mol. Phylogenet. Evol. 2022, 170, 107433. [CrossRef]
- Agatha, S.; Weißenbacher, B.; Kirschner, M.; Ganser, M.H. Trichite Features Contribute to the Revision of the Genus Strombidium (Alveolata, Ciliophora, Spirotricha). J. Eukaryot. Microbiol. 2024, 71, e13001. [CrossRef]
- Krainer, K.; Foissner, W. Revision of the Genus Askenasia Blochmann, 1895, with Proposal of Two New Species, and Description of Rhabdoaskenasia minima N. G., N. Sp. (Ciliophora, Cyclotrichida). J. Protozool. 1990, 37, 414–427. [CrossRef]
- Macek, M.; Šimek, K.; Pernthaler, J.; Vyhnálek, V.; Psenner, R. Growth Rates of Dominant Planktonic Ciliates in Two Freshwater Bodies of Different Trophic Degree. J. Plankton Res. 1996, 18, 463–481. [CrossRef]
- Küppers, G.C.; Lopretto, E.C.; Claps, M.C. Morphological Aspects and Seasonal Changes of Some Planktonic Ciliates (Protozoa) from a Temporary Pond in Buenos Aires Province, Argentina. Pan-Am. J. Aquat. Sci. 2006.
- Sommer, F.; Sonntag, B.; Rastl, N.; Summerer, M.; Tartarotti, B. Ciliates in Man-Made Mountain Reservoirs. Front. Environ. Sci. 2022, 10, 903095. [CrossRef]
- Cleven, E. Pelagic Ciliates in a Large Mesotrophic Lake: Seasonal Succession and Taxon-Specific Bacterivory in Lake Constance. Int. Rev. Hydrobiol. 2004, 89, 289–304. [CrossRef]
- Tirok, K.; Gaedke, U. Regulation of Planktonic Ciliate Dynamics and Functional Composition during Spring in Lake Constance. Aquat. Microb. Ecol. 2007, 49, 87–100. [CrossRef]
- Lischke, B.; Weithoff, G.; Wickham, S.A.; Attermeyer, K.; Grossart, H.-P.; Scharnweber, K.; HIlt, S.; Gaedke, U. Large Biomass of Small Feeders: Ciliates May Dominate Herbivory in Eutrophic Lakes. J. Plankton Res. 2016, 38, 2–15. [CrossRef]
- Šimek, K.; Grujčić, V.; Nedoma, J.; Jezberová, J.; Šorf, M.; Matoušů, A.; Pechar, L.; Posch, T.; Bruni, E.P.; Vrba, J. Microbial Food Webs in Hypertrophic Fishponds: Omnivorous Ciliate Taxa Are Major Protistan Bacterivores. Limnol. Oceanogr. 2019, 64, 2295–2309. [CrossRef]
- Liu, Y.; Dong, Y.; Zhao, F.; Zheng, S.; Wang, C.; Zhang, W. Distinct Distribution Patterns of Planktonic Ciliate Communities along Environmental Gradients in a Semi-Enclosed Bay. Ecol. Indic. 2022, 144, 109513. [CrossRef]
- Šimek, K.; Macek, M.; Pernthaler, J.; Straškrabová, V.; Psenner, R. Can Freshwater Planktonic Ciliates Survive on a Diet of Picoplankton? J. Plankton Res. 1996, 18, 597–613. [CrossRef]
- Fenchel, T. Protozoan Filter Feeding. Prog. Protistol. 1986, 1, 65–113.
- Bernard, C.; Rassoulzadegan, F. Bacteria or Microflagellates as a Major Food Source for Marine Ciliates: Possible Implications for the Microzooplankton. Mar. Ecol. Prog. Ser. 1990, 64, 147–155. [CrossRef]
- Posch, T.; Pitsch, G.; Bruni, E.P. Protists: Ciliates. In Encyclopedia of Inland Waters; Elsevier, 2022; pp. 639–649 ISBN 978-0-12-822041-2.
- Lu, X.; Gao, Y.; Weisse, T. Functional Ecology of Two Contrasting Freshwater Ciliated Protists in Relation to Temperature. J. Eukaryot. Microbiol. 2021, 68, e12823. [CrossRef]
- Weisse, T.; Jezberová, J.; Moser, M. Picoplankton Feeding by the Ciliate Vorticella similis in Comparison to Other Peritrichs Emphasizes Their Significance in the Water Purification Process. Ecol. Indic. 2021, 121, 106992. [CrossRef]
- Müller, H.; Schöne, A.; Pinto-Coelho, R.M.; Schweizer, A.; Weisse, T. Seasonal Succession of Ciliates in Lake Constance. Microb. Ecol. 1991, 21, 119–138. [CrossRef]
- Kammerlander, B.; Koinig, K.A.; Rott, E.; Sommaruga, R.; Tartarotti, B.; Trattner, F.; Sonntag, B. Ciliate Community Structure and Interactions within the Planktonic Food Web in Two Alpine Lakes of Contrasting Transparency. Freshw. Biol. 2016, 61, 1950–1965. [CrossRef]
- Müller, H. Laboratory Study of the Life Cycle of a Freshwater Strombidiid Ciliate. Aquat. Microb. Ecol. 2002, 29, 189–197. [CrossRef]
- Stoecker, D.K.; Johnson, M.D.; de Vargas, C.; Not, F. Acquired Phototrophy in Aquatic Protists. Aquat. Microb. Ecol. 2009, 57, 279–310. [CrossRef]
- Schoener, D.; McManus, G. Plastid Retention, Use, and Replacement in a Kleptoplastidic Ciliate. Aquat. Microb. Ecol. 2012, 67, 177–187. [CrossRef]
- Müller, H.; Geller, W. Maximum Growth Rates of Aquatic Ciliated Protozoa: The Dependence on Body Size and Temperature Reconsidered. Arch. Hydrobiol. 1993, 126, 315–327. [CrossRef]
- Müller, H.; Weisse, T. Laboratory and Field Observations on the Scuticociliate Histiobalantium from the Pelagic Zone of Lake Constance, FRG. J. Plankton Res. 1994, 16, 391–401. [CrossRef]
- Macek, M.; Šimek, K.; Bittl, T. Conspicuous Peak of Oligotrichous Ciliates Following Winter Stratification in a Bog Lake. J. Plankton Res. 2001, 23, 353–363. [CrossRef]
- Chen, W.-L.; Chiang, K.-P.; Tsai, S.-F. Neglect of Presence of Bacteria Leads to Inaccurate Growth Parameters of the Oligotrich Ciliate Strombidium Sp. During Grazing Experiments on Nanoflagellates. Front. Mar. Sci. 2020, 7, 569309. [CrossRef]
Figure 1.
Three weeks-interval values, and the annual- and stratification-mean of biological variables in the Slapy Reservoir (the mean points are drawn on the last period-day, either at the end of the year or the end of stratification). (a) Bacteria abundance (10⁶ cells/mL); (b) HNF abundance (10³ cells/mL); (c) Rhodomonas spp. abundance (10³ cells/mL); (d) Chlorophyll a (Chl a) concentration (μg/L).
Figure 1.
Three weeks-interval values, and the annual- and stratification-mean of biological variables in the Slapy Reservoir (the mean points are drawn on the last period-day, either at the end of the year or the end of stratification). (a) Bacteria abundance (10⁶ cells/mL); (b) HNF abundance (10³ cells/mL); (c) Rhodomonas spp. abundance (10³ cells/mL); (d) Chlorophyll a (Chl a) concentration (μg/L).
Figure 2.
Three weeks-interval values, and the annual- and stratification-mean of (a) ciliate abundance and (b) ciliate organic carbon biomass (the mean-points are drawn on the last period-day, either at the end of the year or the end of stratification); (c) the proportion of ciliate biomass of feeding behaviour groups in the Slapy Reservoir.
Figure 3.
Median and interquartile range data during the periods A and B: (a), (b) Rhodomonas spp. abundance and heterotrophic nanoflagellates (HNF); (c), (d) Chlorophyll a concentration (left axes) and abundances of bacteria (right axes). Criteria of Straškrábová et al. [50] of Chl a >5 μg/L, <7 μg/L, and <10 μg/L for the spring phytoplankton peak, a clear water phase, and the end of summer phytoplankton peak, respectively, were applied.
Figure 4.
Median and interquartile range ciliate abundance (left axes) and organic carbon biomass (right axes) throughout the study: (a), (b) Untreated sampling data from periods A and B; Vertical lines define the interval of found transition sampling days between the mixing and stratification; (c), ( d) stratification starting day normalised samplings; Vertical lines defined the chosen transition sampling Julian day between the mixing and stratification.
Figure 5.
Ciliate carbon biomass plot vs. dissolved oxygen (DO) and temperature (T) during the stratification and rest of the season.
Figure 5.
Ciliate carbon biomass plot vs. dissolved oxygen (DO) and temperature (T) during the stratification and rest of the season.
Figure 6.
The median and interquartile range of heterotrophic nanoplankton filtering ciliate organic carbon biomass (μg/L) and that of mixotrophic ones throughout the study; vertical lines define the median of transition sampling between mixing and stratification.
Figure 6.
The median and interquartile range of heterotrophic nanoplankton filtering ciliate organic carbon biomass (μg/L) and that of mixotrophic ones throughout the study; vertical lines define the median of transition sampling between mixing and stratification.
Figure 7.
The median and interquartile range of a sum of picoplankton filtering ciliate organic carbon biomass throughout the study and that of halteriids with minute strobilidiids and solitary peritrichs. Vertical lines define the median of transi-tion sampling between mixing and stratification.
Figure 7.
The median and interquartile range of a sum of picoplankton filtering ciliate organic carbon biomass throughout the study and that of halteriids with minute strobilidiids and solitary peritrichs. Vertical lines define the median of transi-tion sampling between mixing and stratification.
Figure 8.
The median and interquartile range of a sum of algivores (not filtering) organic carbon biomass (μg/L) throughout the study and that of the genus Urotricha and B. planctonicum; vertical lines define the median of transition sampling between mixing and stratification.
Figure 8.
The median and interquartile range of a sum of algivores (not filtering) organic carbon biomass (μg/L) throughout the study and that of the genus Urotricha and B. planctonicum; vertical lines define the median of transition sampling between mixing and stratification.
Figure 9.
The median and interquartile range of a sum of raptorial ciliates and flagellate hunters’ organic carbon biomass (μg/L) throughout the study; a sum of genera Askenasia with Rhabdoaskenasia, and Mesodinium sp. Vertical lines define the median of transition sampling between mixing and stratification.
Figure 10.
Results of non-metric multidimensional scaling (NMDS) divided according to period (1994-2003 - circles, full line; and 2004-2017 - squares, hatched line). (a) based on explanatory variables (temperature, concentrations of dissolved oxygen, total phosphorus <40µm, DIN, chlorophyll a, and ciliate prey - bacteria abundances, HNF and Rhodomonas spp.); (b) ciliate functional groups (as carbon biomass).
Figure 11.
Median biomass of the analysed groups during periods A and B. (a), (b) Ciliates filtering picoplankton (bacterivorous and omnivorous) and nanoplankton (mainly photosynthetic and heterotrophic flagellates), which are heterotrophic and mixotrophic; (c), (d) Ciliates hunting for algae (algivores), Mesodinium sp. and other raptorial (mainly flagellate hunting) ciliates.
Figure 12.
The median and interquartile range of ciliate organic carbon biomass (μg/L) of sums of heterotrophic and mixotrophic species (with zoochlorellae or kleptoplasts) during periods A and B.
Figure 12.
The median and interquartile range of ciliate organic carbon biomass (μg/L) of sums of heterotrophic and mixotrophic species (with zoochlorellae or kleptoplasts) during periods A and B.
Table 1.
Feeding behaviour grouping of ciliates and their taxonomical position (for images of representative ciliates from the respective groups, see, Figures 3–6).
Table 1.
Feeding behaviour grouping of ciliates and their taxonomical position (for images of representative ciliates from the respective groups, see, Figures 3–6).
| Feeding behaviour | Family | Genus / species |
|---|---|---|
| Picoplankton filtering PF |
Halteriidae Claparède & Lachmann 1858 |
Halteria grandinella (Müller, 1773) Halteria — mixotrophic Pelagohalteria viridis (Fromentel, 1876) |
| Strobilidiidae Kahl in Doflein & Reichenow 1929 |
Rimostrombidium brachykinetum Krainer, 1995 Rimostrombidium humile (Penard, 1922) Rimostrombidium— mixotrophic |
|
| Vorticellidae Ehrenberg 1838 |
Vorticella — minute Vorticella — large Vorticella aqua-dulcis-complex Stokes, 1887 Vorticella mayeri Faure-Fremiet, 1920 |
|
| Zoothamniidae Sommer, 1951 | Pseudohaplocaulus sp. | |
| Astylozoidae Kahl 1935 |
Astylozoon sp. Hastatella sp. |
|
| Trichodinidae Claus 1874 | Trichodina cf. diaptomi Basson and Van As, 1991 | |
| Cinetochilidae Perty 1852 | Cinetochilum margaritaceum Perty, 1852 | |
| Cyclidiidae Ehrenberg 1838 | Cyclidium spp. | |
| other minute scuticociliates | ||
| Heterotrophic nanoplankton filtering HF |
Strobilidiidae Kahl in Doflein & Reichenow 1929 | Rimostrombidium lacustris (Foissner, Skogstad & Pratt, 1988) |
| Tintinnidiidae Kofoid & Campbell 1929 |
Tintinnidium spp. Tintinnopsis spp. Codonella cratera Leidy, 1887 |
|
| Mixotrophic nanoplankton filtering MF |
Pelagostrombidiidae Agatha 2004 |
Pelagostrombidium spp. Limnostrombidium spp. |
| Strobilidiidae Kahl in Doflein & Reichenow 1929 | Rimostrombidium velox (Faurè-Fremiet, 1924) | |
| Algae hunters AH |
Balanionidae Small & Lynn 1985 | Balanion planctonicum (Foissner, Oleksiv &Müller, 1990) |
| Urotrichidae Small & Lynn 1985 |
Urotricha ~10µm Urotricha globosa Schewiakoff, 1892 Urotricha furcata Schewiakoff, 1892 Urotricha pseudofurcata Krainer 1995 Urotricha pelagica Kahl, 1932 Urotricha castalia Muñoz, Tellez & Fernandez-Galiano, 1987 |
|
| Histiobalantiidae de Puytorac & Corliss in Corliss 1979 | Histiobalantium spp. | |
| Chilodonellidae Deroux 1970 |
Phascolodon vorticella Stein, 1859 Trithigmostoma sp. |
|
| Raptorial & Flagellate hunters RH |
Colepidae Ehrenberg 1838 | Coleps spp. |
| Actinobolinidae Kahl 1930 | Actinobolina spp. | |
| Enchelyidae Ehrenberg 1838 | Enchelys spp. | |
| Trachelophyllidae Kent 1882 | Lagynophrya spp. — heterotrophicLagynophrya spp. — nixotrophic | |
| Didiniidae Poche 1913 |
Monodinium spp. Monodinium spp. — large |
|
| Incertae sedis CON-threeP |
Askenasia chlorelligera Krainer & Foissner, 1990 Askenasia volvox (Penard 1922) Askenasia spp. — minute Askenasia spp. — large Rhabdoaskenasia minima Krainer & Foissner, 1990 |
|
| Incertae sedis SAL |
Mesodinium spp. Litonotus spp. — minute |
|
| Oversized biomass | Epistylididae Kahl 1933 | Epistylis spp. — pelagic, colonial |
| Stentoridae Carus 1863 | Stentor sp. | |
| Holophryidae Perty 1852 | Holophrya spp. — large | |
| Cyclotrichiidae Jankowski 1980 | Cyclotrichium sp. | |
| Lacrymariidae de Fromentel 1876 | Lacrymaria spp. | |
| Dileptidae Jankowski 1980 | Pelagodileptus spp. | |
Disclaimer/Publisher’s Note: The statements, opinions and data contained in all publications are solely those of the individual author(s) and contributor(s) and not of MDPI and/or the editor(s). MDPI and/or the editor(s) disclaim responsibility for any injury to people or property resulting from any ideas, methods, instructions or products referred to in the content. |
© 2024 by the authors. Licensee MDPI, Basel, Switzerland. This article is an open access article distributed under the terms and conditions of the Creative Commons Attribution (CC BY) license (http://creativecommons.org/licenses/by/4.0/).
Copyright: This open access article is published under a Creative Commons CC BY 4.0 license, which permit the free download, distribution, and reuse, provided that the author and preprint are cited in any reuse.
Effects of Eutrophication on Plankton Abundance and Composition in the Gulf of Gabès (Mediterranean Sea, Tunisia)
Neila Annabi-Trabelsi
et al.
Water,
2022
Historical Zooplankton Composition Indicates Eutrophication Stages in a Neotropical Aquatic System: The Case of Lake Amatitlán, Central America
Sarahi Jaime
et al.
Diversity,
2021
The Horizontal Distribution of Siliceous Planktonic Radiolarian Community in the Eastern Indian Ocean
Sonia Munir
et al.
Water,
2020


MDPI Initiatives
Important Links
© 2024 MDPI (Basel, Switzerland) unless otherwise stated