Submitted:
21 May 2024
Posted:
22 May 2024
You are already at the latest version
Abstract
Keywords:
1. Introduction
2. Results
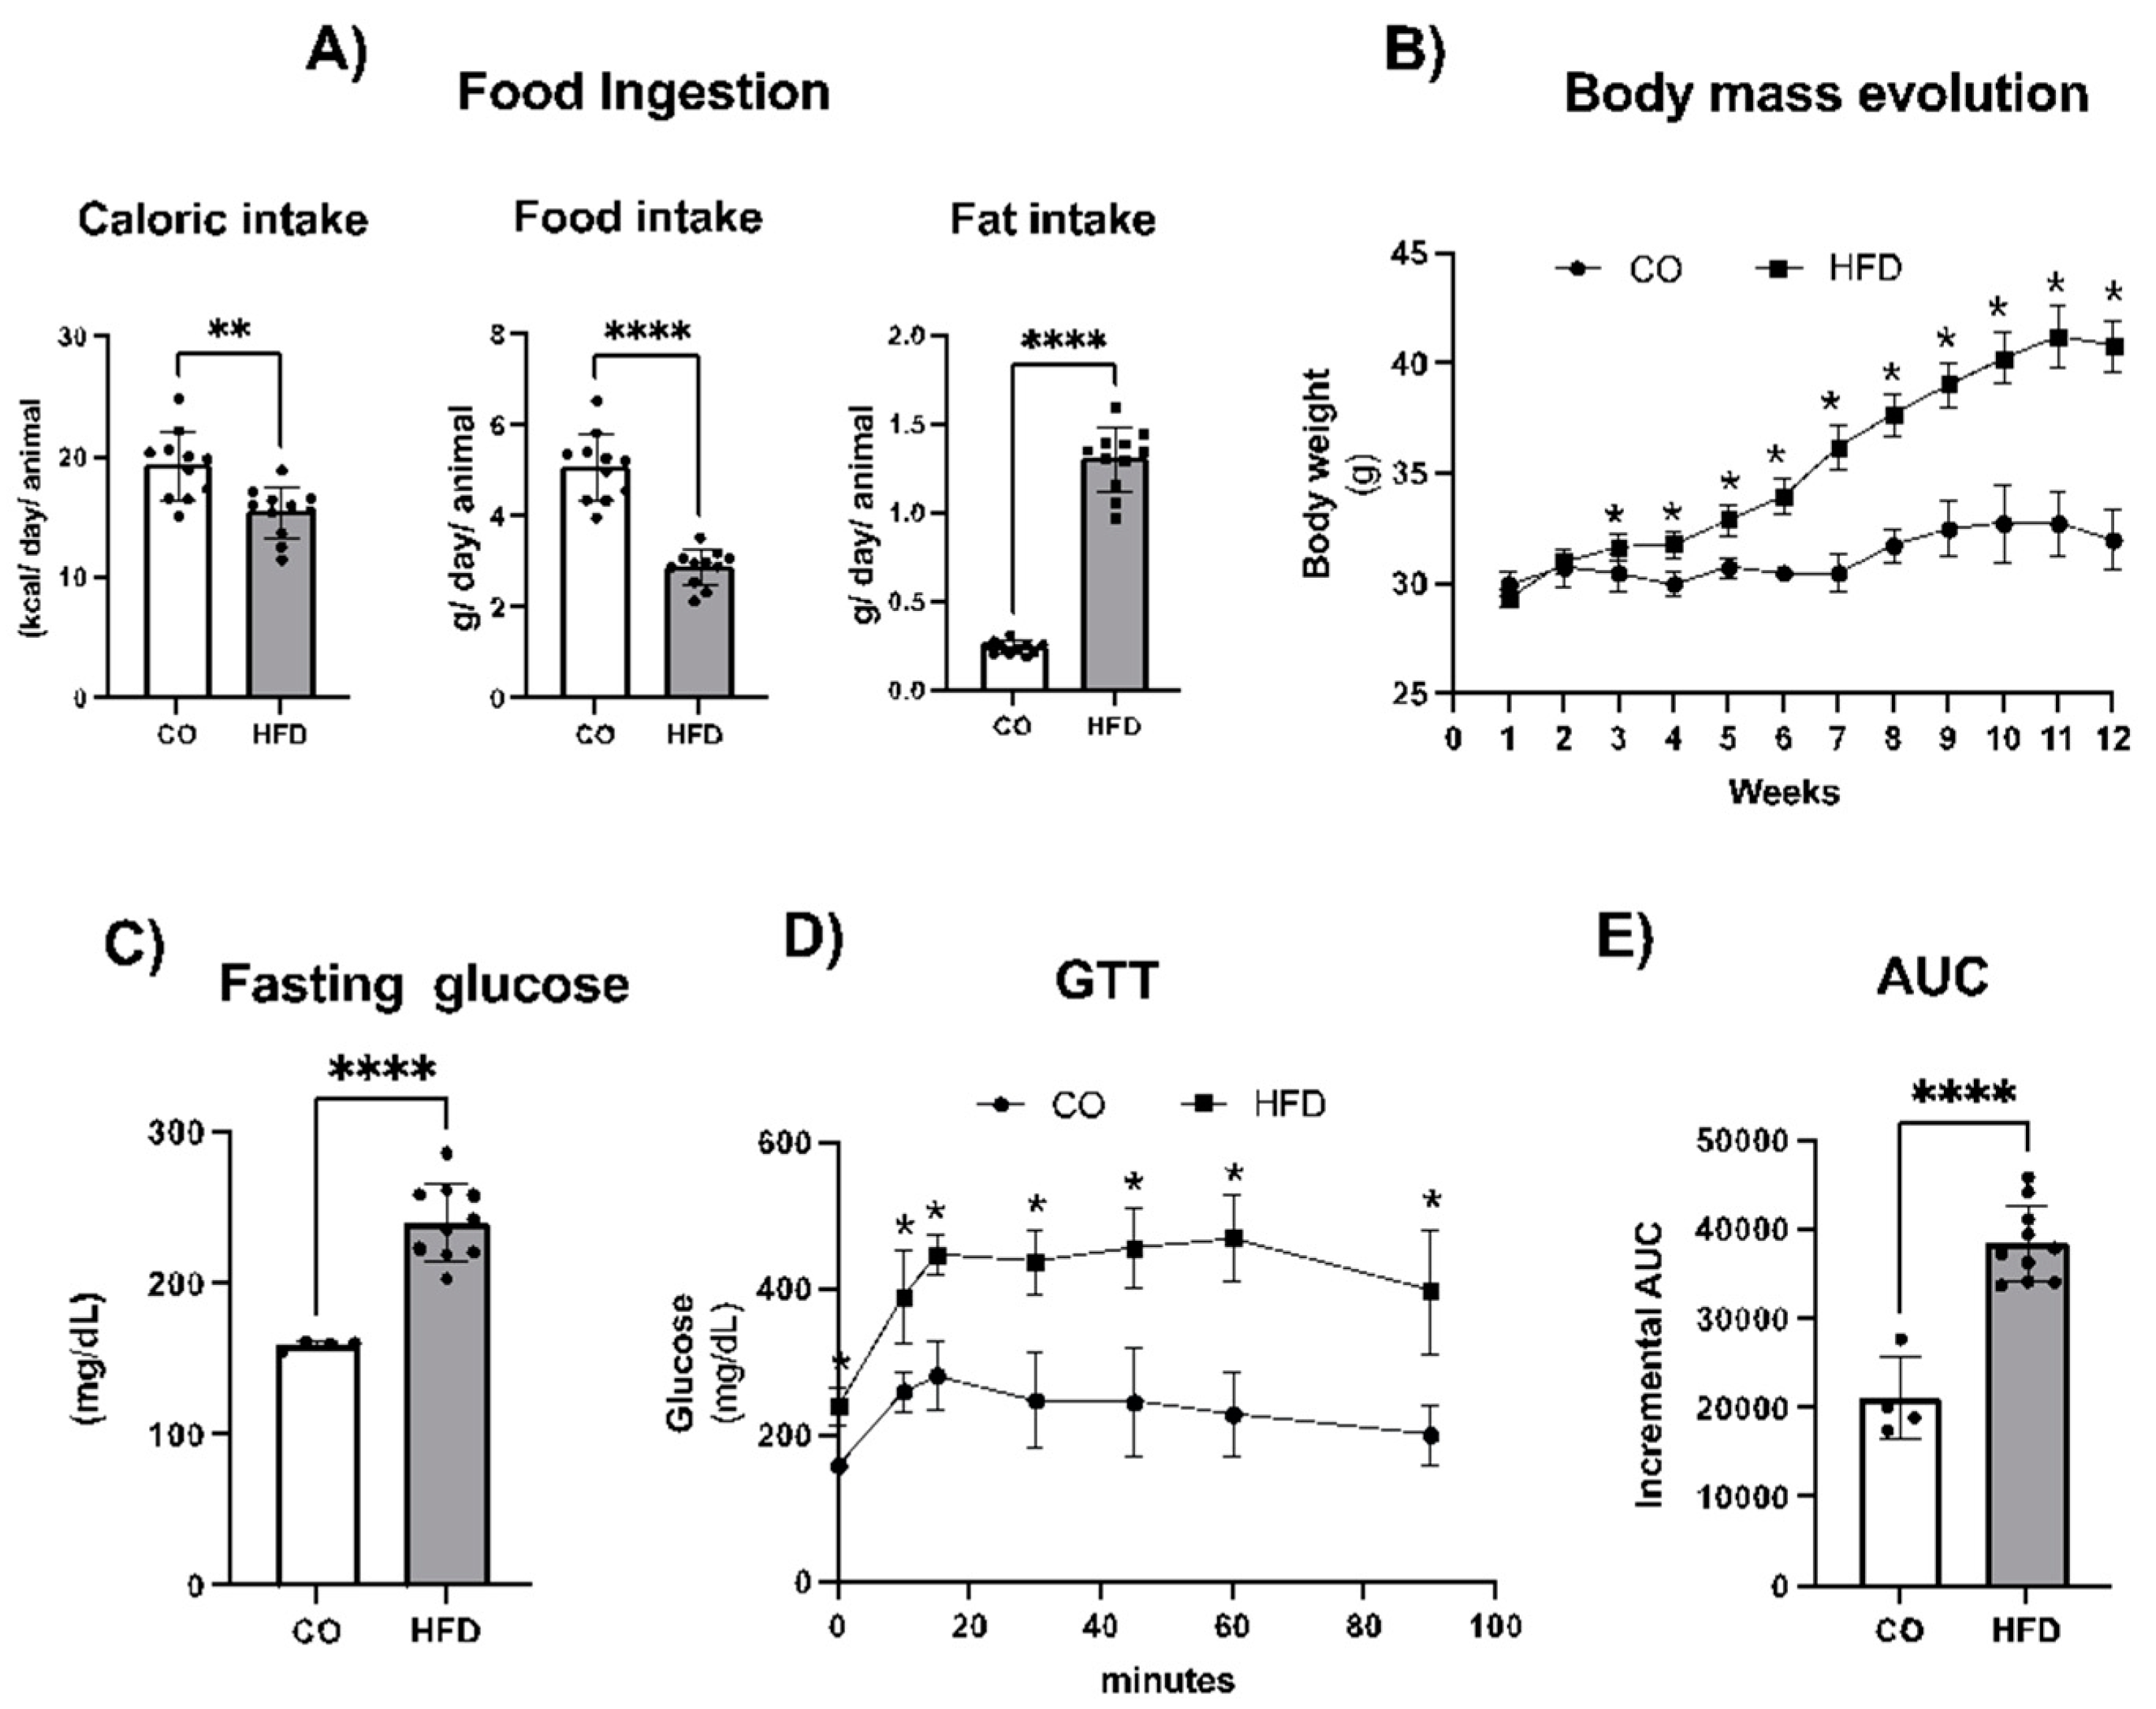
2.1. Obesity Model Characterization
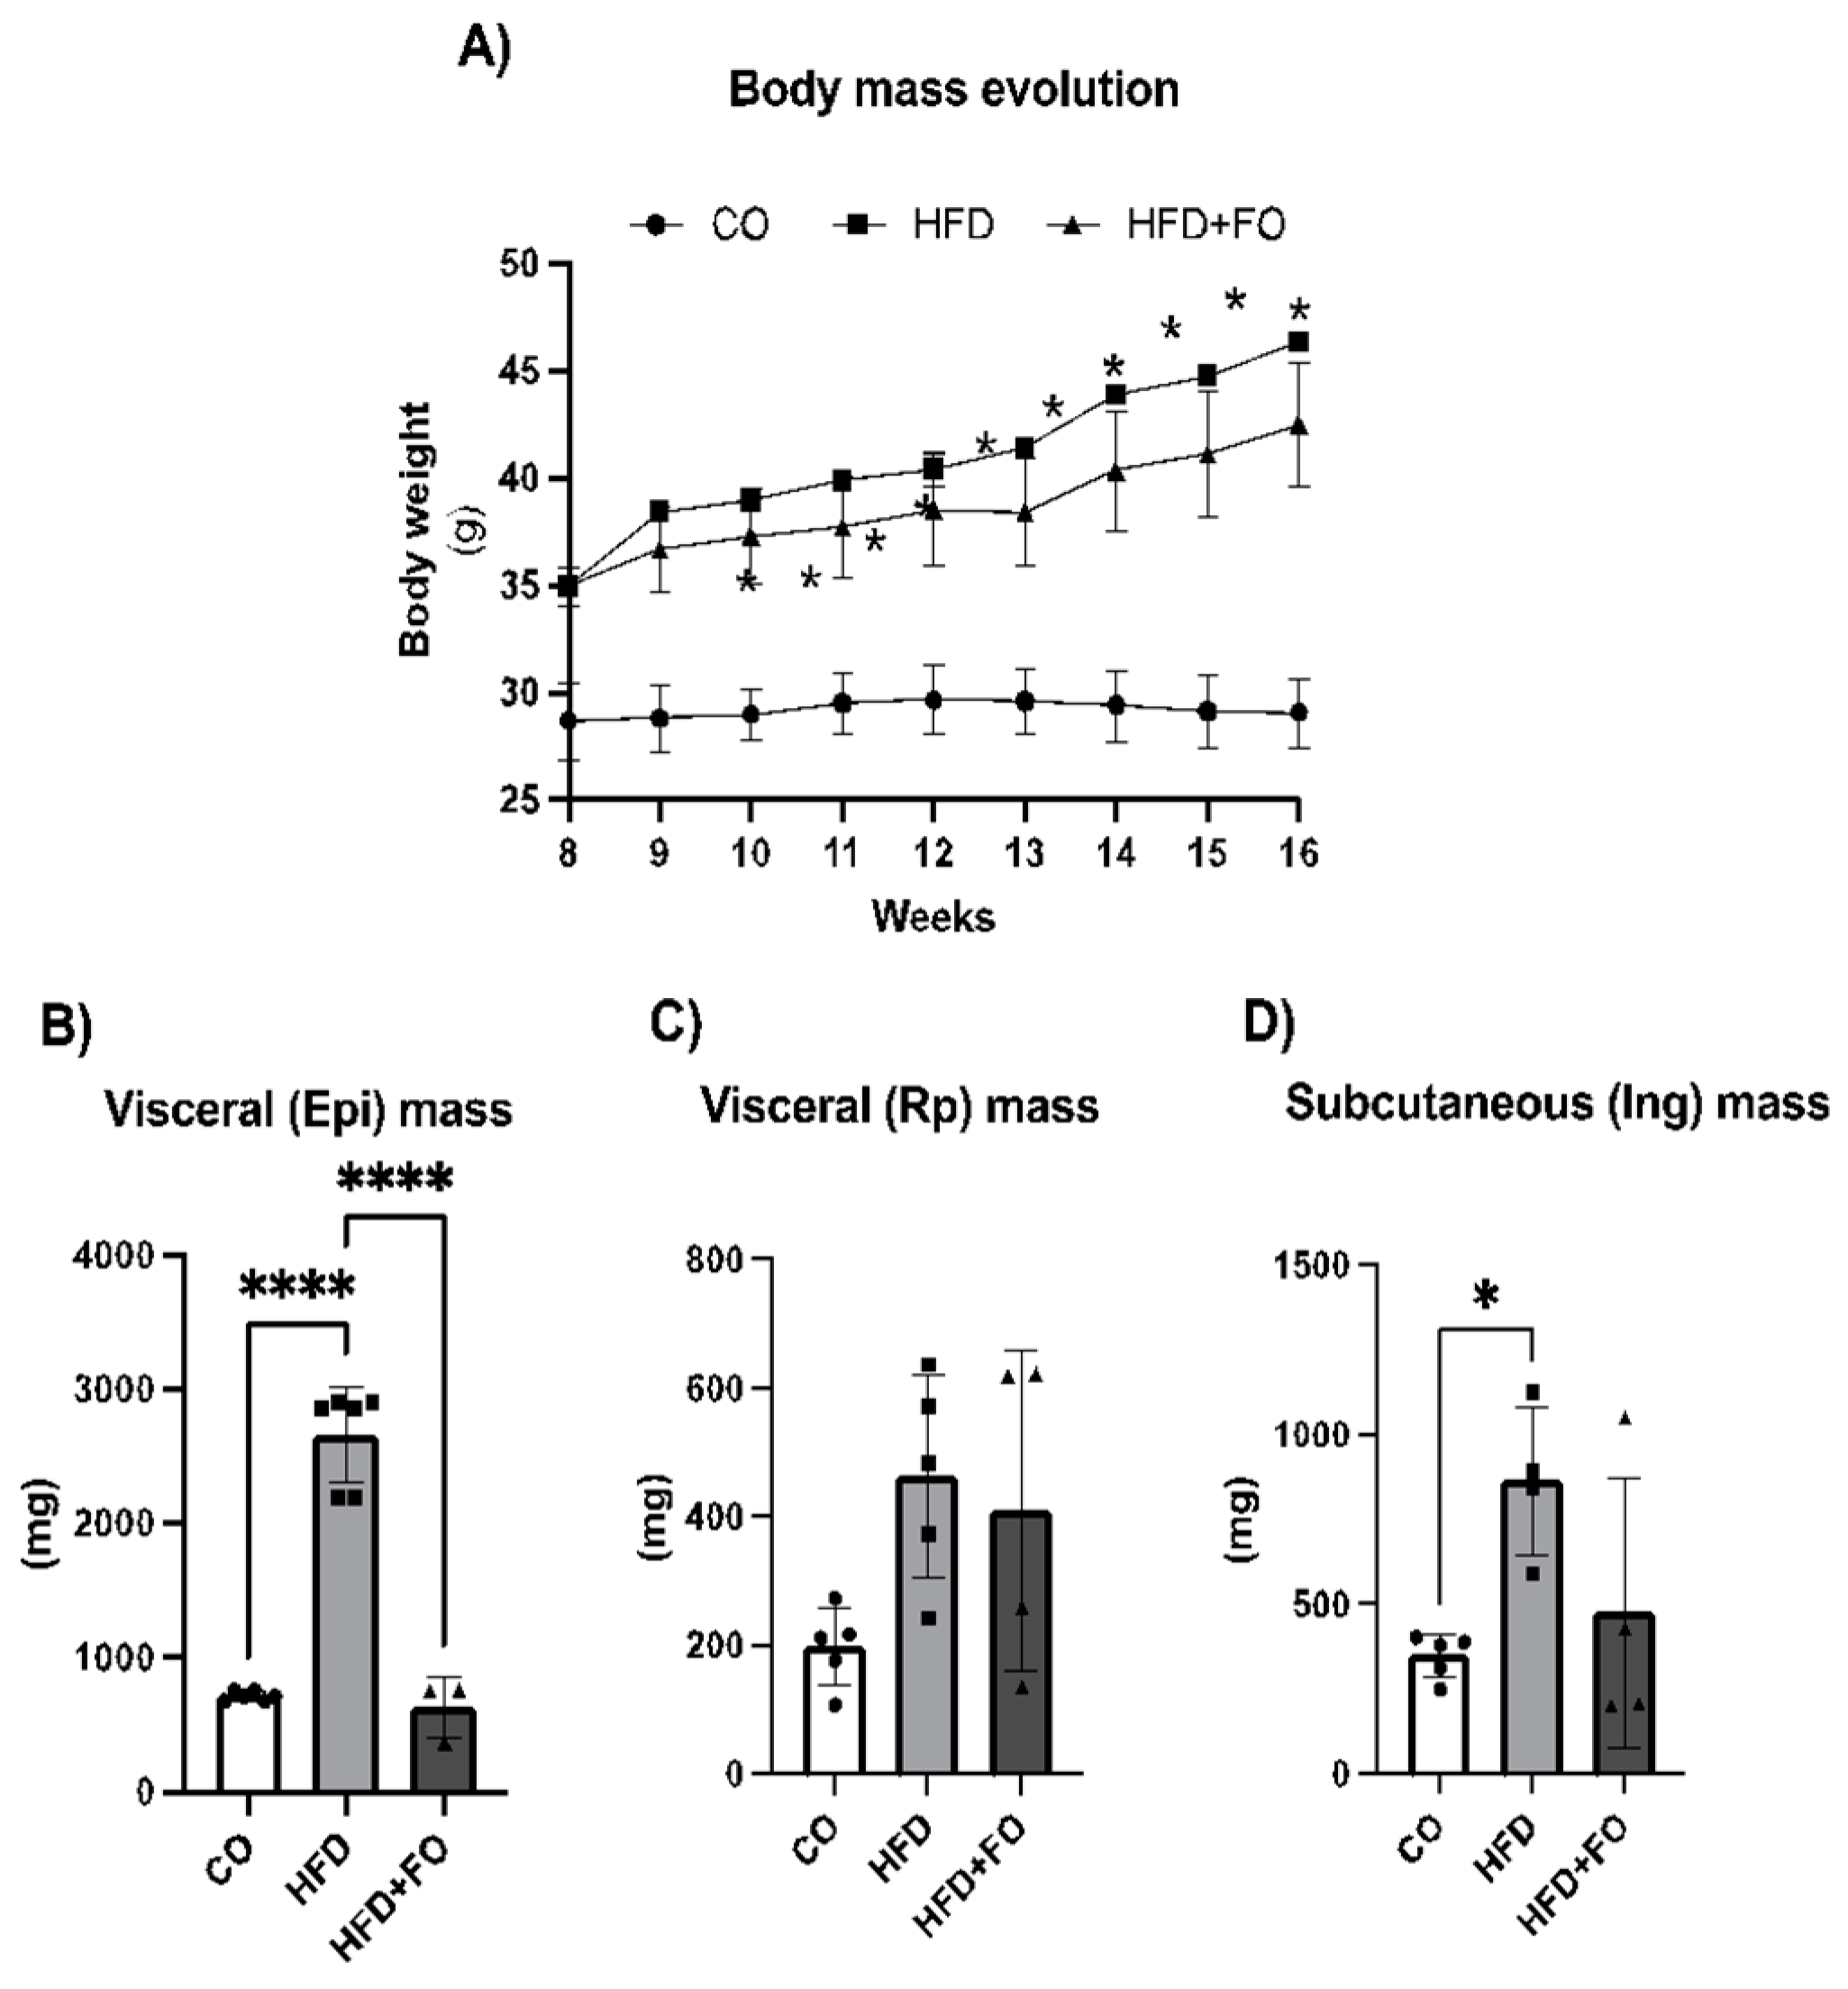
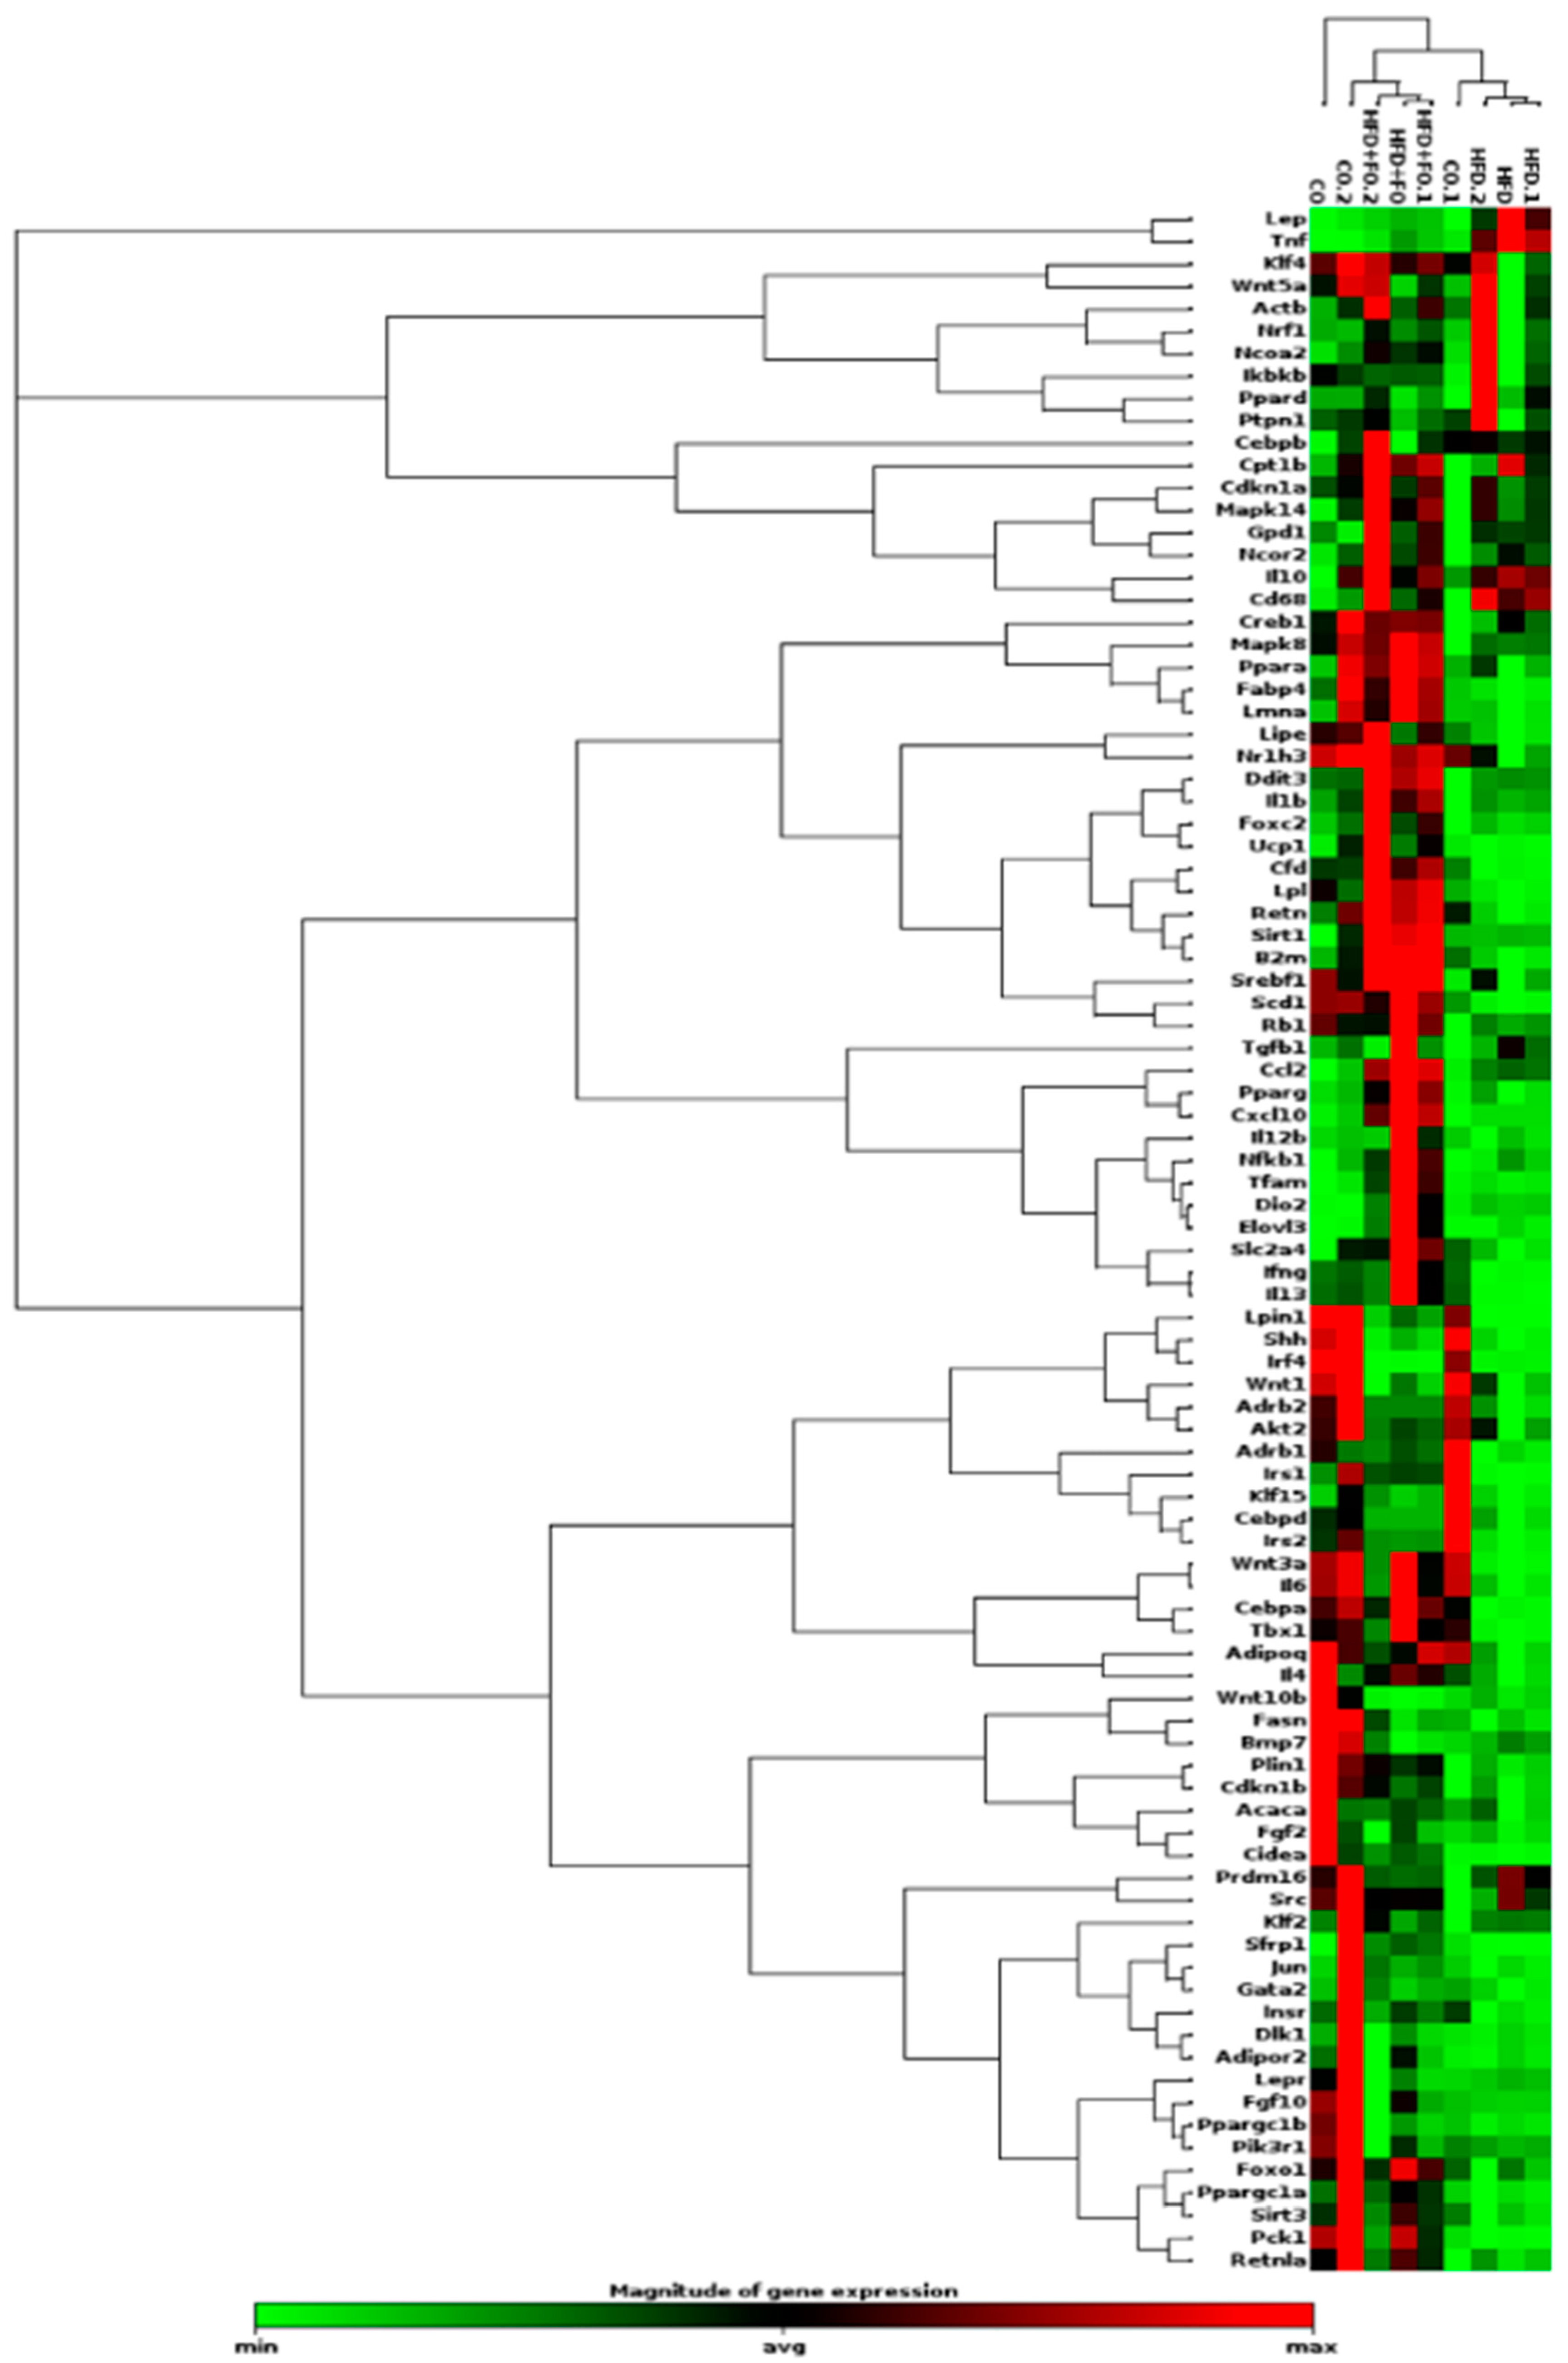
2.2. WAT depots Extracted from Mice Treated with CO, HFD, and HFD+FO Diets: Depot Mass and Gene Expression by PCR Array
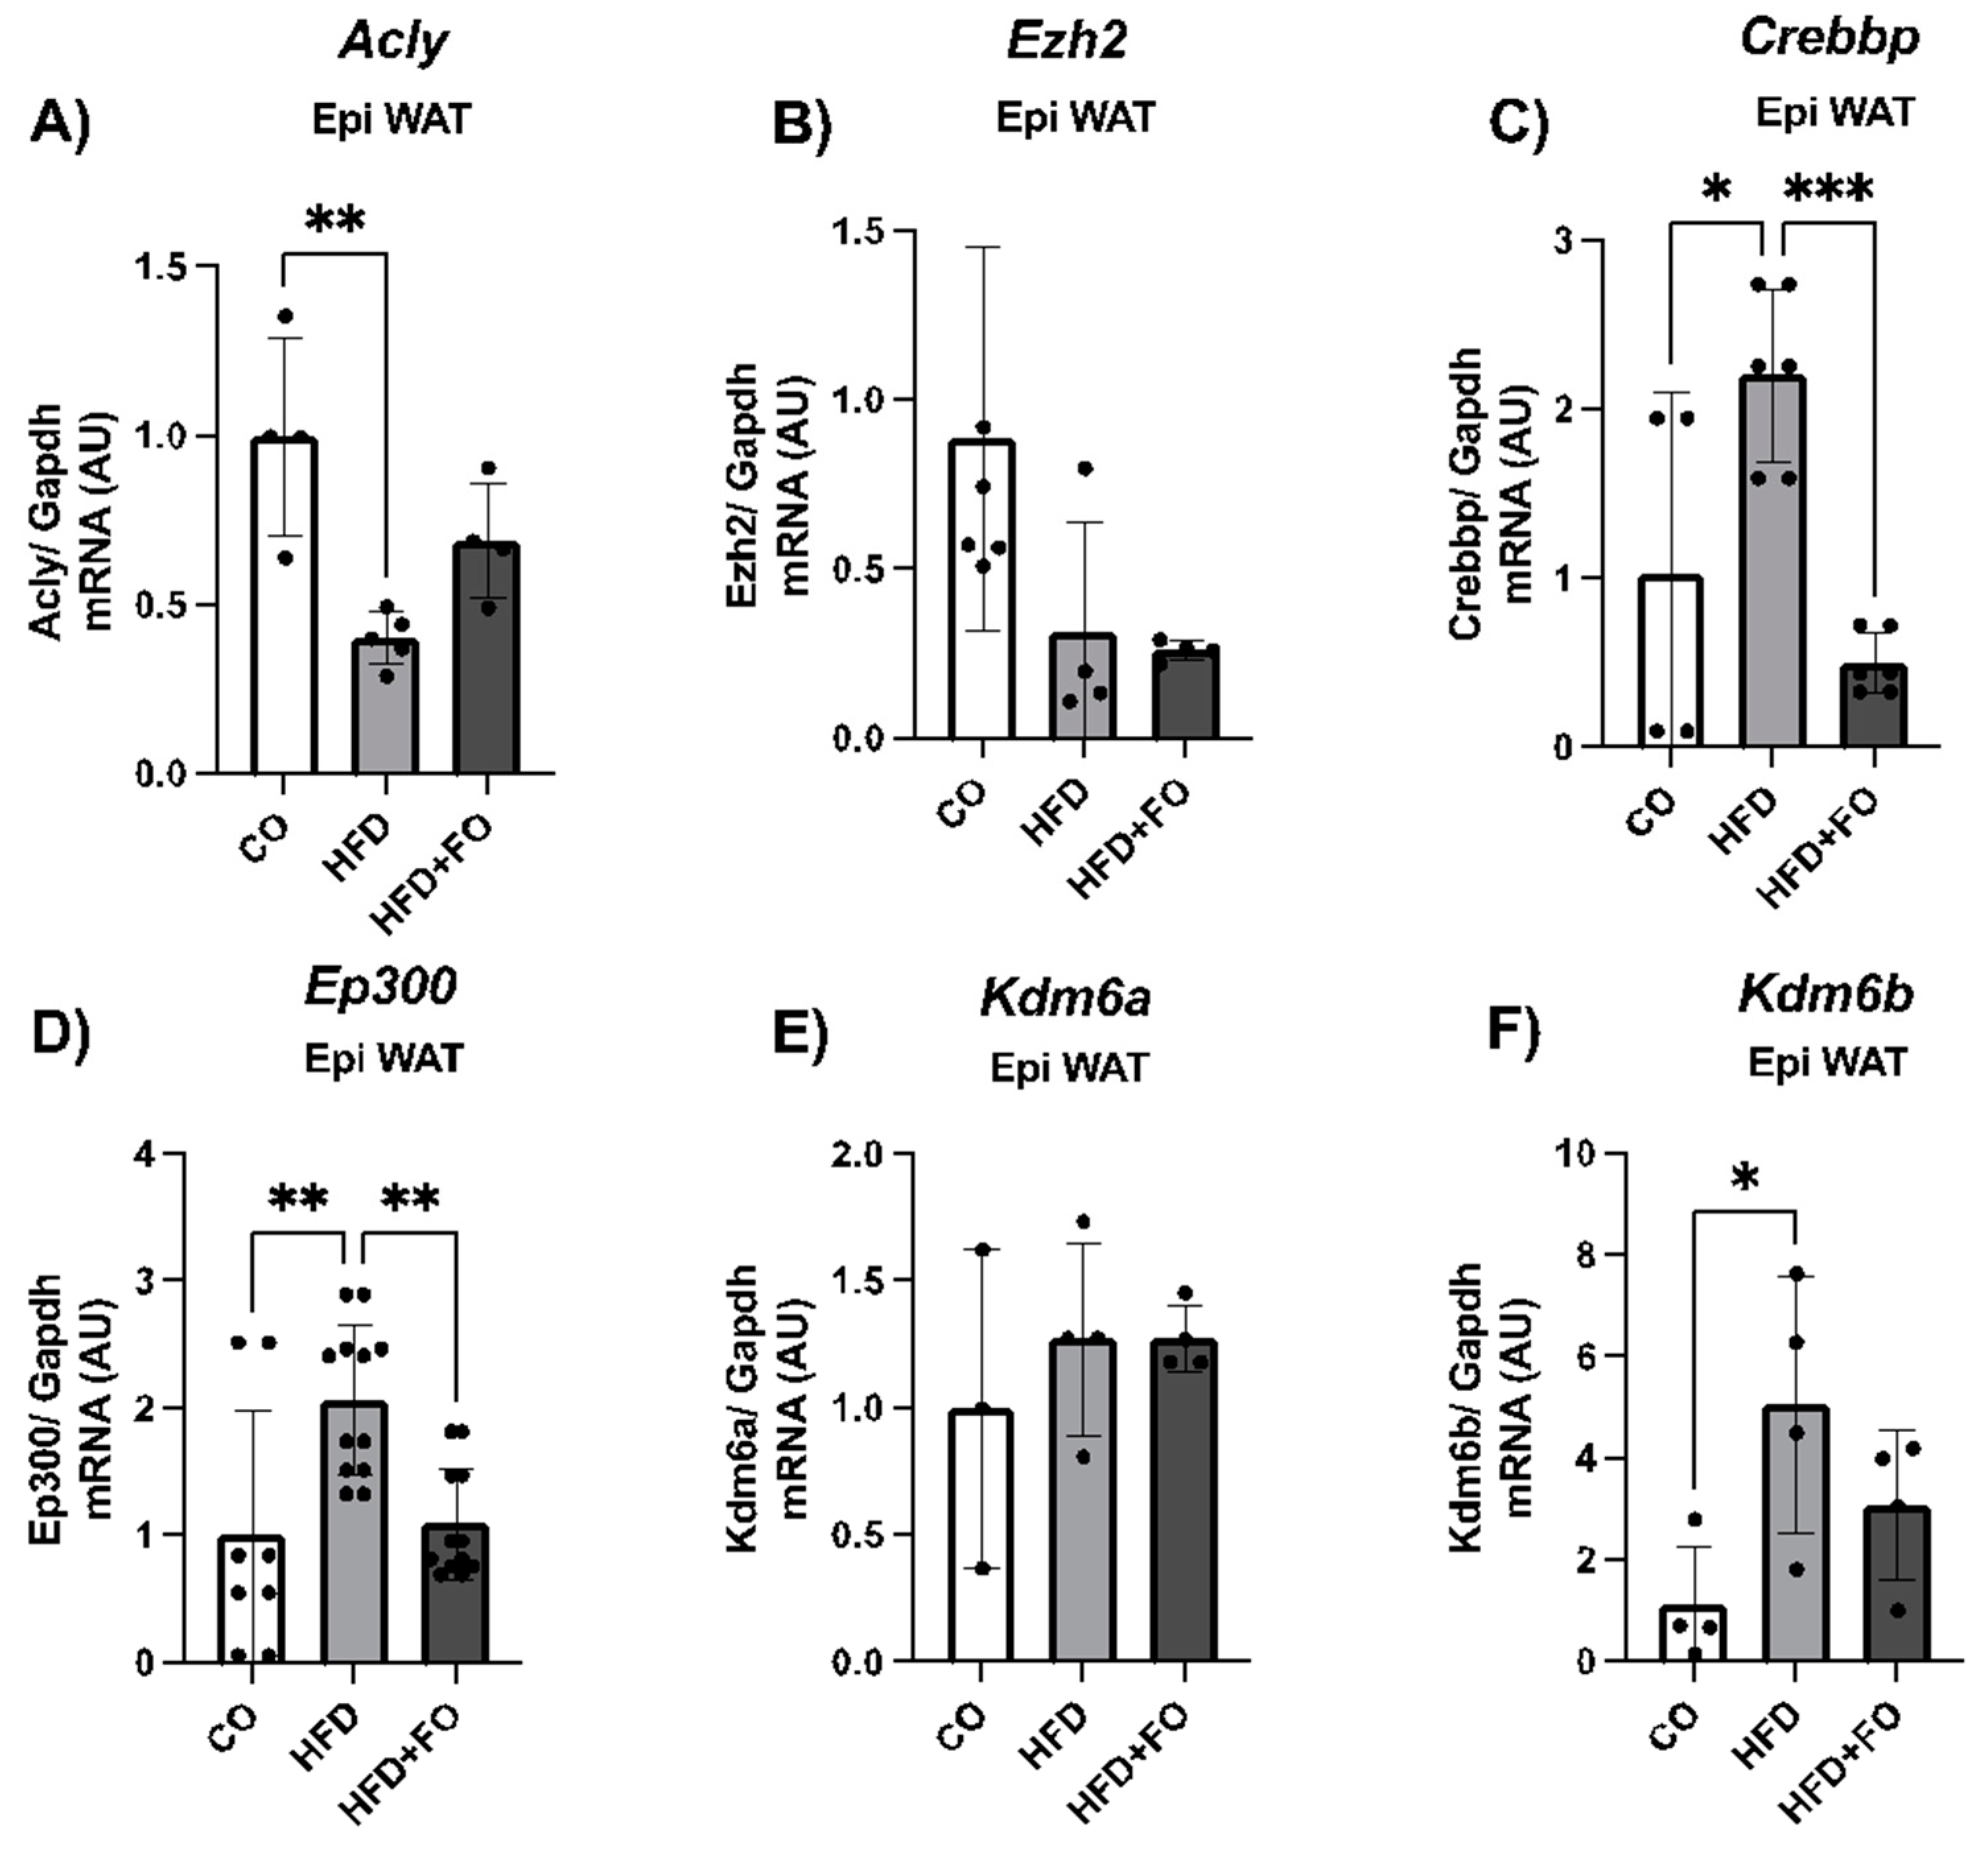
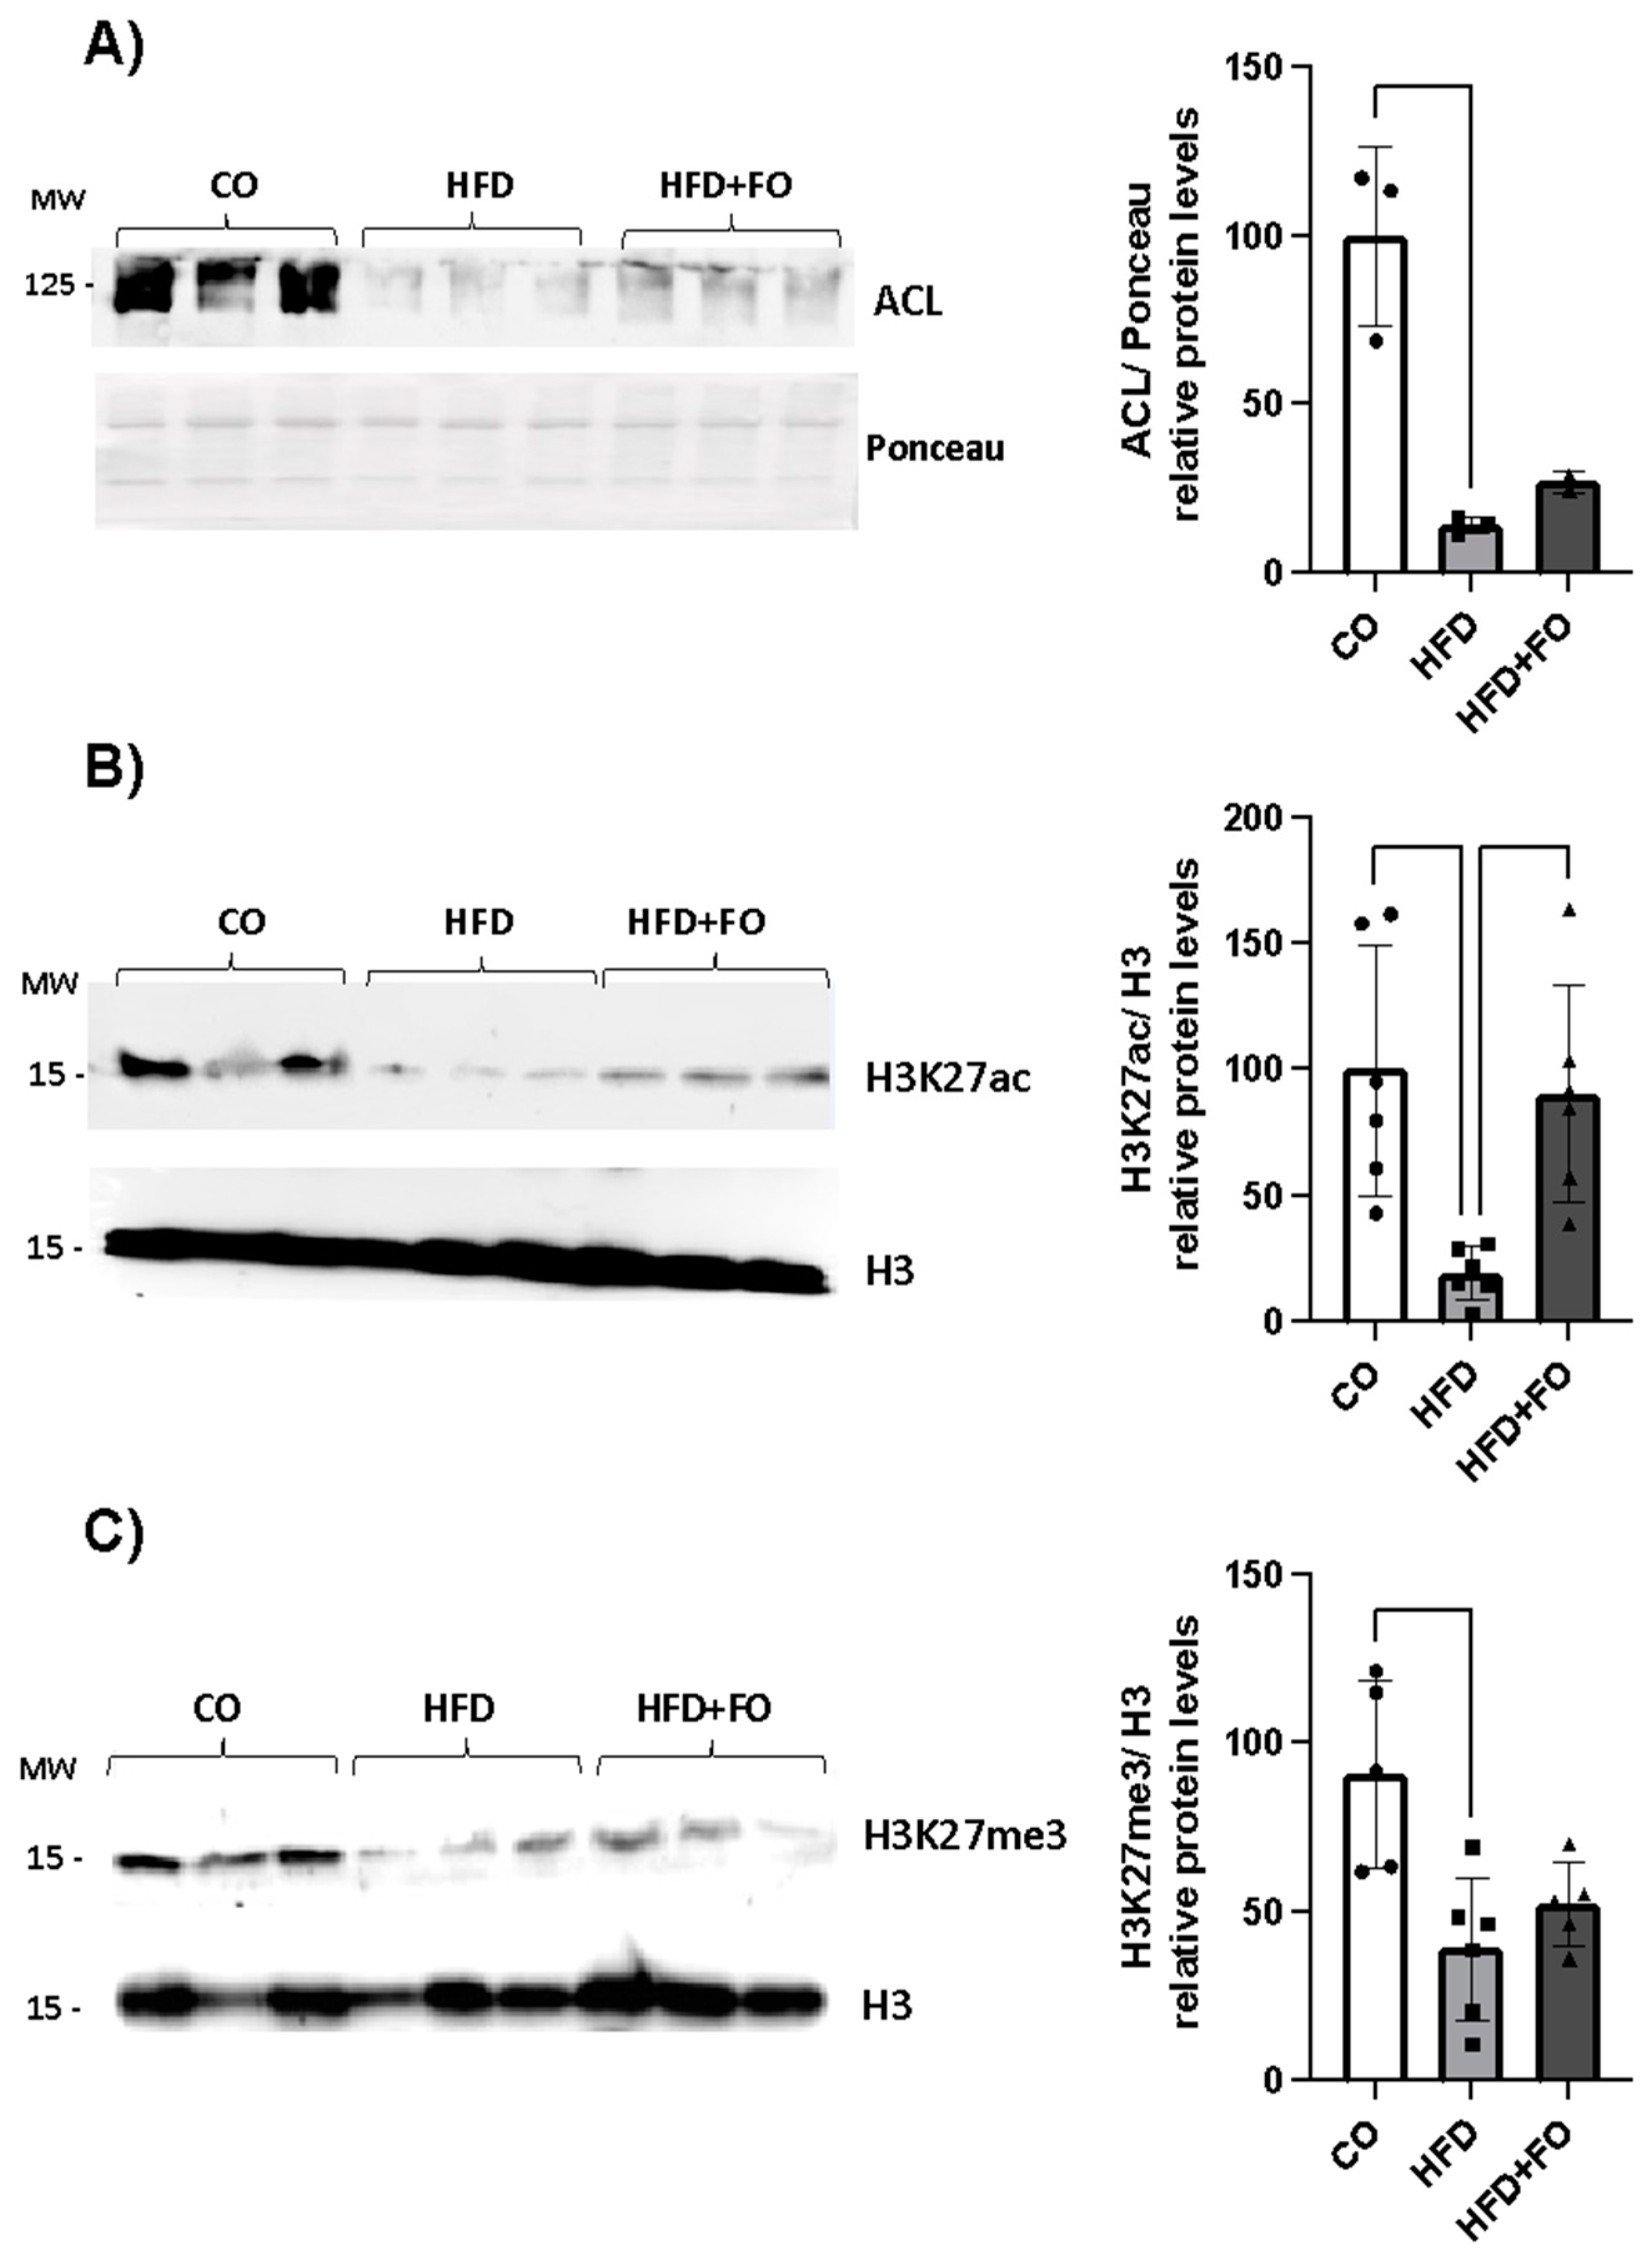
2.3. Expression of H3K27 Modifiers, H3k27ac, H3k27met3 and Acly/ACL in the Visceral Epi WAT from Mice
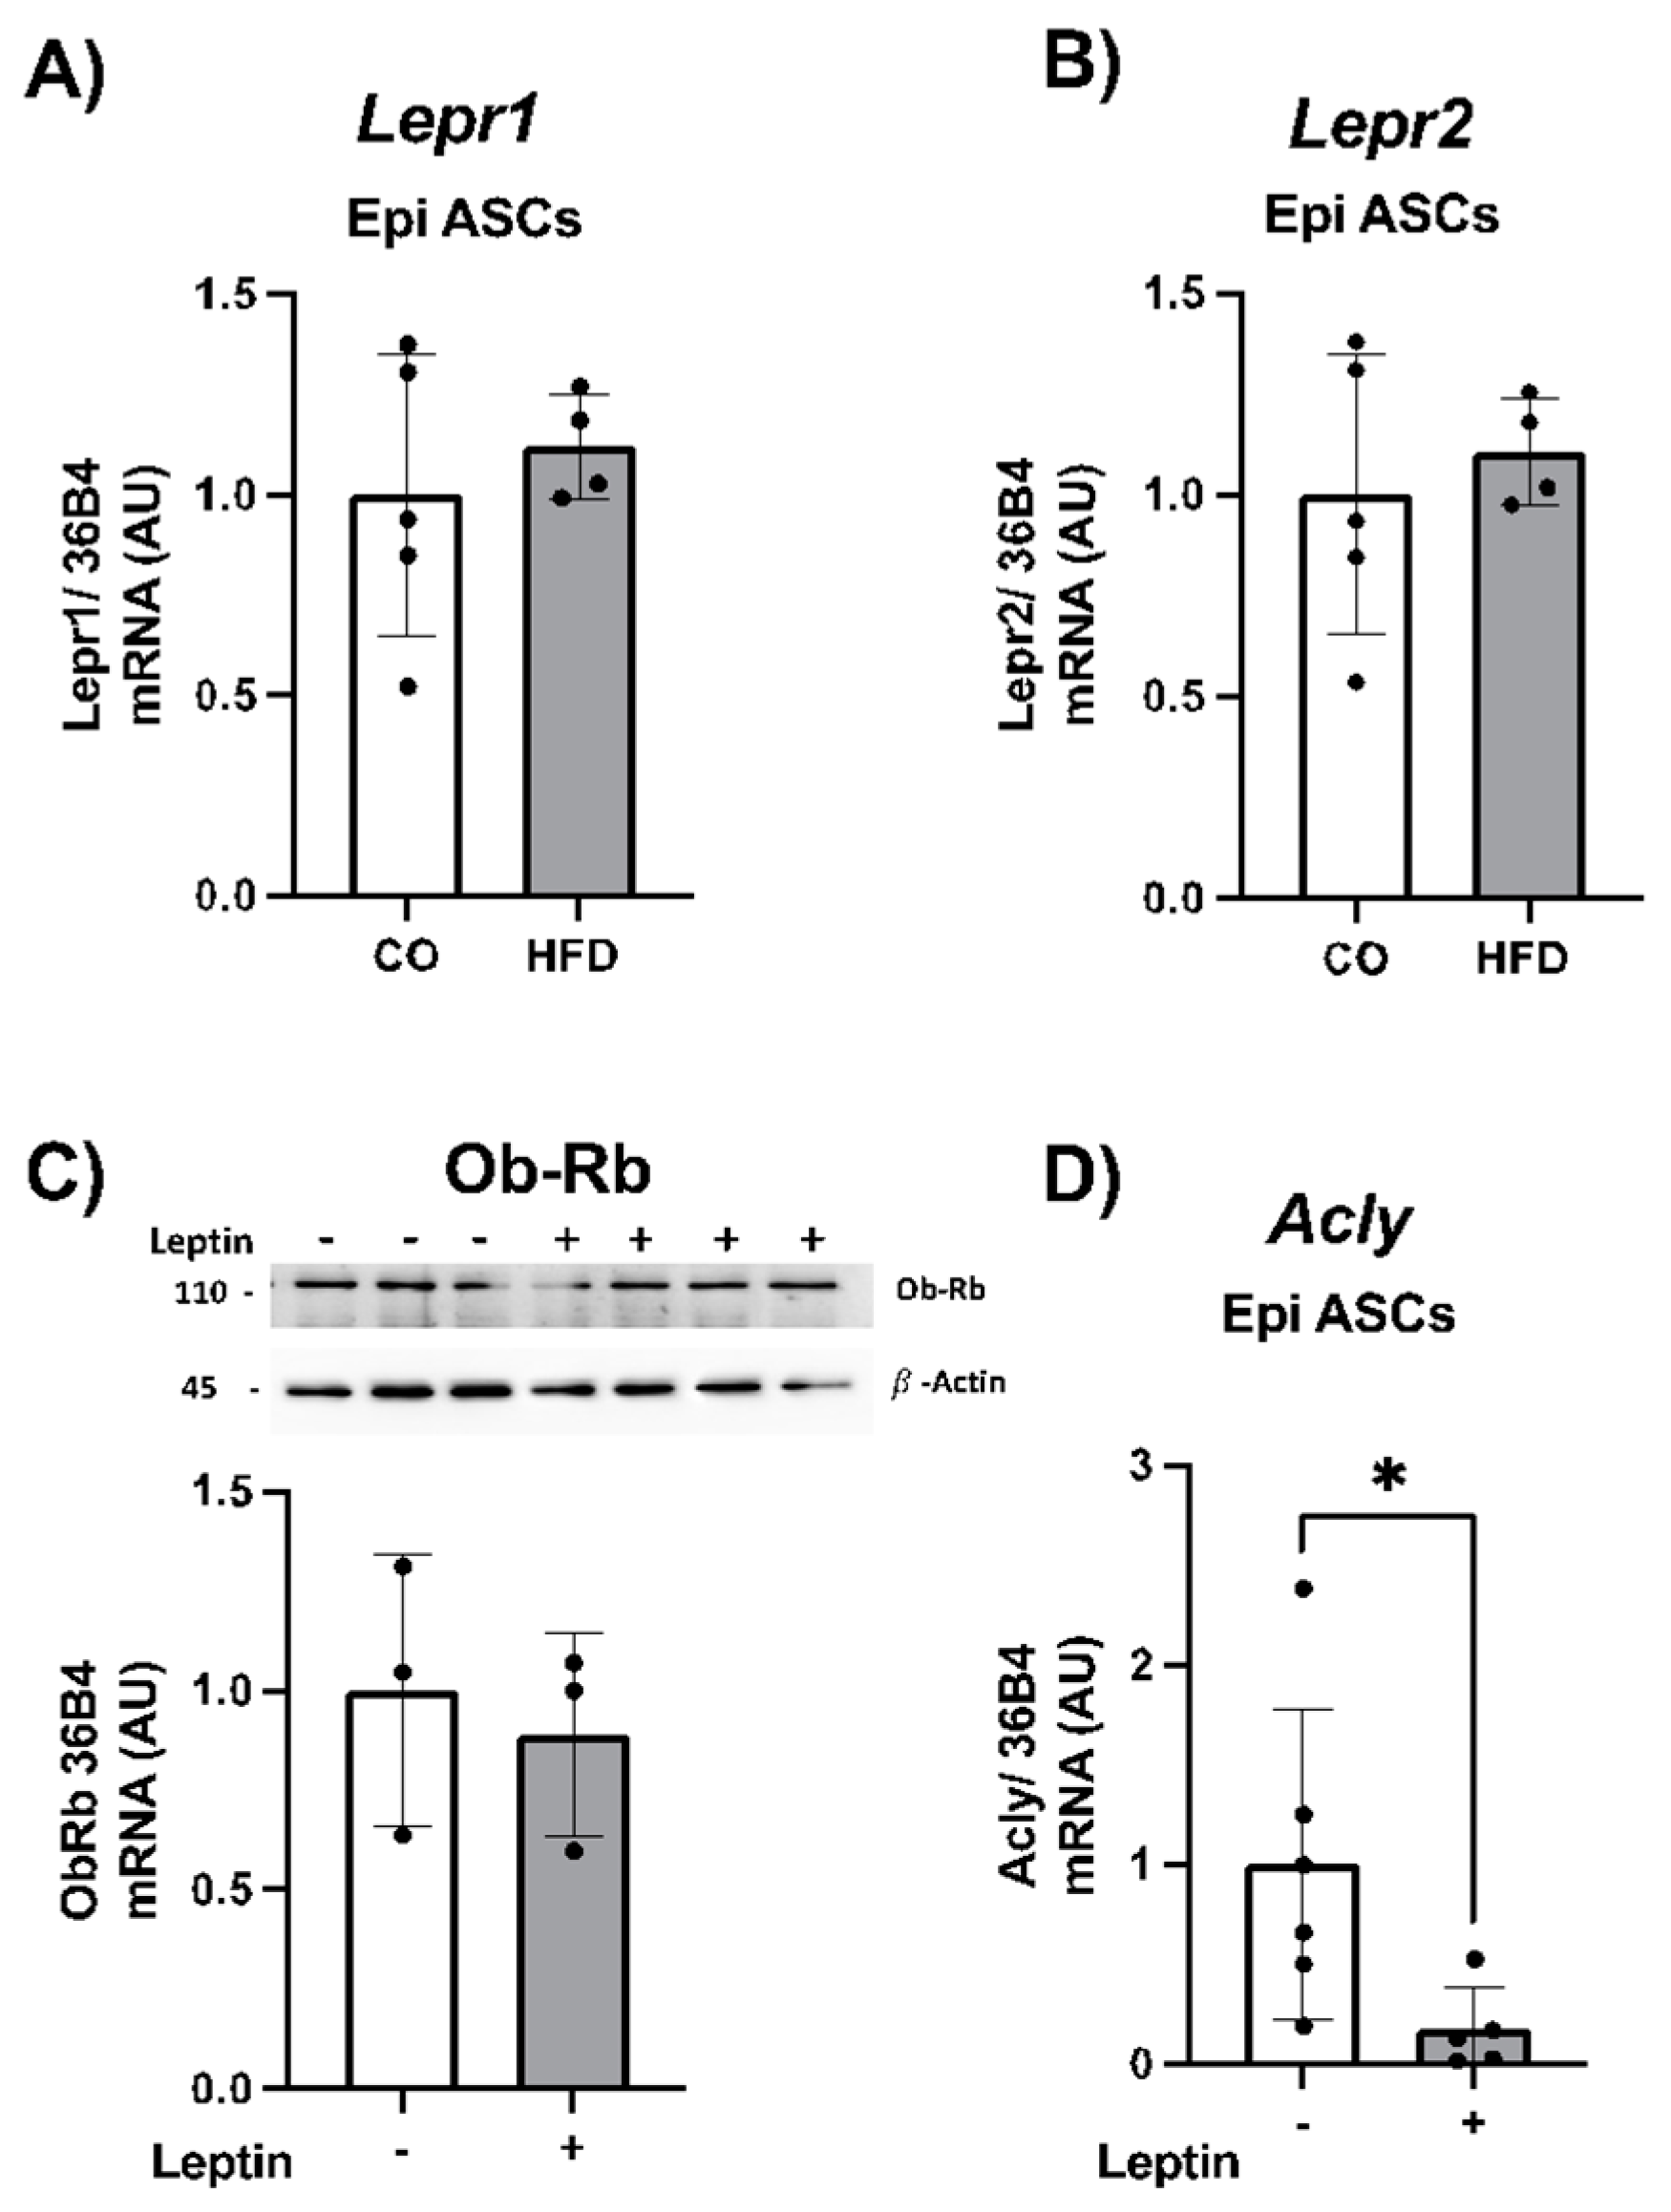
2.4. Gene Expression of Acly and Leptin Receptors in ASCs from Mice
3. Discussion
4. Materials and Methods
4.1. Animals, Fish Oil Supplementation and Experimental Procedure
4.2. Glucose Tolerance Test
4.3. WAT and SVF Isolation
4.4. Isolation of ASCs and Leptin Treatment
4.5. RNA Extraction and Quantitative Real-Time Polymerase Chain Reaction (qRT-PCR)
4.6. PCR Array Gene Expression Analysis
4.7. Western Blot
4.8. Statistical Analysis
5. Conclusions
Author Contributions
Funding
Institutional Review Board Statement
Informed Consent Statement
Data Availability Statement
Acknowledgments
Conflicts of Interest
References
- J. Li, H. Wu, Y. Liu, and L. Yang, “High fat diet induced obesity model using four strainsof mice: Kunming, C57BL/6, BALB/c and ICR,” Exp Anim, vol. 69, no. 3, pp. 326–335, 2020. [CrossRef]
- G. S. Hotamisligil, “Inflammation, metaflammation and immunometabolic disorders,” Nature, vol. 542, no. 7640, pp. 177–185, Feb. 2017. [CrossRef]
- M. Hawash et al., “Characterization and Investigation of Novel Benzodioxol Derivatives as Antidiabetic Agents: An In Vitro and In Vivo Study in an Animal Model,” Biomolecules, vol. 13, no. 10, Oct. 2023. [CrossRef]
- M. Hawash, N. Jaradat, N. A. Salhi, B. Shatreet, A. A. Asbah, and Y. H. Hawash, “Assessing the therapeutic potential and safety of traditional anti-obesity herbal blends in Palestine,” Sci Rep, vol. 14, no. 1, Dec. 2024. [CrossRef]
- Y. Su et al., “Effects of Fish Oil, Lipid Mediators, Derived from Docosahexaenoic Acid, and Their Co-Treatment against Lipid Metabolism Dysfunction and Inflammation in HFD Mice and HepG2 Cells,” Nutrients, vol. 15, no. 2, Jan. 2023. [CrossRef]
- B. Kapoor, D. Kapoor, S. Gautam, R. Singh, and S. Bhardwaj, “Dietary Polyunsaturated Fatty Acids (PUFAs): Uses and Potential Health Benefits,” Curr Nutr Rep, vol. 10, no. 3, pp. 232–242, Sep. 2021. [CrossRef]
- F. Shahidi and P. Ambigaipalan, “Omega-3 Polyunsaturated Fatty Acids and Their Health Benefits,” Annu Rev Food Sci Technol, vol. 9, pp. 345–381, Mar. 2018. [CrossRef]
- S. Yu et al., “Different ratios of DHA/EPA reverses insulin resistance by improving adipocyte dysfunction and lipid disorders in HFD-induced IR mice,” Food Funct, vol. 14, no. 2, pp. 1179–1197, Dec. 2023. [CrossRef]
- R. D. C. da C. de Sá et al., “Fish oil prevents changes induced by a high-fat diet on metabolism and adipokine secretion in mice subcutaneous and visceral adipocytes,” Journal of Physiology, vol. 594, no. 21, 2016. [CrossRef]
- R. D. C. da Cunha de Sá et al., “Fish oil reverses metabolic syndrome, adipocyte dysfunction, and altered adipokines secretion triggered by high-fat diet-induced obesity,” Physiol Rep, vol. 8, no. 4, Feb. 2020. [CrossRef]
- R. D. C. da Cunha de Sá et al., “Fish oil enriched in epa, but not in dha, reverses the metabolic syndrome and adipocyte dysfunction induced by a high-fat diet,” Nutrients, vol. 13, no. 3, pp. 1–18, Mar. 2021. [CrossRef]
- V. J. Antraco et al., “Omega-3 polyunsaturated fatty acids prevent nonalcoholic steatohepatitis (Nash) and stimulate adipogenesis,” Nutrients, vol. 13, no. 2, pp. 1–20, Feb. 2021. [CrossRef]
- K. Sun et al., “Dichotomous effects of VEGF-A on adipose tissue dysfunction,” Proc Natl Acad Sci U S A, vol. 109, no. 15, pp. 5874–5879, Apr. 2012. [CrossRef]
- G. R. Hajer, T. W. Van Haeften, and F. L. J. Visseren, “Adipose tissue dysfunction in obesity, diabetes, and vascular diseases,” European Heart Journal, vol. 29, no. 24. pp. 2959–2971, Dec. 2008. [CrossRef]
- T. S. Mikkelsen et al., “Comparative epigenomic analysis of murine and human adipogenesis,” Cell, vol. 143, no. 1, pp. 156–169, 2010. [CrossRef]
- R. Margueron and D. Reinberg, “The Polycomb complex PRC2 and its mark in life,” Nature, vol. 469, no. 7330, pp. 343–349, Jan. 2011. [CrossRef]
- V. V. Ogryzko, R. L. Schiltz, V. Russanova, B. H. Howard, and Y. Nakatani, “The transcriptional coactivators p300 and CBP are histone acetyltransferases,” Cell, vol. 87, no. 5, pp. 953–959, Nov. 1996. [CrossRef]
- S. H. Hong, Y. W. Cho, L. R. Yu, H. Yu, T. D. Veenstra, and K. Ge, “Identification of JmjC domain-containing UTX and JMJD3 as histone H3 lysine 27 demethylases,” Proc Natl Acad Sci U S A, vol. 104, no. 47, pp. 18439–18444, Nov. 2007. [CrossRef]
- H. Takahashi, J. M. McCaffery, R. A. Irizarry, and J. D. Boeke, “Nucleocytosolic acetyl-coenzyme a synthetase is required for histone acetylation and global transcription,” Mol Cell, vol. 23, no. 2, pp. 207–217, Jul. 2006. [CrossRef]
- A. A. Cluntun, H. Huang, L. Dai, X. Liu, Y. Zhao, and J. W. Locasale, “The rate of glycolysis quantitatively mediates specific histone acetylation sites,” Cancer Metab, vol. 3, no. 1, Dec. 2015. [CrossRef]
- K. E. Wellen, G. Hatzivassiliou, U. M. Sachdeva, T. V. Bui, J. R. Cross, and C. B. Thompson, “ATP-citrate lyase links cellular metabolism to histone acetylation,” Science, vol. 324, no. 5930, pp. 1076–1080, May 2009. [CrossRef]
- A. G. Evertts, B. M. Zee, P. A. Dimaggio, M. Gonzales-Cope, H. A. Coller, and B. A. Garcia, “Quantitative dynamics of the link between cellular metabolism and histone acetylation,” J Biol Chem, vol. 288, no. 17, pp. 12142–12151, Apr. 2013. [CrossRef]
- L. Galdieri, T. Zhang, D. Rogerson, R. Lleshi, and A. Vancura, “Protein acetylation and acetyl coenzyme a metabolism in budding yeast,” Eukaryot Cell, vol. 13, no. 12, pp. 1472–1483, Dec. 2014. [CrossRef]
- A. Carrer et al., “Impact of a High-fat Diet on Tissue Acyl-CoA and Histone Acetylation Levels,” J Biol Chem, vol. 292, no. 8, pp. 3312–3322, Feb. 2017. [CrossRef]
- L. Jiang et al., “Leptin contributes to the adaptive responses of mice to high-fat diet intake through suppressing the lipogenic pathway,” PLoS One, vol. 4, no. 9, Sep. 2009. [CrossRef]
- H. Fukuda, A. Katsurada, and N. Iritani, “Nutritional and hormonal regulation of mRNA levels of lipogenic enzymes in primary cultures of rat hepatocytes,” J Biochem, vol. 111, no. 1, pp. 25–30, 1992. [CrossRef]
- H. M. Jin et al., “MicroRNA-155 as a proinflammatory regulator via SHIP-1 down-regulation in acute gouty arthritis,” Arthritis Res Ther, vol. 16, no. 2, Apr. 2014. [CrossRef]
- M. Peng, N. Yin, S. Chhangawala, K. Xu, C. S. Leslie, and M. O. Li, “Aerobic glycolysis promotes T helper 1 cell differentiation through an epigenetic mechanism,” Science, vol. 354, no. 6311, pp. 481–484, Oct. 2016. [CrossRef]
- J. V. Lee et al., “Akt-dependent metabolic reprogramming regulates tumor cell histone acetylation,” Cell Metab, vol. 20, no. 2, pp. 306–319, Aug. 2014. [CrossRef]
- M. Amatruda, G. Ippolito, S. Vizzuso, G. Vizzari, G. Banderali, and E. Verduci, “Epigenetic Effects of n-3 LCPUFAs: A Role in Pediatric Metabolic Syndrome,” Int J Mol Sci, vol. 20, no. 9, May 2019. [CrossRef]
- P. T. Georgel and P. Georgel, “Where Epigenetics Meets Food Intake: Their Interaction in the Development/Severity of Gout and Therapeutic Perspectives,” Front Immunol, vol. 12, Sep. 2021. [CrossRef]
- A. Abbas et al., “Epigenetic Reprogramming Mediated by Maternal Diet Rich in Omega-3 Fatty Acids Protects From Breast Cancer Development in F1 Offspring,” Front Cell Dev Biol, vol. 9, Jun. 2021. [CrossRef]
- L. Galdieri and A. Vancura, “Acetyl-CoA carboxylase regulates global histone acetylation,” Journal of Biological Chemistry, vol. 287, no. 28, pp. 23865–23876, Jul. 2012. [CrossRef]
- G. Yu et al., “Adipogenic differentiation of adipose-derived stem cells,” Methods Mol Biol, vol. 702, pp. 193–200, 2011. [CrossRef]
- P. Patel and N. Abate, “Role of subcutaneous adipose tissue in the pathogenesis of insulin resistance,” J Obes, vol. 2013, 2013. [CrossRef]
- W. P. Cawthorn, E. L. Scheller, and O. A. MacDougald, “Adipose tissue stem cells meet preadipocyte commitment: going back to the future,” J Lipid Res, vol. 53, no. 2, pp. 227–246, Feb. 2012. [CrossRef]
- M. Ejarque et al., “Adipose tissue mitochondrial dysfunction in human obesity is linked to a specific DNA methylation signature in adipose-derived stem cells,” Int J Obes (Lond), vol. 43, no. 6, pp. 1256–1268, Jun. 2019. [CrossRef]
- L. M. Pérez et al., “Altered metabolic and stemness capacity of adipose tissue-derived stem cells from obese mouse and human,” PLoS One, vol. 10, no. 4, Apr. 2015. [CrossRef]
- G. Pachón-Peña et al., “Obesity Determines the Immunophenotypic Profile and Functional Characteristics of Human Mesenchymal Stem Cells From Adipose Tissue,” Stem Cells Transl Med, vol. 5, no. 4, pp. 464–475, Apr. 2016. [CrossRef]
- C. Serena et al., “Obesity and Type 2 Diabetes Alters the Immune Properties of Human Adipose Derived Stem Cells,” Stem Cells, vol. 34, no. 10, pp. 2559–2573, Oct. 2016. [CrossRef]
- A. B. Crujeiras et al., “Genome-wide DNA methylation pattern in visceral adipose tissue differentiates insulin-resistant from insulin-sensitive obese subjects,” Transl Res, vol. 178, pp. 13-24.e5, Dec. 2016. [CrossRef]
- M. Roldan, M. Macias-Gonzalez, R. Garcia, F. J. Tinahones, and M. Martin, “Obesity short-circuits stemness gene network in human adipose multipotent stem cells,” FASEB J, vol. 25, no. 12, pp. 4111–4126, Dec. 2011. [CrossRef]
- L. Palhinha et al., “Leptin Induces Proadipogenic and Proinflammatory Signaling in Adipocytes,” Front Endocrinol (Lausanne), vol. 10, Dec. 2019. [CrossRef]
- M. J. Crop, C. C. Baan, S. S. Korevaar, J. N. M. Ijzermans, W. Weimar, and M. J. Hoogduijn, “Human adipose tissue-derived mesenchymal stem cells induce explosive T-Cell proliferation,” Stem Cells Dev, vol. 19, no. 12, pp. 1843–1853, Dec. 2010. [CrossRef]
- V. S. da Silva et al., “High-fat diet decreases H3K27ac in mice adipose-derived stromal cells,” Obesity, vol. 30, no. 10, pp. 1995–2004, Oct. 2022. [CrossRef]
- &iartin Rodbell, “Metabolism of Isolated Fat Cells I. EE’li’ECTS OF HORMOXES OX GLUCOSE METABOLISM ASD LII’OLYSIS,” 1961. [Online]. Available: www.jbc.org.
- P. G. Reeves, K. L. Rossow, and J. Lindlauf, “Development and testing of the AIN-93 purified diets for rodents: results on growth, kidney calcification and bone mineralization in rats and mice,” J Nutr, vol. 123, no. 11, pp. 1923–1931, 1993. [CrossRef]
- F. M. Thomaz et al., “Ginkgo biloba Extract Stimulates Adipogenesis in 3T3-L1 Preadipocytes,” Pharmaceuticals (Basel), vol. 15, no. 10, Oct. 2022. [CrossRef]
| Gene | RefSeq Number | Fold Regulation | p-Value | Pathway related |
|---|---|---|---|---|
| Up- regulated | ||||
| Lep | NM_008493 | 25.48 | 0.046332 | Adipokines |
| Ncor2 | NM_001253904 | 3.08 | ns | Anti-Browning |
| Dio2 | NM_010050 | 3.98 | 0.000554 | Pro-Browning, fatty acid thermogenesis and oxidation |
| Elovl3 | NM_007703 | 2.63 | ns | Pro-Browning, fatty acid thermogenesis and oxidation |
| Ccl2 | NM_011333 | 5.07 | 0.009529 | Cytokines, growth factors and signal transduction |
| Il10 | NM_010548 | 2.08 | ns | Cytokines, growth factors and signal transduction |
| Tgfb1 | NM_011577 | 3.06 | ns | Cytokines, growth factors and signal transduction |
| Tnf | NM_013693 | 10.65 | 0.009005 | Cytokines, growth factors and signal transduction |
| Nfkb1 | NM_008689 | 2.52 | ns | Cytokines, growth factors and signal transduction |
| Cd68 | NM_009853 | 9.16 | 0.000279 | Cytokines, growth factors and signal transduction |
| Down- regulated | ||||
| Adipoq | NM_009605 | -2.82 | 0.010125 | Adipokines |
| Cfd | NM_013459 | -2.54 | 0.004805 | Adipokines |
| Retn | NM_001204959 | -3.30 | 0.016985 | Adipokines |
| Acaca | NM_133360 | -2.55 | ns | Lipases and lipogenic enzymes |
| Scd1 | NM_009127 | -2.90 | 0.042774 | Lipases and lipogenic enzymes |
| Lpin1 | NM_001130412 | -8.55 | 0.001238 | Lipases and lipogenic enzymes |
| Pck1 | NM_011044 | -5.98 | ns | Lipases and lipogenic enzymes |
| Fasn | NM_007988 | -3.87 | ns | Lipases and lipogenic enzymes |
| Cebpa | NM_007678 | -2.45 | 0.002073 | Pro- adipogenesis |
| Cebpd | NM_007679 | -3.64 | 0.041382 | Pro- adipogenesis |
| Fabp4 | NM_024406 | -2.01 | ns | Pro- adipogenesis |
| Fgf2 | NM_008006 | -2.37 | ns | Pro- adipogenesis |
| Fgf10 | NM_008002 | -2.71 | ns | Pro- adipogenesis |
| Jun | NM_010591 | -2.05 | ns | Pro- adipogenesis |
| Sfrp1 | NM_013834 | -2.98 | ns | Pro- adipogenesis |
| Klf15 | NM_023184 | -4.62 | ns | Pro- adipogenesis |
| Adrb2 | NM_007420 | -6.37 | 0.001464 | Anti- adipogenesis |
| Dlk1 | NM_001190703 | -2.36 | ns | Anti- adipogenesis |
| Foxo1 | NM_019739 | -2.26 | ns | Anti- adipogenesis |
| Shh | NM_009170 | -18.41 | 0.000001 | Anti- adipogenesis |
| Wnt1 | NM_021279 | -4.60 | 0.001147 | Anti- adipogenesis |
| Wnt3a | NM_009522 | -11.21 | 0.000001 | Anti- adipogenesis |
| Gata2 | NM_008090 | -2.32 | ns | Anti- adipogenesis |
| Bmp7 | NM_007557 | -2.06 | ns | Pro-Browning, fatty acid thermogenesis and oxidation |
| Ppargc1a | NR_027710 | -2.40 | ns | Pro-Browning, fatty acid thermogenesis and oxidation |
| Ppargc1b | NM_133249 | -2.29 | ns | Pro-Browning, fatty acid thermogenesis and oxidation |
| Sirt3 | NM_001127351 | -2.34 | ns | Pro-Browning, fatty acid thermogenesis and oxidation |
| Tbx1 | NM_011532 | -11.21 | 0.000001 | Pro-Browning, fatty acid thermogenesis and oxidation |
| Ucp1 | NM_009463 | -5.67 | ns | Pro-Browning, fatty acid thermogenesis and oxidation |
| Nr1h3 | NM_001177730 | -2.28 | 0.007073 | Anti-Browning |
| Wnt10b | NM_011718 | -2.50 | ns | Anti-Browning |
| Lepr | NM_001122899 | -2.30 | ns | Adipokines receptors |
| Adipor2 | NM_197985 | -3.03 | ns | Adipokines receptors |
| Adrb1 | NM_007419 | -2.73 | ns | Adipokines receptors |
| Ifng | NM_008337 | -11.06 | 0.000001 | Cytokines, growth factors and signal transduction |
| Il4 | NM_021283 | -2.20 | ns | Cytokines, growth factors and signal transduction |
| Il6 | NM_031168 | -10.93 | 0.000001 | Cytokines, growth factors and signal transduction |
| Il13 | NM_008355 | -11.21 | 0.000001 | Cytokines, growth factors and signal transduction |
| Insr | NM_010568 | -3.52 | ns | Cytokines, growth factors and signal transduction |
| Irs1 | NM_010570 | -4.26 | 0.043055 | Cytokines, growth factors and signal transduction |
| Irs2 | NM_001081212 | -4.61 | 0.017955 | Cytokines, growth factors and signal transduction |
| Pik3r1 | NM_001024955 | -2.33 | ns | Cytokines, growth factors and signal transduction |
| Irf4 | NM_013674 | -11.92 | 0.000978 | Cytokines, growth factors and signal transduction |
| Gene | 5’ Primer ( 5’-3’) -Sense | 3’ Primer (5’-3’) -Antisense |
|---|---|---|
| Gapdh | AAATGGTGAAGGTCGGTGTG | TGAAGGGGTCGTTGATGG |
| Ep300(p300) | GTTGCTATGGGAAACAGTTATGC | TGTAGTTTGAGGTTGGGAAGG |
| Ezh2 | CAGGATGAAGCAGACAGAAGAGG | TCGGGTTGCATCCACCACAAA |
| Kdm6a | GCTGGAACAGCTGGAAAGTC | GAGTCAACTGTTGGCCCATT |
| Kdm6b | CCTATTATGCTCCTGGGACA | TACGGCTTCCTCACTGTCGT |
| Crebbp (Cbp) | GACCGCTTTGTTTATACCTGC | TCTTATGGGTGTGGCTCTTTG |
| Acly | TCCGTCAAACAGCACTTCC | ATTTGGCTTCTTGGAGGTG |
| 36b4 (Rplp0) | TAAAGACTGGAGACAAGGTG | GTGTACTCAGTCTCCAC AGA |
| Lepr1 | CAGAATGACGCAGGGCTGTA | GCTCAAATGTTTCAGGCTTTTGG |
| Lepr2 | ATTAATGGTTTCACCAAAGATGCT | AAGATCTGTAAGTACTGTGGCAT |
| Pathways | Genes |
|---|---|
| Adipokines | Adipoq (Acrp30), Cfd (Adipisin), Lep (Leptin), Retn(Resistin) |
| Lipases and lipogenic enzymes | Acaca (Acc1), Gpd1(glycerol-3-phosphate dehydrogenase 1 (soluble), Lipe(HSL),Scd1 (stearoyl CoA desaturase), Lpl, Pnpla2 (Atgl), Lipin 1, Pck1 (phosphoenolpyruvate carboxykinase 1), Fasn |
| Pro- adipogenesis | Cebpa, Cebpb, Cebpd, Pparg (PPAR gamma 2), Srebf1, Fabp4(aP2), Pilin1, Fgf2 (bFGF), Fgf10, Jun (c-jun ou AP1), Lmna (Lamini A), Sfrp1(secreted frizzled-related protein1), Slc2a4 (Glut4), Klf15, Klf4 |
| Anti- adipogenesis | Adrb2, Cdkn1a (p21Cip1, Waf1), Cdkn1b (p27Kip1), Ddit3 (Gadd153, Chop), Dlk1(Pref1), Foxo1, Ncor2, Shh, Sirt1, Wnt1, Wnt3a, Gata2, Klf |
| Pro-Browning, fatty acid thermogenesis and oxidation | Bmp7, Cidea, Cpt1b, Creb1, Dio2, Elovl3, Foxc2, Mapk14 (p38alpha), Nrf1, Ppara, Ppard, Ppargc1a (Pgc1alpha), Ppargc1b (Perc, Pgc1beta), Prdm16, Sirt3, Src, Tbx1, Tfam, Ucp1, Wnt5a |
| Anti-Browning | Ncoa2, Nr1h3, Rb1, Wnt10b |
| Adipokines receptors | Lepr, Adipor2, Adrb1 |
| Cytokines, growth factors and signal transduction | Ccl2 (MCP1), Cxcl10, Ifng, Il1b, Il4, Il6, Il10, Il12b, Il13, Tgfb1, Tnf, Insr, Irs1, Irs2, Akt2, Ptpn1 (PTP1B), Ikbkb (IKKbeta), Mapk8 (JNK1), Nfkb1, Pik3r1 (p85alpha), Irf4, Retnla (Resistin like alpha, Fizz1), Cd68 |
Disclaimer/Publisher’s Note: The statements, opinions and data contained in all publications are solely those of the individual author(s) and contributor(s) and not of MDPI and/or the editor(s). MDPI and/or the editor(s) disclaim responsibility for any injury to people or property resulting from any ideas, methods, instructions or products referred to in the content. |
© 2024 by the authors. Licensee MDPI, Basel, Switzerland. This article is an open access article distributed under the terms and conditions of the Creative Commons Attribution (CC BY) license (http://creativecommons.org/licenses/by/4.0/).


