Introduction
One of the main challenges in electric vehicles is the enlargement of the autonomy of the batteries as well as the improvement of their performance and the increase of the lifetime [
1,
2]. Today, the principal source for electric vehicles is lithium batteries [
3,
4,
5,
6], either lithium-ion or lithium-polymer, although nickel-metal hydride batteries represent an alternative despite their lower performance [
7,
8]. High energy density provides Li-ion batteries with a high capacity, which derives in a long autonomy that reduces or enlarges with power requirements, as the battery capacity is affected by discharge rate [
9,
10,
11,
12]. The type of propulsion for electric vehicles adopts three main engine configurations: hybrid electric vehicle (HEV), plugged hybrid electric vehicle (PHEV), and fully electric vehicle (FEV) [
13,
14,
15], with the only difference in the autonomy, regarding the battery, which is maximum for the FEV and minimum for the HEV, with an intermediate value for the PHEV, closer to HEV than to EV. In present days, there is a large variety of lithium batteries for electric vehicles with different configurations and structures depending on the type and composition of electrodes and electrolytes that tend to provide the best performance possible [
16,
17,
18,
19,
20,
21,
22,
23,
24]; therefore, it is very complicated to characterize the performance of all lithium batteries. Besides, the performance of a battery depends on the discharge rate and time of use, which makes it more difficult to predict the behavior of the battery. These problems require running tests to characterize the performance of a battery to allow setting up critical parameters in the battery performance, like the current capacity to predict remaining charge and autonomy [
25,
26,
27]. The correct battery capacity determination with discharge rate allows an accurate capacity calculation and operation time. Autonomy is essential for applications where additional power is not easily obtained, as in electric vehicles [
28,
29,
30].
If we set up the maximum power and operating voltage, the battery capacity is automatically set up from Ohm’s law. This capacity, however, is not constant, as it depends on the discharge rate, which derives from the required power; therefore, if the electric vehicle engine demands a high-power the current extracted from the battery is high, thus the discharge rate, causing a reduction in the capacity of the battery and in the EV autonomy. Vice versa, when the power demand is low, the battery capacity increases, and the electric vehicle autonomy enlarges. An erroneous calculation in the capacity value may lead to a sudden energy supply interruption with the consequent non-expected stop; this may happen if the battery control system does not calculate capacity accurately, which is difficult in many situations [
31,
32,
33,
34,
35,
36].
Electric vehicles motorize with continuous or alternate current engines [
37,
38,
39]; in the first case, the current is driven directly from the battery to the engine, provided the battery and the engine voltage match; in the second case, we require a DC/AC converter to transform the DC from the battery into the AC required by the engine. In this latter case, the converter efficiency is relevant as the drained energy from the battery is not the same as the one supplied to the engine. Modern DC/AC converters currently operate at very high efficiency, 80% or higher, but we only achieve this value if the demanded power exceeds a certain percentage of the maximum conversion power [
40]; therefore, to extend the battery autonomy when using an AC electric vehicle engine, it is required to use the appropriate DC/AC converter to obtain the maximum efficiency at the operating power [
41]. In low-power engines, the energy saving when using a higher efficiency converter is modest, and many times, additional cost does not compensate for; however, in large-power engines like in electric vehicles, a low increase in the converter’s efficiency represents a high energy saving, thus a significant reduction in energy demand from the battery and an enlargement of its autonomy.
Theoretical Basis
Energy conversion in an AC/DC converter follows Ohm’s law according to the expression:
V is the voltage and I the current, with the sub-indexes DC and AC account for direct and alternate current, and ηCV represents the converter efficiency.
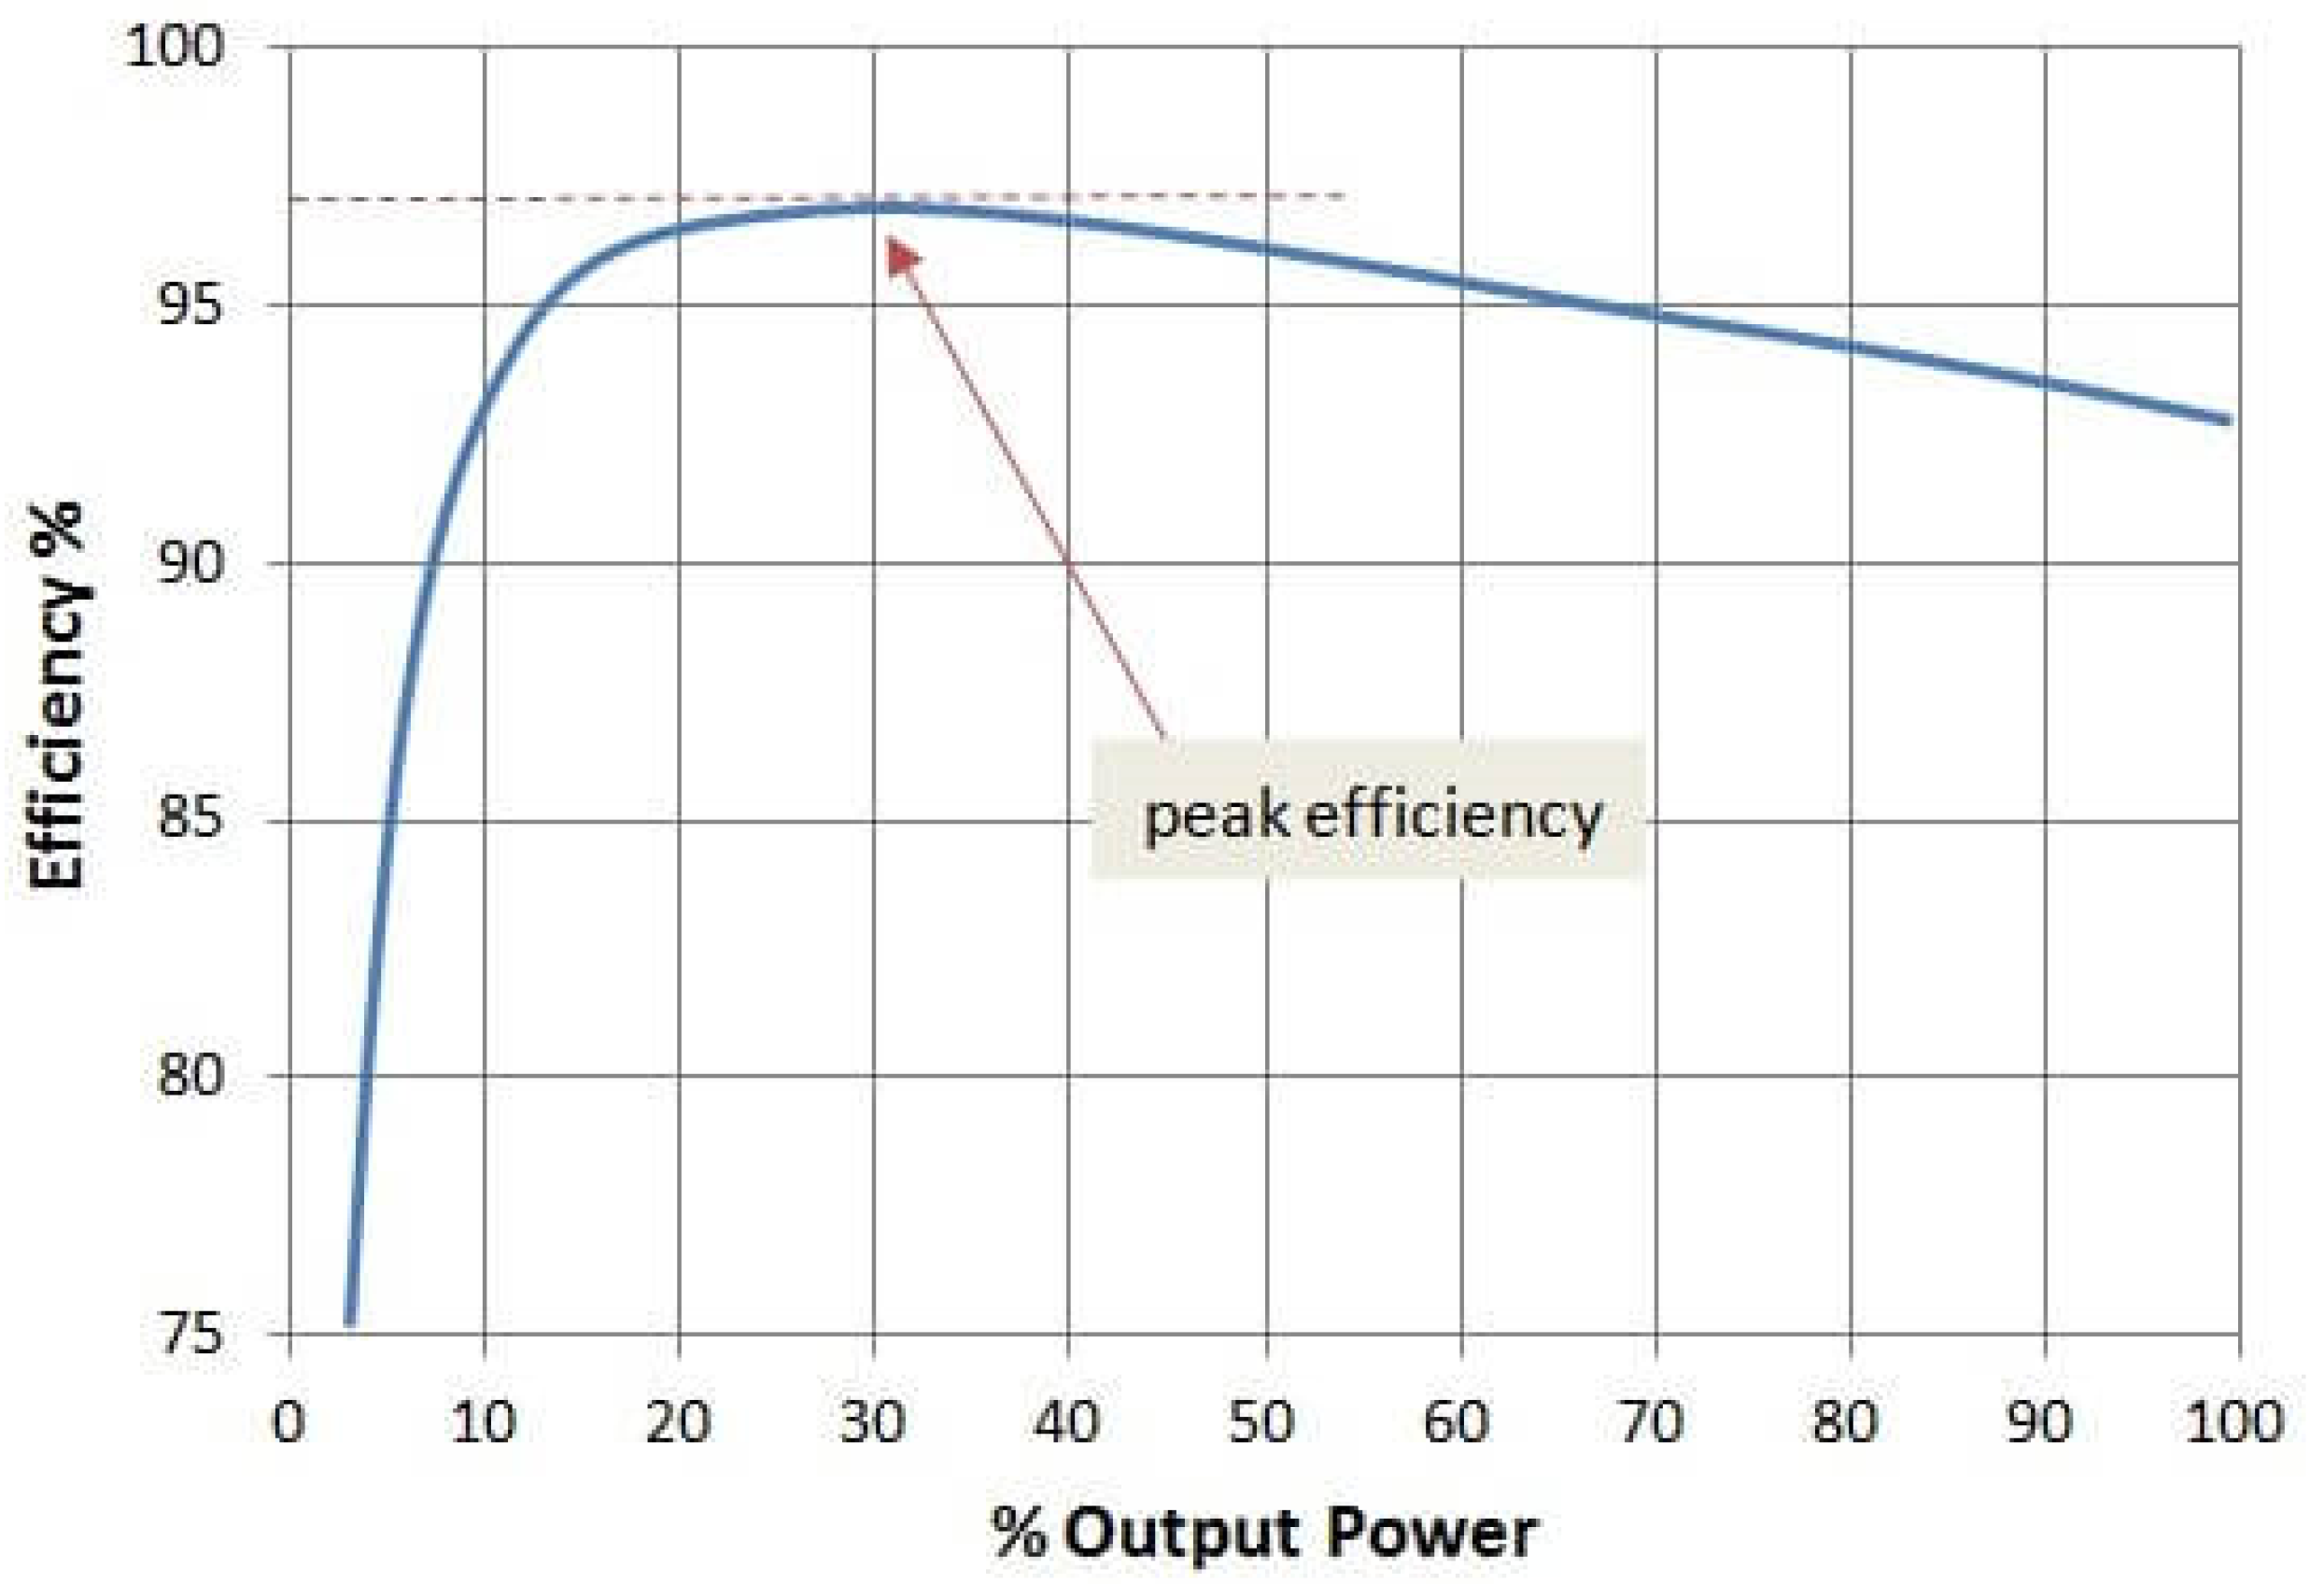
The converter efficiency varies with the percentage of main output power as indicated in
Figure 1 [
42].
Although
Figure 1 is taken from a specific model, it represents the typical evolution of the efficiency of an AC/DC converter with the percentage of main output power with minimal differences between different brands and models.
If the required power from the electric engine is P, and the operating voltage and current are V
AC and I
AC, the demanding current from the battery is given by:
That depends on the converter's efficiency.
We define the autonomy of a battery as the operating time for a set-up current; since the operating time depends on the battery capacity and the capacity depends on the discharge rate, we can express the autonomy in the following form:
Where Cr and Cn are the current and nominal capacity of the battery, ID the discharge current, and f the capacity correction factor.
Recent studies have developed an algorithm for the
f-factor that allows to determine the current capacity of the battery from its nominal value [
43] in lithium-ion batteries; the algorithm provides the
f-factor value using the real discharge time and the reference discharge time:
With a=0.9571 and b=0.0148, being tDR and tref the real and reference discharge time, in hours. The referenced discharge time is the corresponding one to the nominal capacity of the battery.
The discharge time is given by:
Combining equations 2 to 5, it results:
ID represents the direct discharge current IDC.
We can determine the battery autonomy from the nominal capacity of the battery and reference discharge time provided by the battery manufacturer once the battery voltage, the engine power, and the converter efficiency are known.
The above equation provides the battery autonomy, in hours, for a total discharge, considering the power demand and the battery voltage remains constant all over time. If we apply the current value of the battery voltage, equation 6 converts into:
The function VDC(t) represents the evolution of battery voltage with time in the discharge process.
In lithium-ion batteries, the evolution of the battery voltage is linear, thus:
Being VDC,o and VDC,f the initial and final voltage of the battery in the discharge process, and t the elapsed time.
Replacing equation 8 in equation 7, we have:
The equation 6 thus transforms into:
We noticed the influence of the converter efficiency that reduces the battery autonomy as it lowers.
In case the operating mode of the electric vehicle, as usual, requires different power at different times, we must calculate the battery autonomy from the Depth-Of-Discharge (DOD) coefficient, defined as:
tD is the time corresponding to a partial discharge, and the sub-index i represents the order of the partial discharge.
For several partial discharges:
Applying previous equations:
The battery autonomy depends inversely on the maximum DOD value; therefore:
Where n indicates the maximum number of partial discharges allowed.
Replacing the discharge current by the expression given in equation 2, we have:
That gives a practical expression to determine the current autonomy of a lithium-ion battery working as an energy source for the electric vehicle engine, provided the characteristics of the different discharge processes are known.
We obtain the battery voltage at every discharge process using equation 8, where the time
t is now the discharge time
tD; therefore:
Although equation 16 looks a very complex algorithm, most of the involved parameters are fixed, like the reference time, tref, constants a and b, nominal capacity of the battery, Cn, and the initial and final voltage of the battery, VDC,o and VDC,f, that correspond to the battery fully charged and fully discharged state.
Experimental Device
Tests run on a Li-ion battery. The battery block consists of a group of 36 cells, 4 in series and 9 in parallel, of 4.2 Vpe and 2900 mAh of capacity, for a global voltage of 16.8 V and a total capacity of 26.1 Ah. The battery connects to an AC/DC converter from the company VICTRON, model Phoenix 12-800, which operates within the range 9.2-17.2 VDC for the inlet current and with a constant output voltage of 220 VAC within a variation range of ±1 VAC. The converter generates a pure sine wave in the 0-800 W range, with a maximum overload of 50% in the converting power. The AC circuit consists of a group of ohmic resistances connected to the AC output of the converter. The resistances simulate the external loads, and the associated electric power consumption represents the energy demand by the electric engine in a current situation. The resistances can be combined to set up a variable current demand, simulating different driving conditions, idling, acceleration, deceleration, braking, ups and downs, or constant speed. We control the discharge battery using specific software (AMR Control V5) that allows the recording of voltage and current measurement of the battery made by a data acquisition system ALMEMO 2590-AMR from the company ALHBORN. The sensors used for the measurements automatically determine the range of operation, adjusting the precision of the measurement through an internal electronic control circuit. In our case, the accuracy in measuring the voltage and current was ±0.1 mV and ±1 mA. A power analyzer, P-6000 PCE Group, controls AC parameters, allowing measurement and recording of AC voltage and current in continuous mode. The software LABVIEW controls the process of measurement and recording to avoid excessive data. The power analyzer provides not only the AC voltage and current but also the power factor and the power consumption. Voltage is measured with a precision of ±1 V, while the accuracy in measuring current is ±0.1 A. Likewise, the factor power and power consumption have an accuracy of ±0.01 and ±0.1 W.
Table 1 shows the battery composition.
The external load consists of two types of resistances from the company ARCOL, with a maximum dissipation power of 150 W and 100 W; the nominal values of the resistances vary from 22 W to 1 kW. Resistances can be grouped in series or parallel to obtain a specific current. The resistances used in experimental tests have low thermal coefficient, which makes the change in the resistance value with the temperature almost negligible.
Charging of the battery was made with a professional automatic charger ULTRAMAT 18S from the company Groupen that controls the voltage and current of every cell of the battery through an internal equalizer system, allowing a maximum difference voltage between cells of 1 mV. We configure the charger to optimize the battery charging according to the type of battery. The maximum charge current is 20 A with a precision of 0.1 A. The battery charger is connected to a PC using specific software to record charging voltage and current.
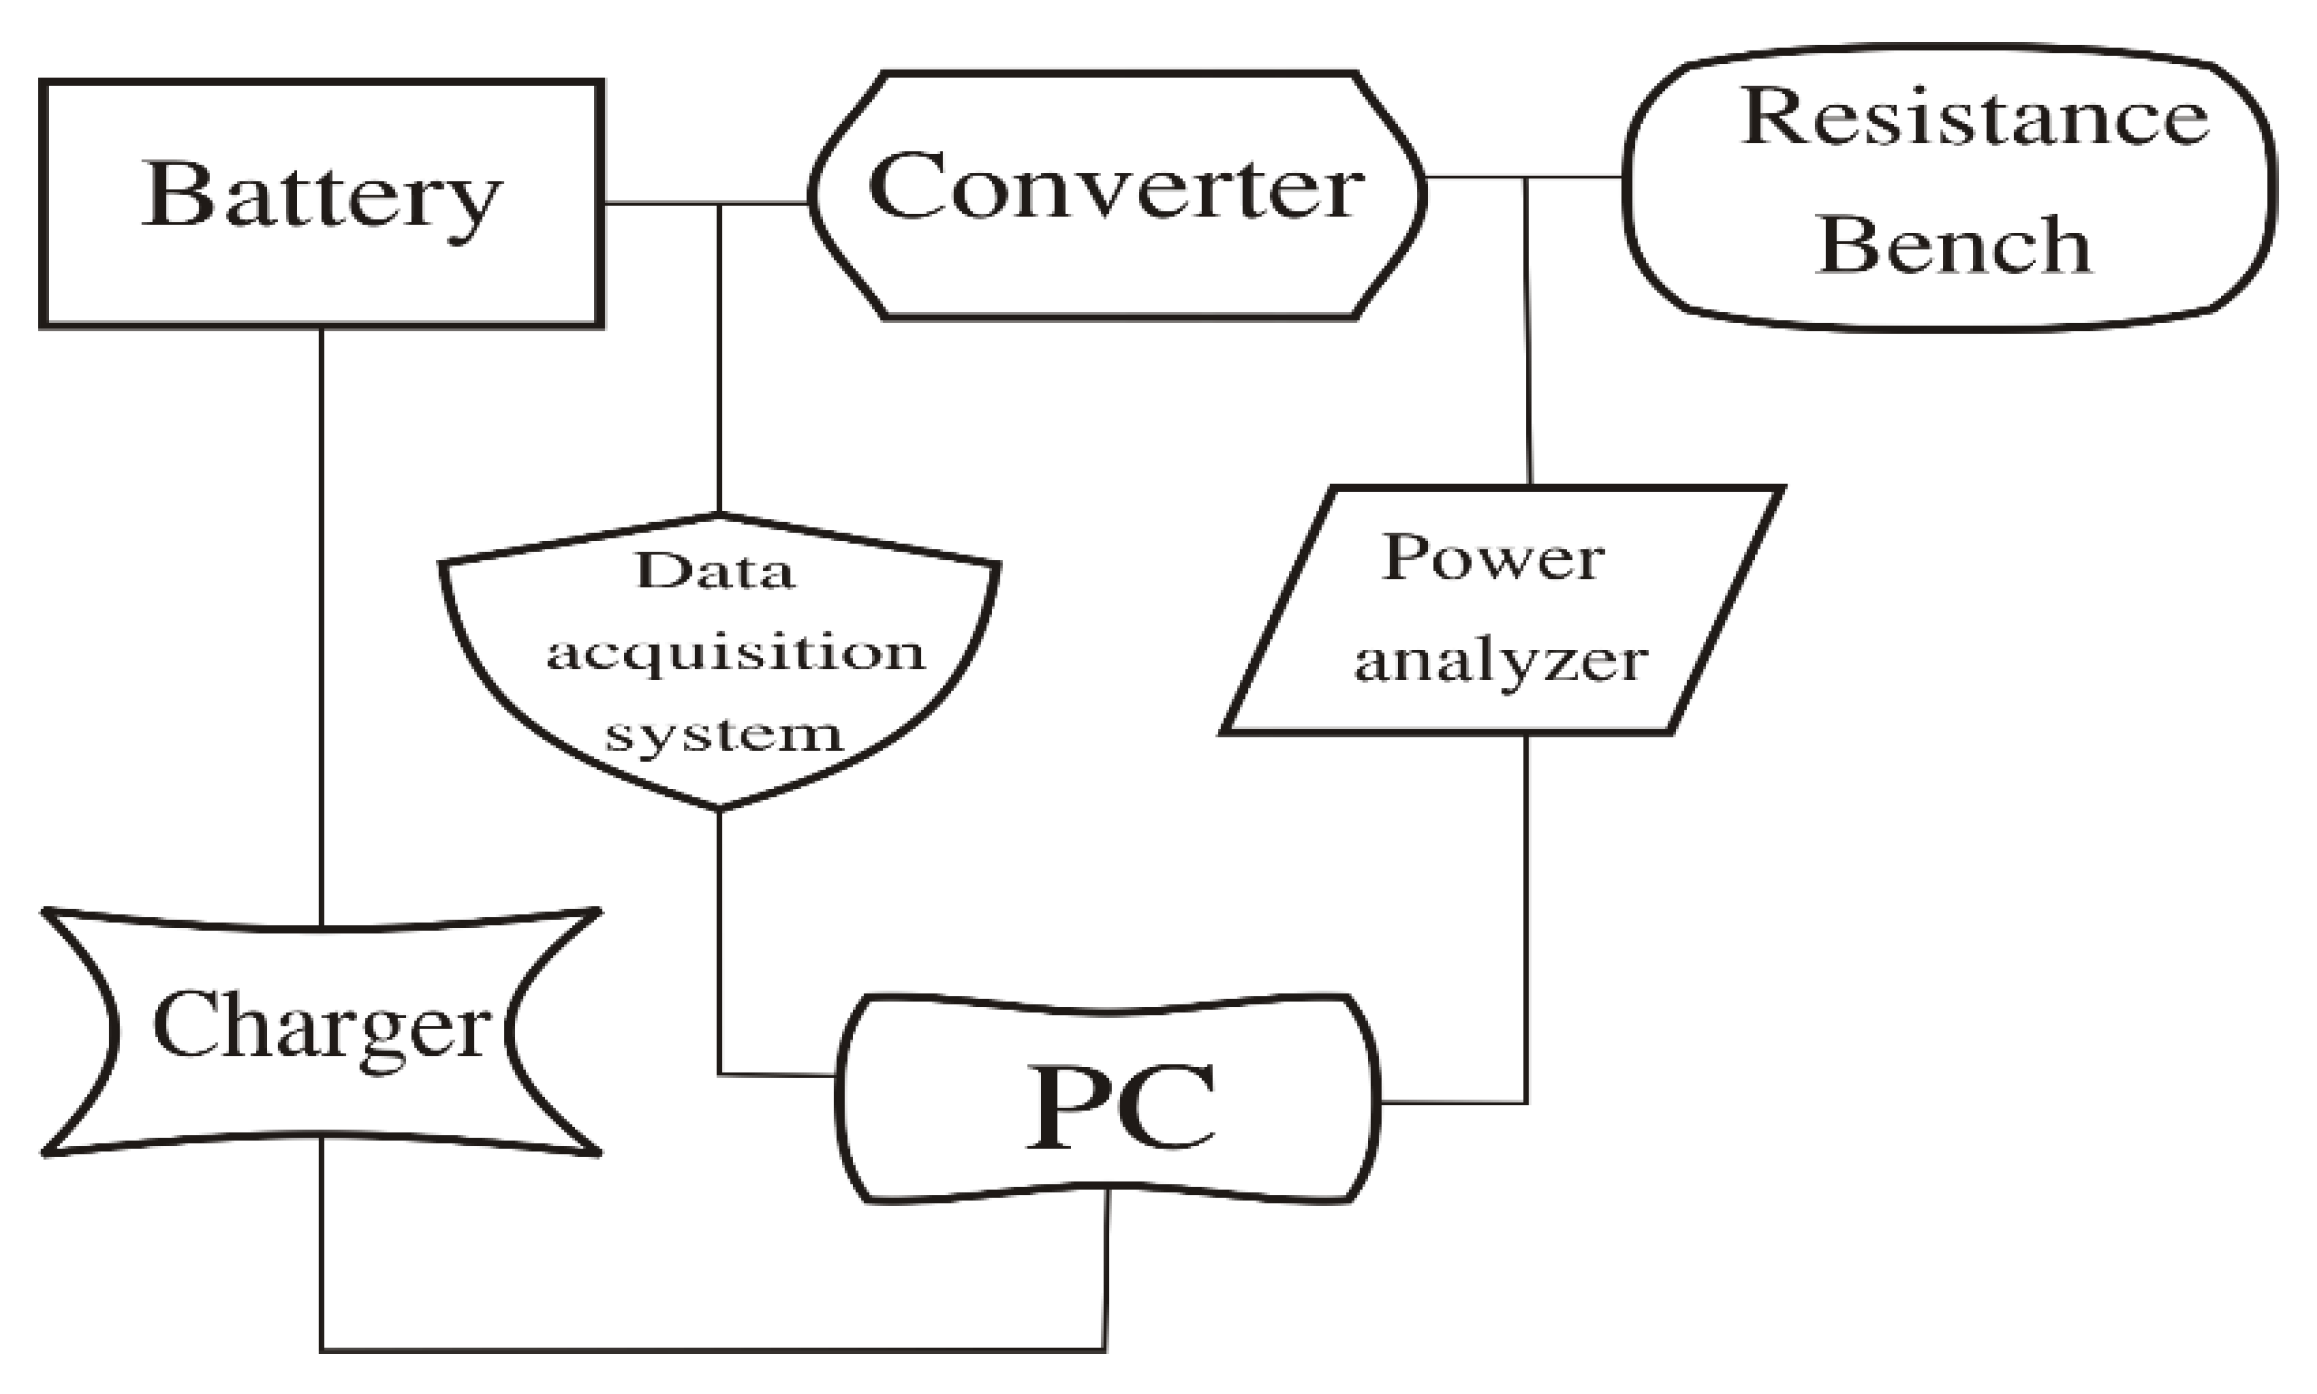
Figure 2 shows the schematic representation of the experimental system.
Experimental Procedure
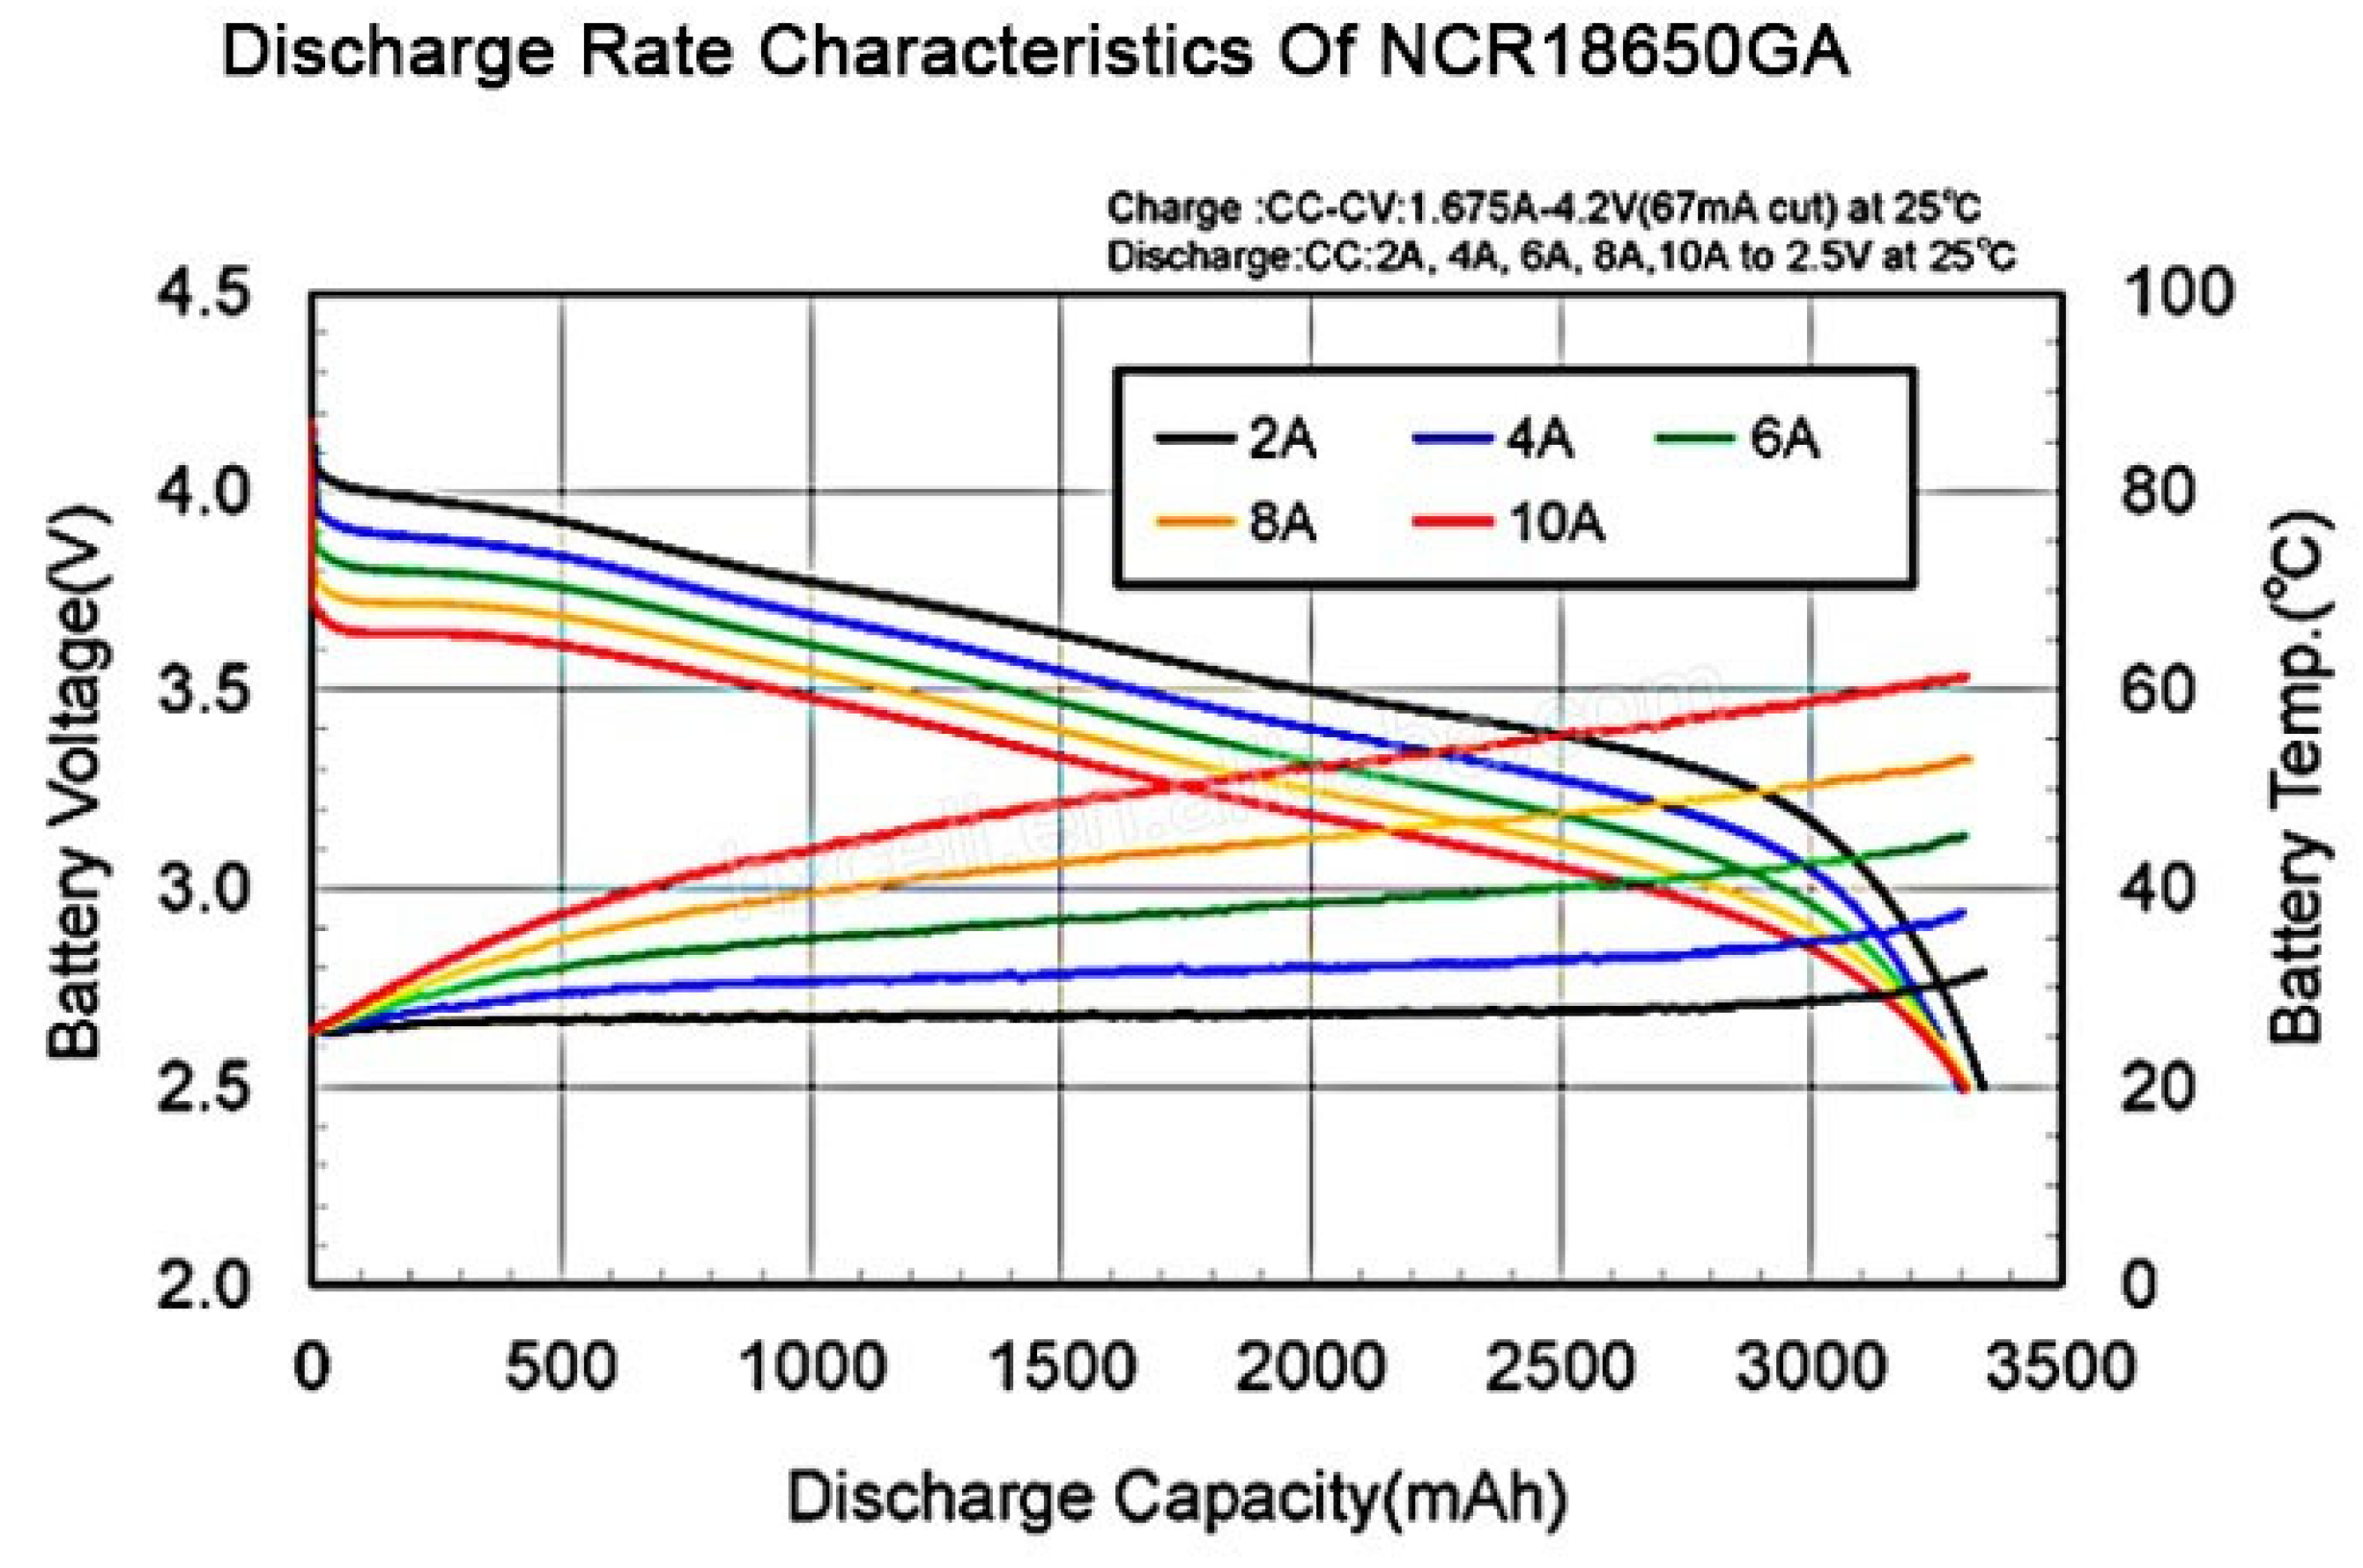
The batteries used in the experimental tests are new, so aging effects are avoided. Tests were run at constant temperature in a thermally controlled room within a maximum variation of ±1º C, which makes the temperature effects on the battery performance negligible. Before starting tests, we characterize the battery block using a reference discharge current and time to verify the battery current capacity. We charge the battery block before running the operation. The characterization discharge ended at the cut-off voltage for this type of battery according to the discharge rate (see
Figure 3). We repeat the characterization process to check possible deviations in the determined capacity. We establish the average value from the characterization tests as the reference capacity. The maximum deviation between values was 0.3%.
After the discharge process, the battery charges using a programmable source that uses the appropriate charging procedure for this type of battery [
45]. The charge develops at an identical current as discharge to avoid applying a capacity correction factor; therefore, we can compare supplied and extracted charge to and from the battery; if the comparison shows a deviation higher than 1%, the battery is discarded and replaced by a new one.
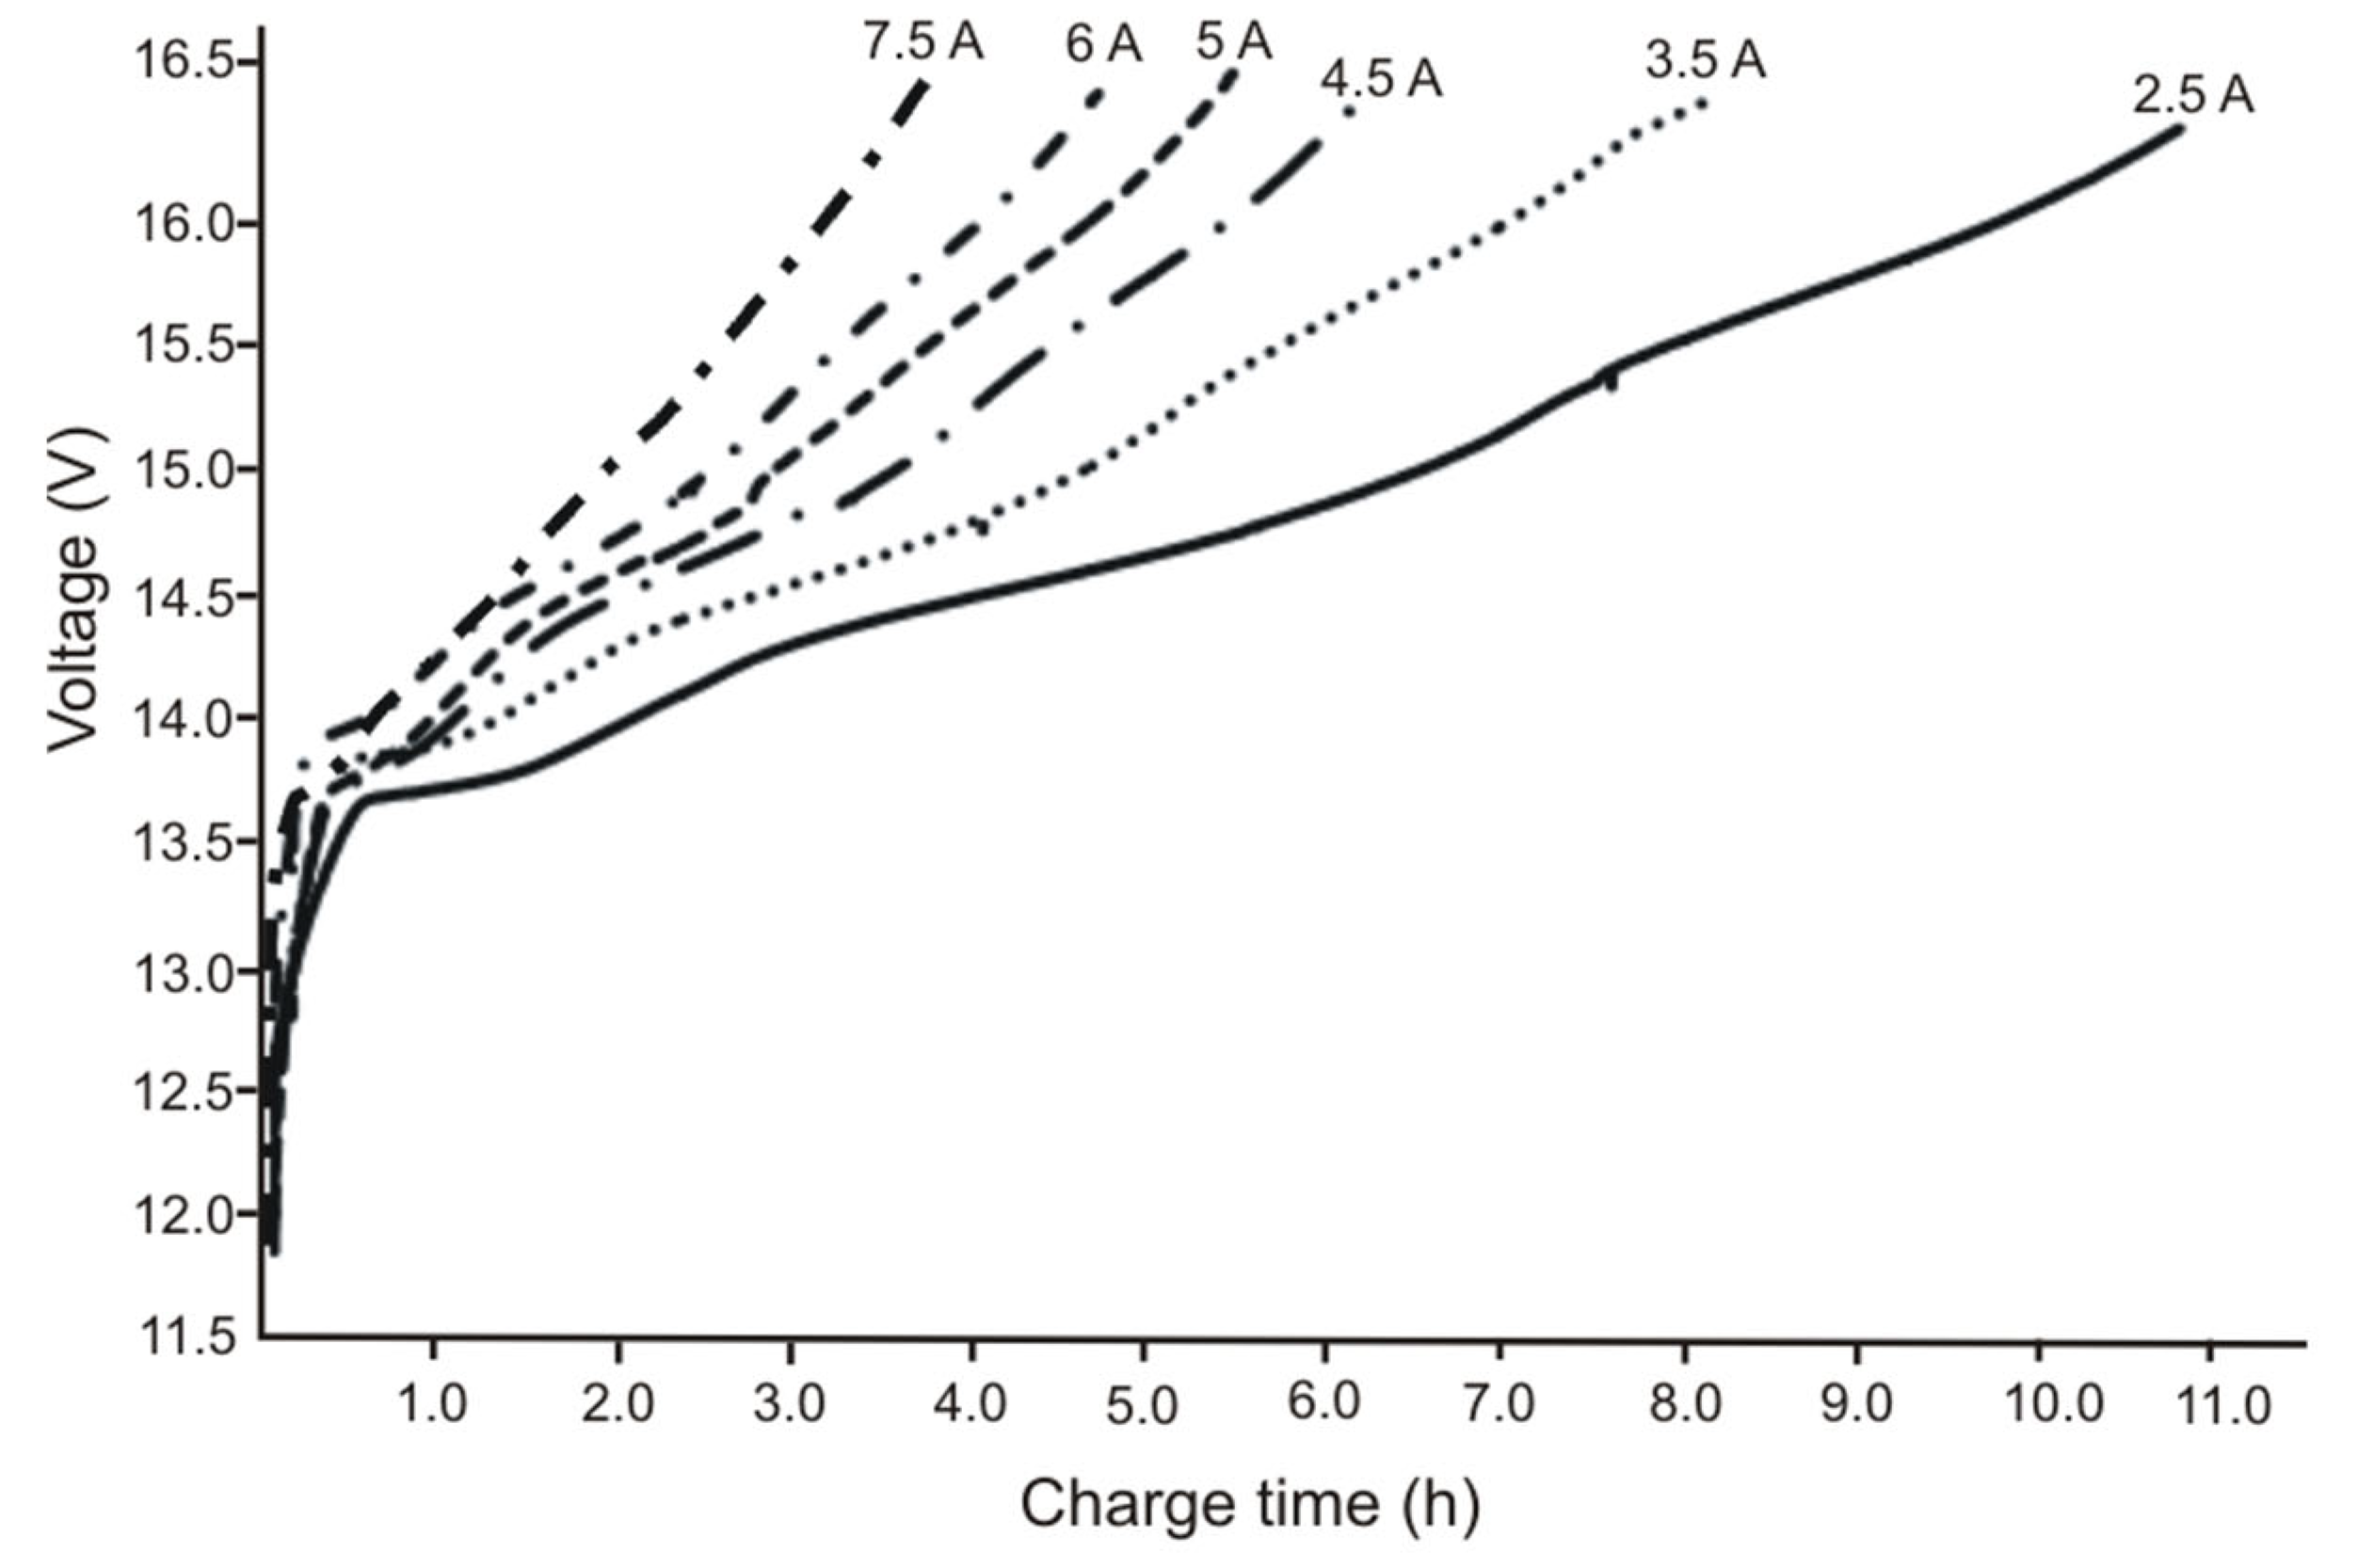
Figure 3 shows the voltage of the characterization charging process.
We compare the capacity obtained during the characterization process with the nominal value provided by the manufacturer [
46]. We observe that the nominal and the average current capacity slightly diverged, 26.1 Ah for the nominal capacity and 24.5 Ah for the average current capacity. Because the deviation is significant, we apply a correction factor of 0.061 to increase the accuracy of the results. The same procedure was applied to the battery voltage to verify if the nominal voltage matched the real one after measuring with a professional voltmeter HP 34970A that has a resolution of 0.1 mV. The result of the testing showed a difference between the nominal voltage, 16.8 V, and the tested one, 16.6 V, which we consider as a reference voltage for the fully charged battery.
Since the simulation seeks to reproduce as faithfully as possible the behavior of the battery in an electric vehicle, and because the electrical battery characteristics of our model differ from a current battery operating in an electric car, it was necessary to establish a conversion relationship between the model and the current battery; therefore, we compared power and voltage used in electric vehicles to those of our battery blocks.
To make a correct simulation of the battery performance, we define three conversion factors: one for the accumulated energy in the battery, another for the battery voltage, and a third one for the discharge current. These factors correspond to the ratio of the values for the electric vehicle battery to the ones in our battery block.
Mathematically, these factors are:
To simplify the calculation, we decided to operate with an energy factor of 150 and a voltage factor of 30, which leads to a current factor of 5 since we obtain the current factor from equation 17 as the ratio fξ/fV (18).
As a reference we used a mid-range electric vehicle, whose battery has a characteristic energy of 60 kWh, what leads to a conversion factor of:
The energy factor is close to the foreseen ratio of 150.
The associated voltage to the battery used in the above calculation is 460 V, leading to a voltage factor of:
The voltage factor also approaches the expected value of 30. Since the time is a constant, the energy factor can be associated with the power factor. According to equation 18, the current factor is:
That is not very far from the predicted value of 5.
Using these factors, discharge or charge current in the model is determined from the current values in the electric vehicle operation divided by the current factor. The current in the current operation mode for the electric vehicle is obtained from Ohm’s law once the required power is known.
To determine the different values of the current in the read operation mode, we have established five different driving modes: standby, flat terrain, ascent, decline, and acceleration. We assume the velocity of the electric vehicle is constant in all modes except acceleration, where the velocity increases, and standby, where the electric vehicle stops.
The required power in every mode is determined from statistical analysis based on daily operational mode in electric vehicles.
Table 2 indicates the values of the required power in real conditions for every driving mode as well as the real and simulated current.
Values of required power have been calculated using the following classical mechanics equations:
Where
Pt represents the required power,
F is the global force and
v is the velocity.
FI, Fv, and
FR are the inertial, drag, and frictional forces, respectively, being
FT the tangent component of the vehicle weight. Mathematically, the forces are defined by:
Being
m the vehicle mass,
a the acceleration,
ρ the air density,
Cd the drag coefficient,
A the reference area,
μ the friction coefficient, and
α the slope of the road. The product
(ACd) in the drag force is known as drag area, with a typical value of 0.790 m
2 for an average full-size passenger car [
47]. Therefore, we express the drag force as:
The coefficient Cx is called the aerodynamic coefficient.
To calculate the parameters involved in equation 23, we have considered the following conditions:
These parameters are coherent with current conditions for a utility vehicle driven in a city with no severe declines or ascents, running on an average velocity of 70 km/h on flat terrain and accelerating from zero to 100 km/h in 14.5 seconds, which is a very current acceleration for city cars. This value agrees with referenced data from previous studies [
48].
We have supposed a friction coefficient value in the middle of the usual range (0.013-0.100) that corresponds to normal driving with conventional tires at normal inflating pressure [
49]. The aerodynamic coefficient has been determined by applying equation 24 and taking the average value of the drag coefficient and reference area range for city cars [
50].
Under the mentioned conditions, using equations 22 and 23 for the forces in the different driving modes, we obtain the values in
Table 2 for the required power.
Now considering the operating voltage of the electric vehicle engine, applying Ohm’s law and using the current factor (equation 21), we determine the operating and simulated current (see
Table 3).
The values of the simulated current (continuous current) are calculated considering the efficiency of the AC/DC inverter using the expression:
Where ηinv is the inverter efficiency, and VAC and VDC are the operating voltages of the electric vehicle and battery.
We assume the inverter efficiency is constant in the operational range, as well as the battery voltage. For calculating the simulated current, we consider the battery voltage at full charge since the slope of the voltage decrease is low, and the running time for every simulated driving mode is relatively short compared to the time of full discharge.
The method to set up the corresponding current to every simulated driving mode is determining the electric resistance using the Ohm’s law. Applying Ohm’s law and taking into account equation 24, the value of the resistance is given by:
The sub-index i indicates the simulated driving mode case.
The resistances for the simulation are presented in
Table 4.
Experimental Tests
The first test is devoted to characterizing the battery block used in the simulation process. For this purpose, we submit the battery to a conventional discharge at the reference current that corresponds to the nominal capacity provided by the manufacturer. We repeat the process three times to determine possible deviations in the current capacity values from test to test. We consider the average value of the three discharging tests as the battery capacity current value. The average value diverged from the nominal capacity by 6%. 24.5 Ah for the tested average capacity versus 26.1 Ah of nominal capacity.
The charging tests run using a ULTRAMAT 18S automatic charger that includes a controller for balancing the voltage of battery cells within a maximum deviation of 1 mV. The charger identifies the type of battery and charges the battery up to the maximum voltage using a programmable protocol; in our case, the charger automatically sets up this protocol corresponding to the current sequence of lithium battery charging.
The charging current varies from 2.5 A to 7.5 A, trying to reproduce the battery current charge in electric vehicles from an external source. According to the conversion factors, the range used in the experimental tests corresponds to a current power source from 6.1 kW (2.5 A) to 18.3 kW (7.5 A), which matches the low and medium charging range in operational wall boxes, 4.6 kW to 7.4 kW for the low range and 11 kW to 22 kW for the medium range [
51,
52]. We can notice the predicted values for the current power source in the simulation are in half of the range of current operating conditions for low and mid-range; therefore, the charging in the simulation process is in close agreement with current conditions. Although this range does not cover all options for battery recharging in electric vehicles, it represents the most accessible ones since the power source is limited.
The experimental tests pursue, among other objectives, to evaluate the battery autonomy for different operating conditions, maintaining the conversion relationship between the simulation and the current working conditions. To this goal, we set up the resistance corresponding to the simulated driving mode, and the battery connects to the inverter, draining a current given by equation 25. Since driving current conditions combine the different driving modes, a conventional driving journey is simulated through the time and conditions of every driving mode; therefore, a single test results for the combination of five different steps, each corresponding to a single driving mode that is characterized by its discharge current and running time. In such conditions, the extracted charge from the battery is given by:
The values applied for this procedure are from
Table 2, where the time for every driving mode is the current time in current driving conditions.
During the time lapse between two steps, the battery recovers until the voltage is constant; this recovering time, although not present in current conditions, is included in the simulation procedure to evaluate its influence on the performance and autonomy of the battery.
Tests were run under two different time conditions, short and long-running times, representing two types of travel, one for short driving distances and the other for longer ones.
Test Results
The battery charging process develops using currents within the interval 2.5 A to 7.5 A.
Figure 4 shows the results of this process.
Charging currents from 2.5 A to 7.5 A corresponds to a simulated power from 41.5 W to 124.5 W and current power from 6.1 kW to 18.3 kW; applying the power factor, we obtain the equivalent power in current conditions, which are 6.121 kW and 18.363 kW. Since the type of alternate current, monophasic or tri-phasic, used in recharging electric vehicle batteries depends on the power, we consider this when calculating the current power supplied to the battery during the recharge.
The charging process represented in
Figure 4 ends before the flotation process to avoid unnecessary extra charging that reduces the efficiency of the process and tends to degrade the battery.
Standardization charging protocol defines the following characteristics [
53]:
Depending on the battery capacity, the charging time for every type of charge indicated in
Table 5 is different [
54]. However, we can estimate the expected charging time for a battery of 60 kWh, like the one used in our simulation, using data from manufacturers [
55], which leads to the following results (see
Table 6):
The values for 60 kWh correspond to an interpolation since this energy is not a current manufacturer value.
If we now apply the estimated values from
Table 6 to the charging power in our simulation, we obtain (
Table 7):
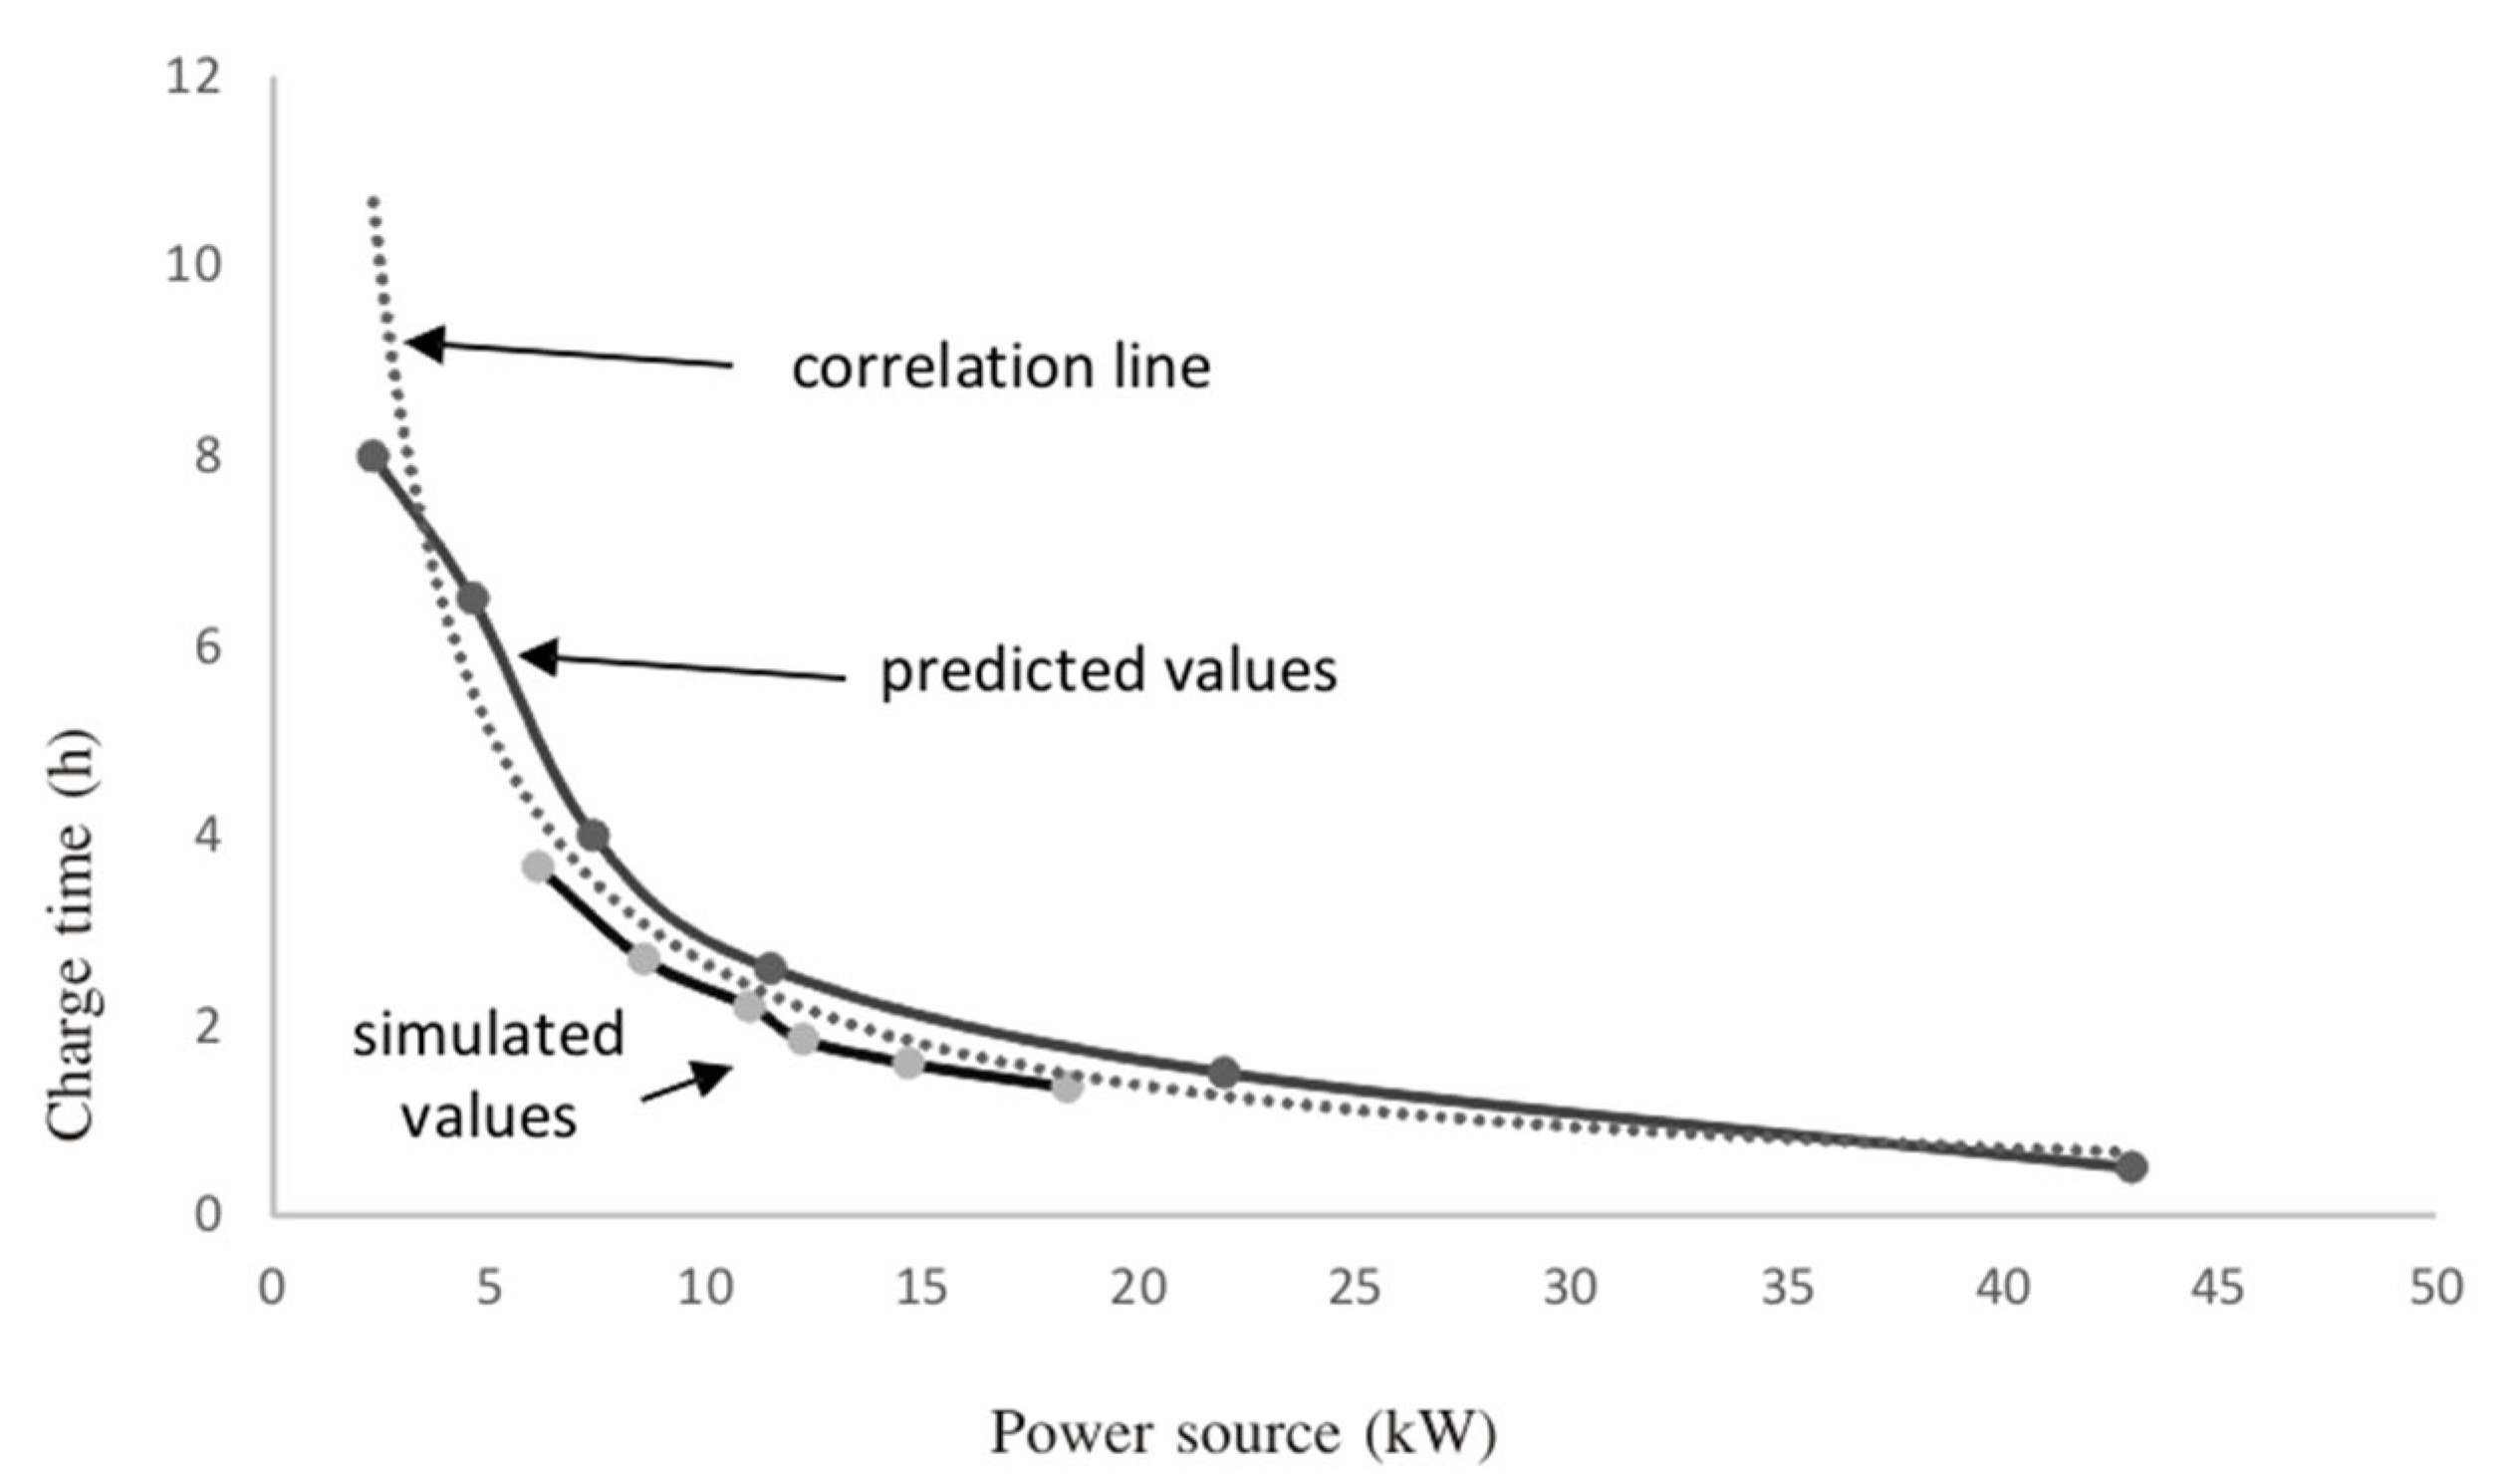
Comparing the predicted values with those obtained in the discharge test from our simulation, we observe a good correspondence, showing an increasing deviation with the discharge current produced by increasing uncertainty in measuring as the discharge current increases, but within a low value, 3% on average. These results are in close agreement with the predicted charging times by wall box manufacturers [
54], as indicated in
Figure 5, which proves the validity of the simulation process.
Figure 5 shows the comparison between predicted values, upper solid line, and simulated values, lower solid line. The discontinuous line corresponds to the potential correlation, with the following characteristics:
Where tC is the charging time and P is the power source.
We notice there is a good correlation between predicted and simulated values to a potential line, as well as a close correspondence from simulated values to predicted ones within an average deviation of 6.6%; therefore, we can extrapolate our simulation to higher and lower values of the power source within a low error.
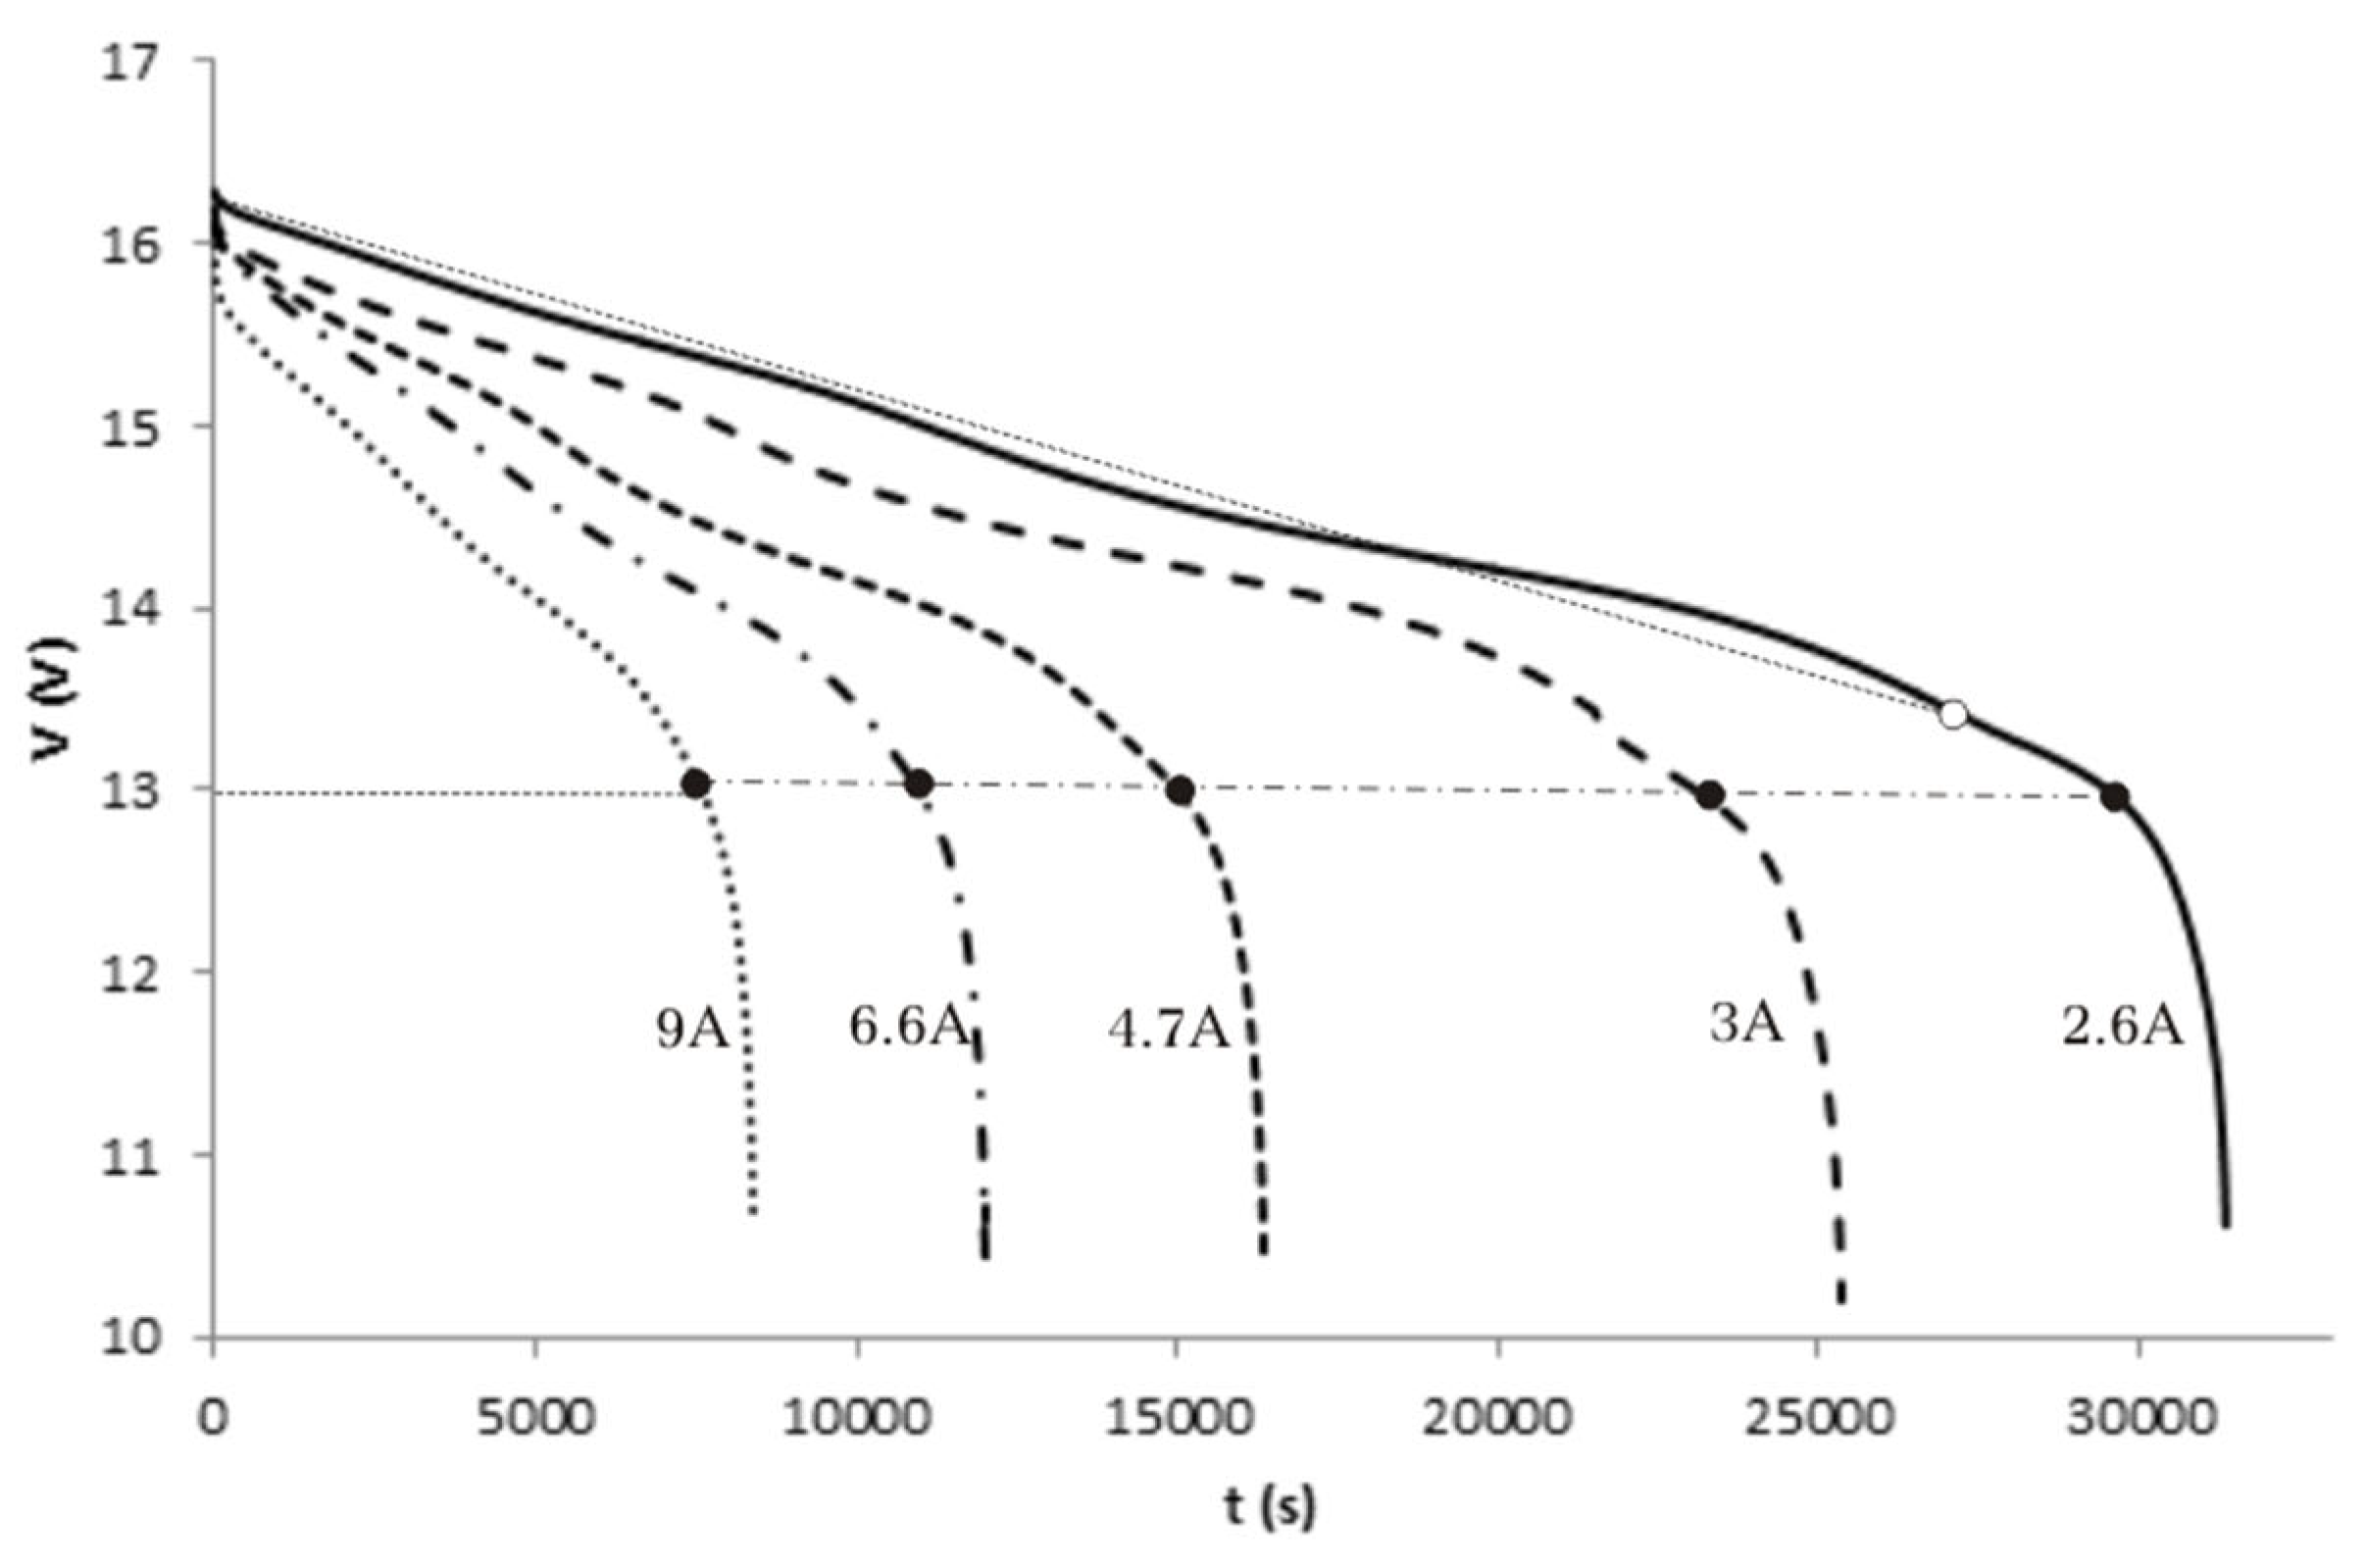
The second test group aims to characterize the battery discharge process. The discharge tests run to determine the behavior of the battery under simulated conditions, reproducing current operation at the model scale. We set up the discharge current at five values: 2.6 A, 3 A, 4.7 A, 6.6 A, and 9 A. The limitation in the battery discharge is due to the restriction imposed by the automatic control unit for the discharge current (10 A). According to the conversion factor for the current, the above values correspond to operating discharge intensity of 13.9 A, 16 A, 25 A, 35.1 A, and 48 A, which results in a power of 6.4 kW, 7.4 kW, 11.5 kW, 16.2 kW, and 22 kW, considering the operating voltage of the electric vehicle, 460 V. These values, for the simulated 60 kWh/460 VDC battery block in an operating electric vehicle correspond to a discharge rate from 0.1C to 0.37C, with operating times from 9.4 h to 2.7 h, which can be considered moderate values appropriate for conservative driving mode.
Tests run without stopping the discharge process between two consecutive discharges, simulating a real operation mode where the driving moves from mode to mode without interruption.
Figure 6 shows the experimental tests for the discharge at the above currents in the battery block of the simulation model.
According to this value, we can determine the discharge time, as shown in
Table 8.
These values were compared to the results of the calculation of the discharge time for the battery block using the expression:
(29), where
ξ is the battery energy at full charge and
P is the extracted power. From the battery characteristics and the required power, we have (
Table 9):
We observe from
Table 9 that the simulation values agree with current operation data, except for the longest discharge time, within a maximum deviation of 3%, proving the validity of the simulation model. The singularity for the lowest power case is due to the uncertainty in defining the cut-off voltage point. If we use the reference voltage, 12.98 V, the cut-off point (black dot) corresponds to a discharge time of 8.24 h; however, if we consider the cut-off point as the one where the linear evolution of the voltage changes (white dot), the discharge time is 7.64 h, in closer agreement with the operating time, having a deviation of 1.6%, within the average value.
We discharge the battery block using the resistance bench instead of the discharge control unit to verify the simulation model results. The procedure reproduces the operating conditions in an electric vehicle with the external resistance playing the role of driving load. We select the resistance value to fulfill the operational conditions following Ohm’s law.
Since the resistances bench uses elements with already set up values, we added a variable resistance to adjust the resistance to the required value; however, due to the lack of precision in establishing the variable resistance, it was impossible to obtain the correct value, thus operating with the closest possible one.
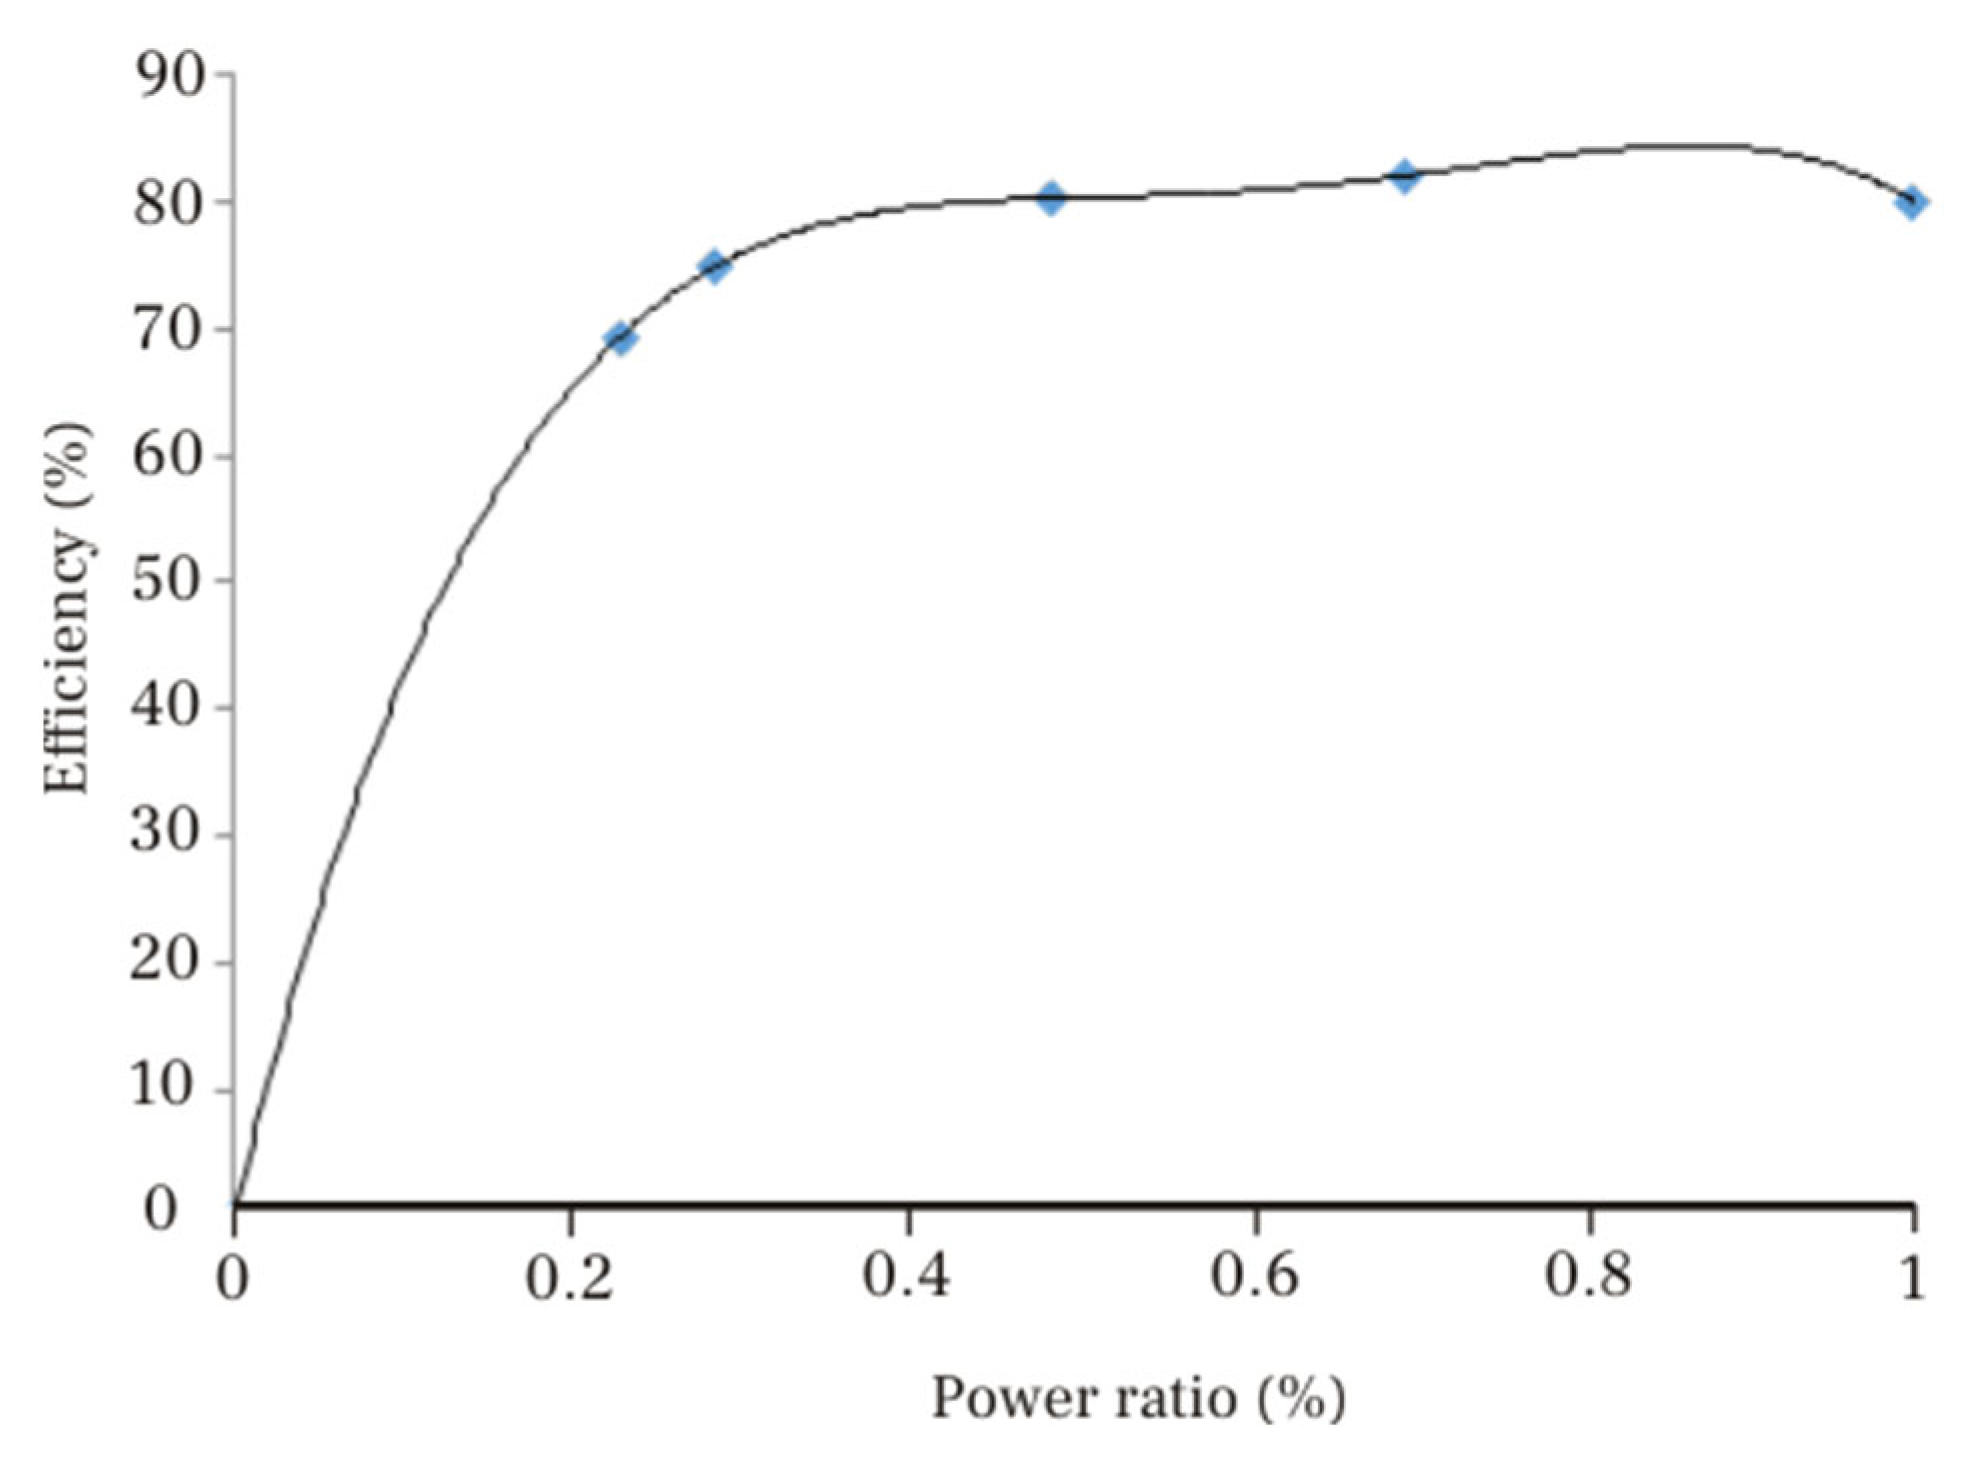
Before running the discharge tests, and because we use the DC/AC converter at variable conversion powers, it is necessary to determine the efficiency of the DC/AC conversion with the power. To this goal, a specific test was run using a professional AC power analyzer PCE-6000 that measures voltage, current, power, and power factor.
Figure 7 shows the results of the test. We establish the power ratio as the relation between the current and the maximum converter power. The solid line in
Figure 7 represents the correlation to the experimental values (diamond spots).
Table 10 shows the operational values of the simulation process during the discharge of the battery block attached to an AC circuit through a DC/AC converter.
IDC (ref) indicates the reference discharge current according to previous tests, while IDC (sim) shows the current discharge current measured during the simulation with the AC circuit. VDC is the average of the current operating voltage of the battery block throughout the discharge process, experimentally measured. PDC corresponds to the battery delivering power calculated using Ohm’s law. The voltage and alternate current values are experimentally measured using the appropriate devices, a professional AC power analyzer PCE-6000 that provides voltage, current, power, and power factor. From the voltage and intensity, the alternate power is determined using Ohm’s law and the converter efficiency from the equation: (30). The values of the resistance, RAC (t) and RAC (sim), correspond to the theoretical value applying Ohm’s law, and the current value used during simulation process.
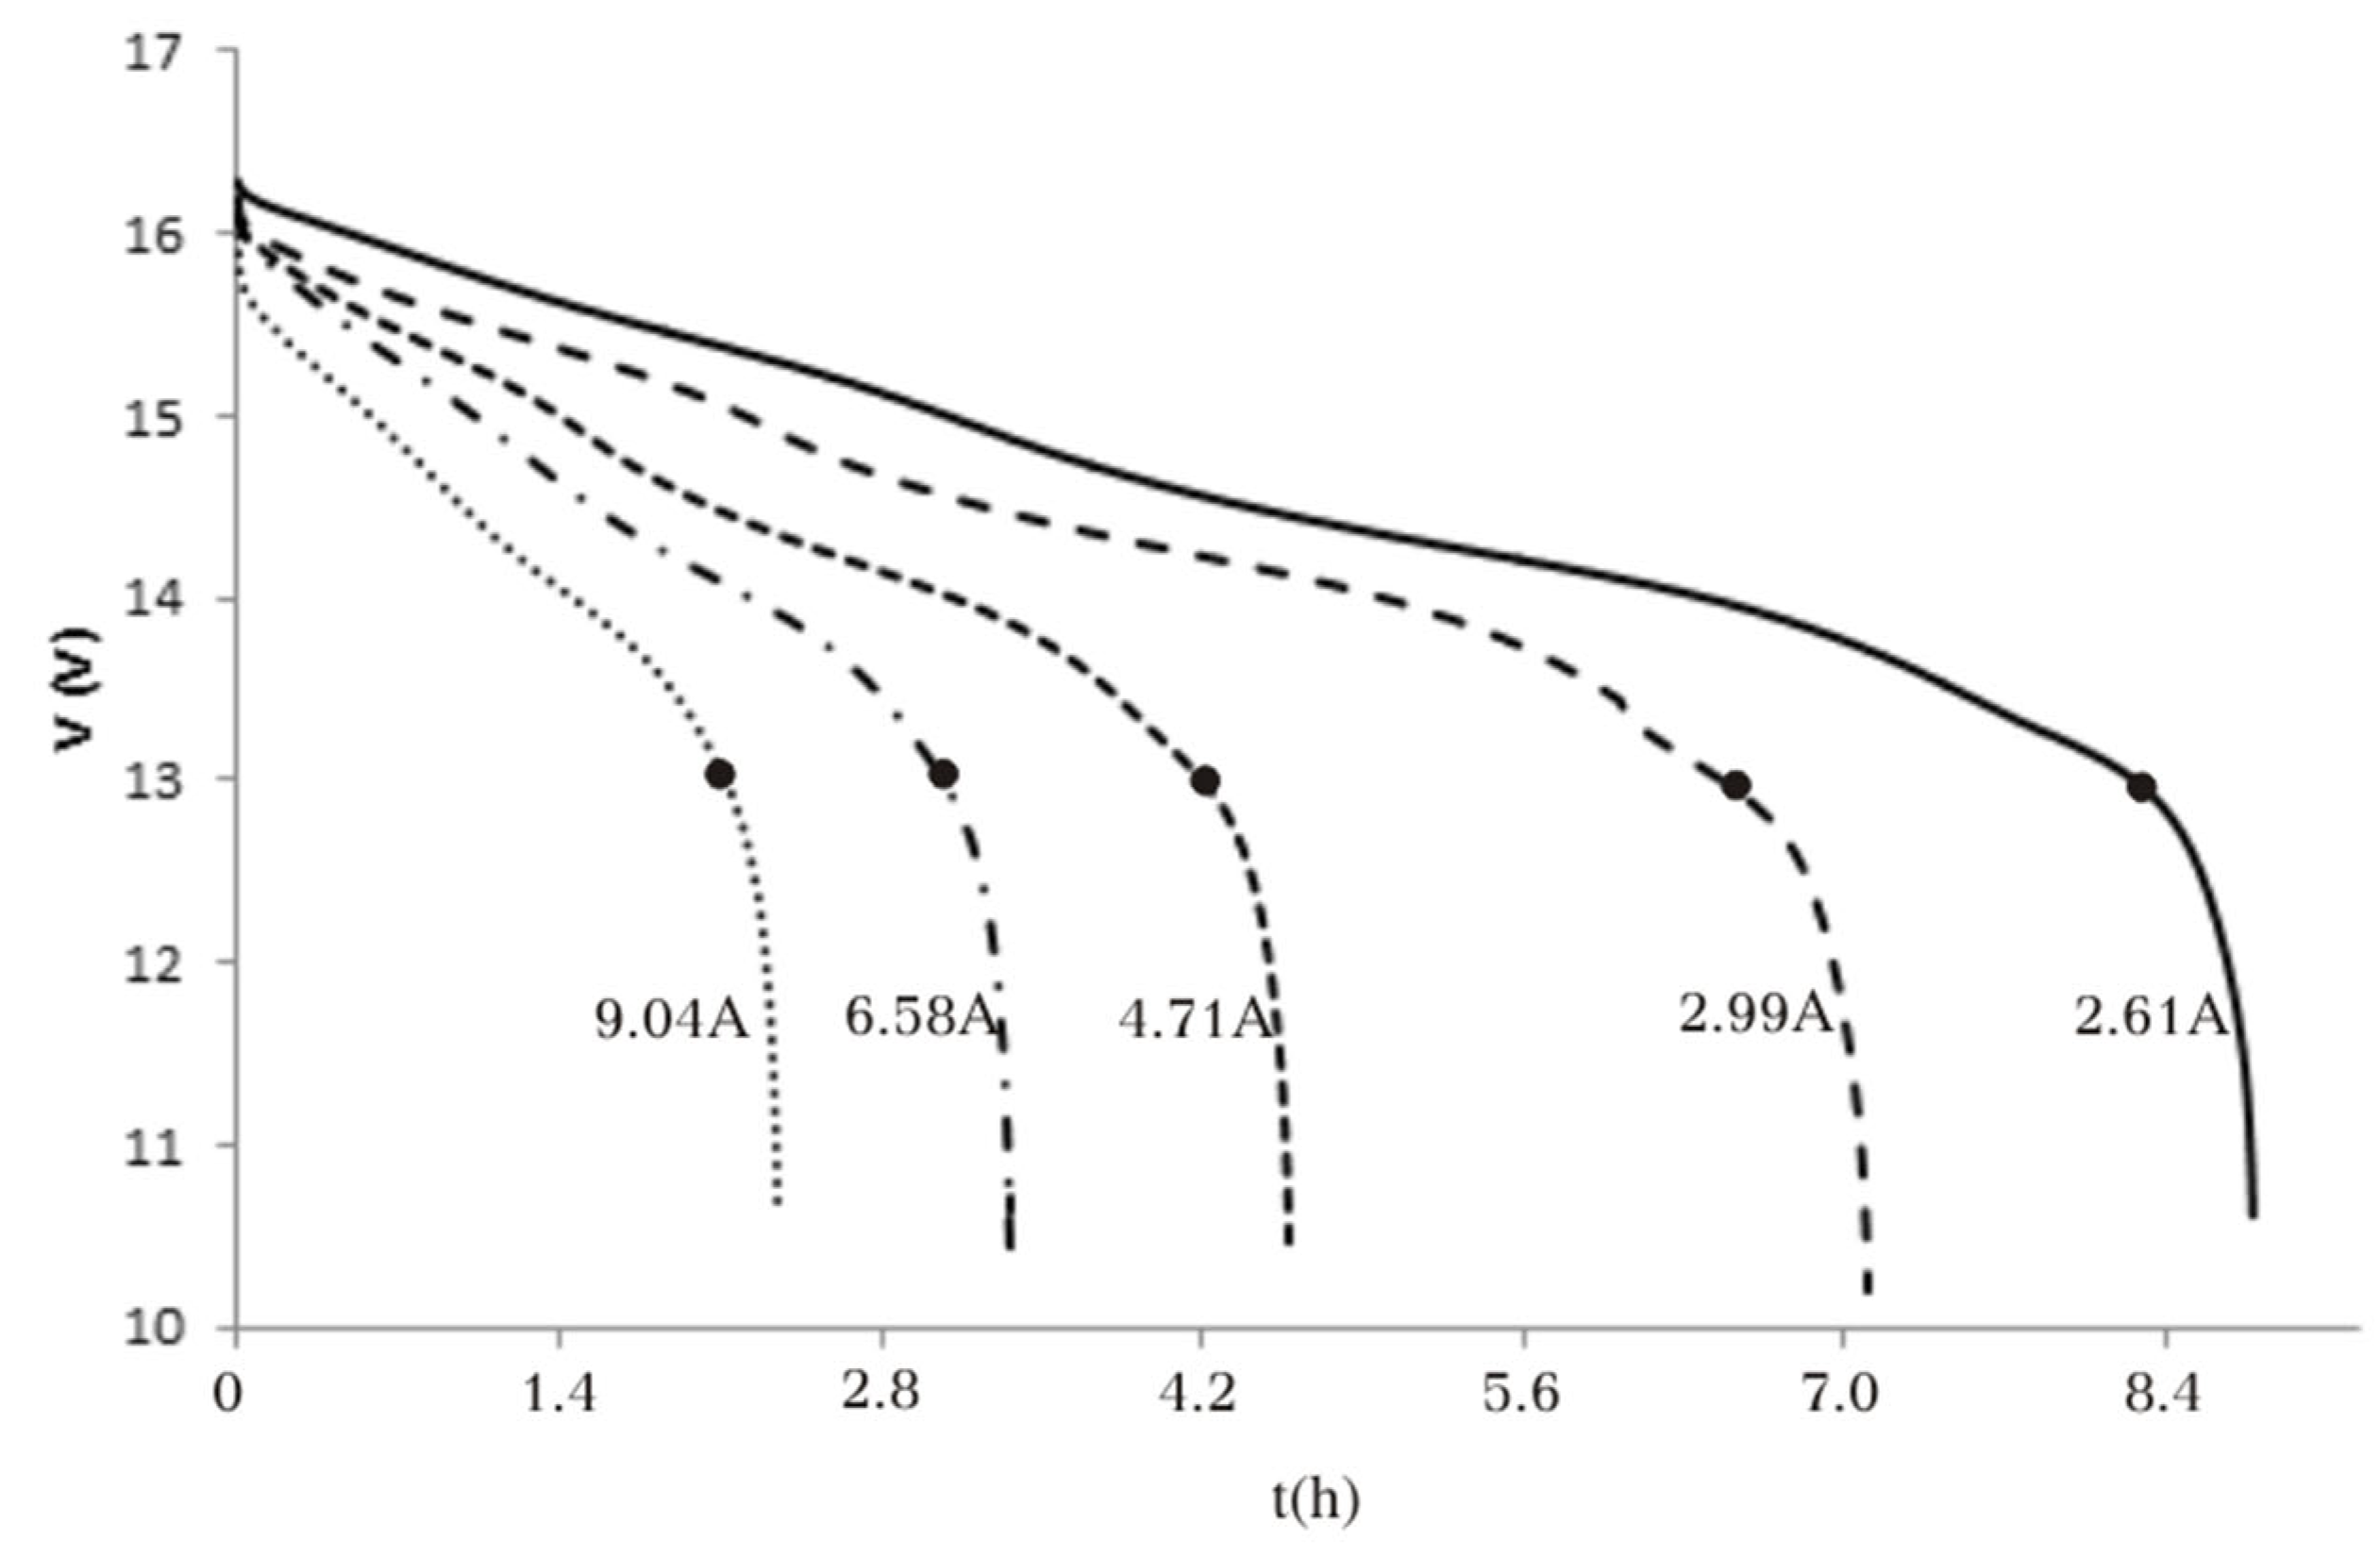
Simulated discharge tests using an alternate circuit produced similar values in the discharge time as when using the continuous current circuit (
Figure 8). If we compare data from
Figure 6 and
Figure 8, we realize that the deviation in the discharging time between the DC and AC simulation models is negligible, as indicated in
Table 11; therefore, both models, AC and DC, are validated.
Conclusions
A simulation process has been developed to determine the behavior of a lithium-ion battery that supplies power to an electric vehicle. The simulation, based on conversion factors for operational battery voltage, extracted current, and delivered power, allows estimating the charge and discharge time in a battery under different charge and discharge rates.
The simulation has been applied from very low to moderate power requirements, using conventional driving modes. Four different driving modes have been simulated: flat terrain, acceleration, ascent, and decline, as they are the most representative of the current driving.
The simulation shows a good agreement between current operation data and experimental results for all the charge and discharge rates, within an average deviation of 3%. This low value validates the proposed methodology for estimating the autonomy of a battery and the recharge time.
The proposed method has been applied to simulated DC and AC circuits with similar results, showing a maximum difference of 1.6% in the time prediction for the discharge time of the battery under various discharge rates. The method can thus be applied to either DC or AC-powered electric vehicles.
References
- Scrosati, Bruno; Garche, Jurgen; Tillmetz, Werner. Advances in Battery Technologies for Electric Vehicles. Woodhead Publishing (2015).
- Institute of Electrical and Electronics Engineers. "IEEE Medal for Environmental and Safety Technologies Recipients". IEEE Medal for Environmental and Safety Technologies (2019).
- Gholam-Abbas Nazri; Pistoia, Gianfranco. Lithium Batteries: Science and Technology, Springer Science & Business Media (2008).
- Korthauer, Reiner. Lithium-Ion Batteries: Basics and Applications, Springer (2011).
- Pistoia, Gianfranco. Lithium-Ion Batteries: Advances and Applications, Newnes (2013).
- Scrosati, Bruno; Abraham, K. M.; van Schalkwijk; Walter A.: Hassoun, Jusef. Lithium Batteries: Advanced Technologies and Applications, John Wiley & Sons (2013).
- Crompton, T.R. Battery Reference Book, Elsevier (2000).
- Linden, David and Reddy, Thomas B. Handbook of Batteries, 3rd Ed., McGraw-Hill Handbooks (2002).
- Garg, Akhil; Peng, Xiongbin; Phung Leb, My Loan; Pareek, Kapil; Chin, C.M.M. Design and analysis of capacity models for Lithium-ion battery, Measurement, (2018) Volume 120.
- Araujo, Jean; Matos, Rubens; Conceição, Verônica; Alves, Gabriel; Maciel, Paulo. Impact of capacity and discharging rate on battery life time: A stochastic model to support mobile device autonomy planning, , Pervasive and Mobile Computing, (2017) Volume 39.
- Goh, Taedong; Park, Minjun; Seo, Minhwan; Kim, Jun Gu; Kim, Sang Woo. Successive-approximation algorithm for estimating capacity of Li-ion batteries, Energy, (2018) Volume 159.
- Fuller, Mark E. A battery model for constant-power discharge including rate effects, Energy Conversion and Management, (2014) Volume 88.
- U.S. Department of Energy. Vehicles. 2014.
- Denton, Tom. Electric and Hybrid Vehicles.. Institute of the Motor Industry. Routledge. Taylor and Francis Group (2016).
- Mi, Chris; Masrur, Abdul and Gao, David Wenzhong. Hybrid Electric Vehicles.. John Wiley and Sons Ltd. (2011).
- Nikkei Electronics Asia. Li-Ion Rechargeable Batteries Made Safer (2008).
- Stanford News. Stanford Report. Nanowire battery can hold 10 times the charge of existing lithium-ion battery (2007).
- Cui, Yi. Inorganic Nanowires as Advanced Energy Conversion and Storage Materials. Department of Materials Science and Engineering & Geballe Laboratory for Advanced Materials. Stanford University (2019).
- Jaques, Robert. Nanotech promises lithium-ion battery boost. Wnunet.com. (2008).
- Berger, Michael. Using nanotechnology to improve Li-ion battery performance. Nanowerk (2008).
- Zhang, Wei-Ming; Hu, Jin-Song; Guo, Yu-Guo; Zheng, Shu-Fa; Zhong, Liang-Shu; Song, Wei-Guo; Wan, Li-Jun. "Tin-Nanoparticles Encapsulated in Elastic Hollow Carbon Spheres for High-Performance Anode Material in Lithium-Ion Batteries - Zhang - 2008-Advanced Materials - Wiley Online Library". Advanced Materials. (2008) 20 (6): 1160–1165.
- "Argonne's lithium-ion battery technology to be commercialized by Japan's Toda Kogyo". December 2016.
- Johnson, C.S. Journal of Power Sources: Development and utility of manganese oxides as cathodes in lithium batteries. Journal of Power Sources 2007, 165, 559–565. [Google Scholar] [CrossRef]
- Hybrid Technologies. US. "Hybrid Develops New "Superlattice Structure" Lithium Battery Capable of Increasing Drive Ranges in Excess of 200 Miles". February (2008).
- Quiñones, F.; Milocco, R.H. and Real, S.G. Remaining discharge-time prediction for batteries using the Lambert function, Journal of Power Sources, (2018) Volume 400.
- Wang, Dong; Yang, Fangfang; Yang, Zhao; Tsui, Kwok-Leung. Battery remaining useful life prediction at different discharge rates, Microelectronics Reliability, (2017) Volume 78.
- Adany, R. Switching algorithms for extending battery life in Electric Vehicles. Journal of Power Sources 2013, 231, 50–59. [Google Scholar] [CrossRef]
- Fui, Siang; Chee, Tie; Tan, Wei. A review of energy sources and energy management system in electric vehicles, Renewable and Sustainable Energy Reviews, (2013) Volume 2.
- Hong Wang, Yanjun Huang, Hongwen He, Chen Lu, Wei Liu, Amir Khajepour Chapter 5 - Energy Management of Hybrid Electric Vehicles, , Modeling, Dynamics and Control of Electrified Vehicles (2018).
- M.A. Hannan, M.M. Hoque, A. Mohamed, A.Ayob. Review of energy storage systems for electric vehicle applications: Issues and challenges, Renewable and Sustainable Energy Reviews, (2017) Volume 69.
- Shun-Li Wang, Carlos Fernandez, Chuan-Yun Zou, Chun-Mei Yu, Xiao-Xi, Li, Shi-Jie Pei, Wei Xie. Open circuit voltage and state of charge relationship functional optimization for the working state monitoring of the aerial lithium-ion battery pack, Journal of Cleaner Production, (2018) Volume 198.
- Zhe Li, Jun Huang, Bor Yann Liaw, Jianbo Zhang. On state-of-charge determination for lithium-ion batteries, Journal of Power Sources, (2017) Volume 348.
- M.A. Hannan, M.S.H. Lipu, A. Hussain, A. Mohamed. A review of lithium-ion battery state of charge estimation and management system in electric vehicle applications: Challenges and recommendations, Renewable and Sustainable Energy Reviews, (2017) Volume 78.
- Cheng Lin, Jilei Xing, Aihua Tang. Lithium-ion Battery State of Charge/State of Health Estimation Using SMO for EVs, , Energy Procedia, (2017) Volume 105.
- Yassine Manane, Rachid Yazami. Accurate state of charge assessment of lithium-manganese dioxide primary batteries, Journal of Power Sources, (2017) Volume 359.
- Linfeng Zheng, Jianguo Zhu, Guoxiu Wang, Dylan Dah-Chuan Lu, Tingting He. Differential voltage analysis based state of charge estimation methods for lithium-ion batteries using extended Kalman filter and particle filter, , Energy, (2018) Volume 158.
- Eberle, Ulrich; von Helmolt, Rittmar. "Sustainable transportation based on EV concepts: a brief overview". Energy & Environmental Science. (2010) 3 (6): 689.
- Gosden, D.F. Modern Electric Vehicle Technology using an AC Motor Drive. Journal of Electric and Electronics Engineering. (1990) Vol. 10, p-21-27.
- Karthik, Sri Hari. Types of Motor used in Electric Vehicles. Circuit Digest. (2019).
- Mikhaylov, Konstantin; Tervonenand, Jouni; Fadeev, Dmitry. Development of Energy Efficiency Aware: Applications Using Commercial Low Power Embedded Systems. Research Gate pubblications (2012) 221926555.
- Knowles, Don. Understand Efficiency Ratings Before Choosing An AC-DC Supply. Power Management. Electronic Design (2013).
- https://topbateriaexterna.com/wp-content/uploads/2019/06/eficiencia-inversor-de-corriente.jpg.
- Armenta-Déu, C. and Carriquiry, J.P. Capacity correction factor for Li-ion batteries: Influence of the discharge rate. Journal of Energy Storage (2019) 25, 100839. [CrossRef]
- Samsung SDI Co., LTD Manufacturer’s Name: Samsung SDI Co., LTD Address: 508 Sungsung-Dong, Cheonan-City, Chungcheongnam –Do, Korea, 330-300.
- Lithium Battery Discharge Cutoff Voltage, News & Events, Large Co. Block A, Gosun Science Park, Hongtu Road, Nancheng District, Dongguan, Guangdong, China.
- Samsung SDI Confidential Proprietary. Specifications of Product. Samsung SDI Co., Ltd. Energy Business Division. Spec. No. INR18650-29E. Version No. 1.1.
- "The Mayfield Company Homepage - Coefficient of Drag Tables and Curves". Mayfco.com. Retrieved 2010-12-07.
- Bokare, P.S. and Maurya, A.K. Acceleration-Deceleration Behaviour of Various Vehicle Types. Transport Research Procedia (2017) 25, 4733-4749. [CrossRef]
- Modern Electric, Hybrid Electric, and Fuel Cell Vehicles. Mehdrad Ehsani, Yiming Gao, Sebastien E. Gay and Ali Emadi. CRC Press (2004).
- http://www.tyre-pressures.com/.
- https://en.wikipedia.org/wiki/Automobile_drag_coefficient.
- Smart electric vehicle charging SYSTEM. Documentation. CIRCUTOR S.A. http://circutor.es/es.
-
"Electric Vehicle Charging Levels, Modes and Types Explained | North America Vs. Europe Charging cables and plug types". Retrieved 2020-02-11.
- https://en.wikipedia.org/wiki/Charging_station.
- https://pod-point.com/guides/driver/how-long-to-charge-an-electric-car.
- https://pod-point.com/guides/vehicles?
|
Disclaimer/Publisher’s Note: The statements, opinions and data contained in all publications are solely those of the individual author(s) and contributor(s) and not of MDPI and/or the editor(s). MDPI and/or the editor(s) disclaim responsibility for any injury to people or property resulting from any ideas, methods, instructions or products referred to in the content. |
© 2024 by the authors. Licensee MDPI, Basel, Switzerland. This article is an open access article distributed under the terms and conditions of the Creative Commons Attribution (CC BY) license (http://creativecommons.org/licenses/by/4.0/).
