1. Introduction
The field of geomatics has been constantly changing and expanding due to numerous technological advances. The traditional and most consolidated surveying techniques relied primarily on the punctual recording of discrete and precise measurements requiring skilled operators and precise instruments such as: levels, theodolites, tacheometers, classical aerial photogrammetry and GNSS (Global Navigation Satellite System). In recent years the field has flourished with newer instruments and methods aimed at quickly recording the complete 3D, producing a dense point-wise geometric description of the object surfaces, a.k.a. the point cloud, as it is the case with terrestrial laser scanners, portable laser scanners, airborne LiDAR (Light Detection And Ranging) and Structure from Motion (SfM) and image dense matching. These 3D dense geometric recordings of reality have enabled many new applications and are now widely adopted in fields such as: land mapping, construction, cultural heritage, archaeology, and infrastructure. Moreover, software development and advancements of algorithmic processes have opened the door to non-specialized instruments as well to be used for geomatics applications with great success further expanding the field. A noticeable example is the democratization of photogrammetry thanks to modern image-based modelling software and the support for low-cost consumer-grade hardware such as: DSLR (Digital Single Lens Reflex) cameras, smartphone cameras and UAVs (Unmanned Aerial Vehicles). However, despite the many advances achieved so far, such as laser scanning and SfM photogrammetry efficiency, there are applications where these techniques cannot effectively be used due to several limitations in maneuverability, acquisition range, execution time, and error propagation. For example: narrow spaces, tunnels, and caves remain a challenge when accurate dense mapping is required [
1,
2].
Hand-carriable and backpack-mounted Mobile Mapping Systems (MMSs) such as many commercial solutions nowadays available on the market: Geoslam Zeb Horizon [
3],Leica Geosystems BLK2GO [
4],Gexcel s.r.l. Heron [
5], NavVis VLX [
6], etc., are ideal instruments for indoor 3D mapping thanks to their maneuverability and speed-effectiveness of the survey operations. However, when employed in extensive or meandering narrow spaces and tunnel-like environments, the global accuracy attainable from these devices is hampered by drift error propagation [
7,
8] thus leaving the problem of efficiently digitizing narrow spaces unsolved. As an example, performing the geometric 3D survey of narrow tunnels or spiral staircases [
9] are challenging tasks: with a TLS is a burdensome and impractical process, even employing the newest more productive TLS solution that allows data pre-registration on the field, such as the Leica RTC360 [
4]; with a portable MMS, the field acquisition is optimized, nonetheless the unpredictable drift of the sensor’s estimated trajectory force the practitioners to integrate the efficient MMS survey with traditional burdensome ground control measurements.
Among portable range-based MMSs, those that are practically employable in narrow spaces, such as the Geoslam Zeb Horizon [
3] and other commercial instruments [
10,
11,
12] or similar devices from the research community [
13,
14], cannot rely on GNSS modules and can only house compact low-grade IMU (Inertial Measurement Unit). Thus a refined estimate of the device’s position, movement, and trajectory is computed from algorithmic processes i.e. SLAM (Simultaneous Localization and Mapping) algorithms [
15]. SLAM methods compute the device movements in unknown environments by exploiting the 3D geometry acquired by the LiDAR mapping sensors. They are prone to failure when ambiguous or featureless geometry is supplied. Even when suitable 3D geometry is available, SLAM is prone to drift error in long acquisitions, and this error is contained if loop closures are provided during the data acquisition. However, loop/closures are usually inherently denied in tunnel-like environments. Indeed, the very scenarios in which hand-carriable MMSs would be most useful are the same scenarios that tend to hamper the possibility of performing loops (tunnels, corridors). The same is true for Visual SLAM methods, using images data instead of LiDAR acquisition to compute movements [
16]. The visual SLAM approach works for ambiguous and featureless geometries while failing for poor image radiometric texture. The visual approach is more promising for the survey of narrow spaces and tunnel like environment since these tend to be geometrically monotonous but rich in radiometric texture. [
9] hinted that the image-based approach might be the most promising solution for the effective survey of narrow spaces, providing good robustness to drift error and good global accuracy. Indeed, the redundancy and robustness of SfM thanks to the bundle adjustment can constitute a solution to the problem in hand. The literature offers many accounts of off-line SfM and on-line visual SLAM approaches applied to the survey narrow spaces, from the uses of low-cost action cameras rigs [
17,
18] to custom stereo-cameras and multi-camera prototypes [
8,
19,
20,
21,
22,
23,
24,
25,
26].
The flourishing market of portable MMSs and the active research regarding fisheye photogrammetry and multi-camera rigs testify to the presence of a demand for a 3D digitization methodology that is both practical, agile, and fast in the field and accurate in its results.
1.2. Research and Paper Objectives
As mentioned, the most consolidated geomatics techniques are not effective for the survey of narrow spaces: both laser scanning and DSLR close-range photogrammetry are regarded as reliable and accurate techniques, yet, in elongated tunnel-like environments they both require acquiring a large number of data (scans or images) that usually makes the job impractical; portable MMS widely available on the market suits the task but are not regarded as reliable due to the drift error that accumulates in long unconstrained acquisitions. They are accurate locally but fail in general accuracy if they are not supported by control measurements.
Complex confined areas are not uncommon and nowadays, acquiring these kinds of places can be necessary in many fields that would benefit from a complete 3D digitization process and extensive photographic documentation useful for restoration, inspection, and monitoring. In Cultural Heritage, there are narrow passages, stairways, and utility rooms; in archaeology, catacombs, and underground burial chambers; in land surveying, there are natural formations such as caves; and in infrastructure tunnels, aqueducts, sewers; or even there is mining. In all these types of spaces, there is a growing need to record 3D geometry, often quickly and recursively, safely, and cost-effectively.
The study described in this paper aims to provide a trustworthy and effective sur-vey methodology for small, tunnel-like areas. Building on a prior study conducted by [
9], the primary goal of the research is to leverage the robustness of SfM and comprehend drift behavior while streamlining the process of capturing large amounts of images in a repetitive tunnel-like environment. The objective was to develop a multi-camera system equipped with fisheye lenses that can collect data quickly, intuitively, and even in the most complex and challenging spaces, producing results that are accurate and reliable enough to meet the requirements of the scale of architectural representation (2–3 cm error).
The key goals to achieve were:
(1) Cost-effectiveness, to be competitive for low-budget applications, for the survey of secondary spaces for which laser scanning cannot be justified, such as geology and archaeology.
(2) Speed-effectiveness: Like the other MMSs, it must speed up the acquisition process regardless of the complexity of the space to be surveyed (narrow and meandering spaces).
(3) Reliability: The time saved on site must not be spent during data elaboration due to unreliable processes. This is probably the most important flaw of today’s MMSs and it is also a problem encountered in the early test with fisheye photogrammetry.
Therefore, the objective was to develop a multi-camera device that is compact, lightweight, and transportable by hand and houses multiple cameras to cover the entire environment in which the device is immersed except for the operator. The cameras should be equipped with fisheye lenses to maximize the field of view and minimize the number of images to be acquired to complete the survey. The compact structure should accommodate the cameras by ensuring a robust fixed baseline between all cameras in the system. The constrained fix design will then allow for automatic scaling of the resulting three-dimensional reconstructions, introducing the relative orientation constraints between cameras and reducing the degrees of freedom of the photogrammetric network.
The paper describes the research that led to the design of a working prototype of a novel instrument, a fisheye multi-camera called Ant3D resulted in a patent in 2020 and that has already been tested and compared multiple times on the field against other approaches [
8,
24,
27].
1.3. The beginning of the Research—The FINE Benchmark Experience
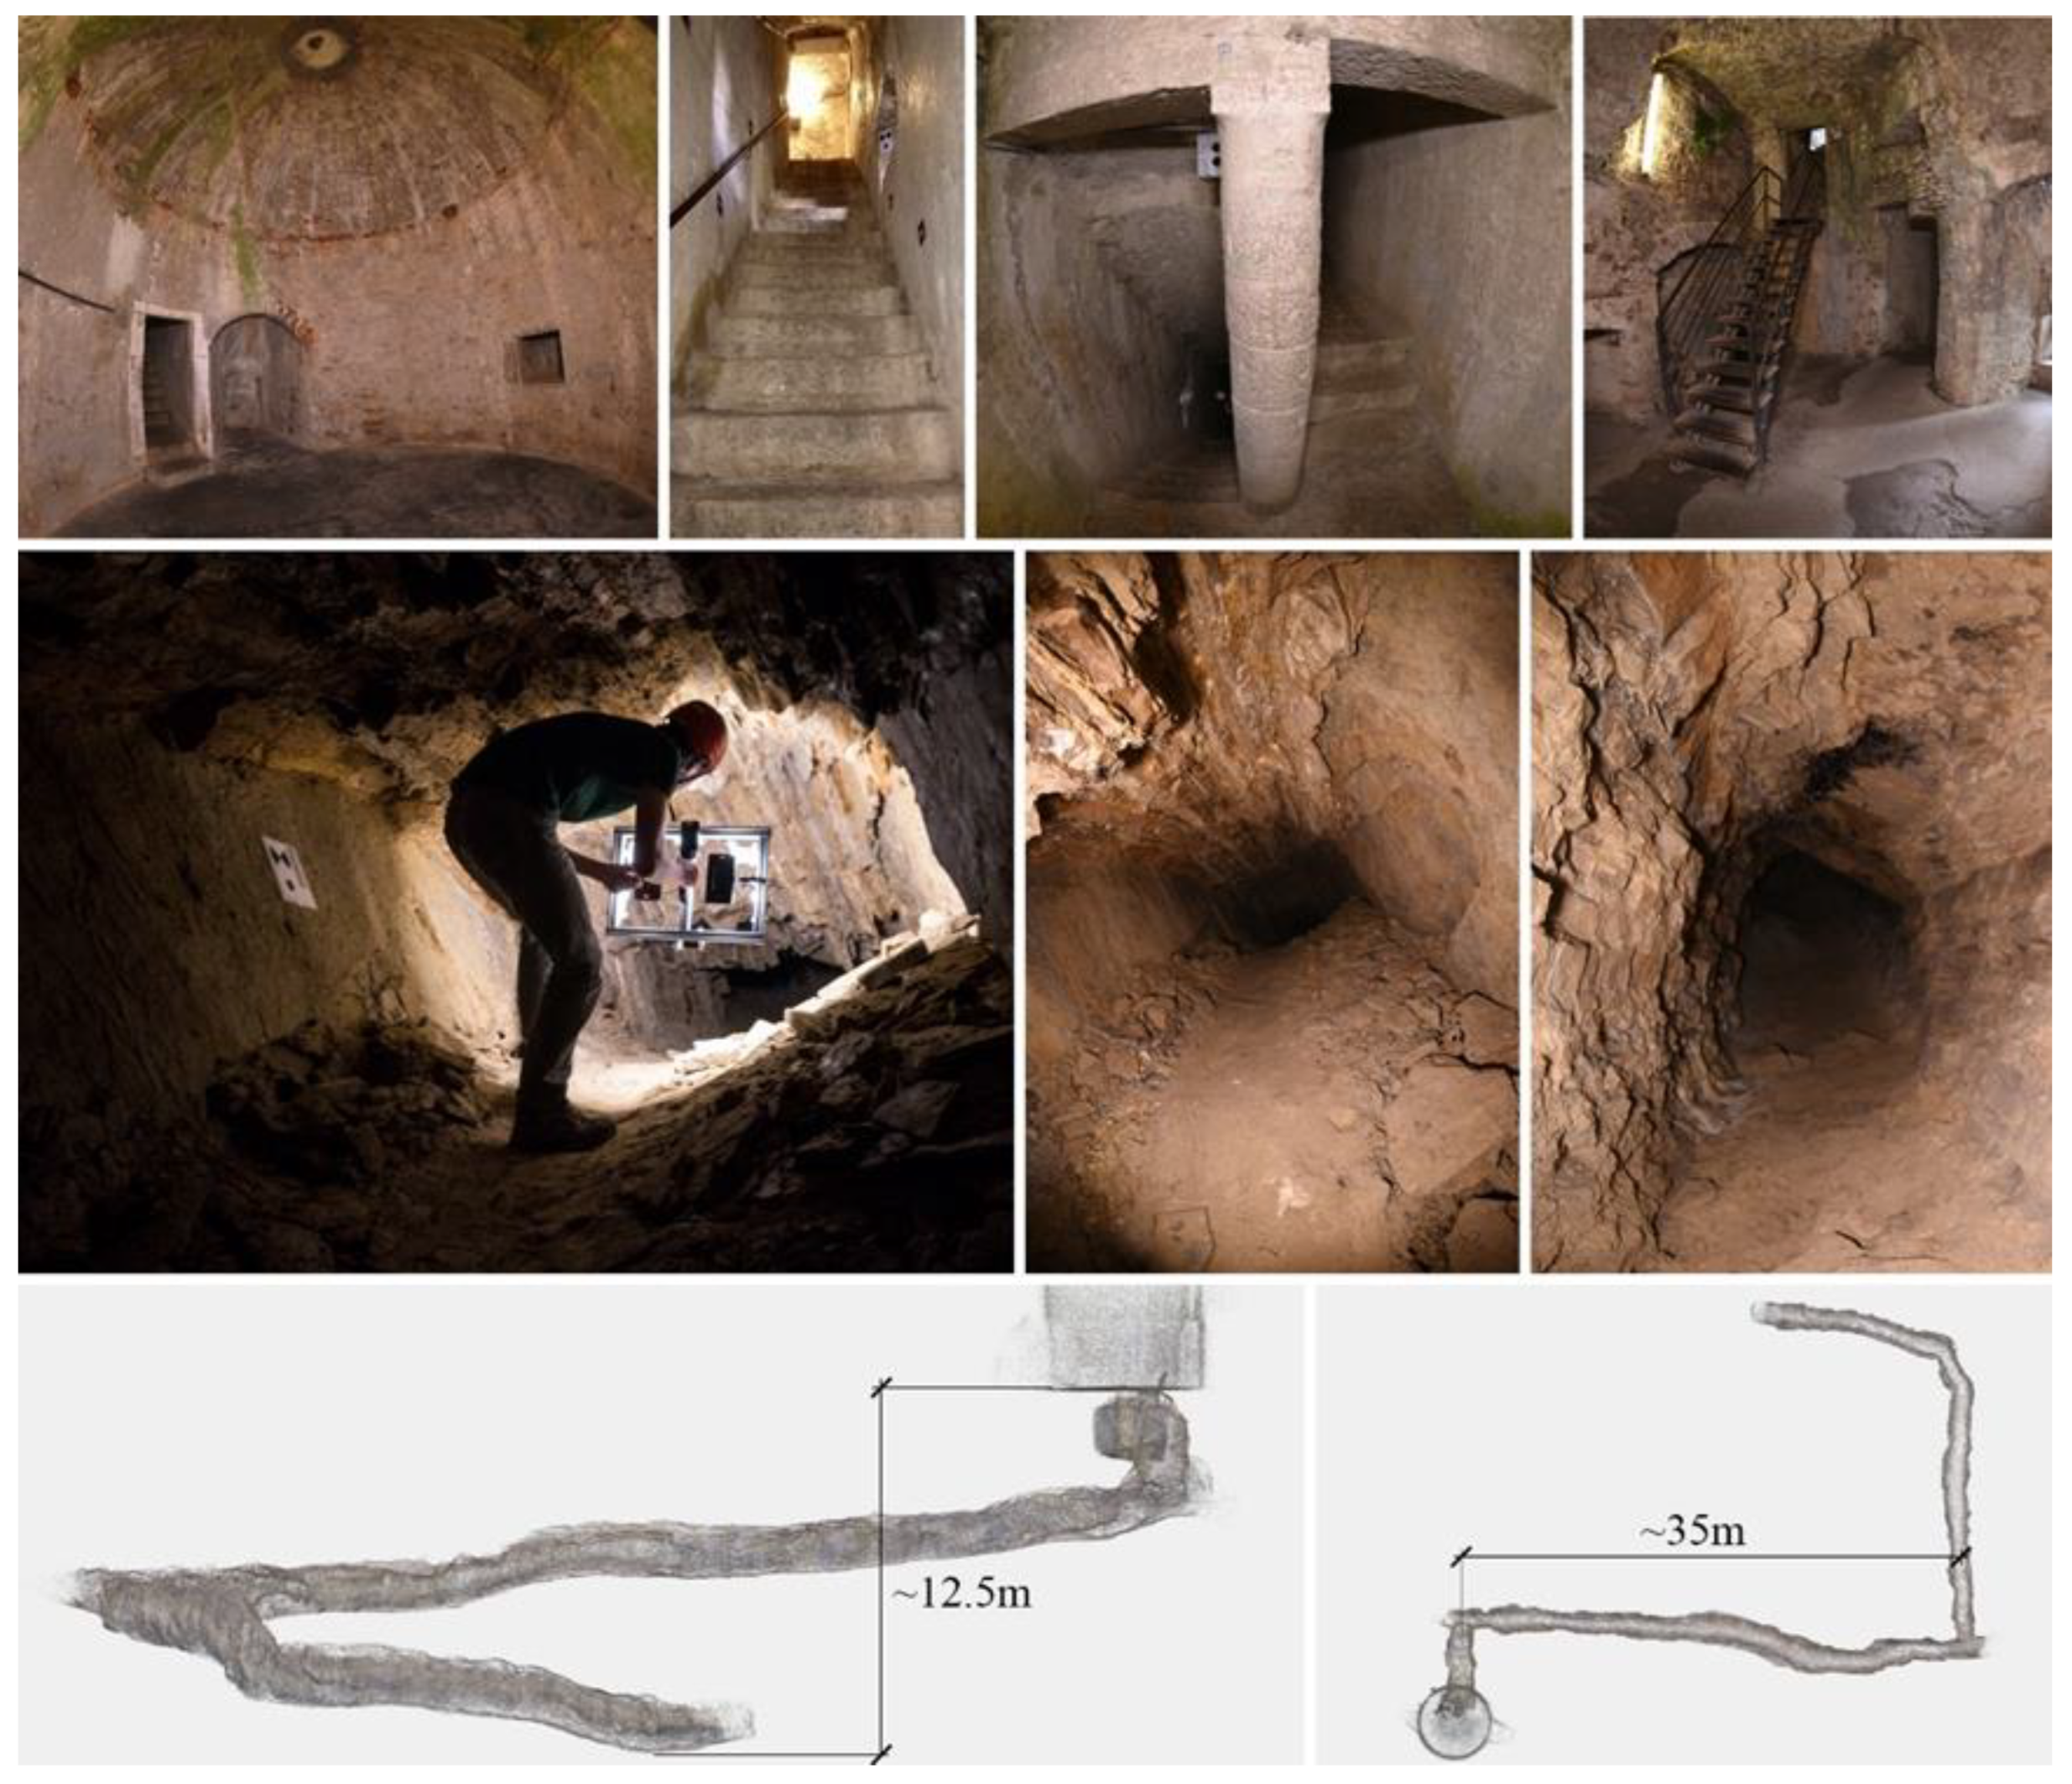
At the beginning of the research interest in fisheye photogrammetry and fisheye multi-camera applications, in 2019, an access-free benchmark dataset was designed to provide a set of data to evaluate the performances of different image-based processing methods when surveying complex spaces, specifically the performance of low-cost multi-camera rigs. The FINE Benchmark (Fisheye/Indoor/Narrow spaces/Evaluation). Participants from academia and research institutes were invited to use the benchmark data and demonstrate their tools, codes and processing methods in elaborating two image datasets for the 3D reconstruction of narrow spaces (
Figure 1). The Benchmark dataset was first presented during the 3D-ARCH 2019 conferences held in Bergamo, where a special session was held specifically for the presentation dealing with the Benchmark.
The benchmark data were acquired in the internal spaces of the Castagneta Tower of San Vigilio Castle, located at the very top of Città Alta (Bergamo, Italy). The case study has been chosen because of the co-existence of challenging conditions that can be exploited to stress the techniques and processing strategies. All the indoor spaces of the castle are poorly illuminated, and the two main environments of the tower includes some narrow passages in the range of 70-80cm wide. They differ in the surface features: artificial, refined flat surfaces for one area; and rough natural rock surfaces for the other.
The benchmark was composed of two datasets referring to the two connected environments:
(1) Tunnel: a dark underground tunnel (around 80 meters long) excavated in the rock, with a muddy floor, humid walls. In some areas, the ceiling is lower than 1.5 meters.
(2) Tower: an artificial passage composed of two rooms with a circular / semi-spherical shape that are connected by an interior path, starting from the tower’s ground floor and leading to the castle’s upper part, constituted of staircases, planar surfaces, sharp edges, walls with squared rock blocks and relatively uniform texture.
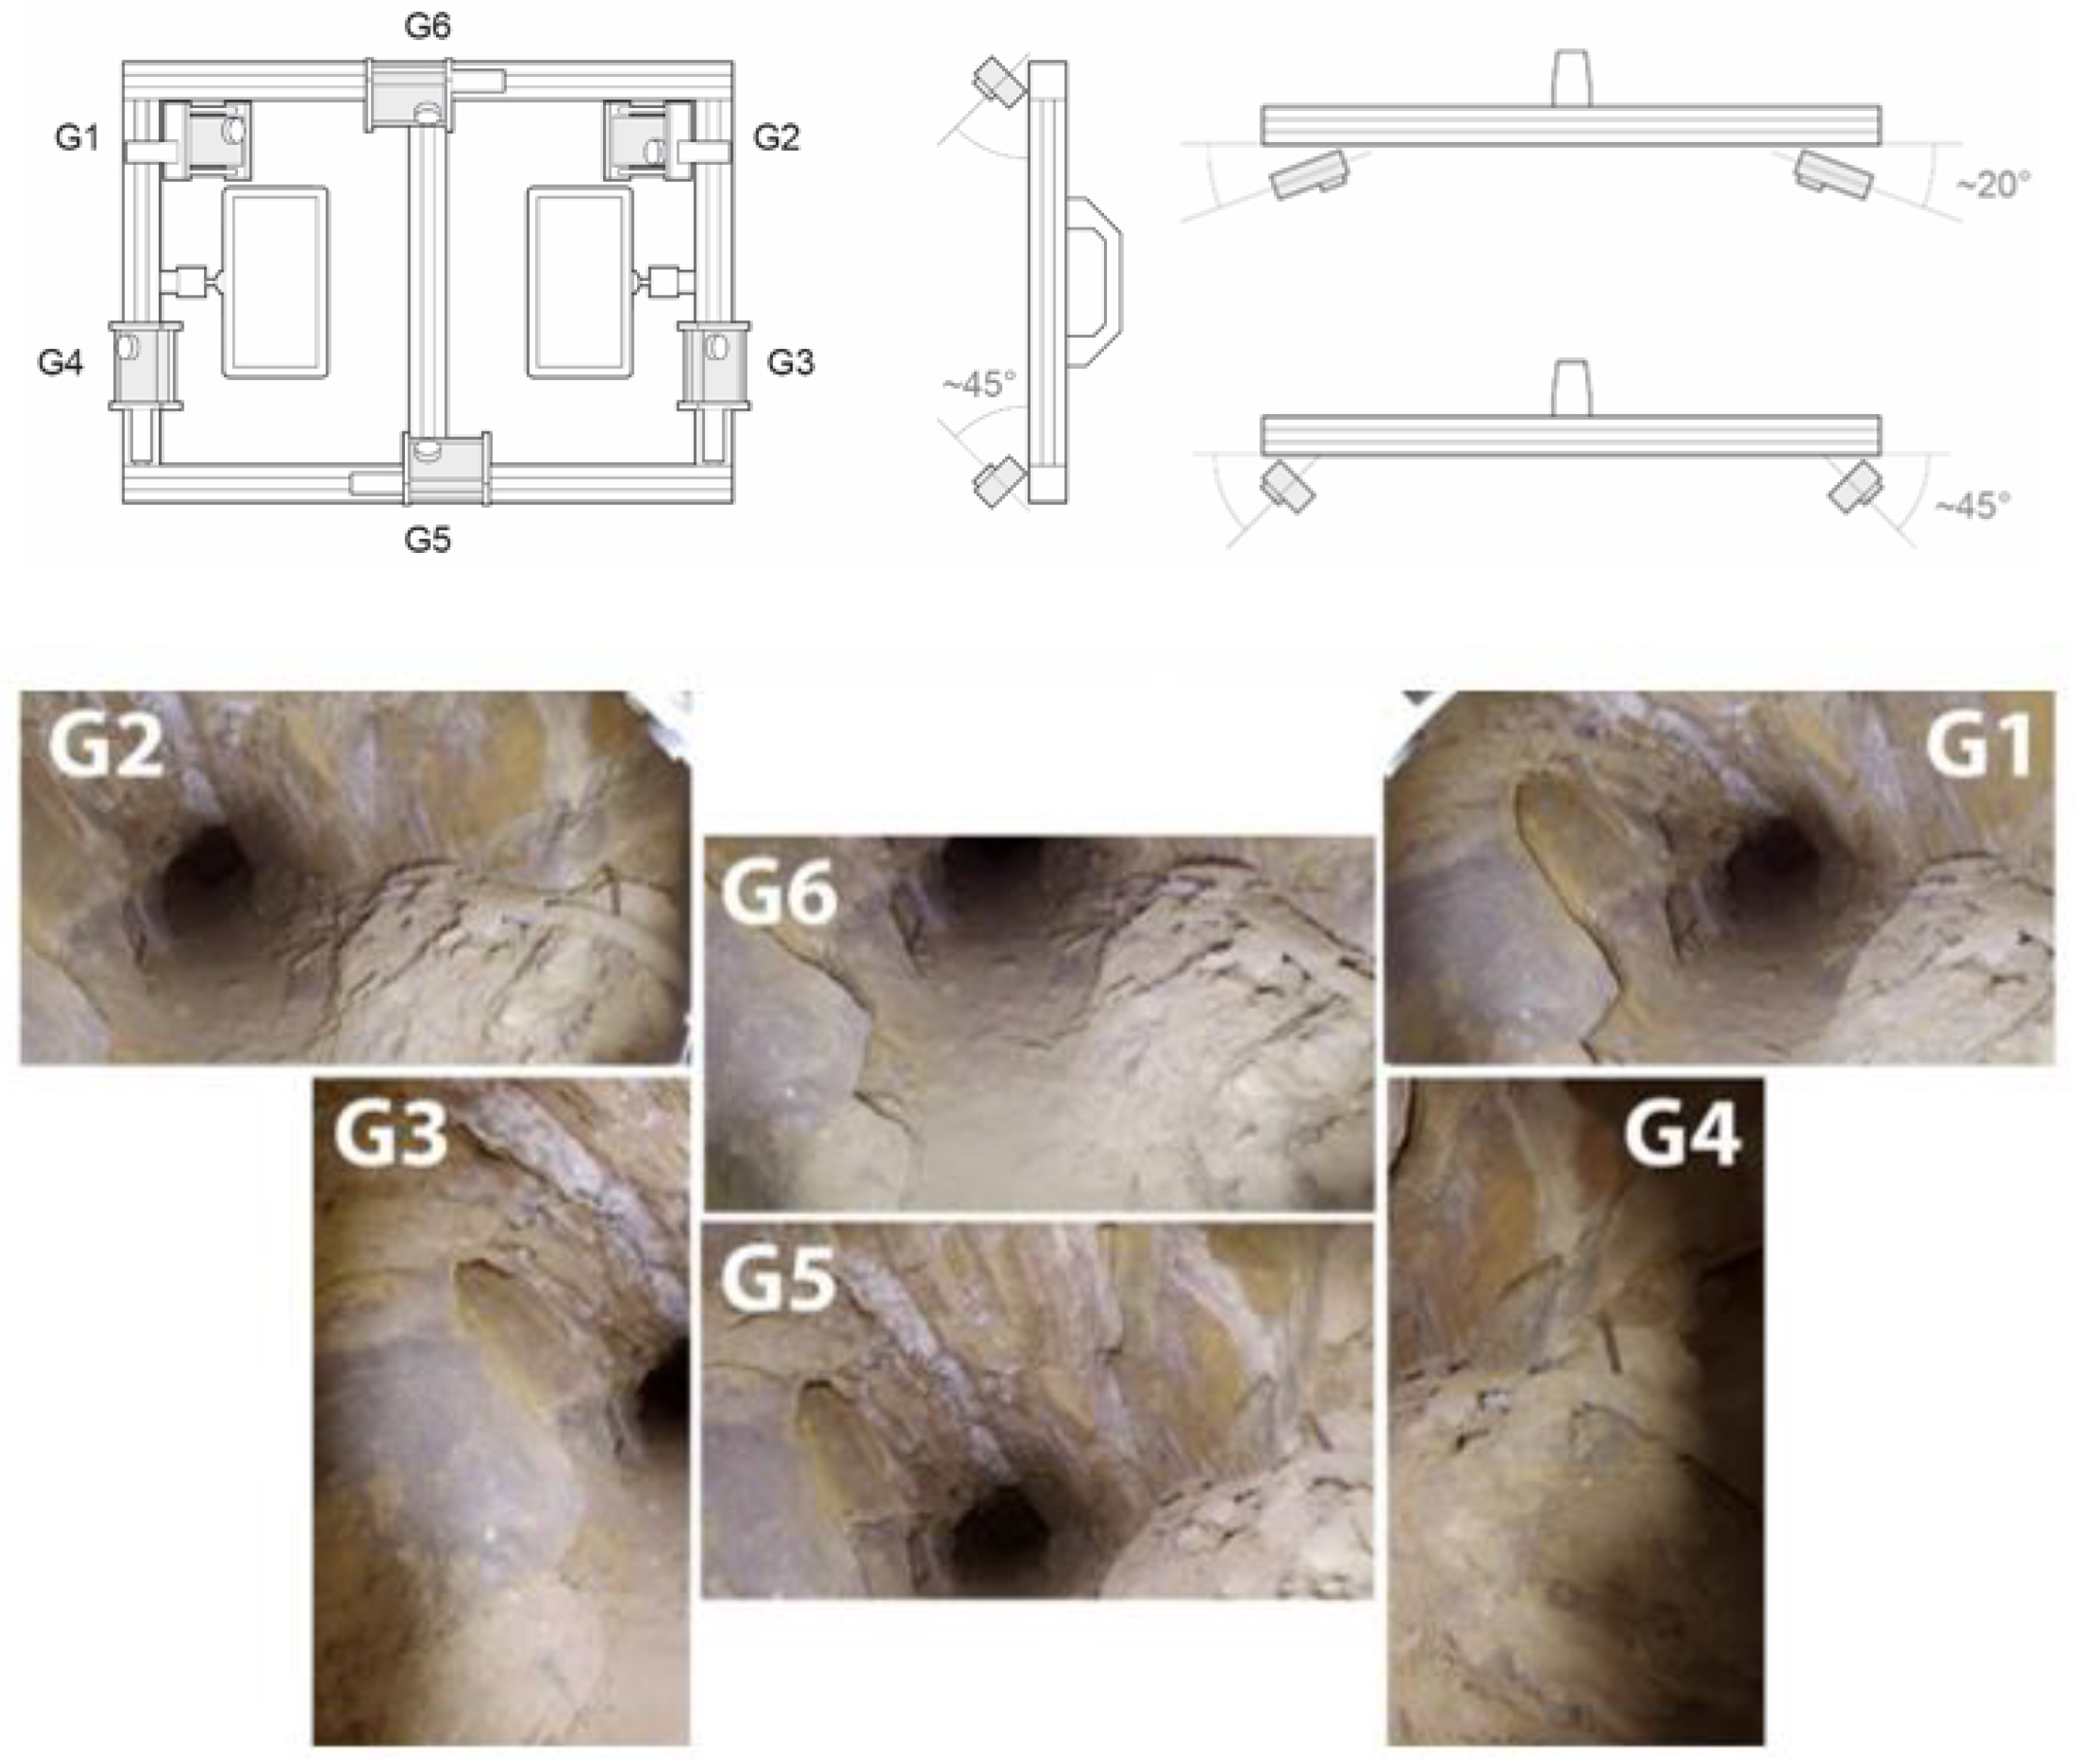
The FINE Benchmark provided several data including the image datasets and a laser scanner ground truth point cloud. For the acquisition of the low-cost multi-camera datasets, an array of action cameras was used to perform a rapid video acquisition of both the tunnel and tower areas. The rig consists of six GoPro cameras mounted rigidly on a rectangular aluminium structure (
Figure 2). Continuous light is provided by two LED illuminators mounted on the back.
The rig was designed to have a sufficient base distance between the six cameras in relation to the width of the narrow passages. The design was thought to reconstruct the object geometry at every single position of the rig. Two cameras are mounted on the top (G6) and the bottom (G5) of the structure, tilted roughly 45° degrees downwards and upwards. Four cameras were mounted on the rig's sides, two of them (G1, G2) in a convergent manner oriented horizontally, and two in a divergent way (G3, G4) oriented vertically.
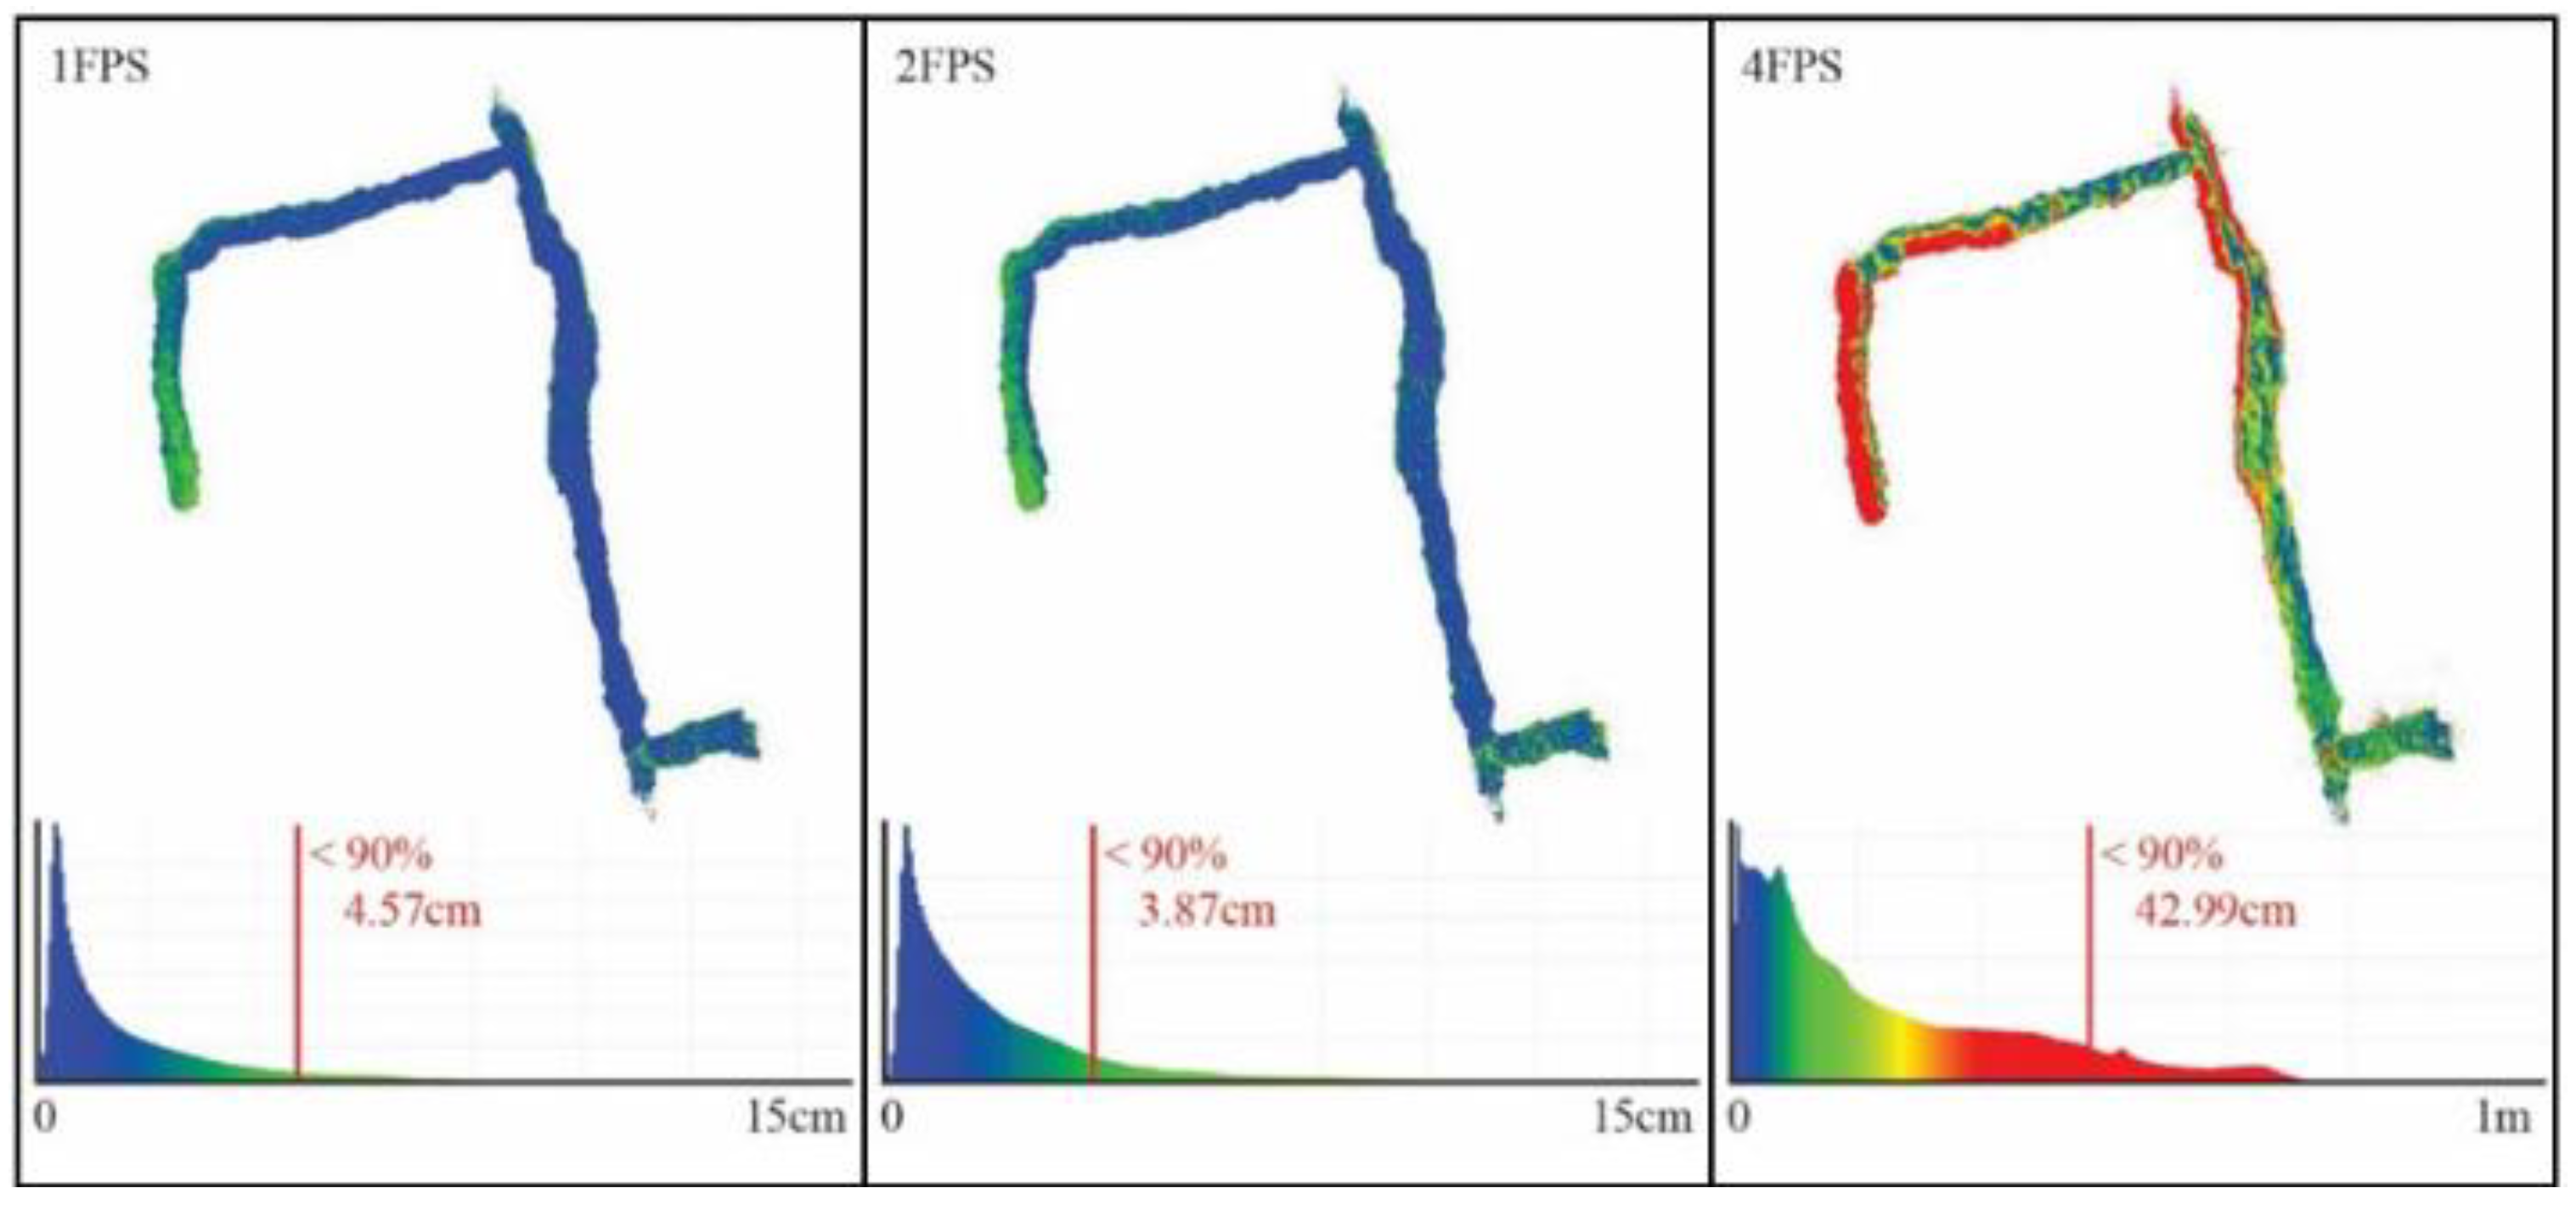
The FINE Benchmark provided the basis for an in-depth test of the low-cost multi-camera approach. The processing carried out by the author comprises the synchronization of the individual video sequences of the six GoPro cameras using the audio tracks available and the subsequent extraction of timestamped keyframes to form the image datasets to be used for SfM. The obtained images were then processed using a pipeline implemented with the commercial software Agisoft Metashape that accounts for rigid constraints of the known baselines between the cameras. Different keyframe extraction densities were tested during the testing, namely 1 fps, 2 fps, and 4 fps. The evaluation of the resulting 3D reconstruction of the processed datasets was performed in two ways: (i) by checking the error on checkpoints (CPs) available along the narrow environments and extracted from the ground truth laser scanner point cloud and (ii) by checking the cloud-to-cloud deviation of the obtained sparse point cloud from the reference ground truth. For both evaluations, the multi-camera reconstructions were oriented with the reference point cloud using a few ground control points (GCPs) at the tunnel start in order to check the maximum drift at the opposite end.
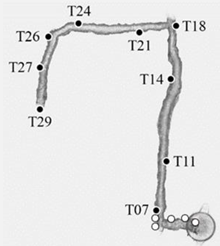
Table 1 shows the error on the checkpoints resulting from the 3D reconstruction of the tunnel environments for the 1, 2, and 4 fps datasets.
Figure 3 shows their relative cloud-to-cloud deviation from the laser scanner ground truth point cloud. For all results reported, the baselines between the cameras were rigidly constrained in the bundle adjustments exploiting the scalebar function available in Metashape. Overall, the error obtained exceeded the target accuracy, and the processing presented a great degree of unreliability.
The FINE Benchmark's experience revealed several problems with the multi-camera implementation based on a commercial action camera. Nevertheless, the results confirmed the potential of the image-based multi-camera approach, allowing the complete acquisition in a short time despite the complexity of the environment. However, reaching architectural accuracy (2-3cm) was impossible without using the coordinates of known points measured with the total station to optimize the three-dimensional reconstruction.
The main limitations were:
(1) the geometry of the multi-camera. The used configuration, consisting of six GoPro cameras oriented mainly in the frontal direction combined with the surface roughness of the rock walls, has resulted in an insufficient number of tie points to connect the images acquired in the forward direction with those obtained in the backward direction.
(2) The rolling shutter of the sensors used. The introduction of distortions due to the acquisition in motion and the use of rolling shutter sensors has led to not being able to accurately calculate the camera's internal orientation parameters and not being able to impose constraints on the relative orientation of the cameras without a high uncertainty. Nevertheless, the constraints on the distances between the cameras were effective in reducing the drift error compared to non-constrained processing.
The FINE Benchmark experience highlighted how, in order to achieve the aforementioned goals, a custom system was necessary to overcome the low-cost hardware limitation. The following chapters describe the hardware and design choices that led to the definition of the current system.
2. Materials and Methods
In designing the multi-camera system, the analysis considered together both the fisheye mapping function characteristics specific to the hardware in use and the environmental characteristics of the targeted applications for the system. The proposed multi-camera design was optimized for the following target environments, which is thought to be a good approximation of common narrow spaces: a tunnel measuring 1m width by 2m height. The main topics tackled are (i) the multi-camera stability with movements, (ii) the multi-camera calibration of both interior orientations and relative orientations of the cameras, and (iii) the design of the multi-camera arrangements, i.e., the optimal rig geometry for the multi-camera-system derived through a study on the GSD distribution in object space accomplished through simulation.
2.1. Materials
The hardware used throughout the investigation is composed by 5 industrial-grade RGB cameras: the FLIR BlackFly S U3-50S5-C, each equipped with a 190° circular fisheye lens SUNEX PN DSL315. The cameras mount global shutter 5-megapixel sensors, and the lens was chosen so that the image circle would fit the sensor, keeping almost the entirety of the field of view. As highlighted from the FINE Benchmark experience, the global shutter sensors and the possibility of accurately triggering the shots were needed to guarantee multi-camera stability in the presence of movement. The 5-megapixel resolution was chosen based on the narrow nature of the target environment, not requiring high-resolution images to grant acceptable GSD, and based on the need to contain computation effort in processing a high number of images.
2.2. Multi-Camera Stability with Movements
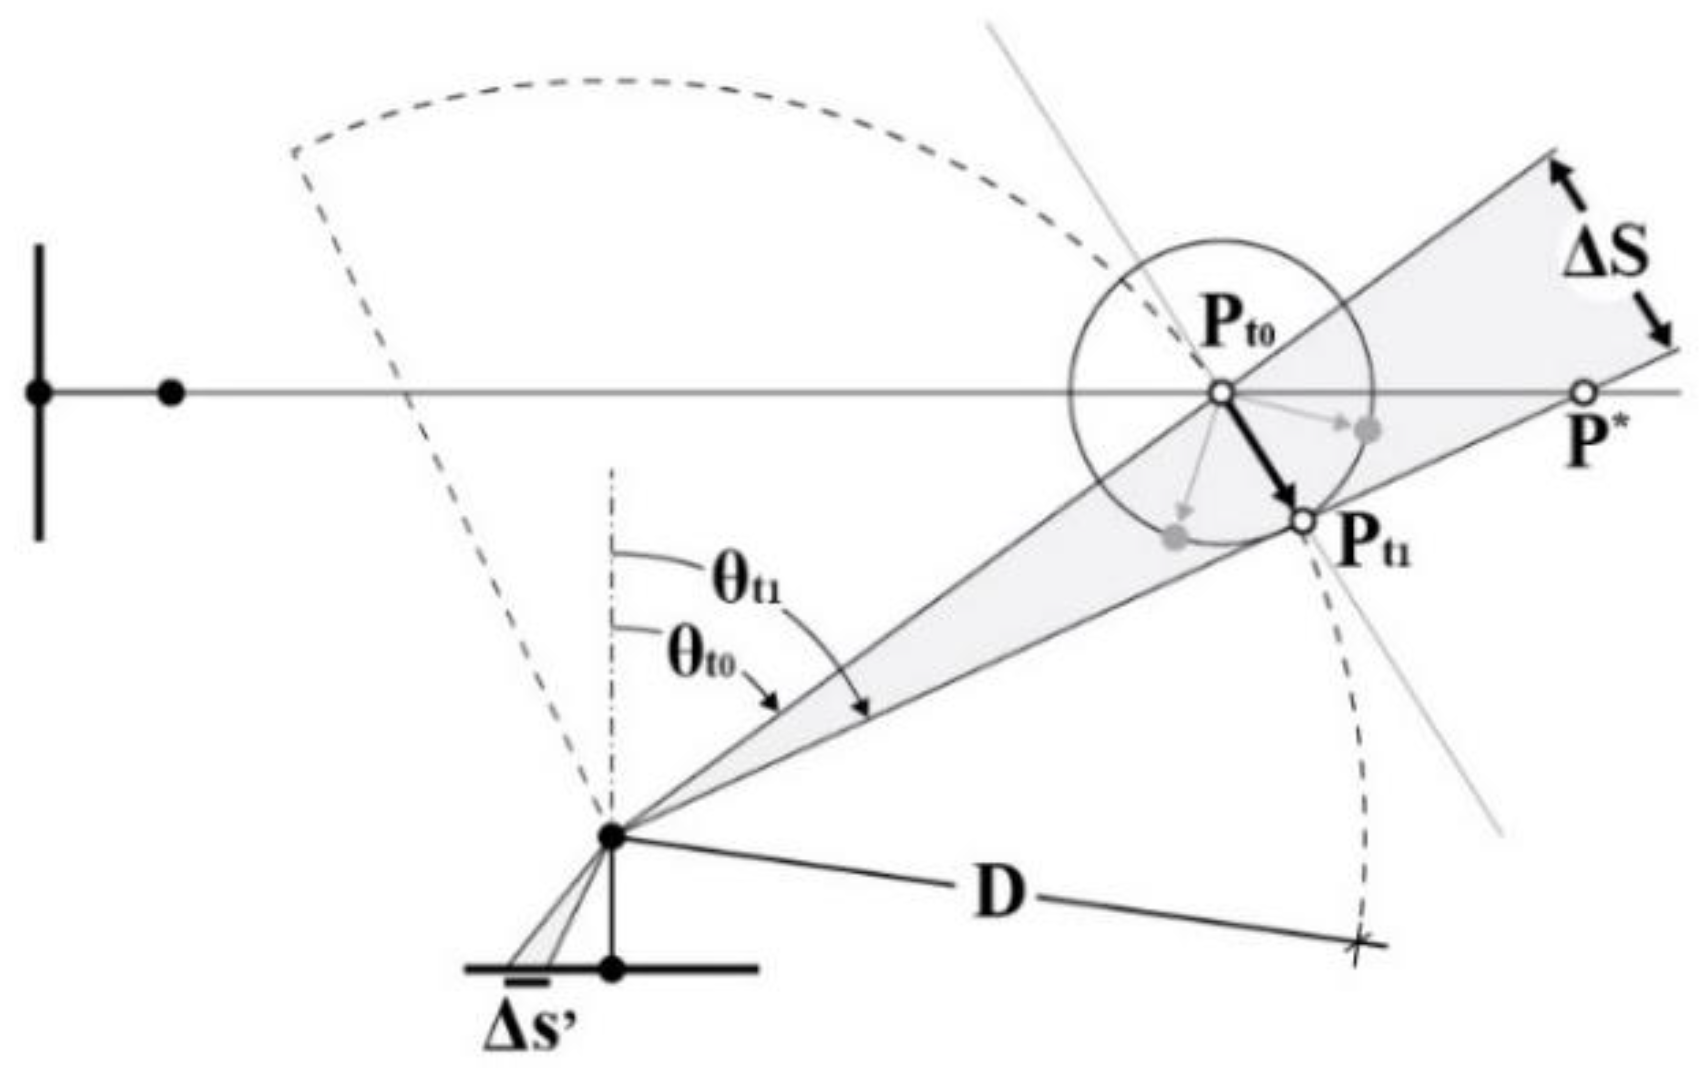
In designing the improved multi-camera rig, the first problem addressed was the lack of frame synchronization experienced in the previous tests with the action cameras. The problem has been tackled by defining a maximum threshold for the displacement error of a given object point in image space due to the synchronization error and the presence of relative motion between the object and the camera rig. This threshold has been set to the size of 1 pixel so that it would not be detectable in the images. Then, also considering the effect of the fisheye mapping function, the maximum synchronization error that would generate a displacement of 1 pixel in image space in the operational conditions (movement speed: 1m/s, camera-to-point minimum distance: 1m) is derived.
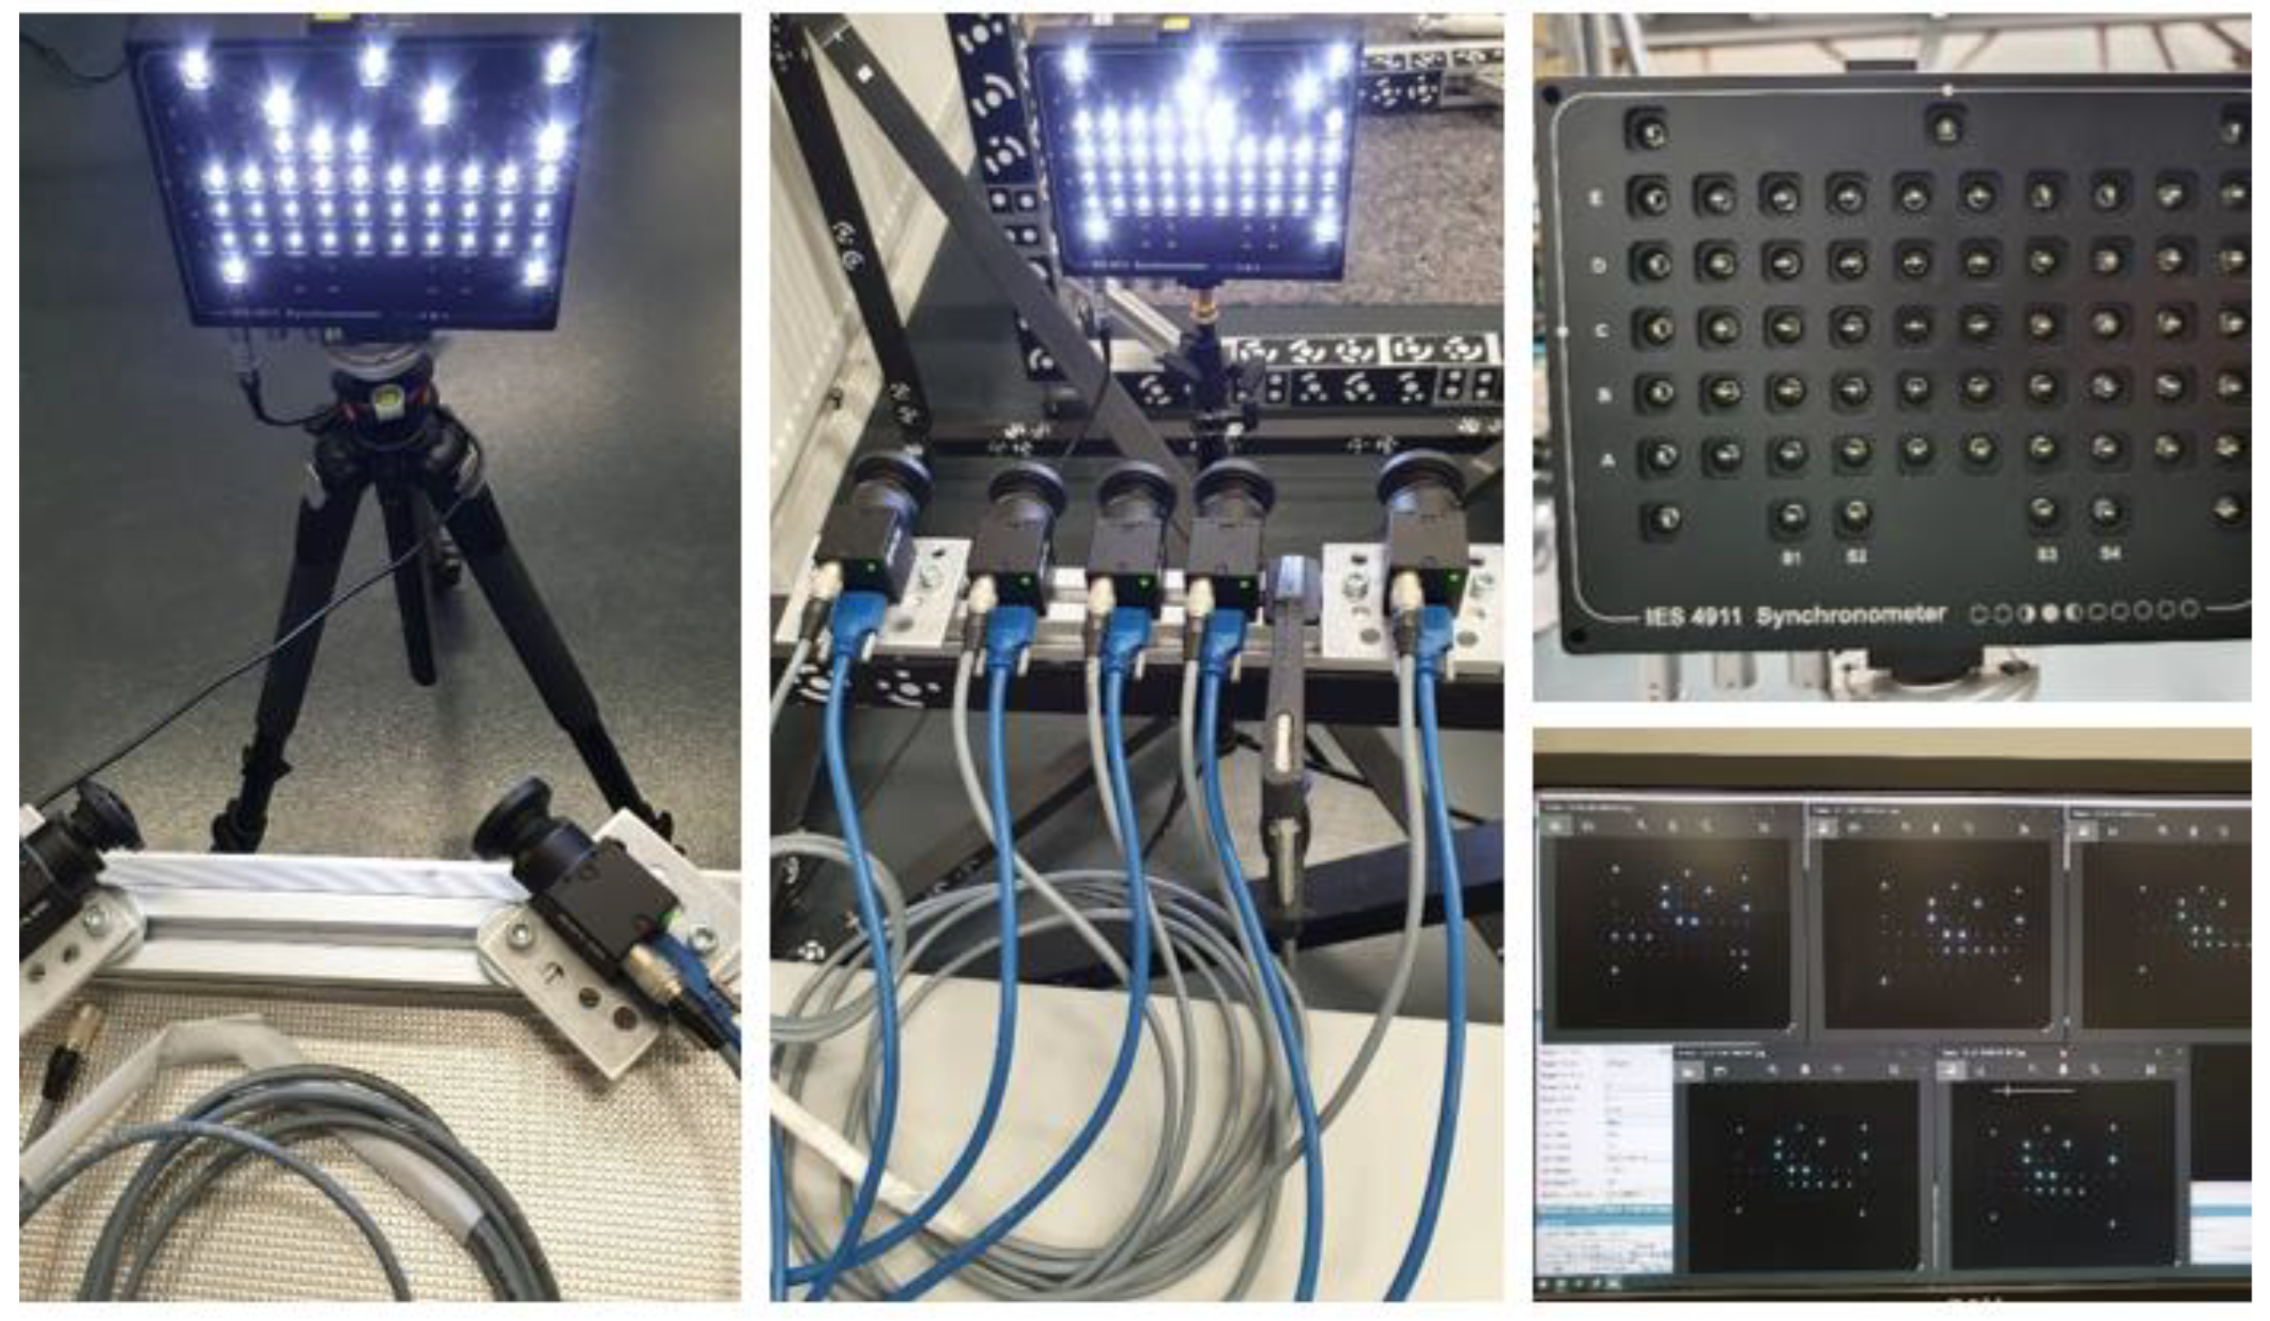
Then, the actual synch error of the multi-camera system was measured with the aid of a synchronometer that can measure synch error up to 10 μs. The device works by emitting intermittent light pulses precisely spaced; by acquiring a sequence of multi-images of the device, it is possible to read out eventual delays in the camera captures. The synchronization test is passed if the multi-camera asynchrony is lower than the computed maximum synchronization error.
The same framework also applies to the computation of the minimum exposure time for the cameras so that no motion blur can be detected in the presence of relative movements between the subject and the rig. As for the maximum synchronization error, the minimum exposure time is the exposure time that causes a displacement of scene points in image space to the threshold value of 1 pixel in the target operational condition, and it also considers the effect of the fisheye mapping function.
Chapter 3.1 provides a framework for computing the maximum synch error and minimum exposure time considering the fisheye mapping function (Figure 8), together with the results of the synchronization error measurement.
2.3. Multi-Camera IO and RO Calibration Method
The stability of the global shutter sensors, together with accurate frame synchronization, allows for the accurate and reliable computation of the Interior Orientation (IO) parameters for each camera and the relative orientations of the secondary cameras with respect to the primary.
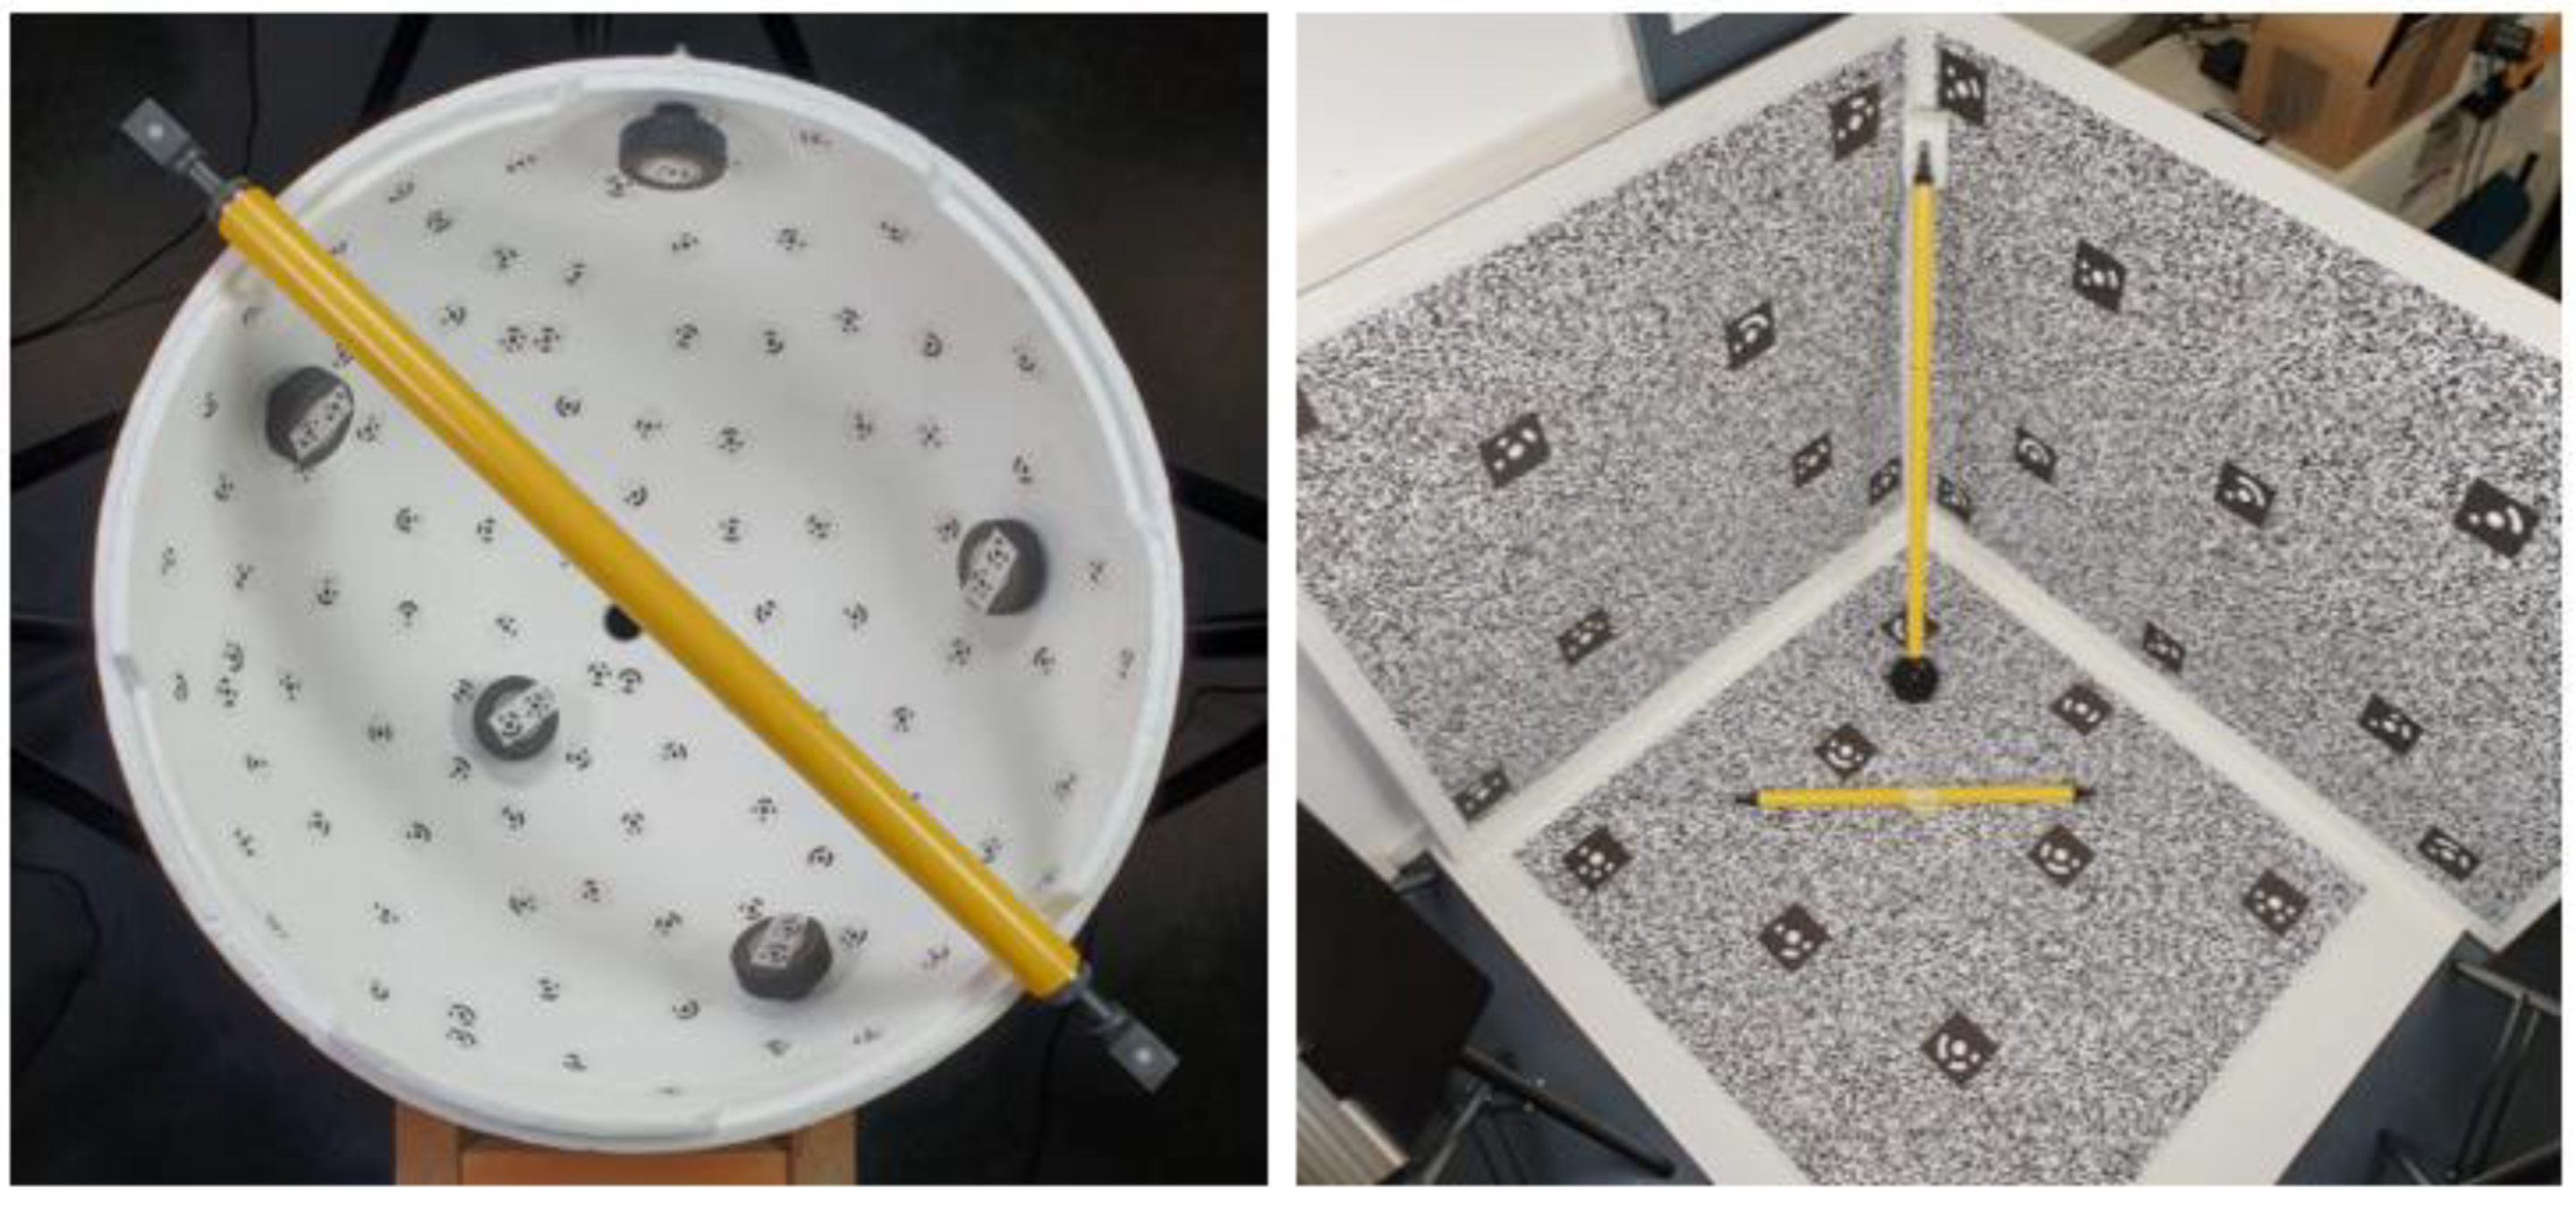
The IO calibration will be performed for each camera composing the rig. To achieve a reliable calibration, two different calibration test fields were compared with the aim of defining the ideal one: the first one is a texture-less semi-sphere covered in coded targets (
Figure 4 – left) as used by [
28] while the second one is a corner-shaped highly textured test-field (
Figure 4 – right). For both the test fields, reference 3D coordinates of some markers were measured by conducting a monocular photogrammetric acquisition with a DSLR scaled using reference invar bars. The monocular photogrammetric processing yielded the reference coordinates for both test field markers to an accuracy of around 0.2mm (accuracy of the reference bars). Later, these coordinates were used to scale the calibration acquisitions performed with the fisheye cameras and control the result. For the comparison of the two test fields, a calibration was performed for just one camera before conducting the calibration for all cameras with the best-performing method. The fisheye calibration acquisition was performed by rotating the camera around the test filed and by rotating it in all different directions. For the semi-spherical test field, the camera was roughly positioned along the imaginary other half of the semi-sphere and pointing to the test field with the optical axis pointed to the center of the sphere; during the acquisition, the camera was also rotated around its optical axis (roll). Roughly the same approach was followed for the corner-shaped test field by moving the camera over an imaginary semi-sphere.
Other than the internal orientation parameters, the camera’s relative orientations can also be calibrated and used as constraints during the system deployment to reduce the degree of freedom of the photogrammetric network. The relative orientation relationship between the cameras allows us to constrain the baselines between them as well as their rotations.
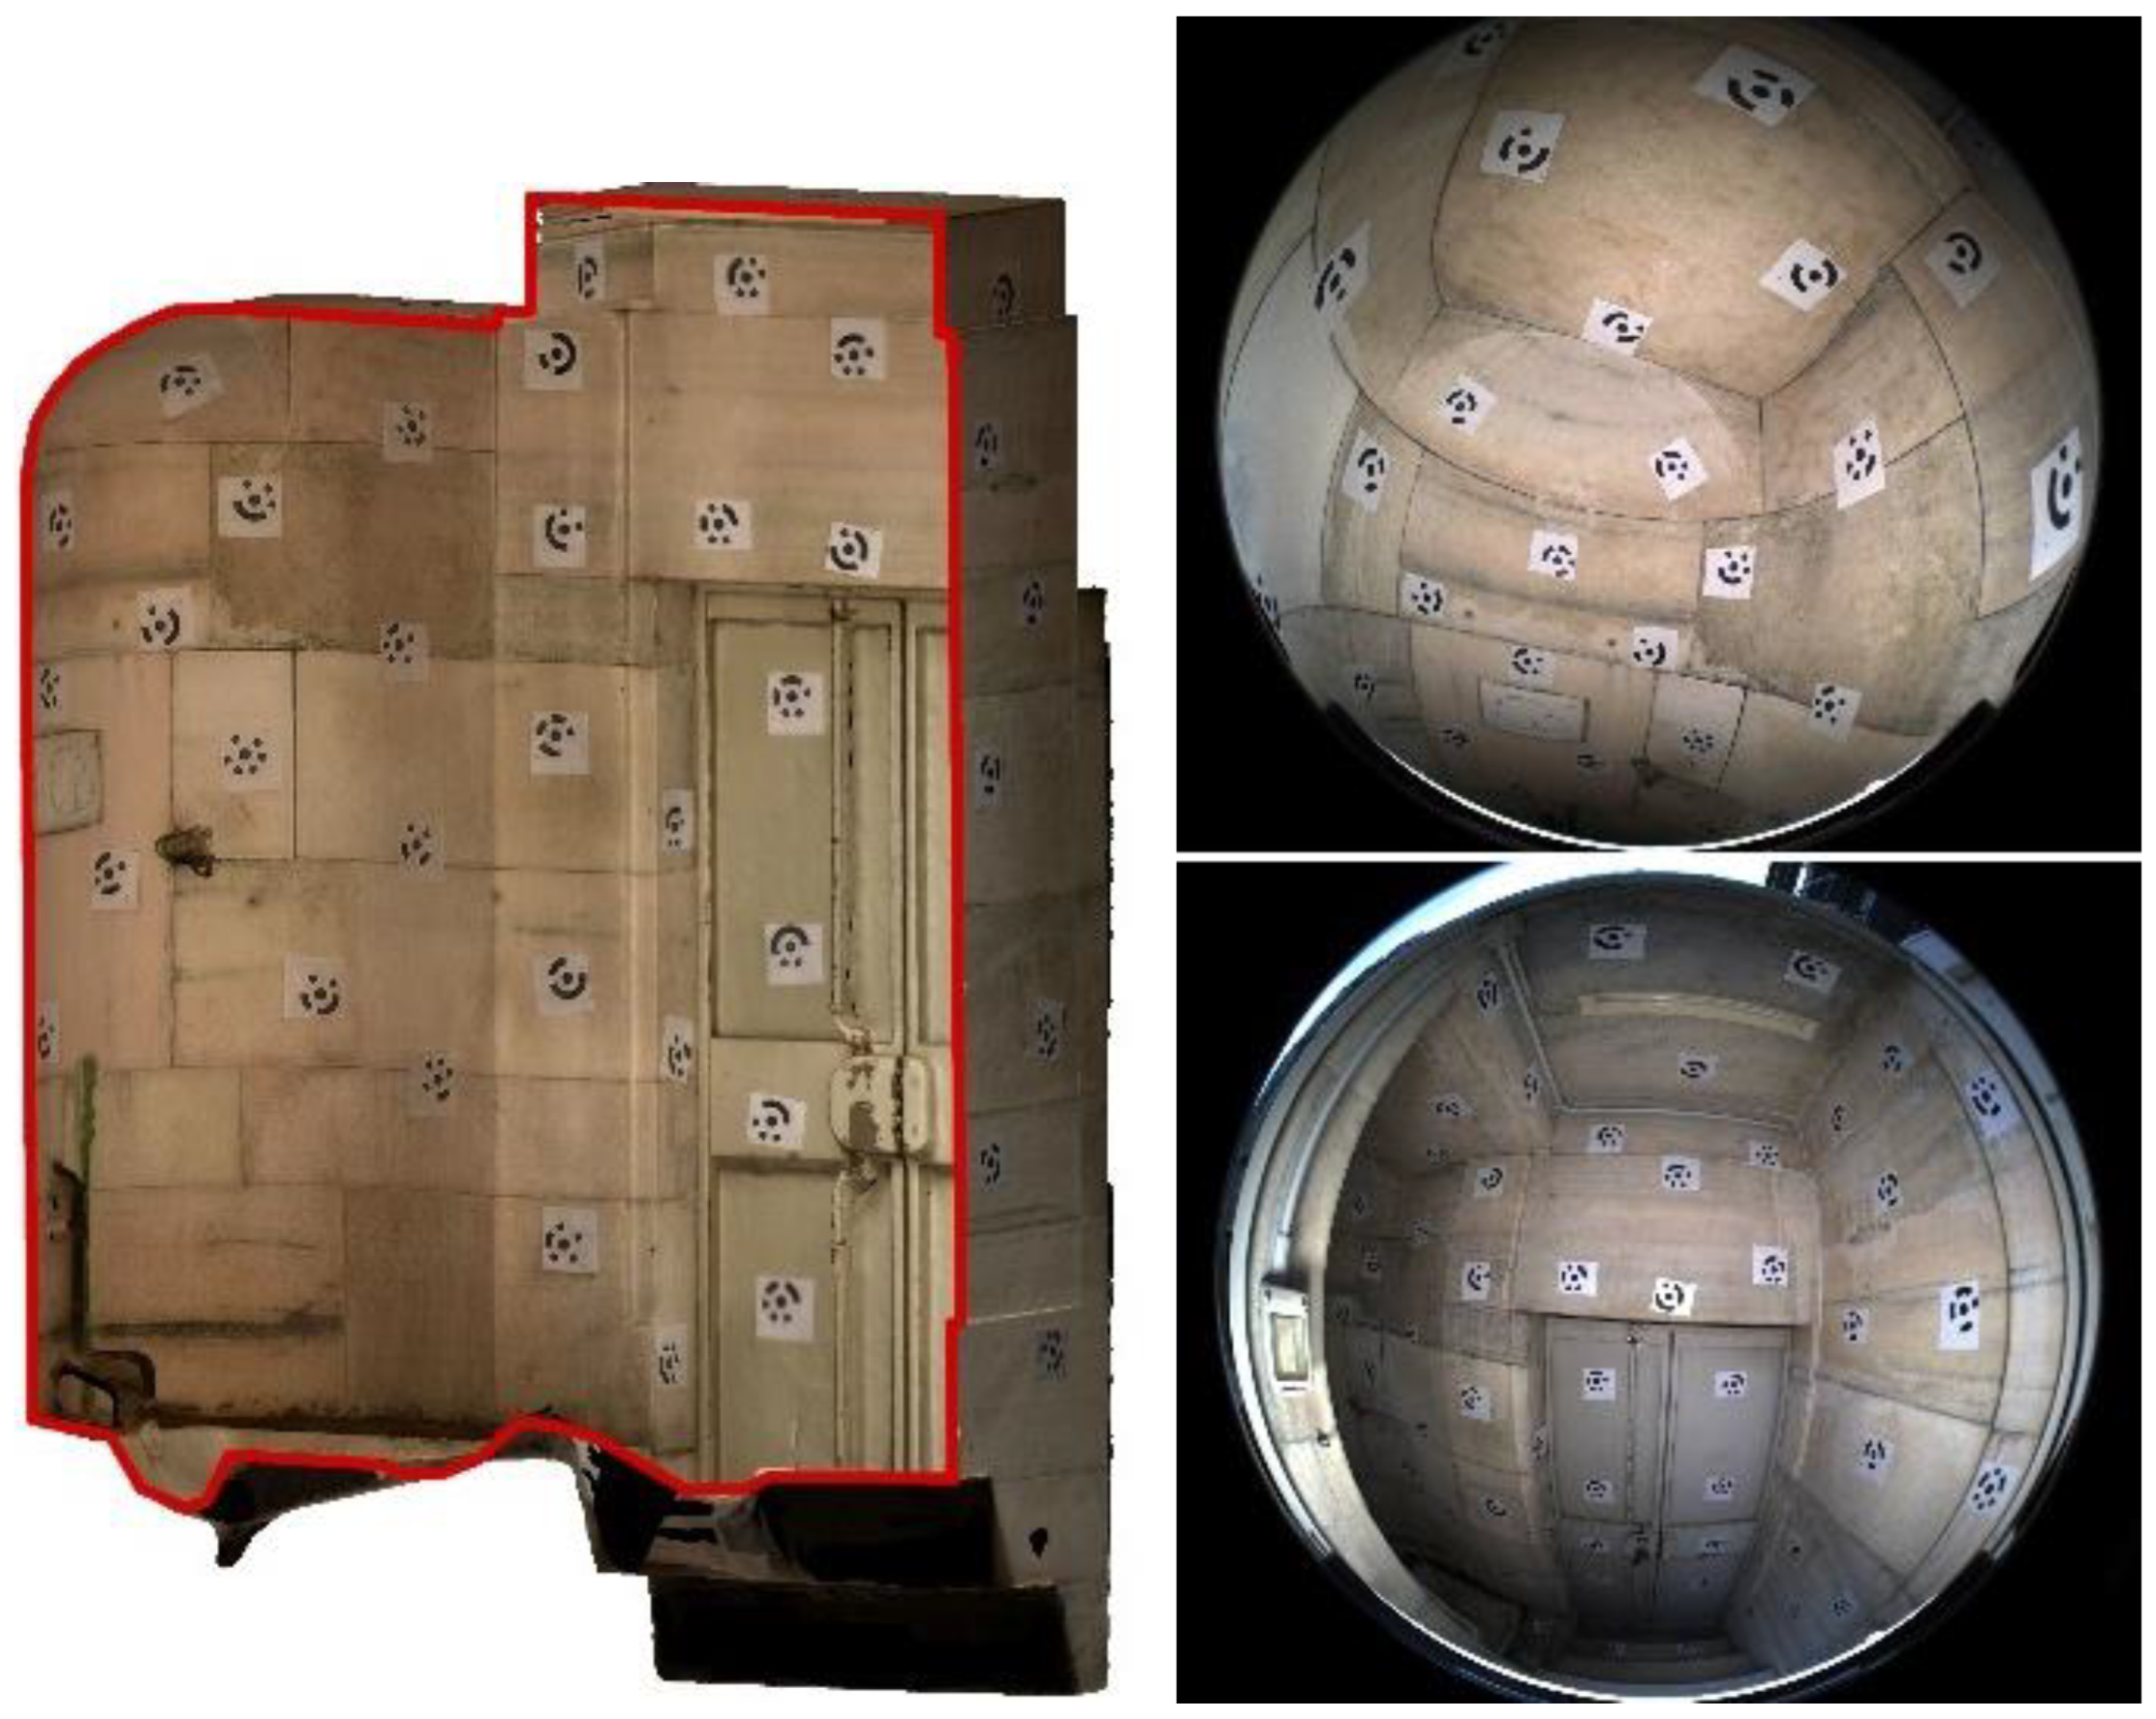
The RO calibration process is performed using Agisoft Metashape in a pipeline like the one already described for the single cameras’ calibrations. That is, by performing a photogrammetric acquisition with the assembled multi-camera system of a known test field that is preferably a small “room” of similar dimensions as the size of the environment the system is intended to be used (
Figure 5). The multi-camera acquisition is then processed to the best possible orientation of the image network. From the estimated coordinates of the oriented cameras, the calibrated RO is computed through Metashape. Reference coordinates for the targets are used half as a constraint to scale the reconstruction and half as a check.
2.4. Designing the Multi-Camera Arrangement
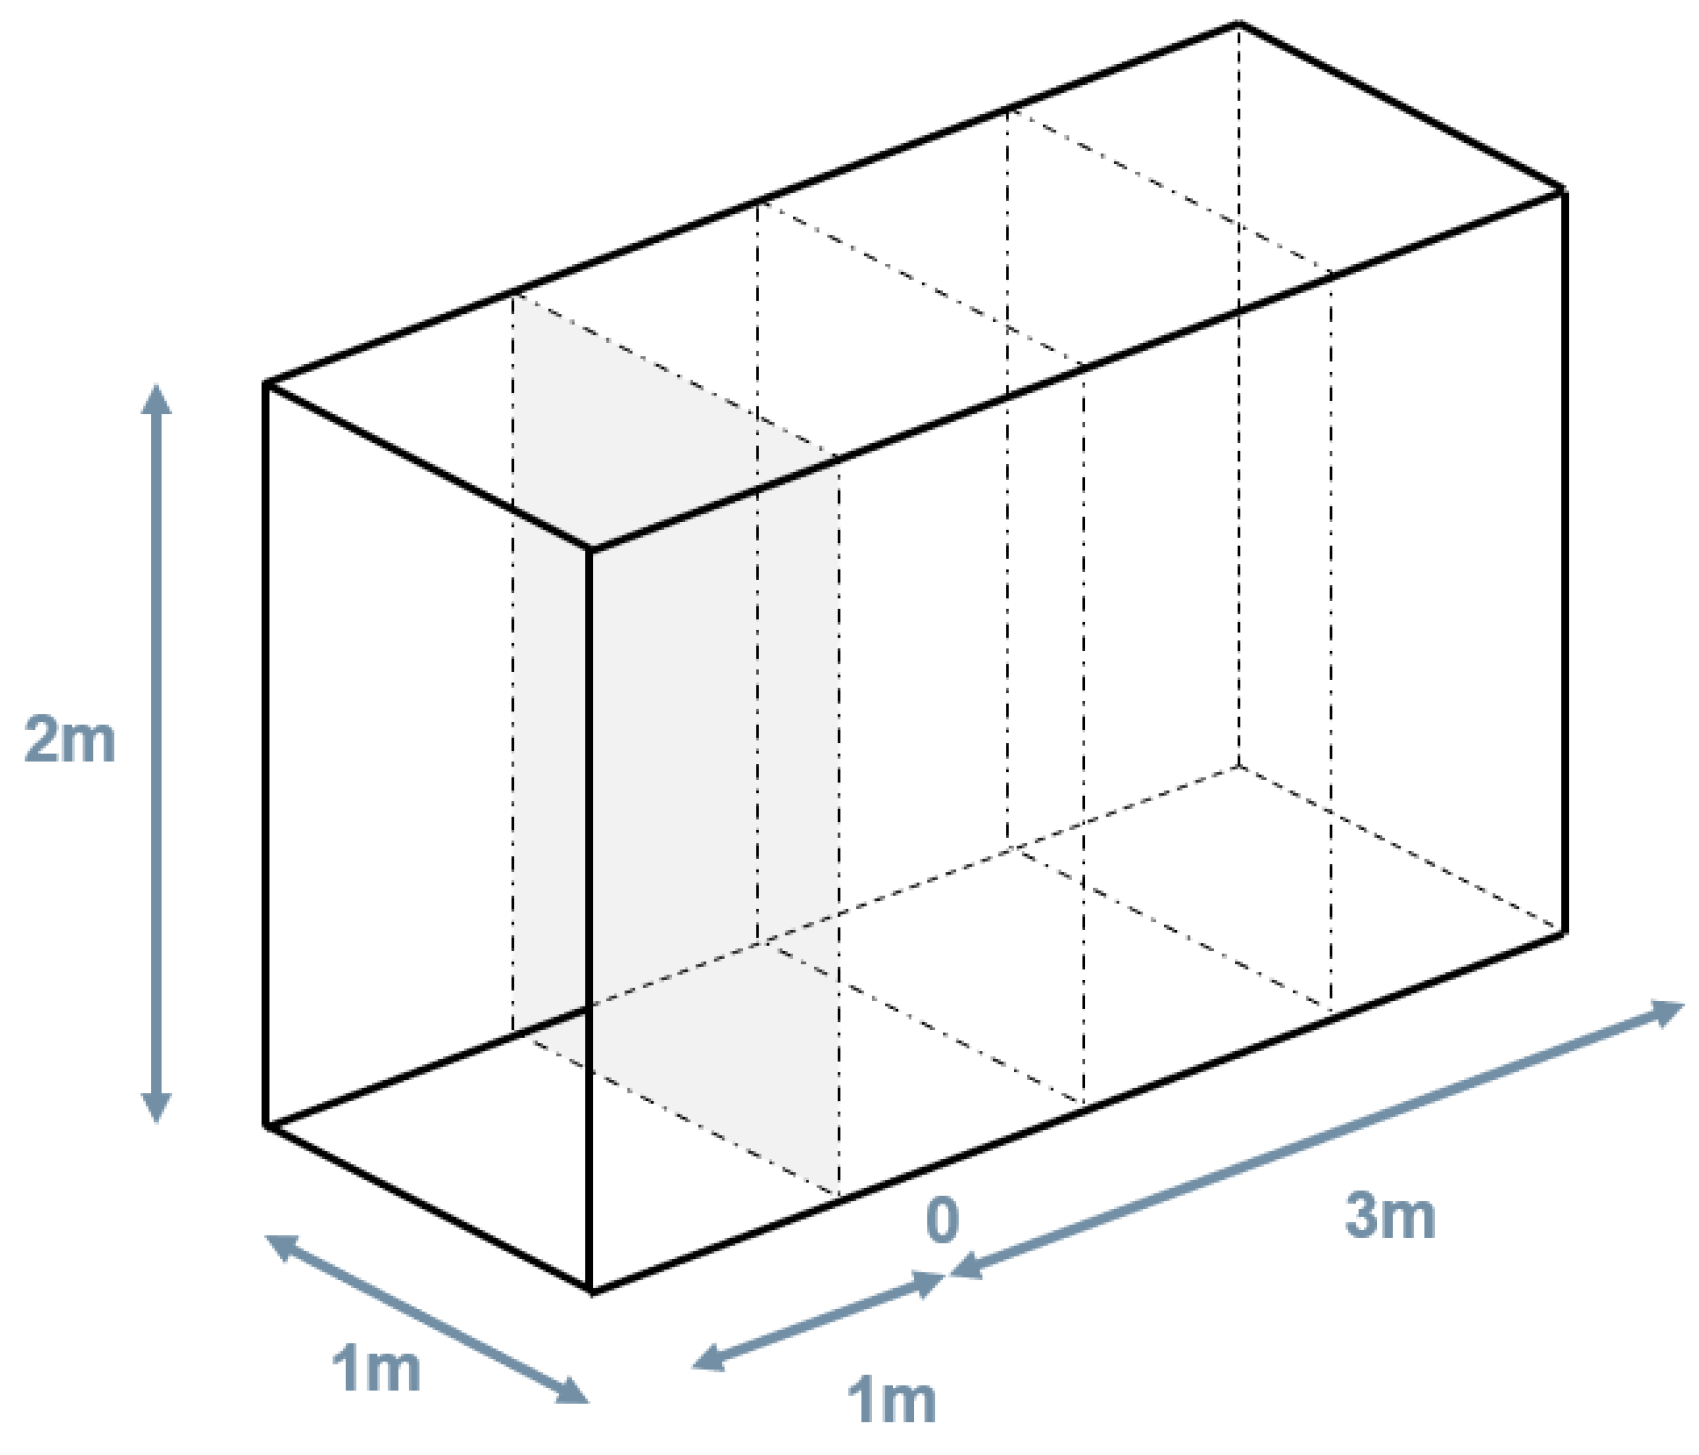
The study to define the multi-camera rig geometry that is improved from the rig geometry used in the FINE Benchmark is firstly based on some practical considerations and lessons learned. Subsequently, pre-defined geometries that have been considered reasonable are compared based on their GSD performance, considering, therefore, the relationship between the camera’s angles and environment geometry for which the multi-camera is intended. In this test, the environment is defined as a synthetic dataset of points equally spaced on the surface of a tunnel-shaped parallelepiped of cross-section w:1m x h:2m. The synthetic dataset of 3D points is used to simulate the projection of each point onto the image plane of one or more simulated cameras. The simulated cameras can be modified both in their internal properties, e.g., principal distance and mapping function, and in their external orientation.
Initial considerations to define the reasonable arrangements to compare were (i) the rig dimensions and (ii) the choice of avoiding framing the operator and the light sources within the FOV of the cameras. On the lesson learned side, the FINE Benchmark highlighted the importance of connecting the outward acquisition with the return acquisition, and this requires planning the incidence angle of the camera’s optical axis to the surface walls. It is important that the images from the two directions of acquisition framing the same area on the walls of the tunnel are not too different, especially in the scenario of rough surfaces.
These initial thoughts led to the definition of the reasonable multi-camera configurations represented in
Figure 6. These arrangements depict only four cameras since it has already been decided that one camera will point straight ahead in the final assembly. This choice depends mainly on the idea of exploiting the central front-facing camera in the future to run real-time processing of the data using only this camera and on the idea of using this camera for virtual inspection purposes. Therefore, only the arrangements of the remaining four cameras remain to be defined.
The reasonable arrangements are the following:
(1) Square. It consists of four cameras organized in two horizontal couples on top of each other. The cameras can be rotated at different angles along their vertical axis. The distance between the cameras is 20 cm, both on the horizontal and on the vertical direction.
(2) Cross: The cross geometry consists of a vertical pair of cameras and a horizontal pair of cameras. The cameras can converge or diverge towards the center at different angles. As in the previous configuration, the distance between the cameras is 20 cm in both horizontal and vertical directions.
(3) Vertical: This geometry consists of a first pair of cameras in the vertical direction with a long baseline (40 cm) converging toward the center at different angles and a second couple in the horizontal direction with a short baseline (10 cm) diverging and pointing toward the sides.
(4) Horizontal: The horizontal configuration consists of a couple of frontal cameras and a couple of rear cameras. The cameras within the two couples are close together (10 cm apart), while the front and rear cameras are positioned 20 cm apart. The longest baseline is, therefore, oriented along the tunnel extension.
As mentioned before, a fifth camera is always positioned in the center, pointing forward for all the arrangements.
The pre-defined arrangements were then tested by simulating virtual cameras inside the synthetic dataset of the tunnel mentioned above. For each point in the synthetic dataset, a projection in image space can be simulated for each camera of the tested rigs, and different mapping functions can also be used. The GSD can be computed for each point in the 3D virtual scene for each camera so that each synthetic point holds a reference to the computed values from all cameras in which it is visible. From this, a GSD distribution analysis is performed considering the average GSD obtained for each point in the scene. This analysis allows us to draw some consideration on the tested configuration and, therefore, can help to decide which one would be the best performing in general or according to specific objectives.
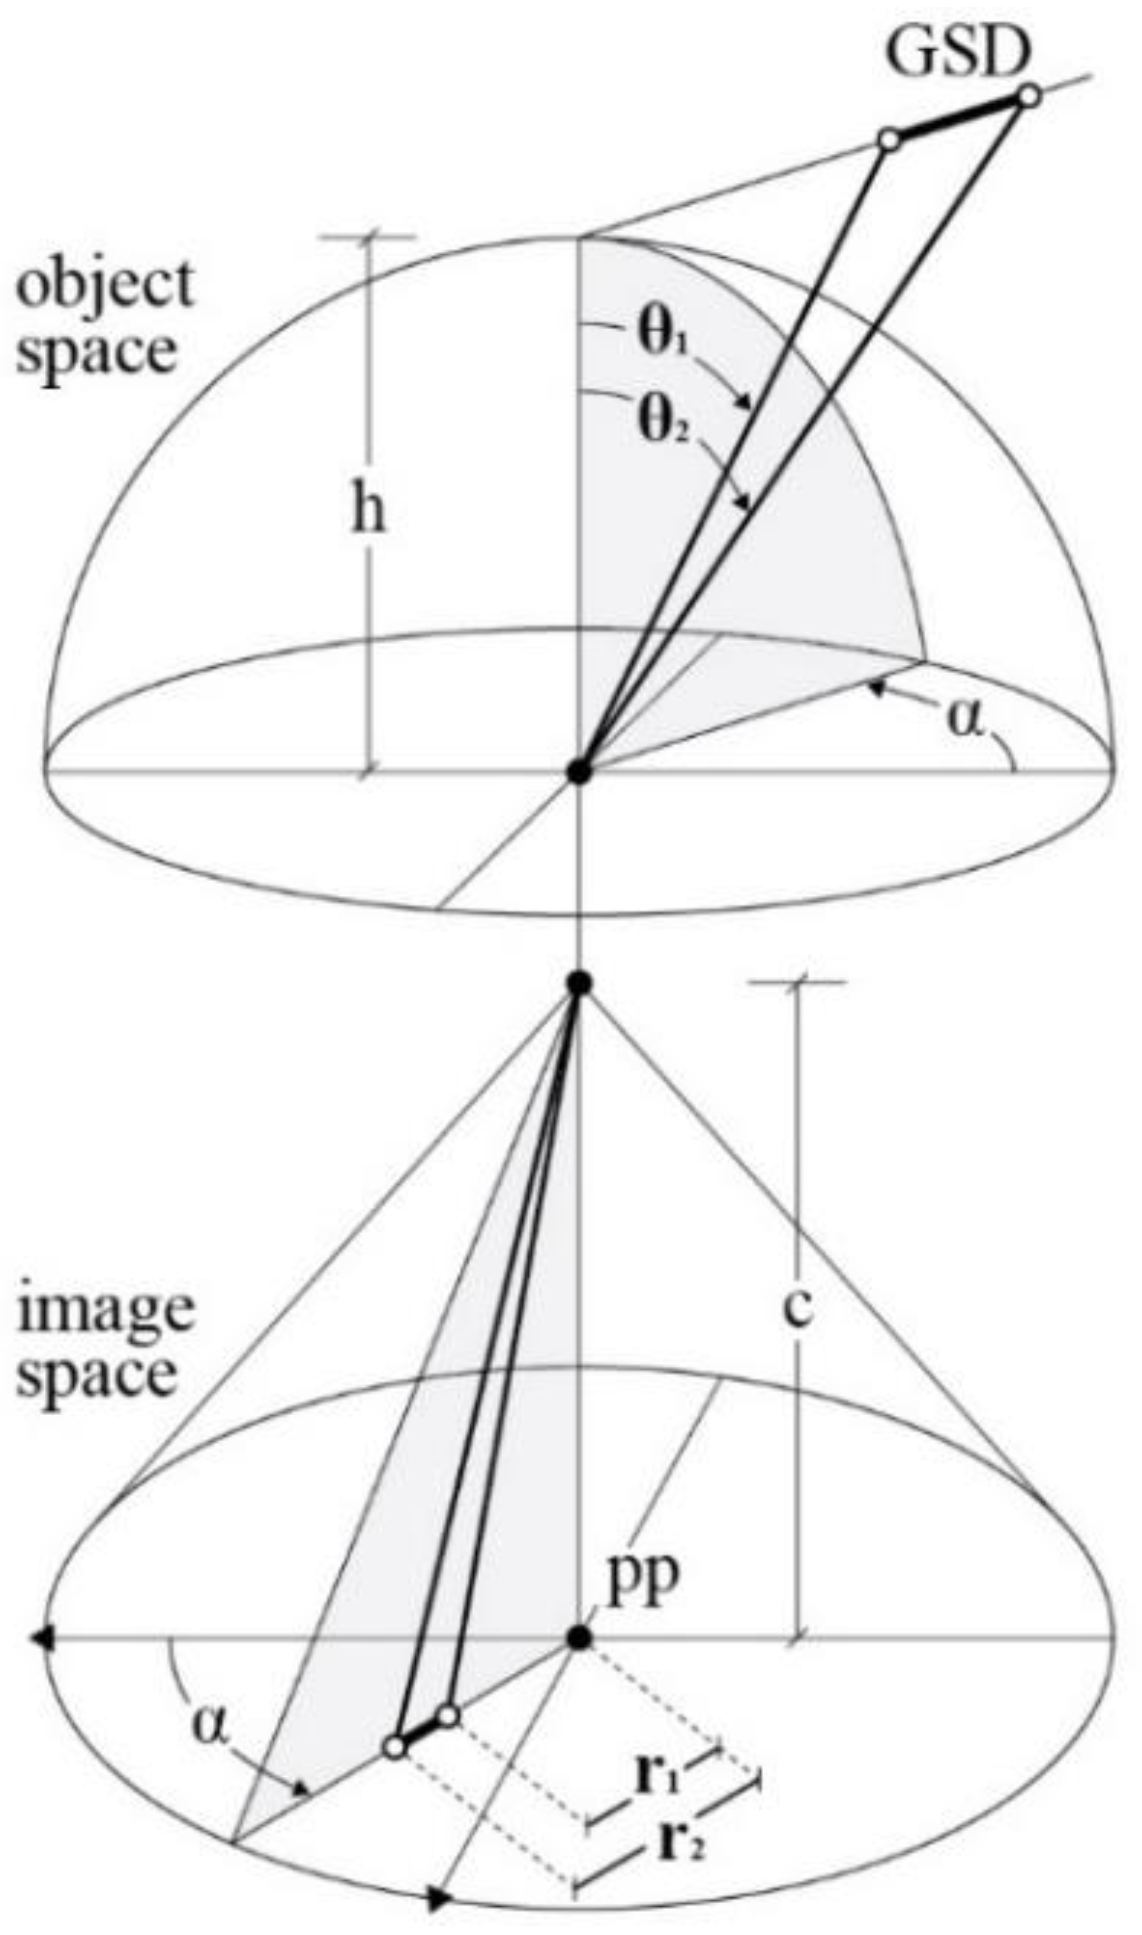
The multi-camera rig geometry and the relationship between fisheye projection and incidence angle with the collimated points were considered to simulate the GSD behavior. The GSD is therefore computed according to Eq. (1), the GSD is expressed as a function of (i) the principal distance, (ii) the distance between the camera and its normal plane passing through the point, (iii) the detector pitch, and (iv) the lens mapping function.
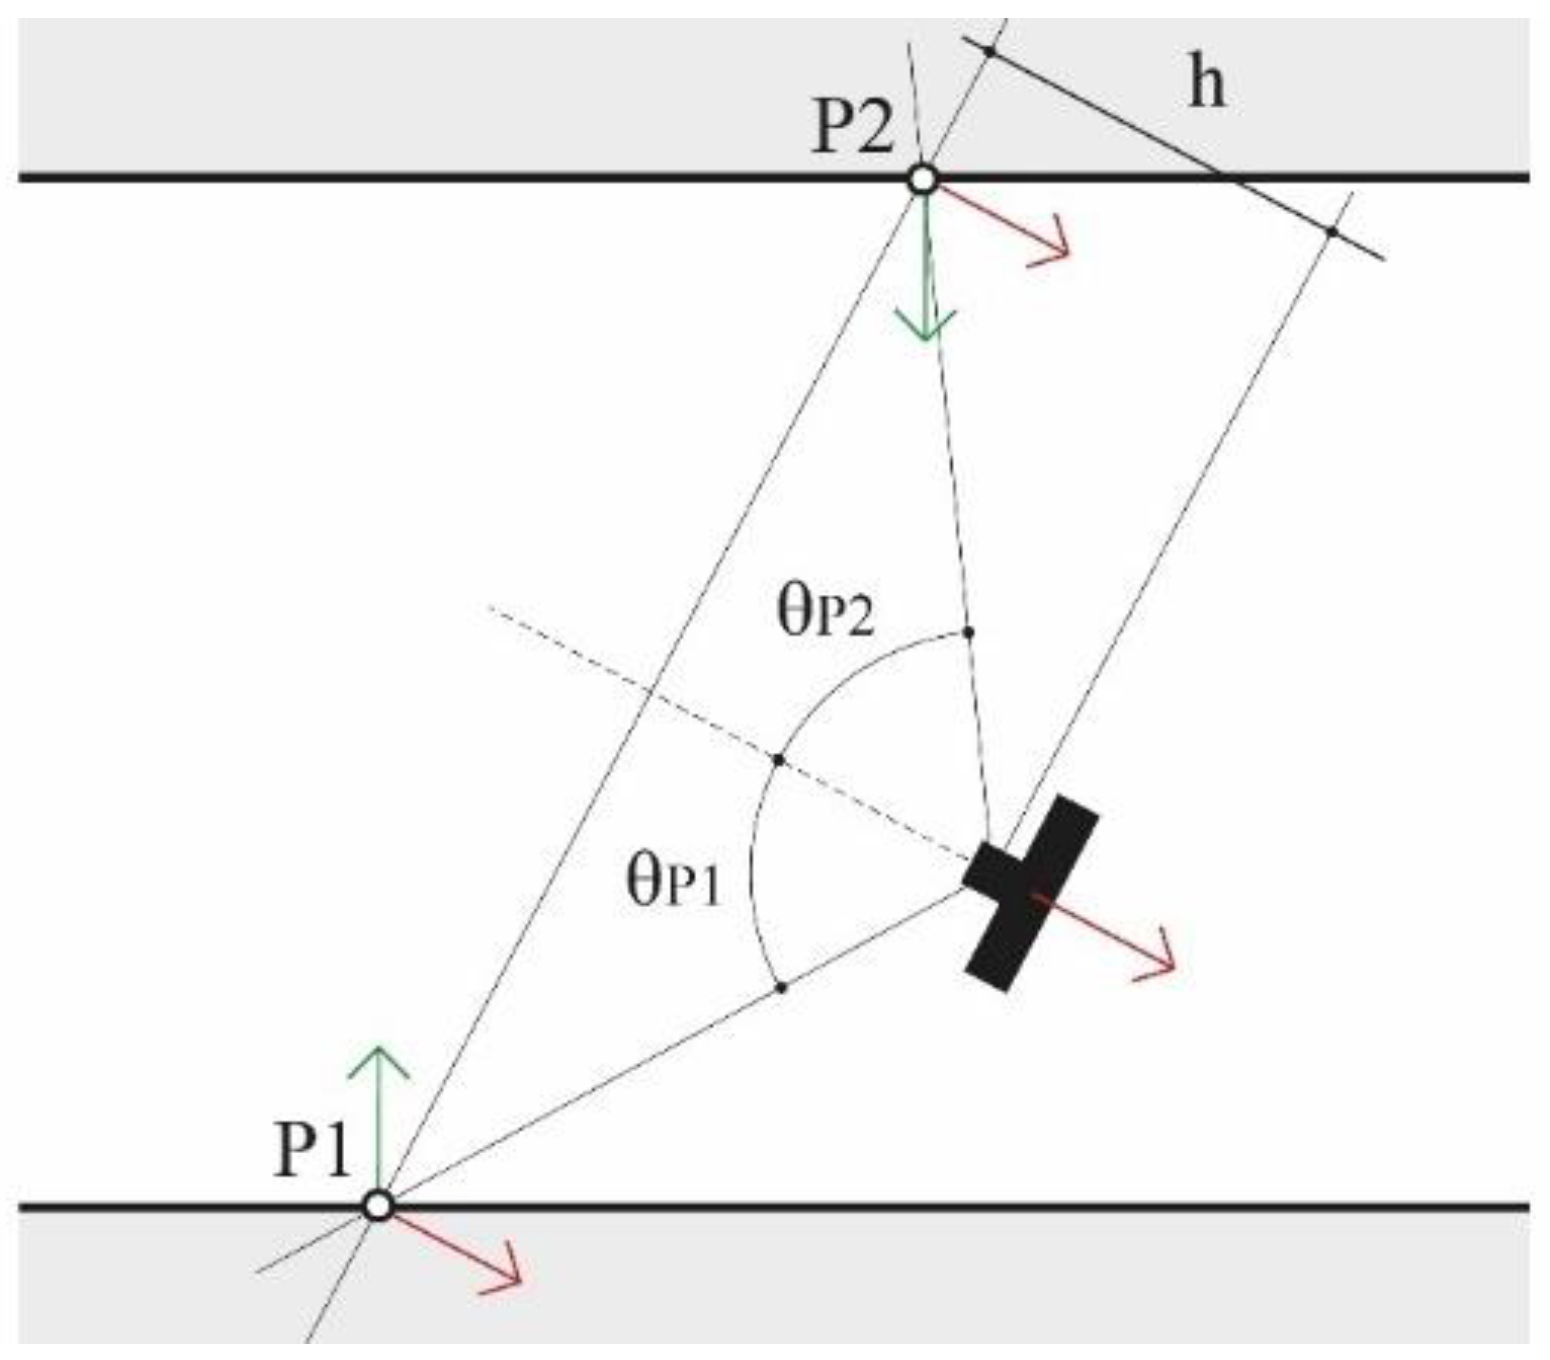
The notation refers to
Figure 9. For each point projected onto the image plane, the radius r
1 is known, and the radius r
2 depends on the detector pitch, with:
.
is the inverse of the lens mapping function .
Eq. (1) is used to compute the GSD for each point projected onto the simulated images, the value is then stored back inside the 3D point entity. At this point two metrics are computed for all 3D point: (i) the first one is
the average of GSD values, according to Eq. (1), calculated from all cameras in which the point is visible; (ii) the second one is
: where the average of the induvial GSD values calculated for each insisting camera is weighted based on the angle between the image normal and the point normal. The weights are calculated as
where:
, the angle between the image and the point unit normal vectors
and
. The image unit normal vector
points opposite the viewing direction, in the direction from the optical center to the image projection (the negative). It follows that when the camera is oriented along the point normal, looking at the point, the angle
is 0°, conversely, when the camera is looking away from the point the angle
is 180° (
Figure 7).
maps the angle between the vectors from the range [0°, 150°] to the interval [
1,
10] linearly, for angles greater than 150°, the GSD value is discarded. The
is the attempt of considering the visibility of the point as a factor into the metric; if a point lies on a surface almost occluded, that is looking away from the camera viewing direction, it is assumed that the accuracy of point detection would be lower that the accuracy for a second point that lies on a surface that is looking towards the camera viewing direction, even if the two points forms an identical angle with the optical axis (
Figure 7). The mapping of the angles to the arbitrary range [
1,
10] has the effect of maintaining the GSD value unaltered in the best condition and of worsening it up to ten times in the worst condition. All analysis based on this second metric have the objective of discriminating between the different camera arrangements to help decide the best ones based also on the assumption that to a greater angle between the image and point normal vectors corresponds a worse measurement quality during actual system deployment.
To find the best performing configurations; within each category/family (
Figure 6): different cameras orientation angles have been simulated, and the results, in terms of the two metrics defined above, compared within the same category/family. Out of each the four categories considered, one specific best-performing configuration is therefore defined. Finally, the best-performing arrangements of each category are compared among themselves, and results are drawn from.
4. Proposed Multi-Camera System—Ant3D
4.1. Description and Main Features
The study of improving the hardware of the initial multi-camera system led to the design of a working prototype of a multi-camera photogrammetric system designed for the survey of complex and narrow areas called Ant3D. The proposed device aims to be an alternative to modern dynamic 3D surveying systems on the market, offering high measurement accuracy combined with the acquisition of high-resolution images, optimal characteristics for digitization, and detailed inspection of surfaces and meandering spaces.
The device allows the drift error reduction in long acquisitions. This is due to the combined exploitation of (i) the fisheye lens angle of view, (ii) 5 cameras arranged in such a way that the whole scene except the operator is always captured in its entirety, (iii) the accurate synchronization of the captured images, (iv) the accurate calibration of the multi-camera IO and RO, and (v) the data processing through Structure from Motion and potentially through V-SLAM.
The multi-camera system is composed of two parts: a hand-held structure or probe and a small backpack connected by data transmission cables (
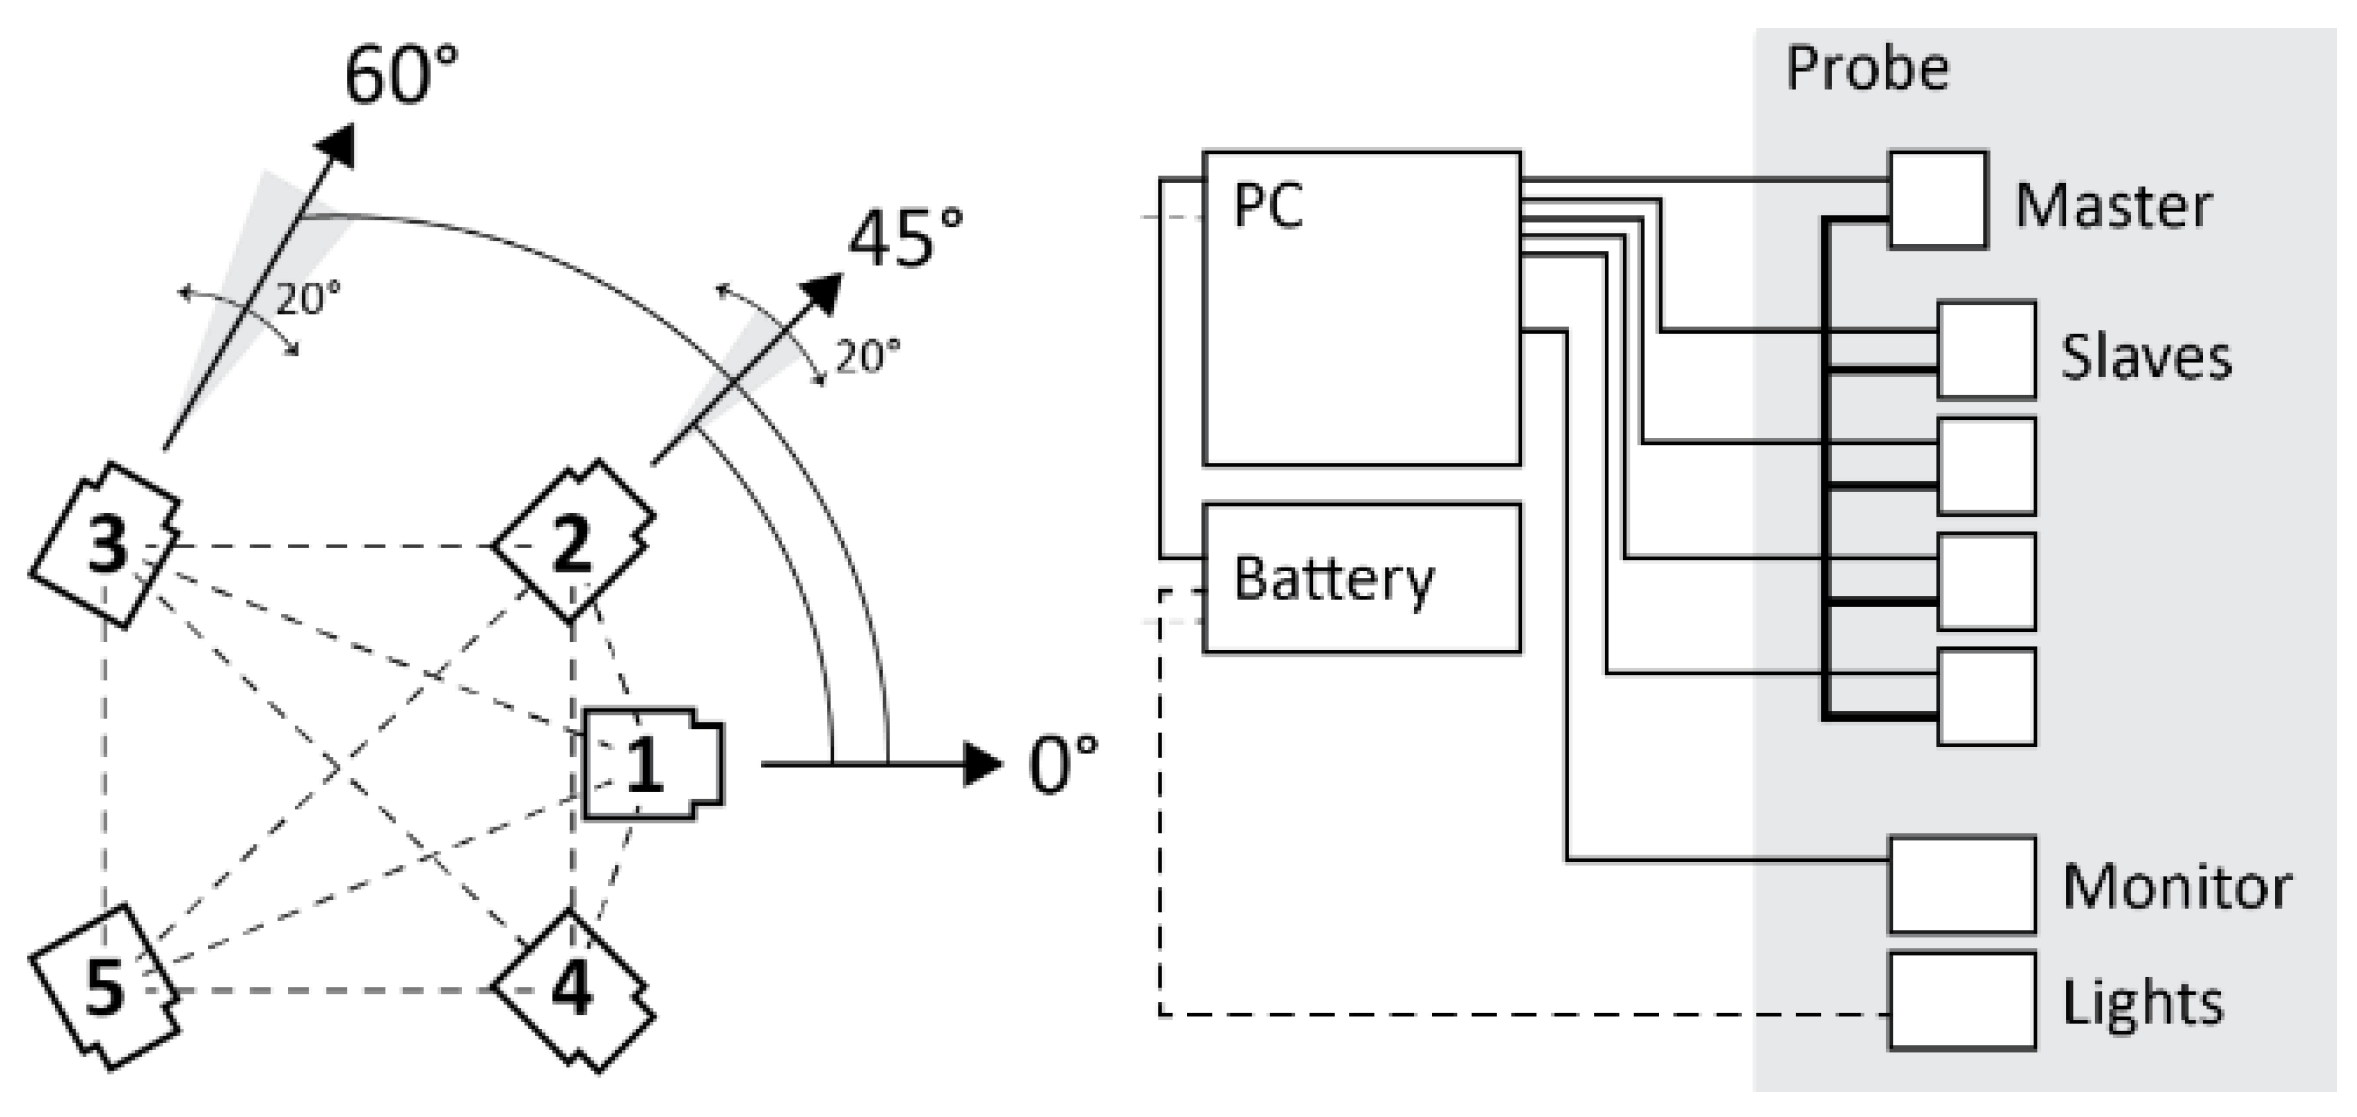
Figure 15). The mechanical structure houses five cameras, a touch screen, and 3 LED illuminators. The geometry of the multi-camera is composed as follows: five cameras are configured in such a way that with respect to a horizontal plane and a front aiming direction, the first frontal camera is placed at an angle 0° with respect to the aiming direction and at around 10° up with respect to the horizontal plane, the second and third front right and left cameras are placed at an angle of +45° and -45° respectively in relation to the aiming direction, the fourth and fifth rear right, and left cameras are placed at an angle of +60° and -60° respectively in relation to the aiming direction. Between the right and left front cameras, there is about 15cm, and between the front and rear cameras, there is about 20cm. This arrangement is motivated by the study described in Chapter 3.3, where the horizontal configuration was the best compromise between performance and practical considerations. This configuration is designed for tunnel-shaped environments with a cross-section varying from about 1m to about 4m. However, the structure can also be used in narrower environments, such as niches from about 30cm wide or even larger environments, provided that is possible to illuminate these environments with different solutions aside from the lights mounted on the structure and accept a lower accuracy. The relative arrangement between the cameras and, in particular, the presence of a significant distance between their centers, particularly along the forward/walking direction, allows accurate triangulation of homologous points and scaling of the resulting three-dimensional reconstruction.
Figure 15 shows a scheme of the proposed system and
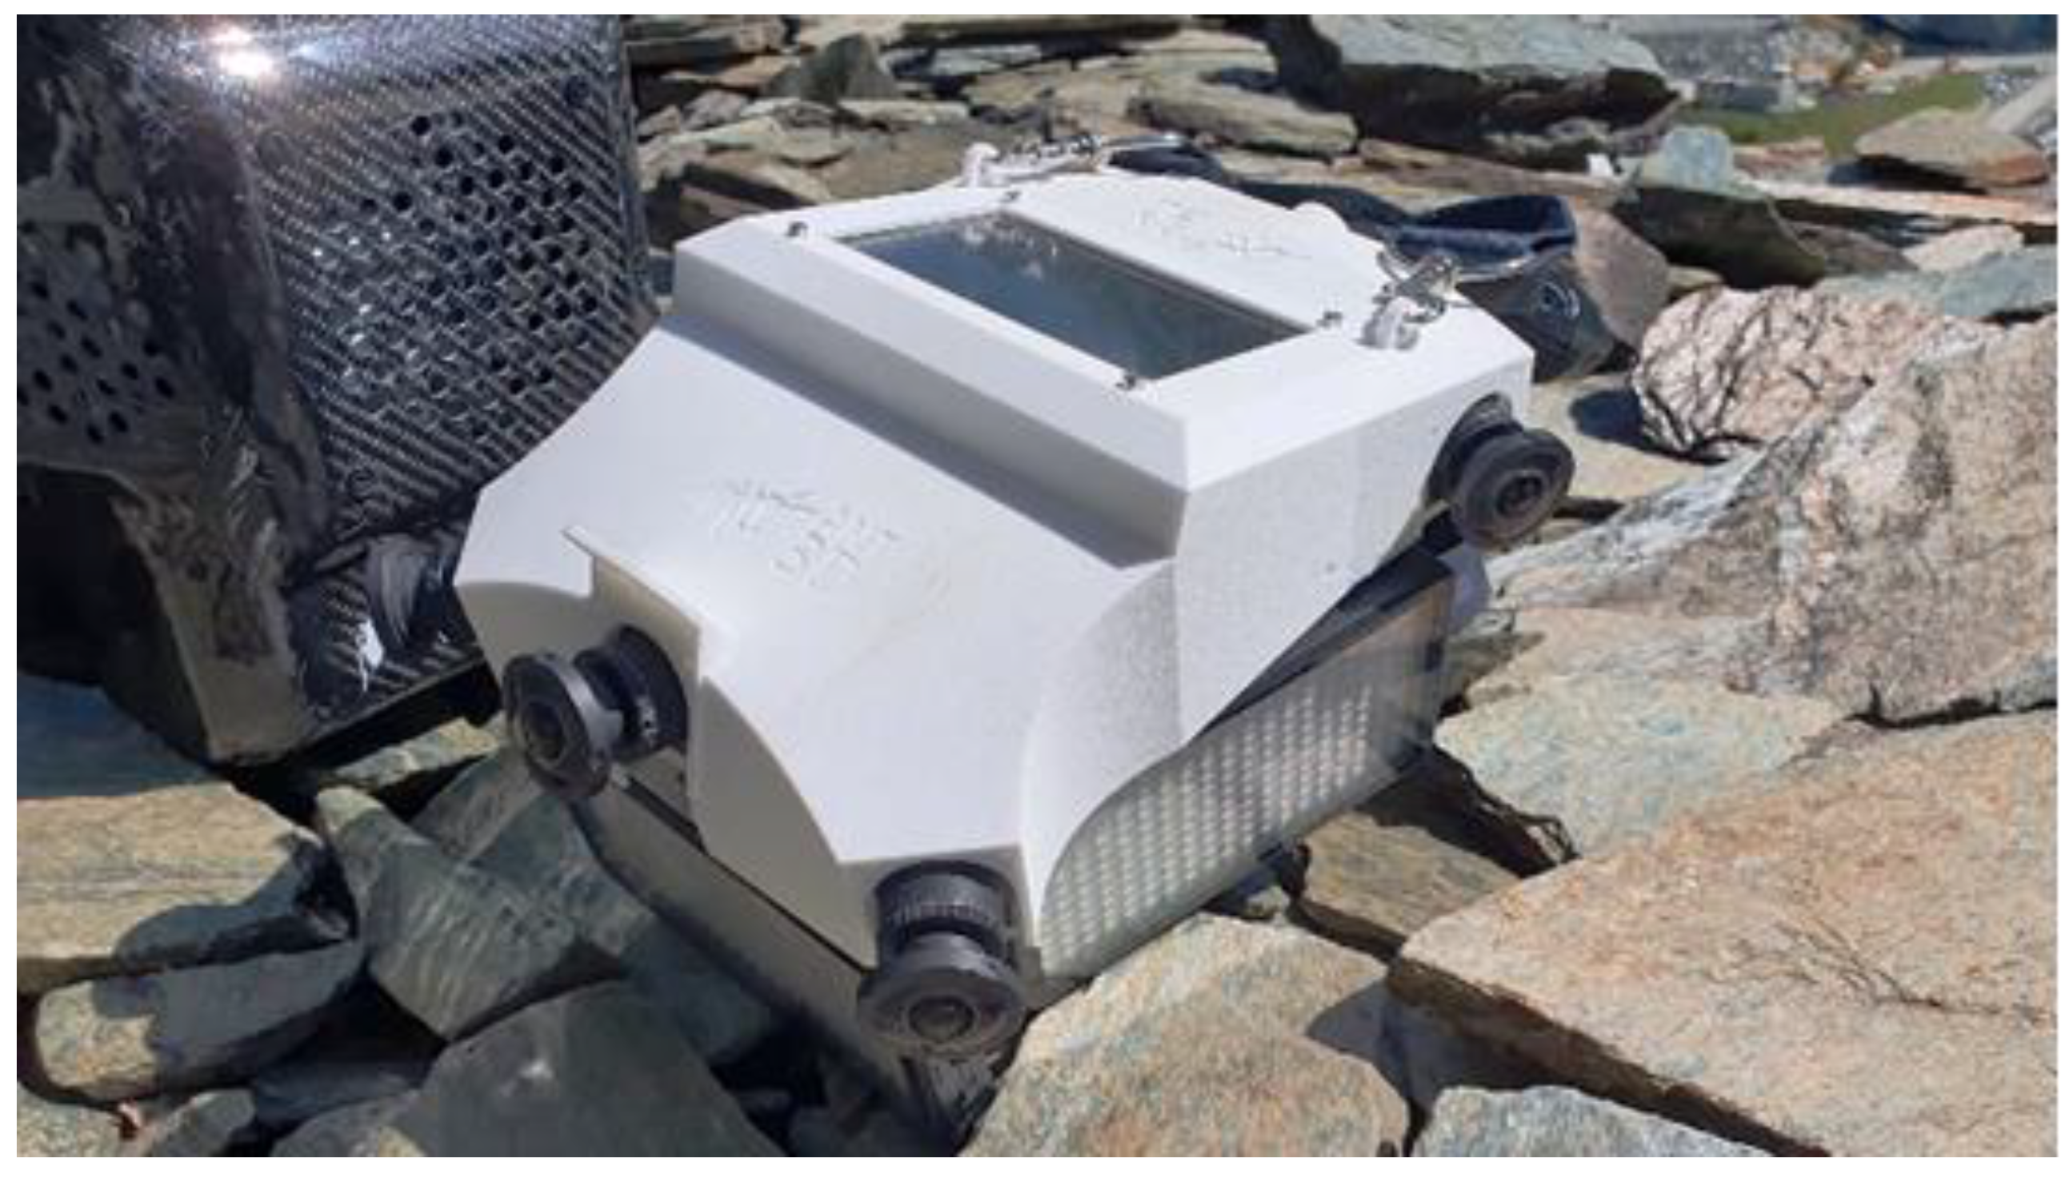
Figure 16 displays a picture of the second prototype build based on this scheme (Patent application No. 102021000000812).
The cameras used in the system are FLIR BlackFly S cameras, model U3-50S5-C that use a 5-megapixel 2/3” color sensor with a pixel pitch of 3.45 micrometers. All the cameras mount fisheye-type optics, specifically the SUNEX PN DSL315, an equidistant fisheye with a focal length of 2.7mm and an FOV of 190° in an image circle of 7.2mm. The optics allow us to reduce the number of images needed for the 360° 3D reconstruction thanks to the wide viewing angle of the fisheye projection that allows us to obtain complete coverage of the framed scene, except for the operator, using only five cameras. In addition, the wide angle of view of the multi-camera allows for obtaining a great redundancy of constraints (homologous points connecting successive positions of the rig) while allowing a large ratio between base distance and capturing distance, i.e. the ratio between the distance of the centers of gravity of two consecutive positions of the rig and the distance between the center of gravity of the rig and the photographed surface, equal to 1:1, while instead, using rectilinear projection optics, this ratio must be lower (about 1:2) significantly increasing the number of images required. Finally, the short focal length favors a wide depth of field that allows one to get simultaneously in focus very close and distant objects improving the result of the subsequent processing.
The device allows us to obtain a reconstruction directly to scale without the need for additional support measurements by exploiting the rigid, calibrated relative position of the cameras and the synchronization of the cameras.
This characteristic allows for the detection of a large number of key points in each direction around the multi-camera and a large number of image constraints (homologous points) between cameras within the structure itself and between consecutive positions of the structure during movement. The wide viewing angle means that the same key points can be recognized and used as constraints for many consecutive positions of the rig before they no longer fall within the cameras' field of view. The redundancy of these constraints reduces drift error in prolonged acquisitions.
The instrument is designed to be held and used by a single operator walking independently through the environment/tunnel to be detected at normal walking speed and allow a complete acquisition in a very short time. The acquisition proceeds in a completely autonomous way and can therefore be completed even mounting the structure on a vehicle or other mode of movement without the need for the presence of the operator.
The key elements of the system are:
(1) Global shutter cameras: The use of global shutter sensors allows reliable exploiting of the calibrated internal orientations.
(2) Circular fisheye lenses, with a field of view of 190°, arranged in a semicircle, allow a hemispherical shot of the framed scene, excluding the operator, allowing omnidirectional tie point extraction. In addition, they provide a wide depth of field, allowing the use of fixed focus while still covering close to faraway subjects.
(3) Rig geometry. The relative arrangement between the cameras favors determining the device's position at the moment of acquisition and allows omnidirectional constraint points that make the final reconstruction more robust.
(4) Calibrated RO: The constrained, rigid, and calibrated position between the cameras allows automatic and accurate scaling, even in very large environments. The accurate hardware synchronization of the cameras guarantees consistent results.
The most notable advantages of the developed system are:
(1) Contained drift error in prolonged acquisitions as evaluated on the field through challenging case studies [
8,
22,
24,
25,
26].
(2) Reduced number of images required for 360° 3D reconstruction thanks to the wide viewing angle of the fisheye optics.
(3) Scaled reconstructions without additional support measures, thanks to the relative position of the calibrated cameras and their accurate synchronization.
(4) Speed and reliability of the acquisition, feasible even for non-photogrammetric experts.
4.2. Acquisition and Processing
The images are acquired with a time-based synchronized trigger that can be set at different frame rates. For most cases, during testing, a frame rate of 1fps has been used. The image set acquired is stored in five subfolders, dividing the images according to the camera that acquired them. For the test performed so far, the processing step is performed using the Agisoft Metashape software. Each camera is loaded with a reliable pre-calibration of the internal and relative orientation parameters. At this point, the image set can be oriented using the SfM implementation of Metashape.
Within the testing phase, it was observed that to achieve optimal results in challenging scenarios, such as complex and extensive interconnected tunnel environments, adjustments such as “manual refinements” and “tie points filtering” were necessary.
Ultimately, the adjustments slowed down the processing phase by requiring manual steps to be added to the process. The source of the misalignments can be identified in a too-complex image network, together with the lack of any effective strategy to pre-select the matching image pairs in large datasets. The problem can be solved by providing initial values for the exterior orientation of all images in the set, and this can be obtained through (i) a low-resolution pre-processing (still potentially requiring manual intervention) or (ii) real-time processing of the images during acquisition using visual SLAM algorithms [
21], first experiments of the visual SLAM integration with Ant3D has been investigated in [
30].
Figure 17 shows a synthesis scheme of the processing phase. At the current implementation the only output of the acquisition is the image dataset. However, in a future implementation it is planned to integrate a real-time processing phase during acquisition that would also output the system trajectory based on the estimated image’s coordinates in object space.
4.3. Case Studies and Discussion
One of the case studies identified to test the instrument performance is the Castle of San Vigilio, the same subject of the acquisition of the FINE Benchmark. The acquisition of this area allows to verify the improvements made to the multi-camera system from its first definitions to that of the working prototype. The ground truth point cloud obtained with the laser scanner for the Benchmark dataset was used as a reference survey. The best results obtained from the FINE Benchmark data processing reported an error of more than 10cm at the ends of the reconstruction up to errors of more than one meter for the worst reconstructions. In general, the processing of the first multi-camera acquisitions, although they have demonstrated the potential of the approach, has also highlighted the poor reliability and repeatability of the results caused by the limited hardware characteristics of the first iterations of the instrument.
Two major limitations were highlighted in the use of the GoPro action camera rolling shutter sensors and in the geometry of the system. The latter is characterized by cameras oriented mainly in the direction of the walk, which limits the possibility of tying the acquired photos in the forward direction with those acquired in the return direction. Carrying out this test allows us to assess the improvements to the new design.
A single acquisition was performed with the proposed device to acquire the whole area in a short time. The acquisition starts from the level of the tunnel, immediately below the access manhole. It proceeds along the underground tunnel, reaches the end, and returns to the starting point. Here it continues up the manhole by means of a ladder and proceeds along the vaulted room with a central plan at the base of the tower. It then continues up the connecting stairs to the second level, surveys the vaulted room, and continues to the top with the last stretch of stairs. Outside, the acquisition runs along the external structure of the last stairwell and proceeds to acquire the external top of the tower. From here, it retraces its steps and retraces the path in the opposite direction back to the circular room on the ground floor; it then proceeds outside, surveying the outer surface of the tower. Finally, the acquisition returns to the circular room, which ends after a reinforcement connection through the access manhole to the tunnel. This time, the acquisition is done without the presence of the ladder.
The steps performed during data processing are the ones described in Chapter 4.2, in this case, it was not required to perform any manual adjustment over the SfM output, contrary to what was observed with the multi-camera data of the FINE Benchmark, all the images were oriented correctly. In addition, it was observed that thanks to the field of view of the circular fisheye optics used and the angle of the cameras with respect to the walking direction (directed more towards the walls of the tunnel), many more points of connection between the images taken from the outward and return path were detected.
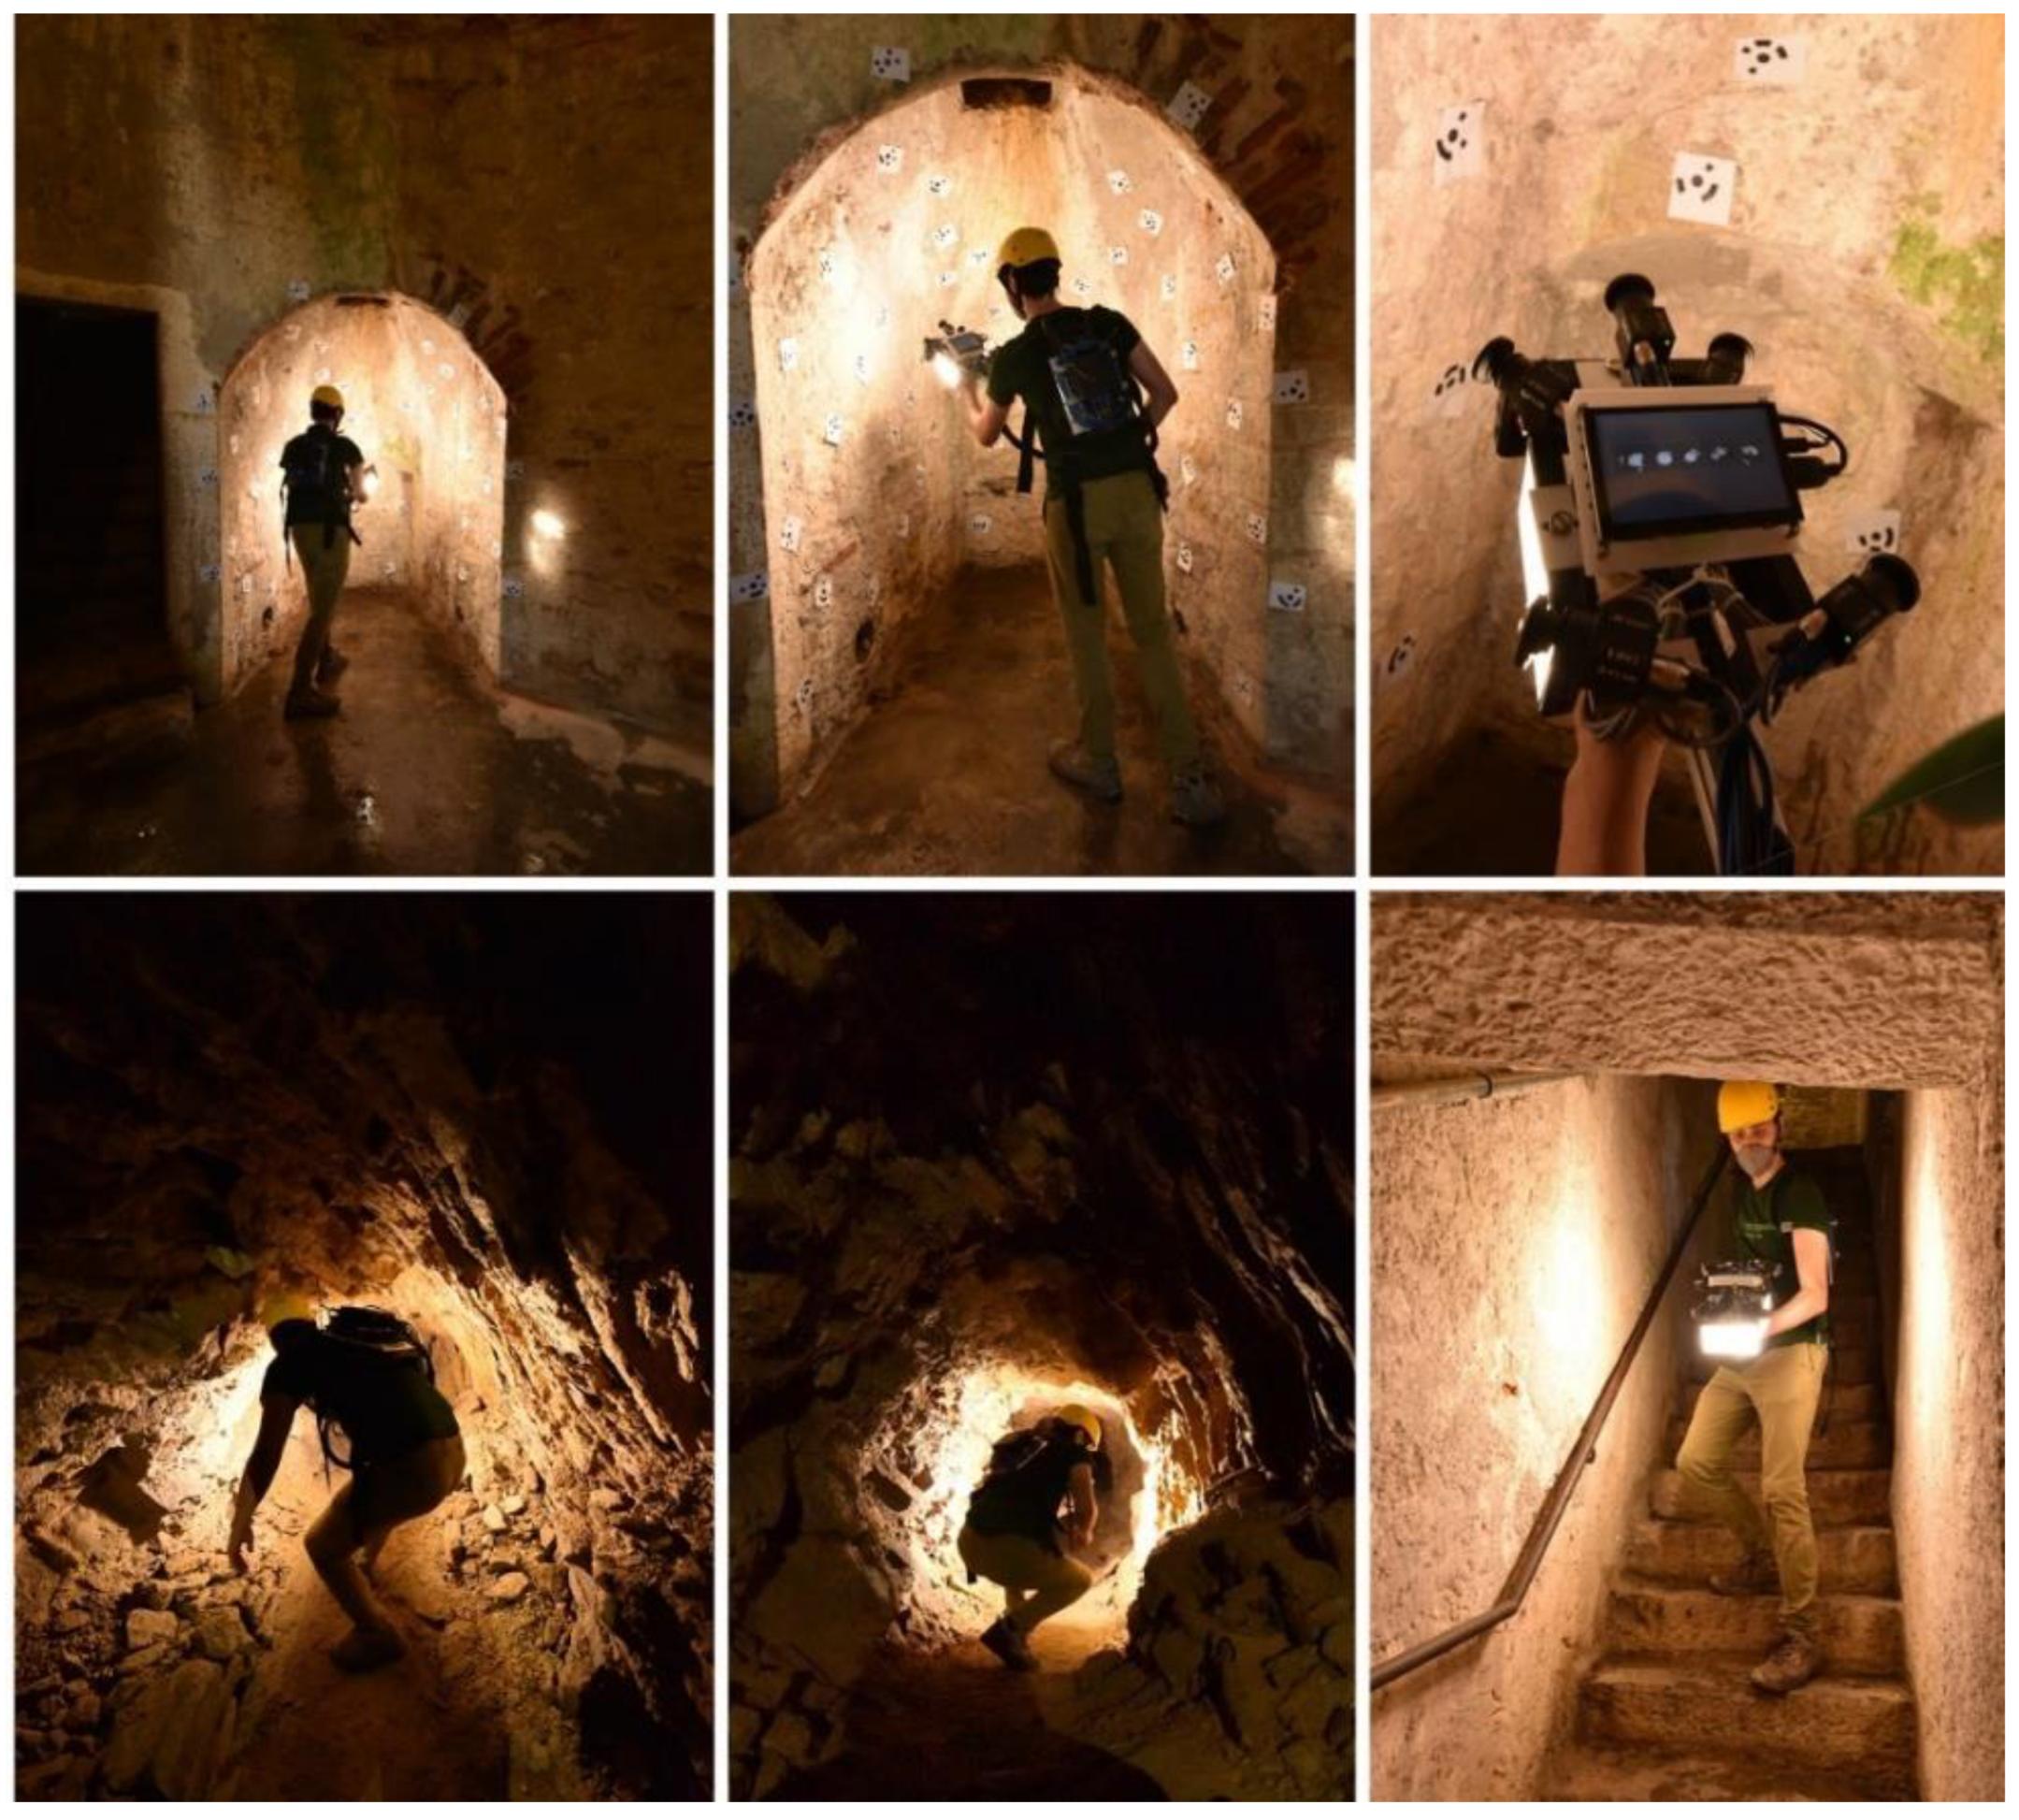
Figure 18 shows the acquisition phase of both the on-site calibration test field and the actual tower environments;
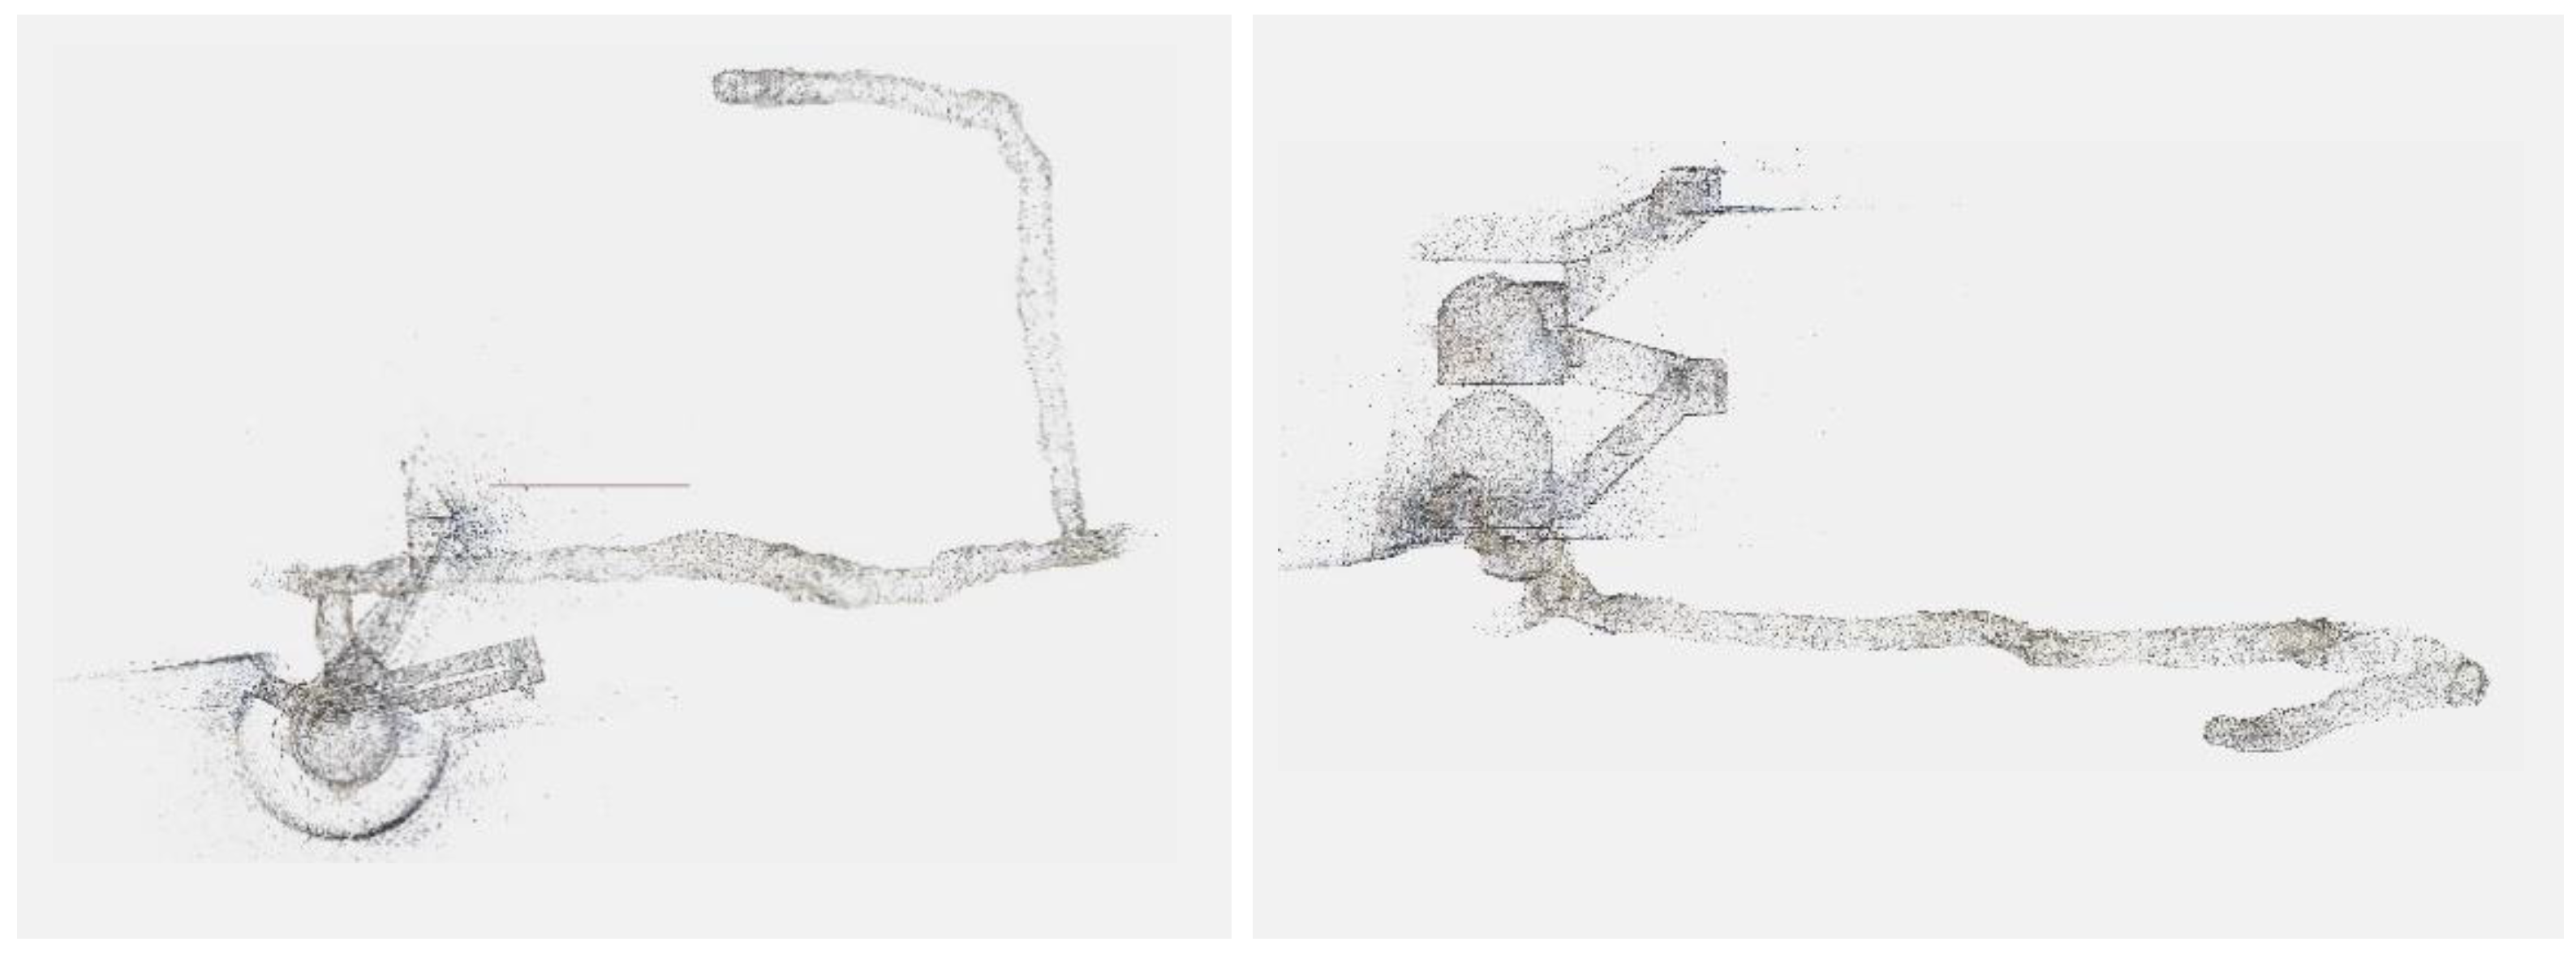
Figure 19 shows the reconstructed sparse point cloud.
For the final evaluation of the reconstruction, it was not possible to compare based on checkpoints as previously done for the FINE Benchmark acquisitions since the reference targets were removed. A direct comparison with the ground truth scanner point cloud was then carried out.
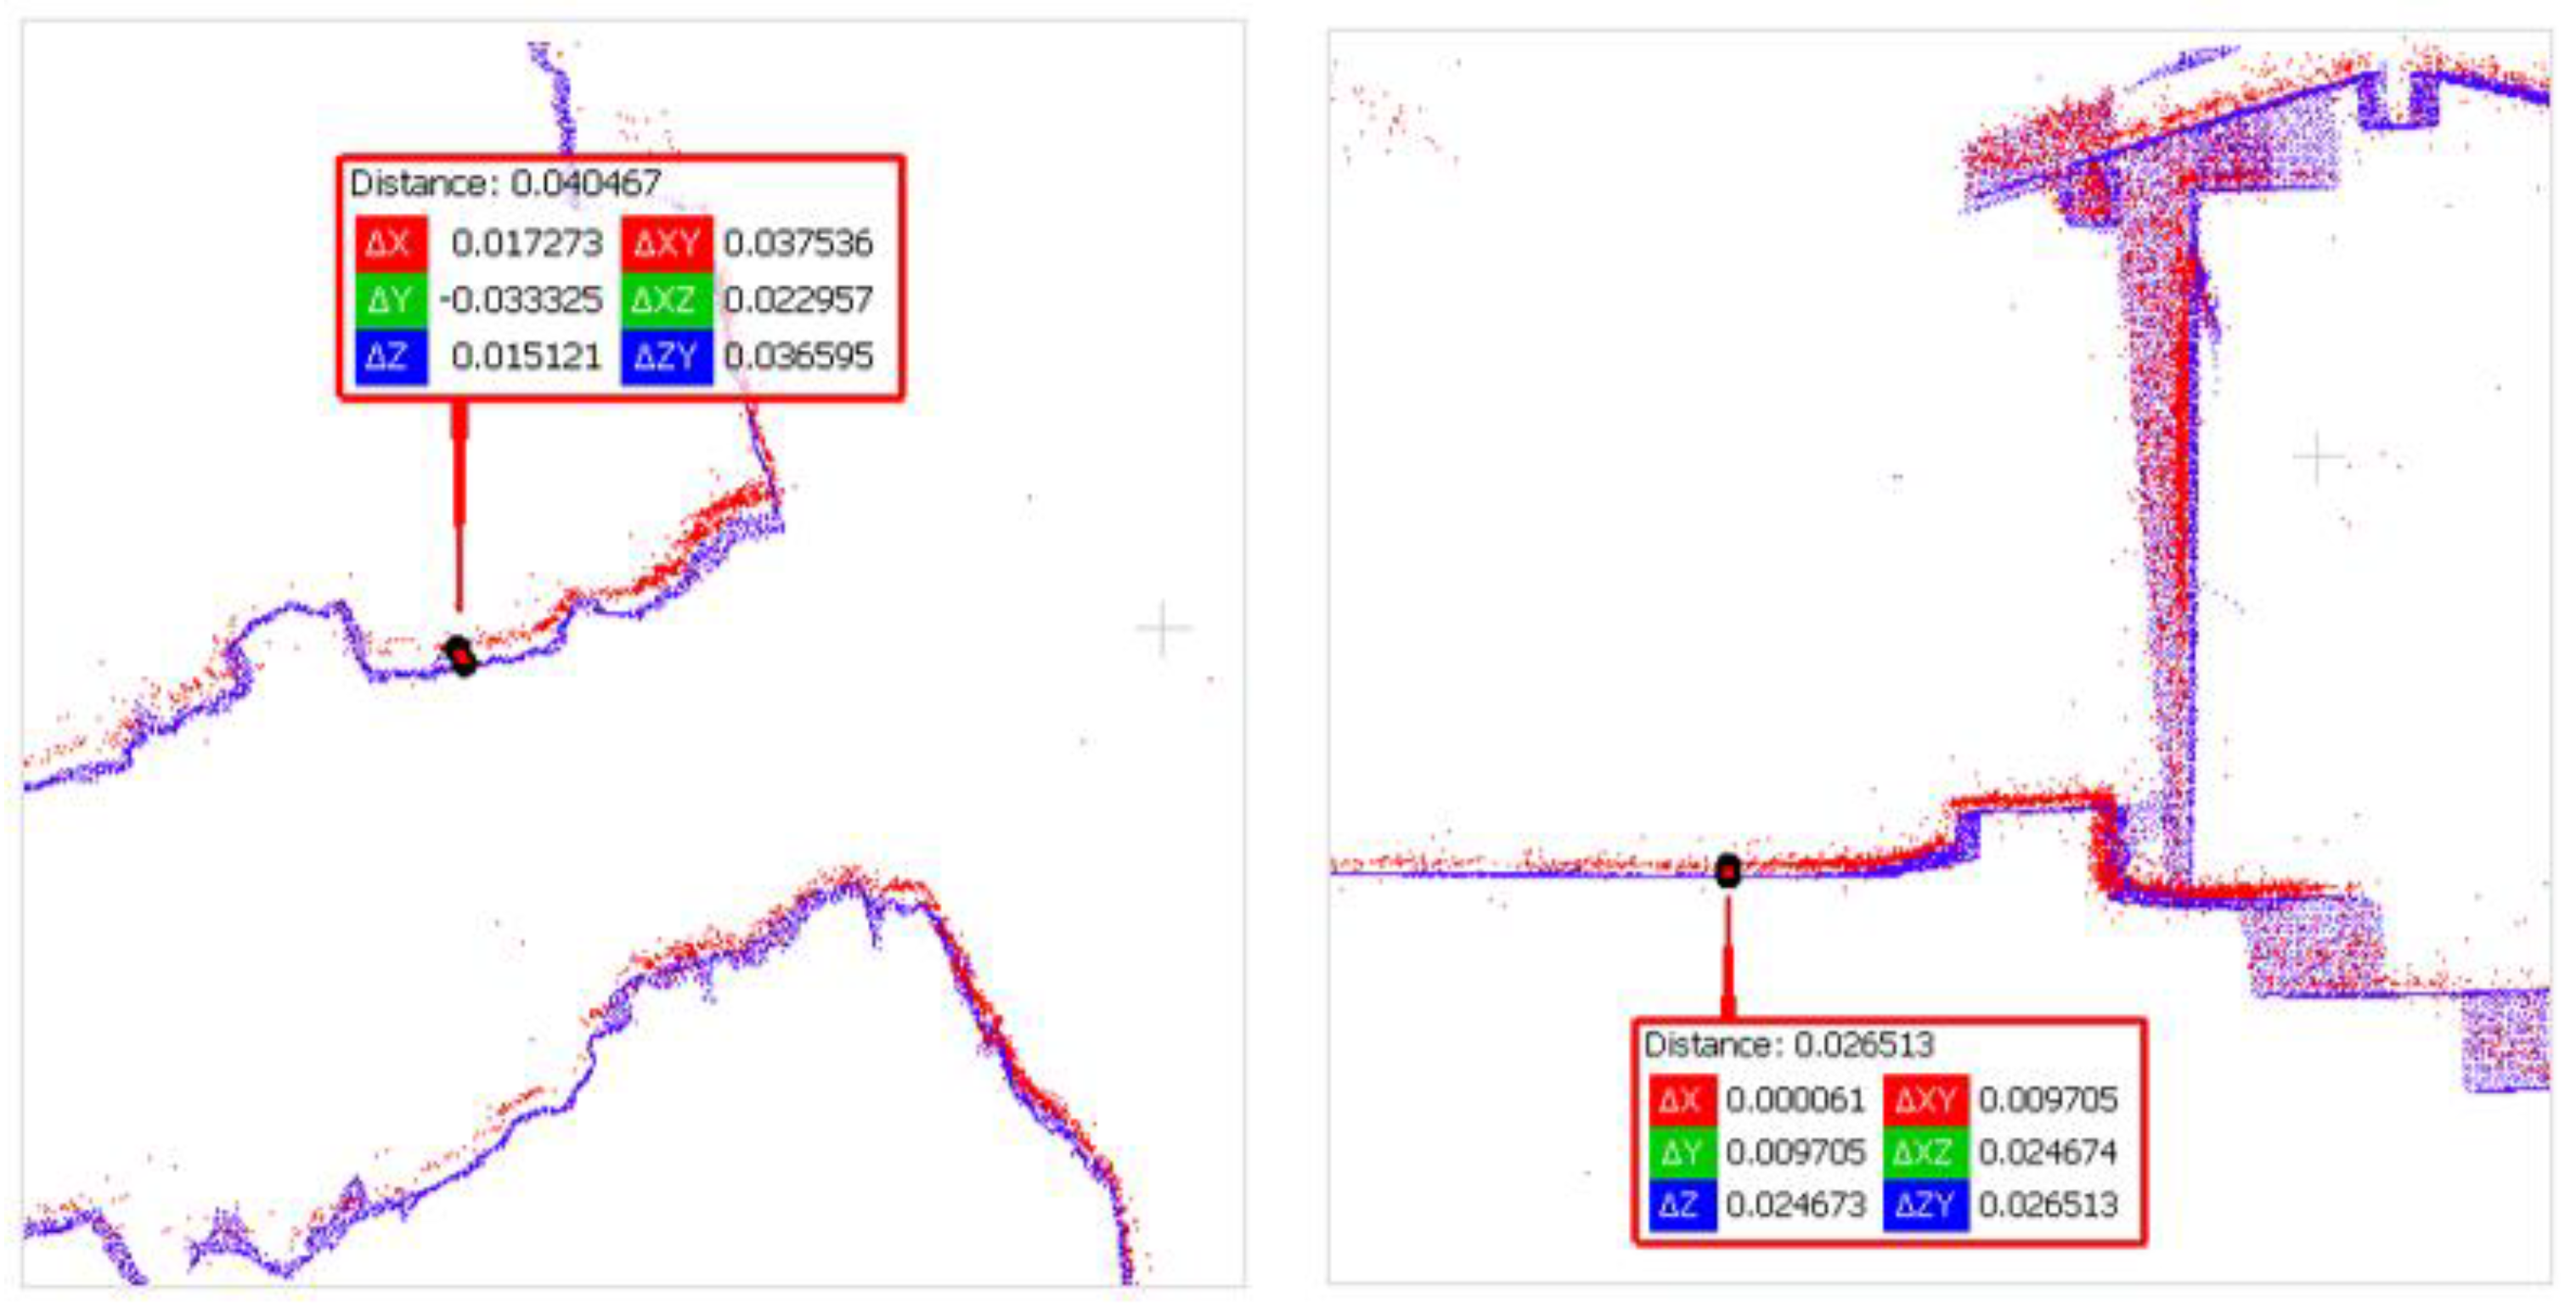
The reference point cloud and the multi-camera reconstruction cloud were oriented by performing a best-fit registration on the surface of the circular access room to the tower. The two clouds were segmented and oriented using the Cloud Compare software. The point cloud transformation matrix, obtained from the best fit, was then applied to the complete point cloud of the multi-camera reconstruction, and the comparison between the two was made.
Figure 20 shows some zoomed-in details of the overlapped point clouds (reference in blue, Ant3D in red). The comparison shows that the photogrammetric reconstruction is complete in all its parts and matches the laser scanner. The maximum deviation between the clouds, measured by performing sections in correspondence of the most extreme areas, was 4cm at maximum, certifying the survey as suitable for the scale of architectural representation of 1:100.
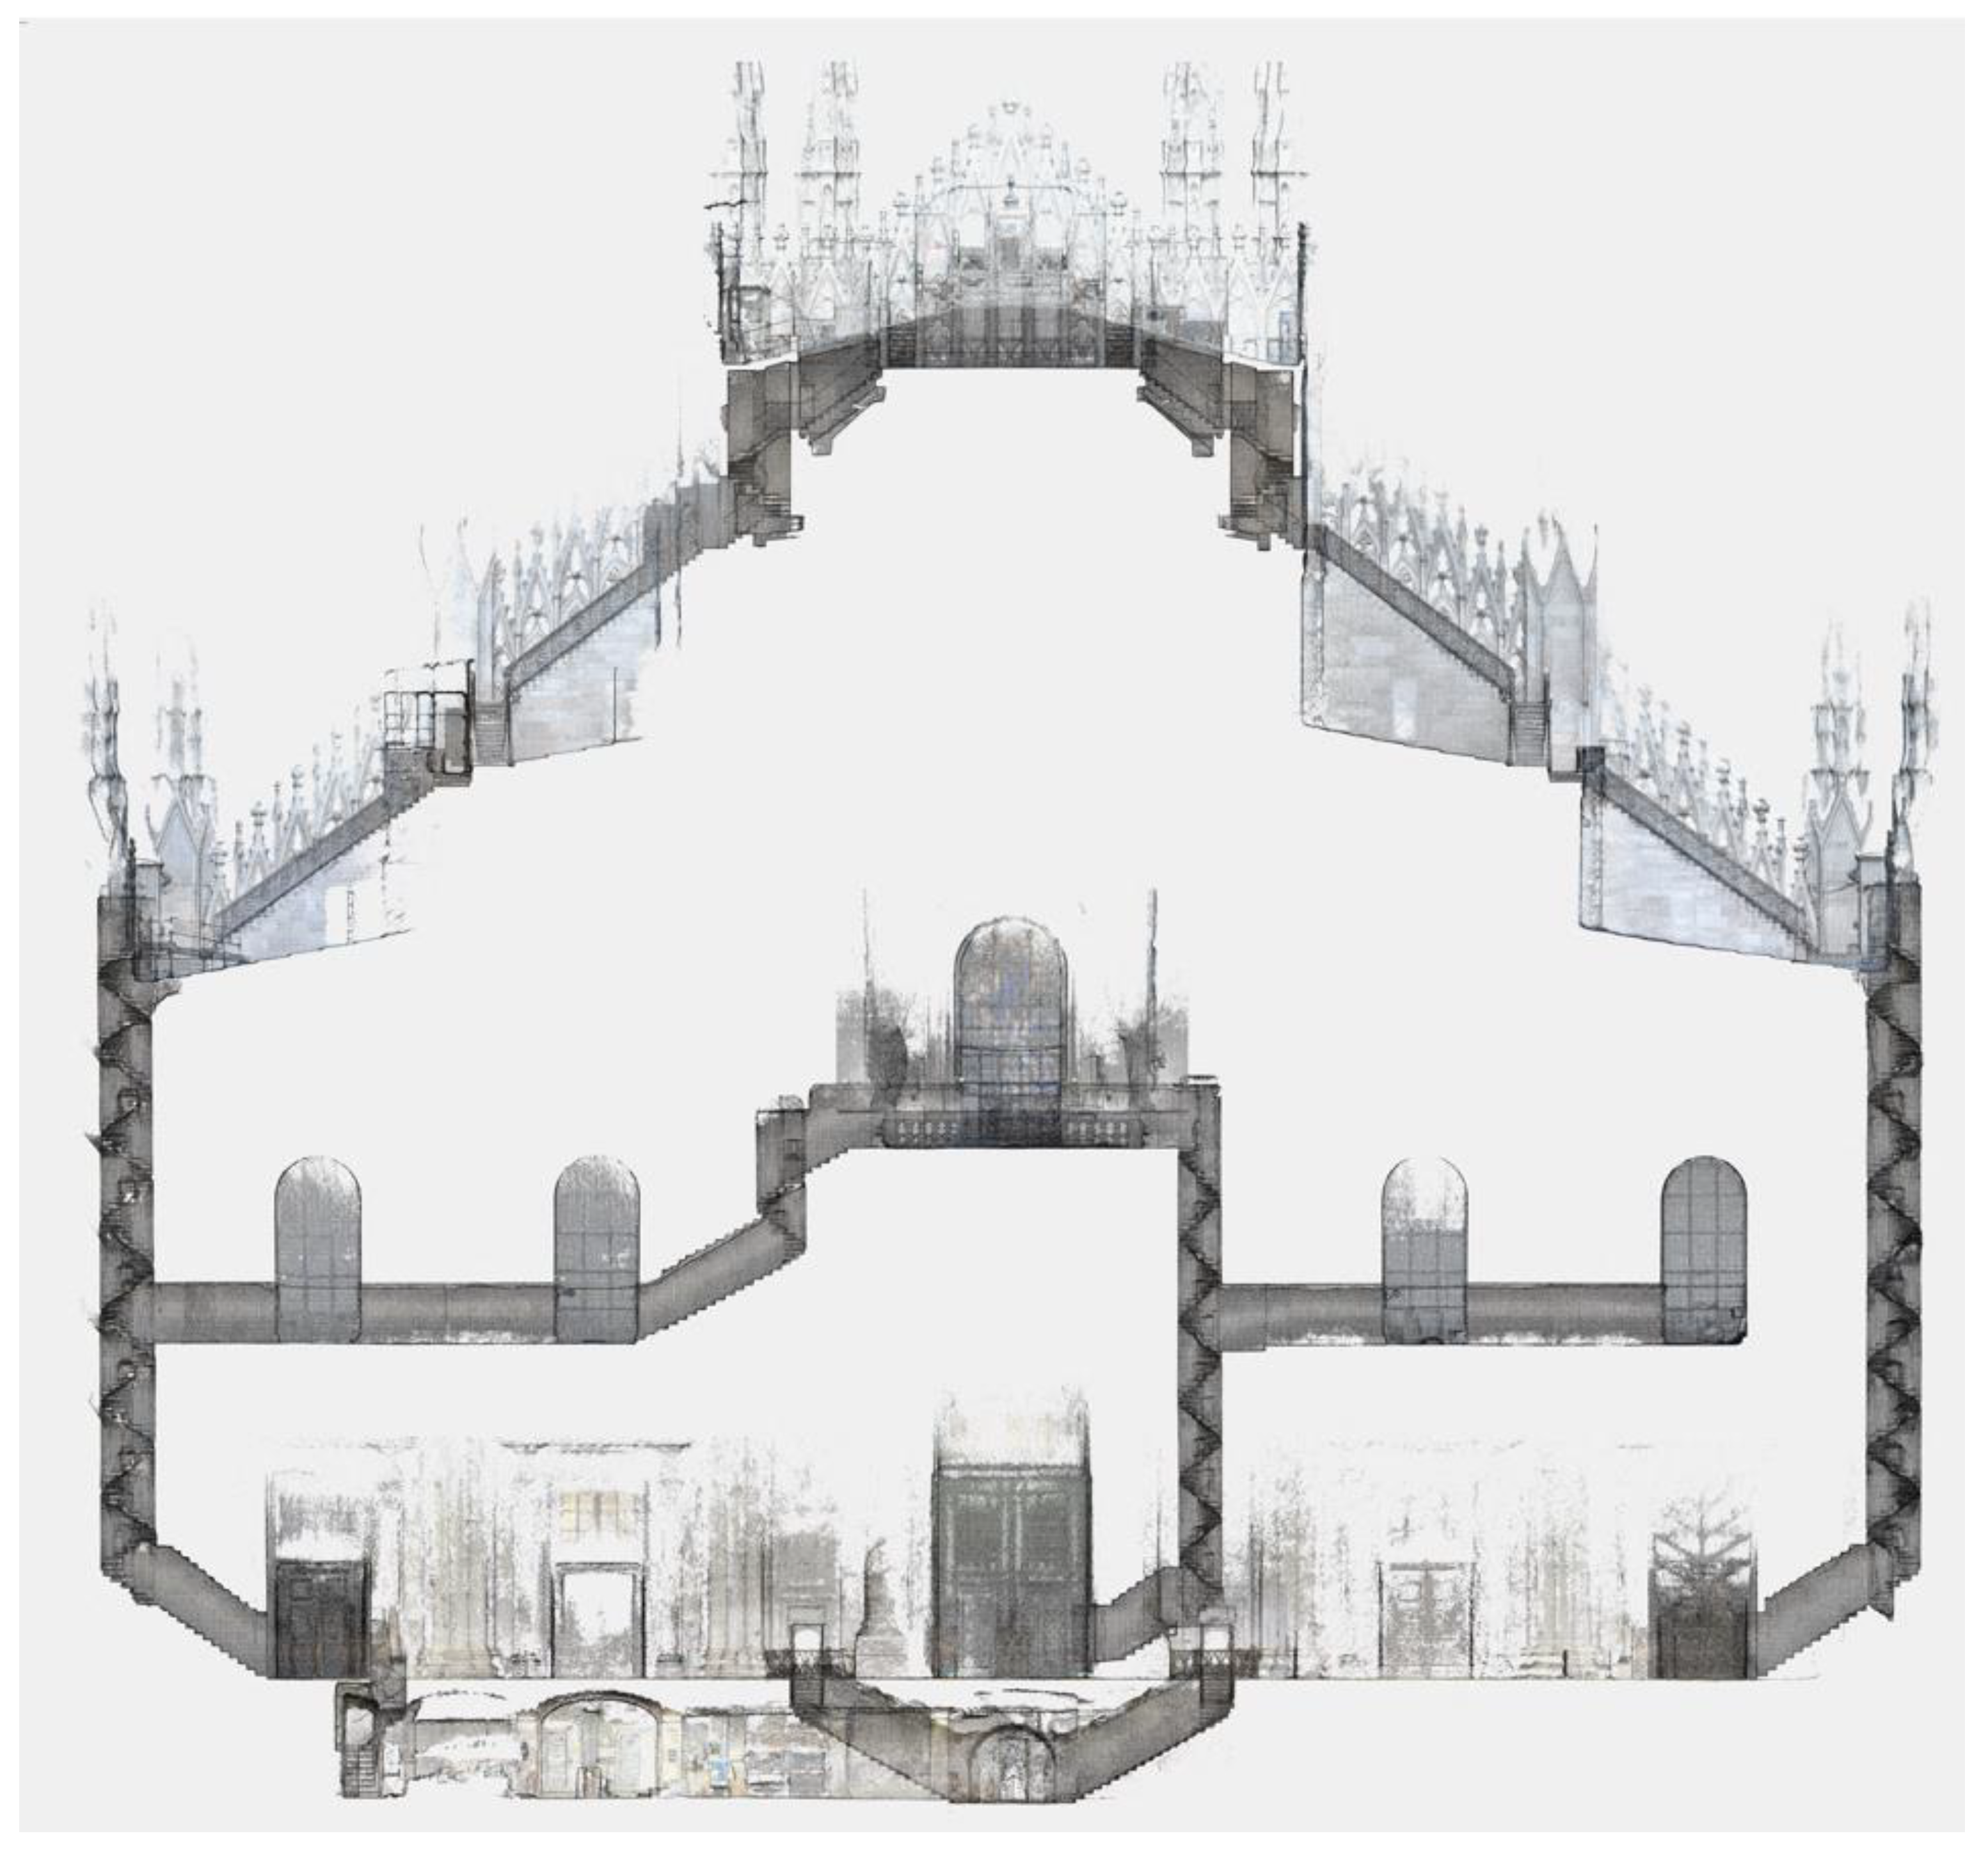
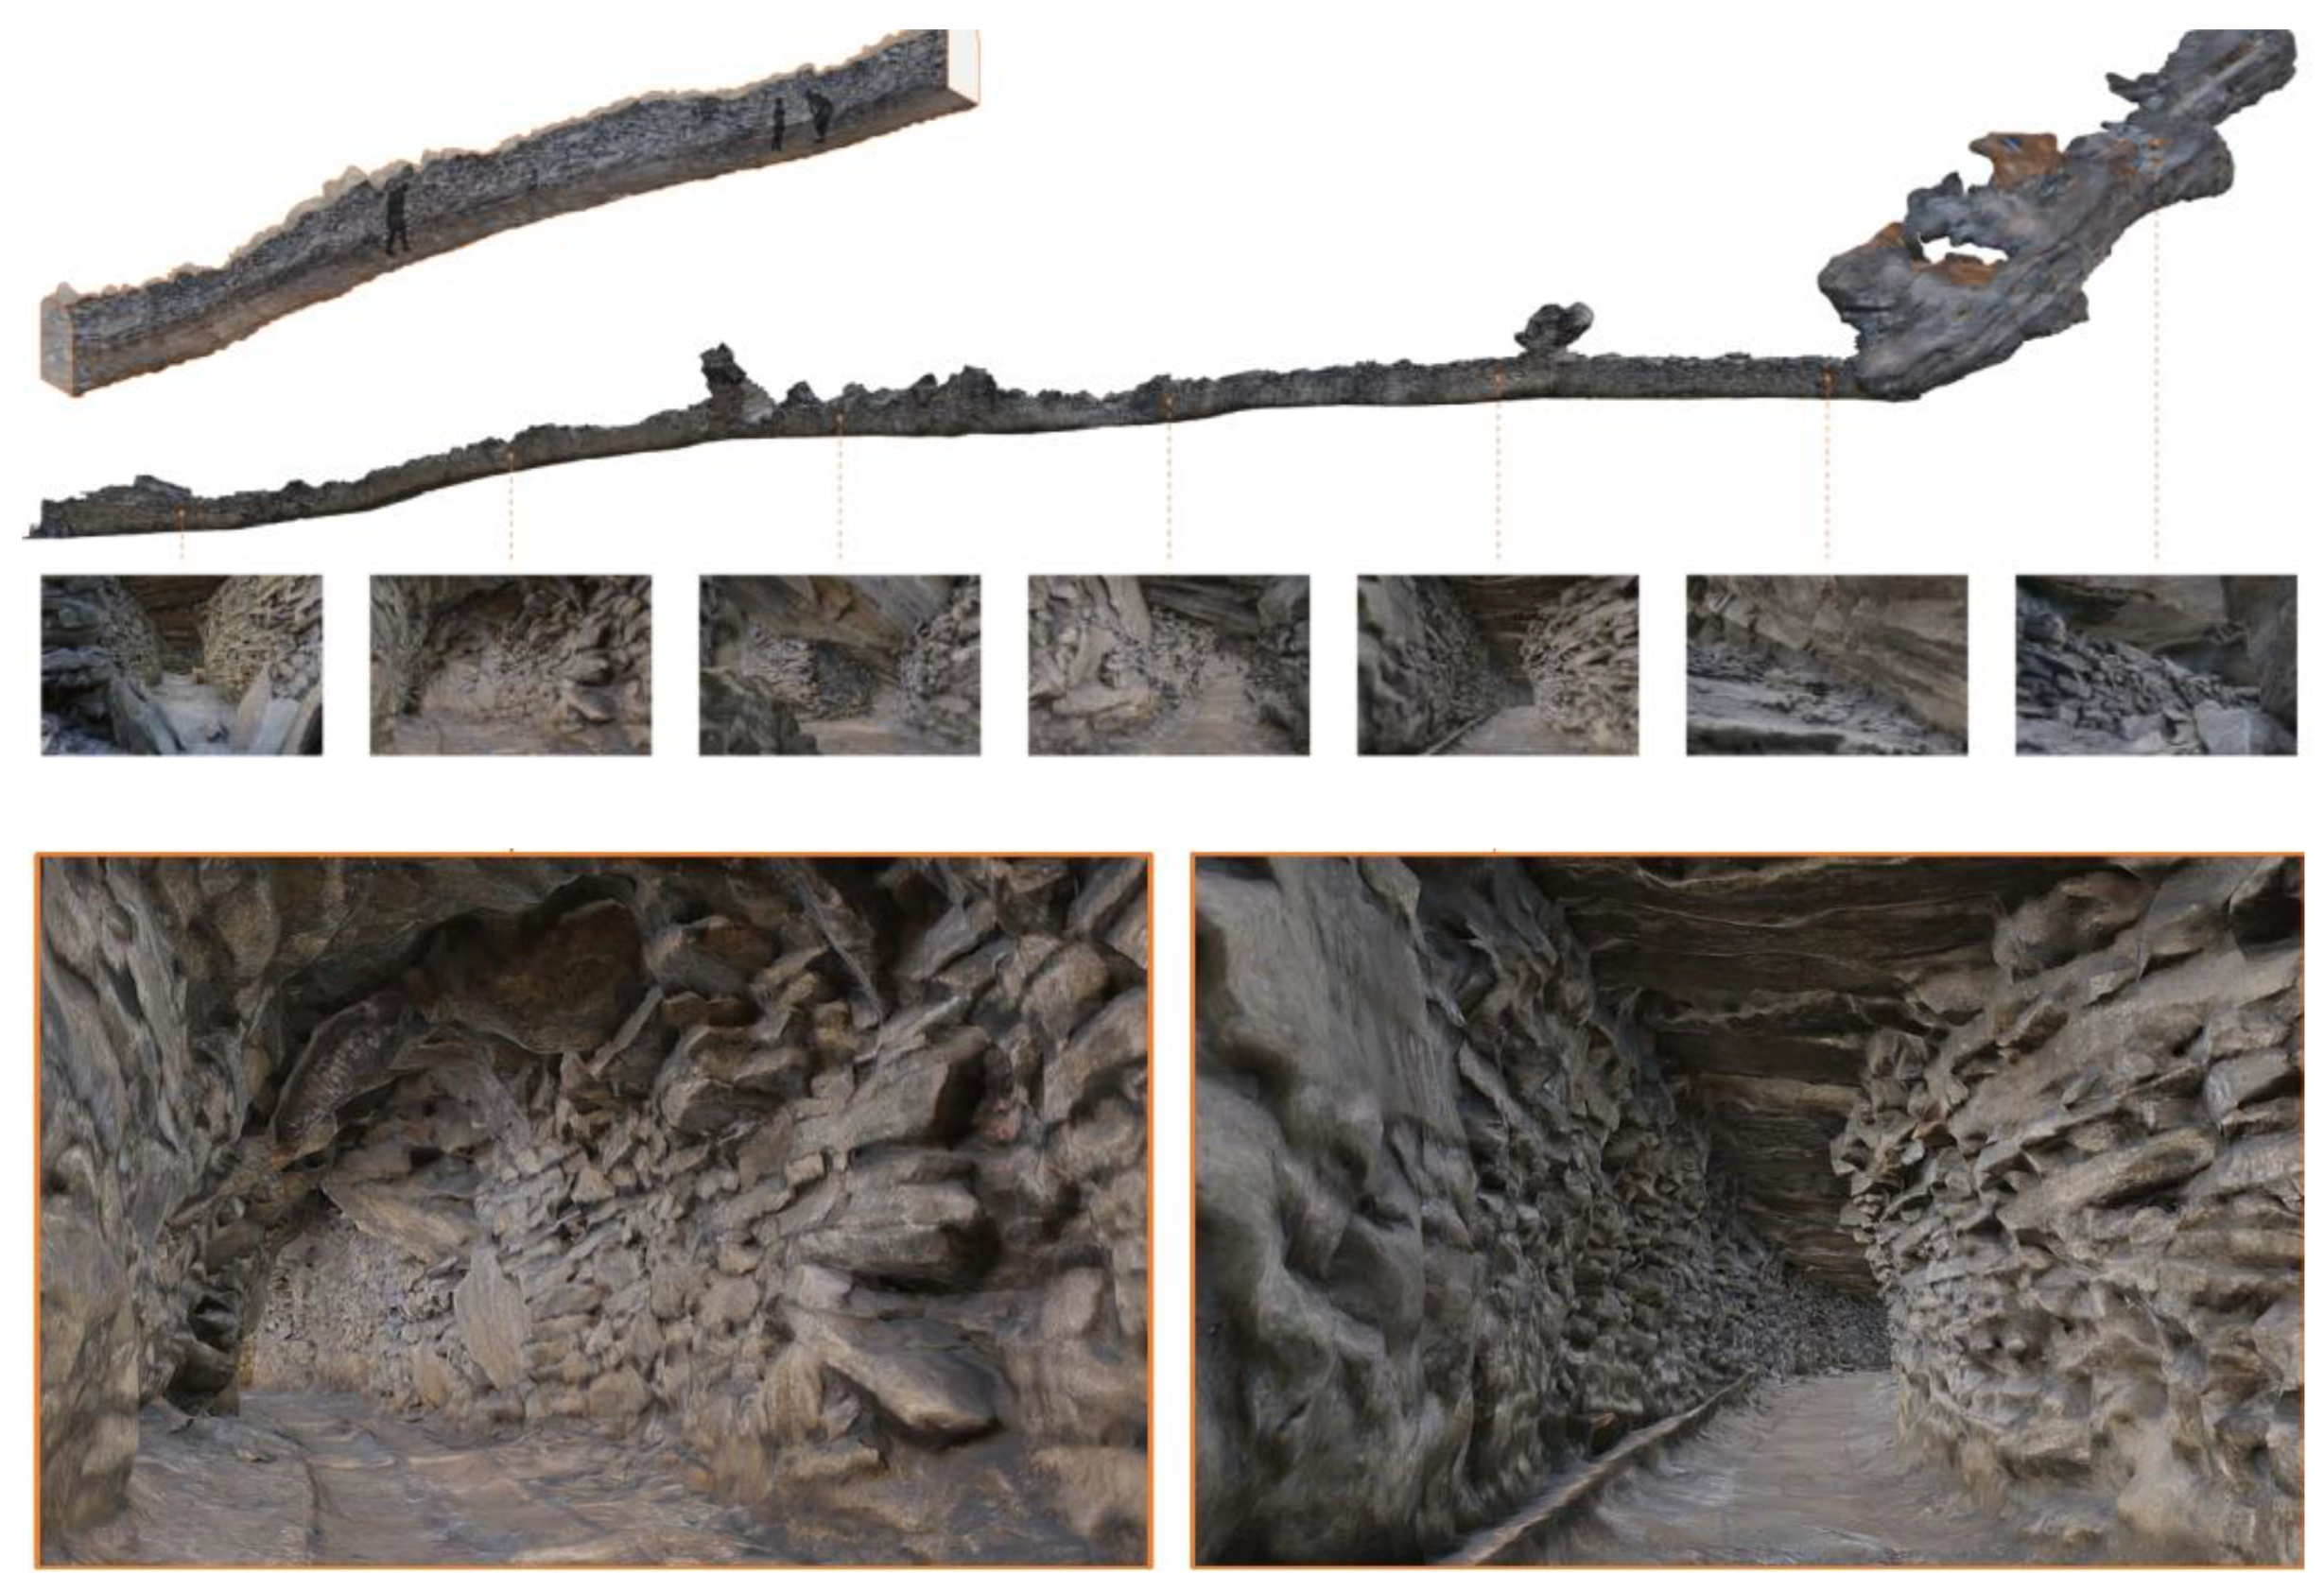
After the initial evaluation the system was thoroughly put to the test further in similar scenarios to the one just presented, i.e. the main target application for the multi-camera, as well as for other types of application not originally considered. Among the tests performed in target application, most notably, Ant3D was used to complete the survey of the network of narrow spaces and staircases of the Milan’s Cathedral (
Figure 21), partially presented in [
22]. Among the test performed in other scenarios there are: (i) the acquisition of a mountain trail path [
8], (ii) the acquisition of large [
25] and narrow [
26] mining tunnels, and (iii) the survey of a historical garden [
24] (
Figure 22).
5. Conclusions
This investigation aimed to develop an image-based measurement system capable of completing the three-dimensional digitization of complex and narrow spaces while acquiring high-resolution photographic documentation.
After an initial experimentation phase based on the use of low-cost hardware culminated in the FINE Benchmark, numerous limitations were highlighted, such as (i) the suboptimal multi-camera acquisition geometry; (ii) the use of low-cost rolling shutter type sensors, not suitable for moving acquisitions; (iii) the poor acquisition synchronization between the component cameras of the system, which limited the stability of the rigid distances between the cameras and thus the effectiveness of them as a constraint during the processing phase.
At this point, the objective was to overcome these limitations to arrive at the definition of the working prototype of the proposed multi-camera system. This phase saw the overcoming of the low-cost hardware used previously, favoring specialized sensors that could produce more accurate results, removing the uncertainty introduced by the lack of synchronization between the cameras and rolling shutter sensors. It has been verified that the hardware specifications of the working prototype (global shutter sensors and synchronization error lower than 200 microseconds) do not introduce measurable distortions in the conditions of intended use. In addition, an optimal acquisition geometry for the survey of confined indoor spaces has been defined using an approach based on the simulation of camera resolution as a function of the environment.
The numerous tests carried out in the field [
8,
22,
24,
25,
26] have demonstrated the effectiveness of the proposed solution that has allowed to achieve the objectives: to simplify and speed up the data acquisition phase and ensure an accuracy consistent with the architectural representation. All the selected case studies present a high level of difficulty and have different characteristics, covering a wide sample of possible real applications: from cultural heritage to archaeology and industry, from natural to artificial environments, from extremely narrow spaces to larger tunnels and outdoor areas.
Moreover, the instrumental drift entity was controlled for all the case studies. The initial part of the executed path has been constrained. The error has been verified at the opposite end without the use of support measurements along the path's extension. The results highlight the proposed solution's robustness compared to existing alternatives on the market, such as portable, lightweight mobile range-based mobile mapping systems.
Figure 1.
Some images of the San Vigilio Castle, tower (top) and tunnel (center); and the dimensions of the tunnel (bottom).
Figure 1.
Some images of the San Vigilio Castle, tower (top) and tunnel (center); and the dimensions of the tunnel (bottom).
Figure 2.
The GoPro array scheme (top) and an example of the 6 views inside the underground tunnel (bottom).
Figure 2.
The GoPro array scheme (top) and an example of the 6 views inside the underground tunnel (bottom).
Figure 3.
Cloud-to-cloud validation of the point clouds against ground truth. The maximum deviation error considering the better 90% of the points reported.
Figure 3.
Cloud-to-cloud validation of the point clouds against ground truth. The maximum deviation error considering the better 90% of the points reported.
Figure 4.
Calibration text fields: texture-less semi-sphere (left) textured corner (right).
Figure 4.
Calibration text fields: texture-less semi-sphere (left) textured corner (right).
Figure 5.
Section view of an example calibration test field set-up on the field for the self-calibration of the multi-camera baselines (left) and two images acquired by the multi-camera system (right).
Figure 5.
Section view of an example calibration test field set-up on the field for the self-calibration of the multi-camera baselines (left) and two images acquired by the multi-camera system (right).
Figure 6.
The figure reports the four families that were considered for arrangements. For each category, different orientations of the cameras were simulated and compared. All schemes depict the configuration in the vertical plane of the tunnel cross-section except for the Horizontal rig, which is shown in plan view.
Figure 7.
The figure illustrates the framing of two points, P1 and P2, at the same distance, h, from the camera and forming the same angle θ with the optical axis. It follows that the GSD for the two points is the same. However, the is different, the weighted metric is worse for point P1 based of the greater angle between the point normal (green arrow) and the image normal (red arrow).
Figure 10.
Check of the synchronisation error performed with the aid of a synchronometre, the resolution of the devices is of 10μs.
Figure 10.
Check of the synchronisation error performed with the aid of a synchronometre, the resolution of the devices is of 10μs.
Figure 11.
Geometry of the simulated synthetic 3D environment used during the tests, the multi-camera rigs are positioned in 0 in the center and pointing forward.
Figure 11.
Geometry of the simulated synthetic 3D environment used during the tests, the multi-camera rigs are positioned in 0 in the center and pointing forward.
Figure 12.
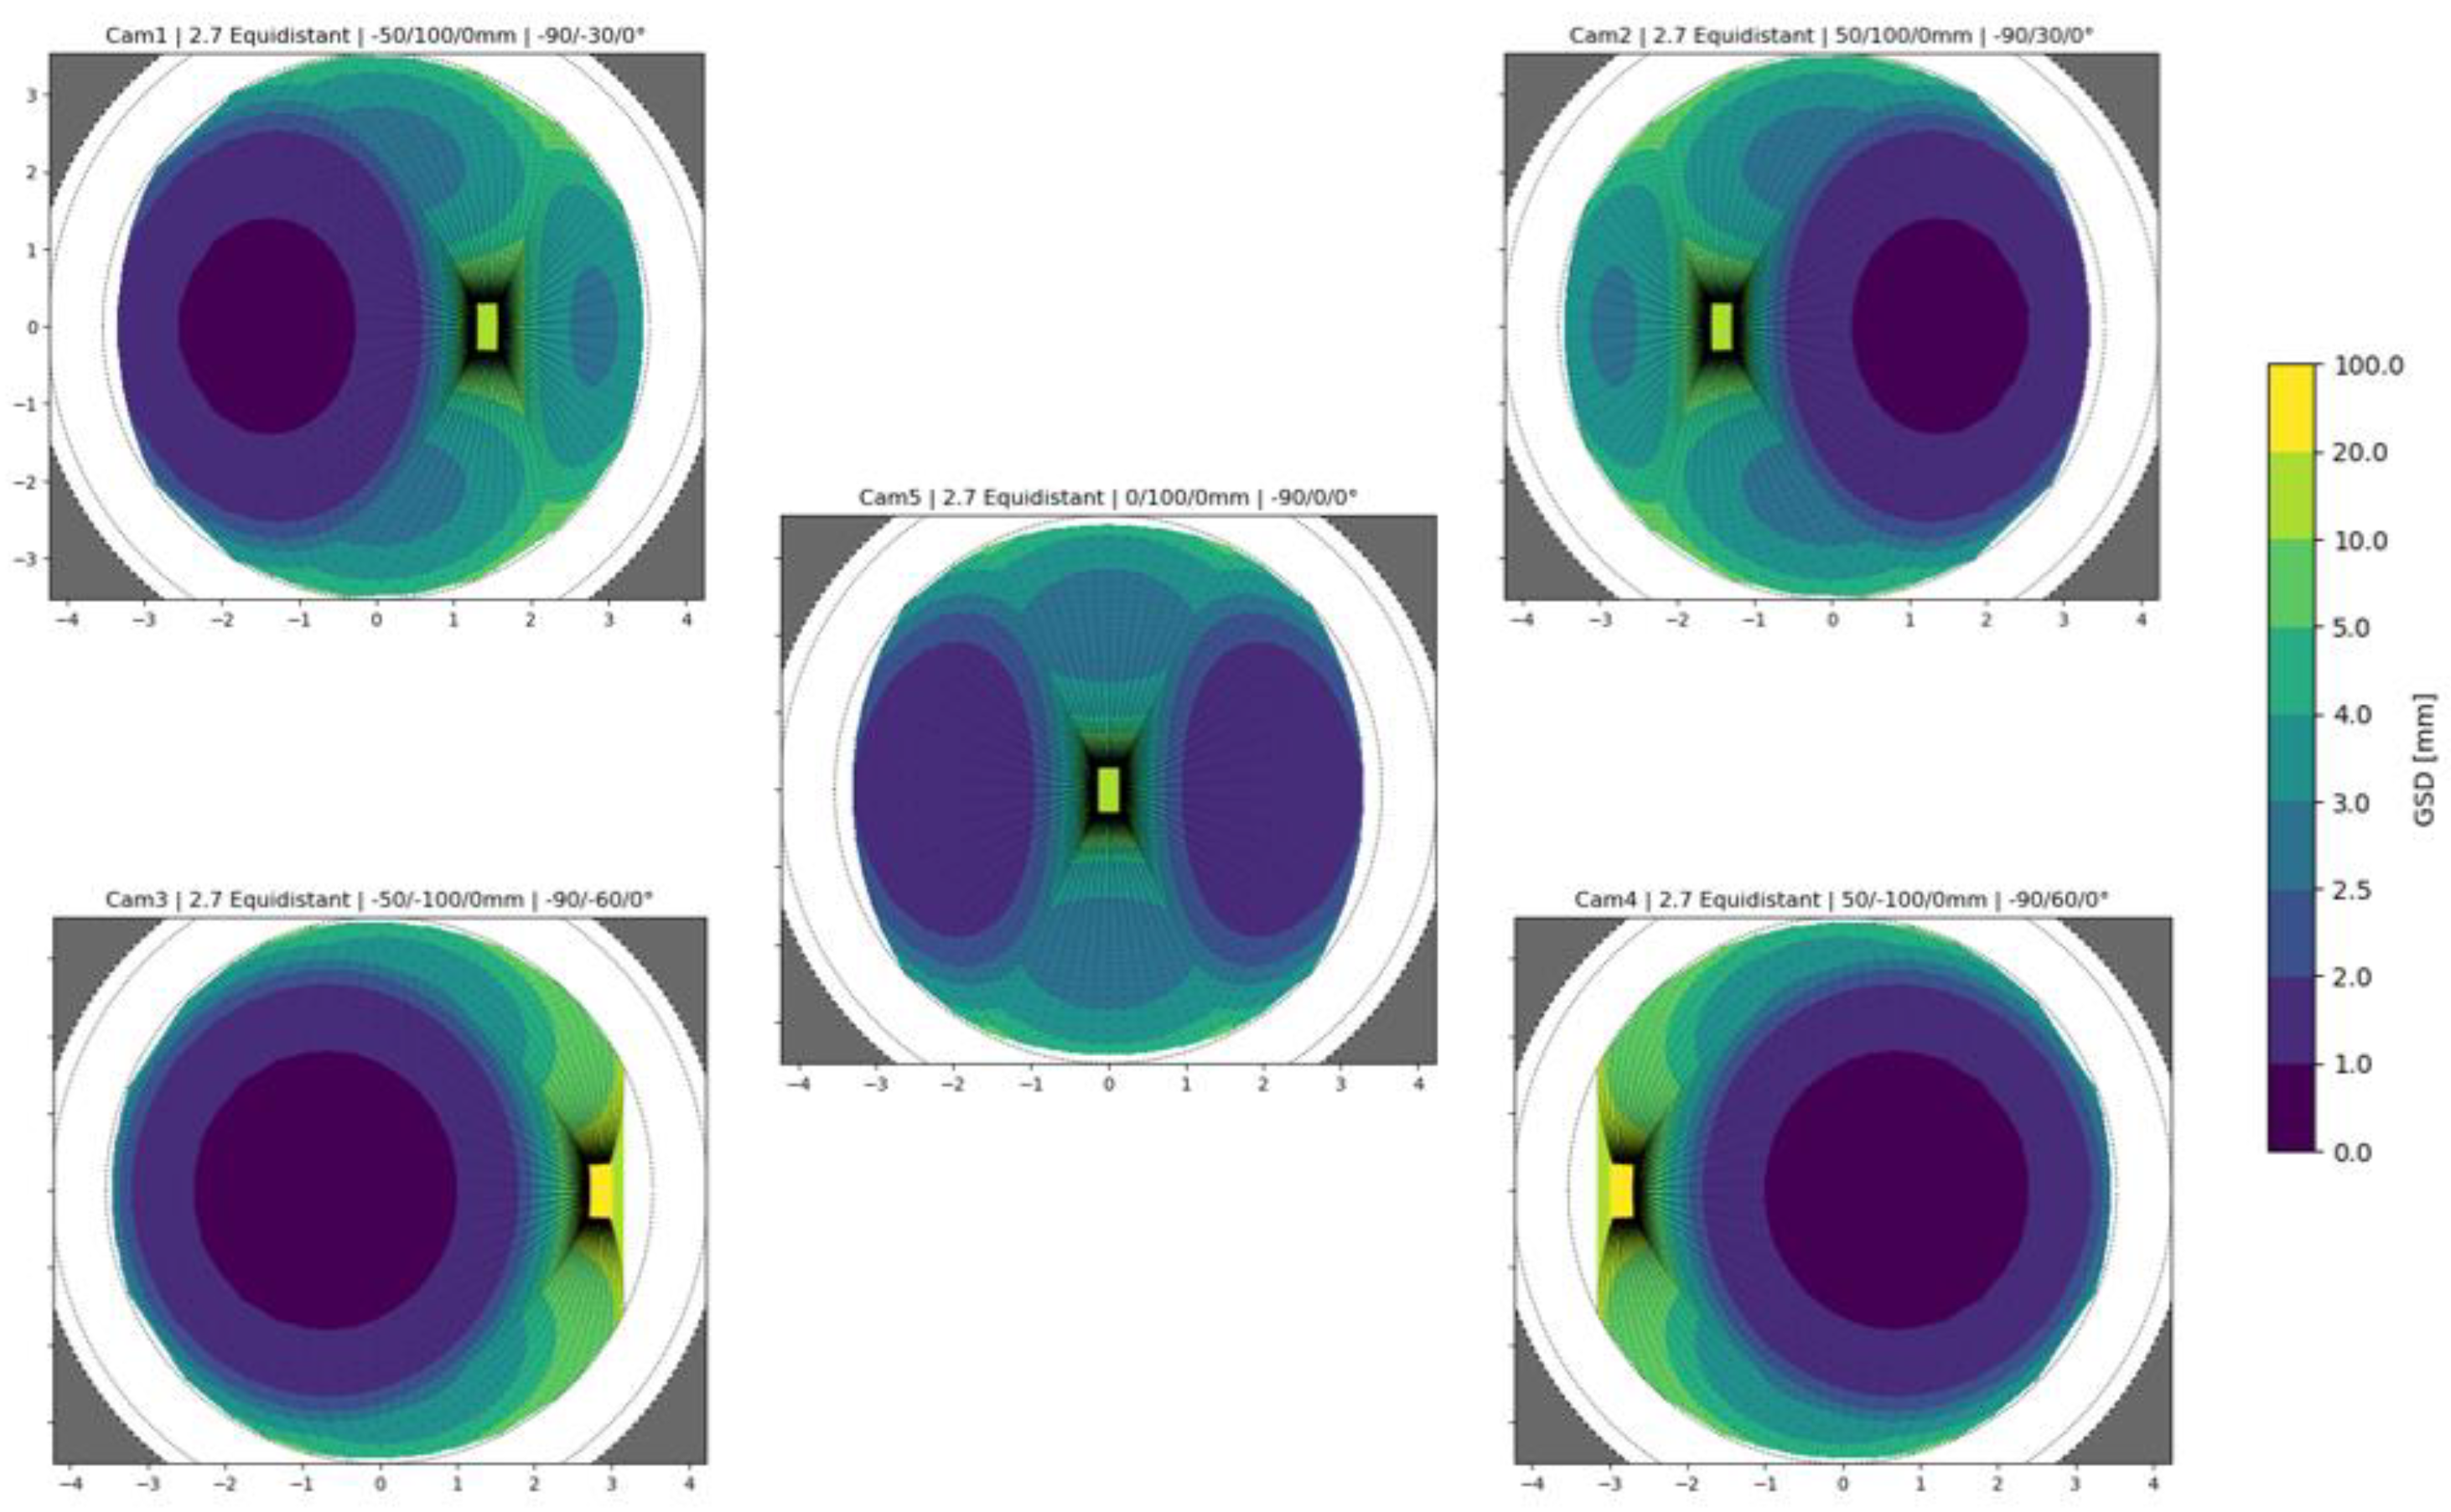
GSD distribution simulated in image space for one of the tested configurations.
Figure 12.
GSD distribution simulated in image space for one of the tested configurations.
Figure 13.
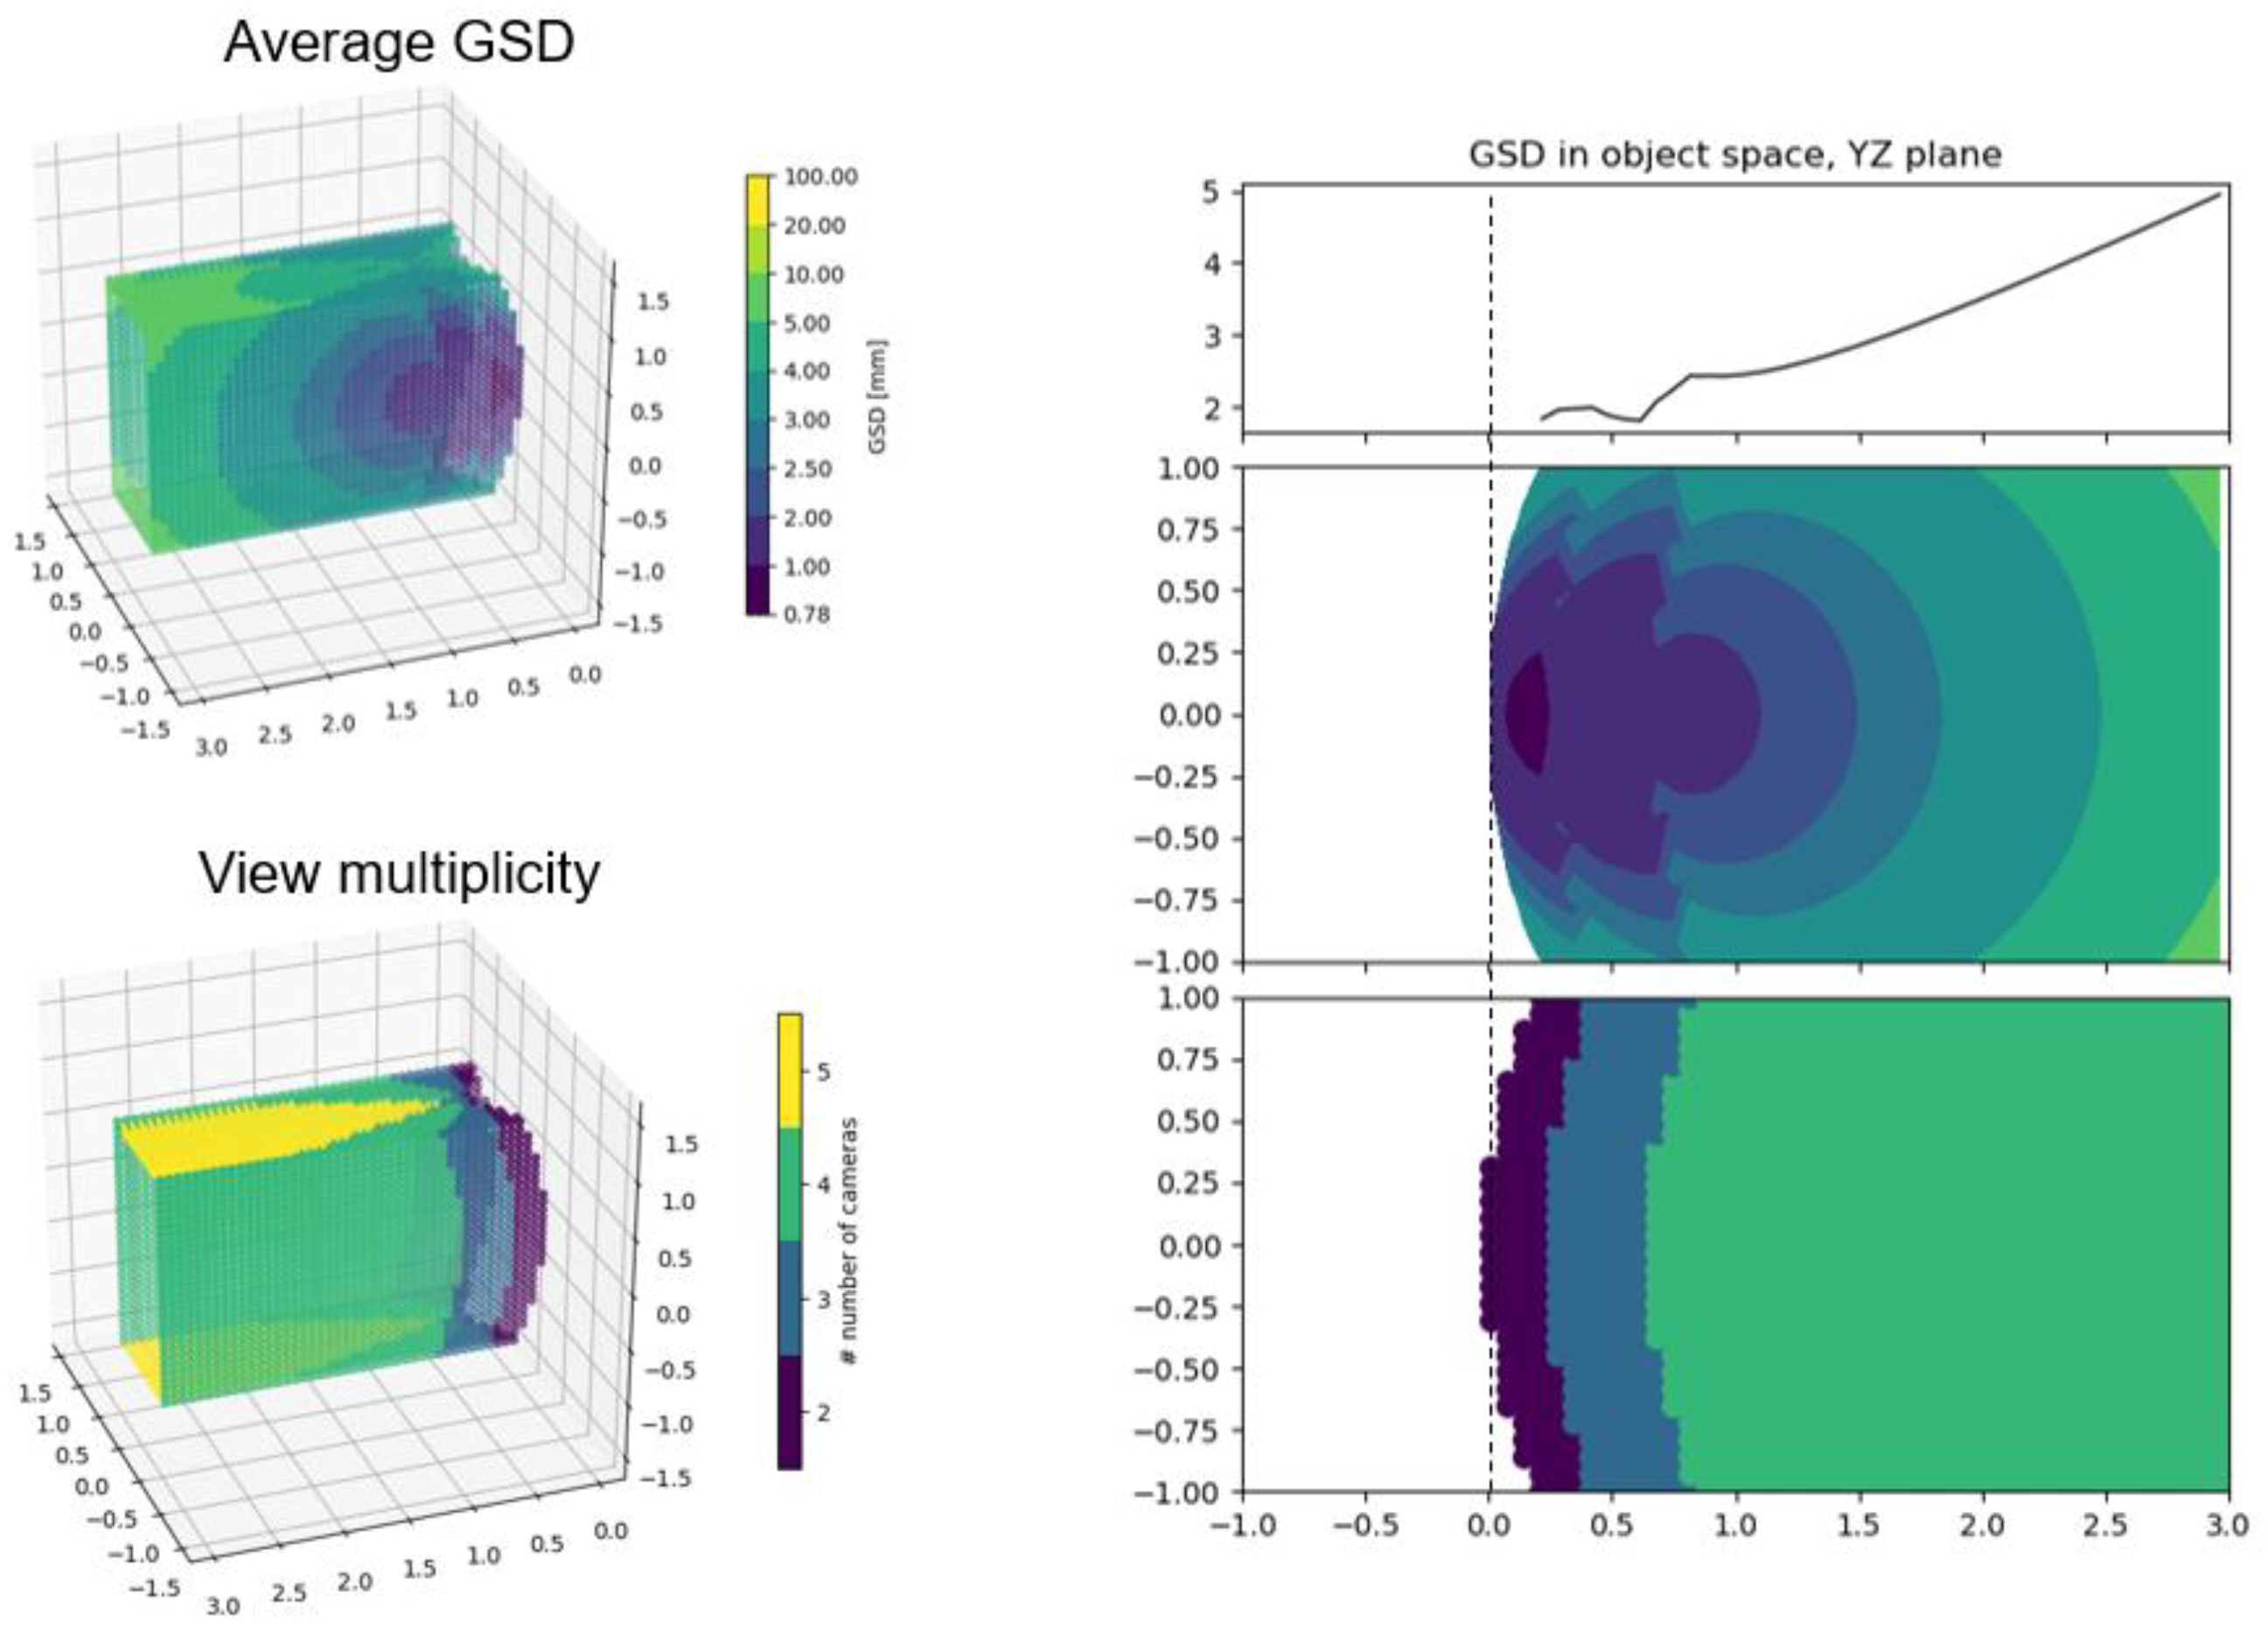
GSD distribution in object space, the 3D plots on the left show the metric (top left) and the view multiplicity for each point (bottom left). On the right (right-center and right-bottom) the same information is shown in 2D on the YZ plane of the side wall of the simulated environment. Finally, the plot at right-top shows the mean computed column wise of the GSD distribution on the YZ plane (right-center), the curve represents how the GSD is distributed on the side wall of the tunnel.
Figure 14.
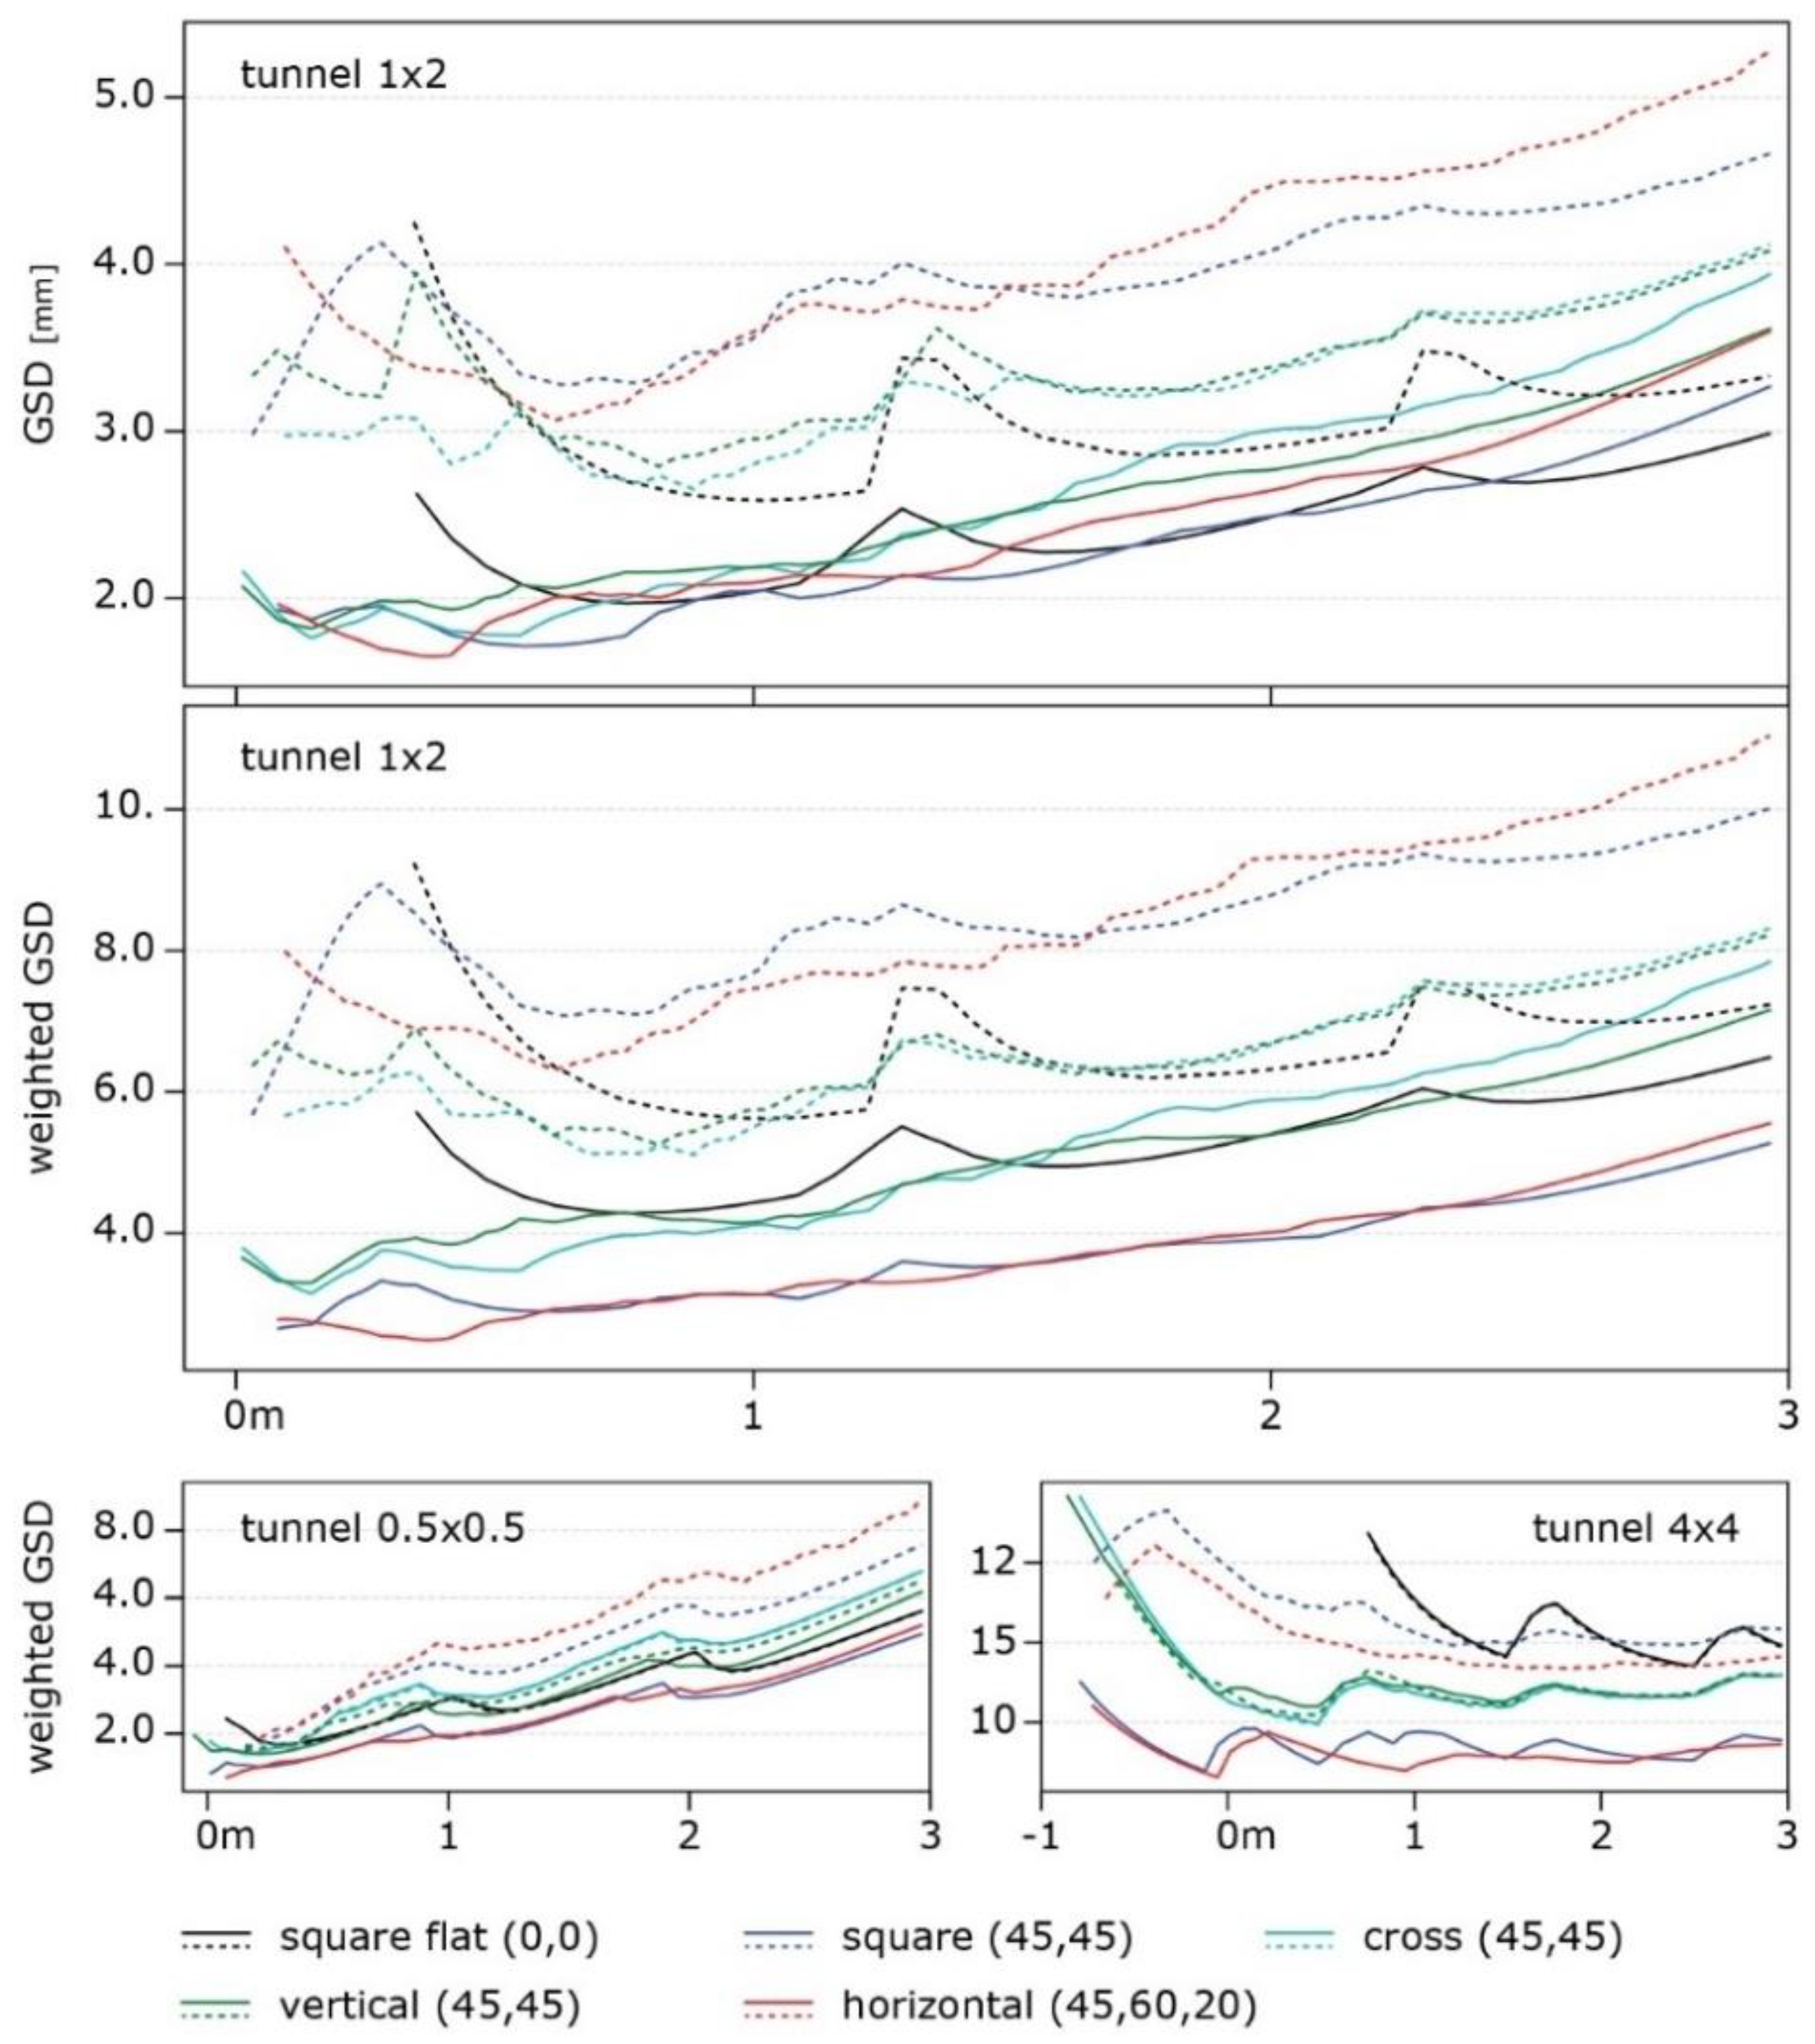
The graphs report the comparison of the selected configurations. The x-axis represents the length of the tunnel along its extension: continuous and dashed lines describe the GSD distribution on the vertical and horizontal plane of the tunnel, respectively. Three consecutive poses of the multi-camera rig are considered at positions 0, 1, and 2m. The top and center graphs are considered virtual tunnels of 1m x 2m, while the bottom-left and bottom-right graphs are considered square tunnels of 0.5m and 4m, respectively.
Figure 15.
Schematic of the proposed multi-camera system. The figure reports the actual angles between the cameras used in the implementation of the prototypes and also includes a range of adjustments that could be implemented for future builds to adapt the device for different target environments. Additional sensors, such as IMUs, are not yet implemented but could be included in future iterations.
Figure 16.
Picture of the second version of the prototyped instrument. The picture shows the probe in the front, the backpack that houses the PC, and the battery on the back on the left.
Figure 16.
Picture of the second version of the prototyped instrument. The picture shows the probe in the front, the backpack that houses the PC, and the battery on the back on the left.
Figure 17.
Scheme of the processing phase.
Figure 17.
Scheme of the processing phase.
Figure 18.
Images of the survey operation on the field, acquisition of the self-calibration testified (first row) and of the castle areas (second row).
Figure 18.
Images of the survey operation on the field, acquisition of the self-calibration testified (first row) and of the castle areas (second row).
Figure 19.
Plan view (top) and elevation view (bottom) of the San Vigilio reconstruction.
Figure 19.
Plan view (top) and elevation view (bottom) of the San Vigilio reconstruction.
Figure 20.
distance between the multi-camera (red) and the reference (blue) point clouds. On the left at the extreme of the tunnel (4cm) and on the right at the extreme of the tower (2.6cm).
Figure 20.
distance between the multi-camera (red) and the reference (blue) point clouds. On the left at the extreme of the tunnel (4cm) and on the right at the extreme of the tower (2.6cm).
Figure 21.
Elevation view of the point cloud generated from the Ant3D survey of Milan’s Cathedral façade’s narrow spaces and corridors. Image extracted from [
22].
Figure 21.
Elevation view of the point cloud generated from the Ant3D survey of Milan’s Cathedral façade’s narrow spaces and corridors. Image extracted from [
22].
Figure 22.
3D model generated from Ant3D survey of an abandoned mining tunnel. Images are extracted from [
26].
Figure 22.
3D model generated from Ant3D survey of an abandoned mining tunnel. Images are extracted from [
26].
Table 1.
Evaluation of the different tests. The table reports the residuals on the CPs (black points) with the three reconstructions oriented over the GCPs (white points).
Table 1.
Evaluation of the different tests. The table reports the residuals on the CPs (black points) with the three reconstructions oriented over the GCPs (white points).
| |
1 fps |
2 fps |
4 fps |
CPs scheme |
| n° tie points [M] |
3.1 |
6.8 |
15.3 |
 |
| CPs [cm] |
T07 |
1.92 |
1 |
15.99 |
| T11 |
1.38 |
2.38 |
30.82 |
| T14 |
2.2 |
2.78 |
55.39 |
| T18 |
5.21 |
6.61 |
75.94 |
| T21 |
3.55 |
4.59 |
75.65 |
| T24 |
2.82 |
3.69 |
89.26 |
| T26 |
4.01 |
4.28 |
89.36 |
| T27 |
7.12 |
6.6 |
83.55 |
| T29 |
13.34 |
10.9 |
75.34 |
| |
worst |
13.34 |
10.9 |
89.36 |
