Preprint
Article

Influence of Vermicompost on the Concentration of Exogenous Indole-3-Acetic Acid and Its Effect on the Development of Tomato Plants (Lycopersicum esculentum L.)

Altmetrics

Downloads

136

Views

56

Comments

0

A peer-reviewed article of this preprint also exists.

Submitted:

03 June 2024

Posted:

04 June 2024

You are already at the latest version

Alerts
Abstract
The presence of exogenous auxins such as indole-3-acetic acid (IAA), has been reported in organic materials such as vermicompost. The objectives of this work were to quantify the concentration of IAA in sand-based substrates with vermicompost (S-VC), to establish the relationship between the concentration of exogenous IAA and the amount of vermicompost (VC), as well as determine its influence on the development of tomato plants. S-VC substrates with different percentages based on volume (0, 20, 40 and 50% VC) placed in pots were used to transplant tomato seedlings. In each substrate, the concentration of IAA was determined at the beginning and at the end of a culture cycle, as well as the bacterial load. In addition, some performance components were measured in the plants. The results show that by increasing 1 kg of VC in a sand-based substrate, the concentration of exogenous IAA increases both at the beginning and at the end of the experiment (0.0470 and 0.0642 mg g-1, respectively); a result that, in turn, was related to the colony-forming units of gram-positive bacteria (Bacillus spp., mainly). Behavior that is reflected in tomato plants; for example, the root had its maximum development (371.33 cm-3) when the amount of VC in the substrate was 4.12 kg.
Keywords: 
Subject: Biology and Life Sciences  -   Agricultural Science and Agronomy

1. Introduction

The activation of phytohormones or plant hormones, endogenous organic compounds in plants, depends on several factors such as light intensity and type, availability of water and nutrients, and even the amount of exogenous auxins [1,2]; these compounds regulate different functions such as plant growth or development, seed and fruit ripening, leaf fall, flowering time, and plant longevity [3]. The main plant hormones are auxins, gibberellins, cytokinins, abscisic acid, ethylene, jasmonates, salicylic acid, and brassinosteroids, of which, jasmonates and salicylic acid are of recent discovery and mainly participate as signal molecules to activate defense against pathogen attacks [4]. Auxins are hormones primarily involved in plant growth; these hormones are mostly synthesized in young leaves, in what is known as shoot apical meristems [5]. One of the most relevant natural auxins is indole-3-acetic acid (IAA), and its presence has been reported even in organic fertilizers such as vermicompost (VC) [6,7,8,9]. The origin of VC is organic matter, which can be composed of plant or animal waste in any state of decomposition, as well as fruit and vegetable waste degraded by the action of microorganisms and enzymes as well as by the passage of this material through the digestive tract of earthworms [8,10]. The presence of auxins in VC has been largely associated with the presence of auxin-producing microorganisms [11]; among the genera that can be mentioned are Agrobacterium, Azotobacter, Azospirillum, Bacillus, Pseudomonas, and Serratia [12,13,14]. In this regard, VC has gained great interest for the improvement of agricultural practices and from an economic point of view [15]. The extraction of growth hormones in VC has been performed through organic solvents and an ultrasound bath for quantification by high-performance liquid chromatography (HPLC), coupled with mass spectrometry [9]. However, these types of techniques require a preparation time and cannot be used as routine assays due to their high costs [16]. Hence, colorimetric methods are an alternative for quantification of IAA [12]. On this matter, Wöhler [17] indicated that the concentration of IAA, a product of soil microorganisms, could be determined in soil by colorimetric methods while the use of HPLC allows for describing the individual indoles and the different pathways; thus both methods can be complementary. This allows deducing that, if the VC is a product of the passage through the digestive tract of the worms, this material would have a bacterial load that would produce IAA, therefore the IAA found in the VC could be quantified by colorimetric methods and related to the presence of bacteria in the material. This indicates that the concentration of IAA would be directly proportional to the amount of VC used for this purpose. As mentioned above, auxins are the main phytohormones involved in plant growth and are a key regulator of almost all aspects of plant development [18]; hence the importance of such substances in crop development. One of the most economically important crops in the world is tomato (Lycopersicum esculentum L.) [19,20,21]. Mexico is one of the main suppliers of tomato worldwide, with an international market share of 25.11% of the value of world exports [22]; 95.70% of the production is technical, which makes this activity a sector of higher productivity, minimizing the possible damages caused by environmental conditions, pests, or diseases [23]. In this regard, Ren et al. [24] reported that auxins in tomato plants play an important role in their development process, root and stem growth, and organ senescence; however, this activity can be modulated by exogenous auxins [25] such as those contained in VC. Considering this, it is likely that when growing tomato plants in substrates containing VC, the concentration of IAA found in the substrate would be a function of the amount of VC in it. In other words, by increasing the amount of VC in a substrate, the bacterial load would increase; in such a way that, the concentration of IAA would also increase and influence the development of tomato plants; however, this type of information is scarce. Based on the above, the objectives of this work were to quantify the concentration of IAA in VC and in substrates of sand-based mixtures with VC, using colorimetric methods, in order to establish the relationship between the concentration of IAA and the amount of vermicompost added to the substrate; to determine the bacterial load of these substrates and to establish their influence on the development of tomato plants in greenhouse.

2. Materials and Methods

The research was conducted in a greenhouse of the Instituto Tecnológico de Tlajomulco, located at kilometer 10 of the Tlajomulco-San Miguel Cuyutlán highway, municipality of Tlajomulco de Zúñiga, Jalisco, Mexico; during the spring-summer cycle of 2022, whit two test in the cycle.
The experiment was implemented in four stages, as described below:

2.1. Description and Preparation of the Materials for the Experiment

The substrates used were mixtures of vermicompost (VC) and sand (S). The VC was provided by the Laboratory of Plant Production of the Centro Universitario de los Altos of the Universidad de Guadalajara (Tepatitlán de Morelos, Jalisco). This organic material was prepared from fruit and vegetable wastes composted by Californian red worms (Eisenia fetida). The sand was obtained from a sandbank located in the town of San Miguel Cuyutlán, in the municipality of Tlajomulco de Zúñiga; it was sterilized in a Felisa model FE-399 automatic autoclave for 20 min. at 121 °C and with a pressure of 15 lb, to avoid the possible action of microorganisms that the material might contain.
The plant material used to evaluate the substrates was tomato (Lycopersicum esculentum L.), Río Grande variety. This is a variety of indeterminate growth and is characterized by its resistance to heat, drought, diseases, and parasites [26].

2.2. Treatment Preparation

Substrates were prepared with S and VC for greenhouse tomato production, as described by Rodríguez et al. [27]. S-VC were mixed in three proportions based on volume (T1: 80-20, T2: 60-40, and T3: 50-50%), which represented the different treatments (Table 1); in addition, there was a control with 100% S (T0).
The required amount of substrate materials (Table 2) for each treatment was determined from the percentage that would be added to each of them. Since the pots (cylindrical-shaped plastic bags of 25 cm of diameter and 30 cm of height) were 14 L, the volume of the substrate was calculated with Equation 1.
V S = ( v m ) ( f ) 100
where: VS is the volume of substrate to be used (L); vm is the total volume of the pot to be used in L; f is the percentage of substrate or treatment required.
Once the volume of the substrate was obtained, the weight required for each of the substrates was calculated using Equation 2.
P s = B d ( V S )
where: Ps, is the weight of substrate required (g); Bd is the bulk density of substrate; VS is the volume of substrate to use.
Each treatment mixture was homogenized; subsequently, a sample (approximately 1 kg) was taken for physical and chemical characterization in the laboratory where it was dried at room temperature in the shade; the rest of each mixture was placed in the pots. The treatments and control had five replicates, resulting in 20 experimental units (EU). Each EU consisted of a pot with substrate and a tomato plant. The distribution of pots in the greenhouse was completely randomized.

2.3. Physical, Chemical and Microbiological Characterization of the VC, S, and Treatments Materials

2.3.1. Vermicompost Analysis

The characteristics determined in the VC were pH, electrical conductivity (EC), percentage of organic matter (OM) by calcination; the amount of organic carbon (OC), being the result of dividing the OM percentage by the Van Benmelen factor (1. 724). Total nitrogen (TN) by the Kjeldahl method, C/N ratio (where C is OC and N is TN). The cation exchange capacity (CEC) by ammonium acetate pH 7, 1N; soluble cations, and bulk density (Bd); these as established by the Mexican Standard for Worm Humus NMX-AA-180-SCFI-2018 [28].

2.3.2. Sand Analysis

In the S, physical and chemical characteristics were obtained, such as mechanical analysis of particle size, pH, EC, OM (Walkley and Black) and OC, TN (Kjeldahl method), C/N ratio, CEC (ammonium acetate pH 7, 1N), soluble cations, and Bd; according to the Mexican Official Standard NOM-021-RECNAT-2000 for soils [29].

2.3.3. Treatment Analysis

The parameters determined were the same as those analyzed for the S since the mixture of vermicompost and sand behaves like soil, therefore the methods to be used were based on the Mexican Official Standard NOM-021-RECNAT-2000 for soils [29].

2.3.4. Extraction of Indoles from Vermicompost and S-VC Substrates

IAA extraction from VC and S-VC substrates was performed using the method proposed by Zhang et al. [9], for which, samples of 5 g of VC and each of the substrates were placed in test tubes of 100 cm3; then, for each gram of VC and substrate content, 2.8 ml of extractant solution was added to each tube. The mixture was subjected to an ultrasonic bath for 60 min to speed up the extraction. Subsequently, the mixture was centrifuged at 1096 xg for 3 min. The supernatant was recovered by decantation and placed in porcelain capsules at room temperature overnight, to allow the solvent to evaporate. After this time, the dried residual material remaining in the capsules was reconstituted with 3 ml of 1 M formic acid. Finally, it was centrifuged at 3779 xg for 6 min, recovering the supernatant.

2.3.5. Indole Quantification by Spectrophotometry

Prior to this step, the Salkowski reagent was prepared by combining 3.5 M perchloric acid with 10 mM ferric chloride hexahydrate (FeCl3 6H2O); the solution was placed in the dark to avoid oxidation. A calibration curve was used to quantify the indole concentration. This curve was prepared with five concentrations (0, 10, 20, 30, 40 and 50 g mL-q) of indole-3-acetic acid [IAA] (3-Indolacetic acid 98% purity from SIGMA-ALDRICH®), which were placed in test tubes. Separately, to each tube with the corresponding IAA concentration, Salkowski's reagent was added in proportions of 2:1 (v:v) and allowed to stand for 30 min in the dark at room temperature, as indicated by Celis and Gallardo [30]. After the rest time had elapsed, the samples were read in a UV-spectrophotometer (Rayleigh, Vis-7220G) at a wavelength of 530 nm, from which the calibration curve was obtained with a coefficient of determination (R2) of 0.9804, which is presented in Equation (3).
A b s = 0.0102 * I A A
where Abs is the absorbance at a wavelength of 530 nm; IAA is the concentration expressed as indole-3-acetic acid equivalents (Eq IAA) in μg mL-1.
Like the calibration curve, the extracts of the different treatments were prepared using 1 ml of each one, and the absorbance of each was obtained in order to estimate the concentration of Eq IAA in the treatments by clearing Eq IAA from equation 3, obtaining Equation (4).
I A A = A b s 0.0102
where the variables have the same meanings as in Equation 3.
The quantification of indoles in the substrates was carried out at the beginning and at the end of the experiment.

2.3.6. Identification of Bacterial Strains in Vermciocompost

The bacterial strains of the vermicompost were identified from the colonies coming from the 10-4- and 10-5 dilutions with a creamy, matte white appearance with irregular edges. Gram staining was performed on the isolated colonies to determine the morphology.

2.3.7. Bacterial Plate Count

The bacterial plate count was performed as established by Yáñez-Ocampo et al. [32], where the culture medium was standard agar (casein peptone 5 g; glucose 1 g; yeast extract 2.5 g; agar 15 g; water q.s. to 1 L; BD Bioxon). Bacteria from each treatment were isolated with sterile water in decimal dilutions by shaking for 1 h; subsequently, 100 µl aliquots of the mixture were seeded in Petri dishes in standard agar medium and incubated at 30 °C for 24 h; finally, the colony-forming units (CFU) in each dish were counted with a LEICA colony counter model 3325.

2.4. Tomato Cultivation in Sand Substrates with Vermicompost

Tomato seedlings were transplanted into plastic pots containing the different treatments previously moistened. The plants received irrigation (2.0 L of water) every three day at noon to maintain available moisture for the plants. The control was adjusted with chemical fertilizer in order to equal the amount of nutrients corresponding to T3 (50% VC) and to avoid a bias due to the lack of nutrients in the control. None of the plants were pruned, as is commonly done in this type of crop [33]. Every 15 days after transplanting (dat) for two months, measurements of plant height (PH), stem diameter (SD), and leaf number count (NL) were taken to monitor plant development. After the two months, the number of flower clusters (FC), number of secondary stems (SS), and root length [RL], root volume [RV], and root dry weight [RW]) were counted.

2.5. Statistical Analysis

An analysis of variance (α = 0.05) was performed to determine the effect of the treatments on the concentration of Eq IAA, as well as to establish the influence of the treatments on the variables evaluated in the plant; in addition, a test of means by Tukey's method (p ≤ 0.05) was performed to identify the treatment with the greatest effect. Likewise, relationships were established by three linear regressions with a 95% significance level (p ≤ 0.05); in the first two, the amount of VC in the treatments was considered an independent variable, while the concentration of Eq IAA (beginning and end of the experiment) and CFU (end of the experiment) represented the dependent variables. In the third relationship, CFU was considered an independent variable, and Eq IAA concentration a dependent variable. The statistical program used during this stage was Minitab 17 [34].

3. Results

3.1. Characteristics of the Vermicompost

The VC presented TN and OM contents (2.24 and 48.15%, respectively), with a pH of 7.3 and an EC of 2.1 dS m-1, as well as a CEC of 130 cmol(+) kg-1 and a Bd of 0.72 g cm-3. These values are within the reference range for vermicompost (Table 3), though the soluble or available cations were lower than those of the reference. The K and Mg contents were high (0.78 and 0.45%, respectively). Only the soluble Ca content and extractable phosphorus could be considered low. However, vermicompost has an extra quality.
In addition, bacteria of the genus Bacillus spp. were mostly identified in the VC. Furthermore, this material had a concentration of Eq IAA of 0.686 µg mL-1 (0.572 µg g-1 of auxins).

3.2. Physical, Chemical, and Biological Characteristics of the Treatments

The physical and chemical characteristics of the substrates (treatments) showed differences (α = 0.05) between treatments (Table 4). For example, pH decreased as the amount of VC increased in the substrate mixtures; it went from a slightly alkaline pH (T0, pH = 7.8) to a neutral pH (T3, pH = 7.4). This trend was maintained in the Bd (from 1.16 to 1.04 g cm-3). In contrast, the rest of the chemical characteristics had an inverse behavior. In the case of CEC and the concentration of available cations (Ca, Mg, K, and P), it was detected that, as VC increased in the treatments, CEC and the concentration of cations increased; T3 being the treatment with the highest concentration and a CEC of 51.77 cmol(+) kg-1. A relevant aspect is that the cation with the highest concentration was K+ at T3 (0.28%); similar to what occurred with OM, TN, and P within treatments.
At the start of the experiment, the concentration of Eq IAA between treatments (Table 5) was different (α ≤ 0.05).
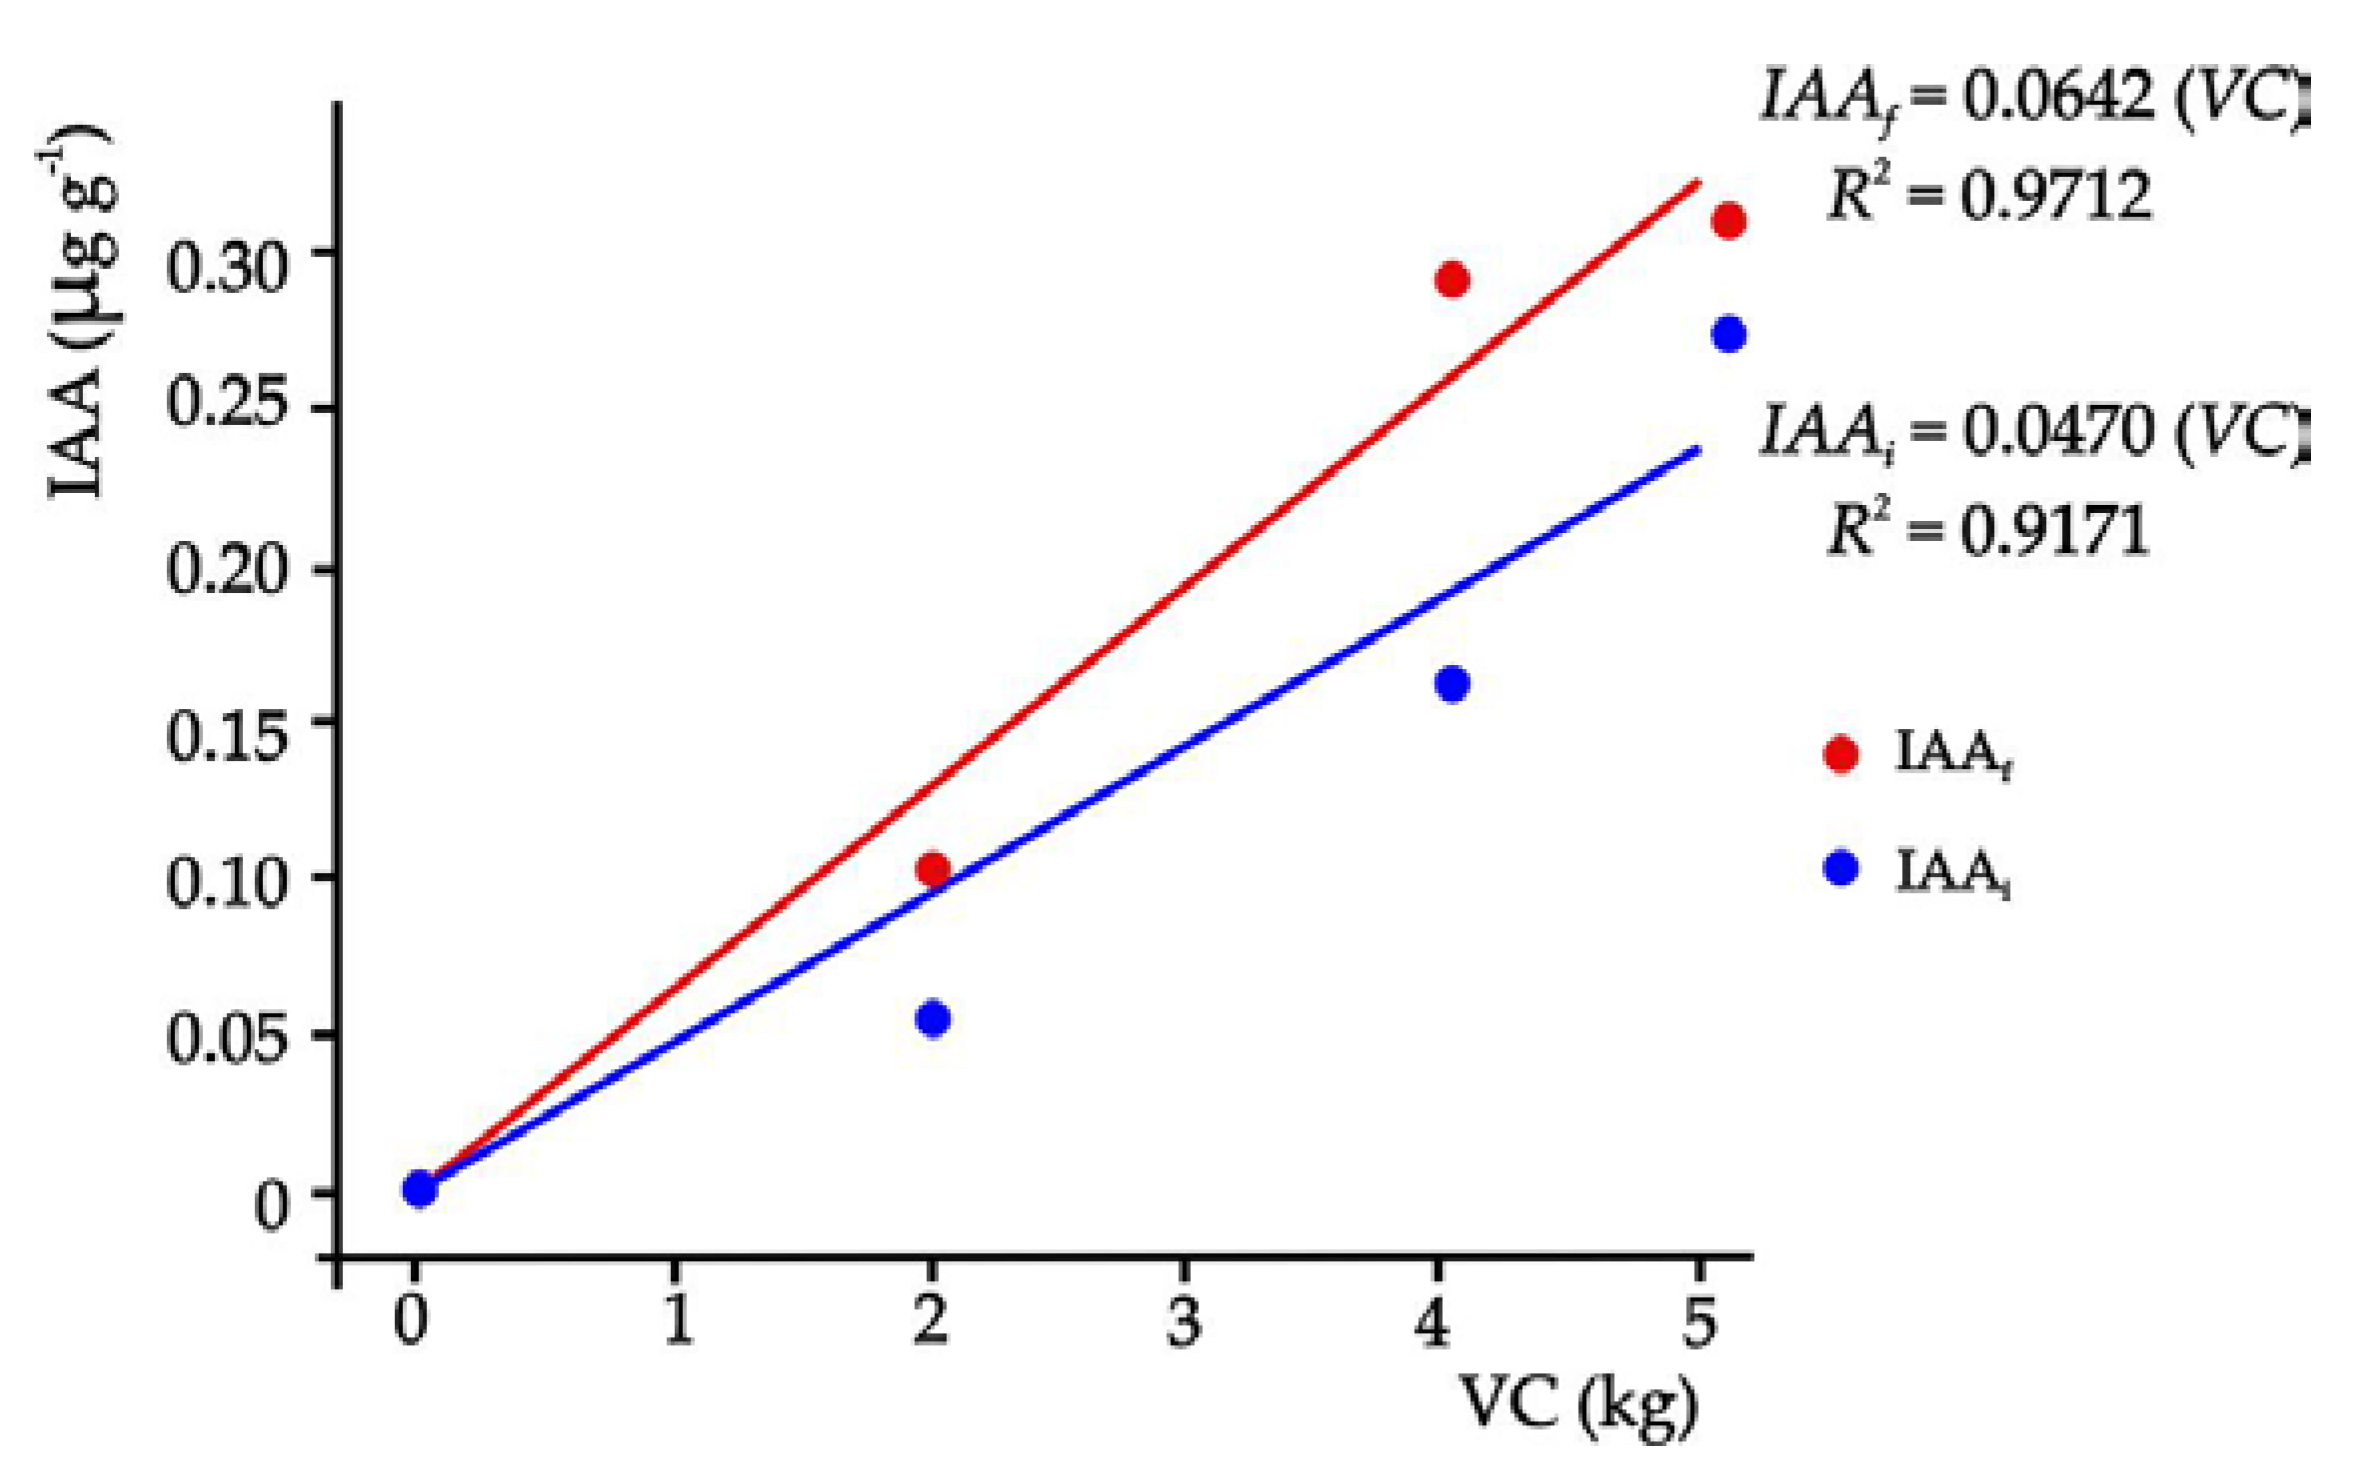
The initial concentration presented a positive trend as a function of the amount of VC in the substrate, where T3 (Tukey, p ≤ 0.05) had the highest concentration of Eq IAA (0.274 µg g-1); whereas, T1 only reached 0.055 µg g-1. In other words, the auxin concentration in the substrates increased as the amount of VC increased. When the amount of vermicompost in the substrates was linearly related to their IAA results (p ≤ 0.05), the following linear function was established (Equation 5).
I A A = 0.0470 V C
This equation had a coefficient of determination (R2) of 0.9171, which means that the amount of VC explains 91.71% of the variation in IAA concentration; in other words, auxin concentration increases in the substrate 0.047 µg g-1, when one kilogram of VC is added to the substrate (p ≤ 0.05). At the end of the experiment, the amount of auxins increased with respect to the initial ones (Table 5).
Likewise, gram-positive bacteria were found in the substrates, with Bacillus spp. being identified in the majority. It was also established that the amount of VC in the substrates influenced the CFU (α ≤ 0.05), where the highest CFU (34,400 CFU mL-1) was found in T3 (Tukey, p ≤ 0.05). In this sense, CFU were a function of the amount of VC in the substrates; when one unit (1 kg) of VC was increased in the substrate, the CFU increased 5189 CFU mL-1 in the substrate; the regression model, in other words, can explain 98.81% of the variation of CFU (p ≤ 0.05) in the substrates that were used (Figure 1).
When the amounts of VC of the substrates and the corresponding Eq IAA concentration were related at the end of the experiment (Figure 2), results showed a linear model that explains 97.12% of the variability of the Eq IAA in the substrate (p ≤ 0. 05).
This means that the increase of one unit (1 kg) of VC caused an increase of 0.0642 µg of Eq IAA in one gram of substrate with VC, but this result was presented at 60 ddt, indicating that the concentration of Eq IAA in the substrates increased at the end of the experiment.

3.3. Tomato Crop Behavior in Substrates with Different Doses of Vermicompost

Treatments had an effect (α ≤ 0.05) on the variables of the aerial part of the plant under study (Table 6). In general, VC treatments caused an increase in PH, SD, NL, FC, and SS, compared to the treatment without VC. Treatments 2 and 3 had a stronger influence on PH, NL, and FC (Tukey, p ≤ 0.05); whereas for SD and SS, the VC treatments had a similar statistical behavior. It is important to highlight that T2 influenced PH (95.53 cm), FC (13.50), and SS (10.00) while T3 influenced SD (1.50 cm) and NL (33.80).
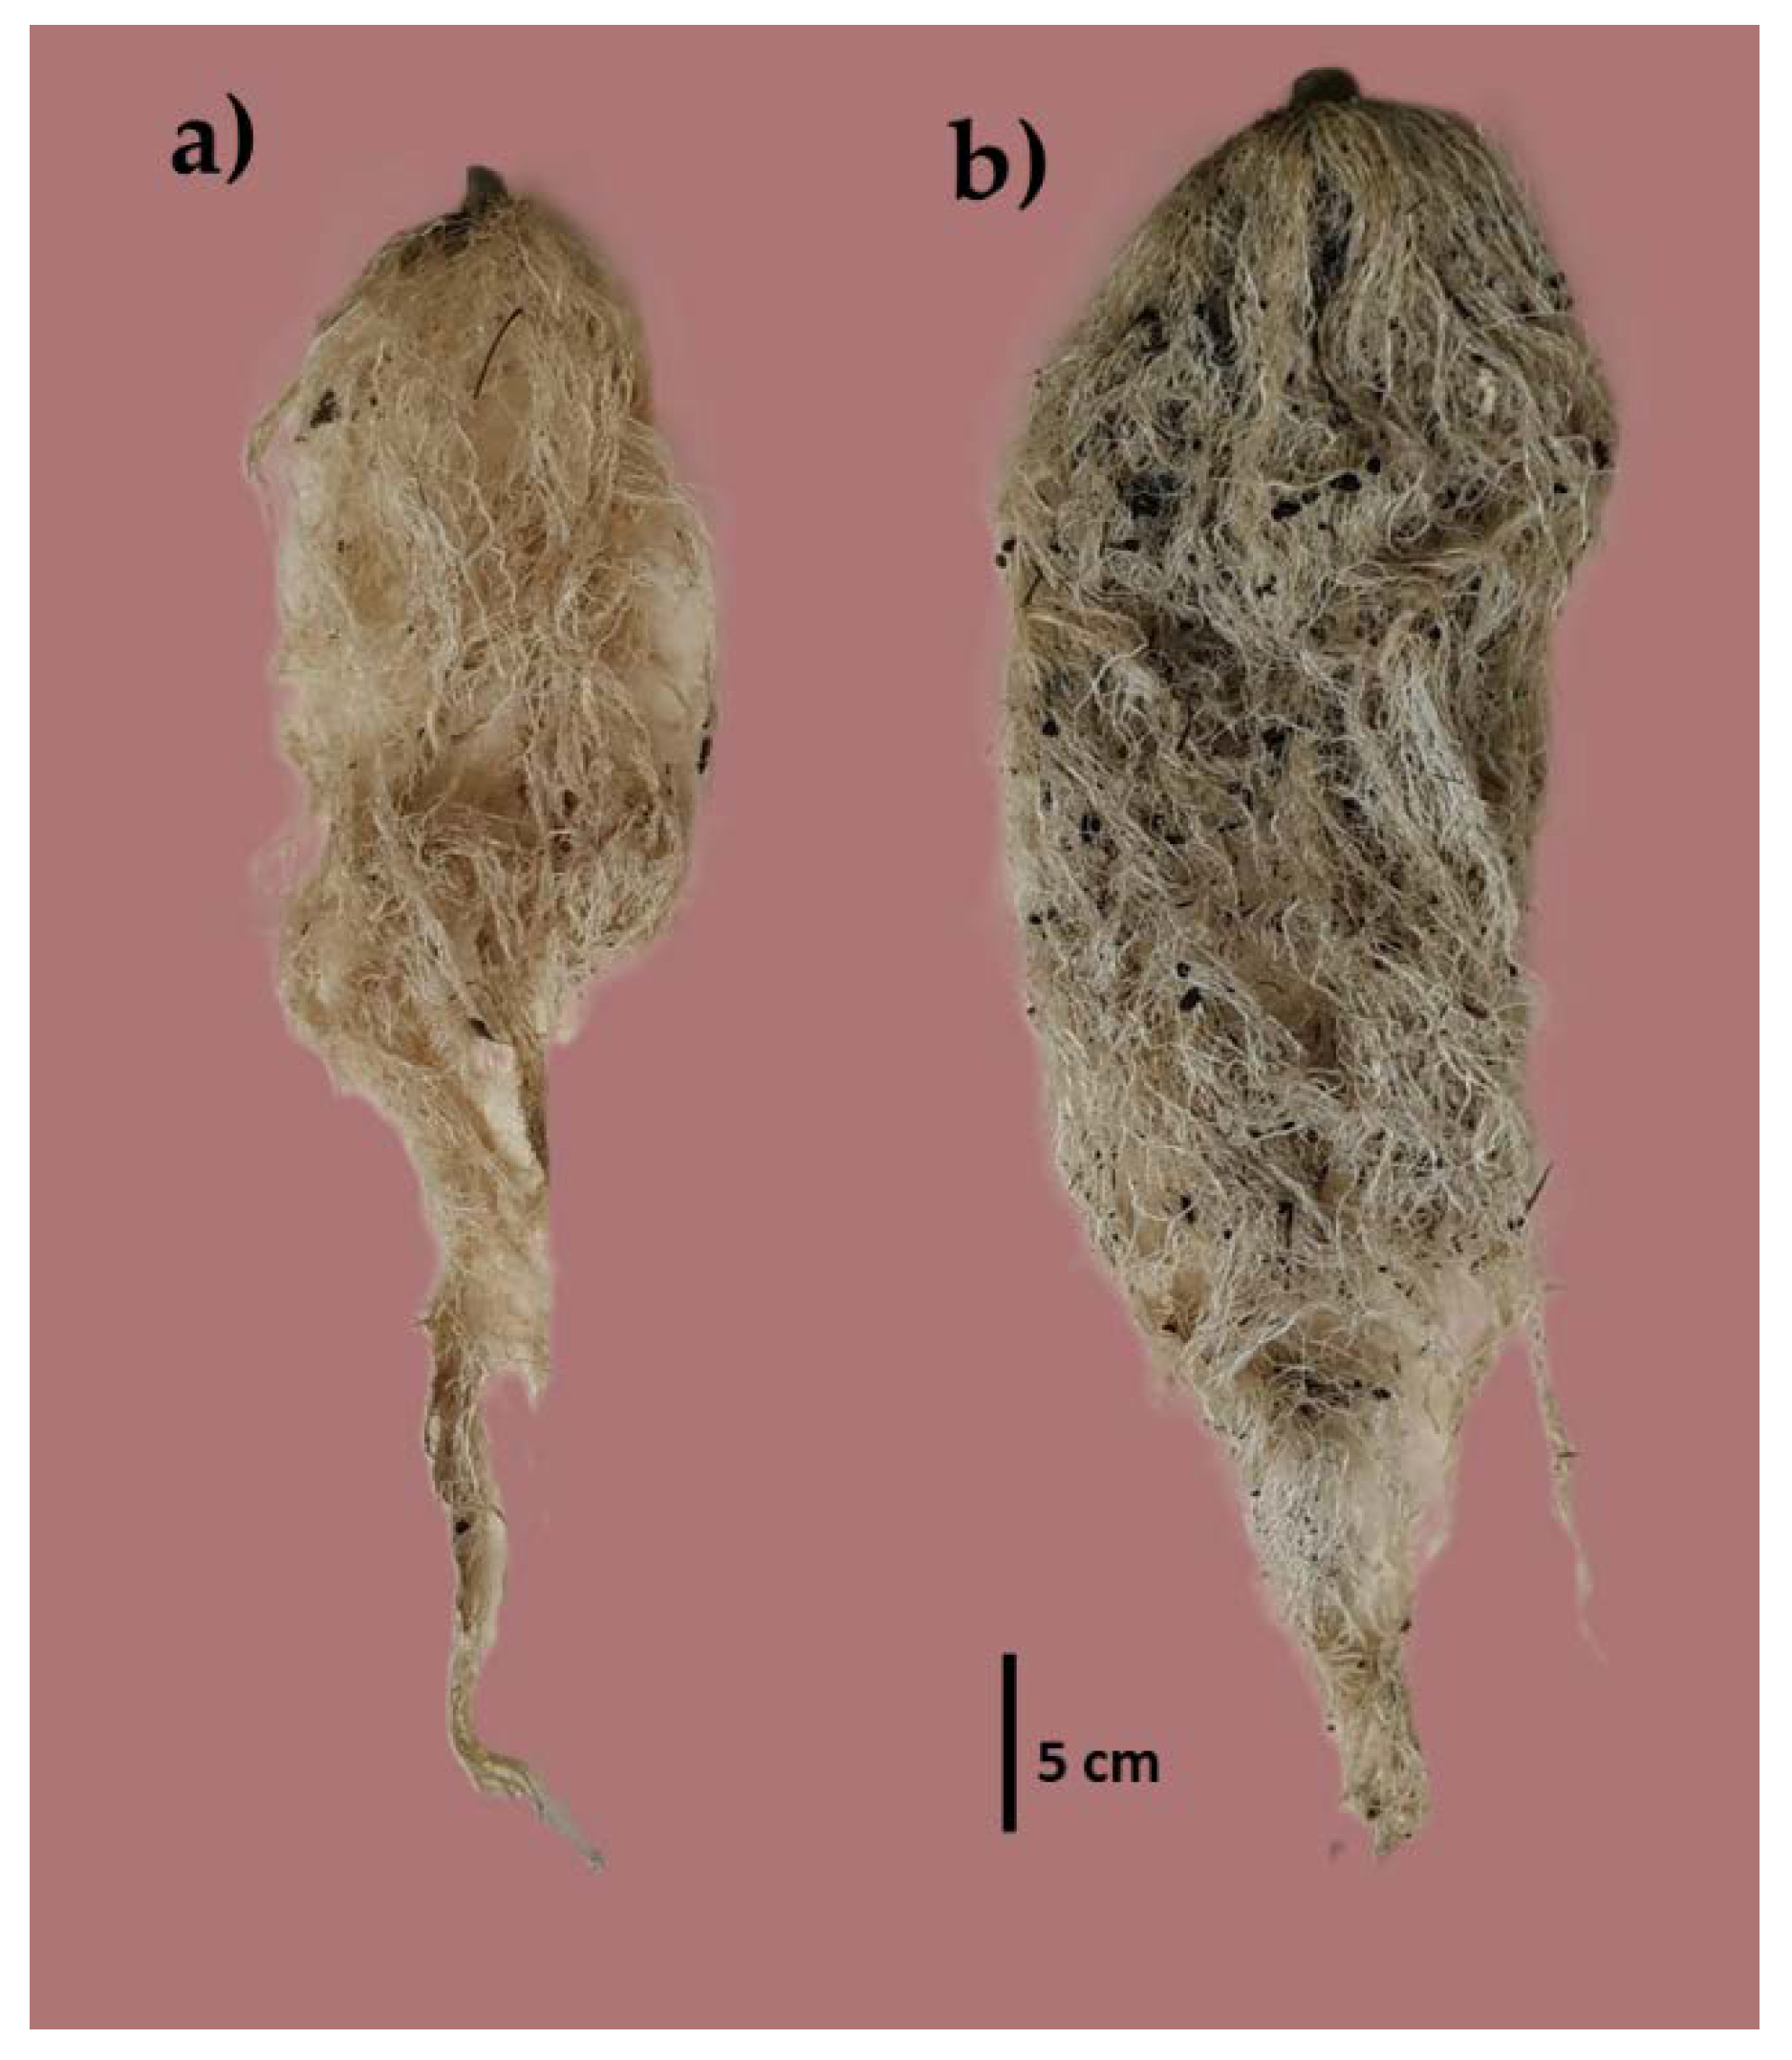
The percentage of VC influenced (α ≤ 0.05) the root development (Figure 3), where plants with T2 had the results of RV (371.00 cm3), RL (77.25 cm), and RW (64.90 g), higher than the rest of the treatments (Table 6).
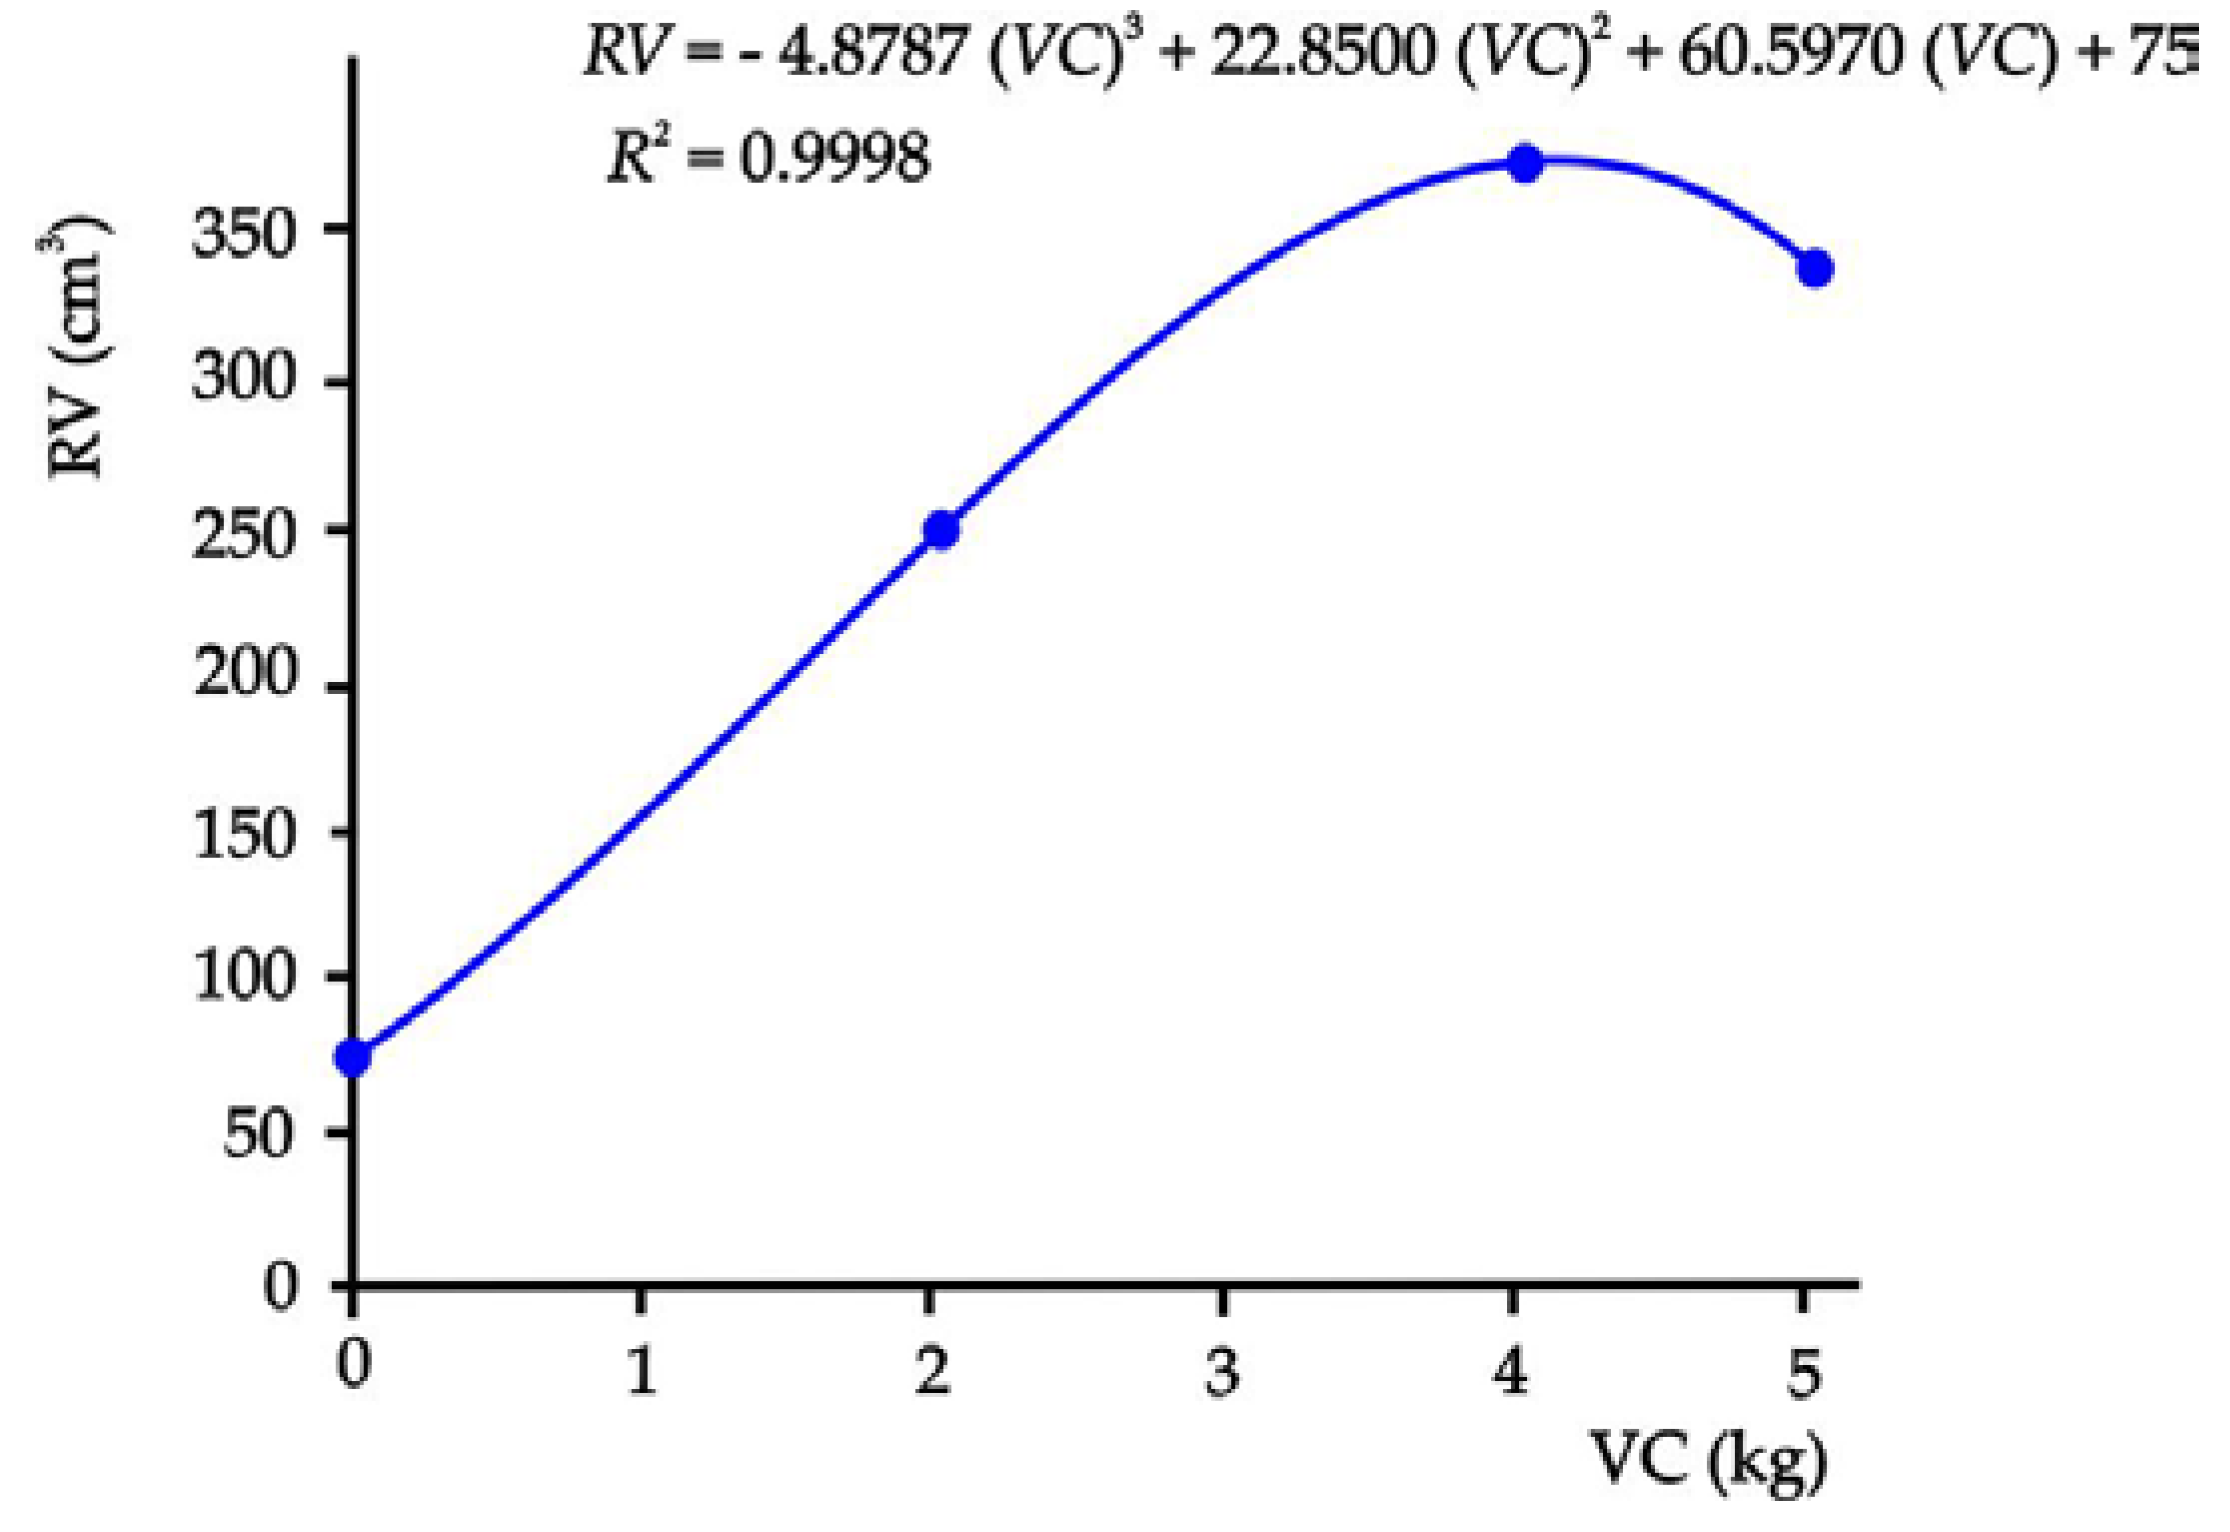
Likewise, the behavior of the root development as a function of the amount of vermicompost presented a sigmoidal behavior (Figure 4) where a polynomial nonlinear model (p ≤ 0.05) was established. Thus, when solving the cubic equation, the maximum amount of vermicompost (4.12 kg) with which the maximum root volume (371.33 cm3) in this experiment was obtained could be calculated, which means that the 5.04 kg of T3 are not necessary to reach the maximum volume.

4. Discussion

4.1. Characteristics of the Vermicompost

The classification of extra quality for a vermicompost is given to organic material that is the product of a vermicomposting process, that complies with the parameters of TN, OM, OC, C/N ratio, humidity, pH, EC, CEC, and Bd, without foreign mineral materials, undigested organic material, or inert materials, and without viable seeds or worms [28]. The VC used in our study was made from fruit and vegetable wastes; however, its physical and chemical characteristics (Table 3) are similar to those reported in other vermicomposts obtained from different organic materials and subjected to the action of the California red worm (Eisenia fetida) in other parts of the world. For example, from coconut leaves [35], cattle manure slurry [36], animal fleshing and tannery wastes [37], coffee husks [38], cattle manure mixed with plant residues [39], cattle manure [40]; and even from fruit and vegetable wastes [41]. According to Villegas-Cornelio and Laines-Canepa [43], vermicompost is considered an organic fertilizer used to improve agricultural soils and stimulate crop production since it possesses a large amount of organic matter and nutrients that can be assimilated by plants. However, the nutrient content in vermicompost varies depending on the origin of the organic material [35,39], as well as the conditions under which the vermicomposting process is conducted. This explains why Ca was lower than the reference values considered for plant development [43] since sometimes this decrease occurs after the vermicomposting process [44,45] whereas, the rest of the soluble cations have a higher concentration. This allows us to suppose that the concentration of the different soluble cations in a vermicompost could be a function of the worm's needs, and these in turn, of the conditions in which the vermicomposting is done. These characteristics allow vermicompost to be applied to soil or substrates to increase crop yields [38,46,47]. Another characteristic of vermicompost is the presence of bacteria of the genus Bacillus spp [48], which improved the root development of tomato plants by increasing the water and nutrient absorption capacity of the crops, associated with the production of IAA determined in the VC of our study. These microorganisms are capable of secreting indole-3-acetic acid (auxins) [14], growth-promoting hormones for plants [49]. This means that the VC used in our research, besides contributing nutrients for plant development, provided microorganisms that produce plant growth-promoting substances, which would probably improve the physical, chemical, and biological characteristics of the base substrate to be used in plant production.

4.2. Physical, Chemical, and Biological Characteristics of the Substrates

The base of the substrates used consisted of sand-sized particles of a type of soil known in the region as 'xal', a Nahuatl word meaning pumiceous sand [50]. This material has a cation exchange capacity higher than 16 cmol(+) kg-1, which has been reported for sandy soils [51], and organic matter; likewise, pumiceous sands are porous and have moisture retention capacity [52], conditions conducive to the development of microorganisms and plant roots in natural environments [53]. In this regard, the addition of VC improves the conditions of the substrates or soil where it is applied, leading to an increase in their physical, chemical, and biological fertility [37]. VC has auxin-producing bacterial strains; when these strains increase in size, they are able to increase auxin production, demonstrating a positive relation between bacterial strain size and auxin concentration [48]. This could explain the behavior detected in our investigation since the Eq IAA concentrations (Table 5) at the end of the experiment were higher than at the beginning. At the beginning of the experiment, the CFU were a function of the amount of VC added to the substrate percentage (Figure 1); the higher the amount of VC added, the higher the CFU; which showed a direct and significant relationship. At the end of the experiment, probably due to the passage of time, the CFU in the substrate increased, which in turn caused a higher generation of Eq IAA in the substrate (Figure 2). This allows us to deduce that the CFU of VC bacteria in the substrates continued to grow and produce auxins during the period of the study. However, the inflection point where the growth of CFU stops and auxin production decreases was not determined in our research; this situation would be important to establish the moment to add organic amendments that feed the growth-promoting microorganisms in the substrate, in order to continue the production of auxins in them.

4.3. Crop Behavior in Sand Substrates with Vermicompost

The application of vermicompost in soil or substrate has positive effects on plant development because they contain growth-promoting substances such as auxins [35,54,55], which allow the increase of crop productivity [56]. For example, auxins cause an increase in plant height, number of leaves, flower clusters, and secondary stems [21,54], as well as plant roots [57], which is attributable to the ability of these hormones within the plant to promote cell division and elongation [58]. However, the activation of auxins within plants is a function of different factors such as plant species, stage of development, light intensity and type, availability of water and nutrients, and even the amount of exogenous auxins found in the edaphic medium near the root [25]. This explains the behavior of the yield components that were analyzed in our experiment (plant species, moisture, nutrients, and light conditions were constant), where the substrates with the highest amounts of vermicompost, and therefore, with the highest concentration of exogenous auxins, had tomato plants with more development. In this sense, if exogenous auxins are added to the soil or substrate, the roots are the first component to come into contact with them, which, depending on the characteristics and origin of the auxins, will inhibit or promote their development [59]. In this regard, Ribnicky et al. [60] indicated that exogenous IAA activates the IAA conjugation system, which moderates the internal concentration of this hormone. In this regard, it has been shown that exogenous IAA, upon contact with the roots of plants, causes the homeostasis of the endogenous IAA of those plants [25]; likewise, the addition of exogenous IAA induces an increase in the concentration of endogenous IAA in leaves and roots [61]. However, the excessive addition of exogenous IAA can decrease biomass production [62]. This allows to deduce that when the root is in a suitable medium, it will respond positively to exogenous auxins, product of the association with bacteria present in the vermicompost, which will initially allow its development, and later promote the activation of endogenous auxins of the plant, resulting in a greater development of the plants. However, the concentration could have a limit, as was found in our research; yet, further research is required to determine the limits depending on the amount of vermicompost and its auxin concentration.

5. Conclusions

The results of this research demonstrated that the quantification of in-dole-3-acetic acid (IAA) by colorimetric methods in substrates with vermicompost (VC) is possible; since, the VC made from fruit and vegetable waste, presented bacteria mainly of the Bacillus spp. type, whose colony forming units (CFU) increased when the amount of VC increased in the substrates. Thus, a directly proportional and positive relationship was established between the concentration of IAA and the amount of VC; for this reason, tomato plants grown in substrates with different amounts of VC responded positively to the increase of VC in the substrates. However, the establishment of maximum and minimum concentration limits of exogenous IAA from microbial or organic origin in relation to the activation of endogenous auxins in the plant is one of the important issues to be studied. Moreover, it is important to know when the development of CFU stops and the generation of IAA decreases in a substrate or soil, in order to establish the right moment to add organic matter to the substrates, which will keep the growth-promoting microorganisms active and, consequently, allow them to continue with the production of auxins

Author Contributions

M.A.S.-C. and M.A.V.-D participated in the conceptualization, methodology, data collection, data processing in software, formal analysis, project administration, supervision, writing—review and editing original draft preparation. P.Y-C. and J.F.G.-L. participated in the formal analysis, review. S.C.-M. participated formal analysis, review and editing original draft preparation. All authors have read and agreed to the published version of the manuscript.

Acknowledgments

The authors are grateful to the Instituto Tecnológico de Tlajomulco, of the Tecnológico Nacional de México, for the support given in terms of the use of laboratories and the chemical analysis through project No. 9380.20-P.

Conflicts of Interest

The authors declare no conflict of interest.

Abbreviations

Bd Bulk density.
CEC Cationic exchange capacity.
CFU Colony-forming units.
Dat days after transplanting.
EC Electrical conductivity.
Eq Equivalents.
EU Experimental units.
FC Floral clusters.
fS Volume of sand.
fVC Volume of vermicompost.
IAA Indol-3-acetic acid.
NL Leaf number.
OC Organic carbon.
OM Percentage of organic matter.
PH Plant height.
Ps Weight of substrate.
PsS Weight of sand.
PsVC Weight of vermicompost.
RL Root length.
RV Root volume.
RW Root dry weight.
S Sand.
SD Stem diameter.
SHD Significant honest difference.
SS Secondary stems.
S-VC Sand-based substrates with vermicompost.
Tmt Treatment.
TN Total nitrogen.
VC Vermicompost.
VS Volume of substrate.

References

  1. Wani, S.H.; Kumar, V.; Shriram, V.; Sah, S.K. Phytohormones and their metabolic engineering for abiotic stress tolerance in crop plants. Crop J. 2016, 4, 162–176. [Google Scholar] [CrossRef]
  2. Napieraj, N.; Janicka, M.; Reda, M. Interactions of polyamines and phytohormones in plant response to abiotic stress. Plants 2023, 12, 1159. [Google Scholar] [CrossRef] [PubMed]
  3. Jini, D.; Joseph, B. Use of Phytohormones in improving abiotic stress tolerance to rice. In Advances in Rice Research for Abiotic Stress Tolerance. First ed.; Hasanuzzaman, M., Fujita, M., Nahar, K., Biswas, J.K., Eds.; Elsevier: Woodhead Publishing, Cambridge, United Kingdom, 2019; pp. 633–649. [Google Scholar]
  4. Zhang, X.; Niu, J.; Zhang, X.; Xiao, R.; Lu, M.; Cai, Z. Graphene oxide-SiO2 nanocomposite as the adsorbent for extraction and preconcentration of plant hormones for HPLC analysis. J. Chromatogr. B Analyt. Technol. Biomed. Life Sci. 2017, 1046, 58–64. [Google Scholar] [CrossRef] [PubMed]
  5. Olatunji, D.; Geelen, D.; Verstraeten, I. Control of endogenous auxin levels in plant root development. Int. J, Mol. Sci. 2017, 18, 12–2587. [Google Scholar] [CrossRef] [PubMed]
  6. Arancon, N.Q.; Lee, S.; Edwards, C.A.; Atiyeh, R. Effects of humic acids derived from cattle, food and paper-waste vermicomposts on growth of greenhouse plants: The 7th international symposium on earthworm ecology·Cardiff·Wales·2002. Pedobiologia 2003, 47, 741–744. [Google Scholar] [CrossRef]
  7. Ishii, T.; Soeno, K.; Asami, T.; Fujioka, S.; Shimada, Y. Arabidopsis seedlings over-accumulated indole-3-acetic acid in response to aminooxyacetic acid. Biosci. Biotechnol. Biochem. 2010, 74, 2345–2347. [Google Scholar] [CrossRef] [PubMed]
  8. Kumar, A.; Bhanu, C.H.; Singh, N.; Kumar, B. Potential of vermicompost for sustainable crop production and soil health improvement in different cropping systems. Int. J. Curr. Microb. Appl. Sci. 2018, 7, 1042–1055. [Google Scholar] [CrossRef]
  9. Zhang, H.; Tan, S.N.; Teo, C.H.; Yew, Y.R.; Ge, L.; Chen, X.; Yong, J.W.H. Analysis of phytohormones in vermicompost using a novel combinative sample preparation strategy of ultrasound-assisted extraction and solid-phase extraction coupled with liquid chromatography-tandem mass spectrometry. Talanta 2015, 139, 189–197. [Google Scholar] [CrossRef] [PubMed]
  10. Beltrán-Morales, F.A.; García-Hernández, J.L.; Ruiz-Espinoza, F.H.; Preciado-Rangel, P.; Fortis-Hernández, M.; González-Zamora, A.; Valdez-Cepeda, D. Efectos de sustratos orgánicos en el crecimiento de seis variedades de chile jalapeño (Capsicum annuum L.). Ecosis. Recur. Agropec. 2016, 3, 143–149. [Google Scholar]
  11. Sivasankari, B. Indole -3-Acetic Acid production by the bacterial strains isolated from vermicomposts in the presence and absence of tryptophan. Int. J. Innov. Res. Sci. Eng. Technol. 2016, 5, 8698–8706. [Google Scholar]
  12. Lara-Mantilla, C.; Oviedo-Zumaqué, L.E.; Betancur-Hurtado, C.A. Bacterias nativas con potencial en la producción de ácido indolacético para mejorar los pastos. Zootecnia Trop. 2011, 29, 187–194. [Google Scholar]
  13. Mashiguchi, K.; Hisano, H.; Takeda-Kamiya, N.; Takebayashi, Y.; Ariizumi, T.; Gao, Y.; Ezura, H.; Sato, K.; Zhao, Y.; Hayashi, K.I.; Kasahara, H. Agrobacterium tumefaciens enhances biosynthesis of two distinct auxins in the formation of crown galls. Plant Cell Physiol. 2019, 60, 29–37. [Google Scholar] [CrossRef]
  14. Amhed, A.; Hasnain, S. Extraction and evaluation of indole acetic acid from indigenous auxin-producing rhizosphere bacteria. The J. Anim. Plant Sci. 2020, 30, 1024–1036. [Google Scholar] [CrossRef]
  15. Lázaro-De la Cruz, E.; Estrada-Botello, M.A.; Robledo-Torres, V.; Osorio-Osorio, R.; Márquez-Hernández, C.; Sánchez-Hernández, R. Producción de tomate en invernadero con composta y vermicomposta como sustrato. Universidad y Ciencia del trópico húmedo 2009, 25, 57–59. [Google Scholar]
  16. Glickmann, E.; Dessaux, Y. A critical examination of the specificity of the Salkowski reagent for indolic compounds produced by phytopathogenic bacteria. Appl. Environ. Microbiol. 1995, 61, 793–796. [Google Scholar] [CrossRef] [PubMed]
  17. Wöhler, I. Auxin-indole derivatives in soils determined by a colorimetric method and by high performance liquid chromatography. Microbiol. Res. 1997, 152, 399–405. [Google Scholar] [CrossRef]
  18. Porfirio, S.; Gomes-da silva, D.R.M.; Peixe, A.; Cabrita, J.M. Current analytical methods for plant auxin quantification-A review. Anal. Chim. Acta. 2016, 902, 8–21. [Google Scholar] [CrossRef] [PubMed]
  19. Balderas-Ruíz, K.A.; Gómez-Guerrero, C.I.; Trujillo-Roldán, M.A.; Valdez-Cruz, N.A.; Aranda-Ocampo, S.; Juárez, A.M.; Leyva, E.; Galindo, E.; Serrano-Carreón, L. Bacillus velezensis 83 increases productivity and quality of tomato (Solanum lycopersicum L.): Pre and postharvest assessment. Curr. Res. Microb. Sci. 2021, 2, 100076. [Google Scholar] [CrossRef] [PubMed]
  20. López-Zapata, S.P.; García-Jaramillo, D.J.; López, W.R.; Ceballos-Aguirre, N. Tomato (Solanum lycopersicum L.) and Fusarium oxysporum f. sp. lycopersici interaction. A review. Rev. U.D.C.A Act. & Div. Cient, 2021; 24, e1713. [Google Scholar]
  21. Ronga, D.; Caradonia, F.; Parisi, M.; Bezzi, G.; Parisi, B.; Allesina, G.; Pedrazzi, S.; Francia, E. Using Digestate and biochar as fertilizers to improve processing tomato production sustainability. Agronomy 2020, 10, 138. [Google Scholar] [CrossRef]
  22. Potencial-Jitomate. Available online: www.gob.mx/cms/uploads/attachment/file/257077/Potencial-Jitomate.pdf (accessed on 11 January 2024).
  23. Jaramillo-Noreña, J.E.; Sánchez-León, G.D.; Rodríguez, V.P.; Aguilar-Aguilar, P.A.; Gil-Vallejo, L.F.; Hío, J.C.; Pinzón-Perdomo, L.M.; García-Muñoz, M.C.; Quevedo-Garzón, D.; Zapata-Cuartas, M.Á.; Restrepo, J.F.; Guzmán-Arroyave, M. Tecnología para el cultivo de tomate bajo condiciones protegidas. 1ª ed. Corporación Colombiana de Investigación Agropecuaria CORPICA. Bogotá, Colombia, 2012; pp. 30–32.
  24. Ren, Z.; Liu, R.; Gu, W.; Dong, X. The Solanum lycopersicum auxin response factor SlARF2 participates inregulating lateral root formation and flower organ senescence. Plant Sci. 2017, 256, 103–111. [Google Scholar] [CrossRef]
  25. Pantoja-Guerra, M.; Valero-Valero, N.; Ramírez, C.A. Total auxin level in the soil–plant system as a modulating factor for the effectiveness of PGPR inocula: A review. Chem. Biol. Technol. Agric. 2023, 10, 6. [Google Scholar] [CrossRef]
  26. Agroactivocol. Ficha técnica de tomate variedad rio grande. Available online: https://agroactivocol.com/ (accessed on 13 January 2024).
  27. Rodríguez-Dimas, N.; Cano-Ríos, P.; Figueroa-Viramontes, U.; Favela-Chávez, E.; Moreno-Reséndez, A.; Márquez-Hernández, C.; Ochoa-Martínez, E.; Preciado-Rangel, P. Uso de abonos orgánicos en la producción de tomate en invernadero. Terra latinoam. 2009, 27, 319–327. [Google Scholar]
  28. SE (Secretaría de Economía). Norma Mexicana que establece los métodos y procedimientos para el tratamiento aerobio de la fracción orgánica de los residuos sólidos urbanos y de manejo especial, así como la información comercial y de sus parámetros de calidad de los productos finales. (NMX-AA-180-SCFI-2018). Diario Oficial, 21 de agosto de 2018. 52 p.
  29. SEMARNAT (Secretaria del Medio Ambiente y Recursos Naturales). Norma Oficial Mexicana que establece las especificaciones de fertilidad, salinidad y clasificación de suelos. Estudios, muestreos y análisis (NOM-021-RECNAT-2000). Diario Oficial de la Federación 31 de diciembre 2002. México, DF. 85 p.
  30. Celis-Bautista, L.X.; Gallardo, R.I. Estandarización de métodos de detección para promotores de crecimiento vegetal (Ácido indol acético y Giberelinas) en cultivos microbianos. Tesis de Licenciatura. Pontificia Universidad Javeriana, Facultad de Ciencias Microbiología Agrícola y Veterinaria. Bogotá, Colombia. Enero 2008. Recuperado de: http://hdl.handle.net/10554/8948. 1055. [Google Scholar]
  31. Mayer, A.M. Determination of indole acetic acid by the Salkowsky reaction. Nature 1958, 182, 1670–1671. [Google Scholar] [CrossRef] [PubMed]
  32. Yáñez-Ocampo, G.; Sánchez-González, M.E.; Portilla-López, N.; De Marmolejo-Santillán, Y.; Del Águila-Juárez, P.; Lugo, J. Densidad poblacional de actinomicetos en suelos florícolas, enmendados con vermicomposta. Terra Latinoam. 2020, 38, 745–753. [Google Scholar] [CrossRef]
  33. Allende, C.M.; Salinas, P.L. Olivares, P.N. Riquelme, S.J., Antúnez, B.A., Martínez, C.J.P., Felmer, E.S. Manual de cultivo de tomate en invernadero. Boletín No. 12. INIA-INDAP. Instituto de Investigaciones Agrícolas y Pecuarias: Santiago de Chile, Chile, 2017; 112p. [Google Scholar]
  34. Minitab Inc. Minitab® State College. Minitab Inc. Pennsylvania, EEUU, 2013. https://www.minitab.com/es-mx/ (Consulta: 15 December 2023).
  35. Gopal, M.; Alka, Gupta, A. ; Palaniswami, C.; Dhanapal, R.; Thomas, G. Coconut leaf vermiwash: a bio-liquid from coconut leaf vermicompost for improving the crop production capacities of soil. Curr. Sci. 2009, 98, 9–1202. [Google Scholar]
  36. Rekha, G.S.; Kaleena, P.K.; Elumalai, D.; Srikumaran, M.P.; Maheswari, V.N. Effects of vermicompost and plant growth enhancers on the exo-morphological features of Capsicum annum (Linn.) Hepper. Int. J. Recycl. Org. Waste Agricult. 2018, 7, 83–88. [Google Scholar] [CrossRef]
  37. Ravindran, B.; Lee, S.R.; Chang, S.W.; Nguyen, D.D.; Chung, W.J.; Balasubramanian, B.; Mupambwa, H.A.; Arasu, M.V.; Al-Dhabi, N.A.; Sekaran, G. Positive effects of compost and vermicompost produced from tannery waste-animal fleshing on the growth and yield of commercial crop-tomato (Lycopersicon esculentum L.) plant. J. Environ. Manag. 2019, 234, 154–158. [Google Scholar] [CrossRef] [PubMed]
  38. Zulhipri; Erdawati; Purwanto, A. Development of technology vermicompost production for the coffee plant Industry. J. Phys. Conf. Ser. 2021, 1876, 012020. [Google Scholar] [CrossRef]
  39. Hemati, A.; Alikhani, H.A.; Ajdanian, L.; Babaei, M.; Asgari Lajayer, B.; van Hullebusch, E.D. Effect of different enriched vermicomposts, humic acid extract and indole-3-acetic acid amendments on the growth of Brassica napus. Plants 2022, 11, 227. [Google Scholar] [CrossRef] [PubMed]
  40. Wu, D.; Chen, C.; Liu, Y.; Zhang, G.; Yang, L. Vermicompost improves tomato yield and quality by promoting carbohydrate transport to fruit under salt stress. Horticulturae 2023, 9, 1015. [Google Scholar] [CrossRef]
  41. Alves-Pereira, M.M.; Moraes, L.C.; Mogollón, M.C.T.; Borja, C.J.F.; Duarte, M.; Buttrós, V.H.T.; Luz, J.M.Q.; Pasqual, M.; Dória, J. Cultivating biodiversity to harvest sustainability: Vermicomposting and inoculation of microorganisms for soil preservation and resilience. Agronomy 2023, 13, 103. [Google Scholar] [CrossRef]
  42. Villegas-Cornelio, V.M.; Laines-Canepa, J.R. Vermicompostaje: I avances y estrategias en el tratamiento de residuos sólidos orgánicos. Rev. Mex. Cienc. Agríc. 2017, 8, 393–406. [Google Scholar] [CrossRef]
  43. Weil, R.R.; Brady, N.C. The nature and properties of soils. 15th edition. Pearson Education Limited. London, England, 2017; 1104 p.
  44. Trinidad-Santos, A. El uso de abonos orgánicos en la producción agrícola. 1st ed. Colegio de Postgraduados, Montecillo, Estado de México, México, 1987; 45 p.
  45. Hernández-López, M.; Vidaña-Martínez, S.A.; Velázquez-Chávez, E.T. Características químicas y microbiológicas de vermicomposta producida en el ITSL. Ciencia Energía y Desarrollo Tec Lerdo 2020, 1, 35–39. [Google Scholar]
  46. Ahmad, A.; Aslam, Z.; Bellitürk, K.; Iqbal, N.; Idrees, M.; Nawaz, M.; Nawaz,M. Y.; Munir, M.K.; Kamal, A.; Ullah, E.; Jamil, M.A.; Akram, Y.; Abbas, T.; Aziz, M.M. Earth worms and vermicomposting: A review on the story of black gold. J. Innov. Sci. 2021, 7, 167–173. [Google Scholar] [CrossRef]
  47. Kaur, T. Vermicomposting: an effective option for recycling organic wastes. In Organic agriculture. First ed. Kumar Das, S. Ed. IntechOpen. London, United Kingdom. 2020. pp. 1–17. [CrossRef]
  48. Pathma, J.; Sakthivel, N. Molecular and functional characterization of bacteria isolated from straw and goat manure based vermicompost. Appl. Soil Ecol. 2013, 70, 33–47. [Google Scholar] [CrossRef]
  49. Vaz-Moreira, I.; Silva, M.E.; Manaia, C.M.; Nunes, O.C. Diversity of bacterial isolates from commercial and homemade composts. Microb. Ecol. 2008, 55, 714. [Google Scholar] [CrossRef] [PubMed]
  50. Diccionario Nahuatl. Available online: https://gdn.iib.unam.mx (accessed on 15 February 2024).
  51. Baldock, J.A.; Broos, K. Soil organic matter. In Hand book of soil science. 2nd ed. Huang, P.M., Li, Y., Sumner, M.E. eds. Vol. 1: Properties and processes. CRC Press (Taylor & Francis), Boca Raton, FL. EEUU, 2012; pp. 11.25–11.35.
  52. Segura-Castruita, M.A.; Preciado-Rangel, P.; González-Cervantes, G.; Frías-Ramírez, J.E.; García-Legaspi, G.; Orozco-Vidal, J.A.; Enríquez-Sánchez, M. Adición de material pomáceo a sustratos de arena para incrementar la capacidad de retención de humedad. Interciencia 2008, 33, 923. [Google Scholar]
  53. Gómez-Godínez, L.J.; Martínez-Romero, E.; Banuelos, J.; Arteaga-Garibay, R.I. Tools and challenges to exploit microbial communities in agriculture. Curr. Res. Microb. Sci. 2021, 2, 100062. [Google Scholar] [CrossRef] [PubMed]
  54. Aremu, A.O.; Stirk, W.A.; Kulkarni, M.G.; Tarkowská, D.; Turecková, V.; Gruz, J.; Subrtová, M.; Pnèík, A.; Novák, O.; Doleal, K.; Strnad, M.; Staden, L.V. Evidence of phytohormones and phenolic acids variability in garden-waste-derived vermicompost leachate, a well-known plant growth stimulant. Plant Growth Regul. 2015, 75, 483–492. [Google Scholar] [CrossRef]
  55. Steffen, G.P.K.; Maldaner, J.; de Morais, R.M.; Saldanha, C.W.; Missio, E.L.; Steffen, R.B.; Osorio-Filho, B.D. The vermicompost anticipates flowering and increases tomato productivity. Agrocienc. Urug. 2019, 23. [Google Scholar] [CrossRef]
  56. Rehman, S.U.; De Castro, F.; Aprile, A.; Benedetti, M.; Fanizzi, F.P. Vermicompost: enhancing plant growth and combating abiotic and biotic stress. Agronomy 2023, 13, 1134. [Google Scholar] [CrossRef]
  57. Puga-Freitas, R.; Abbad, S.; Gigon, A.; Garnier-Zarli, E.; Blouin, M. Control of cultivable IAA-producing bacteria by the plant Arabidopsis thaliana and the earthworm Aporrectodea caliginosa. Appl. Environ. Soil Sci. 2012, 307415. [Google Scholar] [CrossRef]
  58. Xu, Y.; Zhang, Y.; Li, Y.; Li, G.; Liu, D.; Zhao, M.; Cai, N. Growth promotion of Yunnan pine early seedlings in response to foliar application of IAA and IBA. Inter. J. Mol. Sci. 2012, 13, 6507–6520. [Google Scholar] [CrossRef] [PubMed]
  59. Enders, T.A.; Strader, L.C. Auxin activity: Past, present, and future. Am. J. Bot. 2015, 102, 180–196. [Google Scholar] [CrossRef] [PubMed]
  60. Ribnicky, D.M.; Ilic, N.; Cohen, J.D.; Cooke, T.J. The effects of exogenous auxins on endogenous indole-3-acetic acid metabolism (the implications for carrot somatic embryogenesis). Plant Physiology 1996, 112, 549–558. [Google Scholar] [CrossRef] [PubMed]
  61. Ali, B.; Sabri, A.N.; Ljung, K.; Hasnain, S. Quantification of indole-3-acetic acid from plant associated Bacillus spp. and their phytostimulatory effect on Vigna radiata (L.). World J. Microbiol. Biotechnol. 2009, 25, 519–526. [Google Scholar] [CrossRef]
  62. Cai, T.; Meng, X.; Liu, X.; Liu, T.; Wang, H.; Jia, Z.; Yang, D.; Ren, X. Exogenous hormonal application regulates the occurrence of wheat tillers by changing endogenous hormones. Front. Plant Sci. 2018, 9, 1886. [Google Scholar] [CrossRef]
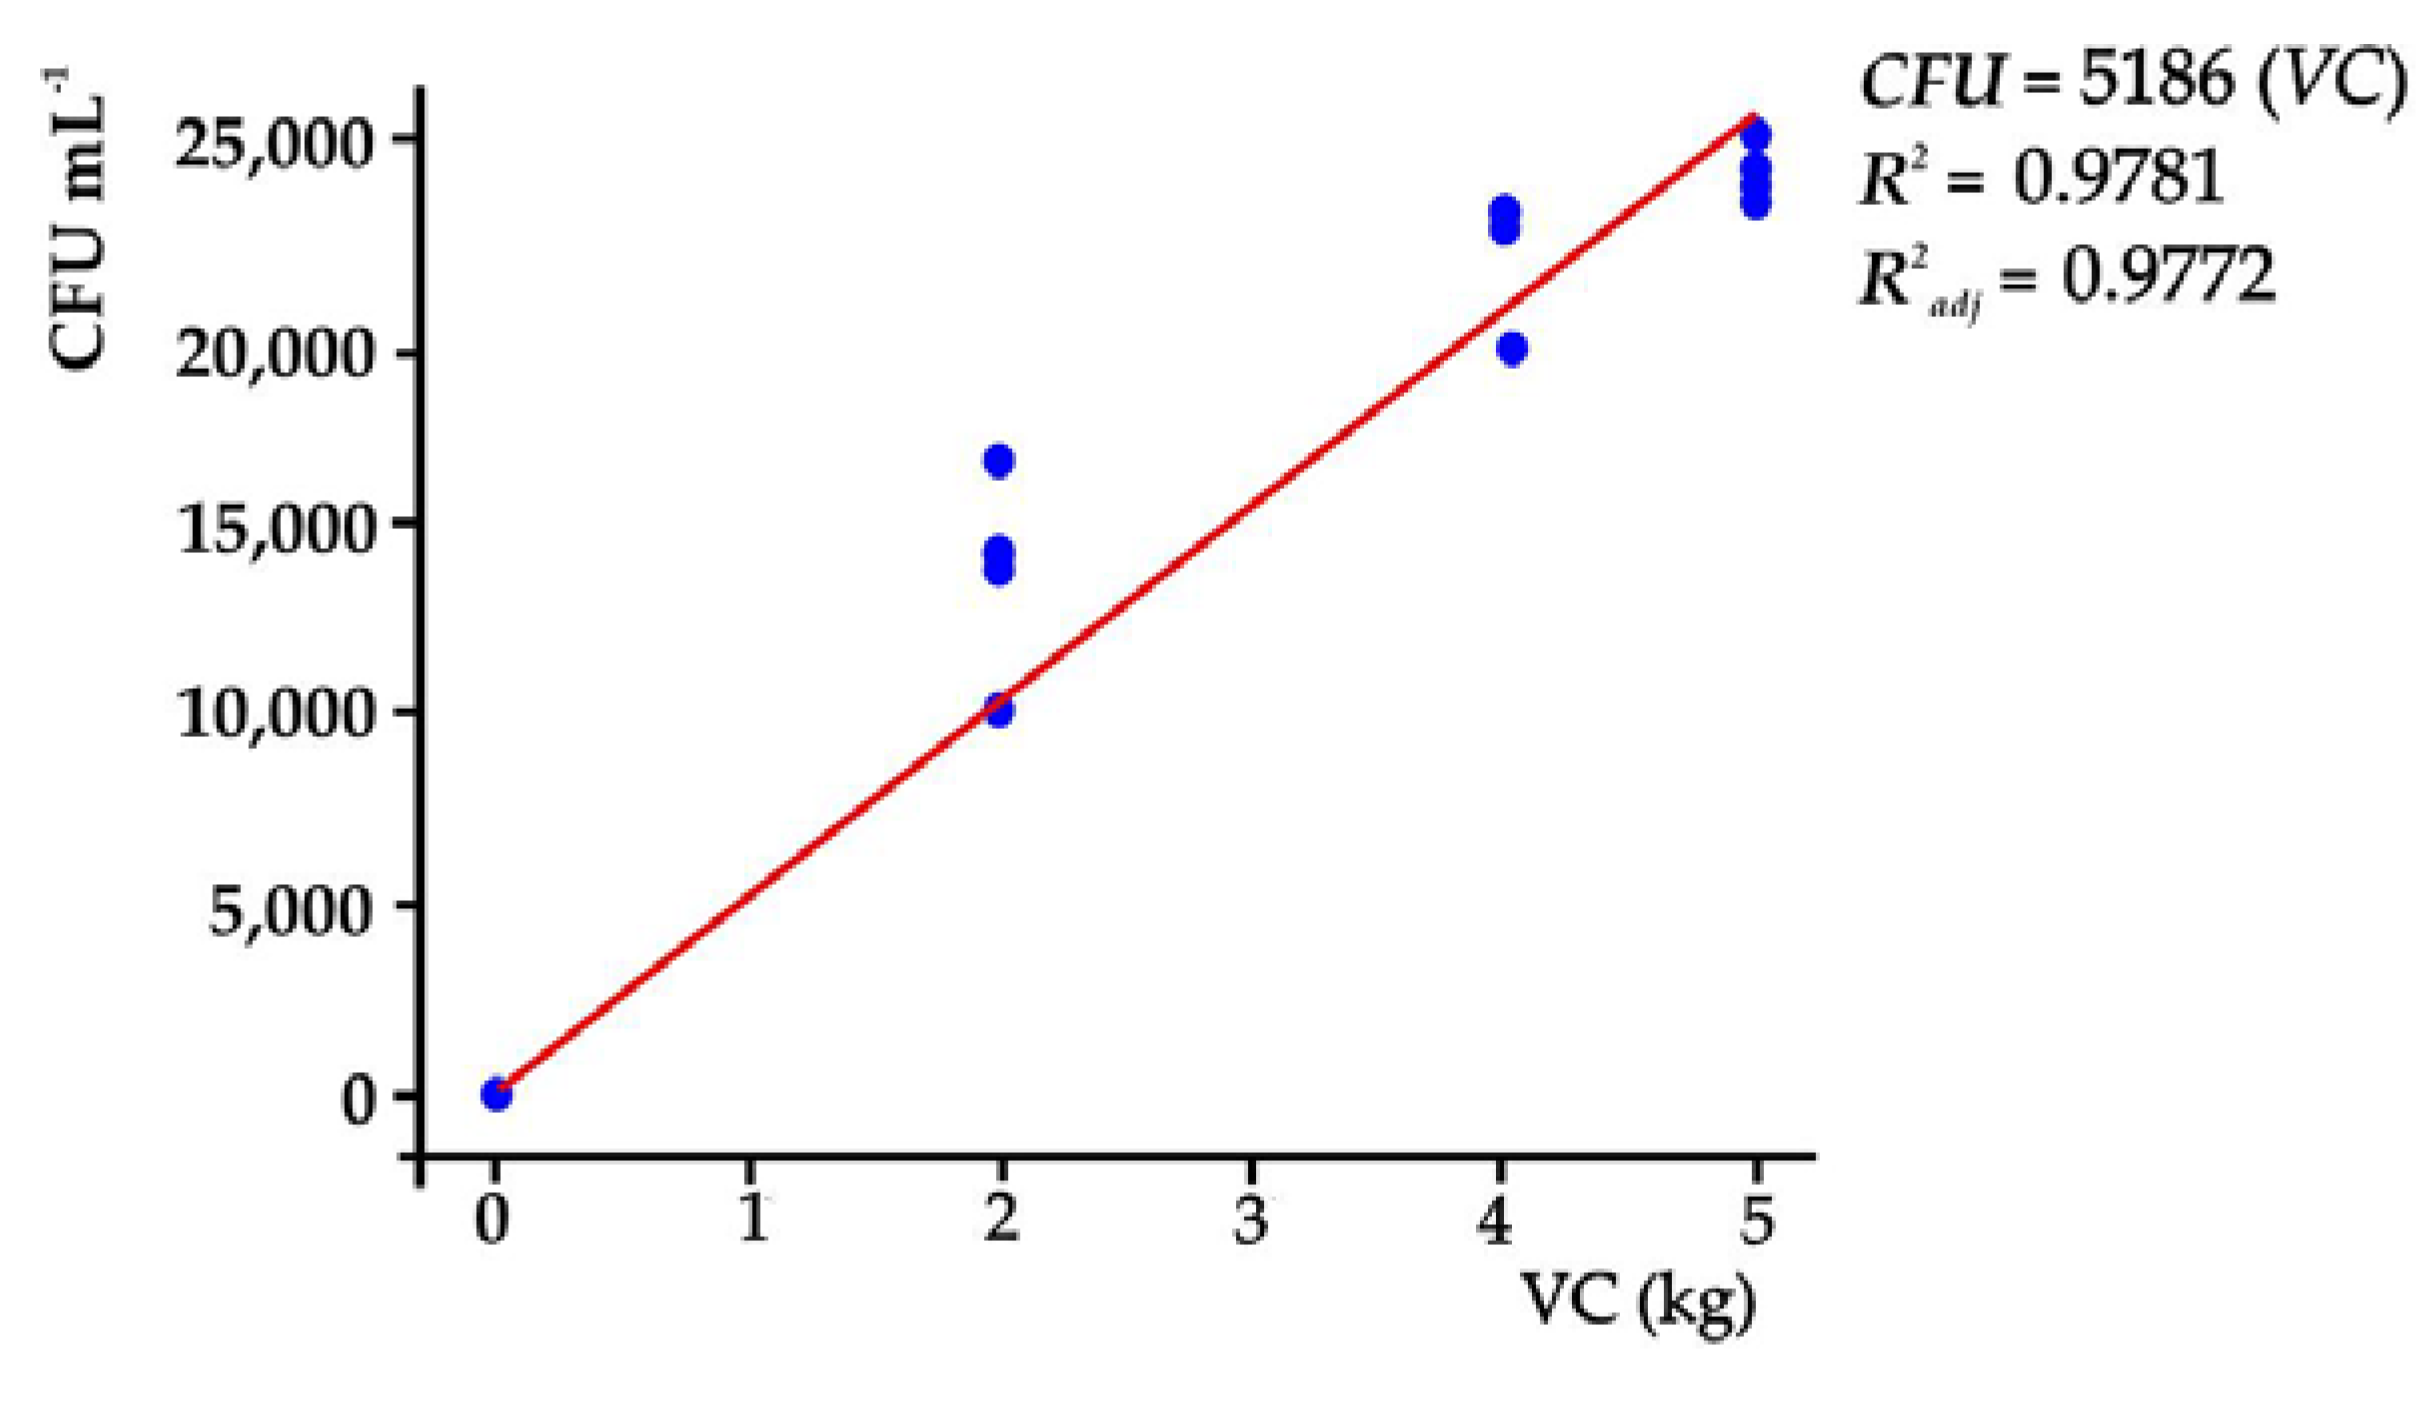
Figure 1. CFU depending on the VC contents of the treatments.
Preprints 108198 g001
Figure 2. Relationship between the concentration of auxin at the beginning and at the end of the experiment of each treatment and the amounts of VC in the substrates.
Preprints 108198 g002
Figure 3. Root volume. a) substrate without VC (T0); b) substrate with 40% VC (T2).
Preprints 108198 g003
Figure 4. Relationship between the volume of the root and the amounts of vermicompost in the substrates.
Preprints 108198 g004
Table 1. Proportions of substrates in treatments.
Tmt 1 S (%) VC (%)
T0 100 0
T1 80 20
T2 60 40
T3 50 50
1 Tmt: treatment; S: sand; VC; vermicompost.
Table 2. Volume and weight of sand and vermicompost used in the treatments preparation.
Tmt 1 Sand Vermicompost
fS
(L)
PsS
(kg)
fVC
(L)
PsVC
(kg)
T0 14.00 15.86 0.00 0.00
T1 11.20 12.76 2.80 2.01
T2 8.40 9.57 5.60 4.03
T3 7.00 7.98 7.00 5.04
1 Tmt: treatments; fS: volume of sand; PsS: weight of sand; fVC: volume of vermicompost; PsVC: weight of vermicompost.
Table 3. Physical and chemical parameters of vermicompost.
Characteristics Reference
range 1
VC
Data
TN 2 (%) 1.00 – 4.00 2.24
OM (%) 20.00 – 50.00 48.15
C/N ≤ 20.00 12.36
Moisture (%) 20.00 – 40.00 30.00
pH 5.50 – 8.50 7.30
EC (dS m-1) ≤ 4.00 2.10
CEC (cmol(+) kg-1) > 40.00 130.00
Ca (%) 2.00 – 8.00 0.11
Mg (%) 1.00 – 2.50 0.45
K (%) 1.00 – 2.50 0.78
P (%) 2.00 – 8.00 1.20
Bd (g cm-3) 0.40 – 0.90 0.72
1 NMX-AA-180-SCFI-2018 [28]; VC: vermicompost. 2 TN: Total nitrogen; OM: organic matter; C/N: carbon-nitrogen ratio; EC: electric conductivity; CEC: cationic exchange capacity; Bd: bulk density.
Table 4. Physical and chemical characteristics of the treatments.
Tmt 1 OM TN pH Bd EC CEC K Ca Mg P
(%) (%) (g cm-3) (dS m-3) (cmol(+) kg-1) (%) (%) (%) (ppm)
T0 0.41 d2 0.01 c 7.8 a 1.16 a 0.09 c 24.89 d 0.18 c 0.01 c 0.04 c 0.75 d
T1 2.56 c 0.21 c 7.6 b 1.06 b 1.00 b 30.89 c 0.22 b 0.02 b 0.08 c 28.1 c
T2 5.65 b 0.44 a 7.4 c 1.04 b 1.32 a 45.01 b 0.27 a 0.03 a 1.14 b 68.7 b
T3 6.31 a 0.47 a 7.4 c 1.04 b 1.36 a 51.77 a 0.28 a 0.03 a 1.22 a 88.1 a
SHD 1.52 0.22 0.18 0.05 0.21 4.45 0.03 0.005 0.07 16.23
1Tmt: treatments; OM: organic matter; TN: Total nitrogen; Bd: bulk density; EC: electric conductivity; CEC: cationic exchange capacity; K: available potassium; Ca: available calcium; available magnesium; P: available phosphorus. 2Different letter in same column indicate significant differences between treatments (Tukey, p ≤ 0.05); SHD: significant honest difference.
Table 5. Concentrations Eq. of auxins in substrates at the beginning and at the end of the experiment.
Tmt 1 Eq IAAi ± σ Eq IAAf ± σ
(µg g-1) (µg g-1)
T0 0.0 ± 0.00 d 2 0.0 ± 0.00 c
T1 0.055 ± 0.05 c 0.101 ± 0.50 c
T2 0.163 ± 0.50 b 0.290 ± 0.50 a
T3 0.274 ± 0.02 a 0.310 ± 1.02 a
SHD 0.104 0.085
1 Tmt: treatment; Eq IAAi: initial indole-3-acetic acid equivalents; Eq IAAf: final indole-3-acetic acid equivalent; σ: standard deviation. 2 Different letter in same column indicate significant differences between treatments (Tukey, p ≤ 0.05). SHD: significant honest difference.
Table 6. Effect of treatments on some performance components of tomato plants.
Tmt 1 PH SD NL FC SS RV RL RW
(cm) (cm) (cm-3) (cm) (g)
T0 56.50 c 2 1.03 b 20.00 b 5.33 c 3.70 b 75.00 d 61.00 c 7.70 c
T1 72.67 b 1.43 a 27.33 ab 11.67 ab 9.00 a 249.50 c 64.60 bc 44.77 b
T2 97.53 a 1.46 a 33.33 a 13.50 a 10.00 a 371.00 a 77.25 a 64.90 a
T3 95.25 a 1.50 a 33.80 a 11.75 ab 9.70 a 336.25 b 71.80 ab 46.52 b
SHD 10.48 0.26 7.21 6.05 3.58 15.65 9.69 9.12
1 Tmt: treatments; PH: plant height; SD: stem diameter, NL: number leaves, FC: floral cluster, SS: secondary stems, RV: root volume, RL: root length, RW: root dry weight. 2 Different letters in the same columns indicate significant differences between treatments (Tukey, p ≤ 0.05). SHD: significant honest difference.
Disclaimer/Publisher’s Note: The statements, opinions and data contained in all publications are solely those of the individual author(s) and contributor(s) and not of MDPI and/or the editor(s). MDPI and/or the editor(s) disclaim responsibility for any injury to people or property resulting from any ideas, methods, instructions or products referred to in the content.
Copyright: This open access article is published under a Creative Commons CC BY 4.0 license, which permit the free download, distribution, and reuse, provided that the author and preprint are cited in any reuse.
Prerpints.org logo

Preprints.org is a free preprint server supported by MDPI in Basel, Switzerland.

Subscribe

© 2024 MDPI (Basel, Switzerland) unless otherwise stated