1. Introduction
As human demand for energy has increased, conventional oil and gas resources have been unable to meet people's demand. Shale oil represents a type of unconventional energy resources with huge reserves, and the research and development of shale oil and gas have attracted much attention. In a broad sense, shale oil refers to oil and gas resources in organic-rich shale and adjacent non-source rock interlayers. Zou et al. [
1] believe that shale oil constitutes mature oil contained within organic-rich shale formations characterized by nanoscale pore sizes. Organic-rich shale develops laminar structure, and micron-nano-sized pore pipes and micro-fractures are the main storage space. Jiang et al. [
2] believe that shale oil refers to the liquid hydrocarbons in free, dissolved or adsorbed state in the effective source rock shale, which is the residual retention and accumulation after hydrocarbon generation and shale expulsion. Shale oil flows little or not far from the source rock. Shale oil is characterized by low porosity and low permeability, tight reservoirs and strong heterogeneity, which often result in difficult transformation of shale oil during the production process, low oil rate per well, rapid decline of oil rate and low or no natural production The production of shale oil depends on the combination of horizontal drilling technology and hydraulic fracturing technology. Horizontal drilling in shale oil reservoirs increases the contact area between the reservoir and the wellbore, thereby increasing productivity and recovery ratio. Hydraulic fracturing is a method of fracturing rock by injecting fluids at high pressure to increase the flow of reservoir fluid.
During fracturing, shale oil develops complex fracture networks. The hydraulic fractures formed during fracturing interlock with the original fractures in the shale, and the original fractures are extended to different degrees. Evaluating the conductivity of fractures is very important for the shale oil flowback process. Palmer and Mansoor [
3] incorporated pore compressibility and permeability as functions of effective stress and matrix shrinkage into a single equation, resulting in a widely adopted theoretical permeability model. Schutjens, P.M.T.M. et al. [
4] proposed the relationship between the degree of compaction, the decrease of porosity based on the linear pore elasticity theory of small strain, and proposed that decrease in permeability of sandstone near the elastic range is primarily dependent on the increase in average effective stress. Legrand, N. et al. [
5] studied the production mechanism of tight oil in Yemen, and the crude oil flow mainly depended on matrix microfractures and fracture channels. The crude oil flows through the matrix microfractures into the fracture channel and then is produced. Lu [
6] established an elastic-plastic deformation model of self-supporting fractures after hydraulic fracturing in deep shale, and studied the flow capacity and characteristics of self-supporting fractures.
A mathematical model is a method used to study the flowback rule after fracturing. Fang et al. [
7] developed a shale gas productivity prediction model for multi-stage fractured horizontal wells, which considers the flow of fracture systems, shale matrix compressibility, gas slip, Knudsen diffusion and surface diffusion. The semi-analytic model is solved using Laplace integral transformation and the point source method. The research results of Du [
8] provide a new perspective for understanding the flow law of shale gas reservoirs with dual media. His non-Darcy flow model takes into account a multitude of complex factors, including adsorption, desorption and slippage effects, and has a higher degree of accuracy and reliability than the traditional Darcy flow model. Furthermore, his model can be solved by Laplace spatial solutions under different boundary conditions, and has been verified by drawing well test curves. Andersen [
9] developed a shale gas productivity prediction model that considers the compressibility of the shale matrix and solves it using a semi-analytical method. This enables the spatial distribution of pressure, adsorption, porosity and apparent permeability to be determined at a given time. Gao et al. [
10] developed a mathematical model for the nonlinear flow of shale gas, taking into account the random distribution of non-uniform equivalent porosity and permeability. They proposed a semi-analytical method and an explicit iterative scheme based on the Boltzmann transform and local homogenization approximation. Ren et al. [
11] constructed an unstable flow mathematical model of stagewise fractured horizontal wells in low permeability reservoirs. They solved this model by combining perturbation transform, Laplace transform, and superposition principle with a semi-analytical method. However, when the mathematical model is used to describe the fluid flow, the flow mechanism is limited. For the mathematical model of a simple mechanism, it can be solved quickly and has great application value. However, for a complex mechanism, it is often impossible to solve. When a discrete crack is used, the calculation is large and the time is long. When the equivalent fracture zoning model is employed, the fundamental characteristics of the fracture network cannot be reflected. Furthermore, the fracture distribution is challenging to characterize, the difference in liquid production between the fractures cannot be considered, the yield is evenly divided, and the irregular reconstruction area is difficult to address.
The fracture network structure of fractured reservoir is complex and the reservoir contains multi-phase fluids such as oil, water and gas. The mechanism of flowback stage after fracturing is very complicated. The numerical simulation method can accurately simulate the fracture distribution and multiphase fluid flow of stage-fractured horizontal Wells, which provides an effective way to study the flowback mechanism and production prediction after fracturing. Clarkson C. R. [
12] established a shale gas production model considering adsorption and slippage effects, which is highly applicable to shale reservoirs without fractures. Takuto Sakai et al. [
13] developed a new type of reservoir simulator to predict the flow behavior of shale gas/oil, which can simulate three-dimensional and three-phase flow behavior. The simulator is able to reproduce the flow of fluid between induced hydraulic fractures and natural fractures. Fan et al. [
14] established a multistage fractured horizontal well composite model considering SRV based on the characteristics of low porosity and low permeability in tight oil gas reservoirs, and used the finite element method to solve the model. The fluid flow around the hydraulic fracture is divided into 5 flow states, and the larger the SRV, the shorter the time to reach quasi-steady flow. Zhao et al. [
15] used CMG software to build a single well productivity model of shale oil fracturing. The fluid model adopted a component model to study and explore the effects of compaction, gas phase non-Darcy effect, and nanoporous fluid phase state on productivity. Through the inversion of reservoir parameters through historical fitting, the final recovery ratio is predicted. The model does not take into account the stress sensitivity of opened beddings and the threshold pressure gradient in the matrix.
A suitable flowback strategy can enhance the production of shale oil. The application of measures such as soaking and controlled pressure flowback has been demonstrated to be an effective means of increasing shale oil production in practice. In a study by LaFollette [
16], multiple linear regression and an enhanced tree model were employed to analyze a range of reservoir quality indicators, well structure, completion, stimulation measures and production parameters in the Barnett shale gas and Middle Bakken oil areas. The study concluded that the quality of the reservoir is a principal determinant of tight oil production. Wang et al. [
17] developed a dual-medium two-phase flow model of shale reservoirs, which considers the flow mechanism of shale reservoir fluids. The flow behavior throughout the entire cycle of drilling and production is simulated, and the impact of flowback performance, including soaking time and pressure drop rate, on shale oil production is studied. Zhu [
18] conducted a comprehensive investigation into the nine factors that influence shale oil production capacity, utilizing layer system analysis and the entropy weight method. Furthermore, from the perspective of enhancing the energy efficiency of fracturing fluids, he put forth an efficacious system for shale oil production, comprising post-fractured soaking and the regulation of the decline in pressure during the flowback phase. Nevertheless, a transparent system for controlling the rate of pressure decrease and an optimization method for shale oil reservoirs have yet to be established. Karantinos et al. [
19] proposed a coupling model between the wellbore and the reservoir. This model employs the black oil model in the reservoir and multiphase flow analysis in the wellbore. The model permits the choke size to be altered at different times, and it is possible to study the influence of a choke size management strategy on shale production. This approach is anticipated to assist operators in selecting the optimal choke size, enhancing well performance and efficiency, and reducing the risk of wellbore or completion failure. Bagci et al. [
20] developed a methodology for selecting the optimal choke size following fracturing. The impact of optimized choke size and flowback time on proppant production was demonstrated. The production of proppant was found to decrease with an increase in choke size and flowback period. The results demonstrate that the optimal choke size is contingent upon pressure drop, fluid volume, wellhead pressure, and fracture geometry parameters. Liu [
21] employed the EDFM to construct a discrete fracture model, considered the fracture network formed by real reservoir fracturing and the migration of proppant, proposed three choke systems, studied the changes in fracture conductivity and production under different choke systems, and concluded that radical choke systems lead to a rapid reduction in bottomhole flow pressure and proppant production, thereby reducing fracture conductivity and resulting in a lower recovery ratio. Nevertheless, this model does not sufficiently consider the law of fluid flow within the shale matrix. In general, a realistic choke management analysis is lacking in unconventional reservoirs.
In this paper, based on a case of shale oil reservoir in Gulong, Daqing, extensive research has been conducted on the flowback performance attributes and factors influencing shale oil reservoirs. The production system for shale oil is reasonably optimised. Firstly, the analysis focuses on the reservoir and fluid properties of the Gulong shale reservoir, and the effect of opened bedding by hydraulic fracturing on flowback is considered. A numerical model of multiphase flowback of the Gulong shale reservoir was established based on the flow mechanism, including PTPG and stress sensitivity effects. This model was utilized to study the influence of geological parameters, flowback modes, and other factors on the shale oil flowback performance. Secondly, the effects of different factors (PTPG, stress sensitivity, opened bedding permeability, matrix permeability) on the flowback performance of the Gulong shale reservoir were studied using the numerical model established earlier. Subsequently, a summary of production data from Daqing Gulong shale oil wells is presented, with nine representative wells selected for analysis. Furthermore, three modes of shale oil flowback are distinguished: the fast-slow mode, the slow-fast-slow mode, and the fast-slow-fast mode. A numerical model is employed to examine the impact of various flowback modes on the flowback performance of shale reservoirs. Finally, the mode was optimized from the perspective of total oil and recovery ratio. The study is of great significance for understanding the flowback performance and for the beneficial development of Gulong shale.
4. Sensitivity Study of Flowback Performance
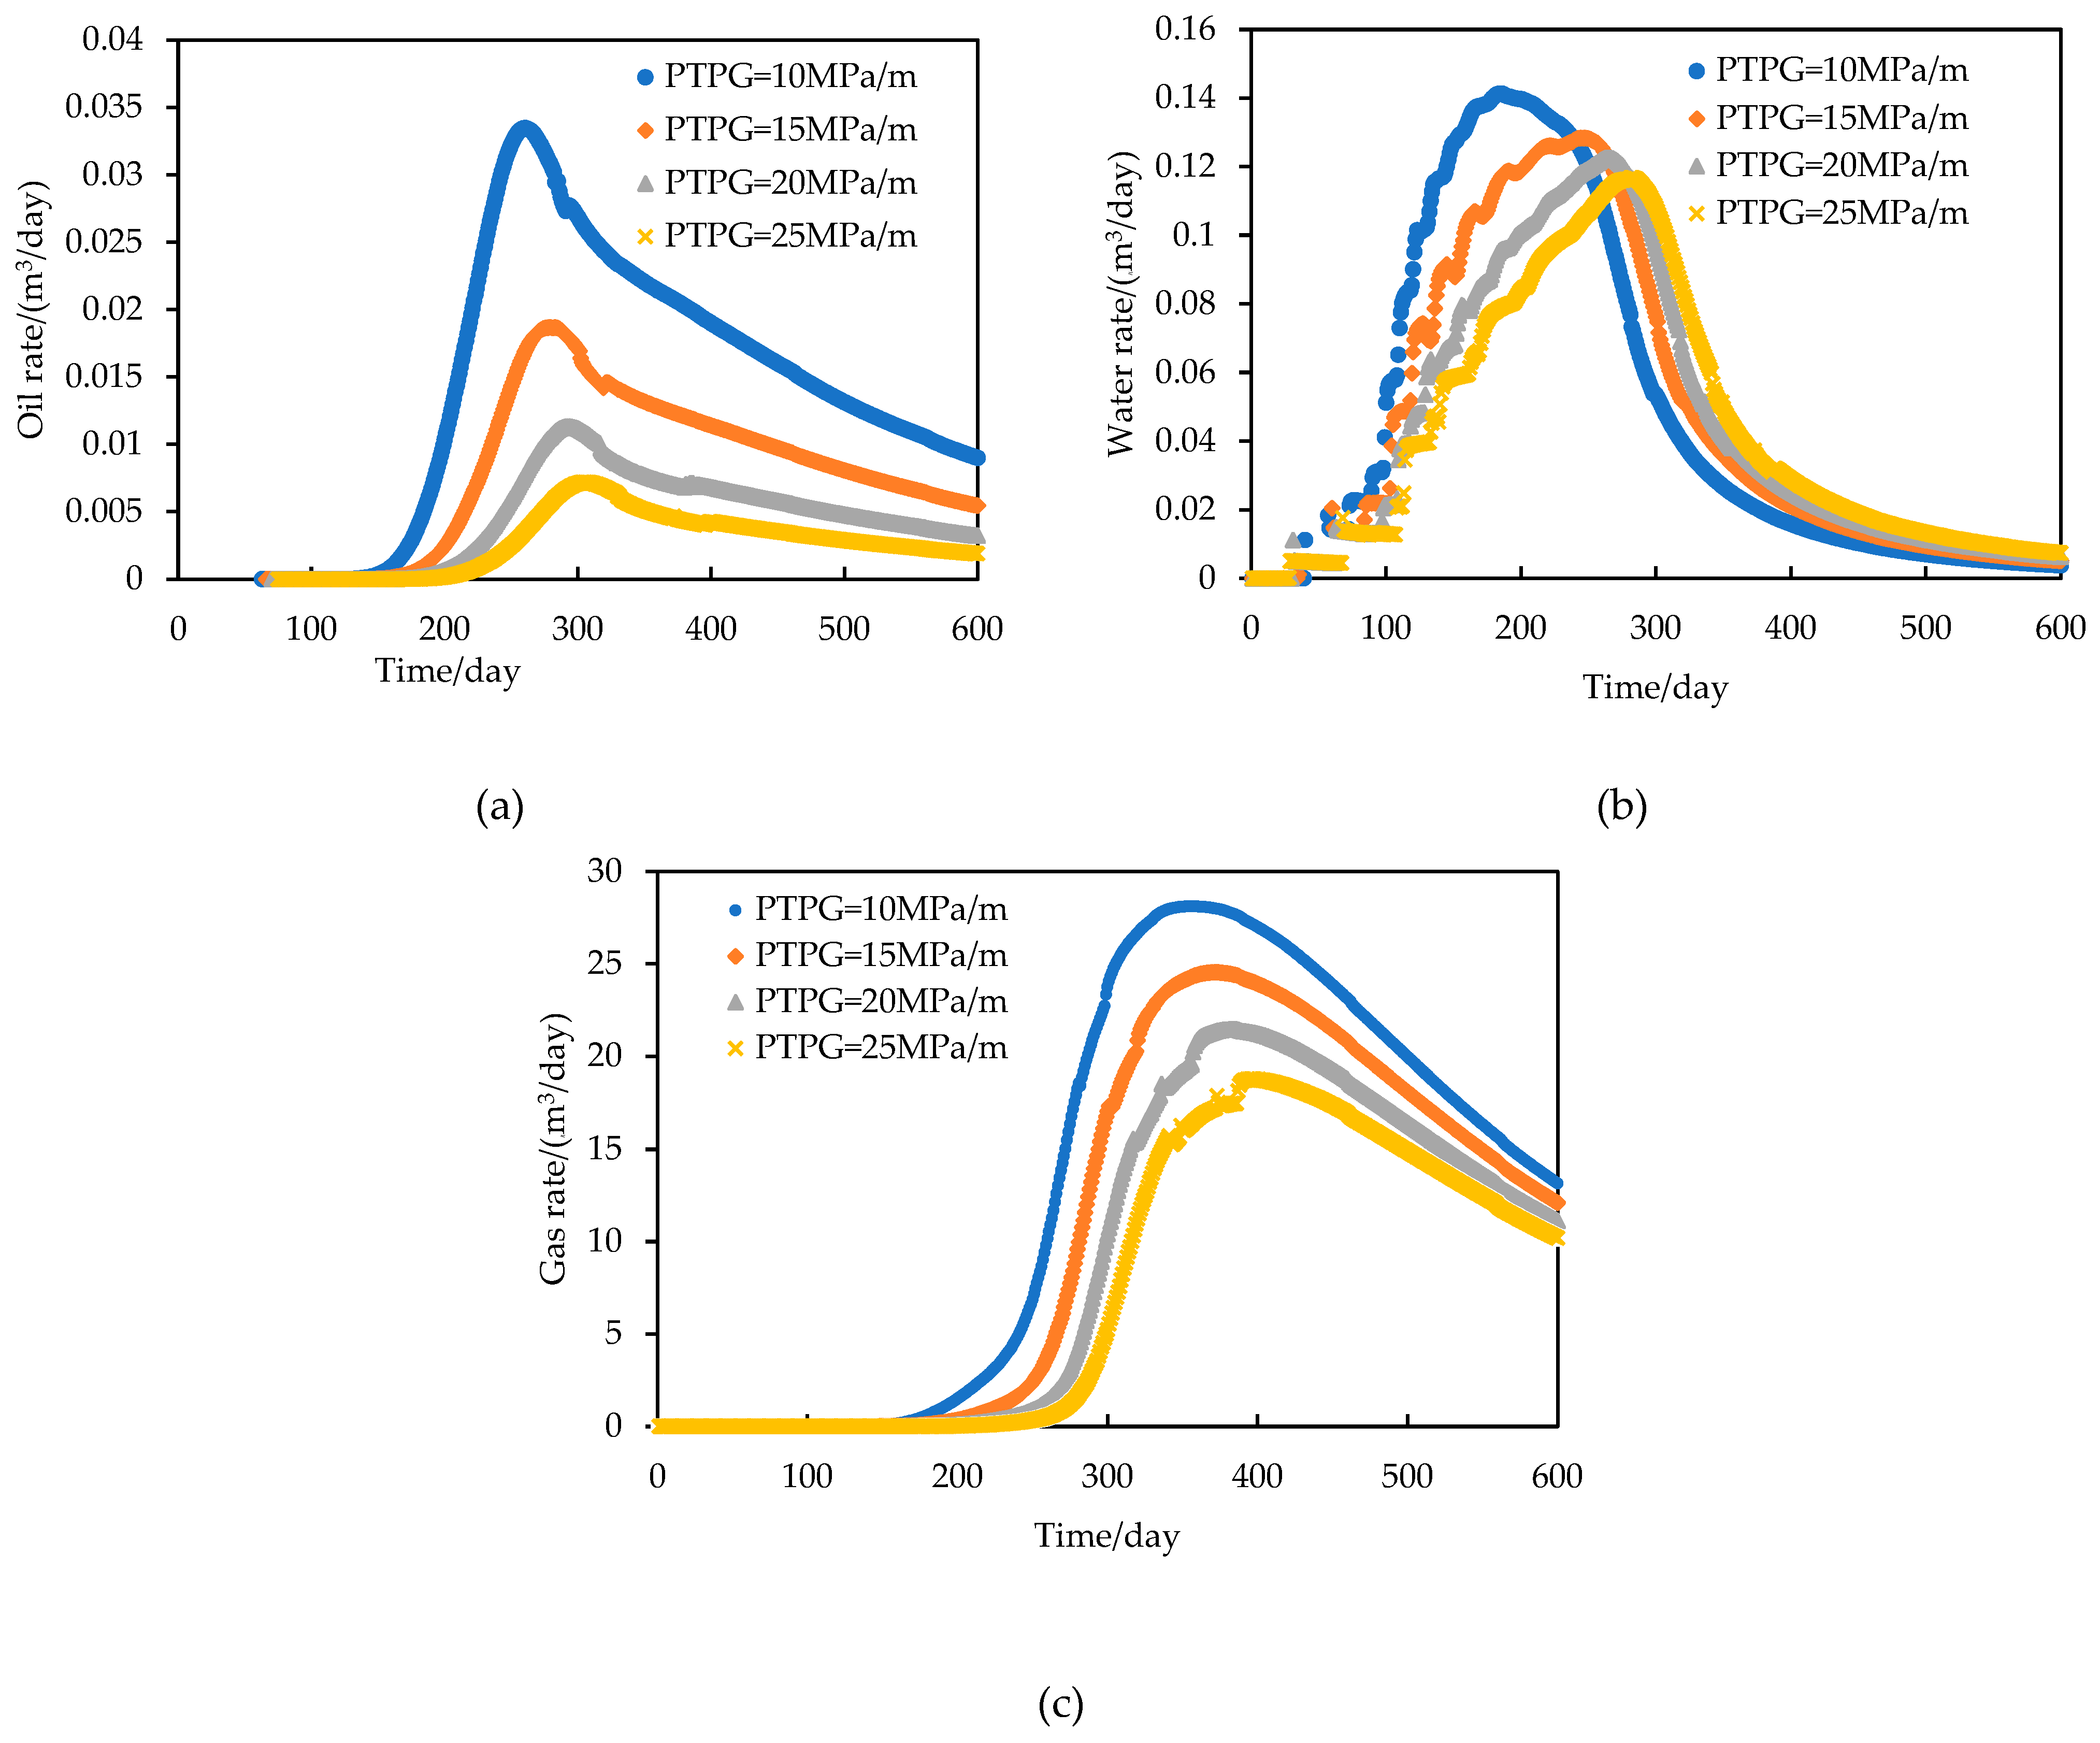
A numerical model was constructed to consider multiple mechanisms, and a sensitive factor analysis was conducted to address the issue of difficult prediction of oil breakthrough time and production in the Gulong shale oil reservoir. This chapter addresses the effects of PTPG, stress sensitivity, and permeability on flowback and production performance, as well as the oil breakthrough time. The influence of various factors on the yield at the model scale is shown in figures 10, 12, 14, and 16, respectively. The actual horizontal well production is calculated as the model production multiplied by the number of fracturing stages multiplied by the number of opened beddings, and then further multiplied by two.
4.1. Pseudo-Threshold Pressure Gradient Analysis
The time required for oil to breakthrough varies with different PTPG. As the PTPG increases, the oil breakthrough time exhibits a delayed trend. As shown in
Figure 10.a, during the increasing stage, the rate of increase of the oil rate curves significantly slows down with the increase of the PTPG. Concomitantly, the peak oil rate also declines significantly, and the time corresponding to the peak oil rate exhibits a delayed trend. In the decreasing stage, the rate of decline of the oil rate curve significantly slows down with the increase of the PTPG. The total oil content at the 600th day exhibited a gradual decline as the PTPG increased. This is due to the fact that an increase in the PTPG results in a reduction in the capacity for oil to flow through the matrix, an increase in the pressure gradient within the matrix, and a narrowing of the oil supply range. As shown in
Figure 10.b, PTPG exerts a profound influence on water rate. The smaller the PTPG, the larger the peak water rate, the earlier the peak water rate time, and the lower the water rate in the later period. With the increase of PTPG, the water rate curve tends to shift towards the lower right side. The larger the PTPG, the lower the peak water rate yield, the later the peak water rate time, and the smaller the fluctuation of water rate. As shown in
Figure 10.c, the gas rate decreases with the increase of PTPG. As the initial reservoir pressure surpasses the saturation pressure, there is an absence of free gas within the matrix, with gas production primarily stemming from the degassing of crude oil. Consequently, the higher the PTPG, the lower the crude oil production, the lower the corresponding oil degassing, and therefore the lower the daily gas production.
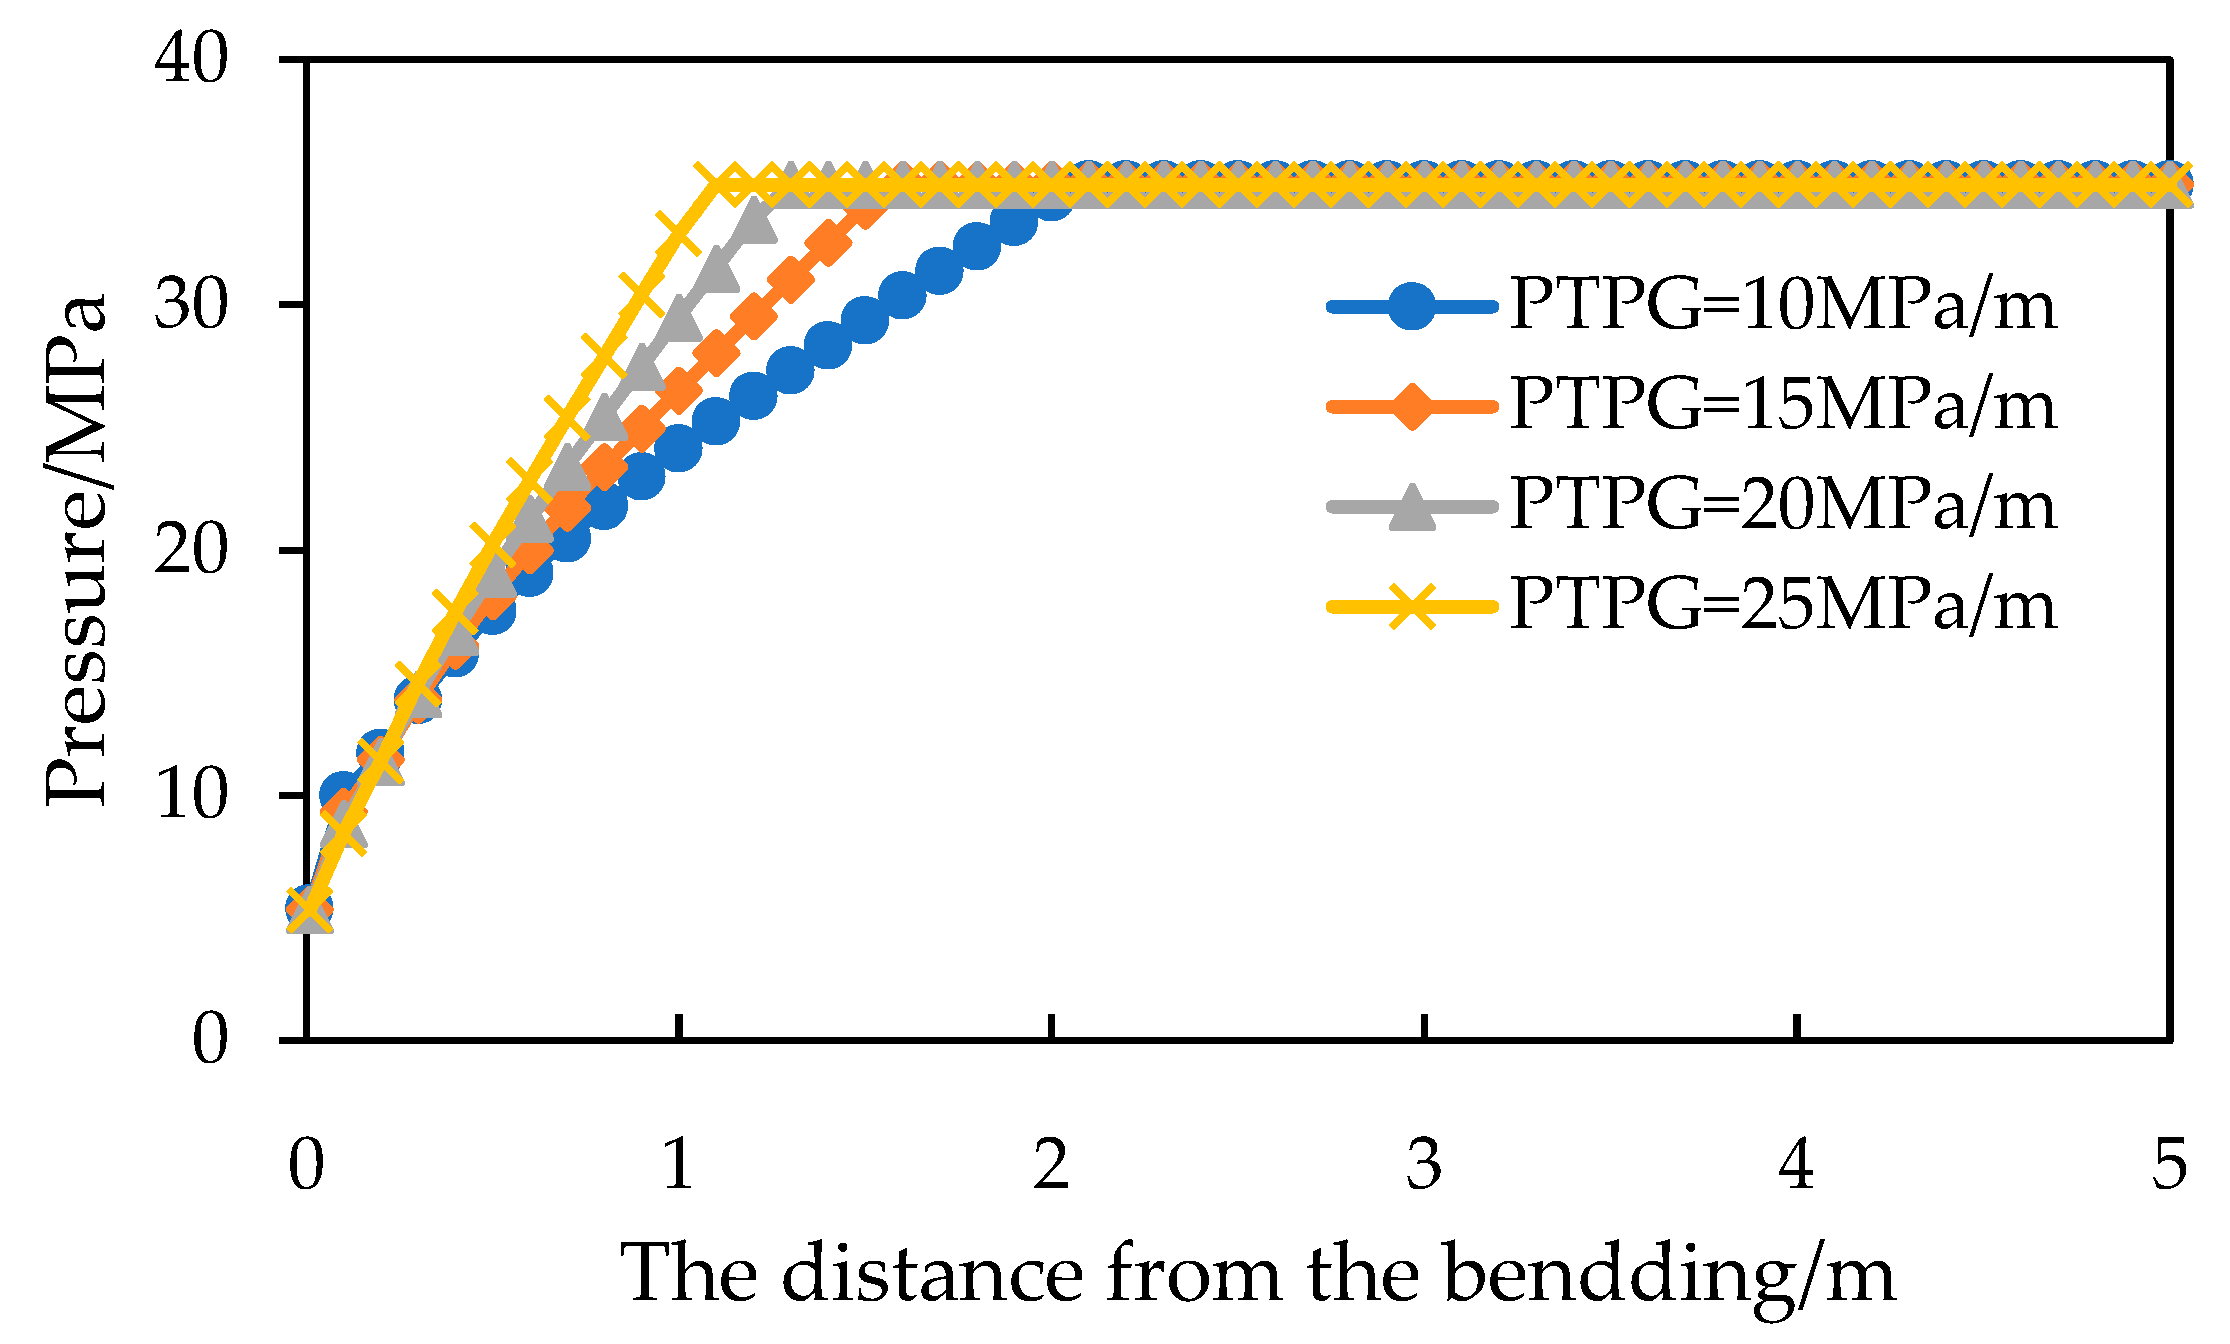
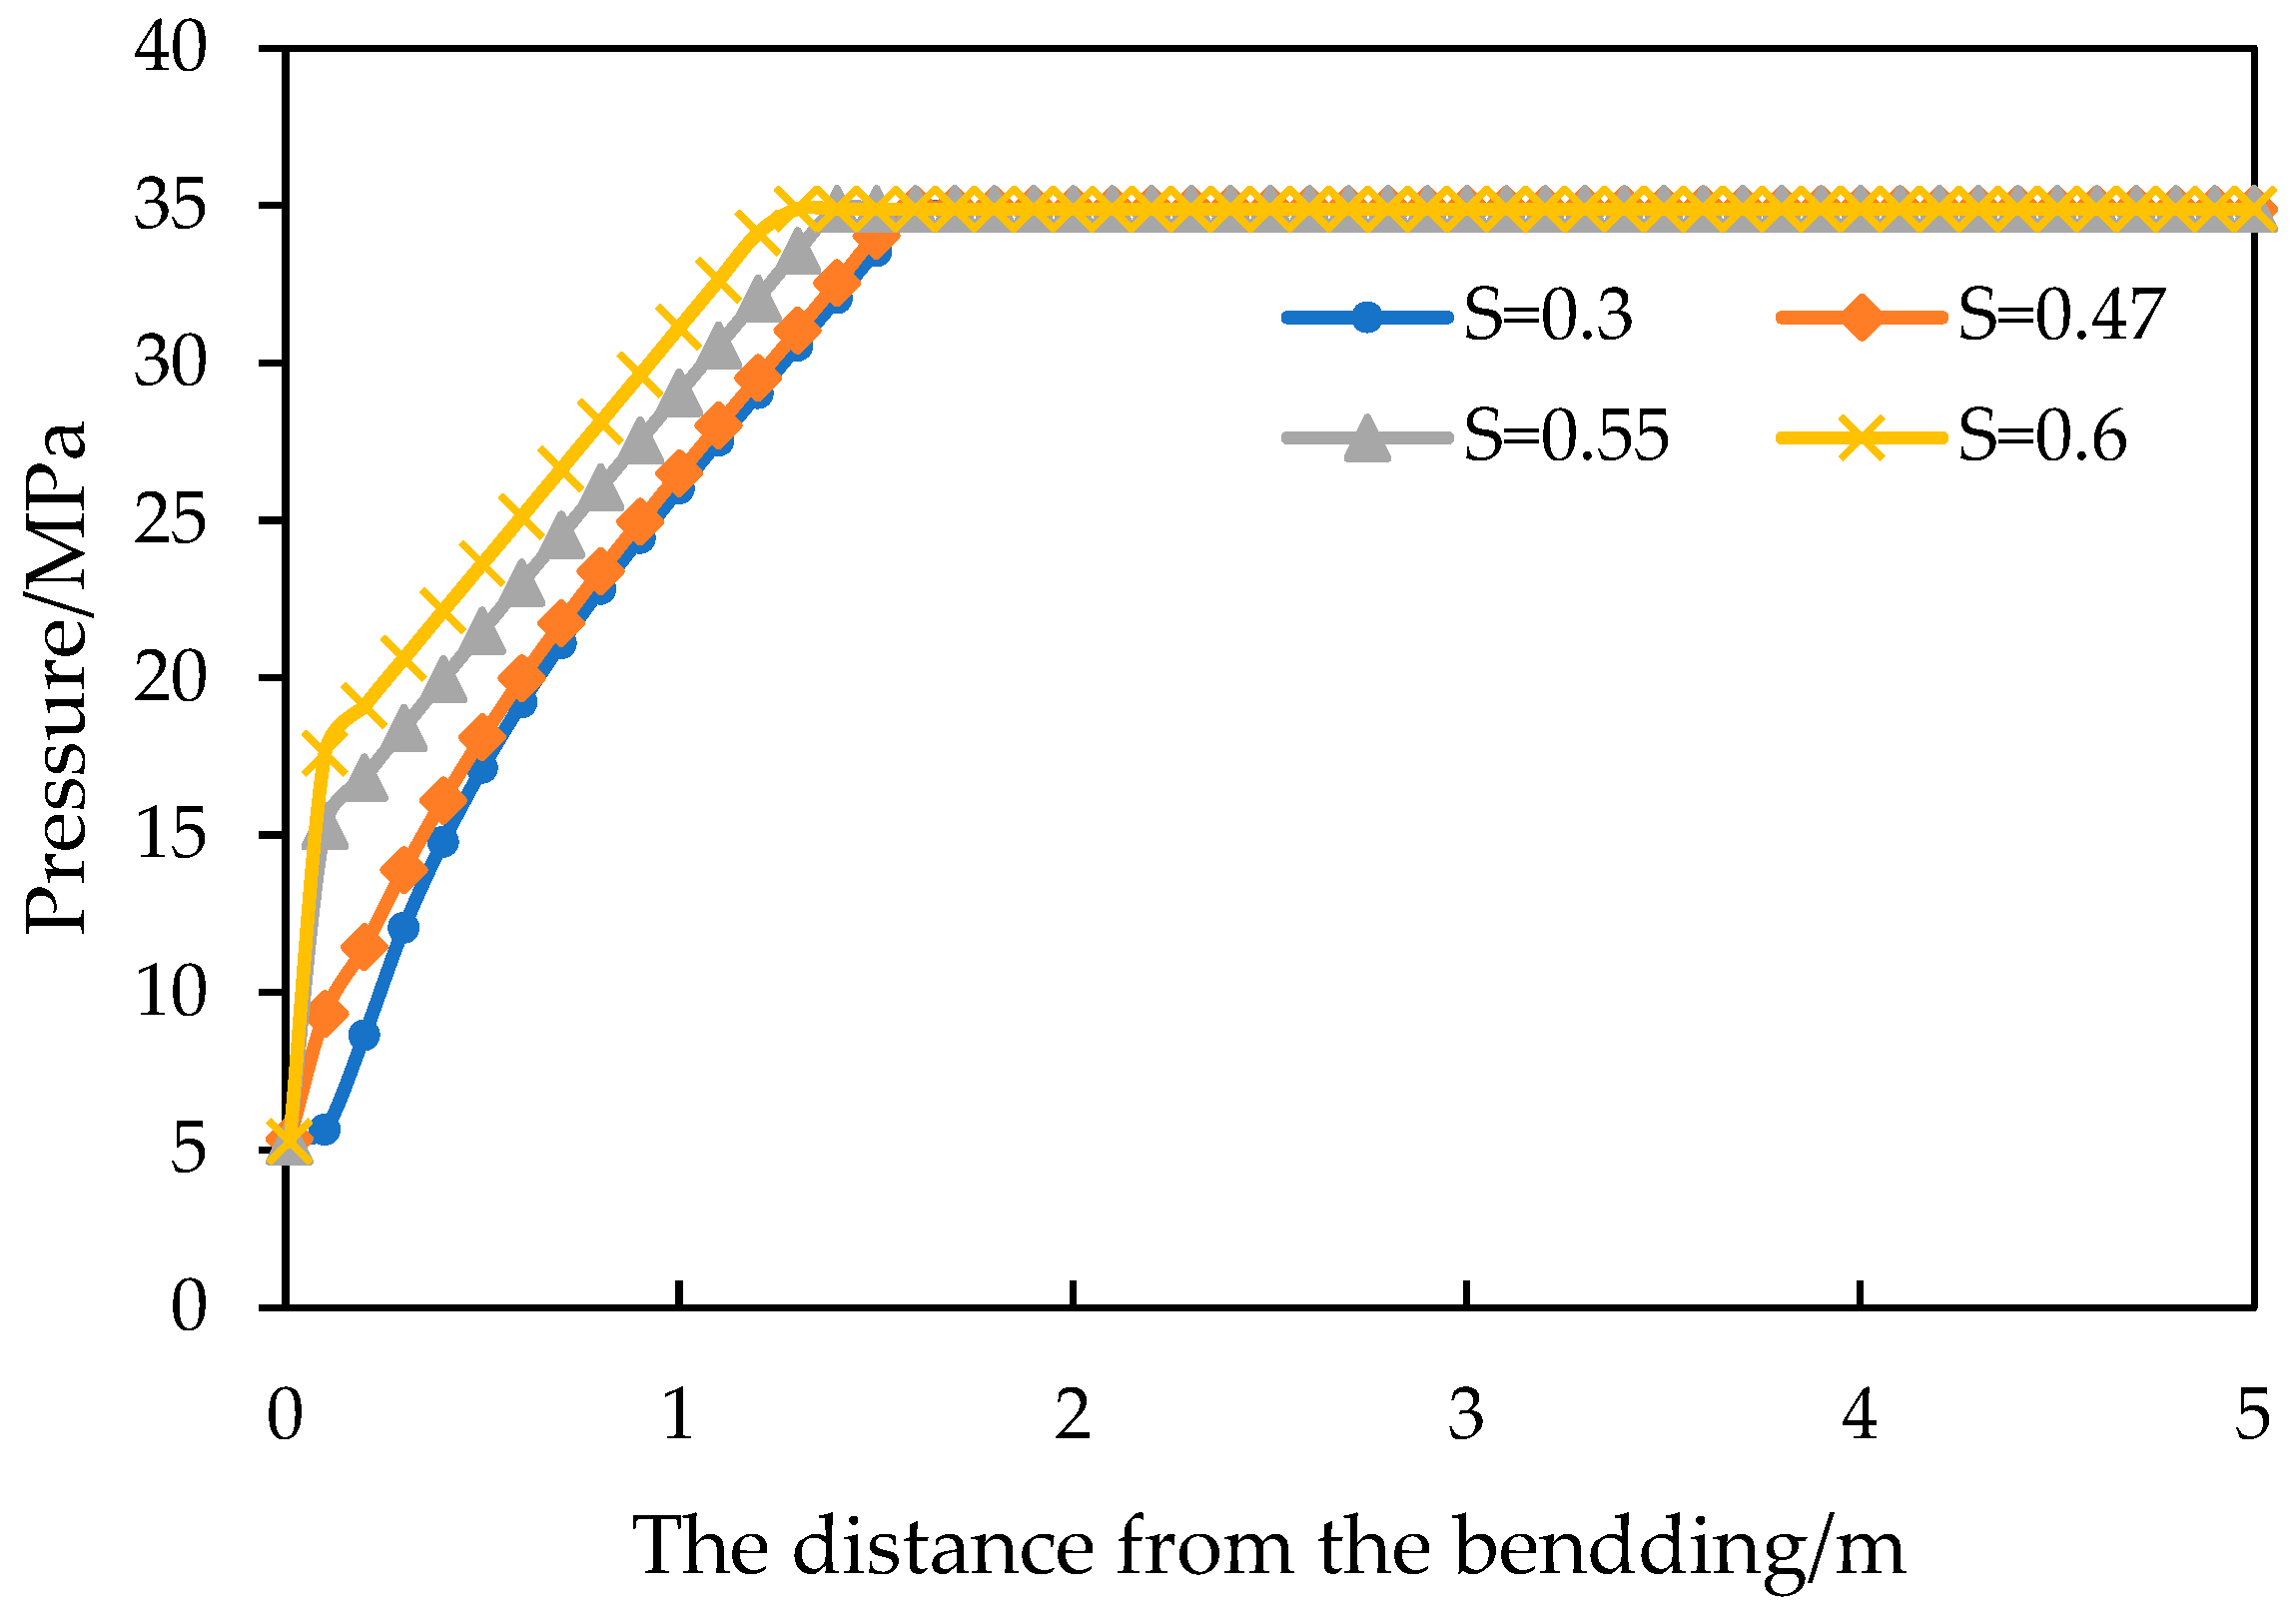
The analysis of this feature indicates that the fluid primarily flows through the opened bedding during the initial stage. Due to the substantial quantity of fracturing fluid present in the opened bedding, the oil saturation in the opened bedding is relatively low, resulting in a period of low production. Additionally, the permeability of the opened bedding is considerable, rendering it unaffected by the PTPG. Consequently, the production curve remains largely consistent during the low production stage. In the increasing stage, oil and gas begin to flow and produce near the opened bedding. The remarkably low permeability of the matrix significantly influences fluid flow within it, predominantly governed by the PTPG. A substantial PTPG amplifies the fluid's flow resistance within the matrix, leading to a pronounced pressure gradient along the flow pathway (
Figure 11). The small propagation range of pressure waves leads to the slow growth of the oil supply area. Subsequently, the rate of production growth slows and the peak production level declines with the increase in PTPG during the initial stages of production.
The peak production time is also advanced as the PTPG decreases, because the production is sensitive to the change in the PTPG, which leads to the difference of several times the oil production in the early stage. The peak production is the maximum value of the production and the node where the production increases and decreases. Due to the limited spread range of the reservoir and the limited recovery rate, the larger the spread range in the early stage, the larger the corresponding production, and the faster the fluid is extracted from the formation, the earlier the peak production time. The oil production in the early stage of small PTPG is much larger than that in the early stage of large PTPG, so the peak production time also advances as the PTPG decreases.In the decline stage, as the PTPG increases, the rate of fluid production in the matrix slows down. Consequently, the influence of fluid production on the production decline is minimal, resulting in a long, stable production period and a slow decline rate.
4.2. Opened Bedding Stress Sensitivity Analysis
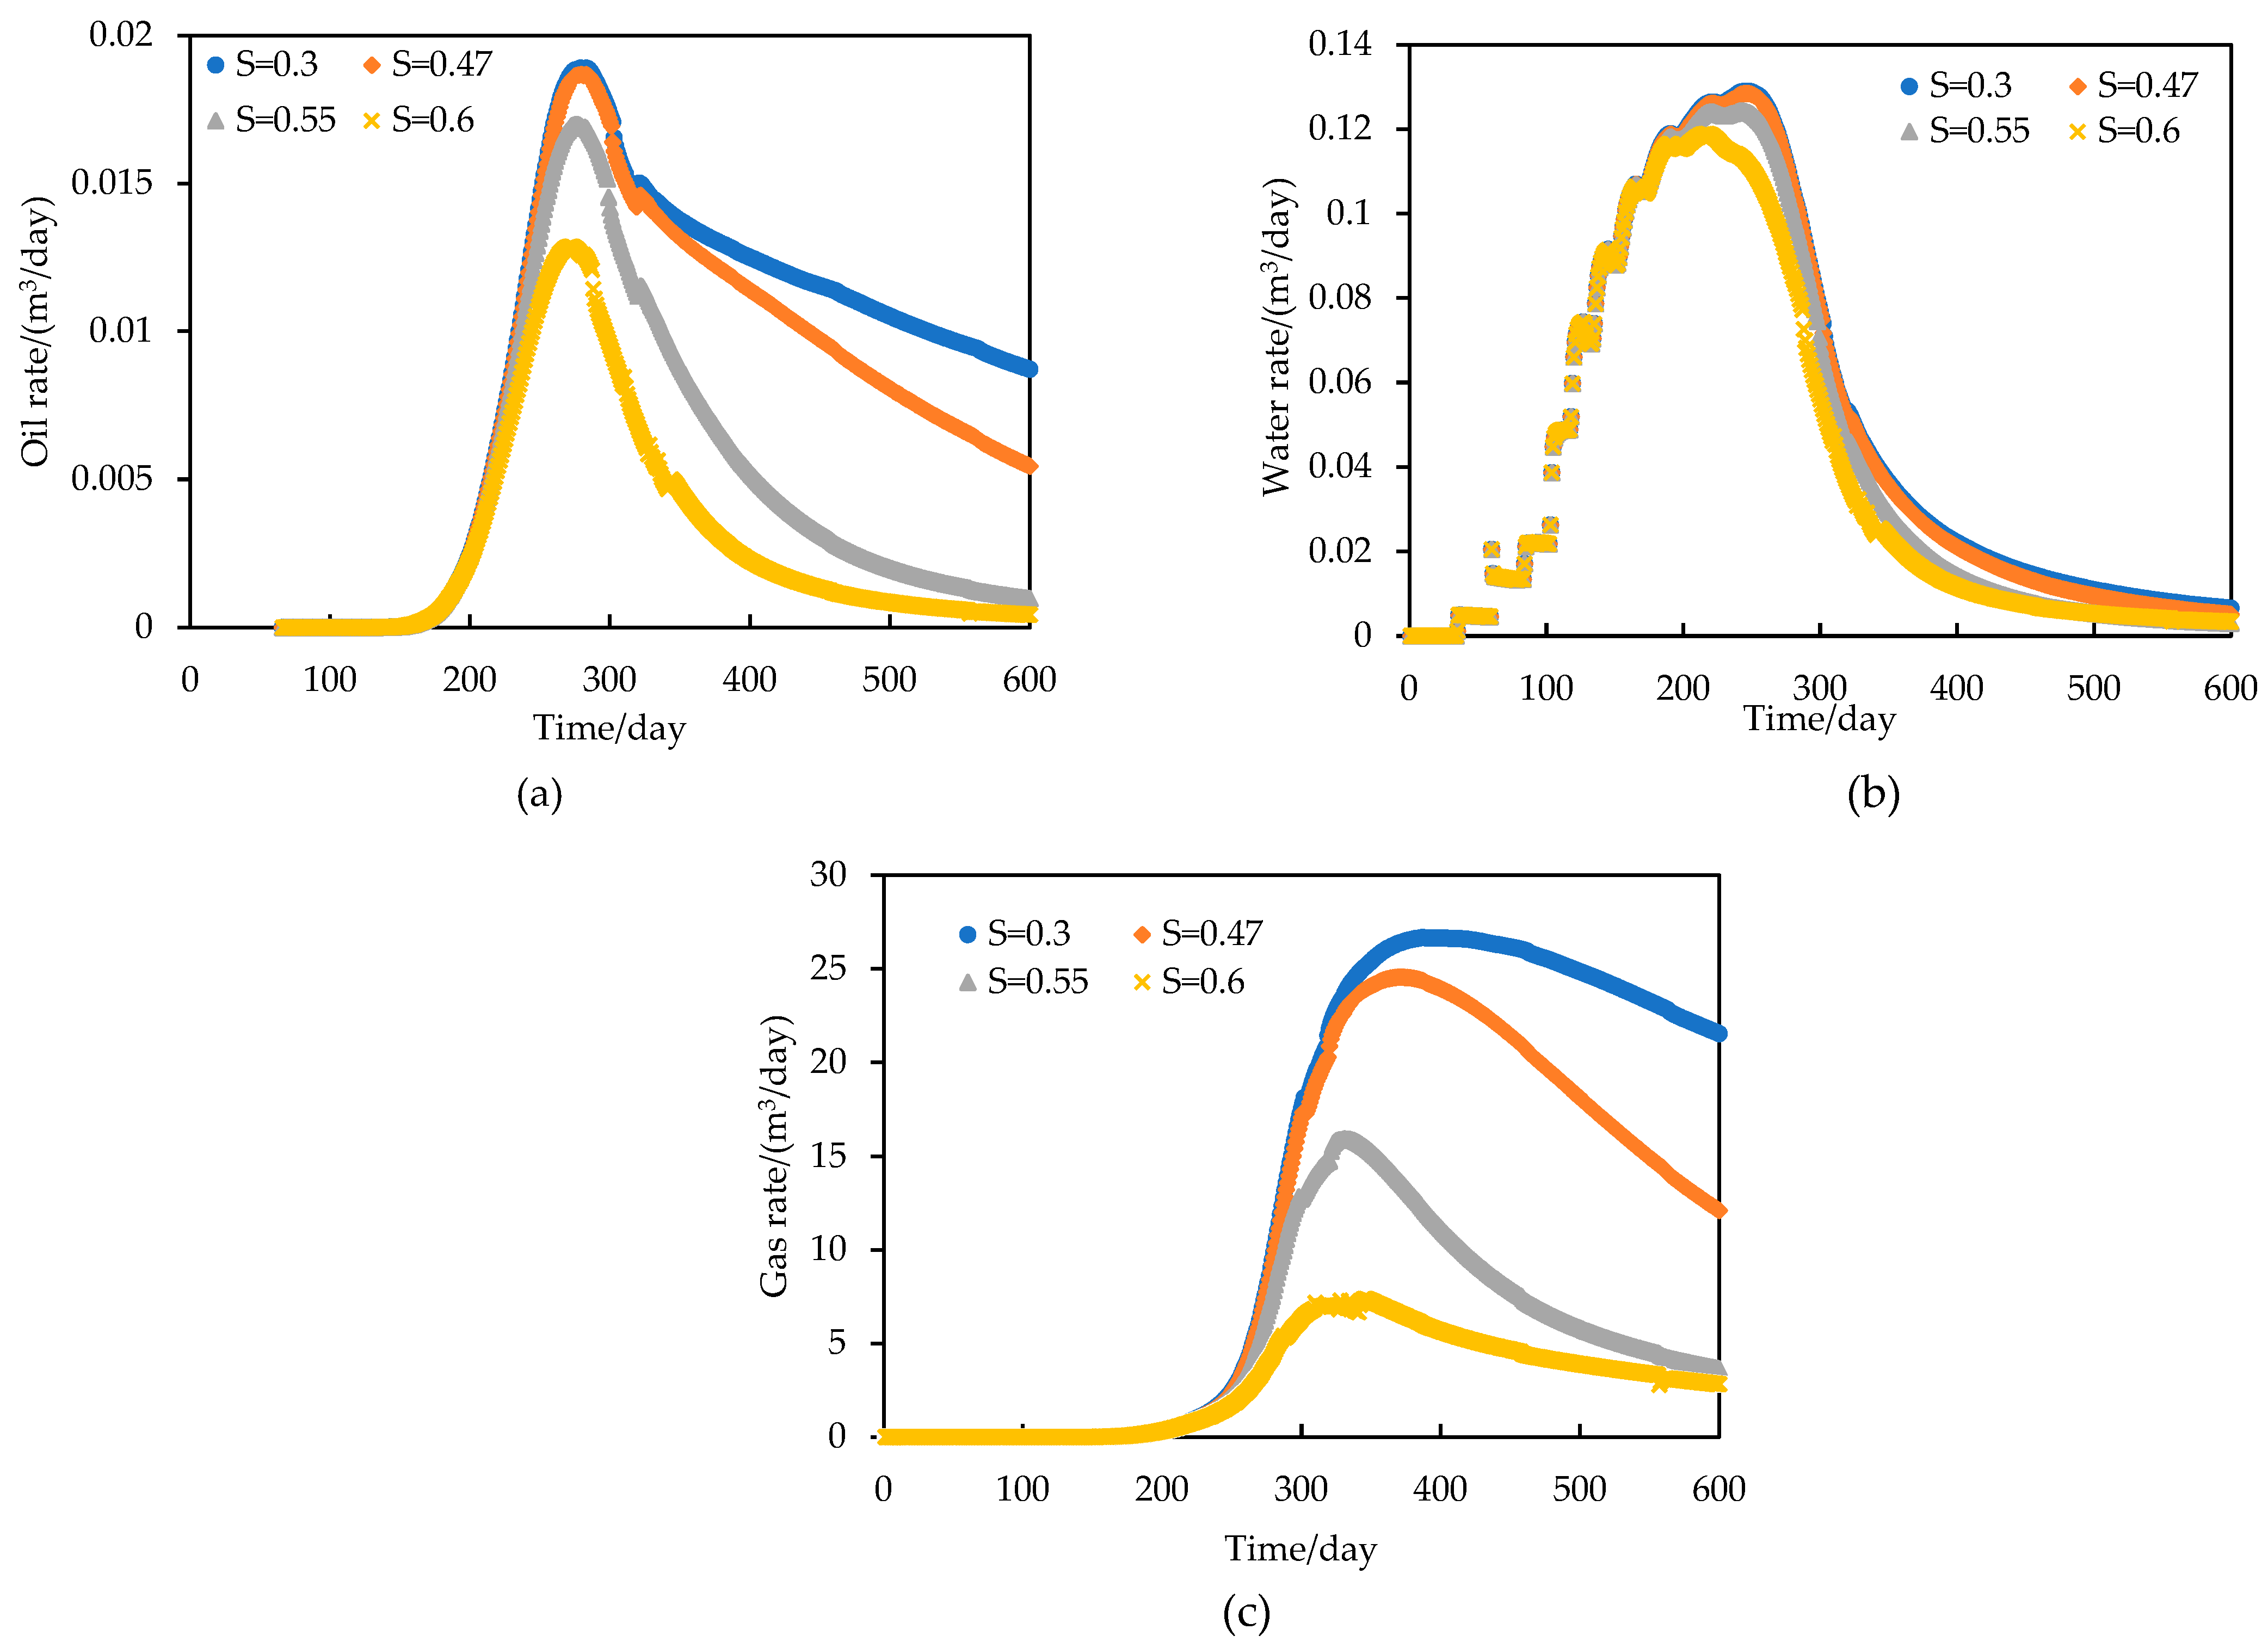
As shown in
Figure 12.a, as the stress sensitivity coefficient (S in
Figure 11) increases, the increasing rate of the oil rate curve slows down, and the oil rate peak shows a decreasing trend. When the stress sensitivity coefficient goes up, the time to oil rate peak is constantly advanced. During the declining stage, there is a rising tendency in the rate of oil decline as the stress sensitivity coefficient increases. With an increase in the stress sensitivity coefficient, the total oil at the 600th day decreases. Influenced by the exponential relationship between effective stress and permeability of beddings, the declining of total oil production is accelerating, when the coefficient increases from 0.47 to 0.6. As recovery proceeds, the BHP decreases, and the opened beddings with larger stress sensitivity coefficients close more quickly. Their permeability decreases rapidly, and the pressure gradient in the shale beddings is more significant, resulting in a reduced supply range and lower production.
As shown in the
Figure 12.b, during the initial stages, there was negligible disparity in the water rate curve. However, the peak water rate diminishes with the escalation of the stress sensitivity coefficient. The difference increased after the peak water rate. Large stress sensitivity coefficients lead to the opened bedding permeability decrease faster and the water rate decrease faster after water rate peak. As shown in
Figure 12.c, the increase of stress sensitivity coefficient leads to a significant decrease in gas rate.
The analysis of this feature shows that in the increasing stage, the opened bedding pressure decreases with the production of the fluid in bedding and matrix. However, the pressure drop in the early stage is small, so the stress sensitive effect is weak, and the pressure drop propagation range is small. The permeability of the opened bedding decreases exponentially. The higher the stress sensitivity coefficient, the faster the permeability decline, resulting in slower production increasing and lower peak production with the increase of stress sensitivity coefficient. In the decline stage, due to the low opened bedding pressure, the opened bedding permeability is also very low. There is a large pressure gradient in the opened bedding (
Figure 13), which greatly limits the subsequent pressure diffusion in the matrix. As the stress sensitivity coefficient increases, the oil supply area diminishes, leading to a faster rate of oil production decline.
4.3. Opened Bedding Permeability Analysis
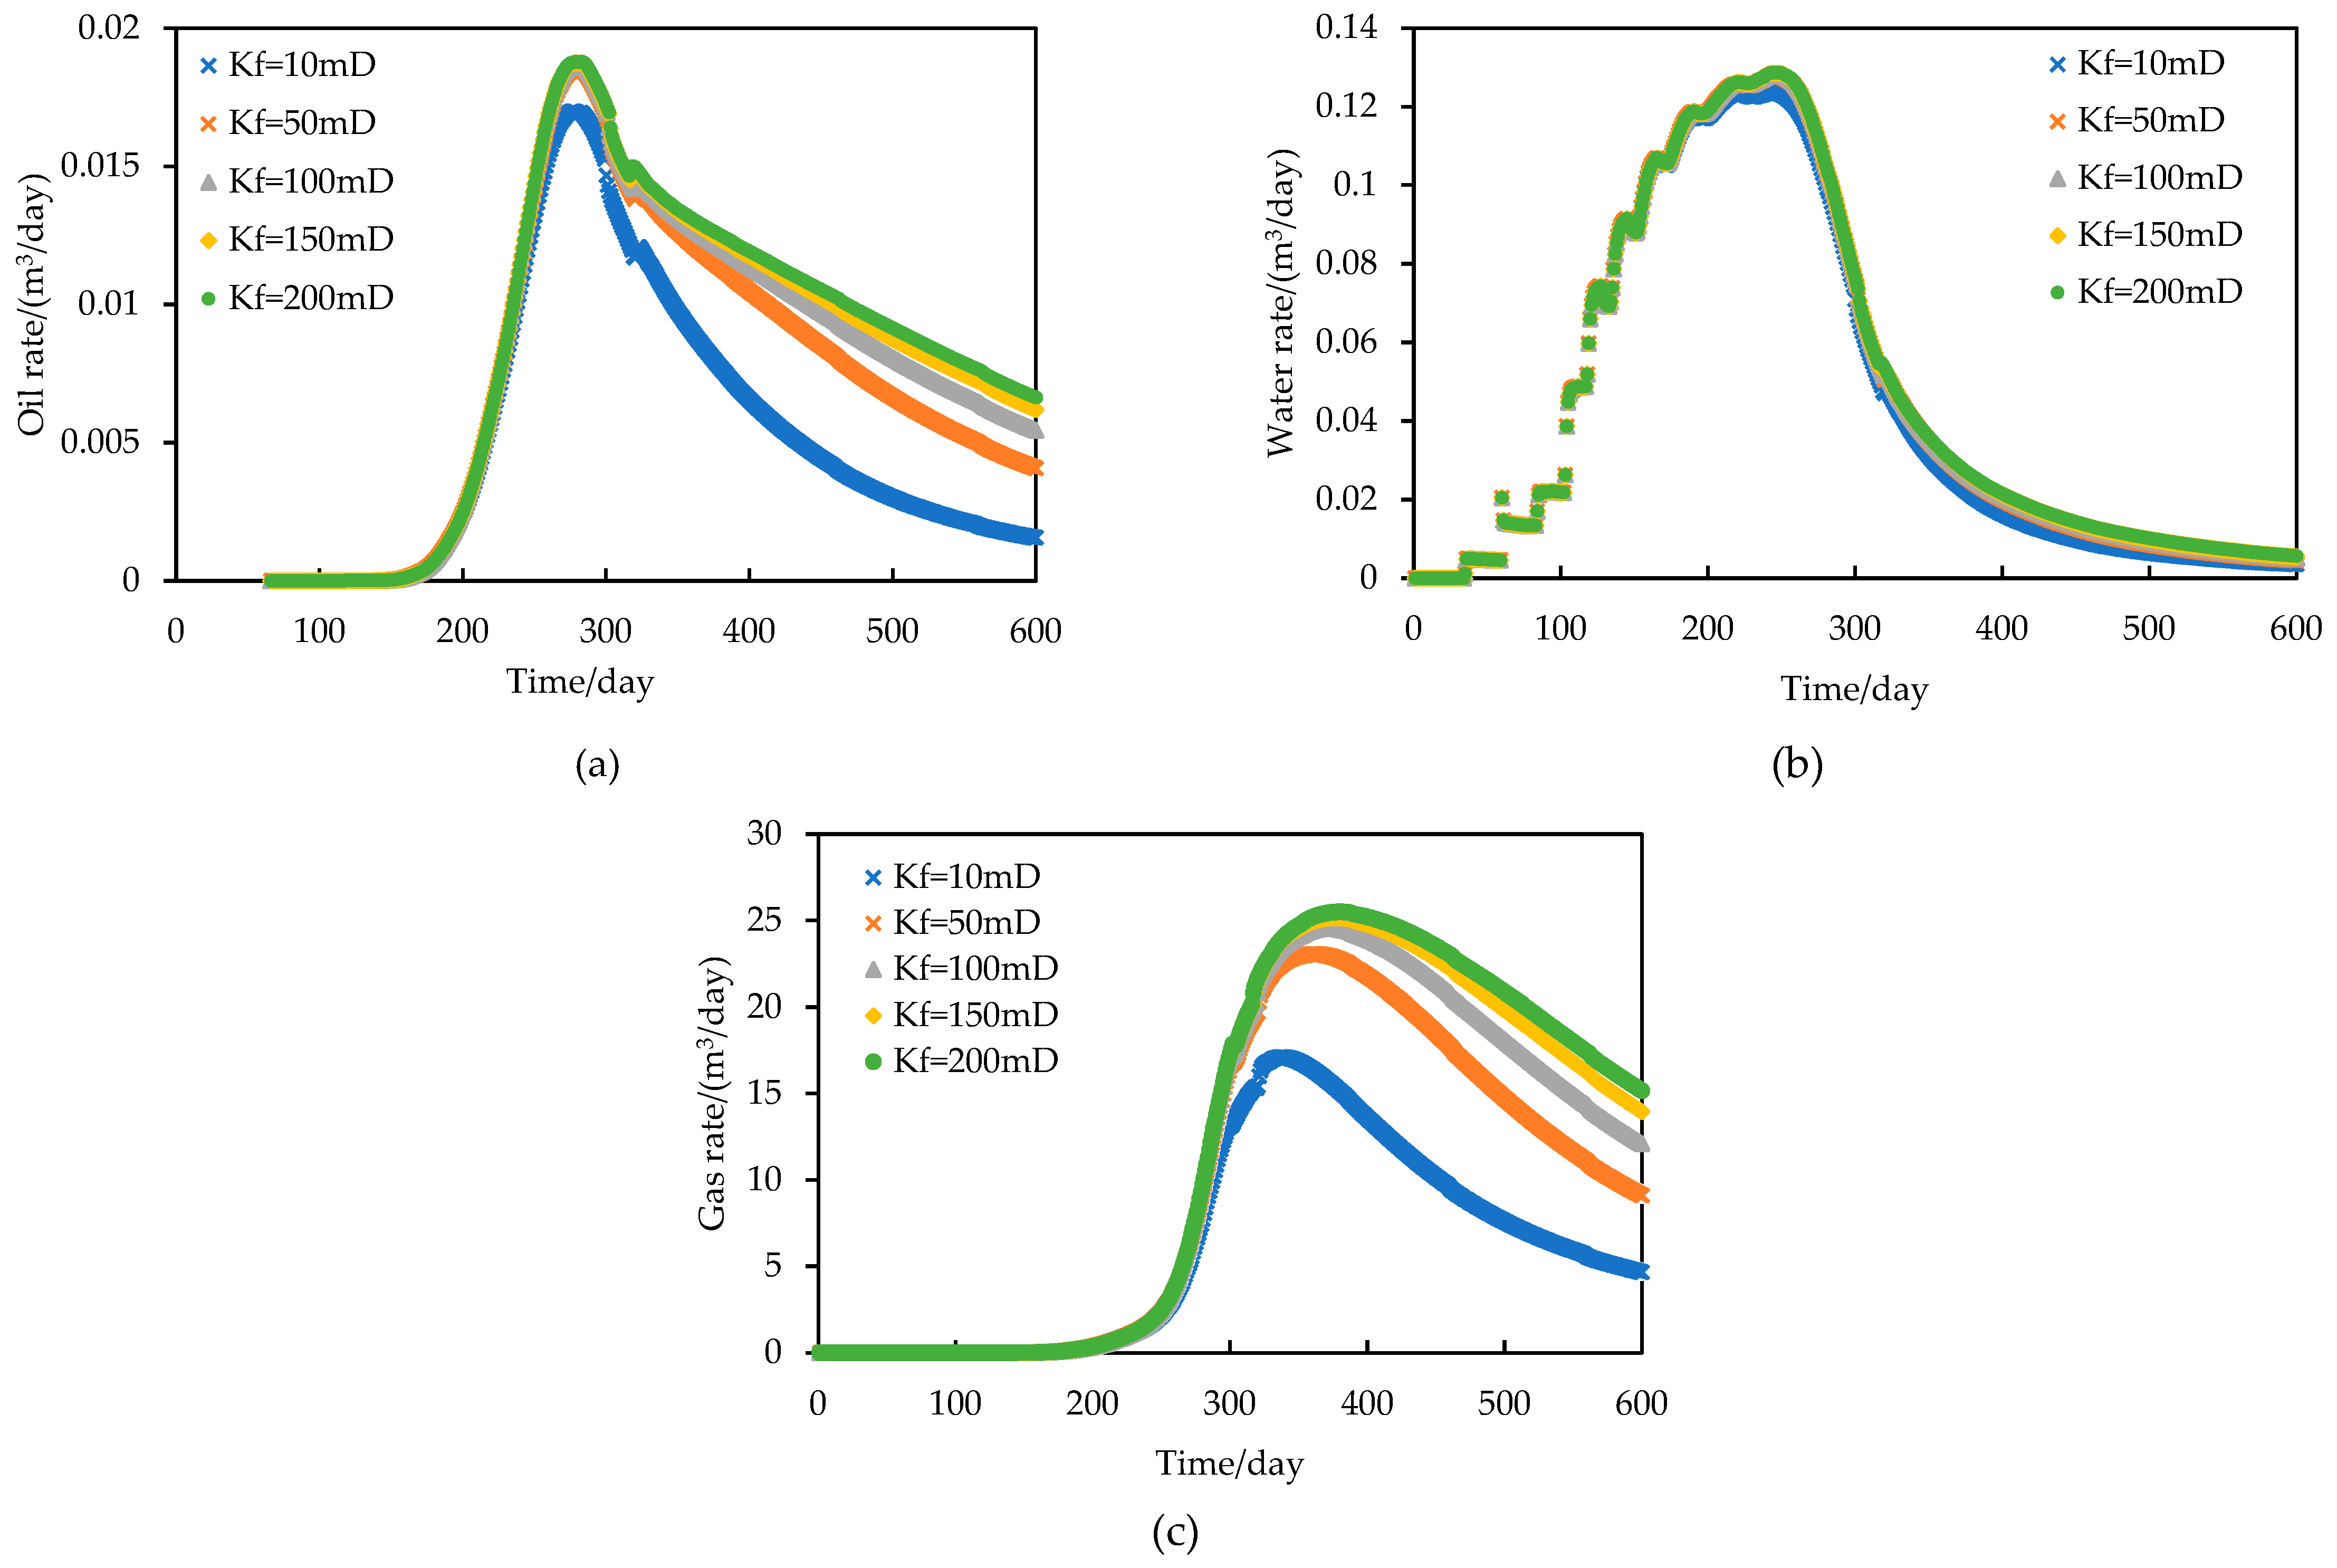
As shown in
Figure 14.a, the differences of oil rate begin to appear in the later incremental stage. As the permeability of the opened beddings (Kf in Figure14) increases, the oil rate peak shows an increasing trend; the difference in the time of the peak is not apparent. In the decreasing stage, the decreasing rate of the oil rate curve decreases with the increased opened bedding permeability. The higher opened bedding permeability means the greater the opening degree of the opened beddings. Therefore, its closing speed is slower under the stress sensitivity effect, and the corresponding permeability after closing is larger, which leads to a higher total oil.
As shown in the
Figure 14.b, the water rate curves flow under different opened bedding permeability is similar to that under different stress sensitivity coefficients. There is no significant difference before reaching the water rate peak, and the difference of water rate peak is also small. The water rate is slightly larger with the higher the permeability of opened bedding in the decline stage. As shown in
Figure 14.c, the decrease of opened bedding permeability leads to the decrease of gas production. However, the decline rate of gas rate curve under different opened bedding permeability is basically the same in the decline stage.
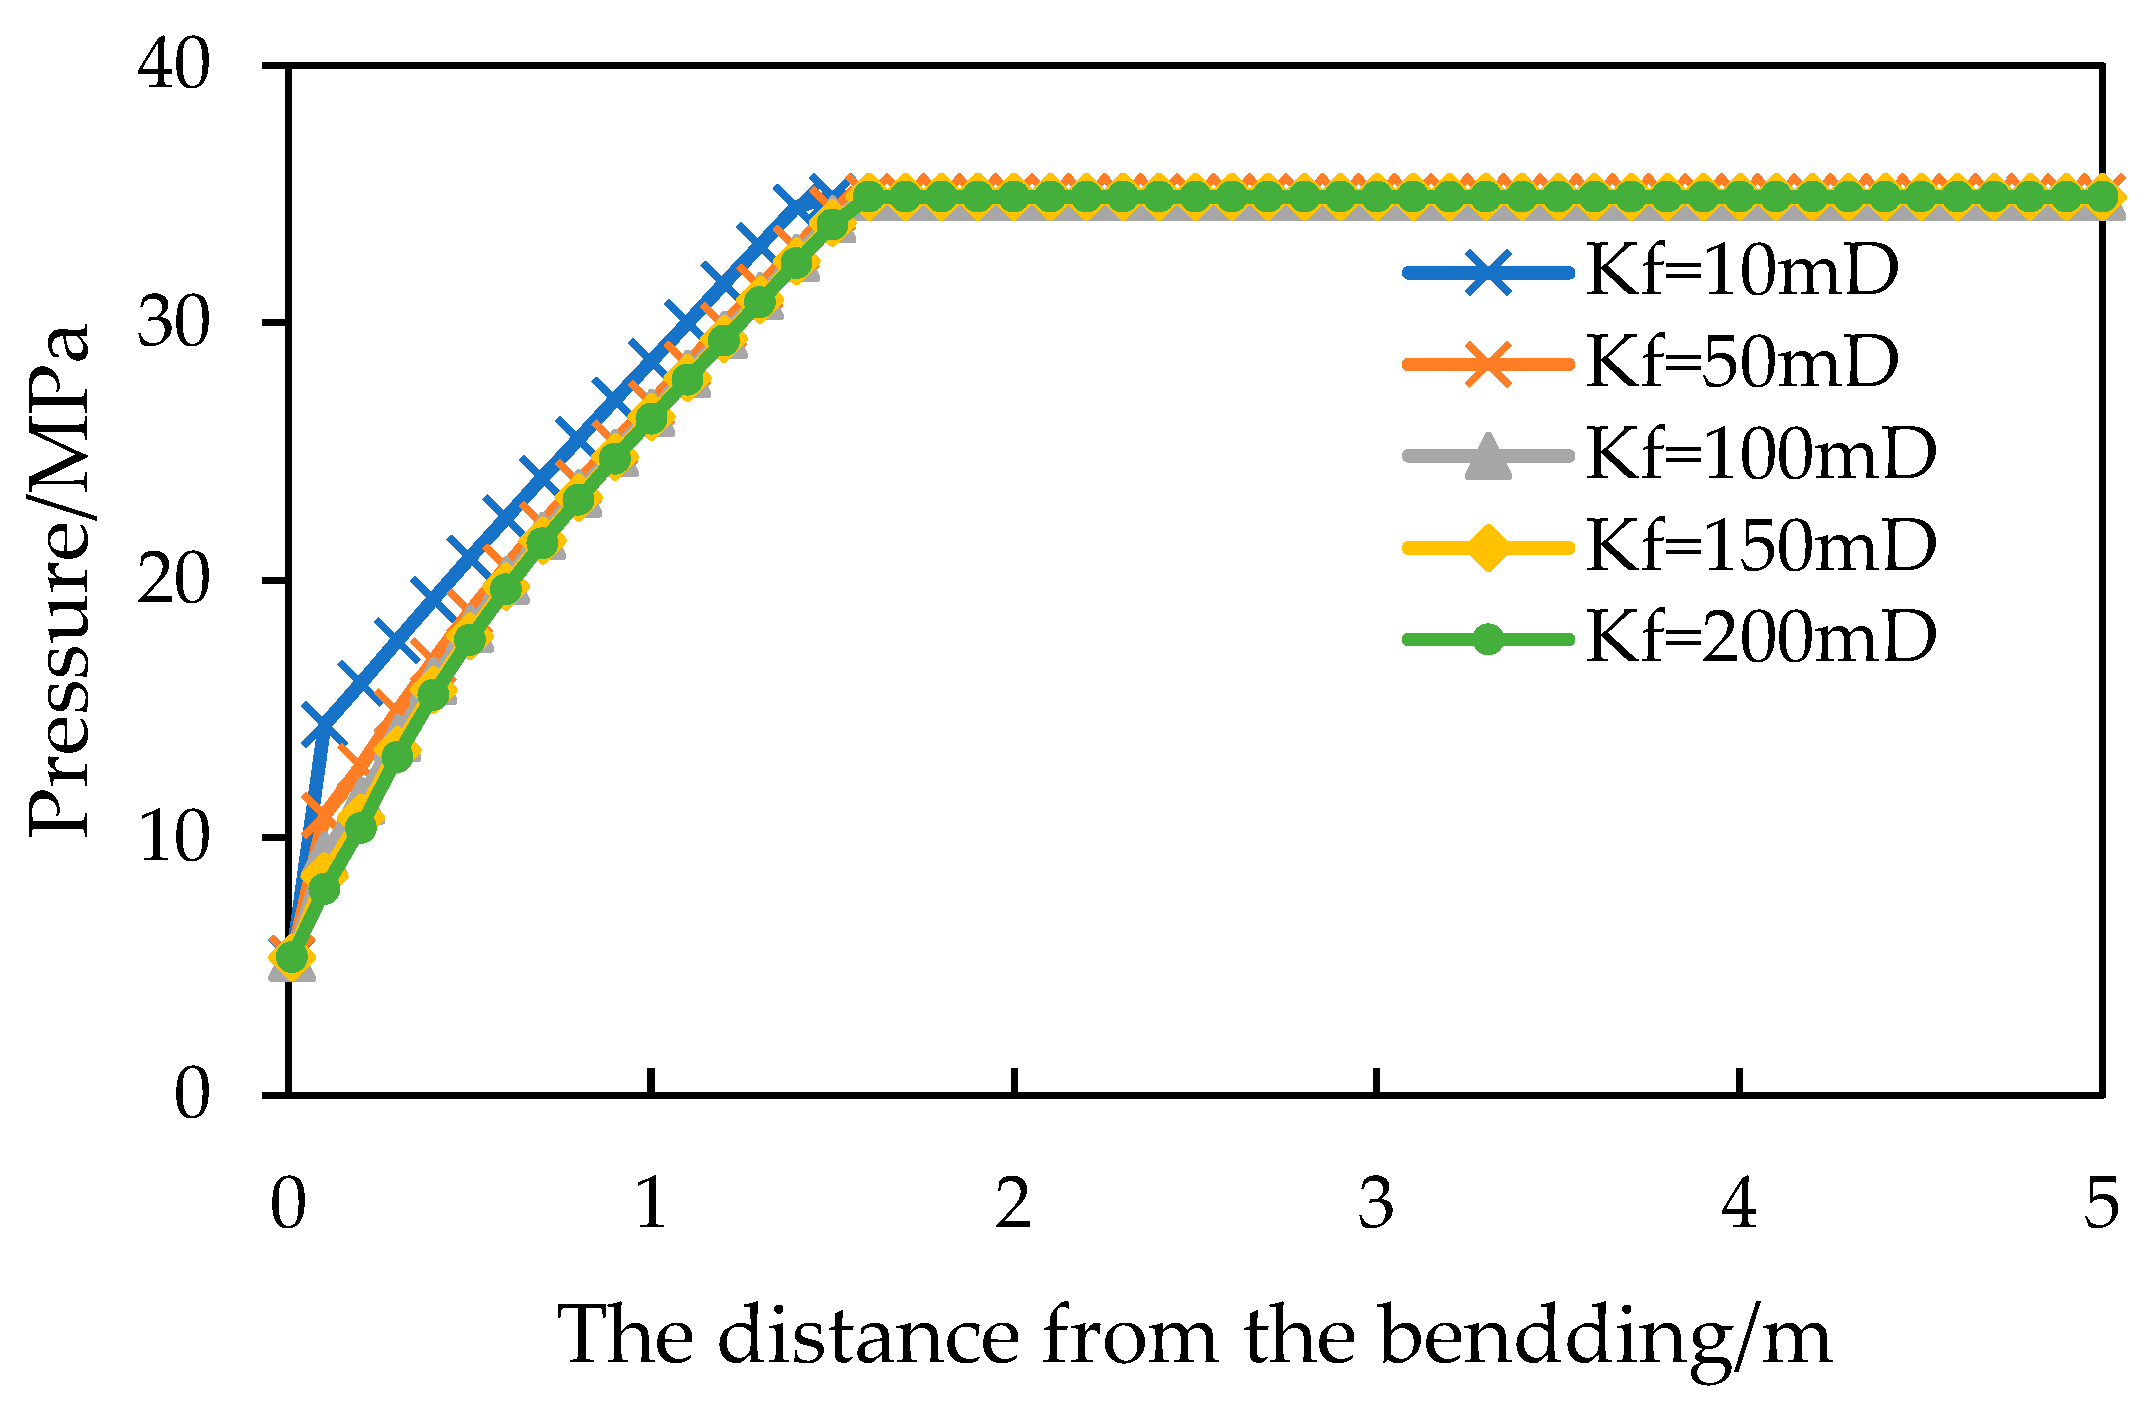
According to the analysis of this feature, in the increasing stage, with the production of fluid in the opened bedding and matrix, the pressure of the opened bedding decreases rapidly, and its permeability decreases exponentially. When the opened bedding pressure is equal, the larger the original permeability of opened bedding is, the larger the permeability after decreasing, so the greater the production peak can be reached. In the decline stage, although the original permeability of opened beddings varies, their stress sensitivity coefficients remain consistent, resulting in a similar trend in fracture permeability changes. When the permeability of opened beddings is high (>50×10-3), the yield difference during the decline stage is minimal initially but gradually increases with production progress. The variation in yield across different opened bedding permeability is not significant. However, differences mainly arise from challenges in fluid production due to fracture permeability within the supply area.
Figure 15.
Formation pressure distribution on the 600th day at different opened bedding permeability (opened bedding permeability is respectively 10, 50, 100, 150, 200mD).
Figure 15.
Formation pressure distribution on the 600th day at different opened bedding permeability (opened bedding permeability is respectively 10, 50, 100, 150, 200mD).
4.4. Matrix Permeability Analysis
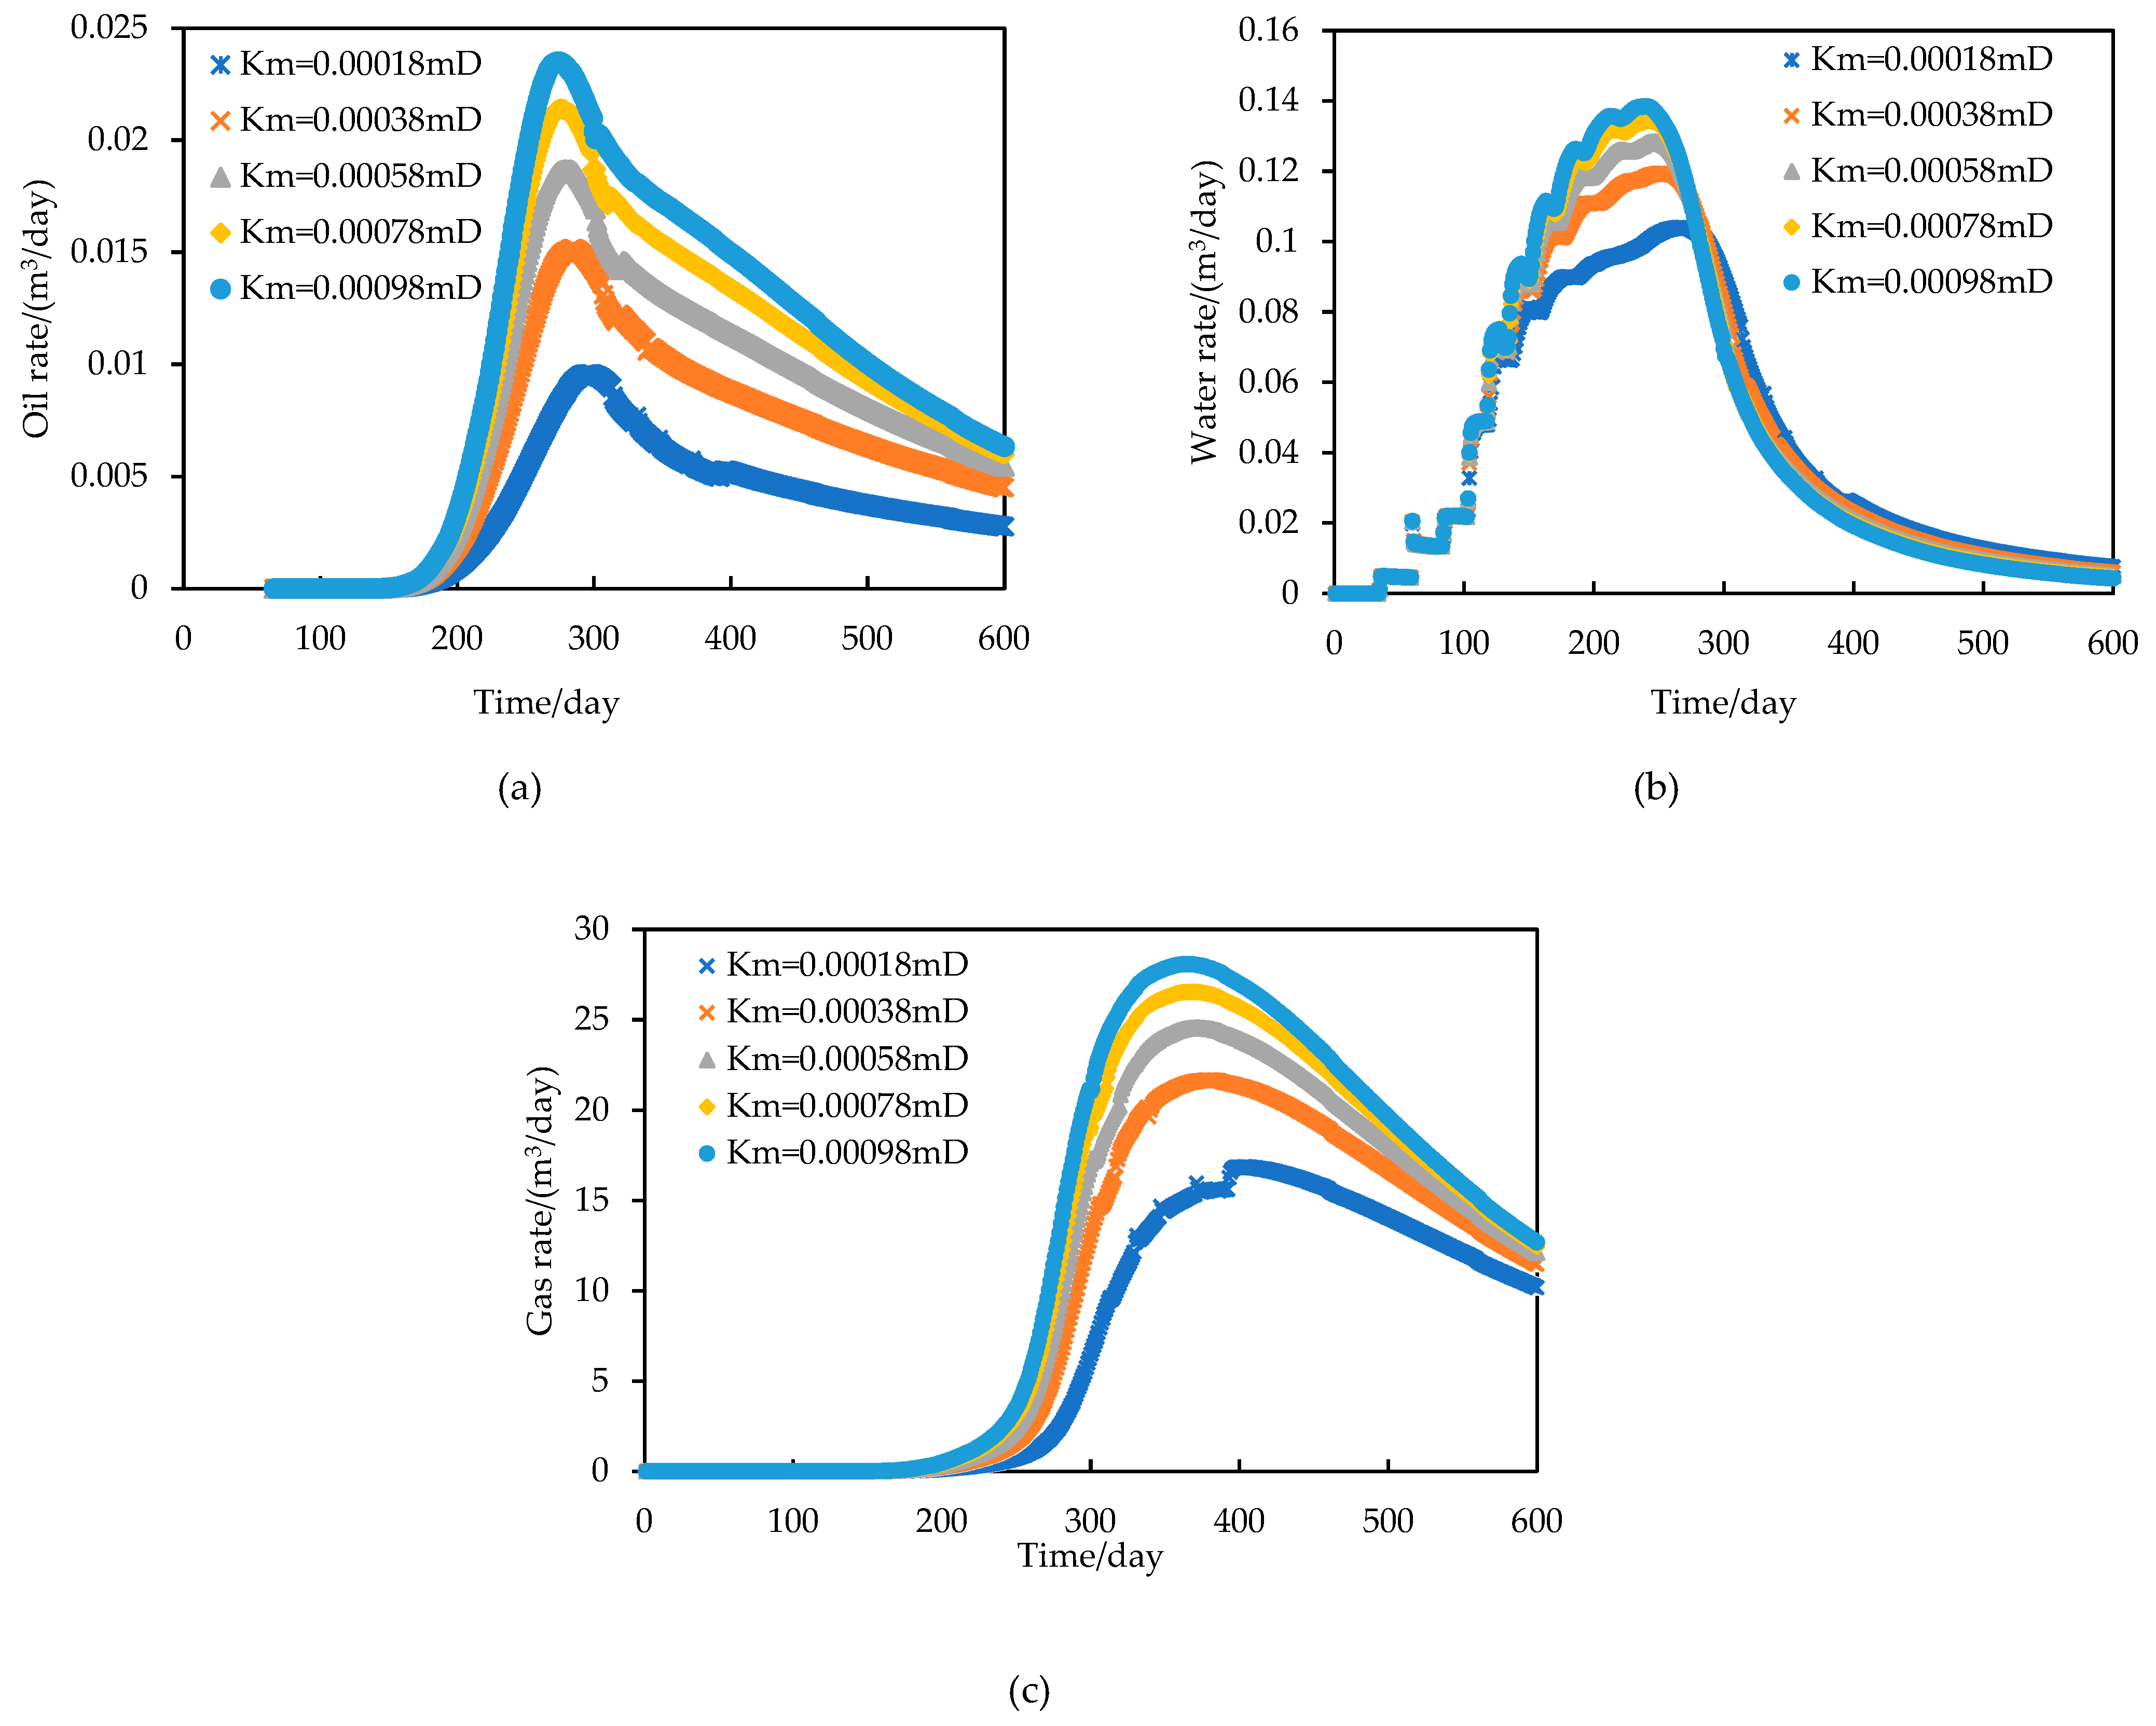
As shown in
Figure 16.a, the four curves are almost identical in the low yield stage. Differences appeared in the incremental stage. As the matrix permeability (Km in Figure16) increased, the increasing rate of the oil rate curve accelerated. The oil rate peak also showed a rising trend, and the time to oil rate peak was earlier. In the decreasing phase, the rate of decrease in the oil rate curve accelerated with increasing matrix permeability. Matrix permeability reflects the resistance to fluid mobilization within the matrix, resulting in a smaller supply range and lower oil rate, which is consistent with the impact of the PTPG.
As shown in the
Figure 16.b, there are obvious differences in water production under different matrix permeability. With the increase of matrix permeability, the shape of water rate curve becomes narrower and higher. Higher matrix permeability can result in a longer increasing stage and a larger water rate peak. These reservoirs also tend to experience shorter high production stages and faster decline rates after reaching the water rate peak. As shown in
Figure 16.c, the gas rate increases with the increase of matrix permeability.
The characteristics of liquid production are analyzed. In the incremental stage, with the production of fluid in the opened bedding and adjacent matrix, more fluid in the matrix is affected by the pressure drop and flow to the opened bedding. Greater matrix permeability correlates with reduced fluid mobilization and flow resistance within the matrix, consequently resulting in a decreased pressure gradient in the matrix. This results in a wider range of pressure drops that can reach, leading to faster production increasing rates and the ability to reach larger peak production.
Similar to the PTPG, the early production of shale oil is also very sensitive to the matrix permeability, and the pressure spread range in the early under different matrix permeability is very different, resulting in a large difference in the early oil production and the change time of production from increasing to decreasing. Therefore, the higher the matrix permeability, the faster the fluid is extracted from the matrix, and the corresponding advance of the peak production time.
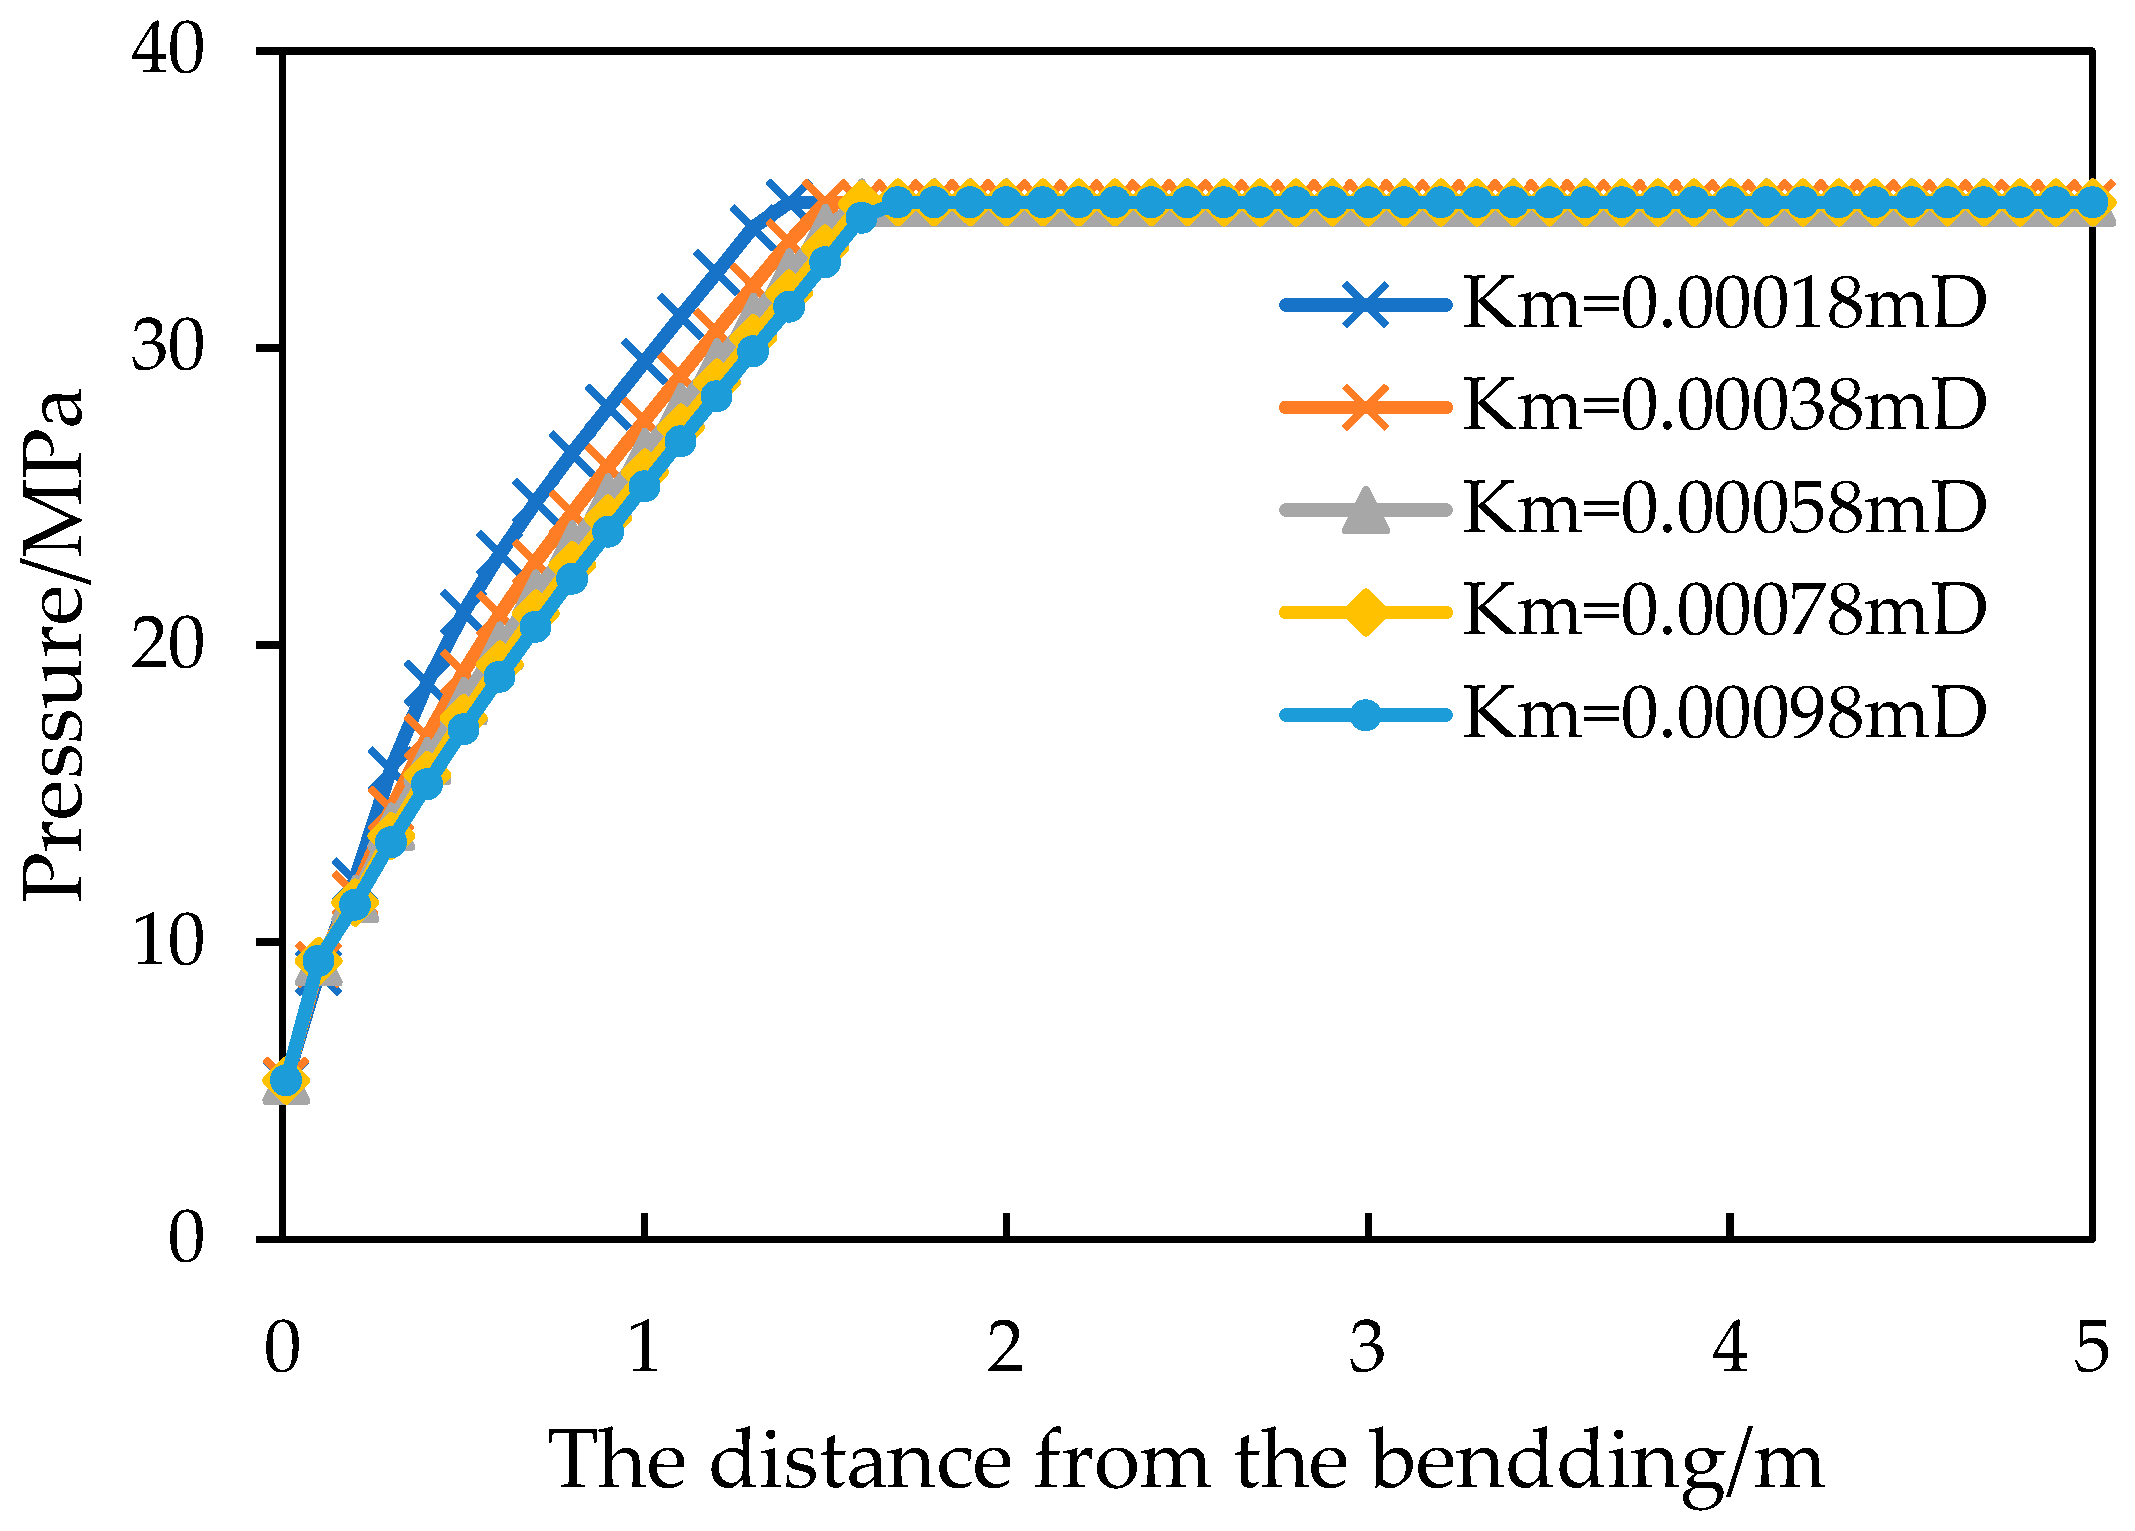
In the decline stage, when the matrix permeability is large, the pressure wave can be diffused to a longer range. This means that in the decline phase, the fluid is mainly supplied by the matrix that is farther away from the opened bedding. Due to the large permeability of the matrix, fluid flow in the matrix is relatively easy, so the production decline is slow. These changes indicate that matrix permeability has a significant impact on both the increase and decline stages of shale oil production. The increase of permeability will enhance the fluid flow capacity and increase the oil supply area, thus promoting the increase of production. At the same time, the increase of matrix permeability will slow down the production decline rate and increase the cumulative production.
Figure 17.
Formation pressure distribution on the 600th day at different matrix permeability (matrix permeability is respectively 1.8, 3.8, 5.8, 7.8, 9.8×10⁻⁴mD).
Figure 17.
Formation pressure distribution on the 600th day at different matrix permeability (matrix permeability is respectively 1.8, 3.8, 5.8, 7.8, 9.8×10⁻⁴mD).
5. Optimization of Flowback Modes
A reasonable flowback strategy is a crucial factor in the efficient production of shale oil. In the context of oilfield operations, the flowback strategies of shale oil wells are frequently modified through the replacement of different-sized chokes. The study of choke size on shale oil flowback performance is limited to the regulation of the shale oil rate. The varying pipe resistance under different choke sizes leads to different pressure fields, which in turn affects the shale oil rate. It is commonly accepted that casing pressure and flowing bottom hole pressure exert a significant influence on oil rate. The bottom hole flow pressure exerts a direct influence on the inflow performance relationship; however, it is typically not feasible to measure this parameter directly in the field. In this chapter, we establish the relationship between the choke size and the casing pressure and between the casing pressure and the bottom hole flow pressure (BHP). This allows us to indirectly obtain the link between the choke size and the BHP, which is necessary to achieve a thorough study of the shale oil flowback strategies.
5.1. Flowback Modes for Shale Oil Wells
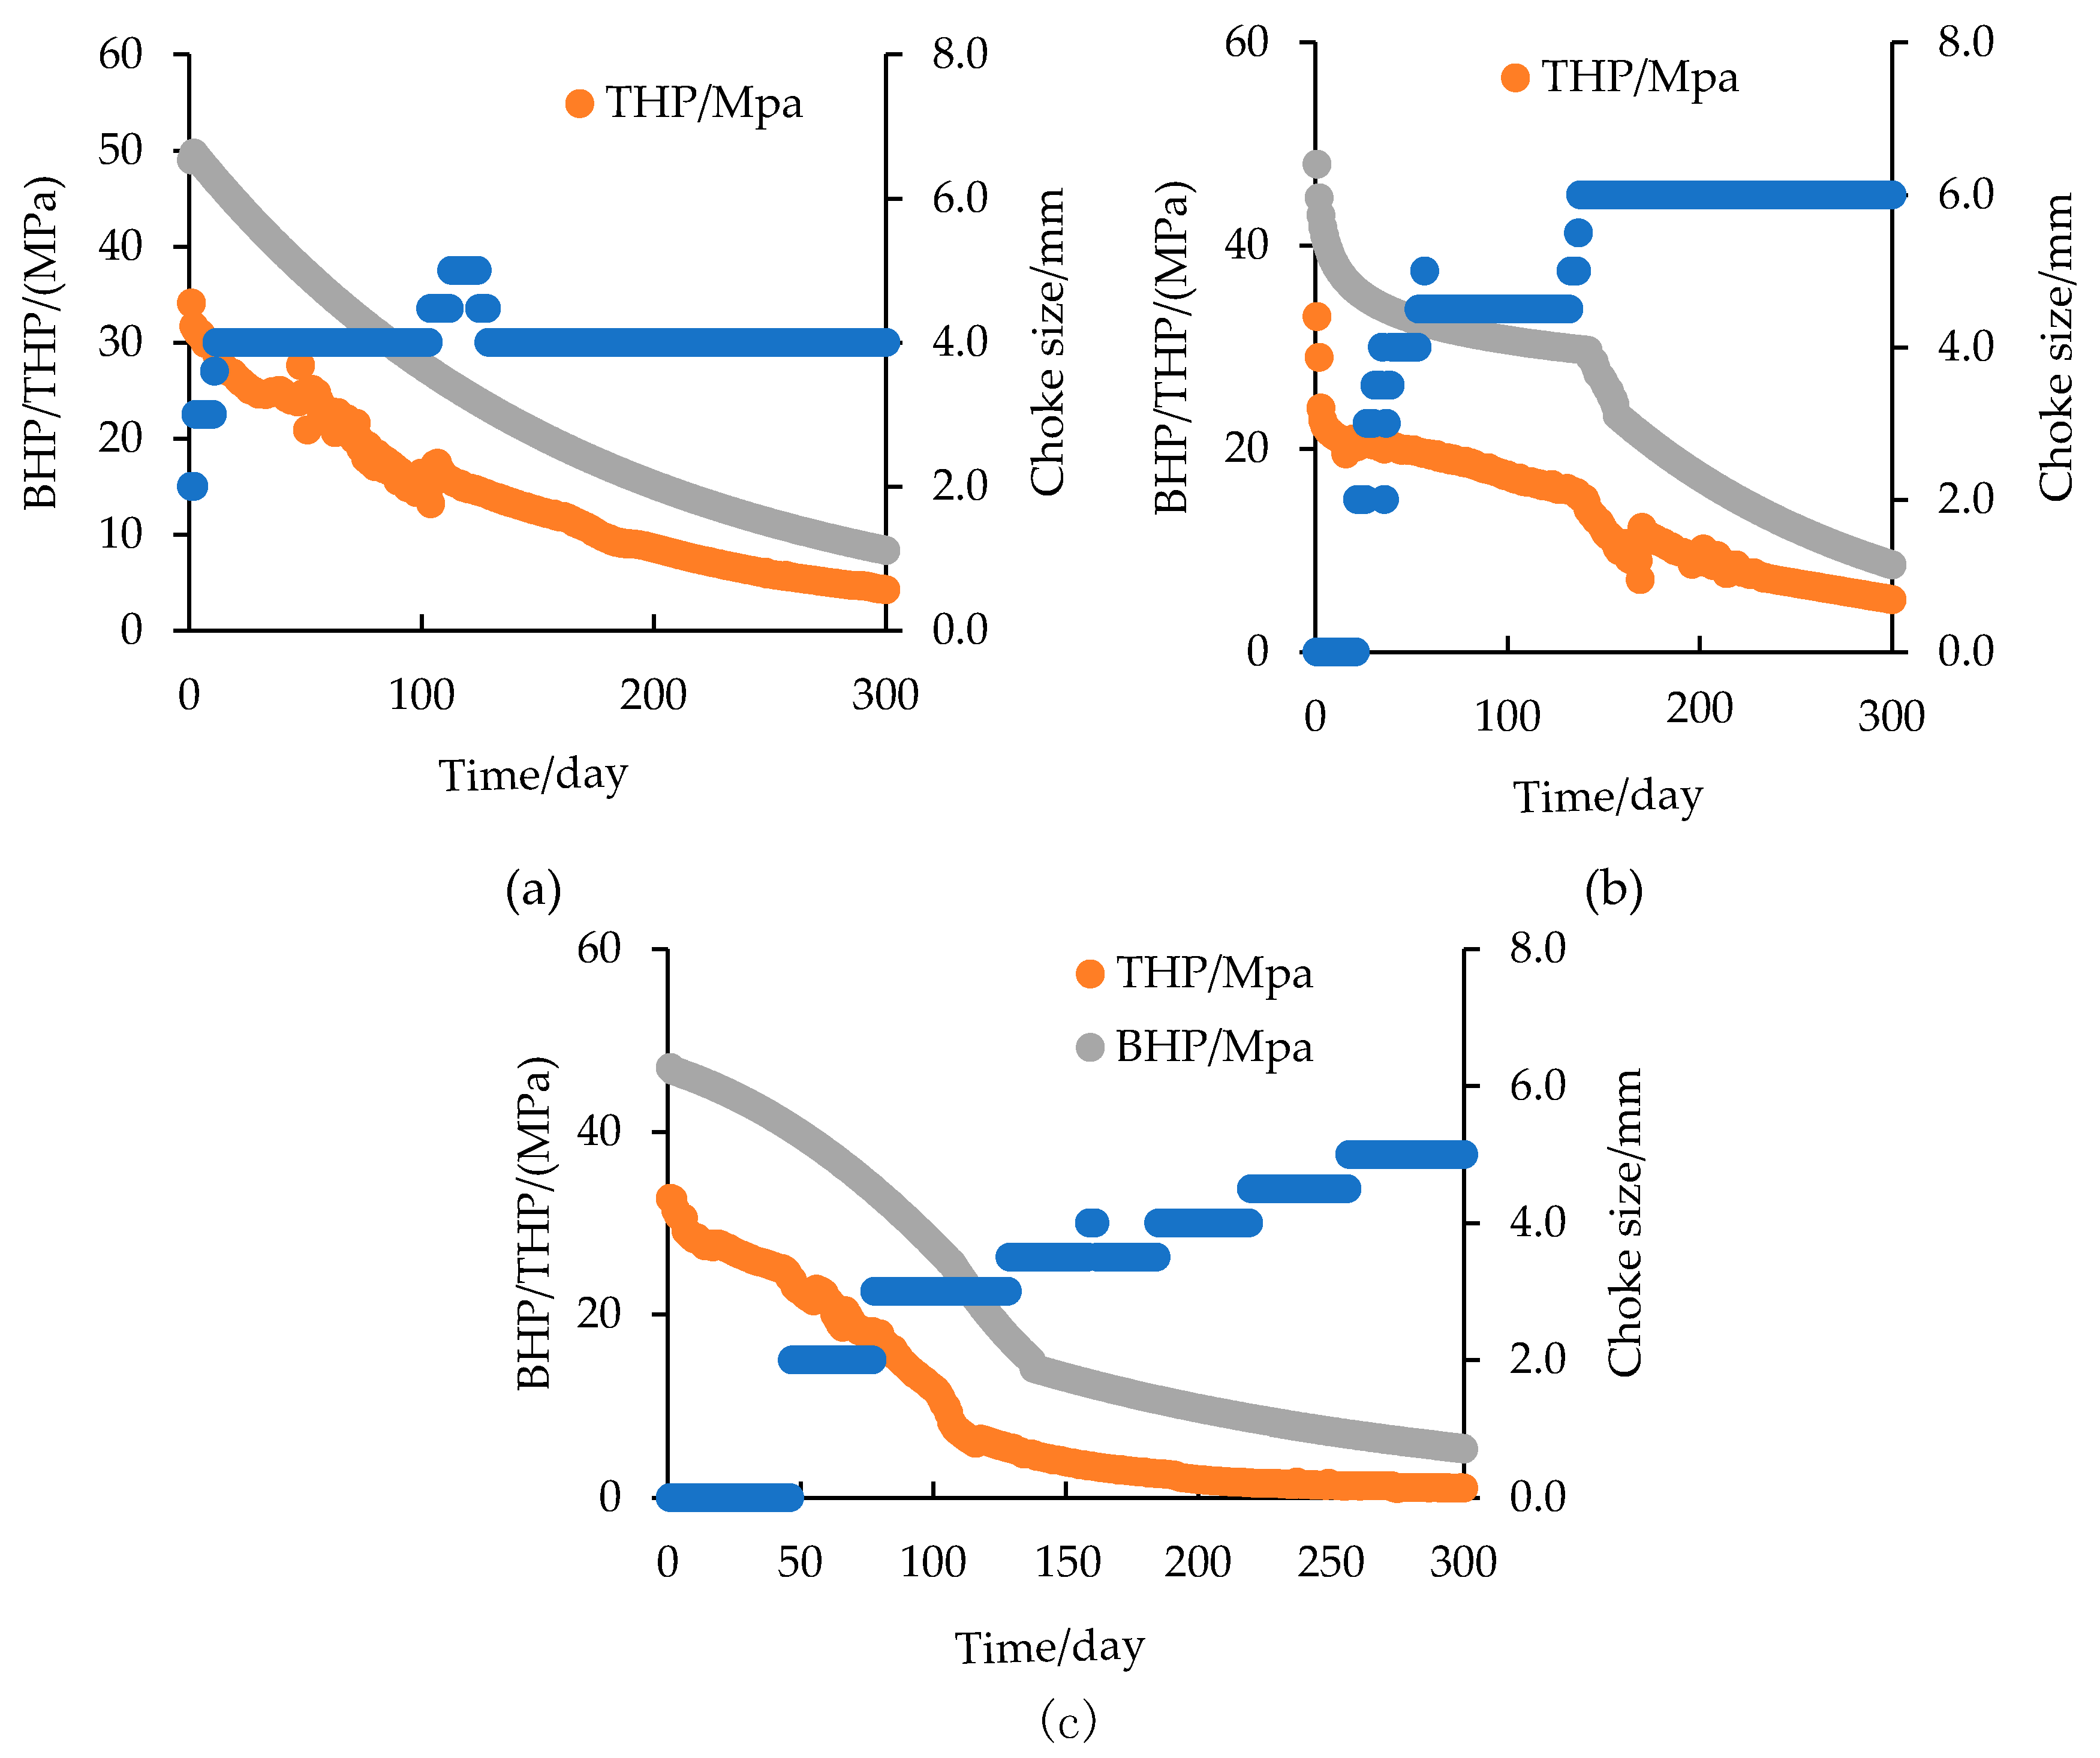
A selection of oil wells within the Gulong block were subjected to analysis. The study on the parameters of choke size, casing pressure, and BHP revealed that the decreasing rates of casing pressure and BHP vary with choke sizes. Consequently, three shale oil flowback modes are distinguished by the rate of decline in BHP [
21], as shown in
Figure 18.
As shown in
Figure 18a, the fast-slow mode is distinguished by a rapid increase in the choke size during the initial phase, which is then maintained at a constant level. The rate of decline in casing and bottom hole flow pressure is initially rapid, followed by a slower rate of decline. As shown in
Figure 18.b, the fast-slow-fast mode is defined by a rapid increase in choke size during the initial phase, followed by a medium choke size in the intermediate stage and a large choke size in the late stage. The rate of decrease in casing and bottom hole flow pressure is initially rapid, then gradual, and finally rapid again. As shown in
Figure 18.c, the slow-fast-slow mode is characterized by a gradual increase in the size of the choke throughout the stage. The rate of decline in casing pressure and BHP is initially slow, followed by a period of accelerated decline, and then a subsequent slowdown.
The BHP exerts a direct influence on the inflow performance relationship (IPR). If the BHP is excessive, the production pressure differential will be insufficient, resulting in a reduction in the oil rate. Conversely, if the BHP is insufficient, the production pressure differential will increase. Consequently, the oil rate will be larger, accompanied by a series of problems such as crude oil degassing and reservoir stress sensitivity [
31]. Consequently, the method of controlling BHP is employed to categorize the three flowback modes.
5.2. Optimization Method of Flowback Modes
In this paper, we employed a constructed numerical model to optimize three distinct flowback modes. Due to the inability to directly simulate the oil choke as a variable, we employed the BHP as a control variable and conducted simulations with variable BHP. This implies that control was achieved by modifying the lower limit of the BHP on a daily basis. During the simulation, the reservoir and fluid properties parameters were maintained at their original values, and a 1,000-day production simulation was conducted. The objective of this study was to evaluate the three different flowback modes based on the final oil production. By analyzing and comparing the simulation results, it is possible to determine the ultimate oil production and use this as a criterion for selecting the preferred flowback mode. The optimization process facilitates a more comprehensive understanding of the most suitable flowback strategy, which in turn leads to enhanced oil production and improved production efficiency.
5.3. The Impact of Different Flowback Modes
5.3.1. The Impact on Oil Break-through Time
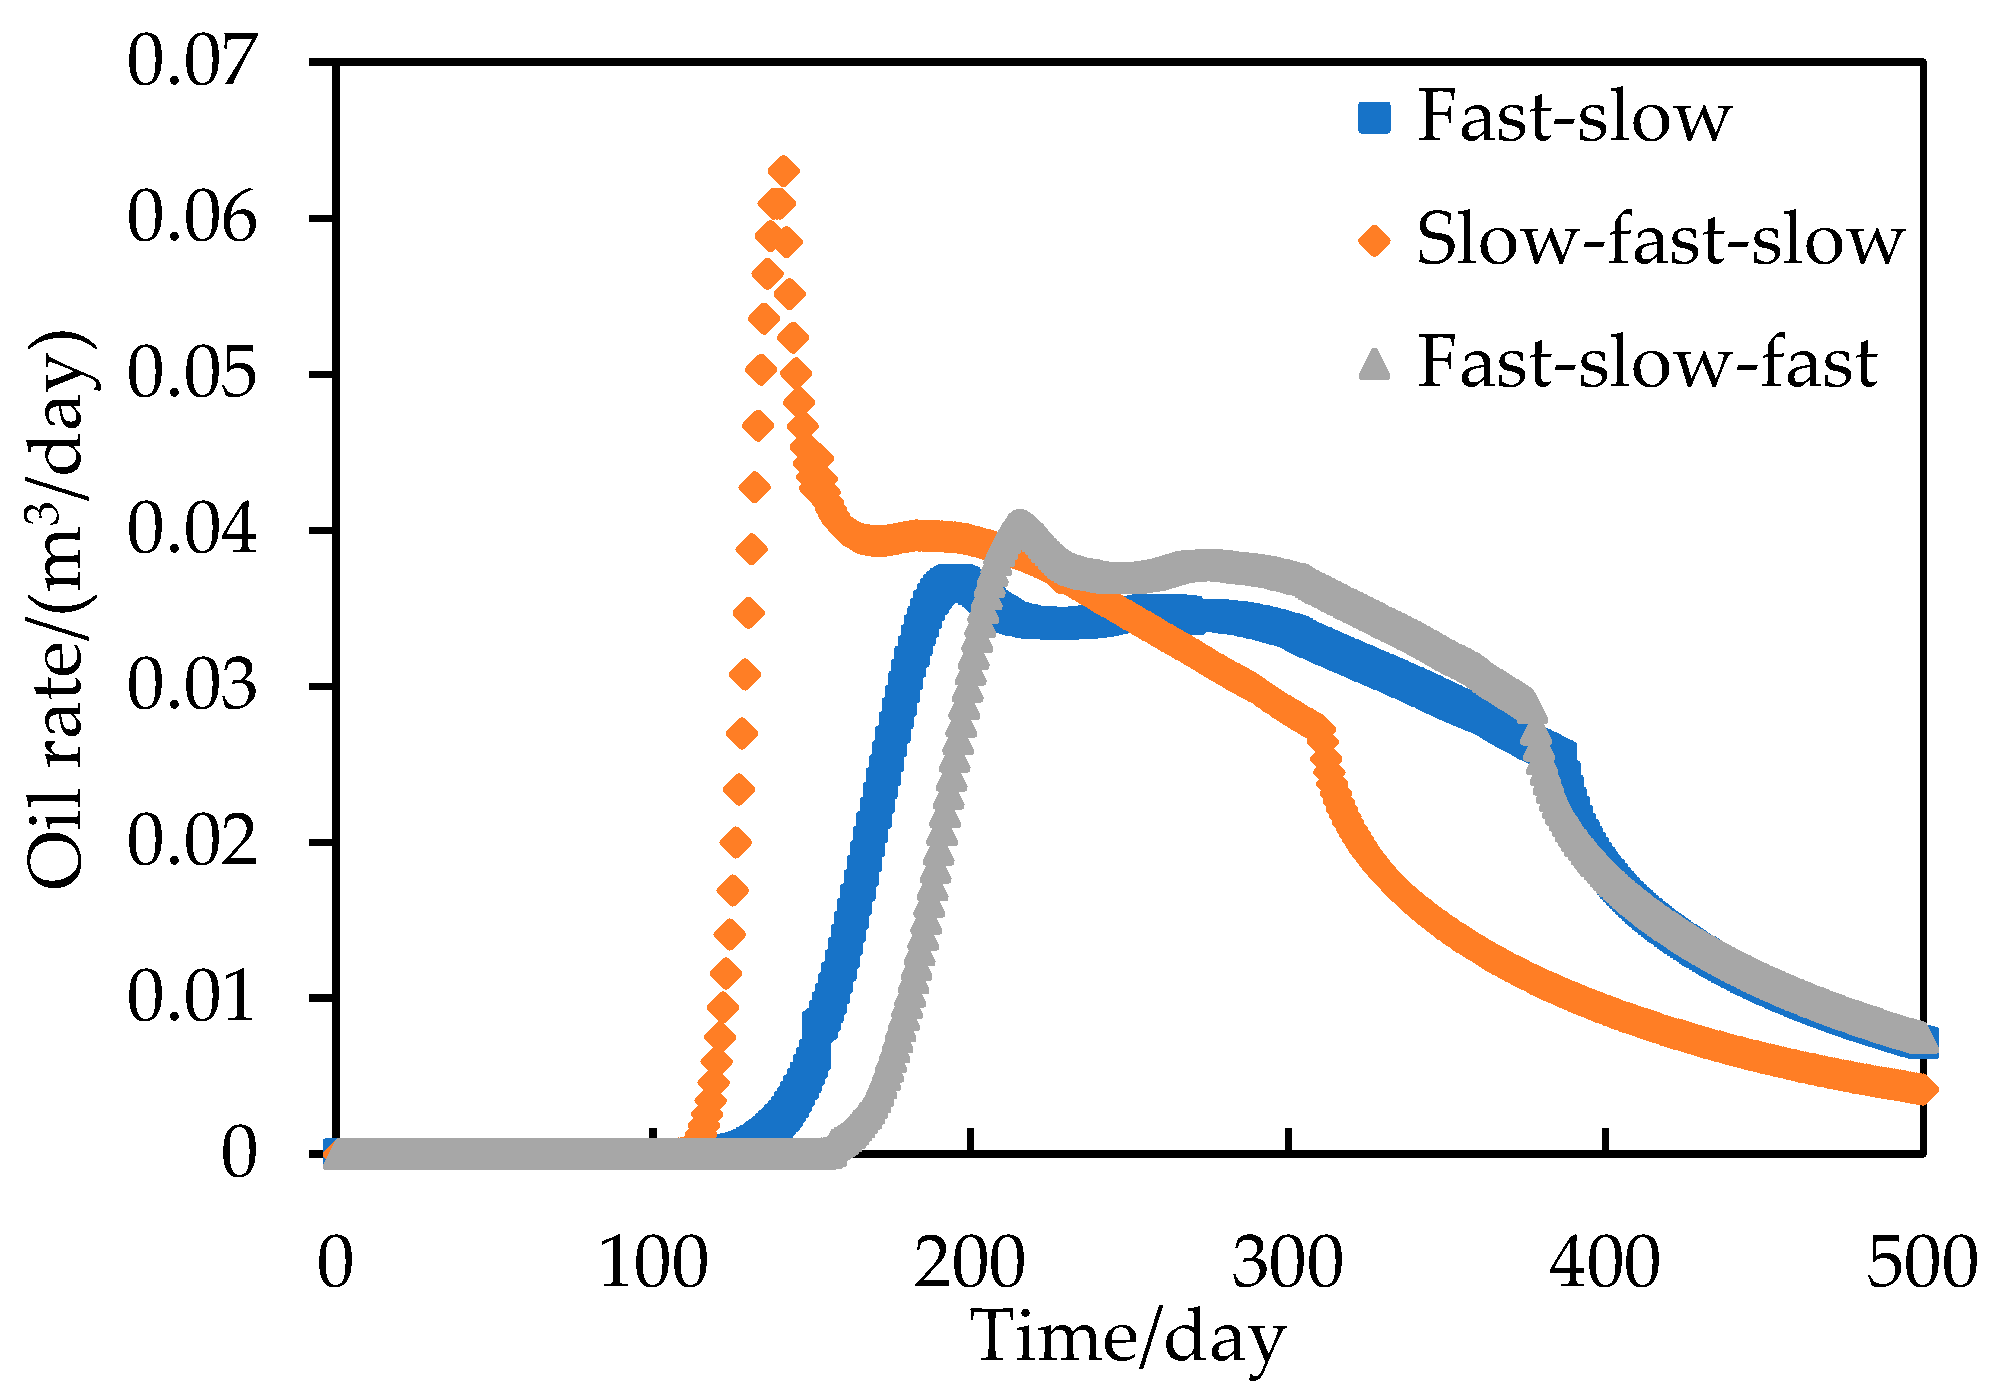
The oil rate curves of the three flowback modes exhibit distinct characteristics, with the primary difference being the oil breakthrough time. The order of oil breakthrough time from shortest to longest is as follows: fast-slow-fast mode, fast-slow mode, slow-fast-slow mode. The oil breakthrough times for the aforementioned flowback modes are 29, 63, and 75 days, respectively. The analysis indicates that the oil breakthrough time is primarily influenced by the BHP at the outset of the flowback period. The presence of a PTPG within the shale matrix results in a differential pressure drop rate for the BHP during the early stages of flowback, contingent upon the specific flowback mode. A more rapid decline in pressure during the initial stages of the flowback period results in a greater pressure gradient within the matrix, which in turn leads to a shorter oil breakthrough time.
5.3.2. The Impact on Flowback Performance
The decline rate of bottom hole pressure (BHP) during the initial stages of production directly affects the rate of oil increase during that period. Consequently, the decline rate of BHP in the late stage determines the rate of oil decrease during that phase.
In the slow-fast-slow mode, the decline rate of BHP is relatively modest during the initial stages. Furthermore, there is a prolonged period of time during which no oil is produced. Upon transitioning to the fast stage, the BHP undergoes a pronounced increase. Consequently, the rate of oil increase is rapid. The time required to reach the production peak is the shortest, and the oil rate peak is the largest. The period of stabilized production is shorter, and the decrease in oil rate is faster after the period of stabilized production.
In the fast-slow mode, the rate of decrease in the bottom hole flow pressure is considerable during the initial stages. Concomitantly, the oil rate increases at a rapid pace. Subsequently, as the process enters the slow stage, the oil rate increases at a gradual pace, eventually reaching a point of decline. The slower rate of oil decrease is primarily attributable to the elevated BHP at the onset of the slow stage. Furthermore, the bottom hole flow pressure can continue to decrease in the subsequent slow stage, and the oil supply area can be further expanded. The period of stabilized production is lengthy, yet the stable oil rate is the lowest.
The fast-slow-fast mode is characterized by a significant decrease in BHP in the early stages, which facilitates the breakthrough of oil. Subsequently, the oil rate increases at a gradual pace as the well transitions into the slow stage. Upon re-entry into the fast stage, a notable increase in oil rate is observed. The period of stabilized production is relatively brief, yet the stabilized oil rate is high.
Figure 19.
Oil rate curves of three flowback modes.
Figure 19.
Oil rate curves of three flowback modes.
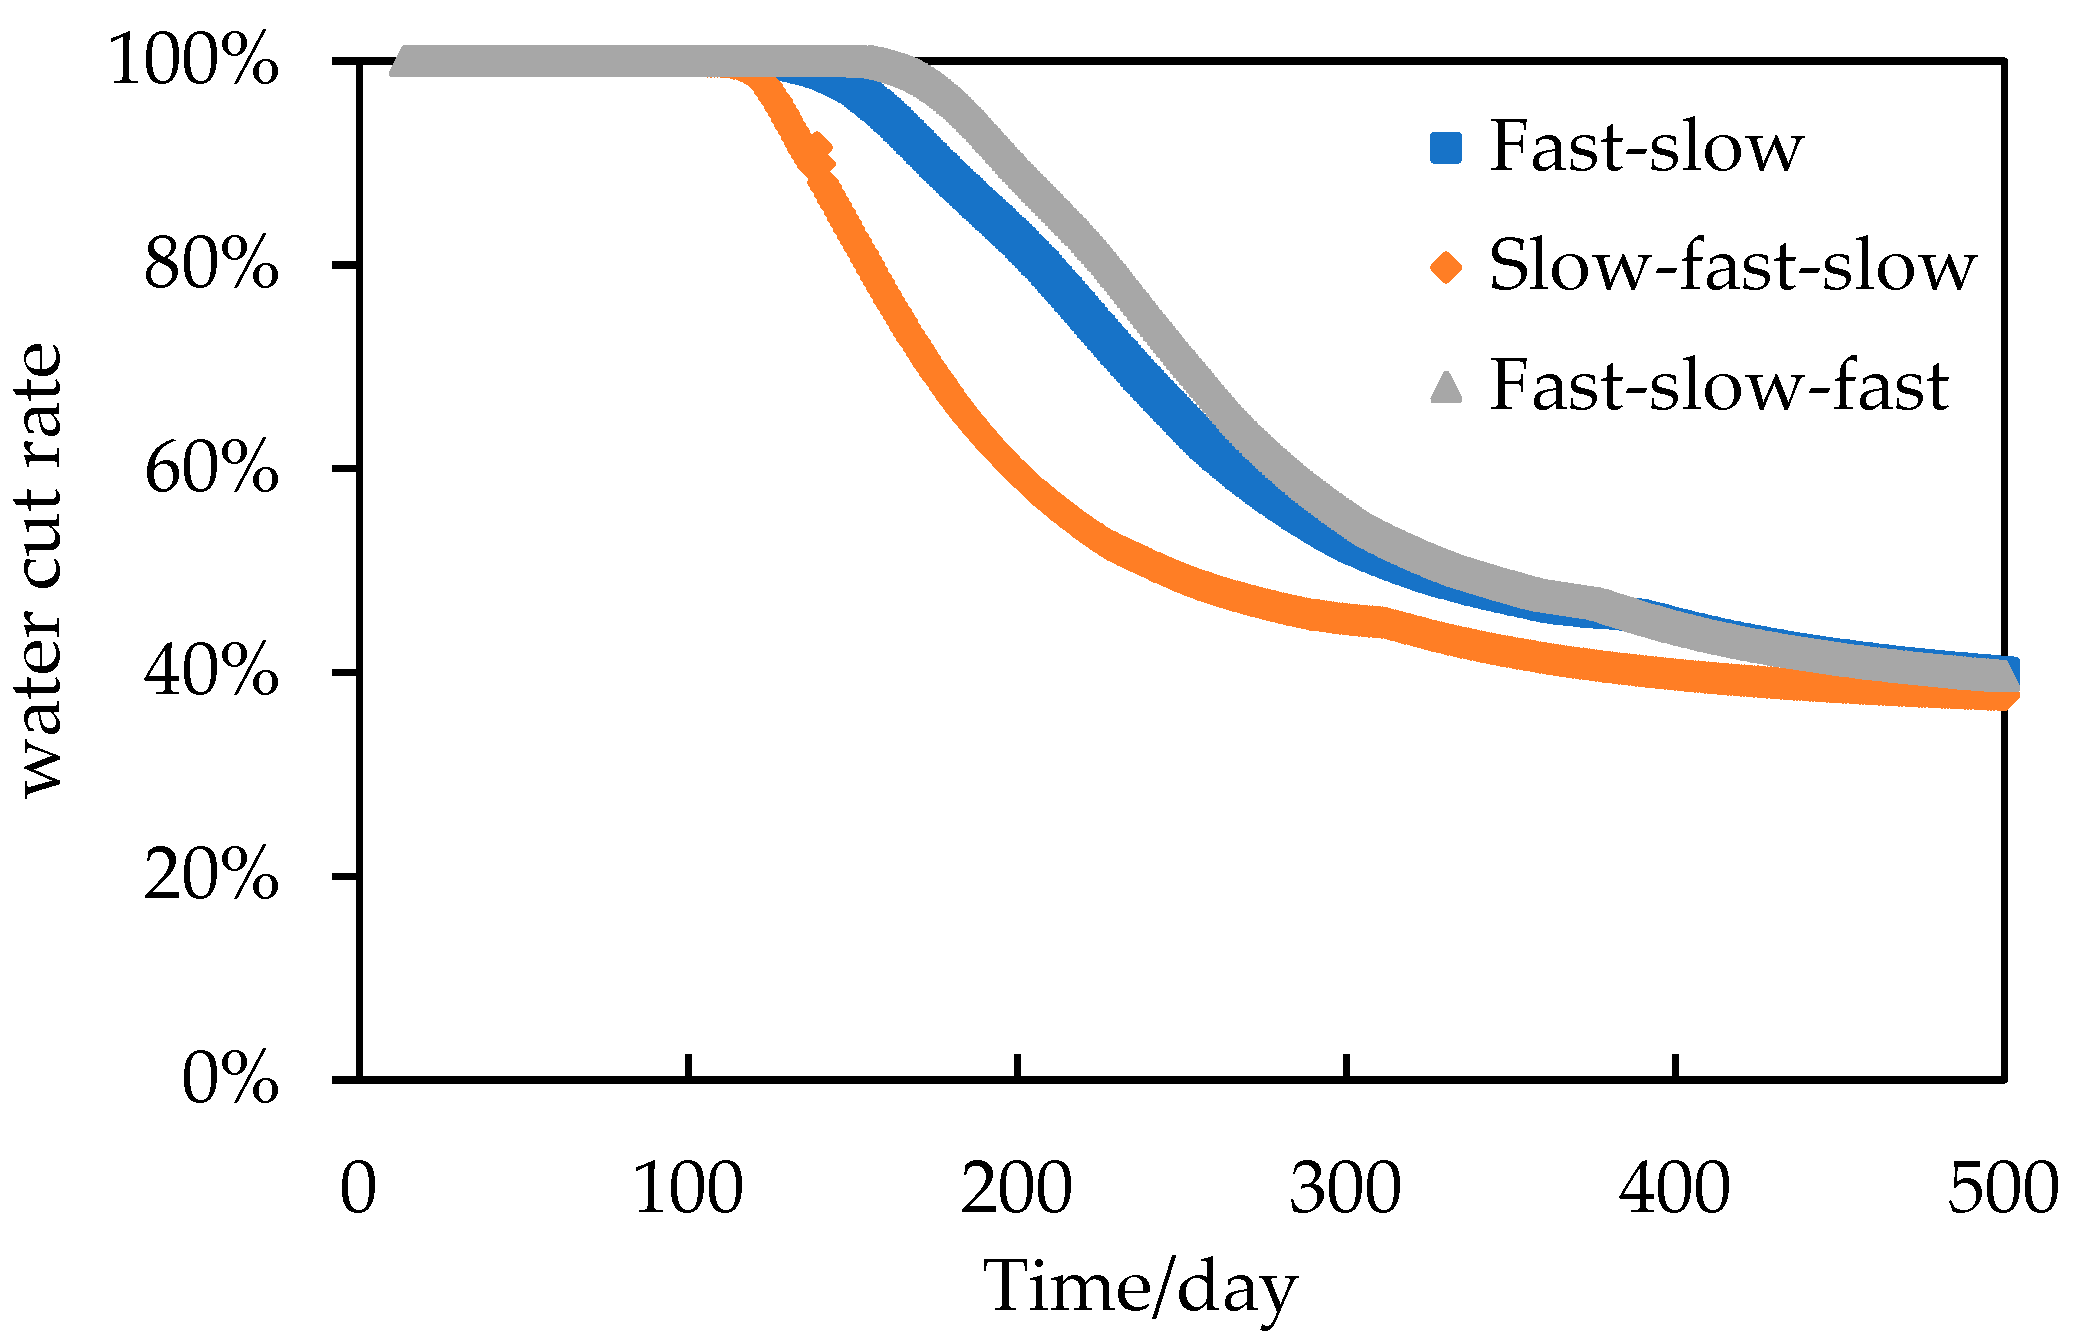
A comparison of the water-cut rate curves presented in
Figure 20 reveals notable discrepancies in the water-cut rate during the medium stage. At the outset of the flowback process, the water-cut rate of the slow-fast-slow mode exhibited the most rapid decline, while the water-cut rate of the fast-slow-fast mode exhibited the slowest decline. As the development time progresses, the disparity in water-cut rate between the three modes gradually diminishes. As production progresses, the water-cut rate of the fast-slow mode gradually becomes the largest, although the difference between the rates remains minimal.
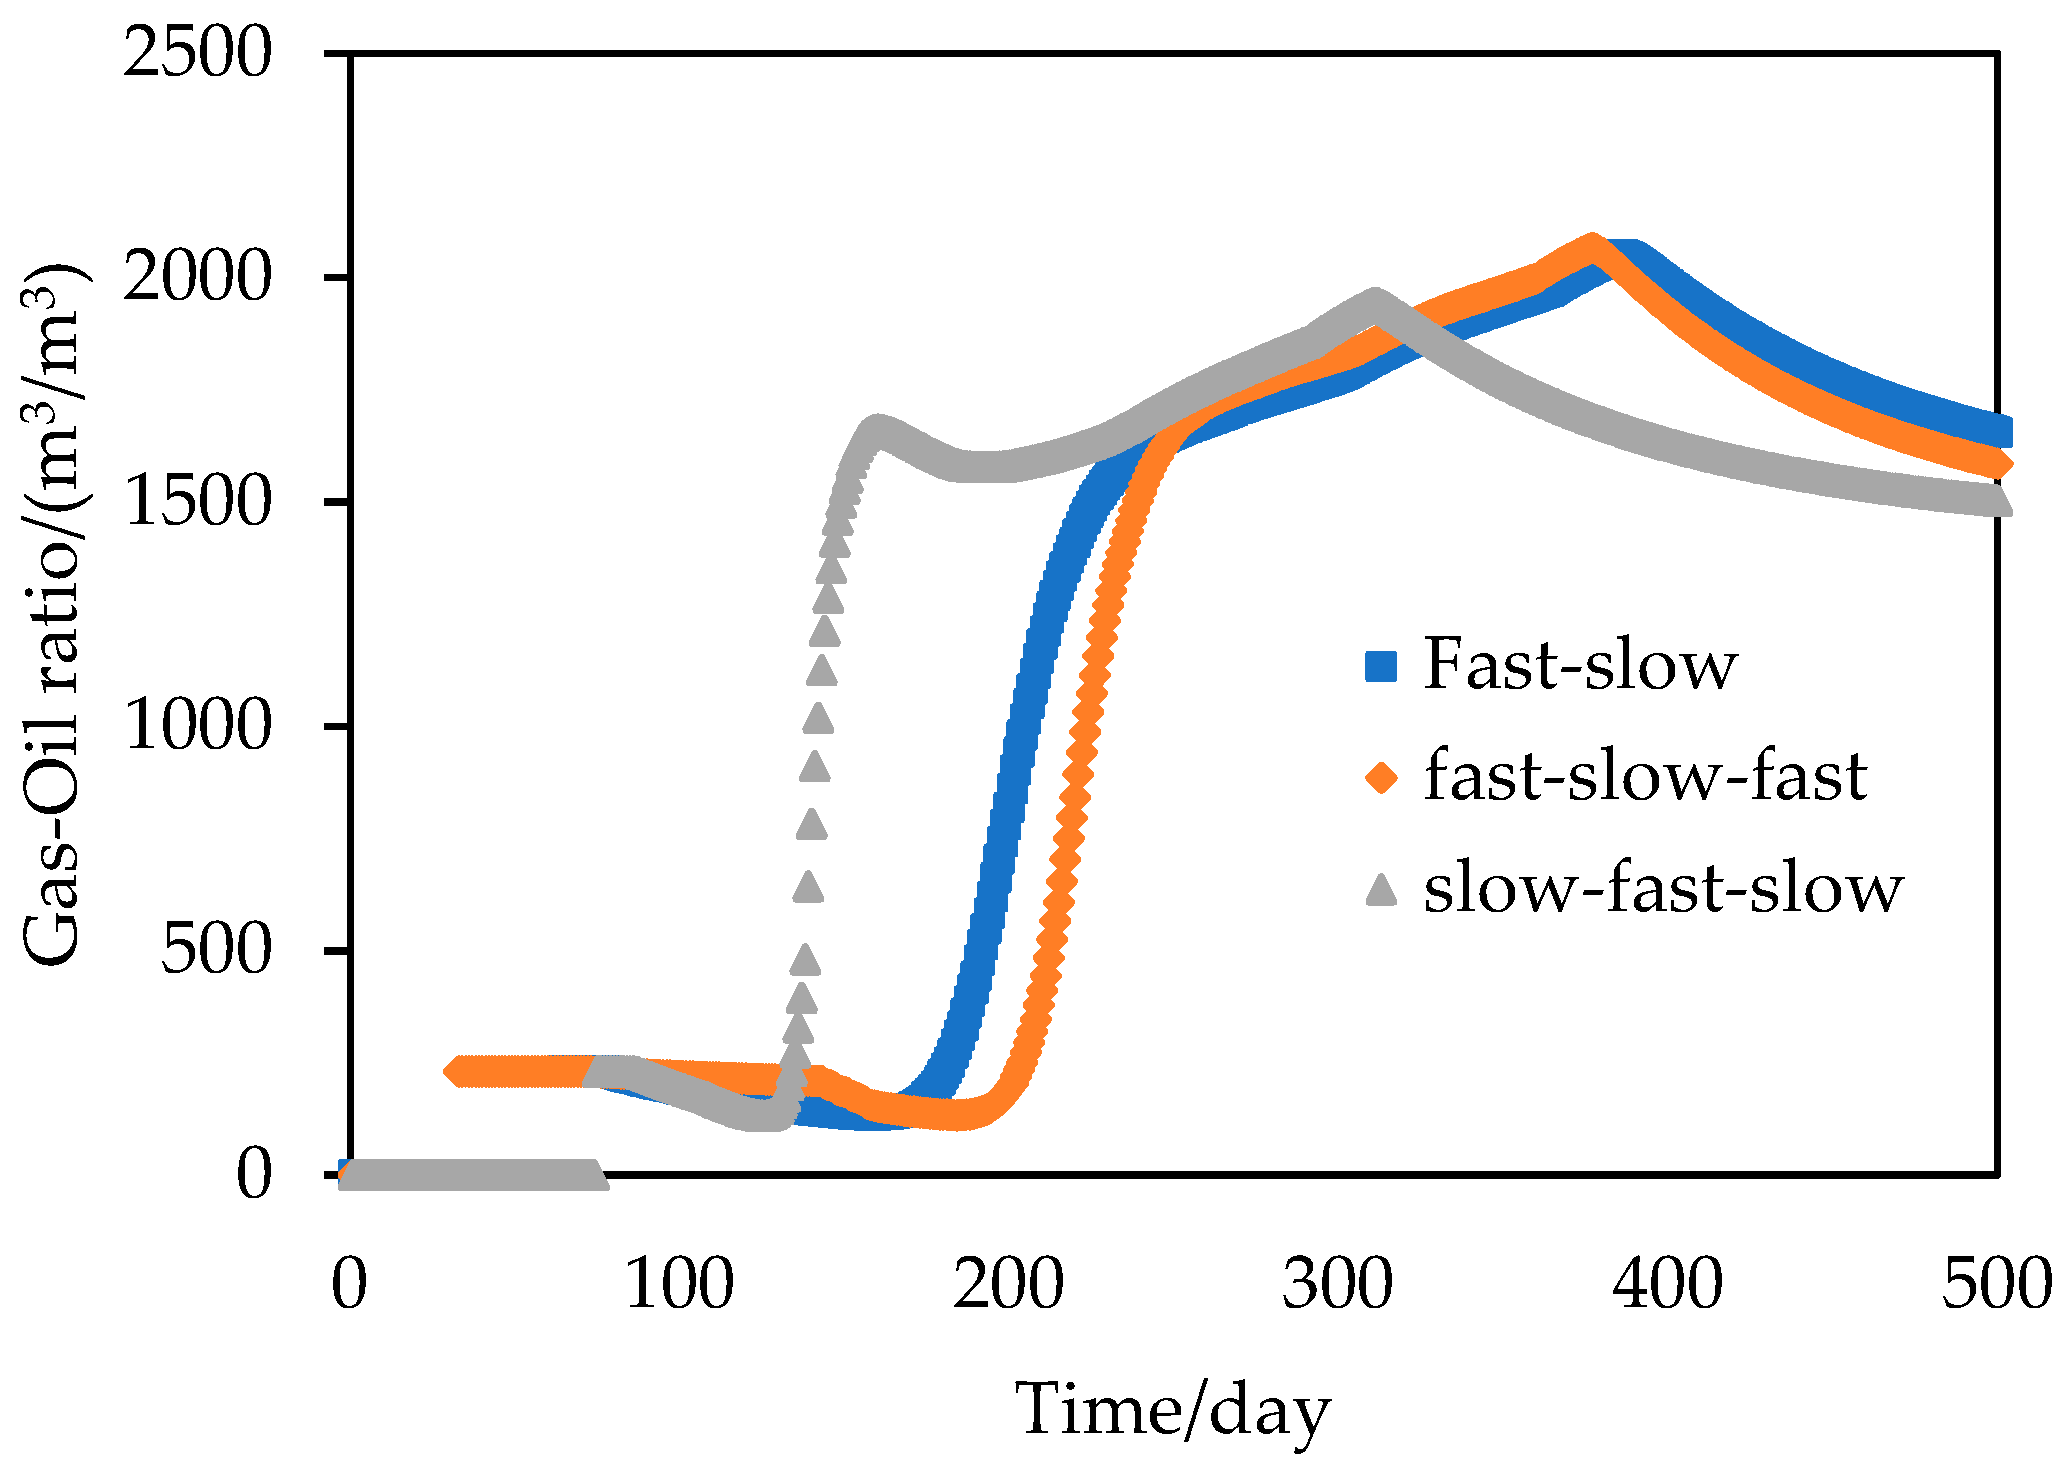
The data presented in
Figure 21 indicates that various flowback modes exert a considerable influence on the gas-oil ratio. Given the sensitivity of the dissolved gas-oil ratio to pressure changes, particularly below the bubble point pressure, fluctuations in bottom-hole flow pressure have a notable impact on the gas-oil ratio. During the initial production phase, the gas-oil ratio of the fast-slow mode exhibits an initial increase, and the time required to maintain a low gas-oil ratio is longer. In the slow phase (200th day), the gas-oil ratio exhibits a rapid increase to a higher level. In the fast-slow-fast mode, the production process commences with a low gas-oil ratio until the fast phase (200th day), at which point the gas-oil ratio rises rapidly to a higher level. In the slow-fast-slow mode, the gas-oil ratio rises rapidly in the fast phase (150th day) and remains at a high level. However, after the 300th day, the gas-oil ratio decreases at a faster rate than in the other two modes. In conclusion, the choice of production system model will have a significant impact on the gas-oil ratio. According to the characteristics of these models, a suitable system model can be selected to control the gas-oil ratio in order to achieve more efficient production.
5.4. Optimization Results and Discussion
As shown in
Figure 19, the initial production discrepancy between the three flowback modes is considerable. As shown in
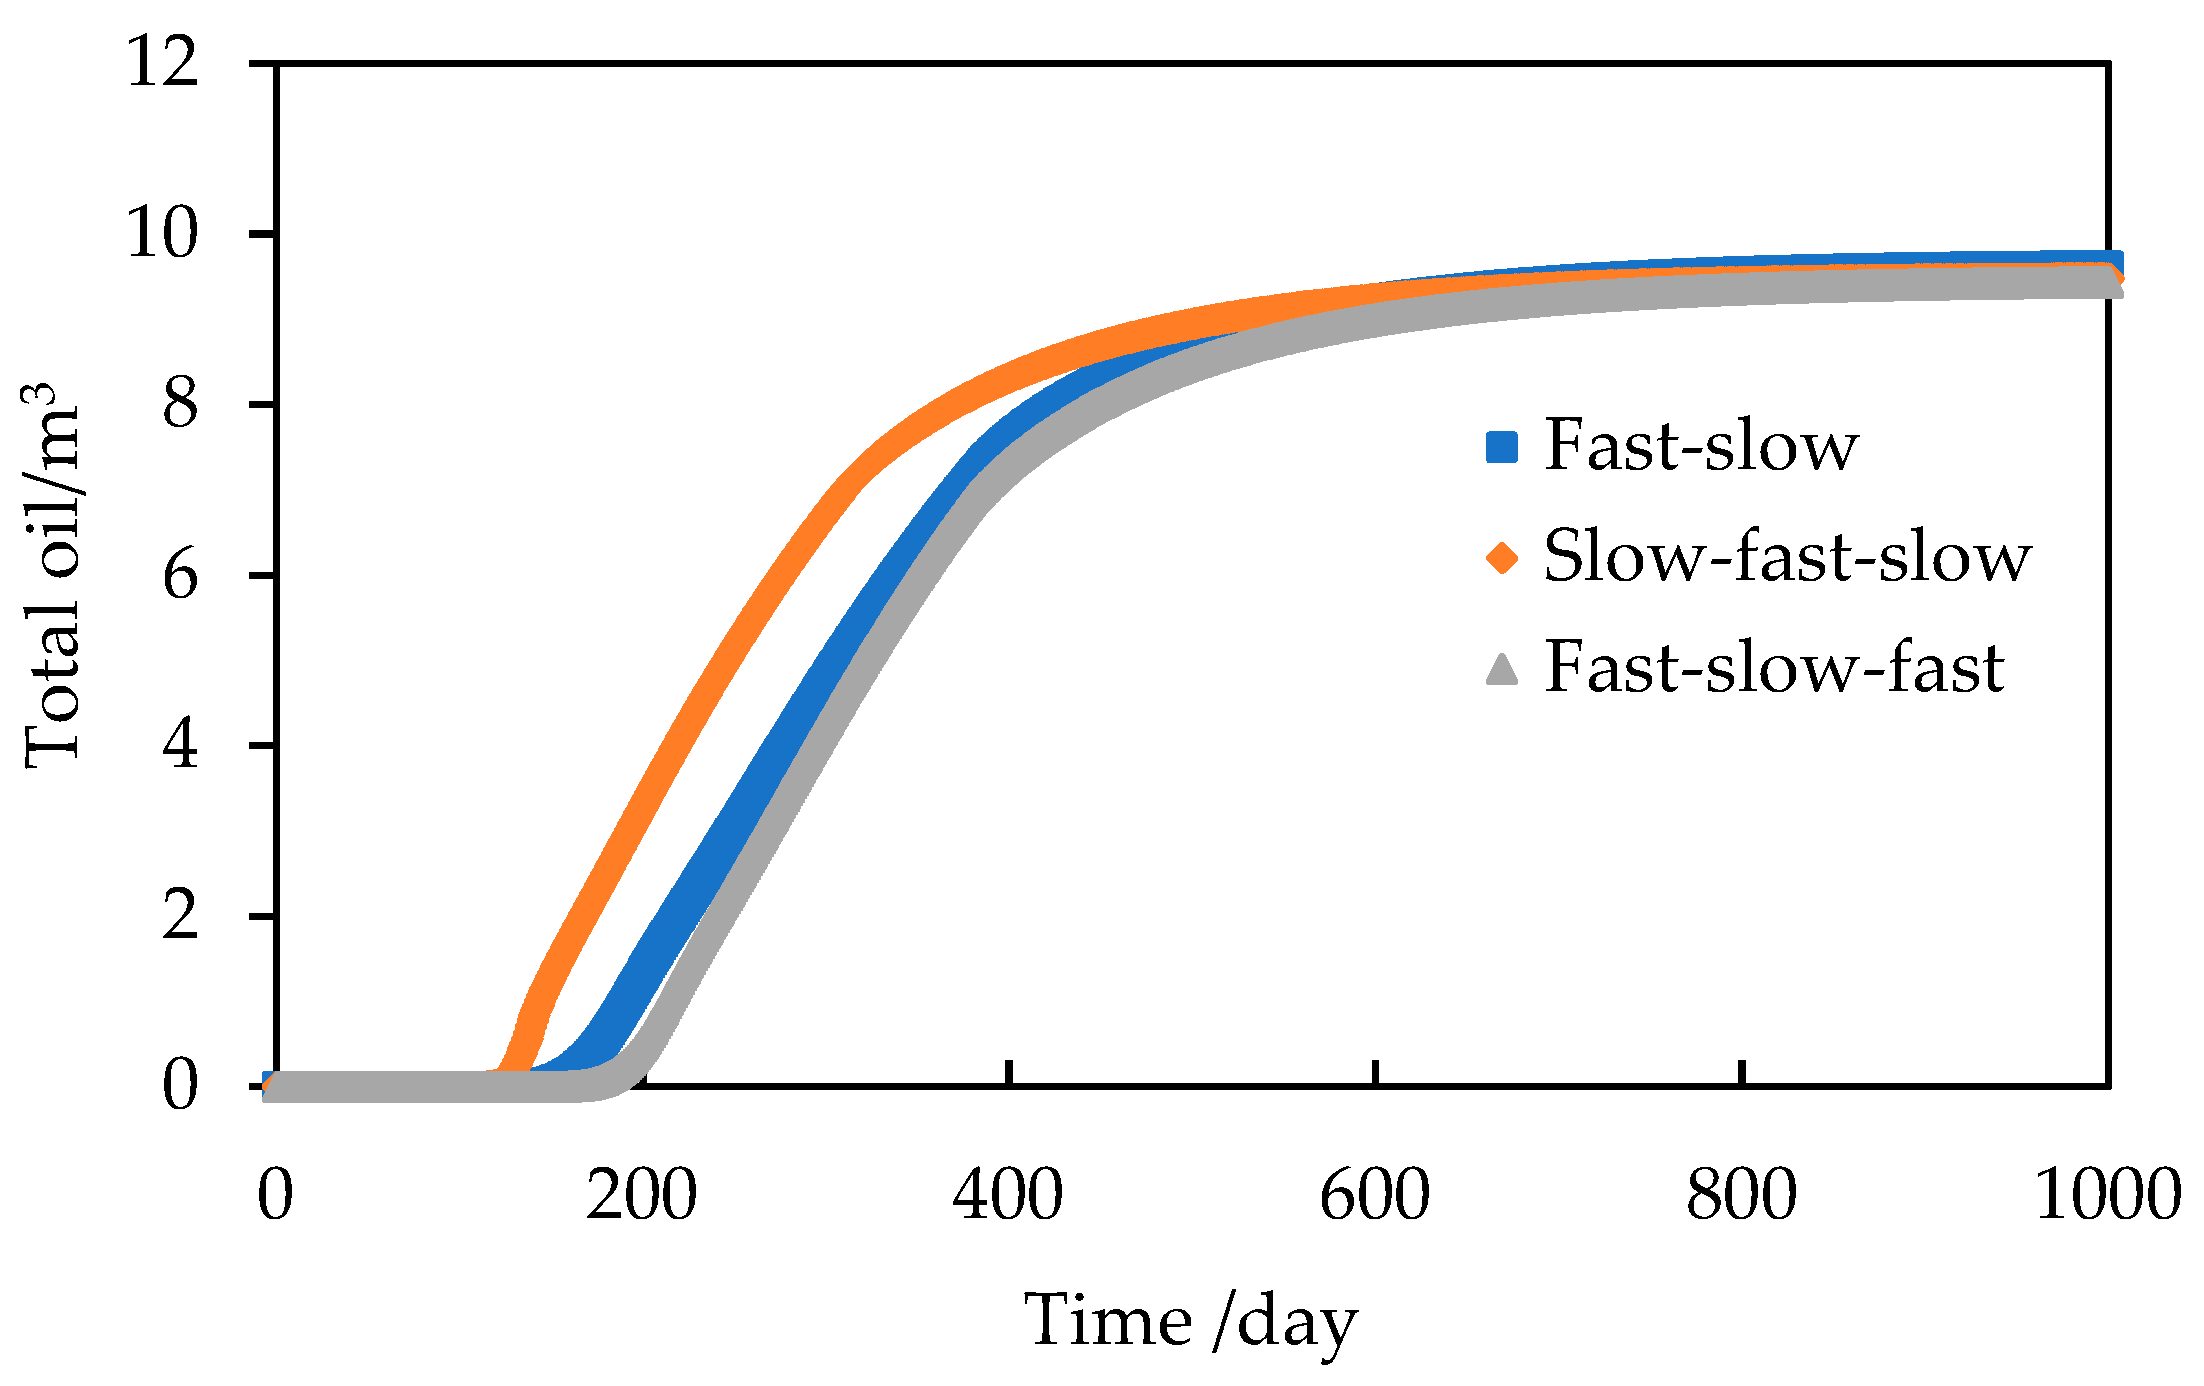
Figure 22, the total oil differences between the three flowback modes are the greatest in the initial stages. Over time, the discrepancy in total oil between the three modes diminishes gradually. The fast-slow mode exhibited the greatest total oil on the 1000th day.
As shown in
Figure 23, the three flowback modes were optimized using the total oil and recovery ratio on the 1000th day. The total oil produced by the three flowback modes, namely fast-slow, slow-fast-slow, and fast-slow-fast, was 9.6211 m³, 9.4783 m³, and 9.4331 m³, respectively. The corresponding recovery ratio of oil was 1.2231%, 1.2050%, and 1.1992%, respectively. From the perspective of the most significant total oil production and a highest recovery ratio, the results of the three flowback modes are as follows: the fast-slow mode is the most optimal, the slow-fast-slow mode is the second most optimal, and the fast-slow-fast mode is the least optimal.
A correlation has been identified between choke size, casing pressure, and BHP, which allows for the derivation of the optimal choke mode among the three modes. The most optimal choke mode is characterised by a rapid increase in choke size in the initial stage, followed by a maintenance of a medium choke size.
In the case of shale, due to its extremely low permeability and significant PTPG in the matrix, the movable oil in shale reservoirs is primarily distributed within the volume containing fractures. Furthermore, within the volume containing fractures, only the oil in close proximity to the fractures exhibits a superior mobility effect. As oil is recovered near the fractures, the rate of shale oil production begins to decline. The primary focus of production is on the expansion of the oil supply area and the further recovery of crude oil in the vicinity of the fractures, which are in a decline phase.
There is a relationship between oil rate and pressure spread range, the larger the pressure spread range, the higher the oil production. As shown in
Figure 24,
Figure 25 and
Figure 26, the production performance of the three models was evaluated based on the 300th day and 1000th day pressure distribution maps. Upon analysis of the pressure distribution maps at the 300th and 1000th days, it was observed that the pressure spread range exhibited considerable variation across the three production modes, ranging from large to small in the following order: slow-fast-slow, fast-slow, fast-slow-fast. Conversely, at the 1000th day, the pressure spread range exhibited minimal variation, with the three modes displaying a similar pattern of large to small in the following order: fast-slow, slow-fast-slow, fast-slow-fast. The outcomes of the pressure spread range are in accordance with those of the oil rate.
In slow-fast-slow mode, the initial pressure spread range is the largest, the crude oil production range is the largest, and the initial daily oil rate and total oil are the largest. However, the rapid reduction of bottom hole pressure leads to the rapid closure of the opened beddings, which in turn increases the flow resistance of the opened bedding. A large amount of crude oil degasses, and the oil rate fluctuation is large, which is not conducive to the later crude oil recovery. In the latter stages of production, the pressure spread is to some extent affected. The late pressure spread range is relatively narrow, the oil supply range is similarly limited, and the oil rate is similarly low.
In fast-slow-fast mode, the initial pressure spread range is the smallest, the crude oil supply range is similarly limited, and the oil rate and total oil are similarly low in the early stages. The initial production is similarly low, which makes the oil rate more stable. In the latter stages of production, a precipitous decline in bottomhole pressure results in the abrupt closure of previously opened beddings. The pressure spread range is narrow, the oil production range is limited, and the oil rate in the latter stages is minimal.
In the fast-slow mode, the initial pressure spread range is situated between the fast-slow mode and the slow-fast-slow mode. The initial oil rate is lower than that observed in the slow-fast mode, and the degasser phenomenon is less pronounced in the reservoir. The period of stable oil rate is the longest. In the subsequent production phase, the pressure drop spread range is the greatest, during which the oil supply area within the matrix expands effectively and the oil recovery area is also high. In the fast-slow mode, the BHP drops more rapidly in the initial stages. Furthermore, the fracturing fluid can be recovered with minimal delay following the fracturing process. The well proceeded rapidly to the production stage. The oil recovery ratio of the matrix in the vicinity of the fracture is high, and the oil recovery period is prolonged. The stable choke size is conducive to stable oil rate and the longest stable oil rate period. Consequently, the fast-slow mode yields the highest total oil yield.
Figure 1.
Image of the post-fractured fractures network in the Gulong Shale.
Figure 1.
Image of the post-fractured fractures network in the Gulong Shale.
Figure 2.
A schematic diagram of the physical model of matrix-opened beddings-hydraulic fractures.
Figure 2.
A schematic diagram of the physical model of matrix-opened beddings-hydraulic fractures.
Figure 3.
Schematics illustrating the model for numerical simulation.
Figure 3.
Schematics illustrating the model for numerical simulation.
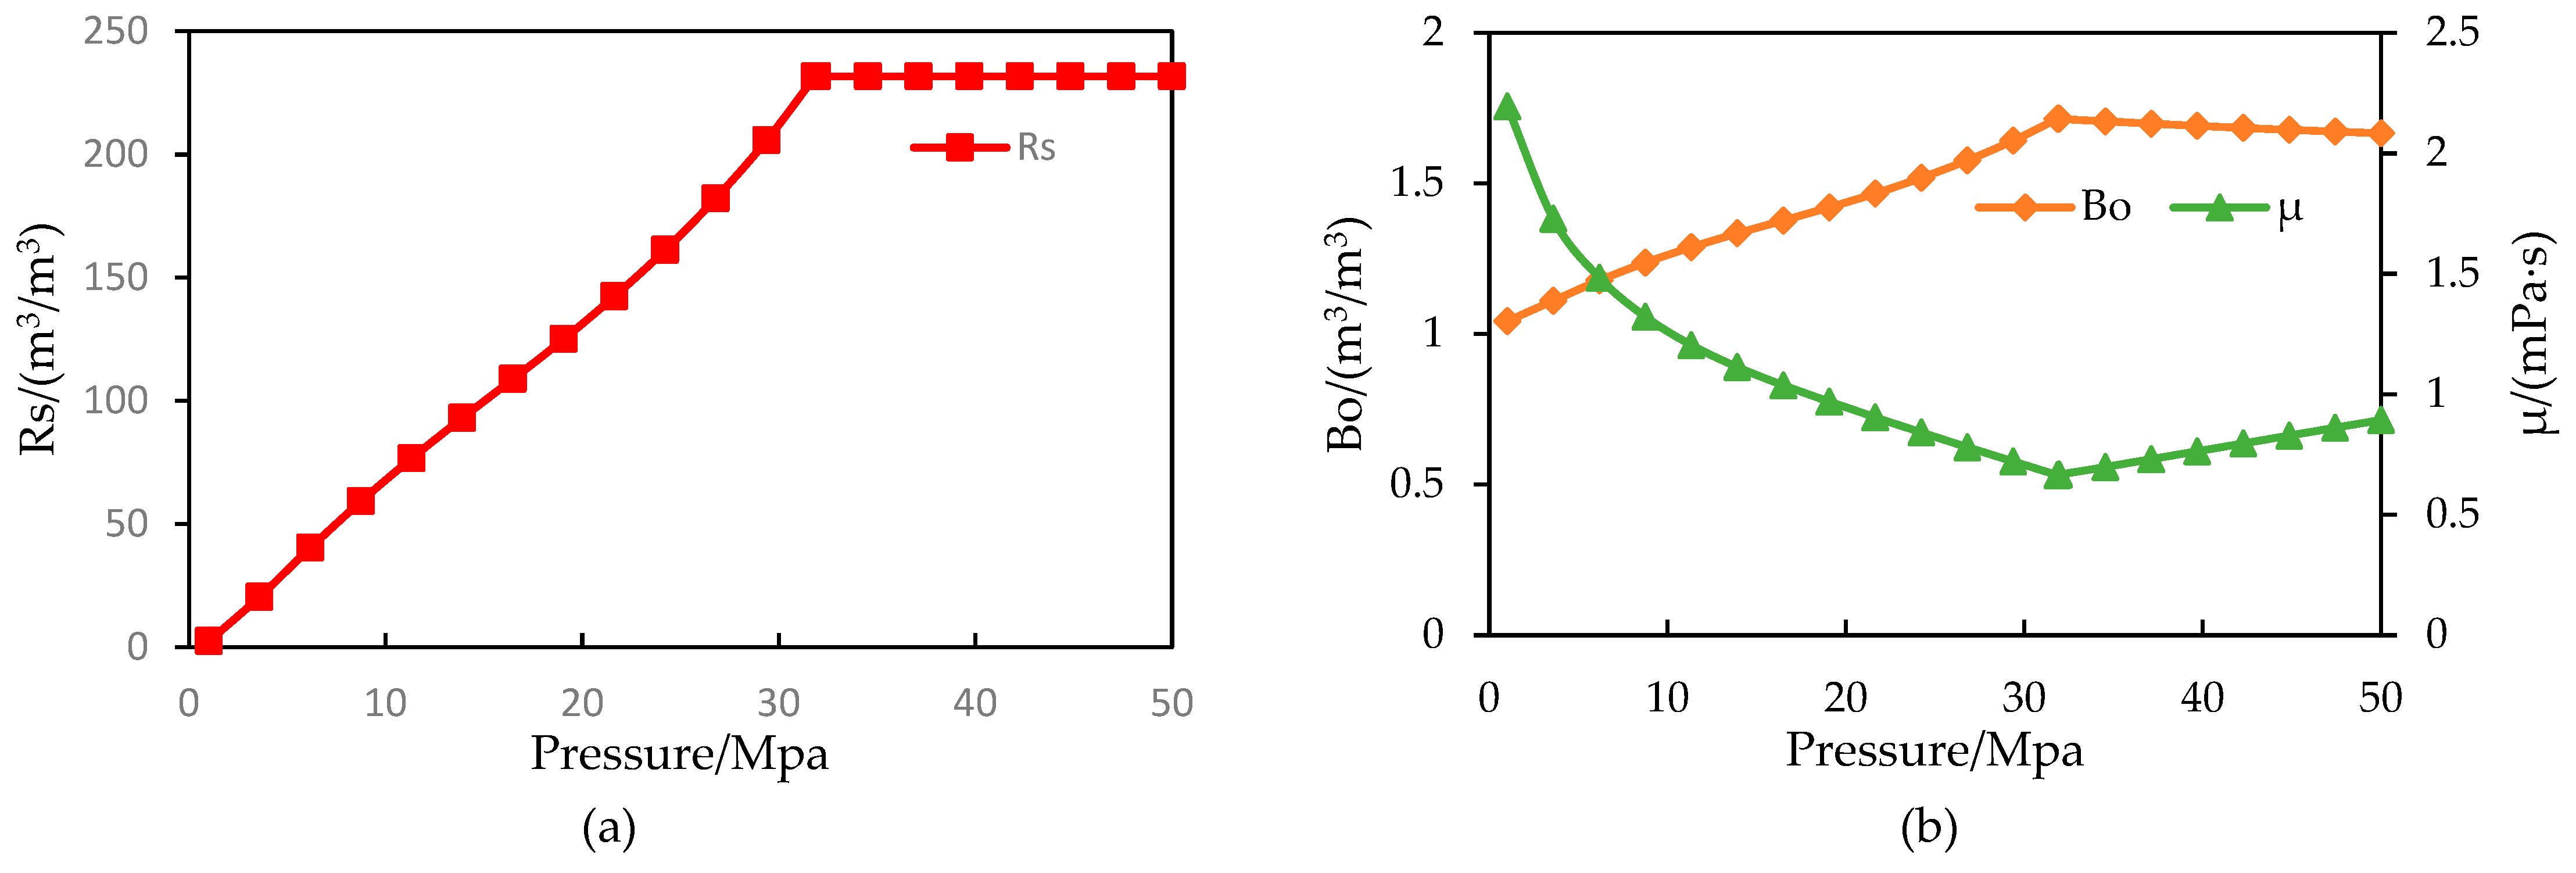
Figure 4.
Parameter curves of the physical properties of crude oil: (a) Variation curve of dissolved gas-oil ratio of crude oil; (b)Volume coefficient and viscosity curve of crude oil.
Figure 4.
Parameter curves of the physical properties of crude oil: (a) Variation curve of dissolved gas-oil ratio of crude oil; (b)Volume coefficient and viscosity curve of crude oil.
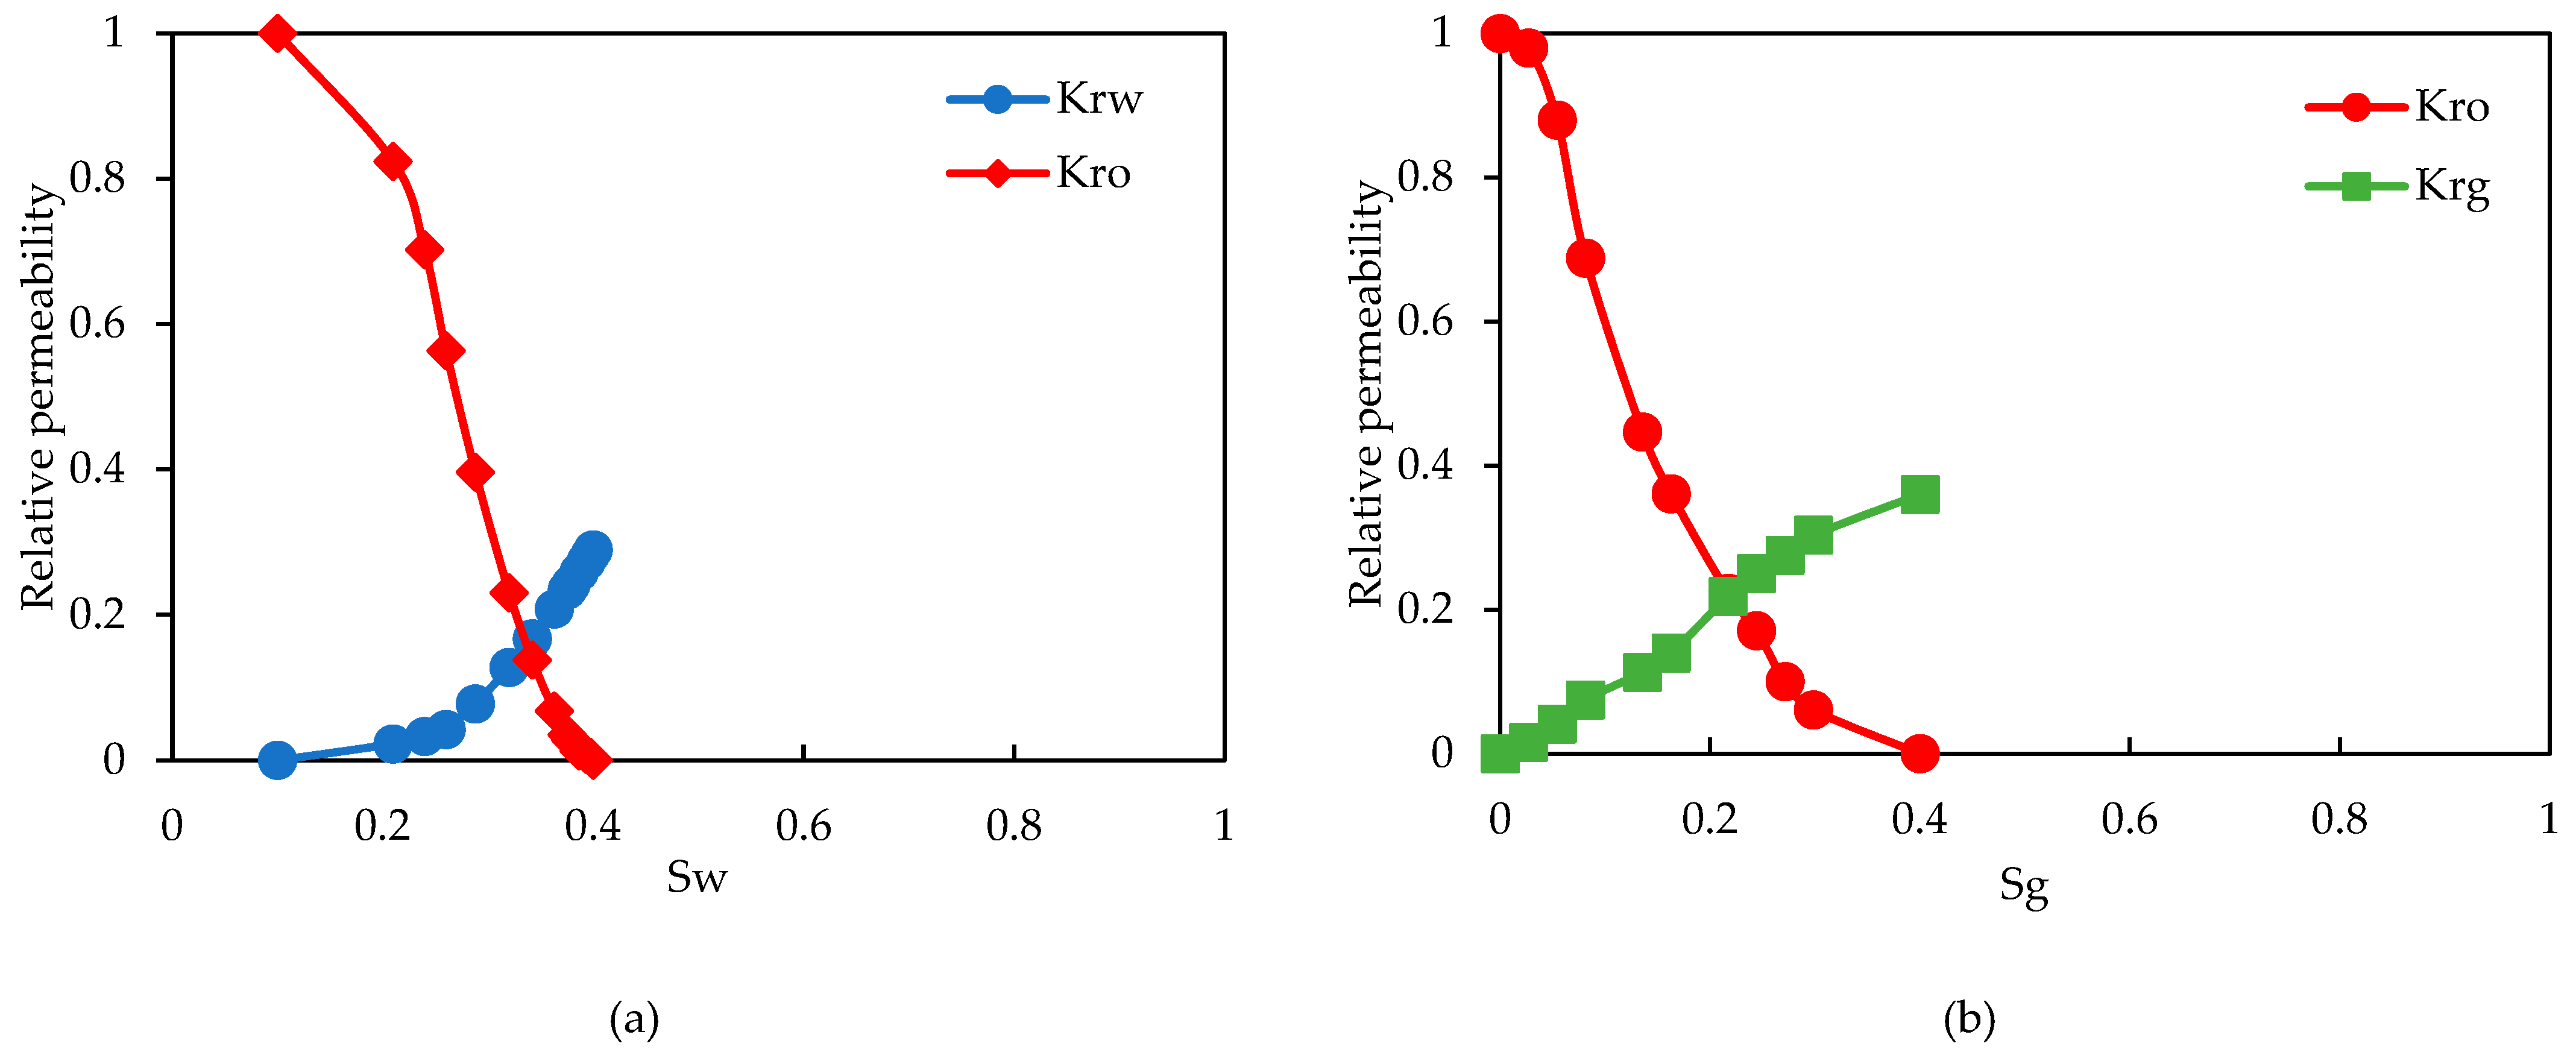
Figure 5.
Oil-gas-water three-phase permeability curves: (a) Oil-water relative permeability curves; (b) Liquid-gas relative permeability curves.
Figure 5.
Oil-gas-water three-phase permeability curves: (a) Oil-water relative permeability curves; (b) Liquid-gas relative permeability curves.
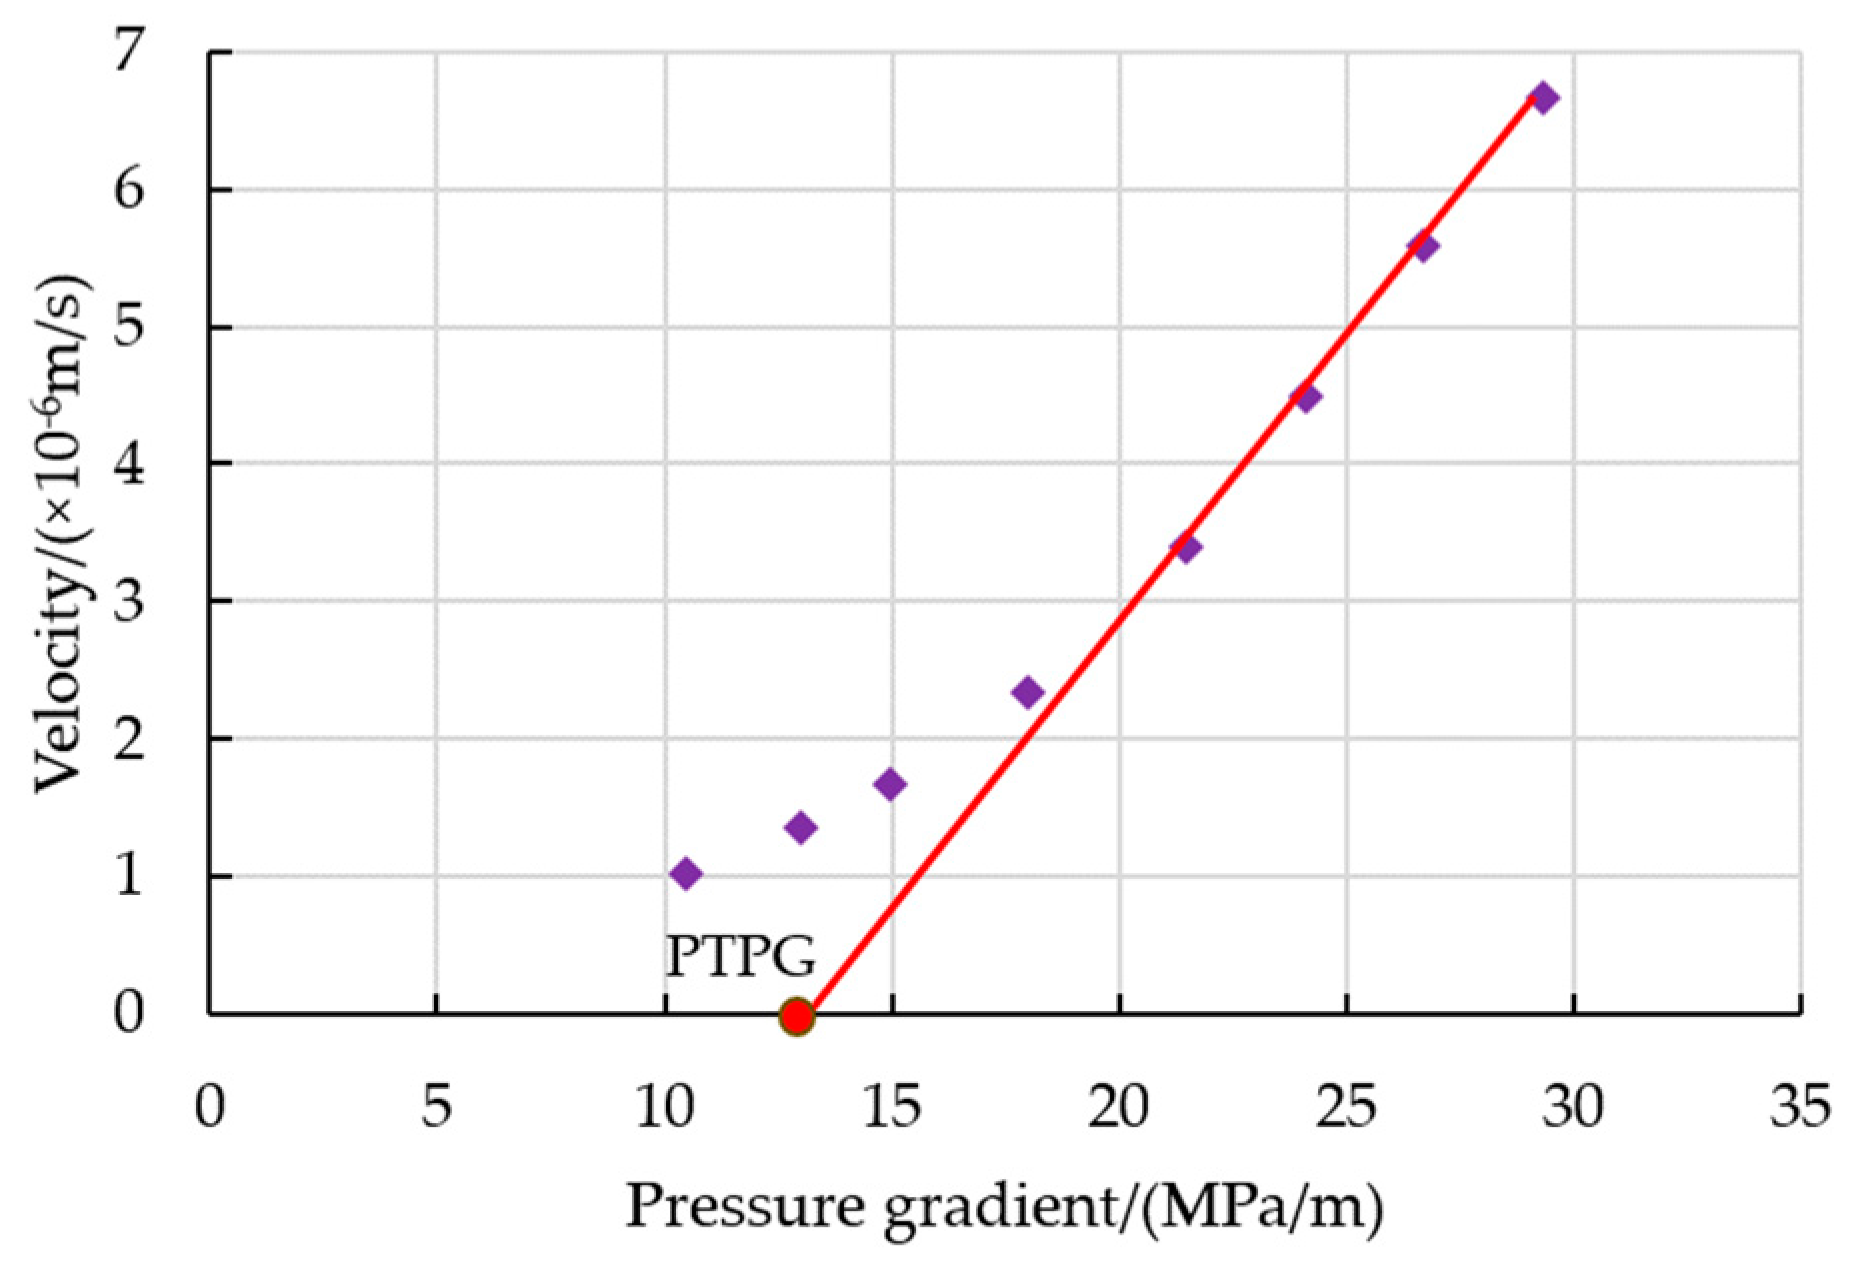
Figure 6.
Flow regime curve of low-velocity non-Darcy flow.
Figure 6.
Flow regime curve of low-velocity non-Darcy flow.
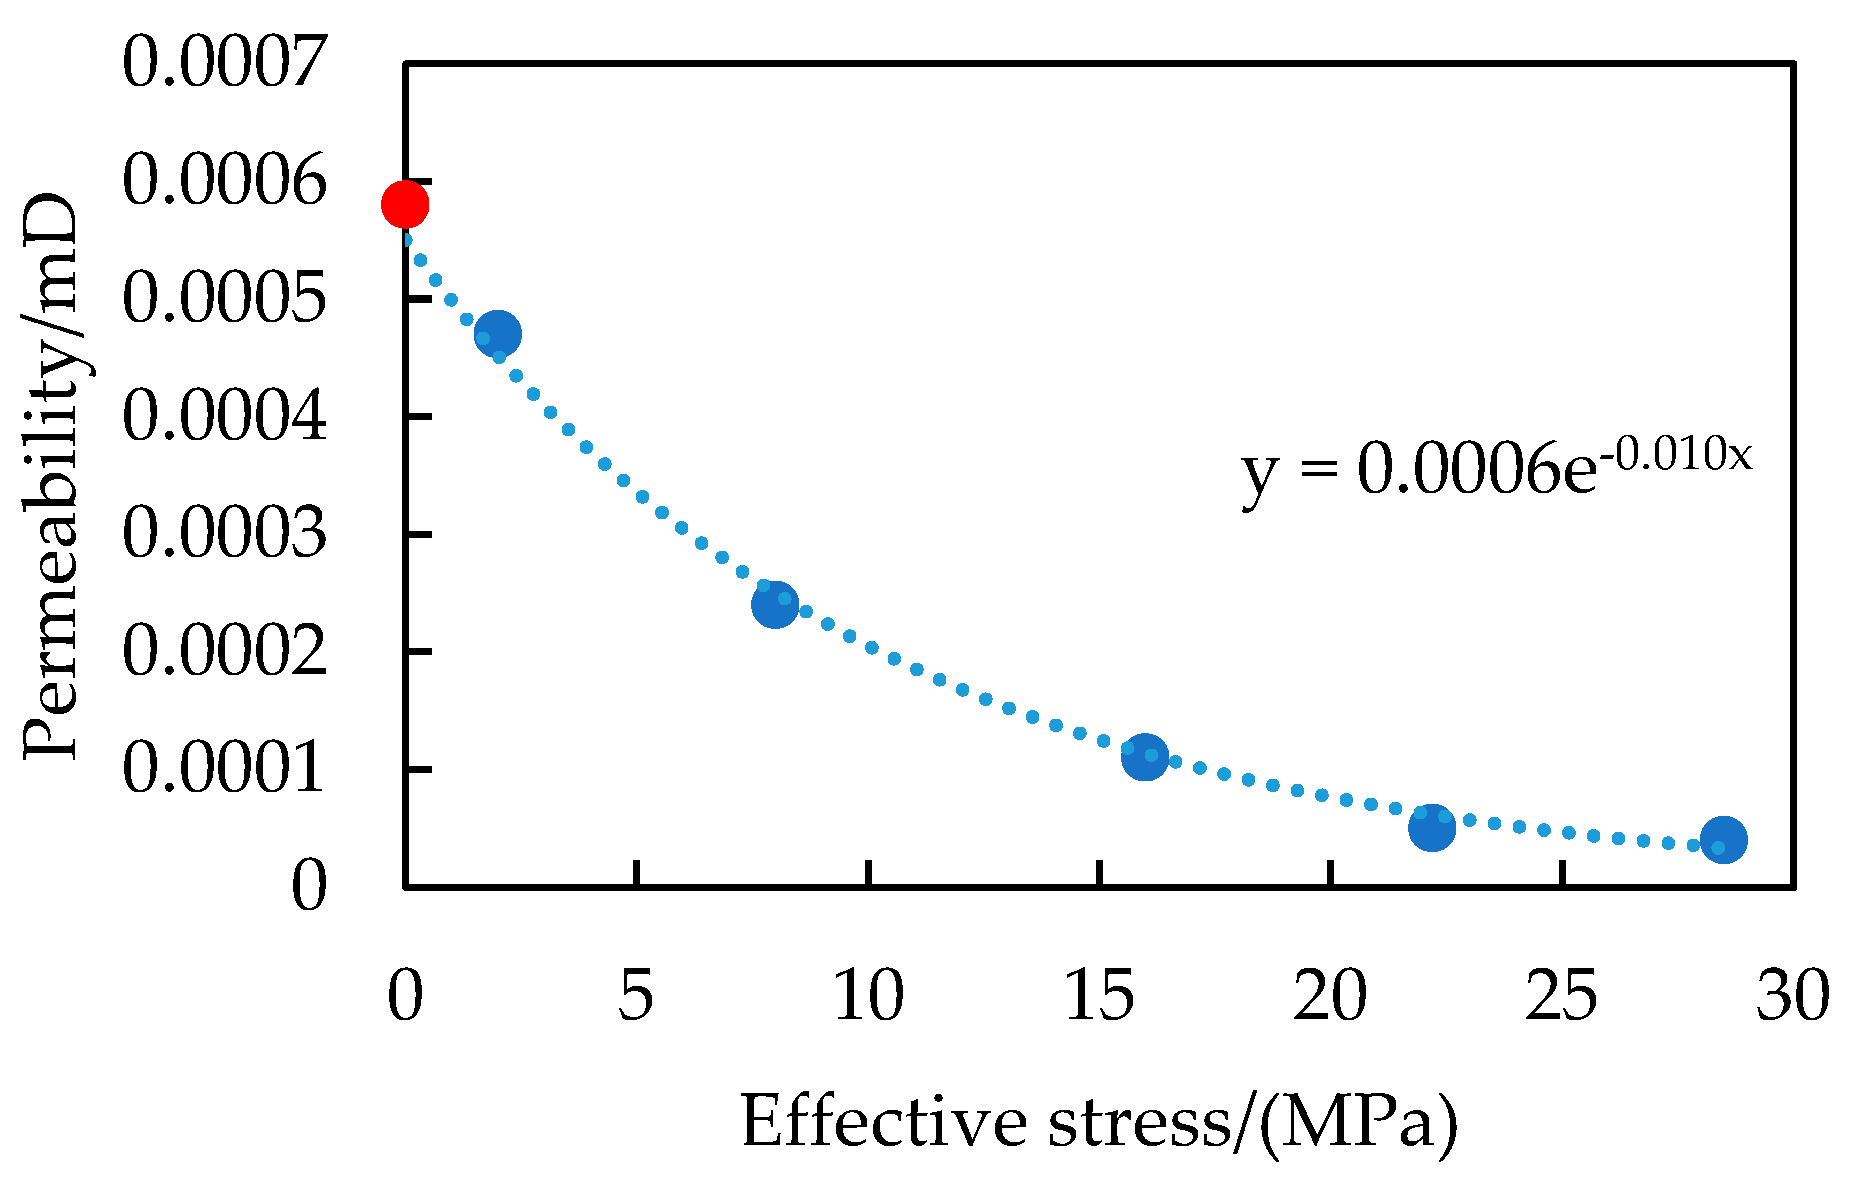
Figure 7.
Fitting results of matrix stress sensitivity tests in the Gulong Shale.
Figure 7.
Fitting results of matrix stress sensitivity tests in the Gulong Shale.
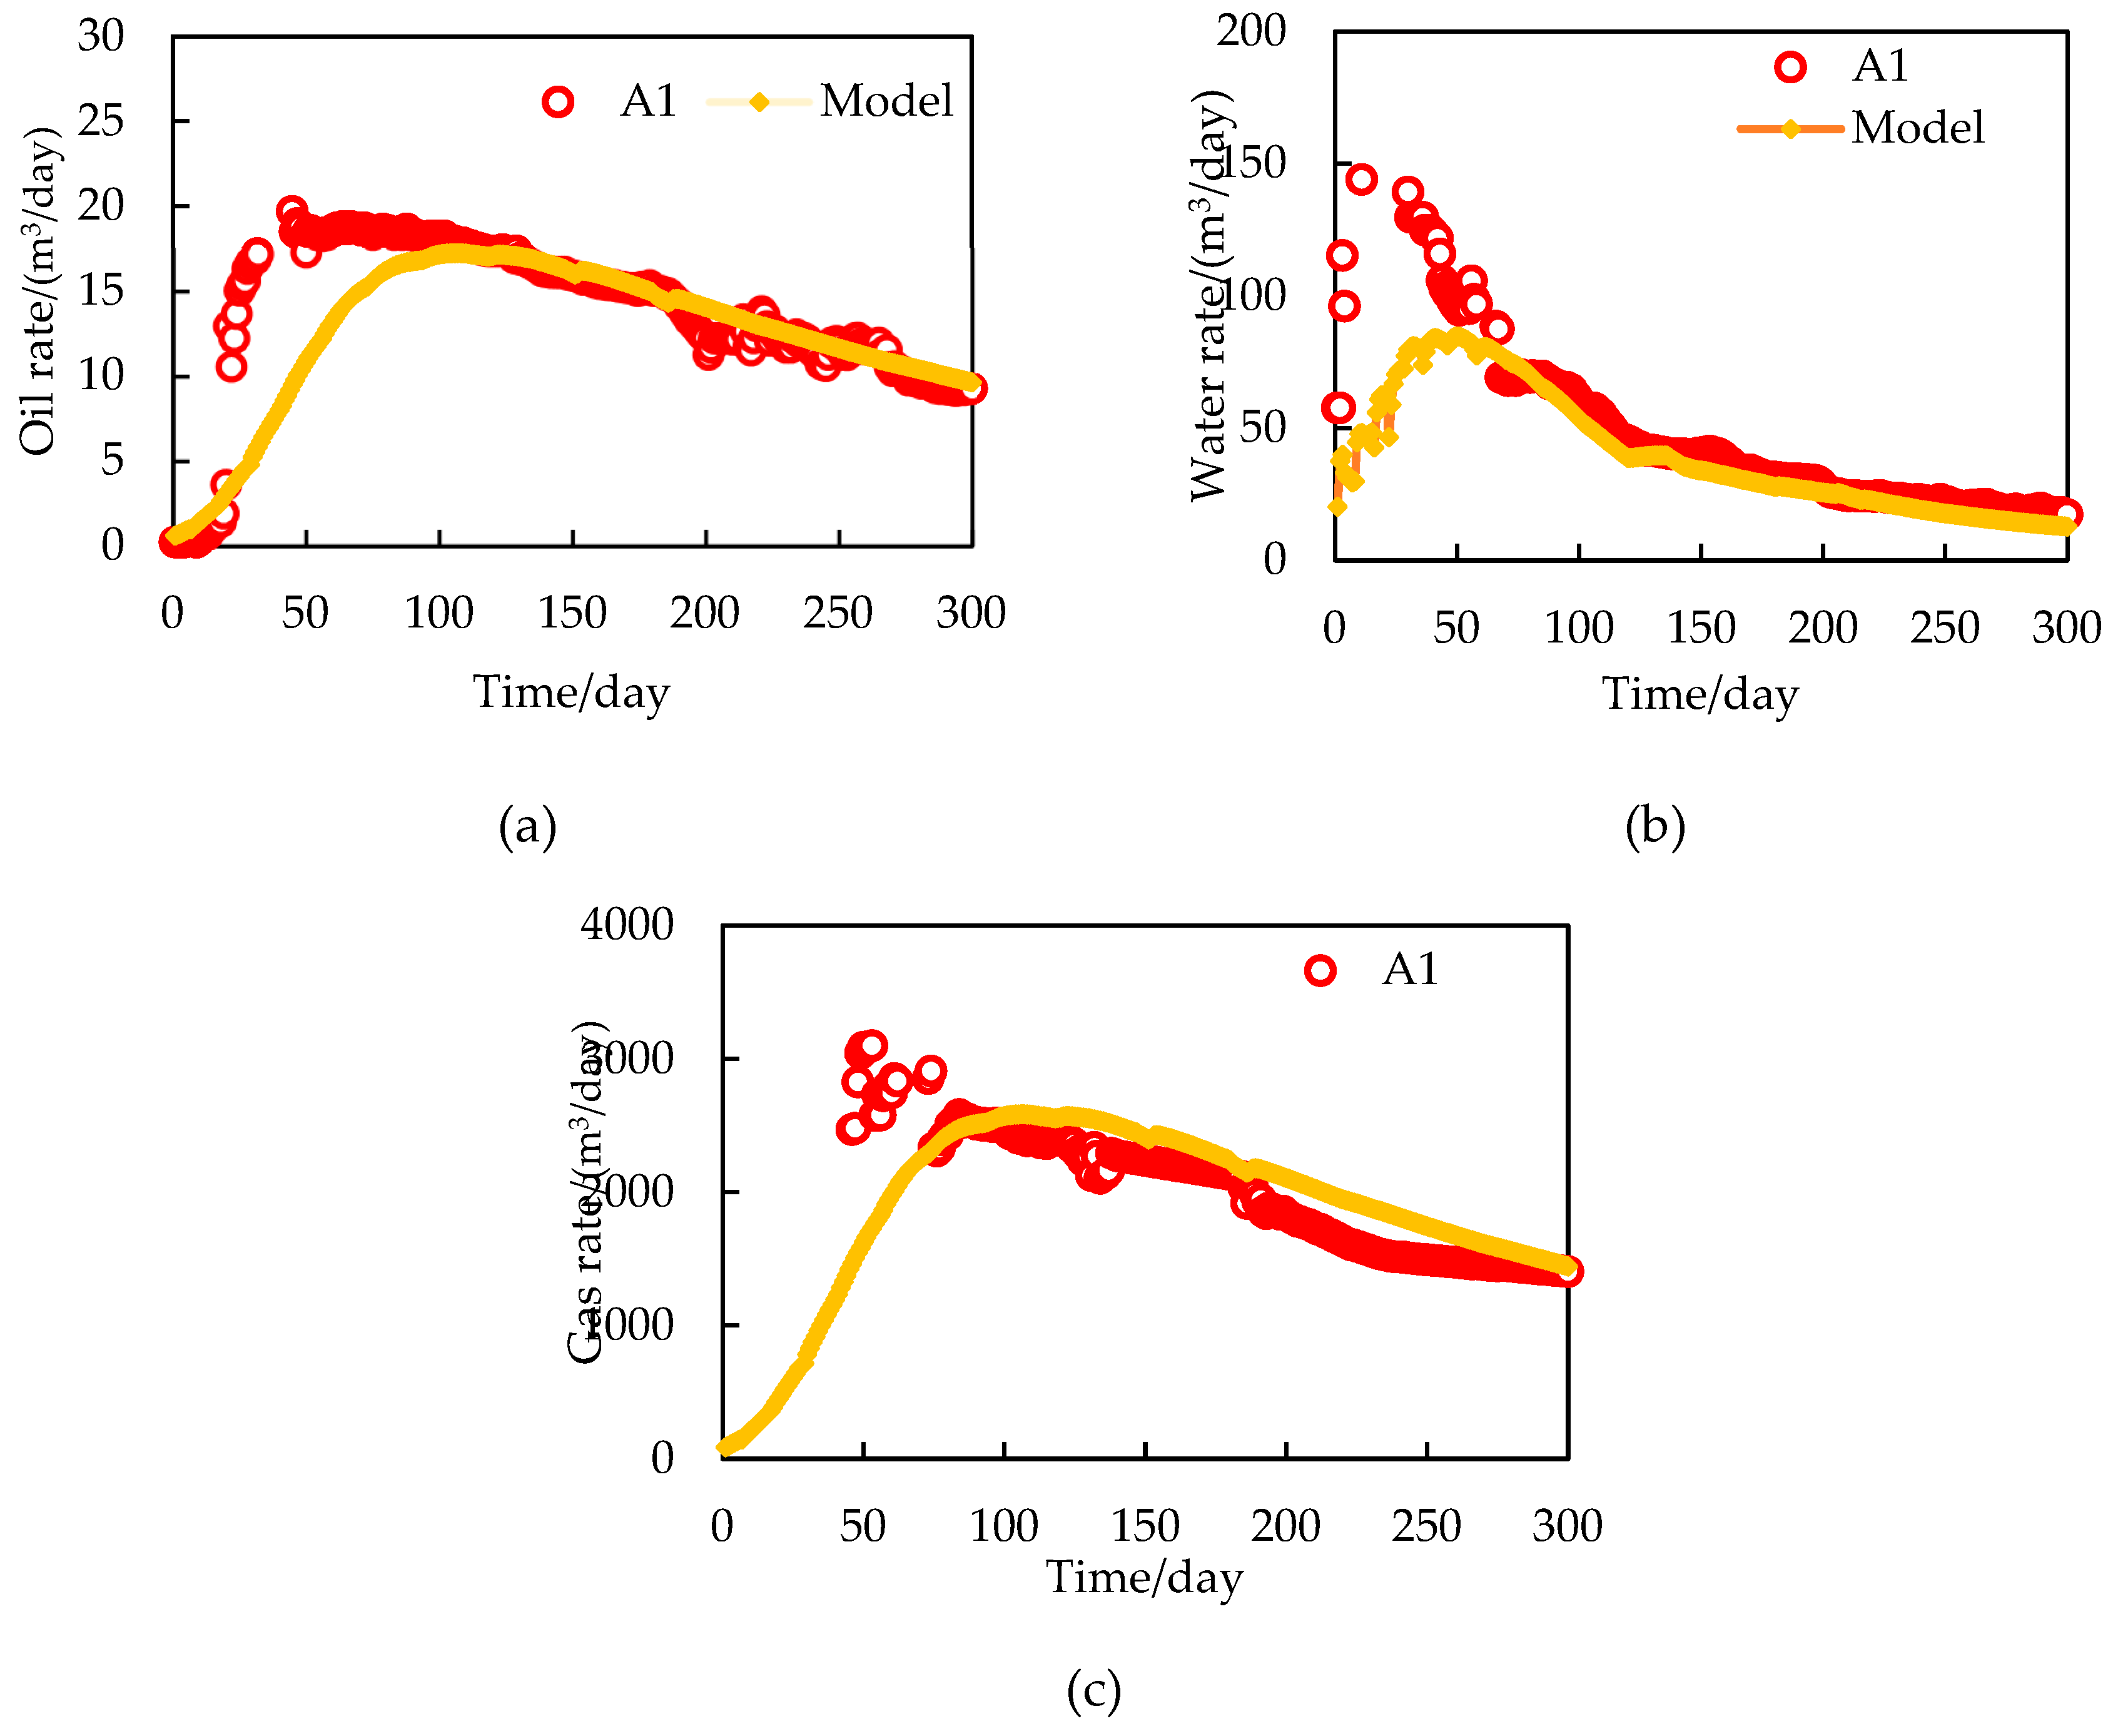
Figure 8.
Historical matching results of a multiphase flow back numerical model for Gulong shale oil well: (a) historical matching of oil rate; (b) historical matching of water rate; (c) historical matching of gas rate.
Figure 8.
Historical matching results of a multiphase flow back numerical model for Gulong shale oil well: (a) historical matching of oil rate; (b) historical matching of water rate; (c) historical matching of gas rate.
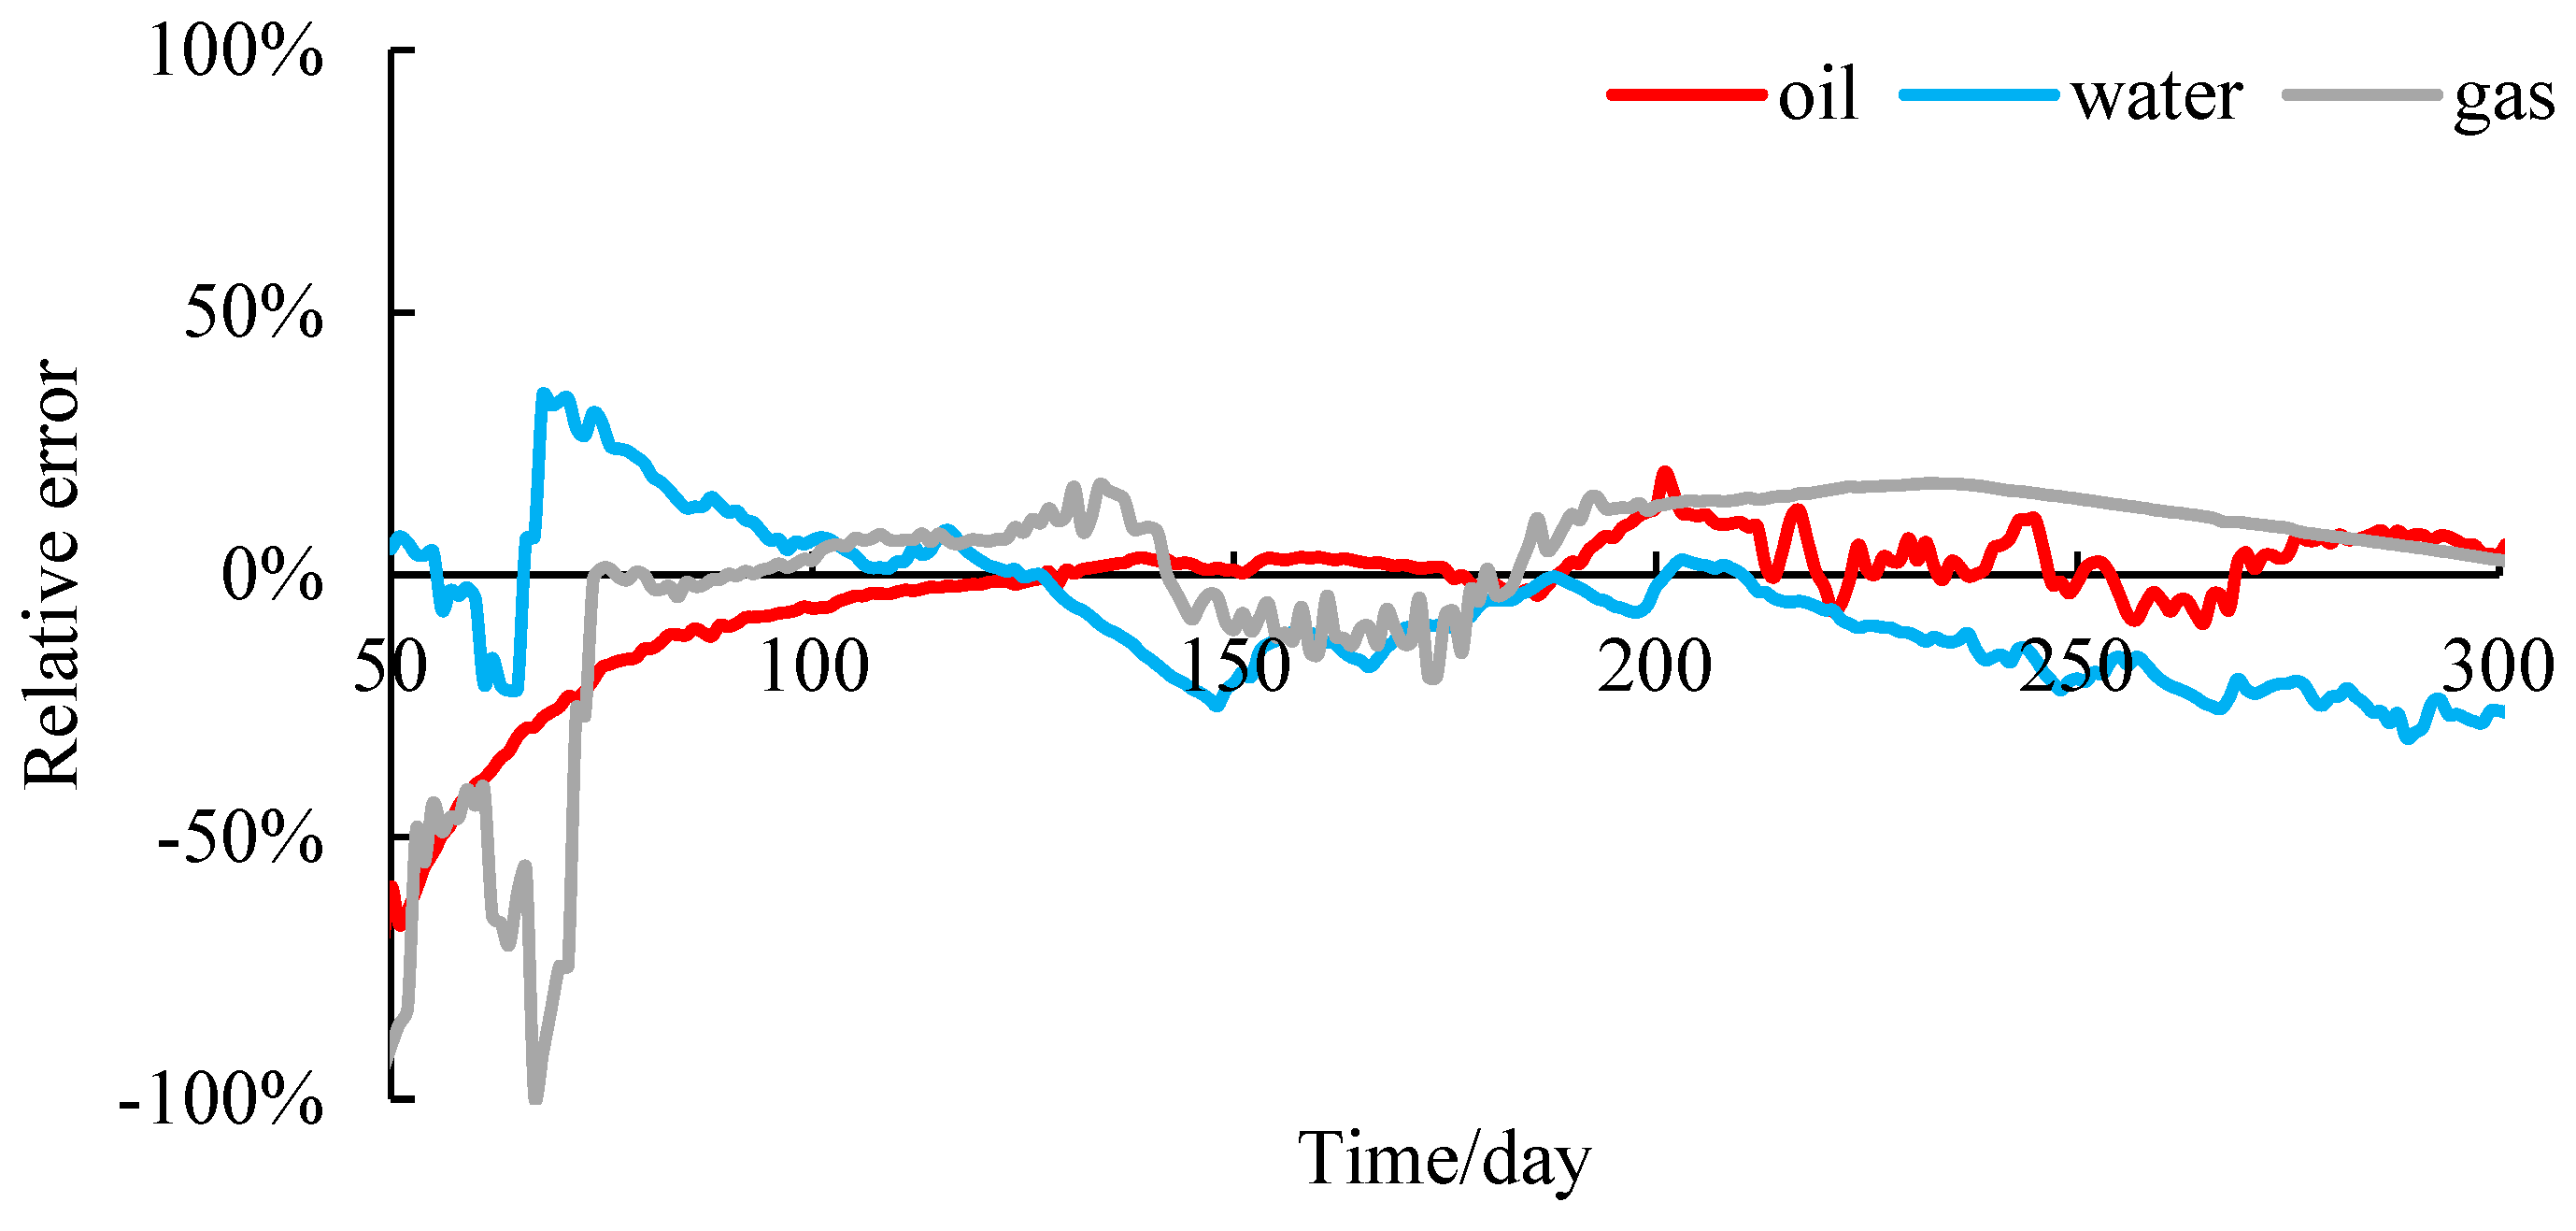
Figure 9.
Analysis of matching errors.
Figure 9.
Analysis of matching errors.
Figure 10.
Oil and water rate curves at different Pseudo-Threshold Pressure Gradients (PTPG is respectively 10, 15, 20, 25MPa/m): (a) Oil rate curves; (b) Water rate curves; (c)Gas rate curves.
Figure 10.
Oil and water rate curves at different Pseudo-Threshold Pressure Gradients (PTPG is respectively 10, 15, 20, 25MPa/m): (a) Oil rate curves; (b) Water rate curves; (c)Gas rate curves.
Figure 11.
Formation pressure distribution on the 600th day at different pseudo-threshold pressure gradients (PTPG is respectively 10, 15, 20, 25MPa/m).
Figure 11.
Formation pressure distribution on the 600th day at different pseudo-threshold pressure gradients (PTPG is respectively 10, 15, 20, 25MPa/m).
Figure 12.
Oil and water rate curves at different stress sensitivity coefficients (stress sensitivity coefficient is respectively 0.3, 0.47, 0.55, 0.6): (a) Oil rate curves; (b)Water rate curves; (c)Gas rate curves.
Figure 12.
Oil and water rate curves at different stress sensitivity coefficients (stress sensitivity coefficient is respectively 0.3, 0.47, 0.55, 0.6): (a) Oil rate curves; (b)Water rate curves; (c)Gas rate curves.
Figure 13.
Formation pressure distribution on the 600th day at different stress sensitivity coefficients (stress sensitivity coefficient is respectively 0.3, 0.47, 0.55, 0.6).
Figure 13.
Formation pressure distribution on the 600th day at different stress sensitivity coefficients (stress sensitivity coefficient is respectively 0.3, 0.47, 0.55, 0.6).
Figure 14.
Oil and water rate curves at different opened bedding permeability (opened bedding permeability is respectively 10, 50, 100, 150, 200mD): (a) Oil rate curves; (b)Water rate curves; (c)Gas rate curves.
Figure 14.
Oil and water rate curves at different opened bedding permeability (opened bedding permeability is respectively 10, 50, 100, 150, 200mD): (a) Oil rate curves; (b)Water rate curves; (c)Gas rate curves.
Figure 16.
Oil and water rate curves at different matrix permeability (matrix permeability is respectively 1.8, 3.8, 5.8, 7.8, 9.8×10⁻⁴mD): (a) Oil rate curves; (b)Water rate curves; (c)Gas rate curves.
Figure 16.
Oil and water rate curves at different matrix permeability (matrix permeability is respectively 1.8, 3.8, 5.8, 7.8, 9.8×10⁻⁴mD): (a) Oil rate curves; (b)Water rate curves; (c)Gas rate curves.
Figure 18.
Relationship curves of pressure and choke size for three flowback modes: (a) Curves of pressure and choke size for fast-slow mode; (b) Curves of pressure and choke size for fast-slow-fast mode; (c) Curves of pressure and choke size for slow-fast-slow mode.
Figure 18.
Relationship curves of pressure and choke size for three flowback modes: (a) Curves of pressure and choke size for fast-slow mode; (b) Curves of pressure and choke size for fast-slow-fast mode; (c) Curves of pressure and choke size for slow-fast-slow mode.
Figure 20.
Water cut rate curves of three flowback modes.
Figure 20.
Water cut rate curves of three flowback modes.
Figure 21.
Production gas-oil ratio curves under three flowback modes.
Figure 21.
Production gas-oil ratio curves under three flowback modes.
Figure 22.
Total oil production curves of three flowback modes.
Figure 22.
Total oil production curves of three flowback modes.
Figure 23.
Total oil and recovery ratio curves of three flowback models.
Figure 23.
Total oil and recovery ratio curves of three flowback models.
Figure 24.
Pressure distribution diagrams of production in slow-fast-slow mode: (a) Pressure distribution at the 300th day of production; (b) Pressure distribution at the 1000th day of production.
Figure 24.
Pressure distribution diagrams of production in slow-fast-slow mode: (a) Pressure distribution at the 300th day of production; (b) Pressure distribution at the 1000th day of production.
Figure 25.
Pressure distribution diagrams of production in fast-slow mode: (a) Pressure distribution at the 300th day of production; (b) Pressure distribution at the 1000th day of production.
Figure 25.
Pressure distribution diagrams of production in fast-slow mode: (a) Pressure distribution at the 300th day of production; (b) Pressure distribution at the 1000th day of production.
Figure 26.
Pressure distribution diagrams of production in fast-slow-fast mode: (a) Pressure distribution at the 300th day of production; (b) Pressure distribution at the 1000th day of production.
Figure 26.
Pressure distribution diagrams of production in fast-slow-fast mode: (a) Pressure distribution at the 300th day of production; (b) Pressure distribution at the 1000th day of production.
