Preprint
Article

A Comparative Analysis of the Phytochemical Profiles of Lonicera japonica Thunb. Flos Thunb. Species Native to the Mountainous and Coastal Regions of Romania

Altmetrics

Downloads

128

Views

53

Comments

0

Submitted:

21 May 2024

Posted:

23 May 2024

You are already at the latest version

Alerts
Abstract
This study aimed to examine the chemical makeup and antioxidant properties of hydroalcoholic extracts obtained from Lonicera japonica Thunb. Thunb. (honeysuckle) flowers collected from two geographically distinct regions of Romania: a mountainous region (Făgăraș Mountainous, Brașov) and a coastal region (Black Sea, Constanța). Our research revealed that the extracts from these two regions differed significantly in terms of their total polyphenol, flavone, and phenolic carboxylic acid content, as well as their antioxidant activity. These results suggest that climatic factors play a crucial role in shaping the phytochemical profile and antioxidant activity of Lonicera japonica Thunb. Thunb. extracts. Therefore, these findings could potentially contribute to the development of standardized herbal preparations and nutraceutical products.
Keywords: 
Subject: Medicine and Pharmacology  -   Pharmacy

1. Introduction

Lonicera japonica Thunb., also known as Japanese Honeysuckle, is a species of honeysuckle native to East Asia. The plant was first introduced to Europe in the 19th century as an ornamental plant and has since become naturalized in many regions. In traditional East Asian medicine, Lonicera japonica Thunb. was used to treat a variety of ailments, including fever, sore throat, and digestive issues [1]. Modern research has explored the medicinal properties of the plant, confirming some of its traditional uses and discovering new potential applications [2]. Lonicera japonica Thunb., is a species of flowering plant in the honeysuckle family (Caprifoliaaceae). It is native to East Asia, including China, Japan, Korea [3]. The species is widely used in Chinese Traditional Medicine with various pharmacological activities. In recent years, research on the plant has focused on its antioxidant and anti-inflammatory properties [4,5], which are attributed to its bioactive compounds such as polyphenols, flavonoids, and polysaccharides [3,6]. A review article by Li et al. [7] summarized over 200 studies on the chemical constituents and pharmacological activities of Lonicera japonica Thunb. extract. The review highlighted the potent antioxidant and anti-inflammatory effects of polyphenols found in the extract, such as quercetin, kaempferol, and rutin. The authors suggested that Lonicera japonica Thunb. has great potential in treating various diseases, such as respiratory infections, diabetes, and cardiovascular diseases [7]. Another study investigated the anti-inflammatory effects of Lonicera japonica Thunb. flower extracts and its active compound, chlorogenic acid. The study found that both the flower extracts and chlorogenic acid exhibited anti-inflammatory effects by reducing the production of inflammatory mediators and cytokines in LPS-induced RAW264.7 cells. The results suggested that Lonicera japonica Thunb. flower extracts and their active compound, chlorogenic acid, could be developed as natural anti-inflammatory agents [5]. A review article by An et al. [8] summarized the structures, biological activities, and industrial applications of polysaccharides extracted from Lonicera japonica Thunb. The authors concluded that Lonicera japonica Thunb. polysaccharides have great potential as functional food ingredients and therapeutic agents, but more research is needed to fully understand their structures and activities [8]. A study by Tang et al. [9] investigated the antioxidant and anti-inflammatory effects of Lonicera japonica Thunb. extract on HT-29 colon cancer cells. The study found that the extract exhibited potent antioxidant activity and inhibited inflammation in HT-29 cells, which was attributed to the presence of phenolic compounds in the extract [9]. Finally, the in vitro and in vivo antioxidant properties of Lonicera japonica Thunb. extract and its fractions were examined. The study found that the extract and its fractions had significant free radical scavenging activity in vitro and in vivo, suggesting their potential as natural antioxidants [4,6,10]. The authors have suggested that Lonicera japonica Thunb. is a promising traditional Chinese medicine with potent antioxidant and anti-inflammatory properties. Further studies are needed to determine the optimal dosages and potential side effects of Lonicera japonica Thunb., as well as its efficacy and safety in animal and human trials. Nevertheless, the findings highlight the potential of Lonicera japonica Thunb. as a natural alternative to conventional drugs for the treatment of various diseases.
Taking into account the data presented in the literature, the present study aims to establish a phytochemical profile and antioxidant capacity of extracts obtained from naturalized Lonicera japonica Thunb. flowers, harvested from two distinct geographical regions of Romania.

2. Results

2.1. Total Flavonoid and Polyphenol Content

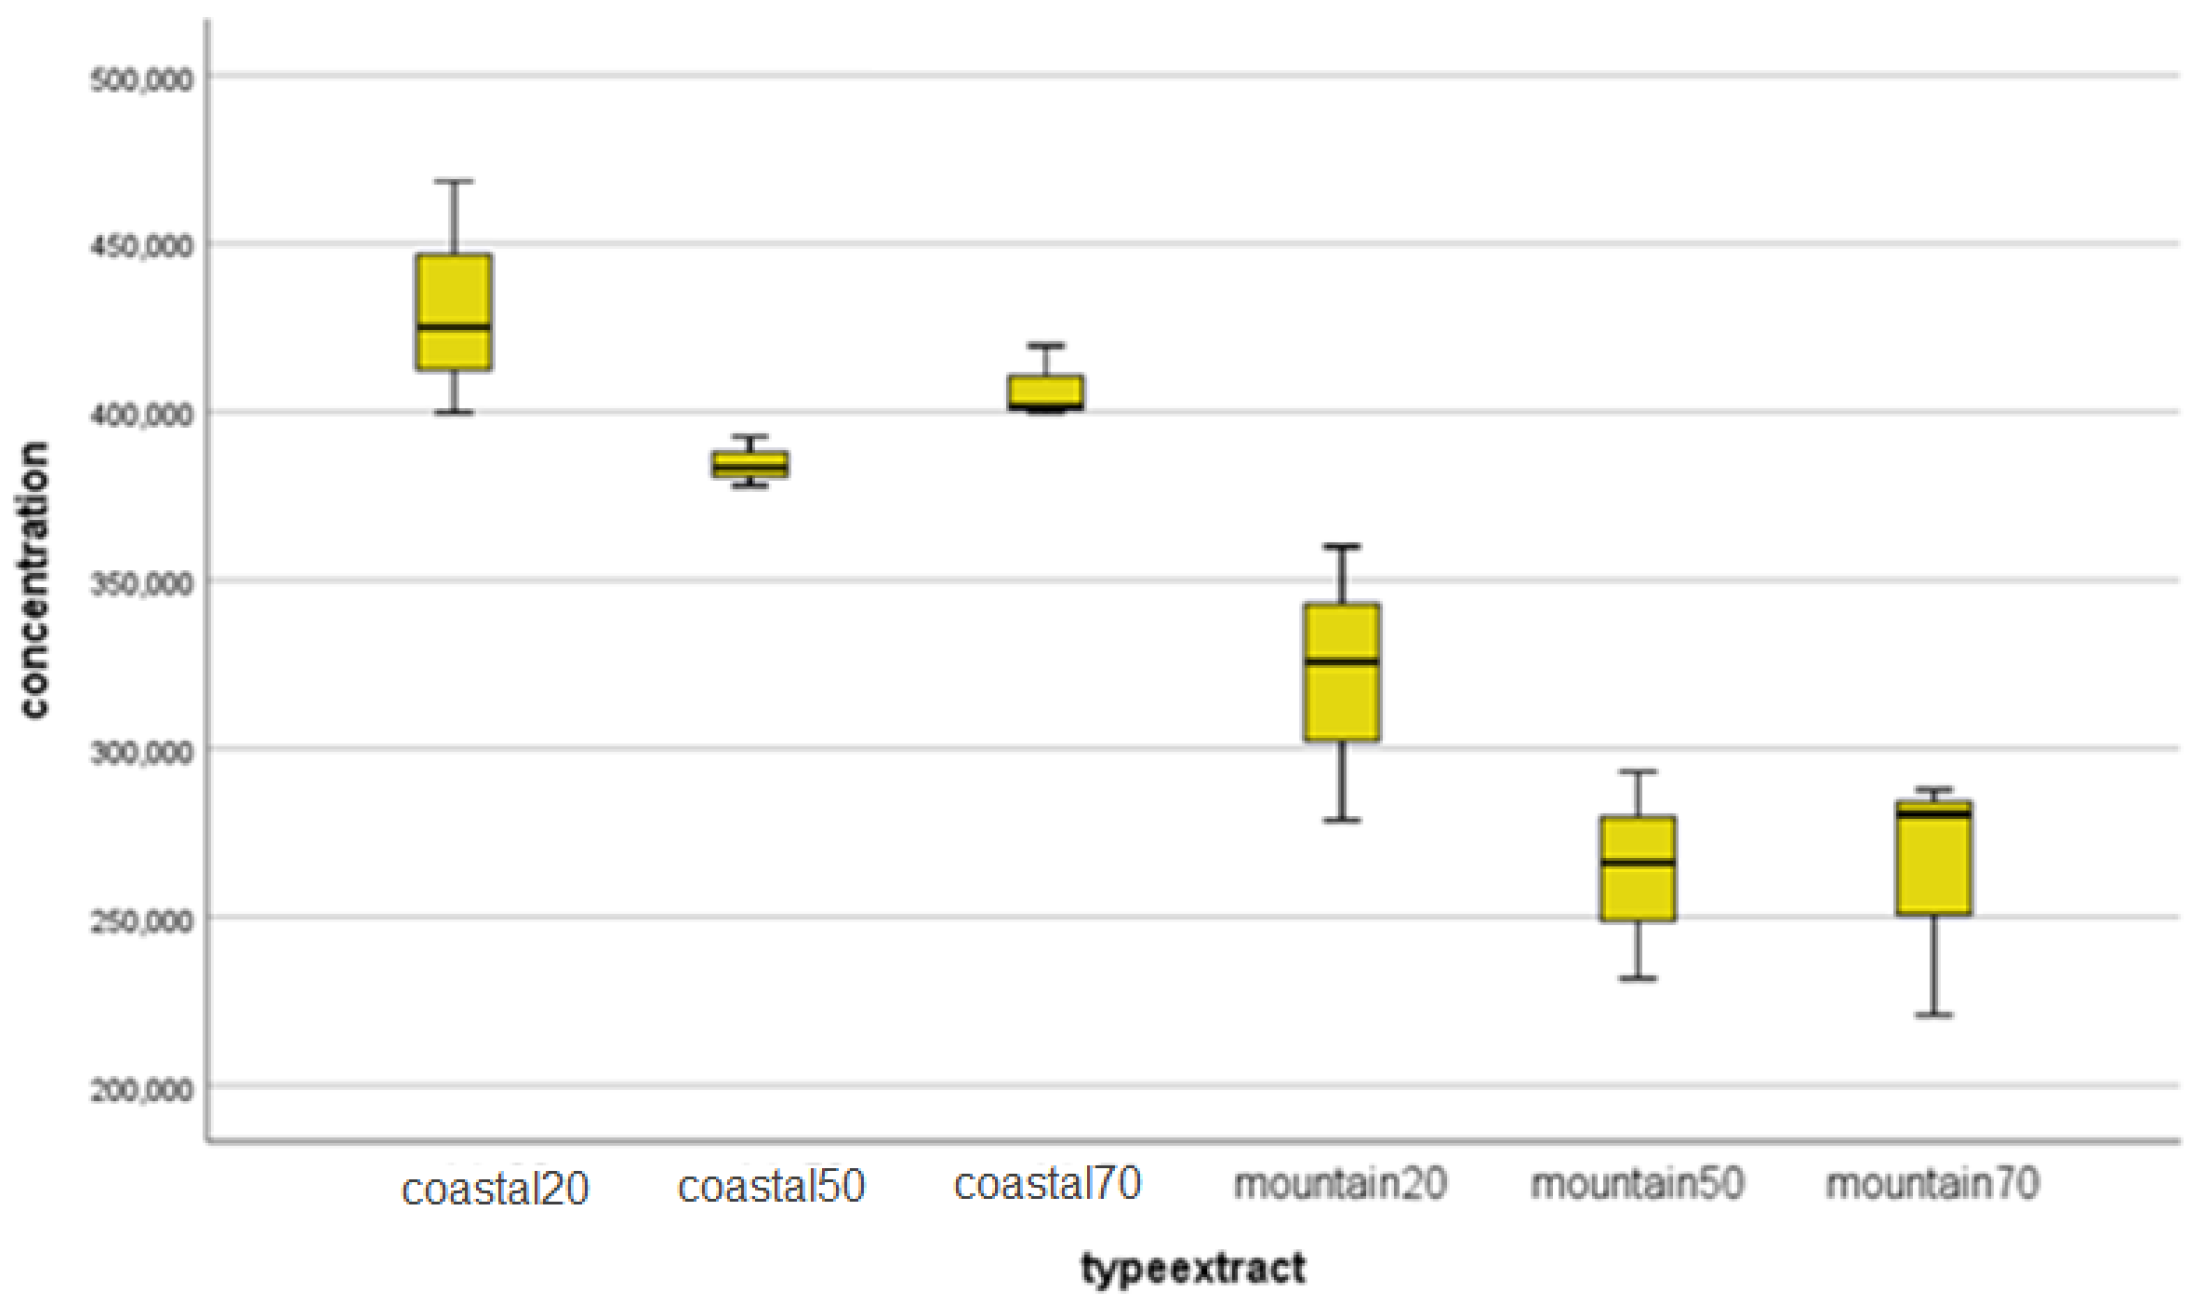
In this study, the phytochemical content of Lonicera japonica Thunb. extracts from coastal and mountainous regions was investigated using three different solvents. The results showed that coastal extracts had higher concentrations of polyphenols and flavonoids compared to mountain extracts (Figure 1, Figure 2). However, the differences in polyphenol and flavonoid content between the coastal and mountain extracts were not statistically significant for all solvents, suggesting that other factors such as climate conditions, soil composition or extraction methods may play a larger role in determining the concentrations of these compounds.
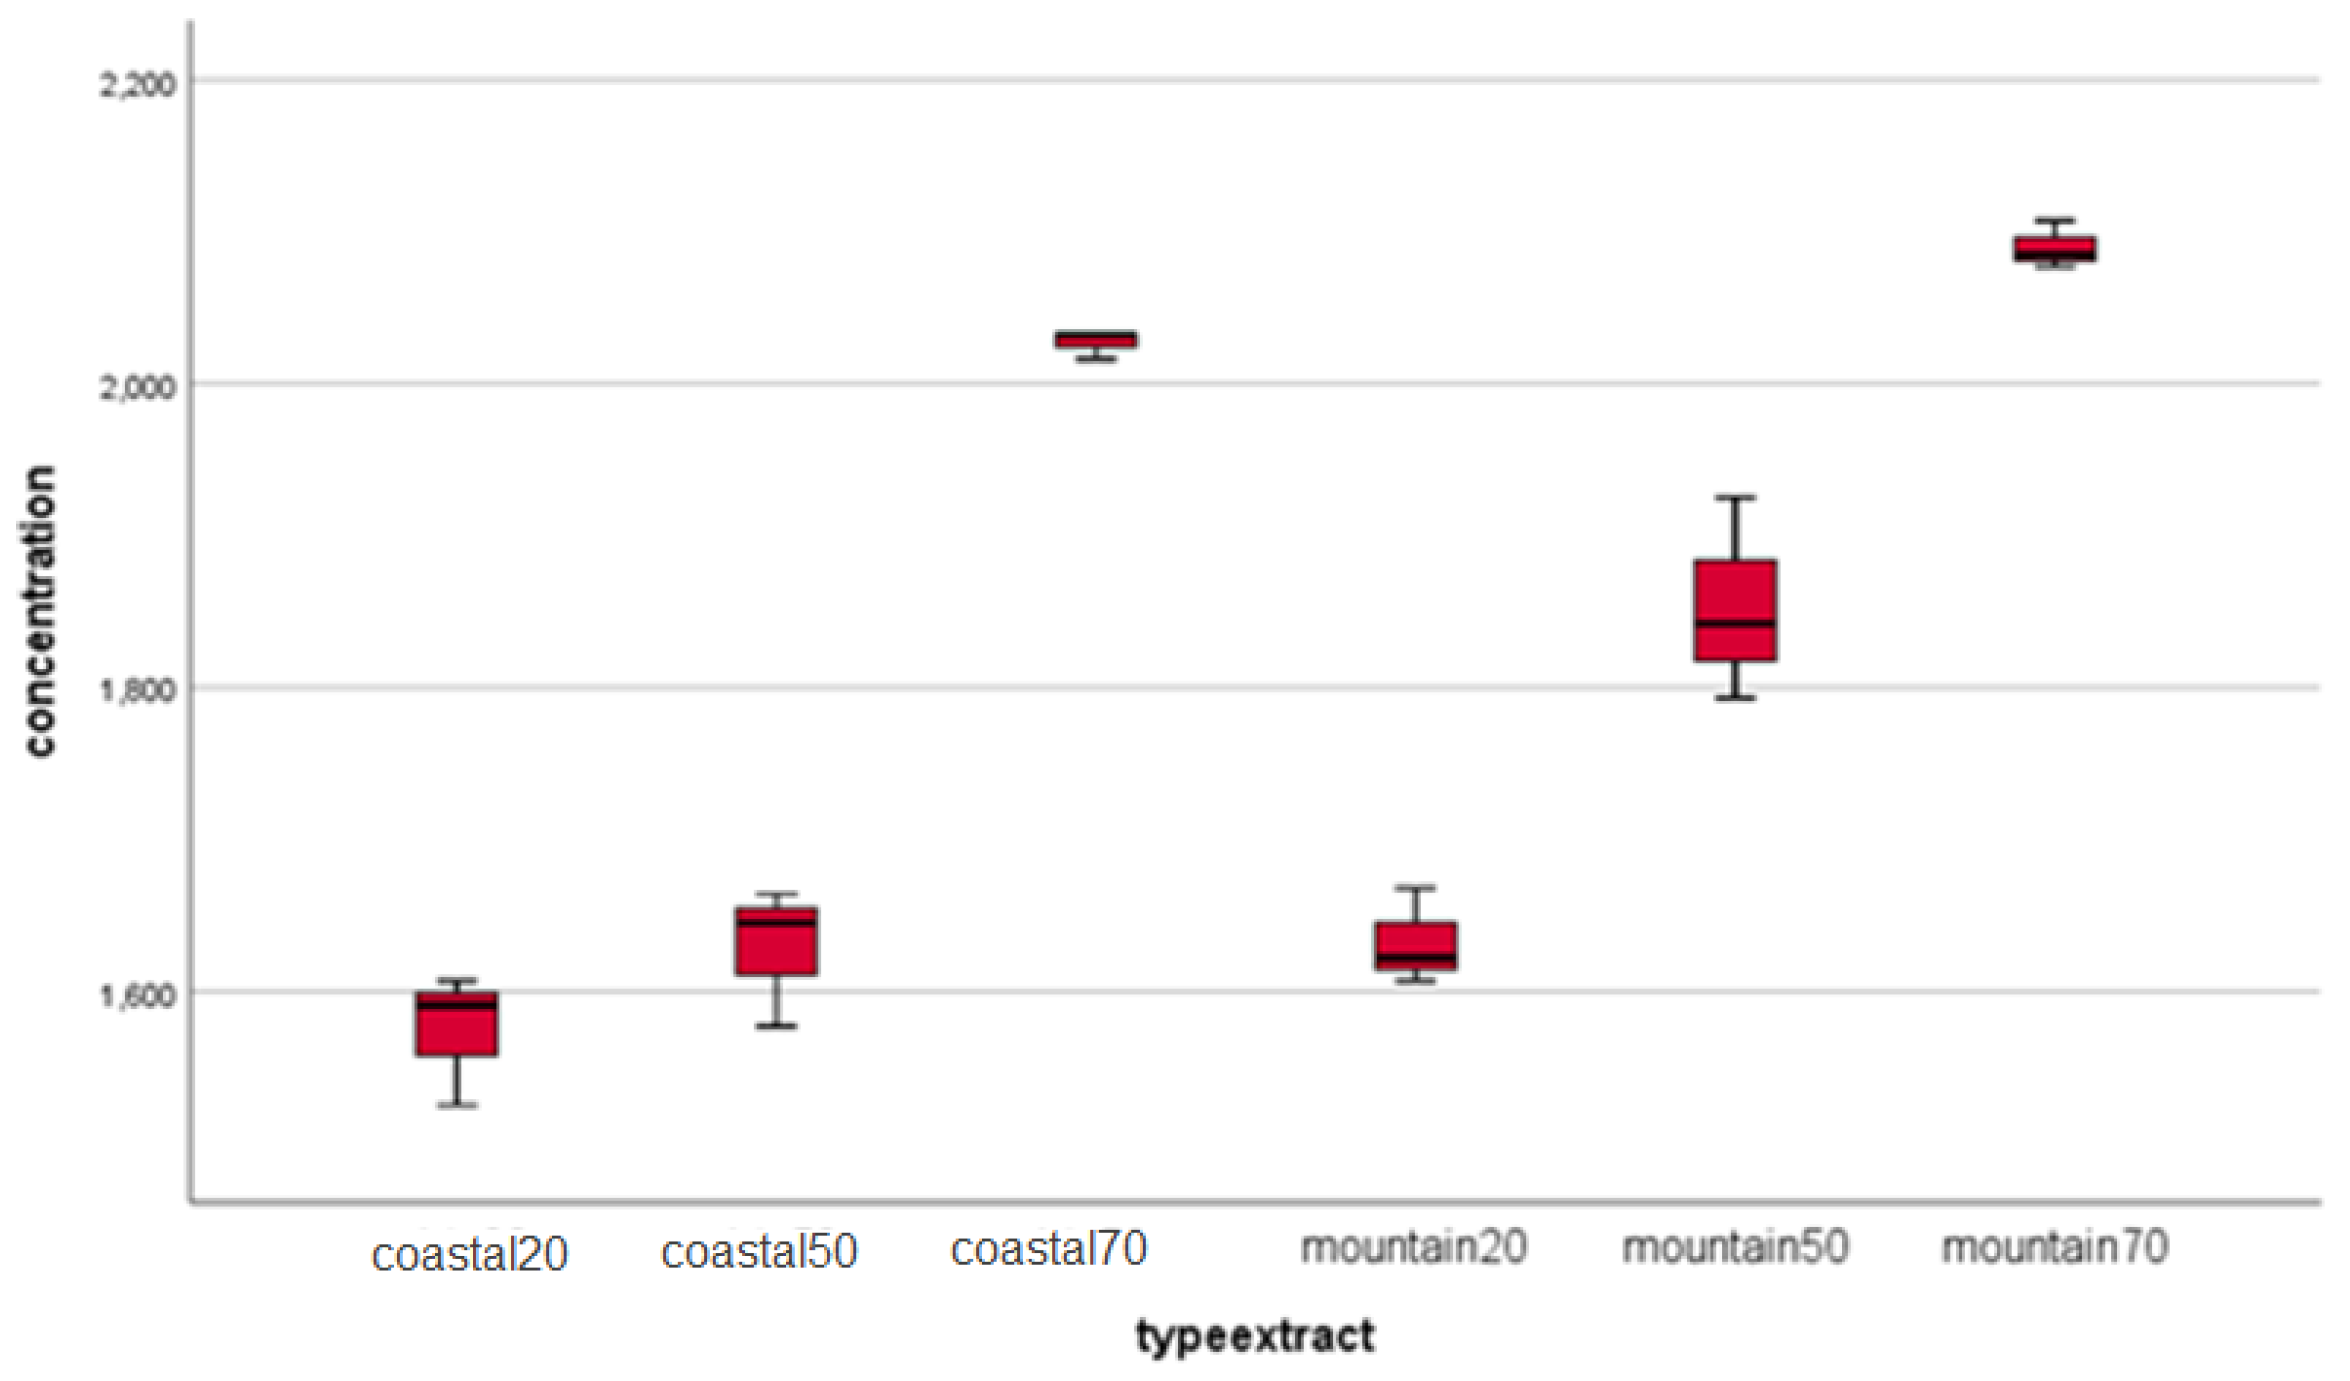
On the other hand, mountain extracts had a higher phenolcarboxylic acid content than coastal extracts, with the highest concentration obtained using ethanol 70 as a solvent (Figure 3).

2.2. Antioxidant Activity

The study conducted further analysis on the lyophilized extract using 70% ethanol as a solvent. Two antioxidant assays, CUPRAC and DPPH, were employed to evaluate the antioxidant capacity of the extracts obtained from both coastal and mountain sources. The results indicated that both coastal and mountain extracts exhibited significant antioxidant activity, with the mountain extract showing higher antioxidant activity compared to the coastal extract in both assays. These findings are consistent with previous studies [11], highlighting the antioxidant efficacy of Lonicera japonica Thunb. extracts. A correlation analysis was performed, establishing a relationship between the total phenol content and the antioxidant activity. The summarized results of the antioxidant activity can be found in Table 1 and Table 2, with data expressed as the mean ± standard error of the mean (n = 3).

2.3. LC/MS Analysis

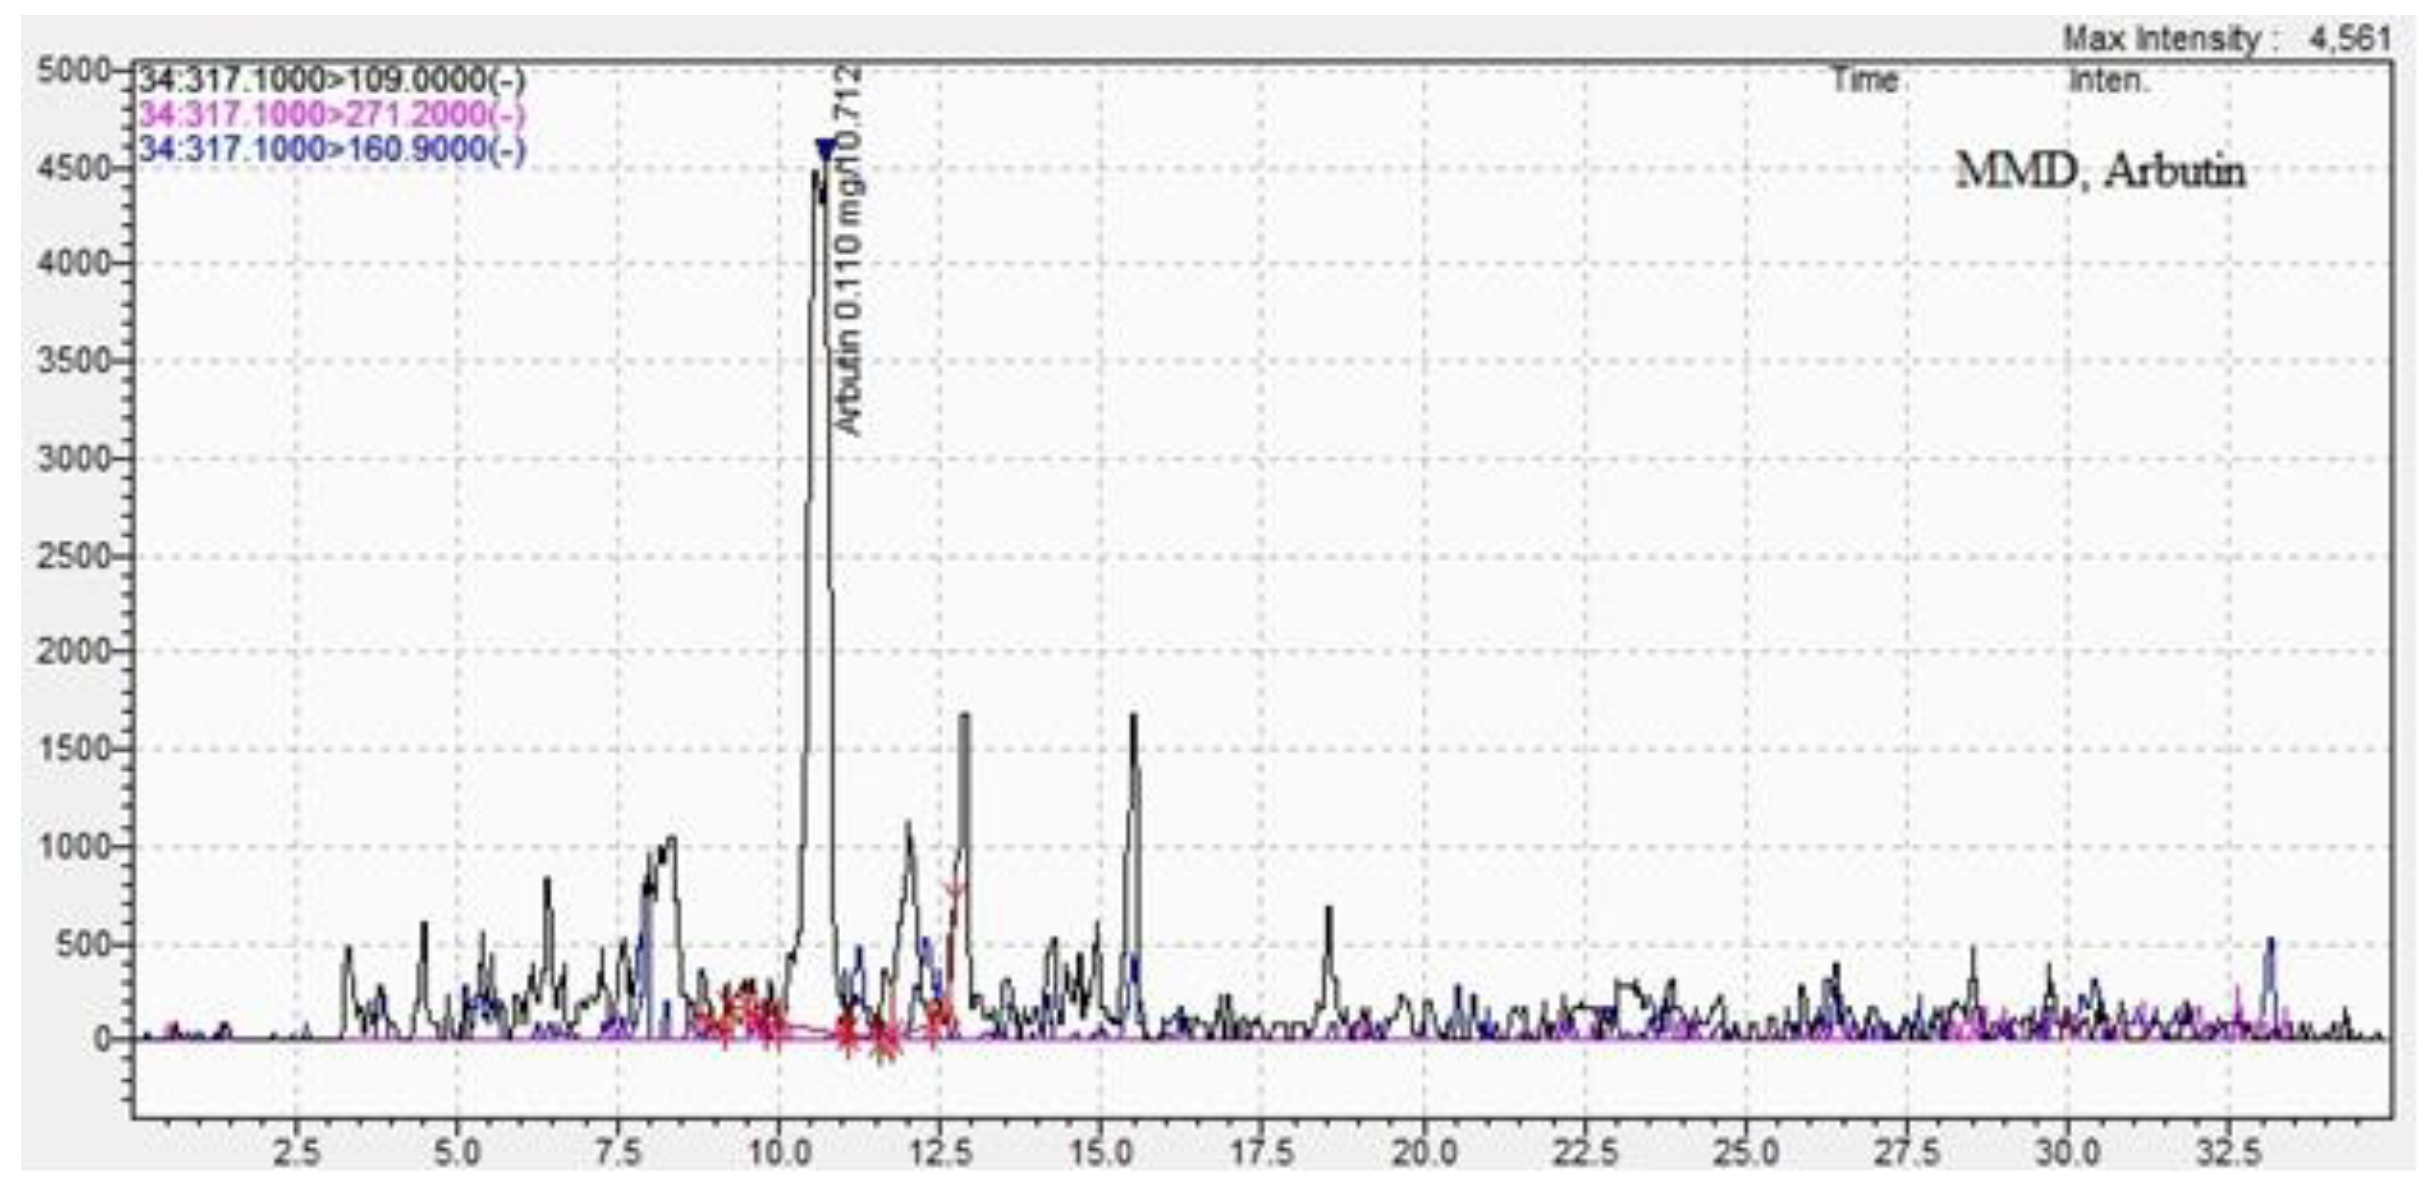
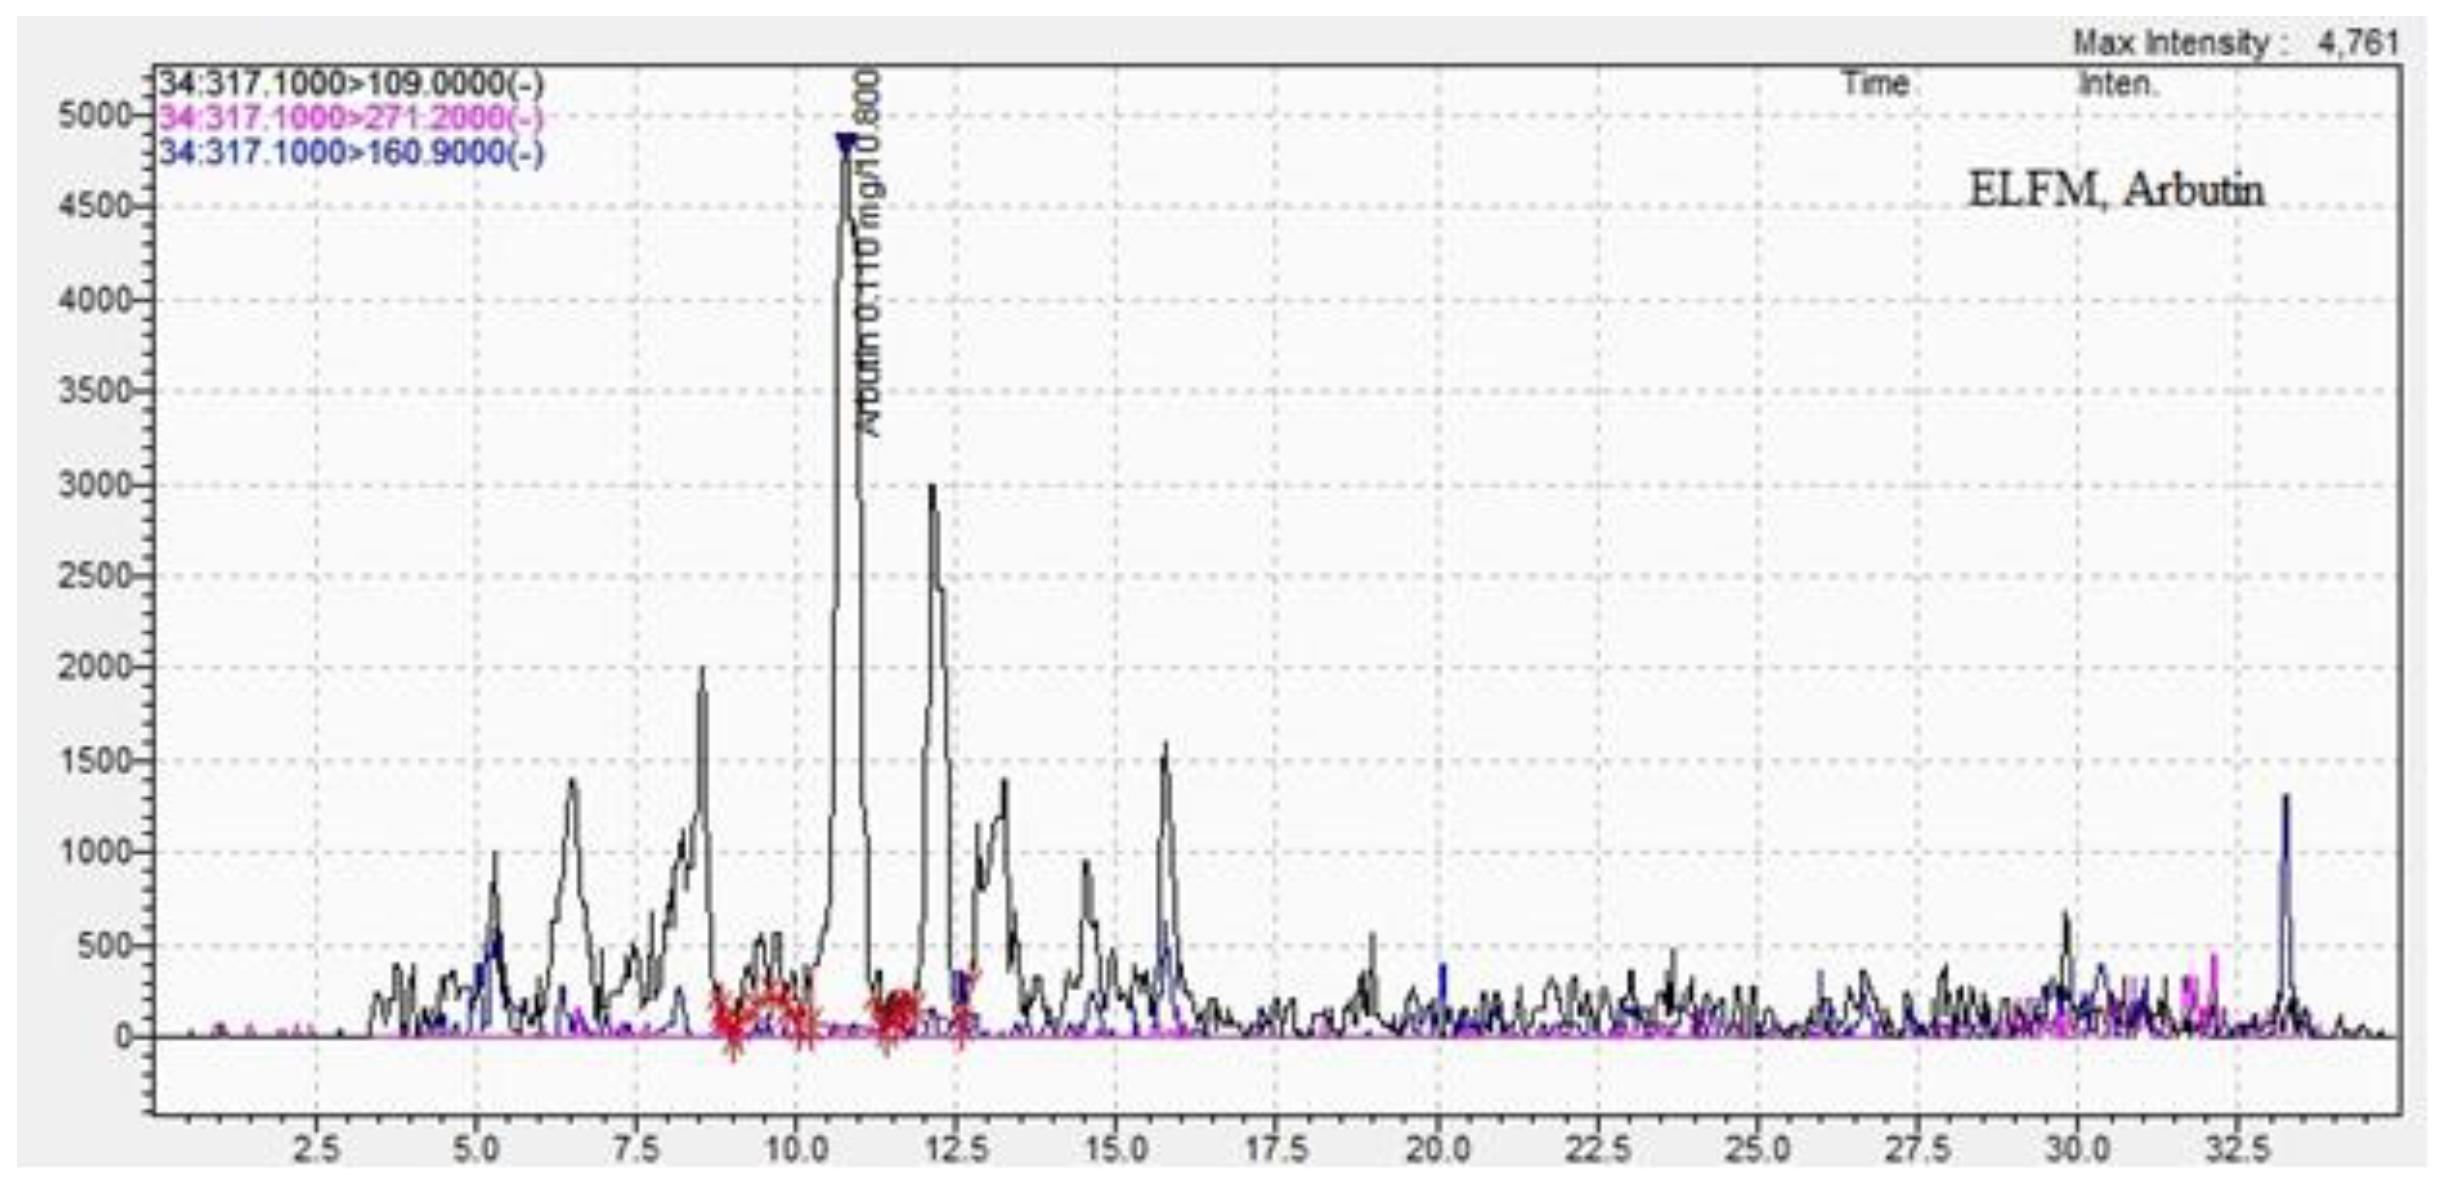
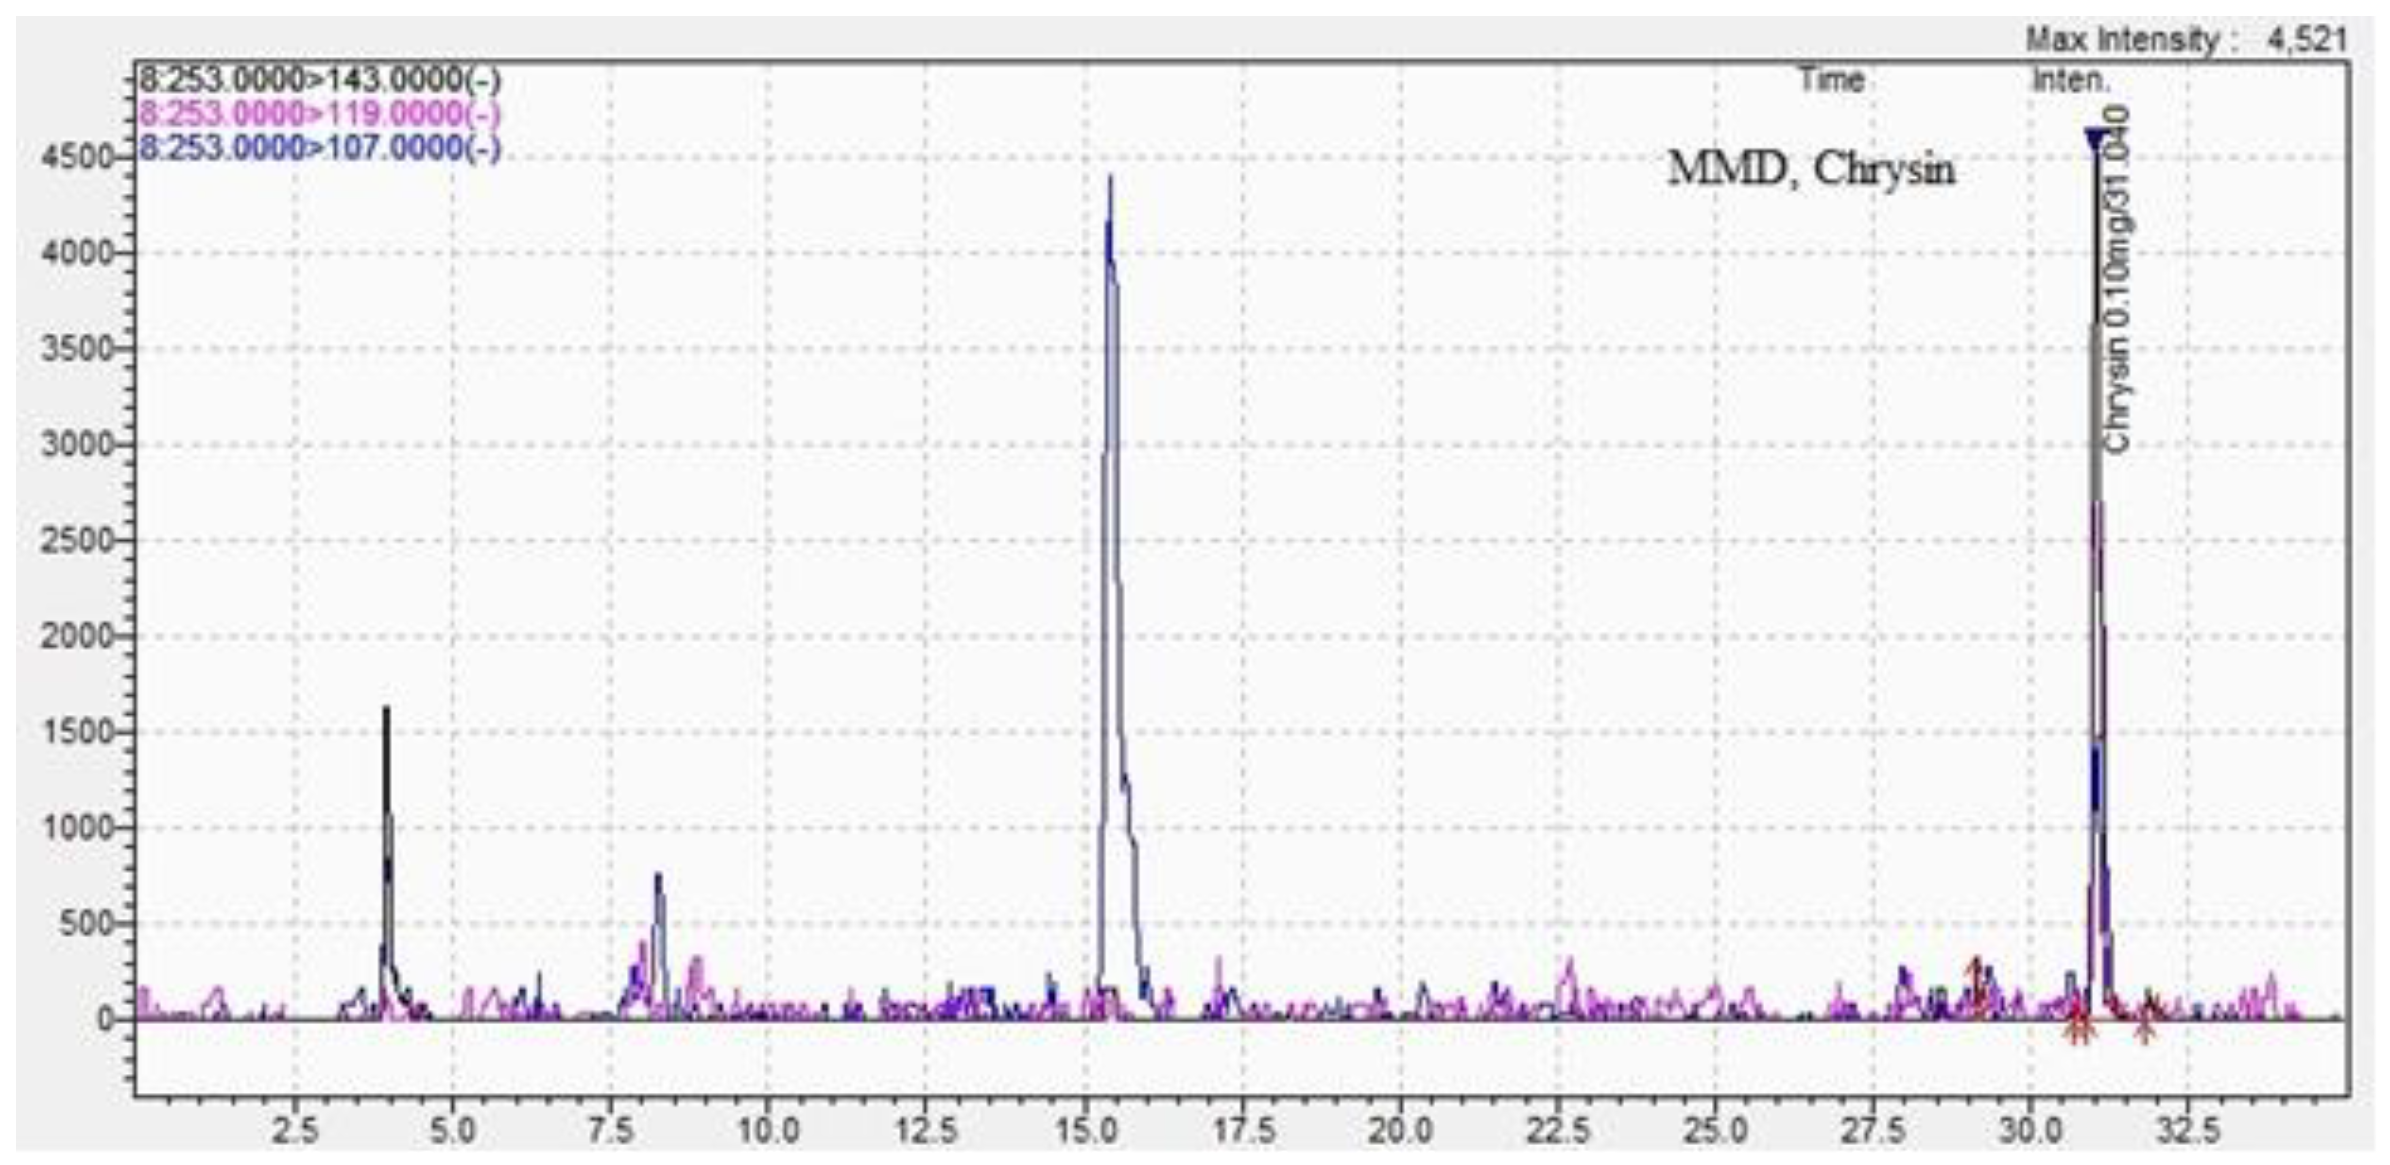
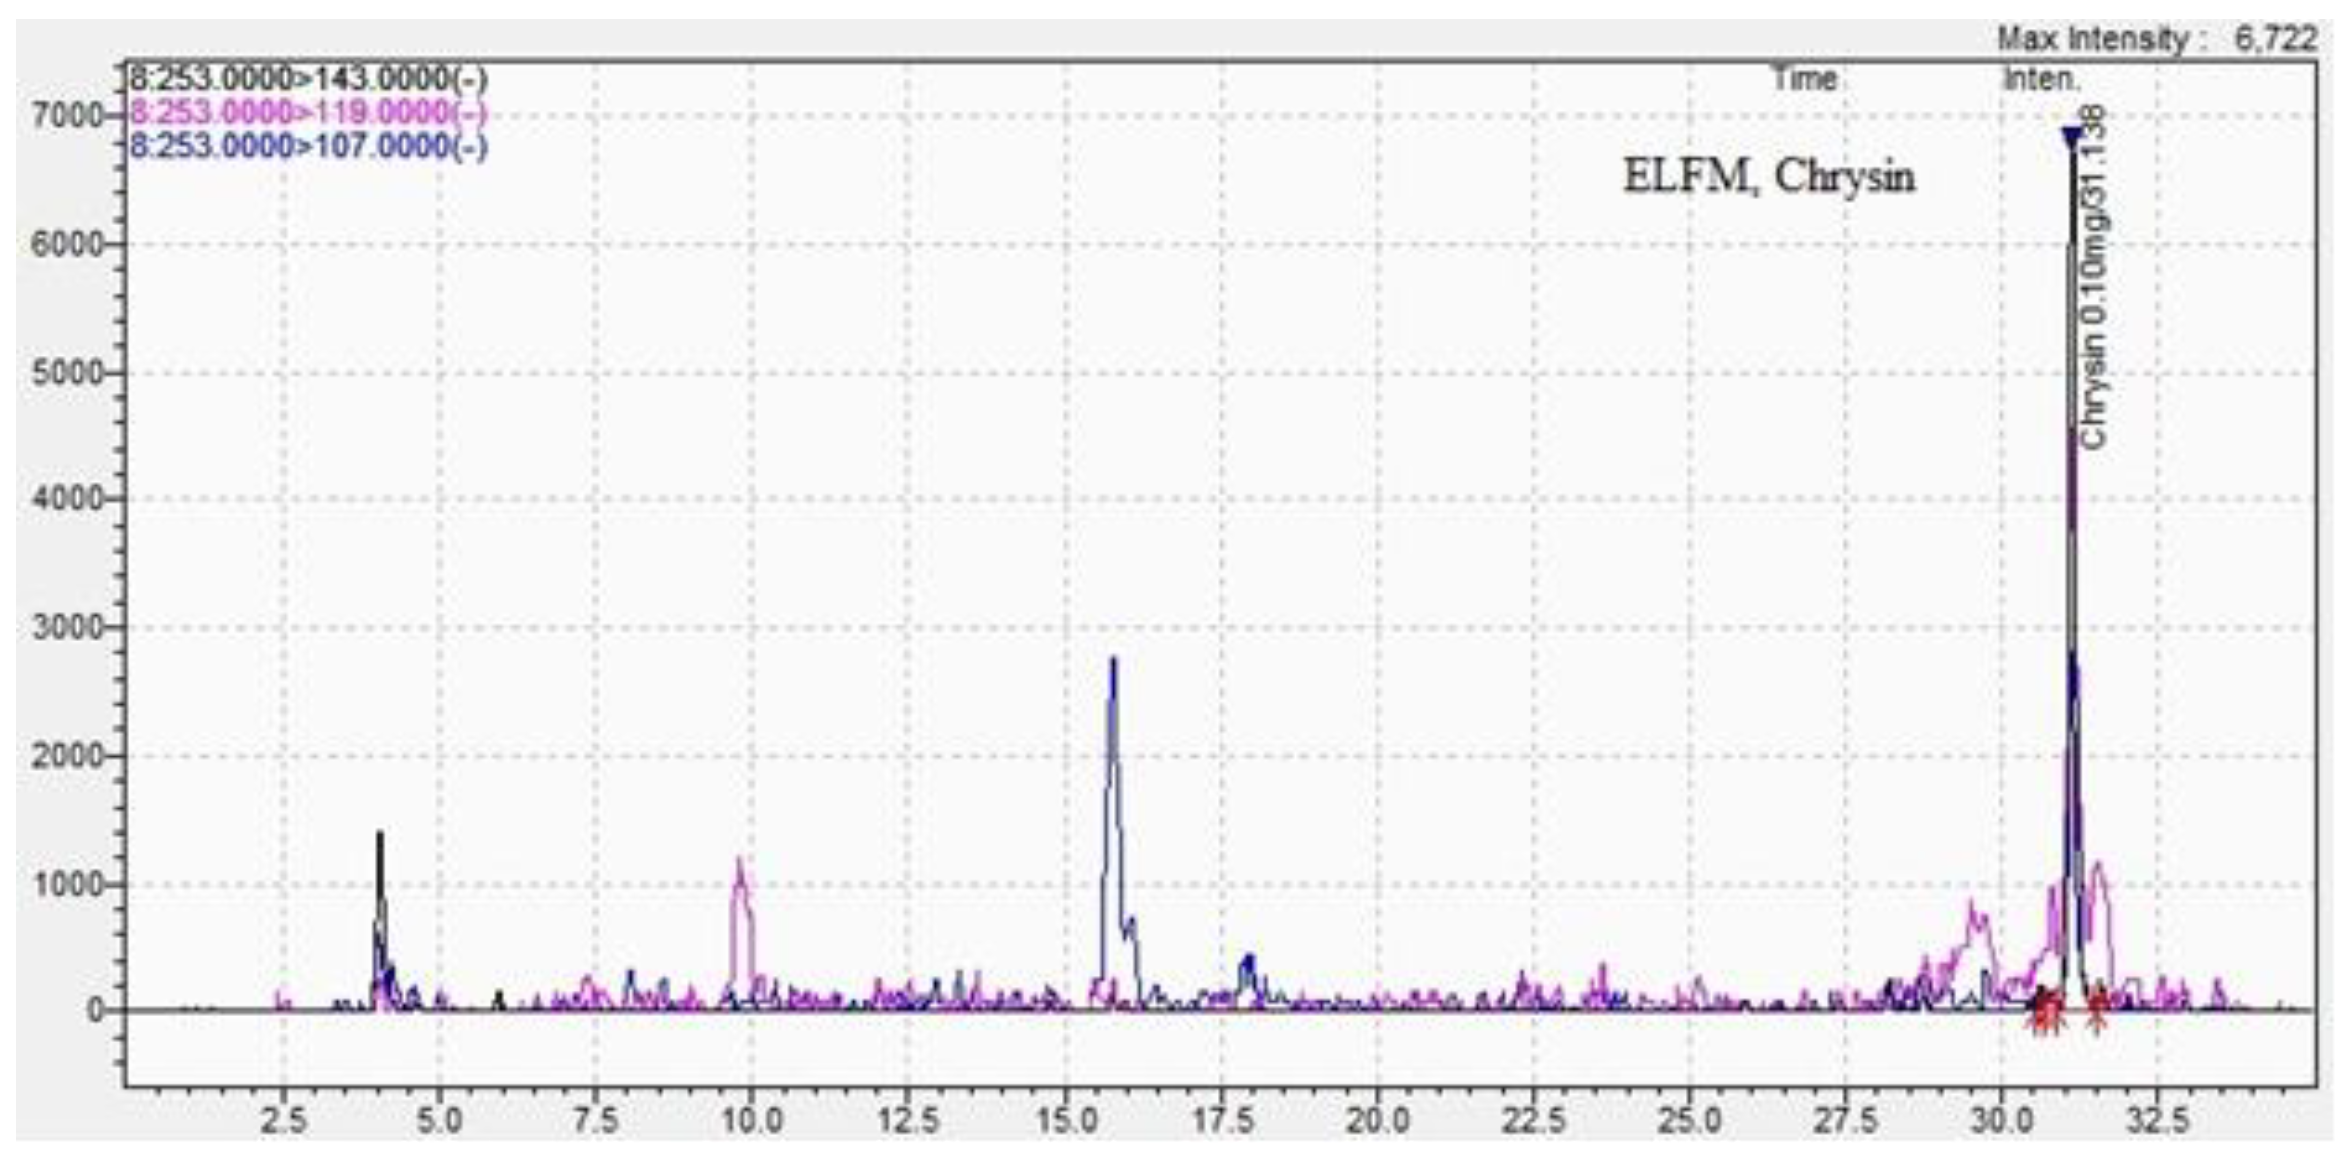
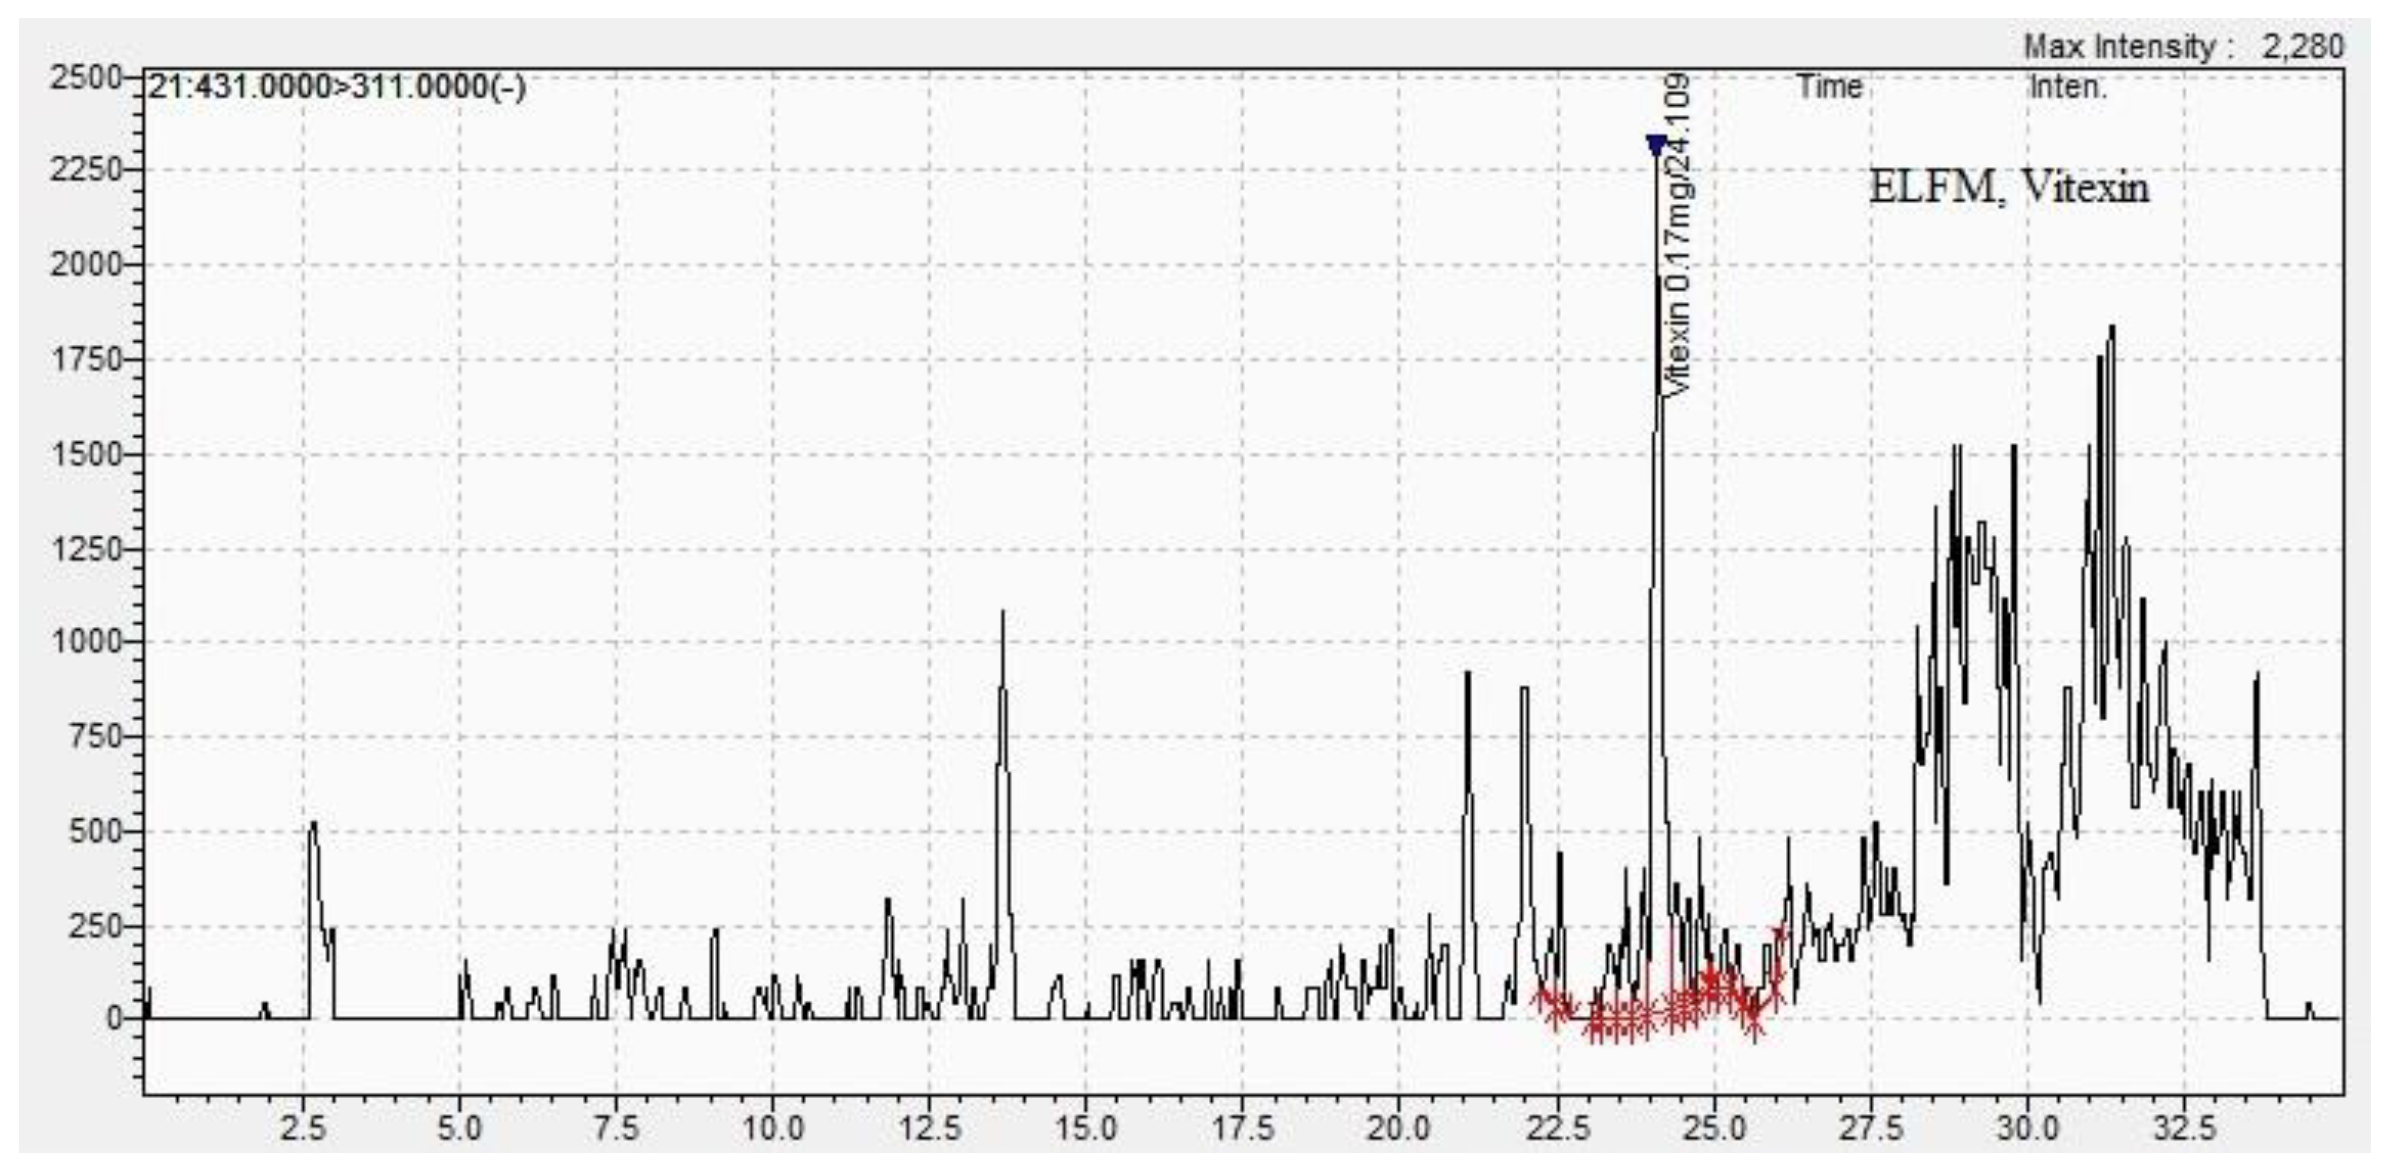
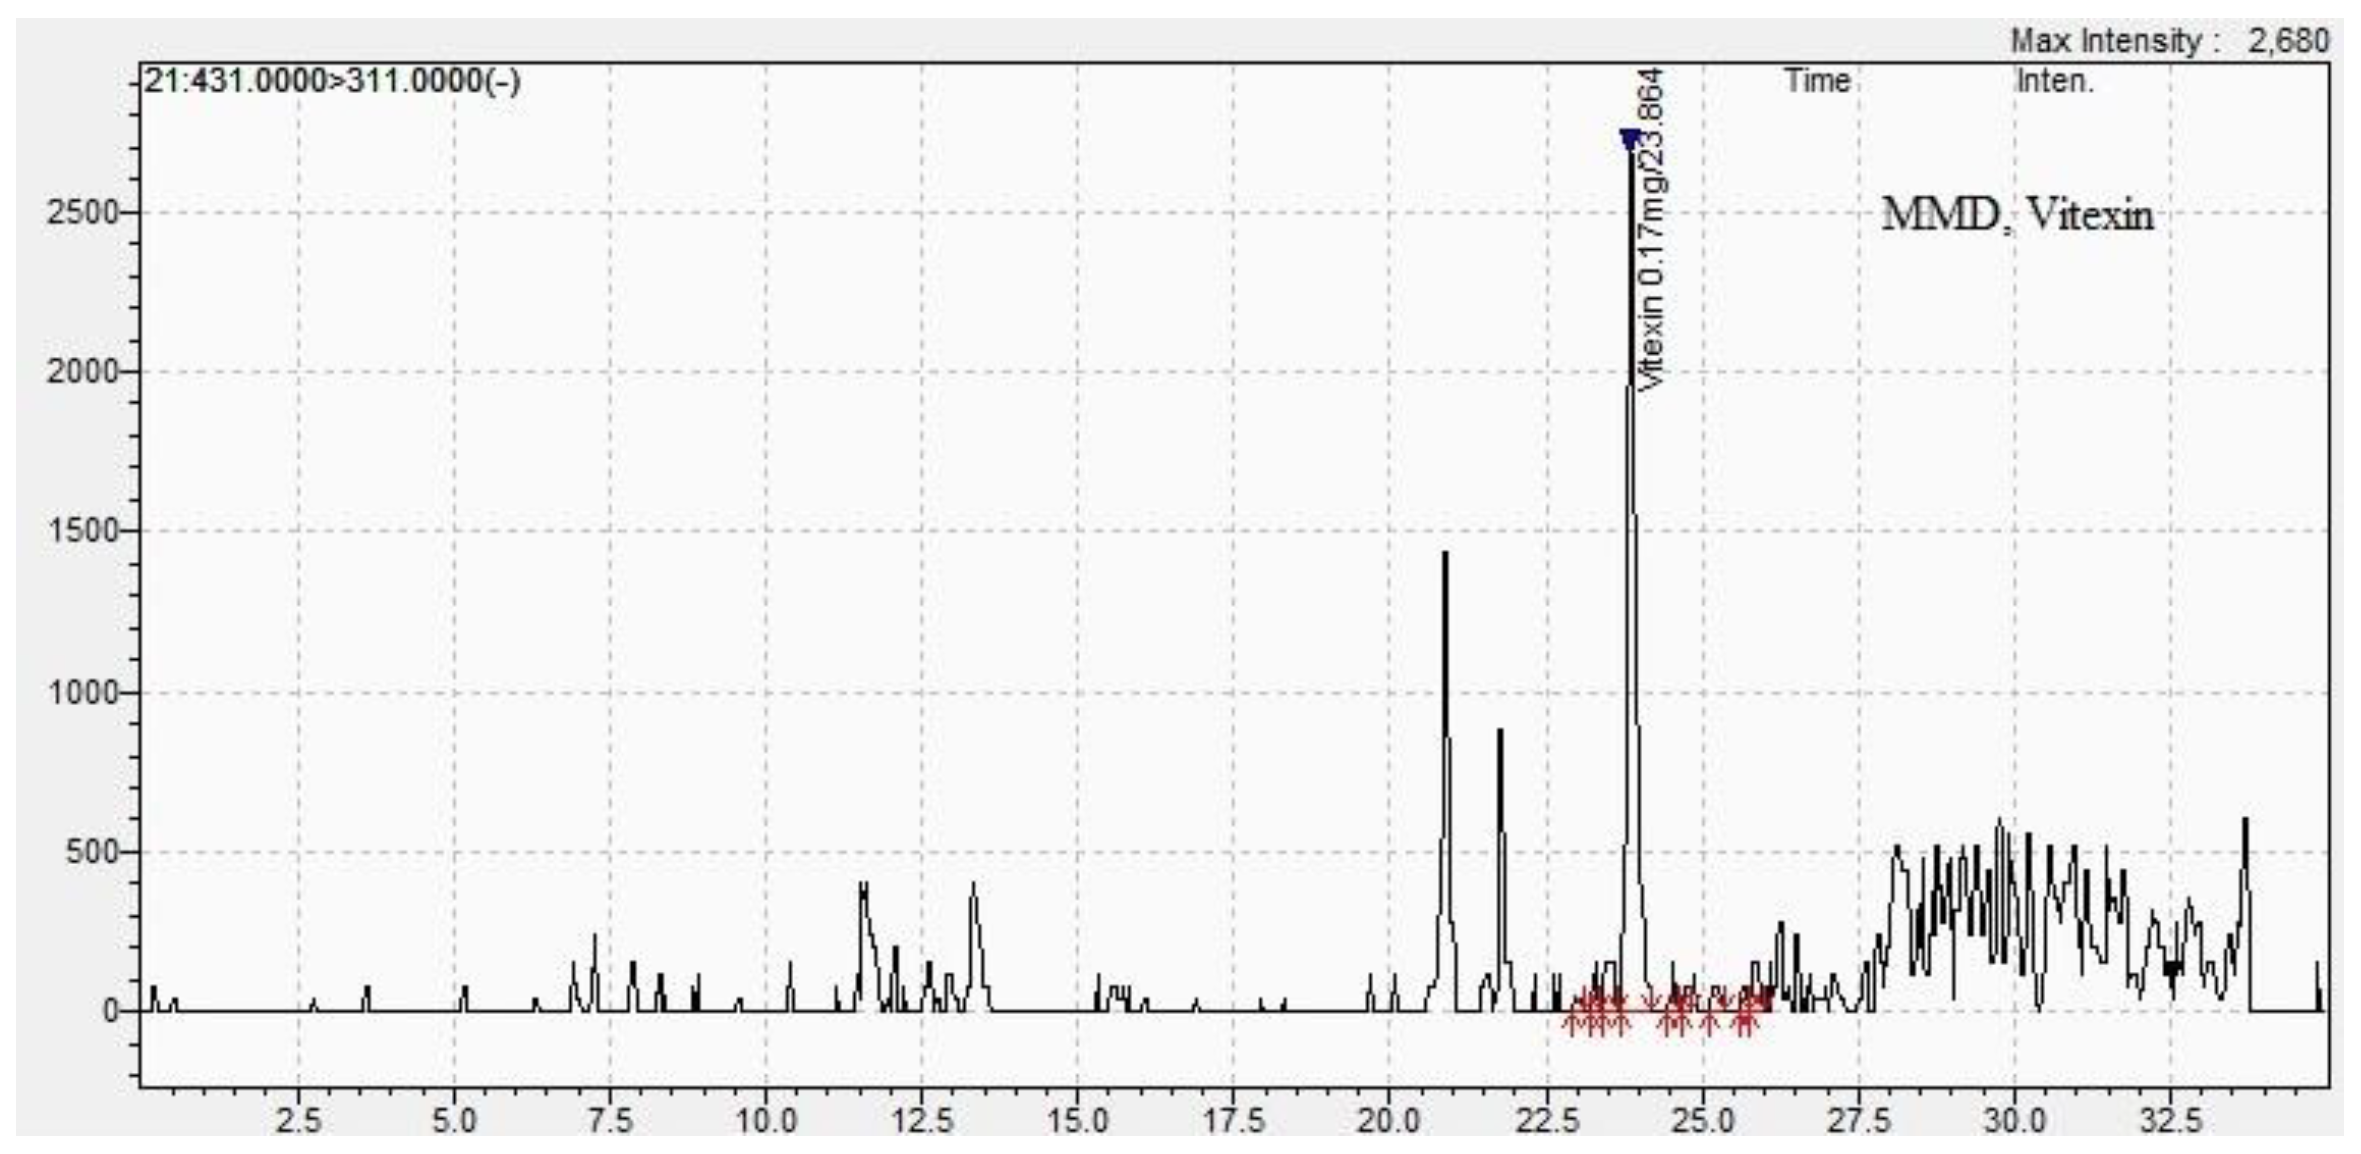
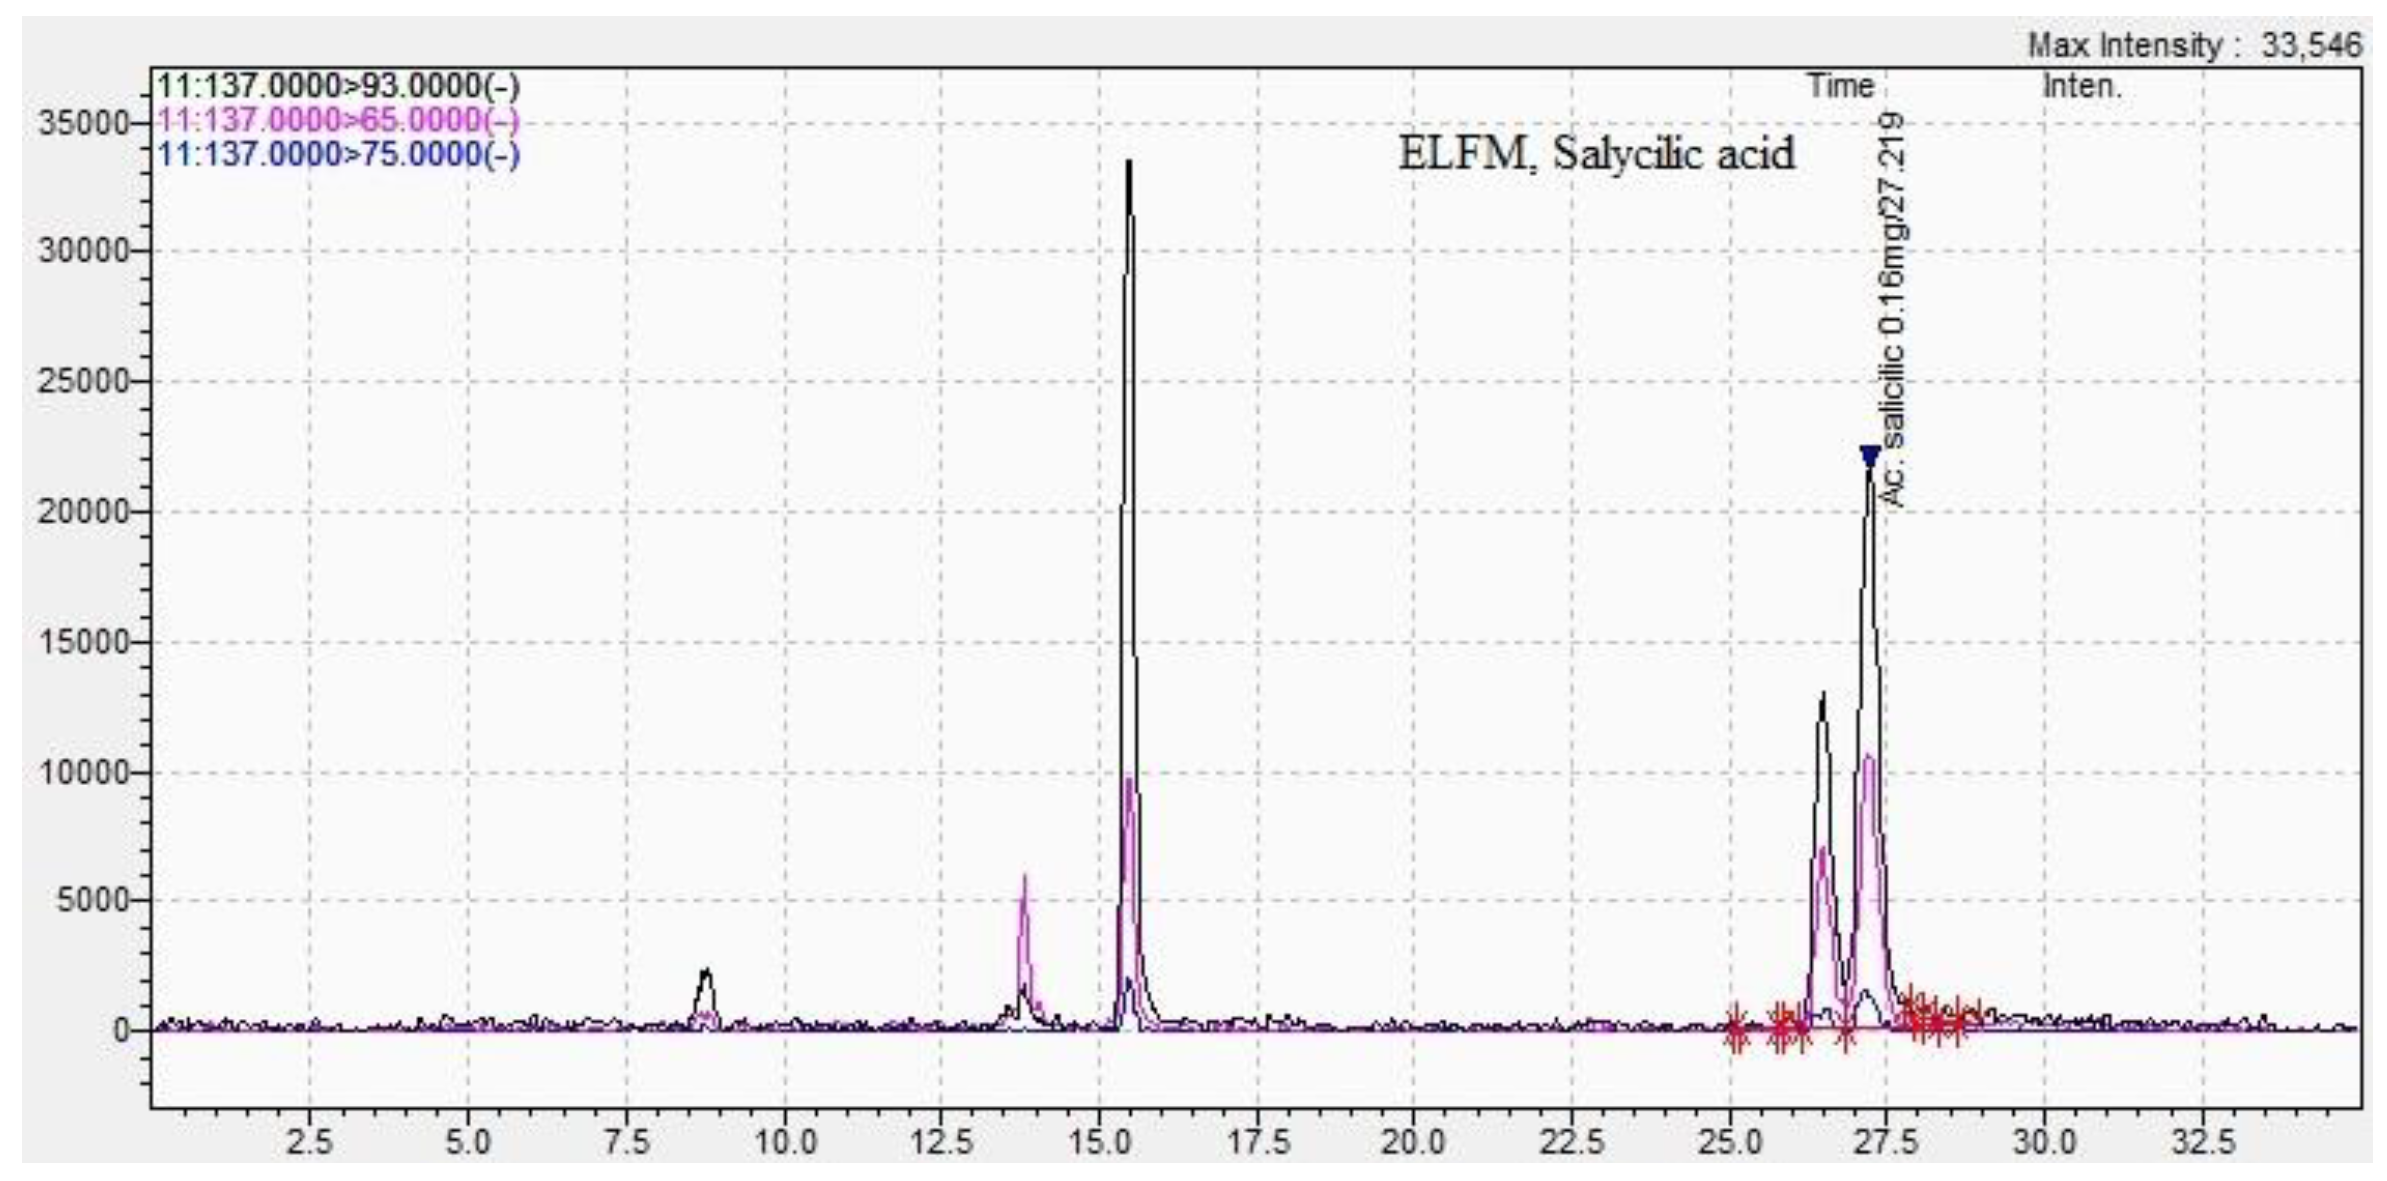
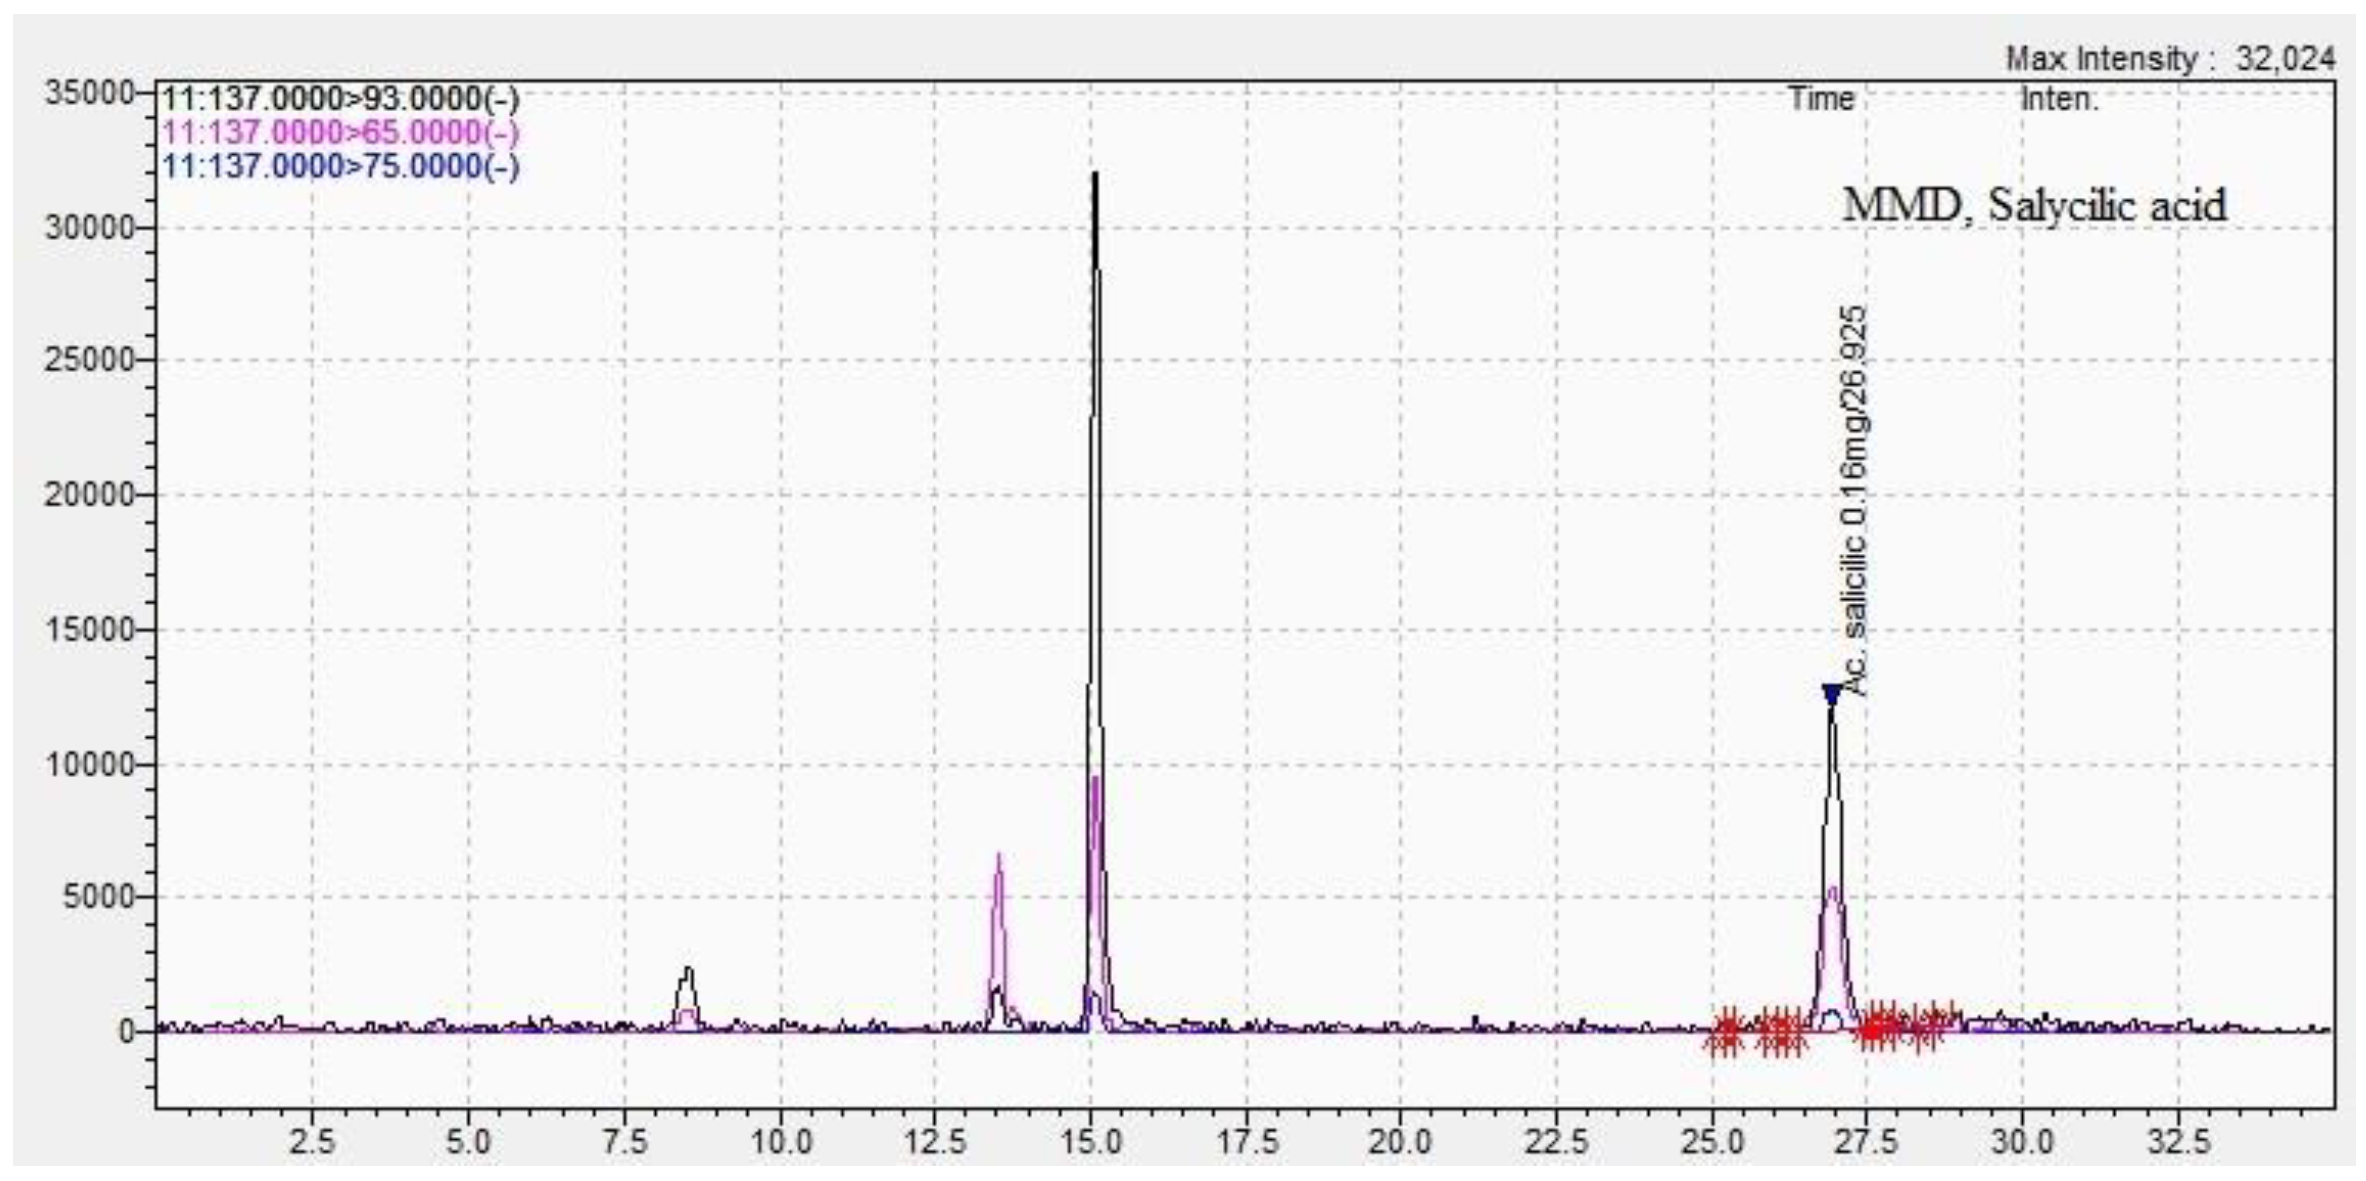
LC/MS analysis of the extracts from the coastal and mountain regions yielded significant results, which have been summarized in Table 3. Upon reviewing the data presented in Figure 4, Figure 5, Figure 6, Figure 7, Figure 8, Figure 9, Figure 10 and Figure 11, it is apparent that the peak resolution achieved was suitable for analysis. Moreover, the concentrations of Apigenin, Carnosol, and Chrysin were found to be the highest for both extracts, as per the calculated values, providing valuable insights into the composition of the ex-tracts and their potential applications in various fields.
Also, the LC/MS analysis was able to separate and identify additional bioactive compounds in Lonicera japonica extracts, namely gallic acid, 2-hydroxybenzoic acid, trans p-coumaric acid, carnosol, myricetin, vitexin, 4',5,7-trihydroxyflavone (apigenin), and 8-C-glucoside. These compounds have not been mentioned in the existing literature.
It was found that, except for gallic acid, rosmarinic acid, hyperoside, naringenin, and myricetin, all other compounds exhibited higher concentrations in the species harvested from the coastal area compared to the mountain area. This suggests that environmental factors play a role in the production of these compounds. Specifically, lower temperatures and heavier rainfall in mountain areas, in contrast to coastal areas, are the main climatic factors influencing the production of phenolic compounds in plant tissues [12,13].

2.4. GC/MS Analysis

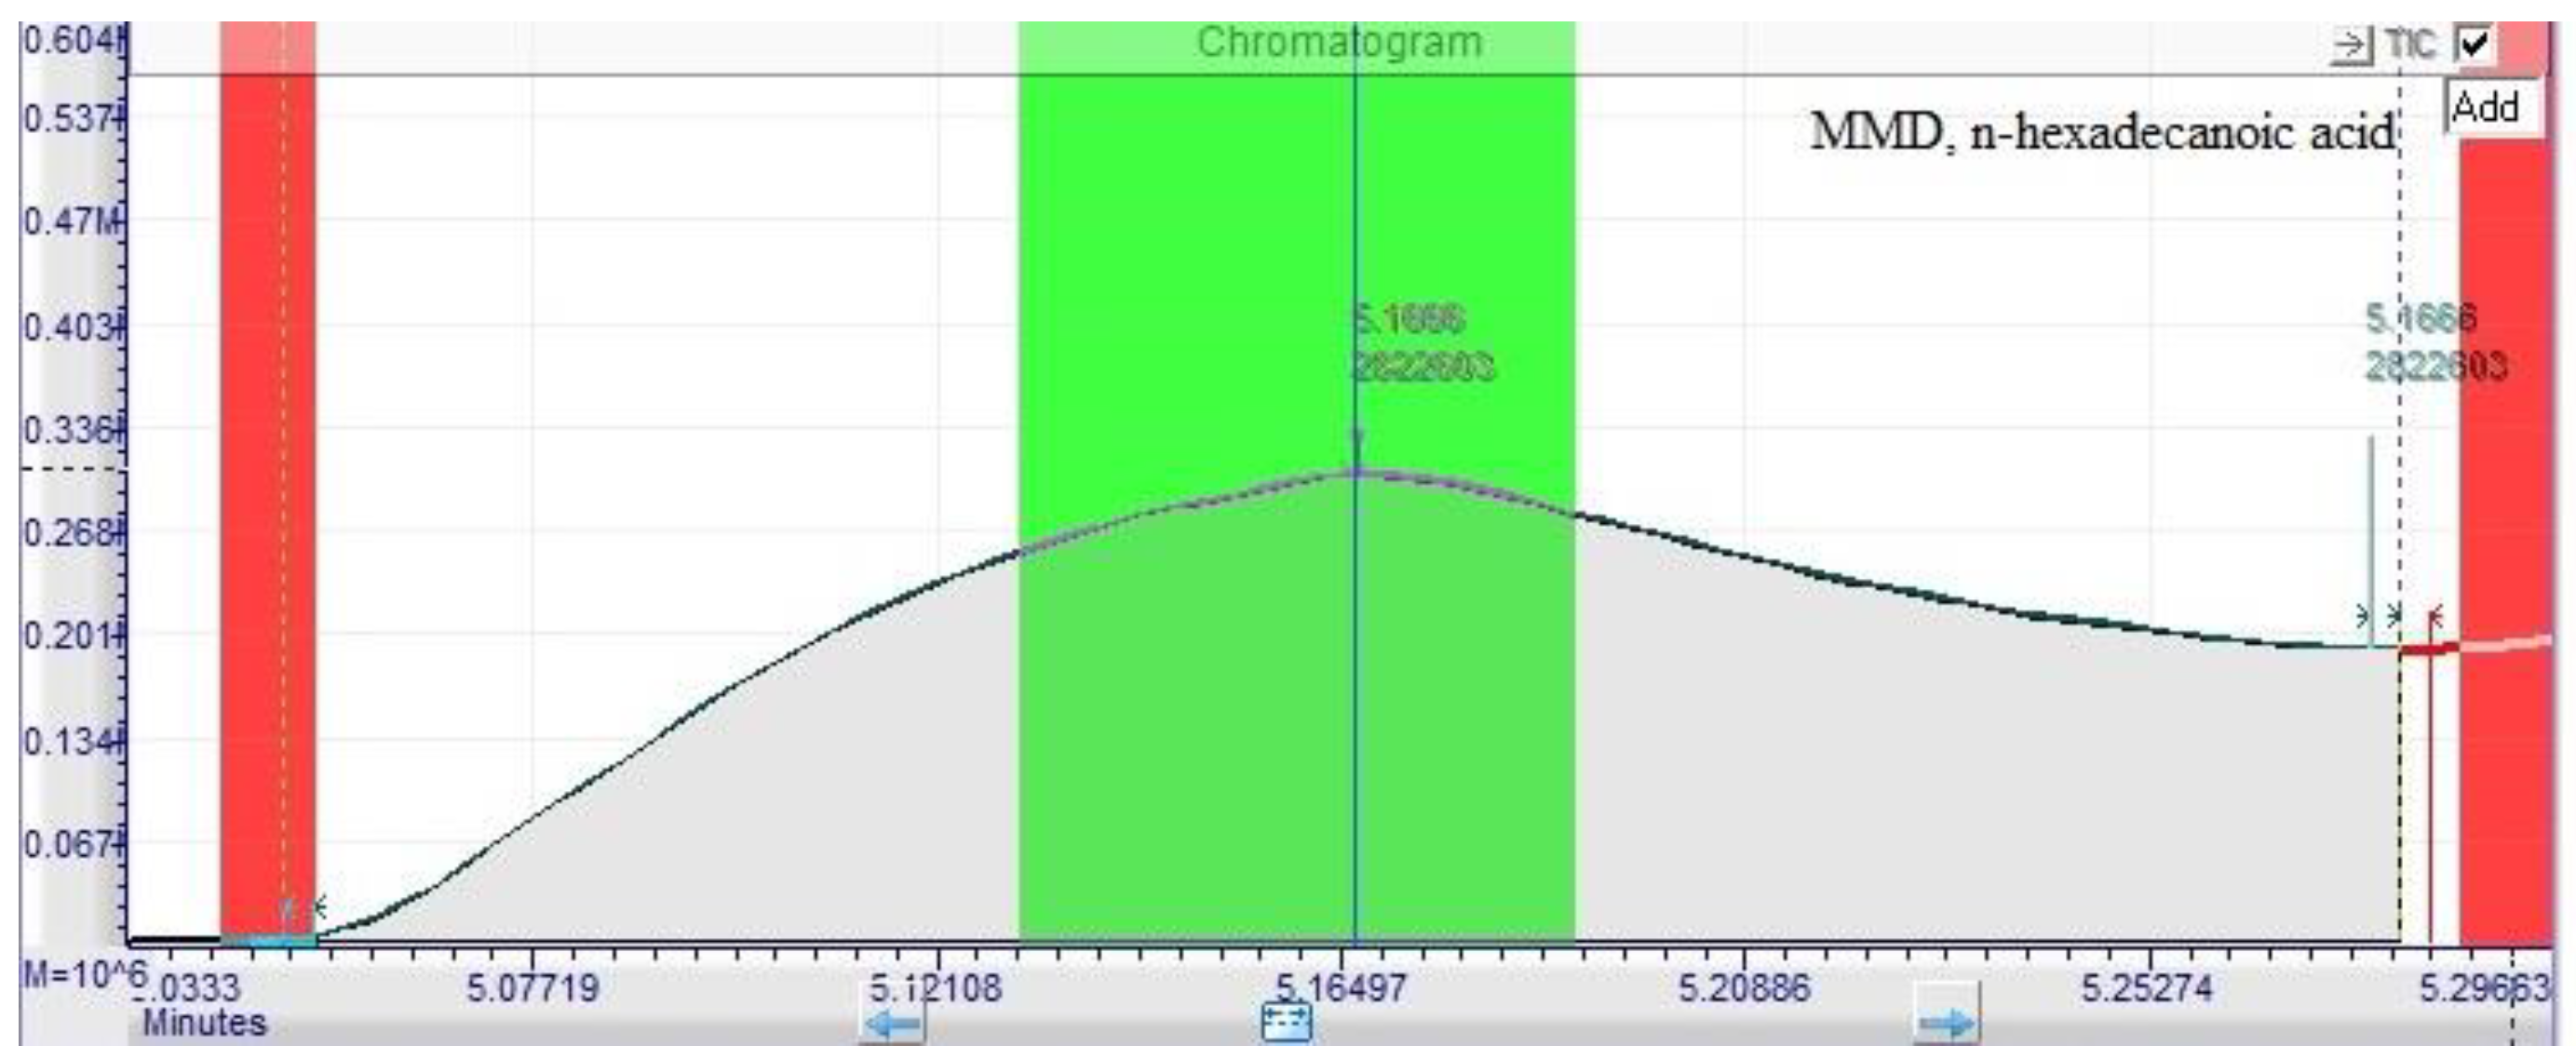
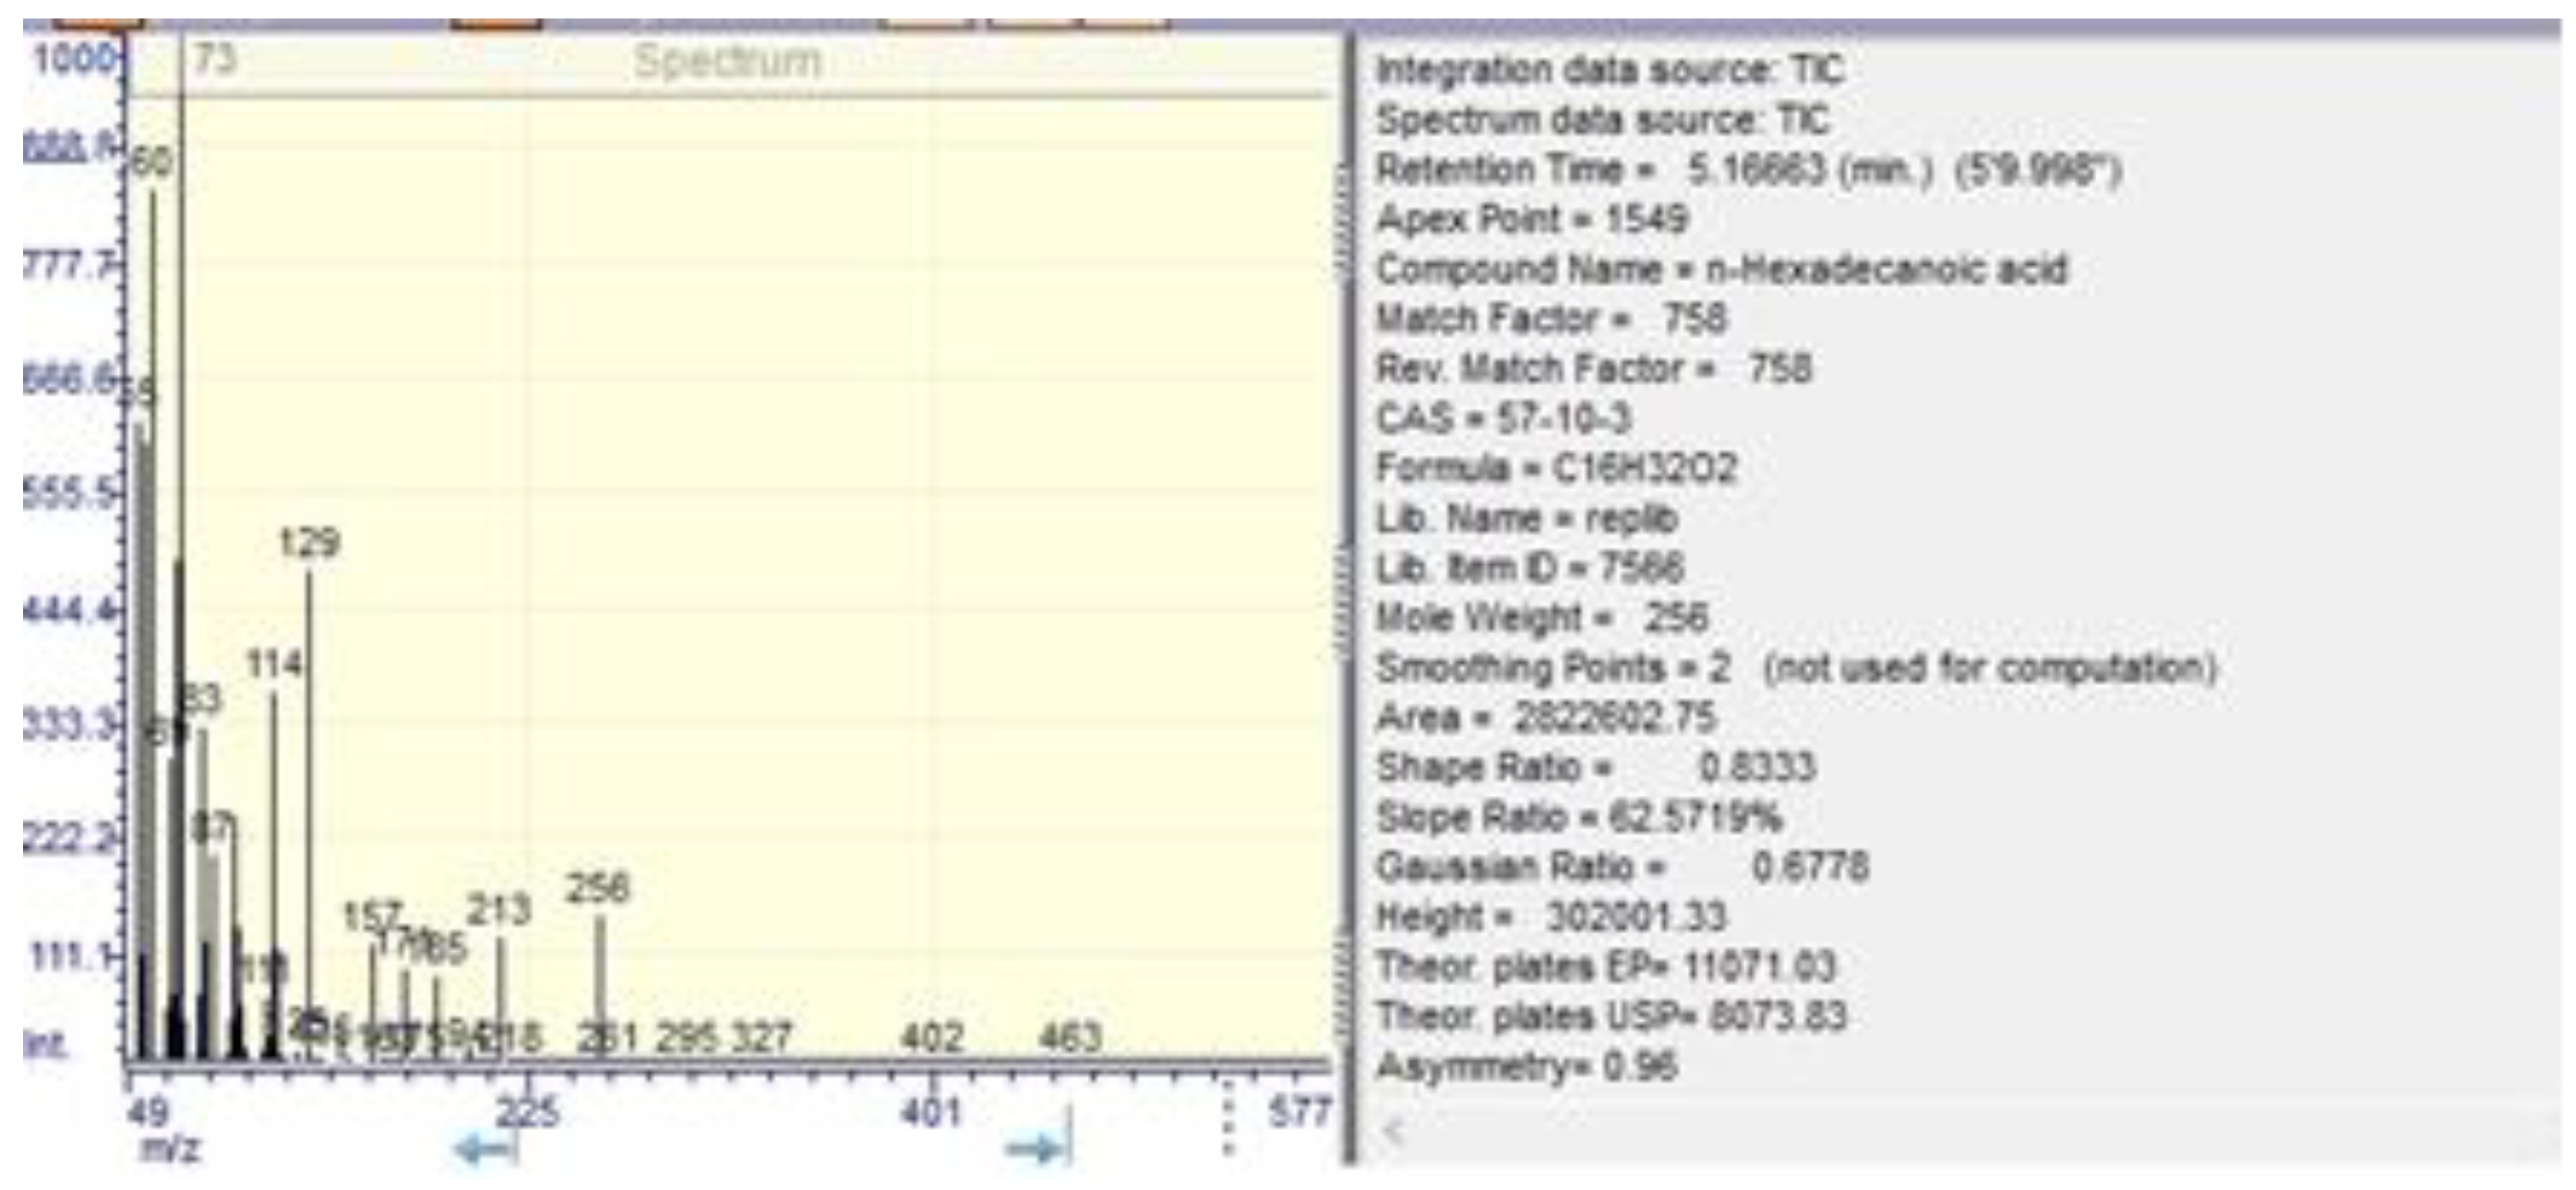
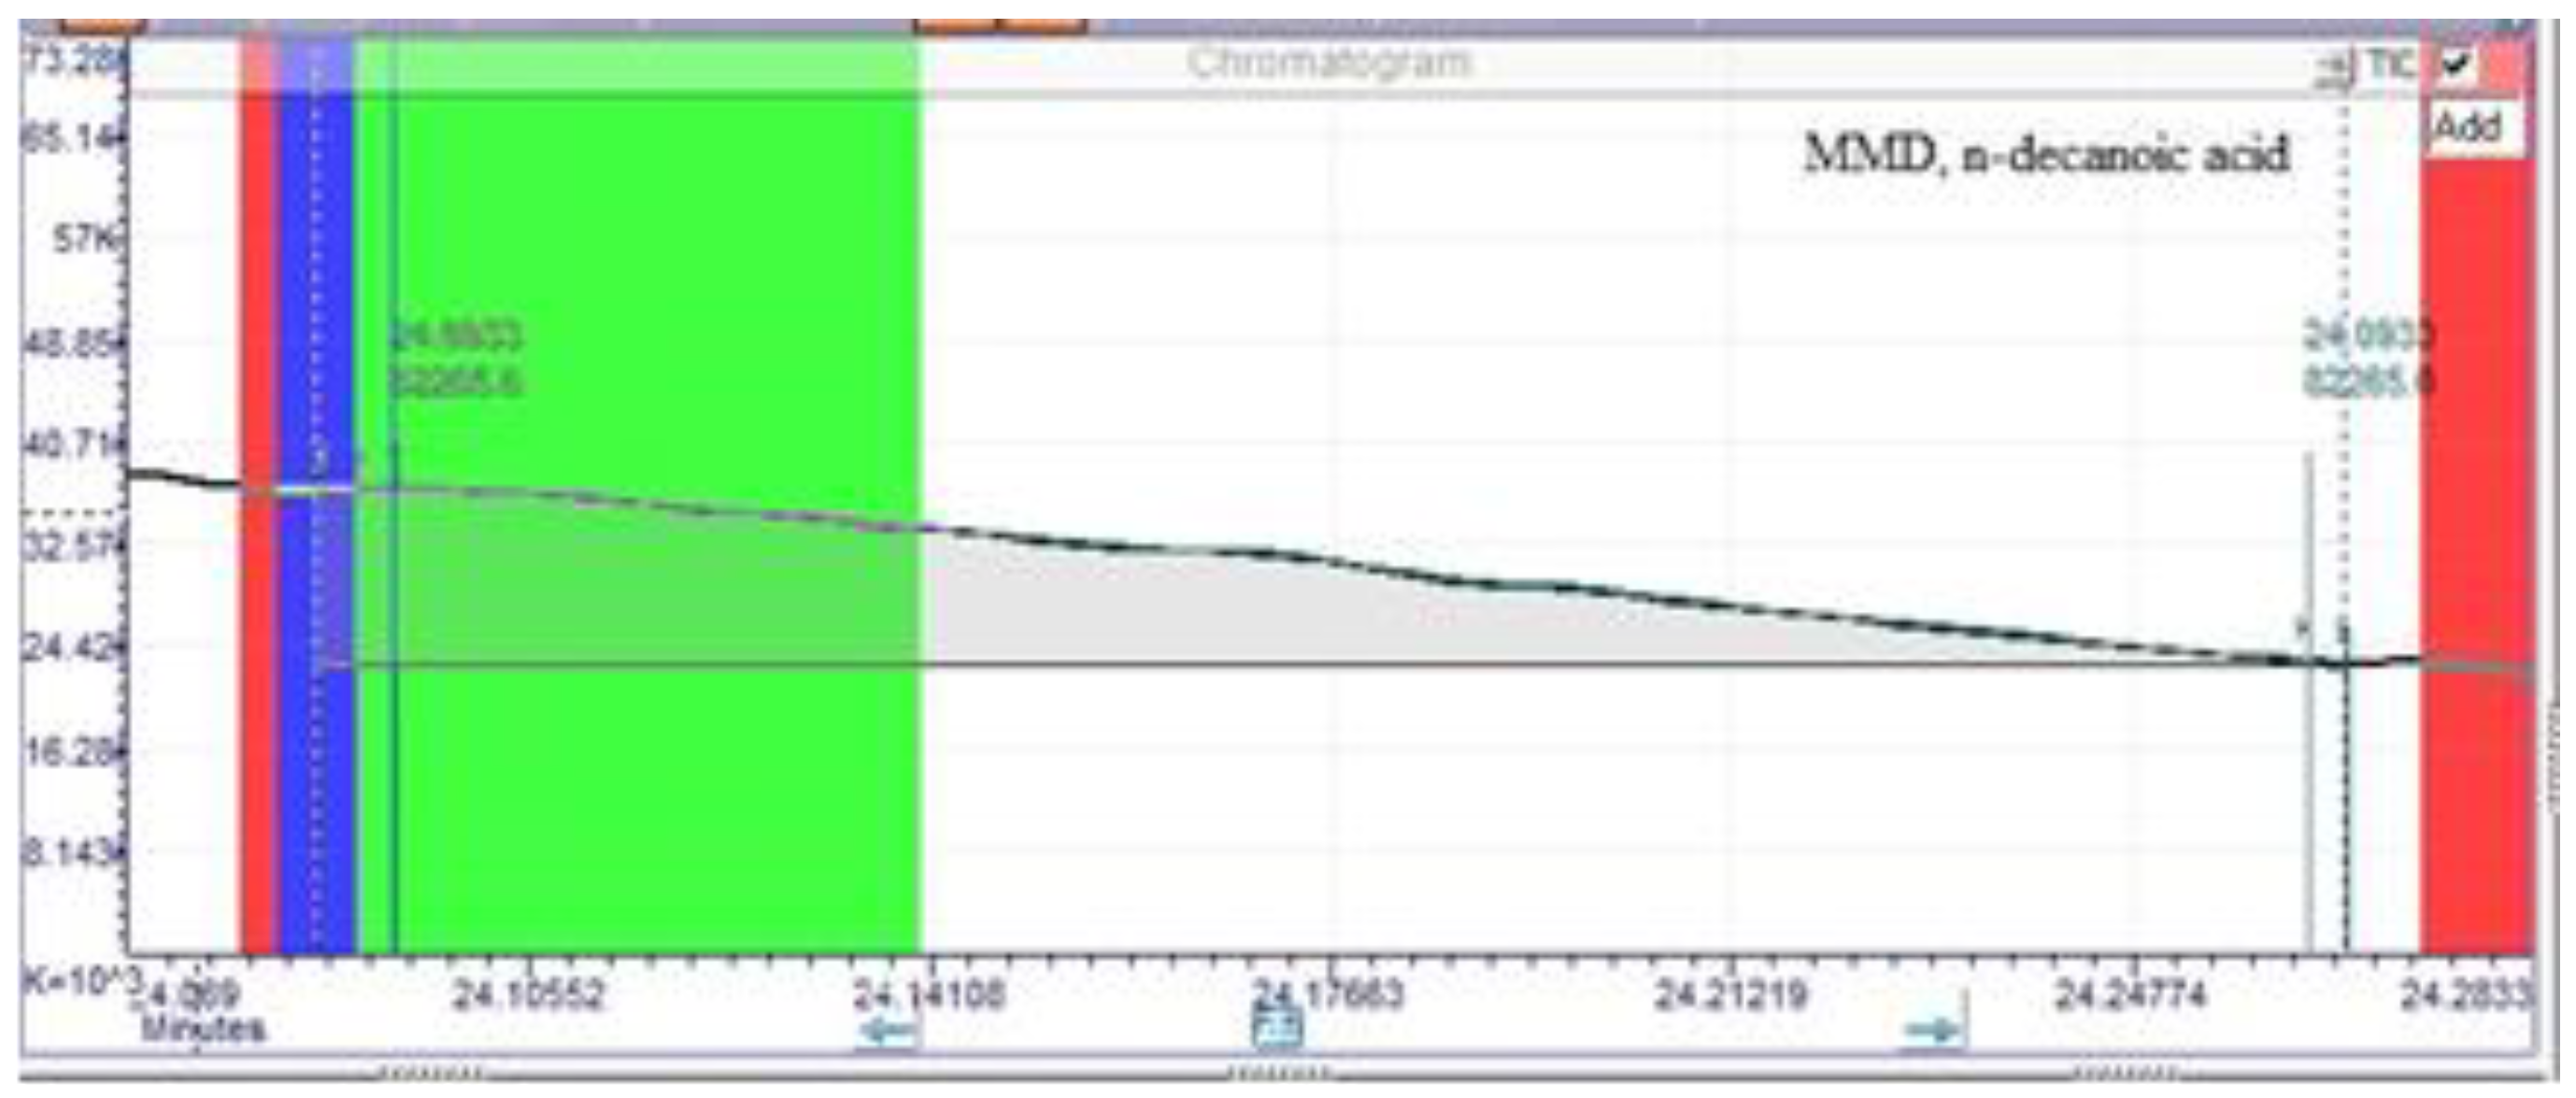
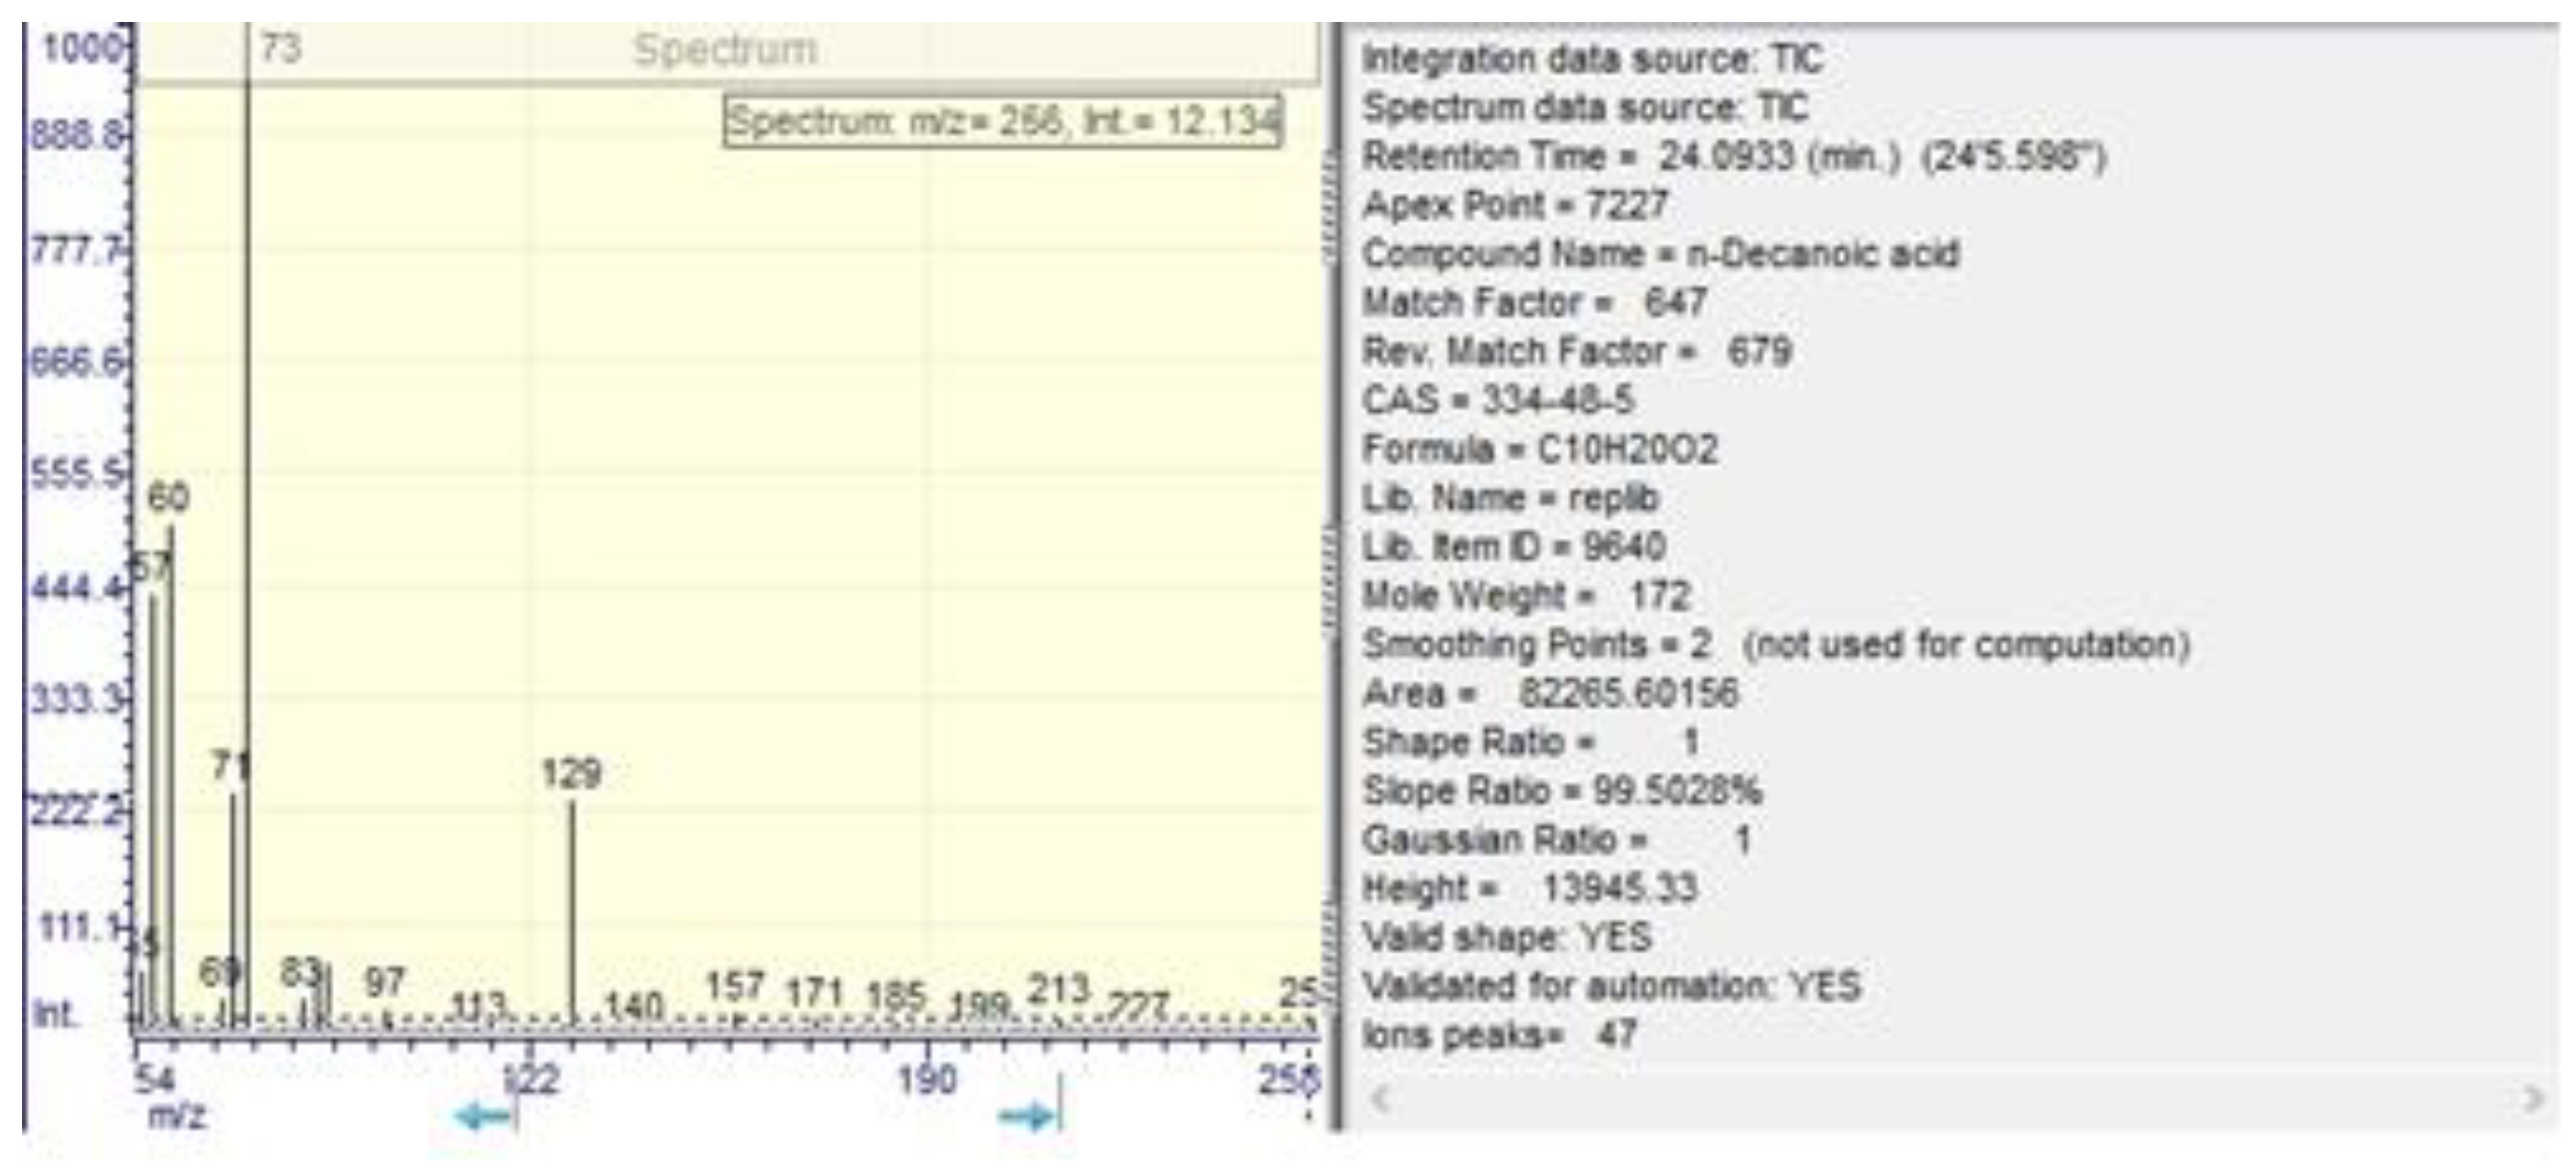
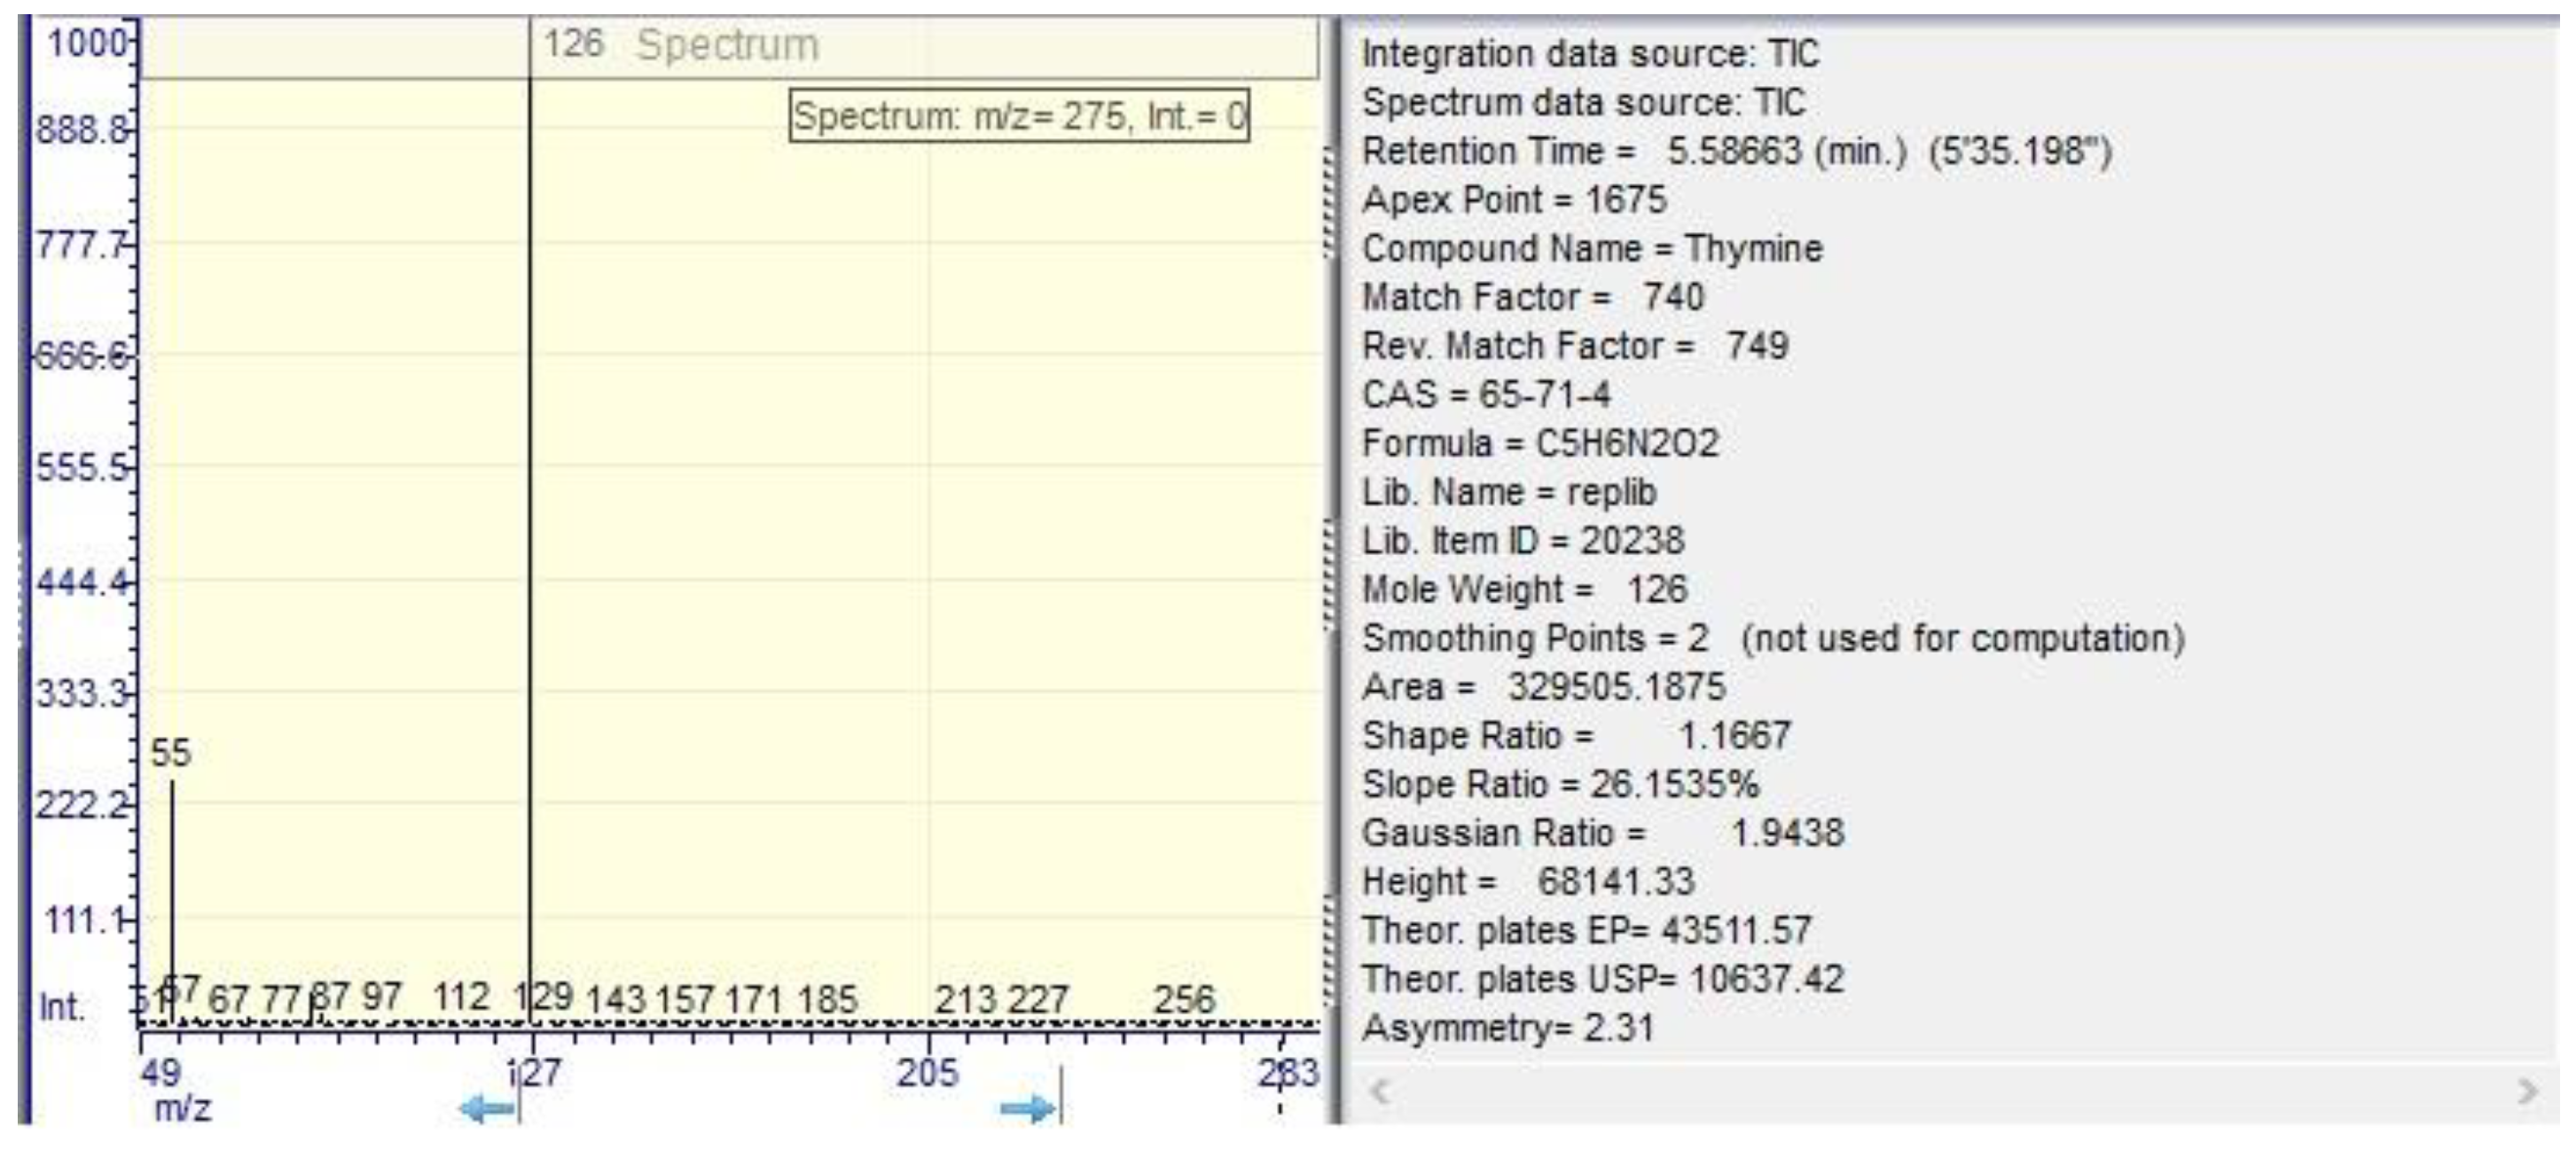
GC/MS analysis was carried out on the mountain extract, identifying three compounds with a high degree of certainty, as depicted in Figure 12, Figure 13, Figure 14, Figure 15, Figure 16 and Figure 17 . From these results, the presence of n-hexadecenoic acid, n-decanoic acid, and thymine can be observed with remarkable values compared to the literature [14,15], as shown in Table 4.

3. Discussion

The relationship between the content of phenolcarboxylic acids in Lonicera japonica Thunb. and climate has not been extensively explored in scientific literature. However, climate can indirectly impact the phenolcarboxylic acid content by influencing plant growth, physiology, and secondary metabolism [16]. Various climate factors such as temperature, sunlight, rainfall, soil moisture, and stress factors can affect the content [17] or the phenolcarboxylic acid content [17,18,19]. Drought, extreme temperatures, and high humidity can induce stress responses in plants, triggering the synthesis of phenolcarboxylic acids as defense mechanisms against environmental stressors [20,21]. Additionally, the soil composition, with coastal areas having chalky soil and mountainous regions having acidic soil, can partially explain the observed differences in phenolcarboxylic acid content [22].
Overall, studies have suggested that plants cultivated in mountainous regions may possess greater antioxidant capacity compared to those in coastal areas, attributed to variations in sunlight intensity, climate, soil composition, and altitude. Previous research has explored the antioxidant capacity of Lonicera japonica species but without specific comparisons between harvesting areas and the antioxidant potential of the species. Antioxidant capacity is associated with secondary metabolites, including phenolic compounds, flavonoids, aromatic compounds, and compounds with hydroxyl groups [9,11,23,24,25].
In literature, several studies have mentioned the separation and quantitative determination of various compounds in the Lonicera species. Caffeic acid has been mentioned in studies conducted by Wang et al. [3], Chaowuttikul et al. [26], Li et al. [27], and Tang et al. [9]. Chlorogenic acid has been studied by Wang et al. [9], Lin et al.[5], Chaowuttikul et al. [26], Liu [28], Cai et al. [29], and Tang et al. [9]. Rosmarinic acid has been investigated by Chaowuttikul et al. [26], while apigenin has been mentioned in studies by Wang et al. [3] and Cai et al. [29]. Arbutin has been studied by Wang et al. [3], hesperidin by Hsu et al. [4], and hyperoside by Cai et al. [29] and Li et al. [27]. Kaempferol has been analyzed by Cai et al. [29] and Shang et al. [30], luteolin 7-O-glucoside by Li et al. [31], and luteolin by Lin et al. [5], Tang et al. [9], Liu et al. [22], Cai et al. [29]), and Hsu et al. [4]. Naringenin has been mentioned by Li et al. [31], quercetin by Tang et al. [9], and Shang et al. [30]. 6,7-dihydroxycoumarin has been identified in other Lonicera species by Xiang et al. [32], and chrystin has been identified in the leaves of the species, but not in flowers, by Kumar et al. [33].
Extracts obtained from both coastal and mountainous regions of Lonicera japonica Thunb. were subjected to analysis using three distinct solvents to evaluate their content of polyphenols, flavonoids, and phenol carboxylic acids. The results revealed a higher concentration of polyphenols and flavonoids in the coastal extracts, whereas the mountain extracts exhibited a higher content of phenol carboxylic acids. These findings are consistent with previous research that has observed variations in the phytochemical composition of Lonicera japonica Thunb. extracts derived from different regions and employing diverse extraction methods.
The findings strongly indicate the potential use of these extracts in the treatment of pathological conditions associated with oxidative stress. Moreover, a notable correlation between the antioxidant activity of these extracts and their polyphenolic composition has been revealed. In-depth analysis employing LC/MS and GC/MS techniques has unveiled the presence of several compounds, including Apigenin, Carnosol, Chrysin, n-hexadecenoic acid, n-decanoic acid, and thymine, which exhibit promising therapeutic effects. These results are consistent with previous studies that have identified similar compounds in extracts derived from Lonicera japonica Thunb.
Additionally, the outcomes derived from the LC/MS and GC/MS analyses provide compelling evidence supporting the abundance of bioactive compounds in Lonicera japonica Thunb., thus underscoring its potential as a valuable natural source of antioxidants and anti-inflammatory agents. These findings open up promising avenues for further exploration of the therapeutic properties associated with this particular plant species.

4. Materials and Methods

4.1. Plant Material and Reagents

The flowers of Lonicera japonica Thunb. were collected from two distinct geographical locations in Romania, namely the mountainous region of Făgăraș (geographic coordinates: eastern longitude 24º58’17”, northern latitude 45º50’32”), samples named MMD (mountains region flowers) and the coastal area of Constanța (geographic coordinates: east longitude 28°38’18”, north latitude 44°10’24”), samples named EFLM (coastal region flowers). The flowers of Lonicera japonica Thunb. were gathered in September 2023 from the mountainous location and in July 2023from the coastal region, followed by drying under controlled humidity of 50% in the dark until a constant weight was achieved. The plants were identified at the Pharmacognosy, Phytochemistry, and Phytotherapy Department of the Faculty of Pharmacy, and a voucher specimen was deposited at the Laboratory.
The dried flowers were extracted by refluxing for 30 minutes using ethanol of 20%, 50%, and 70% (v/v). The hydroalcoholic extracts, with a concentration of 25 mg/mL, were preserved in borosilicate glass containers at 2-8°C until further analysis. Merck Romania SRL, a subsidiary of Merck KGaA, Darmstadt, Germany, was consulted to provide reference compounds of gallic acid, quercetin, and chlorogenic acid for comparison purposes in the evaluation of total phenolic content, total flavonoid content, phenol carboxylic acids, respectively. Six extracts were prepared: three hydroalcoholic extracts of Lonicera flowers collected from the mountainous location with 20%, 50%, and 70% ethanol (v/v), and three hydroalcoholic extracts of Lonicera flowers collected from the coastal area with 20%, 50%, and 70% ethanol (v/v).
Based on the results, the hydroalcoholic extract with 70% ethanol concentration exhibited the most favorable balance of polyphenols, flavonoids, and carboxylic acids and was therefore selected for further investigation. The MMD (mountain region flowers) extract and the EFLM (coastal region flowers) extract underwent lyophilization and were analyzed via liquid chromatography/mass spectroscopy (LC/MS) and gas chromatography-mass spectrometry (GC/MS). Additionally, the DPPH and CUPRAC methods were employed to determine the total antioxidant activity of the extracts.

4.2. Total Phenolic Content

The total phenolic content of the hydroethanolic extract was determined using a modified version of the method described by Mihai et. al. [34] as a quick and easy way to determine the TPC of a wide variety of materials, including plant extracts.
Briefly, six dilutions of gallic acid (50, 75, 100, 150, 250, and 500 µg/mL) were prepared in hydroalcoholic solvent and the absorbance of each dilution was measured at 760 nm using a UV-Vis spectrophotometer (UV-6300PC, VWR, Wien, Austria) to draw a standard curve. The plant extract was assayed using the same procedure, with 100 µL of the extract being vortexed with 500 µL of double distilled water and 100 µL of Folin-Ciocâlteu reagent, and the resulting mixture being incubated for 6 minutes. 1 mL of 7% sodium carbonate and 500 µL of double distilled water were then added to the reaction mixture and allowed to stand at room temperature for 90 minutes. The absorbance of the samples was measured at 760 nm, and the total phenolic content was calculated as gallic acid equivalents (µg/mL). The assay was performed in triplicate, and all results are reported as mean ± standard deviation.

4.3. Total Flavonoid Content

To accurately determine the total flavonoid content of a plant extract, the method described by Mihai et al. [34] was employed. This method used quercetin as a reference compound, which allowed for the results to be expressed as quercetin equivalents present in the sample.
Briefly, a standard solution of quercetin was prepared by dissolving 1 mg of quercetin in a hydroalcoholic solvent. From this solution, five dilutions were prepared at concentrations of 50, 250, 500, 750, and 1000 µg/mL. 100 μL of each standard sample was added to 500 μL of double distilled water and 100 μL of a 5% sodium nitrate solution. The mixture was vortexed for 2 minutes and then incubated for 6 minutes. After the incubation period, 150 μL of a 10% aluminium chloride solution was added and allowed to react with the solution for 5 minutes. Finally, 200 µL of a 1M sodium hydroxide solution was added, and the absorbance was measured at 510 nm using the spectrophotometer. The absorbance of each dilution was measured at 510 nm using a UV-Vis spectrophotometer. The same working protocol was applied to all plant extracts.
The total flavonoid content of the plant extract was then calculated based on the standard curve created using the dilutions of quercetin. All experiments were performed in triplicate, and the results were reported as the mean ± standard deviation.

4.4. Phenol Carboxylic Acid Content

The phenol carboxylic acid content of the plant extract was determined using a method in which chlorogenic acid served as the reference compound [35].
To begin the assay, a standard solution of chlorogenic acid was prepared by dissolving 1 mg of the compound in a hydroalcoholic solvent. From this solution, six dilutions were made at concentrations of 0.25, 0.5, 0.625, 1.25, 2.5, and 3.5 µg/mL.
To perform the assay, 1 mL of each dilution was mixed with 1 mL of 0.5 M HCl, 1 mL of Arnow Reagent, 1 mL of 1 M NaOH, and 1 mL of double distilled water. The mixture was vortexed and allowed to react for 5 minutes. The absorbance was then measured at 510 nm using a UV-Vis spectrophotometer.
The plant extract was then subjected to the same assay conditions, and the absorbance was measured at 510 nm. The phenol carboxylic acid content of the plant extracts was calculated based on the standard curve drawn using the dilutions of chlorogenic acid. The results of the assay were expressed as the chlorogenic acid equivalents. All experiments were performed in triplicate, and the results were reported as the mean ± standard deviation.

4.5. DPPH Antioxidant Assay

The antioxidant assay was conducted using the method proposed by Brand-Williams et. al. with slight alterations [36].
Briefly, a solution of 25 mM 1,1-diphenyl-2-picrilhidrazil (DPPH) in methanol was prepared and mixed with samples plant extract of varying concentrations. These samples were prepared by diluting a stock solution. Three different dilutions were prepared, with volumes of 0.3 mL, 0.6 mL, and 0.9 mL of the stock solution being brought to a total volume of 10 mL with methanol. These dilutions were then mixed with 5 mL of the 25 mM DPPH solution, resulting in a final volume of 10 mL. The mixtures were placed in a water bath for incubation at 40°C for 30 minutes.
The blank solution was prepared by mixing 5 mL of the 25 mM DPPH solution with 5 mL of methanol. This reference solution is used as a baseline for comparison to the samples, and its absorbance is measured at 517 nm using a spectrophotometer.
After the incubation period, the absorbance of the samples and the blank solution were measured and used to calculate the percentage inhibition of the free DPPH free radical. The percentage inhibition (I%) is calculated using the following equation:
% I = A r A s A r · 100   ,
where Ar is the absorbance of the blank solution and As is the absorbance of the samples. By plotting the concentration versus percentage inhibition, the concentration of the antioxidant required to inhibit 50% of the DPPH radical (IC50 value) was determined.

4.6. CUPRAC Antioxidant Assay

The CUPRAC assay was performed using the method proposed by Ozyürek M. et al [37], with minor alterations. Briefly, a sample solution was prepared by diluting a stock solution of plant extract to a final volume of 100 mL with 70% ethanol. The CUPRAC reagent was prepared by mixing 1 mL of 7.5 mM Neocuproine solution, 1 mL of 10 mM copper chloride solution, and 1 mL of ammonium acetate buffer (pH 6.8). A known volume of the sample solution was mixed with water to a final volume of 1.1 mL and then combined with 3 mL of the CUPRAC reagent. This mixture was incubated at room temperature for 30 minutes. A blank solution, consisting of water in place of the sample solution, was also prepared and incubated in the same manner. After the incubation period, the absorbance of the samples and the blank solution was measured at 450 nm using a UV-VIS spectrophotometer.
The antioxidant activity was calculated in units of mM Trolox equivalent per 100 mL extract, using a calibration curve based on known concentrations of Trolox.

4.7. Liquid Chromatography/Mass Spectrometry (LC/MS) Analysis

The LC/MS analysis was performed following the method proposed by Stan et al. [38] in their study on the antioxidant and anti-inflammatory properties of a Thuja occidentalis mother tincture for the treatment of ulcerative colitis.
The LC/MS method was performed on a Shimadzu Nexera I LC/MS - 8045 (Kyoto, Japan) UHPLC system equipped with a quaternary pump and autosampler respectively an ESI probe and quadrupole rod mass spectrometer.
The separation was carried out on a Luna C18 reversed-phase column (150 mm x 4.6 mm x 3 mm, 100 Å), from Phenomenex (Torrance, CA, USA). The column was maintained at 40 ºC during the analysis.
The mobile phase was used in a gradient, made from methanol (Merck, Darmstadt, Germany) and ultra-purified water prepared by Simplicity Ultra Pure Water Purification System (Merck Millipore, Billerica, MA, USA). As an organic modifier, formic acid was used (Merck, Darmstadt, Germany). The methanol and the formic acid were of LC/MS grade. The flow rate was of 0.5 mL/minute. The total time of an analysis was 35 minutes.
A mixed standard solution with a concentration of 1mg/mL was prepared by accurately weighing 25.00 mg of each 7 phenolic compounds into a 25 mL volumetric flask and making up to volume with absolute methanol.
The standard solution was diluted to different concentrations (2, 4, 6, 10, 26, 50, 75, 100, 150, and 200 μg/mL) by diluting the appropriate volume of stock solution with methanol in a volumetric flask. All solutions were stored at 4°C before injection.
The detection was performed on a quadrupole rod mass spectrometer operated with electrospray ionization (ESI), both in negative and positive multiple reaction monitoring ion mode (MRM). The interface temperature was set at 300 ºC. For vaporization and drying, nitrogen gas was used at 35 psi with a flow rate of 10 L/min. The capillary potential was set to +3000 V.
The samples MMD and EFLM were prepared with 1g dry extract with 10 g ethanol 70%, they were vortexed for an hour and then filtered, to form the stock solution. A dilution of 1:5 with methanol absolute was made, and 10 μL of the sample was injected.
The standards employed included: caffeic, chlorogenic, gallic, rosmarinic, 2-hydroxybenzoic, trans p-coumaric acids, 4’,5,7-trihydroxyflavone (apigenin), hydroquinone β-D-glucose (arbutin), hesperetin, hyperoside, kaempferol, luteolin-7-O-glucoside, luteolin, myricetin, naringenin, quercetin, rutoside, vitexin, apigenin-8-C-glucoside, 6,7-dihydroxycoumarin, esculetin, n-hexadecanoic acid, n-decanoic, thyamin (Phytolab, Vesrenbergsgreuth, Germany) and 5,7-dihydroxyflavone (chrysin) (Merck, Daarmstadt, Germany). The identification was performed by comparison of MS spectra and their transitions between the separated compounds and standards. The identification and quantification were made based on the main transition from the MS spectra of the substance. For quantification purposes the calibration curves were drawn using the standards.

4.8. Gas Chromatography/Mass Spectrometry (GC/MS) Analysis

The GC/MS analysis was conducted by the methodology presented by Stan et. al. [38]. The GC-MS method was performed on a Dani Master GC-MS system along with SH-Rxi-5ms columns with dimensions of 30 cm x 0,25 mm x 0,25 mm and nitrogen as the carrier gas, with a 10 mL/min flow rate and a gradient temperature. The electrospray ionization mass spectrometer (ESI MS) identified the compounds with molecular weights from 50 to 600 Daltons, and the ion source was operated at 200 ºC. The compounds were identified with a match factor of 758, 679, and 749 using the National Institute of Standards and Technology (NIST MS) 2.2 spectra database.

4.9. Statistical Analysis

All experiments were performed in triplicate, and the results were reported as the mean ± standard deviation. This helps to ensure the accuracy and reliability of the results.
The statistical analysis was conducted using the software IBM SPSS Statistics and involved the application of a two-way ANOVA test. To determine significant differences among the samples, a Tukey's test was performed at a significance level of 0.05.

Author Contributions

Conceptualization, Dăineanu. N. and Gîrd. C.. .; methodology, Mihai. S..; software, Stoicescu I..; validation, Stoicescu. I.., Popescu. A. and Dumitrescu. D.E.; formal analysis, Dăineanu. N., and Gîrd. C.; investigation, Dumitrescu. D.E.; resources, Dumitrescu, D.E..; data curation, Stoicescu. I..; writing—original draft preparation, Stoicescu. I. and Mihai. S.; writing—review and editing, Mihai.. S..; visualization, Popescu. A.; supervision, Gîrd. C..; project administration, Mihai. S.; funding acquisition, Dăineanu. N. All authors have read and agreed to the published version of the manuscript.

Funding

This research received no external funding.

Data Availability Statement

We encourage all authors of articles published in MDPI journals to share their research data. In this section, please provide details regarding where data supporting reported results can be found, including links to publicly archived datasets analyzed or generated during the study. Where no new data were created, or where data is unavailable due to privacy or ethical restrictions, a statement is still required. Suggested Data Availability Statements are available in section “MDPI Research Data Policies” at https://www.mdpi.com/ethics.

Conflicts of Interest

The authors declare no conflicts of interest.

References

  1. Yang, R.; Lu, Y.; Hao, H.; Zhang, M.D.; Xuan, J.; Zhang, Y.Q. Research progress on chemical constituents and pharmacological activities of iridoid glycosides in Lonicera japonica. Zhongguo Zhong Yao Za Zhi 2021, 46(11), 2746–2752. [Google Scholar] [CrossRef] [PubMed]
  2. Filipiak-Szok, A.B.; Kurzawa, M.; Szłyk, E. Simultaneous Determination of Isoquinoline Alkaloids in Medicinal Asiatic Plants by Ultrasound-Assisted Extraction and High-Performance Liquid Chromatography – Mass Spectrometry with Principal Component Analysis. Analytical Letters 2018, 51(16), 2577–2587. [Google Scholar] [CrossRef]
  3. Wang, Y.; Li, L.; Ji, W.; Liu, S.; Fan, J.; Lu, H.; Wang, X. Metabolomics Analysis of Different Tissues of Lonicera japonica Thunb. Based on Liquid Chromatography with Mass Spectrometry. Metabolites 2023, 13, 186. [Google Scholar] [CrossRef] [PubMed]
  4. Hsu, H.F.; Hsiao, P.C.; Kuo, T.C.; Chiang, S.T.; Chen, S.L.; Chiou, S.J.; Ling, X.H.; Liang, M.T.; Cheng, W.Y.; Houng, J.Y. Antioxidant and anti-inflammatory activities of Lonicera japonica Thunb. var. sempervillosa Hayata flower bud extracts prepared by water, ethanol and supercritical fluid extraction techniques. Industrial Crops and Products 2016, 89, 543. [Google Scholar] [CrossRef]
  5. Lin, H.W.; Lee, Y.J.; Yang, D.J.; Hsieh, M.C.; Chen, C.C.; Hsu, W.L.; Chang, Y.Y.; Liu, C.W. Anti-inflammatory effects of Flos Lonicerae Japonicae Water Extract are regulated by the STAT/NF-κB pathway and HO-1 expression in Virus-infected RAW264. 7 cells. International Journal of Medical Sciences 2021, 18(11), 2285–2293. [Google Scholar] [CrossRef]
  6. Lee, J.; Park, G.; Chang, Y.H. Nutraceuticals and antioxidant properties of Lonicera japonica Thunb. as affected by heating time. International Journal of Food Properties 2019, 22, 630. [Google Scholar] [CrossRef]
  7. Li, Y.; Li, W.; Fu, C.; Song, Y.; Fu, Q. Lonicerae japonicae flos and Lonicerae flos: a systematic review of ethnopharmacology, phytochemistry and pharmacology. Phytochemistry Reviews 2020, 19(1), 1–61. [Google Scholar] [CrossRef] [PubMed]
  8. An, F.; Ren, G.; Wu, J.; Cao, K.; Li, M.; Liu, Y.; Liu, Y.; Hu, X.; Song, M.; Wu, R. Extraction, purification, structural characterization, and antioxidant activity of a novel polysaccharide from Lonicera japonica Thunb. Frontiers in Nutrition 2022, 9, 1035760. [Google Scholar] [CrossRef]
  9. Tang, X.; Liu, X.; Zhong, J.; Fang, R. Potential application of Lonicera japonica extracts in animal production: from the perspective of intestinal health. Frontiers in Microbiology 2021, 12, 1. [Google Scholar] [CrossRef]
  10. Zhang, T.; Liu, H.; Bai, X.; Liu, P.; Yang, Y.; Huang, J.; Zhou, L.; Min, X. Fractionation and antioxidant activities of the water-soluble polysaccharides from Lonicera japonica Thunb. International Journal of Biological Macromolecules 2020, 151, 1058. [Google Scholar] [CrossRef]
  11. Lee, J.; Park, G.; Chang, Y.H. Nutraceuticals and antioxidant properties of Lonicera japonica Thunb. as affected by heating time. International Journal of Food Properties 2019, 22(1), 630–645. [Google Scholar] [CrossRef]
  12. Zargoosh, Z.; Ghavam, M.; Bacchetta, G.; Tavili, A. Effects of ecological factors on the antioxidant potential and total phenol content of Scrophularia striata Boiss. Scientific Reports 2019, 9, 16021. [Google Scholar] [CrossRef] [PubMed]
  13. Rezende, W.P.; Borges, L.L.; Santos, D.L.; Nilda, M.A.; Alves, D.L.; Paula, J.R. Effect of Environmental Factors on Phenolic Compounds in Leaves of Syzygium jambos (L.) Alston (Myrtaceae). Modern Chemistry Applications 2015, 3(2), 1–6. [Google Scholar] [CrossRef]
  14. Kausar, A.; Zahra, N.; Zahra, H.; Hafeez, M.B.; Zafer, S.; Shahzadi, A.; Raza, A.; Djalovic, I.; Prasad, P.V.V. Alleviation of drought stress through foliar application of thiamine in two varieties of pea (Pisum sativum L.). Plant Signaling & Behavior 2023, 18(1). [Google Scholar] [CrossRef] [PubMed]
  15. Idris, Z.H.C.; Abidin, A.A.Z.; Subki, A.; Yusof, Z.N.B. The effect of oxidative stress towards the expression of thiamine biosynthesis genes (THIC and THI1/THI4) in oil palm (Elaeis guineensis). Tropical Life Sciences Research 2018, 29(1), 71–85. [Google Scholar] [CrossRef] [PubMed]
  16. Misra, D.; Dutta, W.; Jha, G.; Ray, P. Interactions and regulatory functions of phenolics in soil-plant-climate nexus. Agronomy 2023, 13, 280. [Google Scholar] [CrossRef]
  17. Albergaria, E.T.; Oliveira, A.F.M.; Albuquerque, U.P. The effect of water deficit stress on the composition of phenolic compounds in medicinal plants. South African Journal of Botany 2020, 131, 12. [Google Scholar] [CrossRef]
  18. Del Valle, J.C.; Buide, M.L.; Whittall, J.B.; Valladares, F.; Narbona, E. UV radiation increases phenolic compound protection but decreases reproduction in Silene littorea. PLoS One 2020, 15(6), e0231611. [Google Scholar] [CrossRef] [PubMed] [PubMed Central]
  19. de Sousa Araújo, T.A.; de Almeida e Castro, V.T.N.; da Silva Solon, L.G.; da Silva, G.A.; das Graças Almeida, M.; da Costa, J.G.M.; de Amorim, E.L.C.; Albuquerque, U.P. Does rainfall affect the antioxidant capacity and production of phenolic compounds of an important medicinal species? Industrial Crops and Products 2015, 76, 550. [Google Scholar] [CrossRef]
  20. Alhaithloul, H.A.S.; Galal, F.H.; Seufi, A.M. Effect of extreme temperature changes on phenolic, flavonoid contents and antioxidant activity of tomato seedlings (Solanum lycopersicum L. ). PeerJ 2021, 9, e11193. [Google Scholar] [CrossRef] [PubMed] [PubMed Central]
  21. Chowdhary, V.; Alooparampil, S.; Pandya, R.V.; Tank, J.G. 2022. Physiological Function of Phenolic Compounds in Plant Defense System [Internet]. In: Phenolic Compounds - Chemistry, Synthesis, Diversity, Non-Conventional Industrial, Pharmaceutical and Therapeutic Applications. IntechOpen. Available from:. https://doi.org/10.5772/intechopen.101131. [CrossRef]
  22. Liu, Z.; Fadiji, T.; Yang, J.; Li, Z. 2023. Impact of mechanical stimulation on the life cycle of horticultural plant. Horticultural Plant Journal 2023, xx, 1–14. [Google Scholar] [CrossRef]
  23. Guo, A.L.; Chen, L.M.; Wang, Y.M.; Liu, X.Q.; Zhang, Q.W.; Gao, H.M.; Wang, Z.M.; Wei, X.; Wang, Z.Z. 2014. Influence of sulfur fumigation on the chemical constituents and antioxidant activity of buds of Lonicera japonica. Molecules 2014, 19(10), 16640. [Google Scholar] [CrossRef]
  24. Kong, D.; Li, Y.; Bai, M.; Deng, Y.; Liang, G.; Wu, H. 2017. A comparative study of the dynamic accumulation of polyphenol components and the changes in their antioxidant activities in diploid and tetraploid Lonicera japonica. Plant Physiology and Biochemistry 2017, 112, 87. [Google Scholar] [CrossRef]
  25. Fan, Z.; Li, L.; Bai, X.; Zhang, H.; Liu, Q.; Zhang, H.; Fu, Y.; Moyo, R. 2019. Extraction optimization, antioxidant activity, and tyrosinase inhibitory capacity of polyphenols from Lonicera japonica. Food Science and Nutrition 2019, 7(5), 1786. [Google Scholar] [CrossRef] [PubMed]
  26. Chaowuttikul, C.; Palanuvej, C.; Ruangrungsi, N. 2020. Quantification of chlorogenic acid, rosmarinic acid, and caffeic acid contents in selected Thai medicinal plants using RP-HPLC-DAD. Brazilian Journal of Pharmaceutical Sciences 2020, 56, e17547. [Google Scholar] [CrossRef]
  27. Li, Y.; Kong, D.; Bai, M.; Haiyang, H.; Hong, W. 2019. Correlation of the temporal and spatial expression patterns of HQT with the biosynthesis and accumulation of chlorogenic acid in Lonicera japonica flowers. Horticulture Research 2019, 6, 73. [Google Scholar] [CrossRef]
  28. Liu, C.W.; Che, B.C.; Chen, T.M.; Chang, Y.Y. Effect of Different Extraction Methods on Major Bioactive Constituents at Different Flowering Stages of Japanese Honeysuckle (Lonicera japonica Thunb.). J Agron Agri Sci. 2020, 3, 021. [Google Scholar] [CrossRef]
  29. Cai, Z.; Wang, C.; Zou, L.; Liu, X.; Chen, J.; Tan, M.; Mei, Y.; Wei, L. 2019. Comparison of Multiple Bioactive Constituents in the Flower and the Caulis of Lonicera japonica Based on UFLC-QTRAP-MS/MS Combined with Multivariate Statistical Analysis. Molecules 2019, 24(10), 1936. [Google Scholar] [CrossRef] [PubMed]
  30. Shang, X.; Pan, H.; Li, M.; Miao, X.; Ding, H. 2011. Lonicera japonica Thunb.: ethnopharmacology, phytochemistry and pharmacology of an important traditional Chinese medicine. Journal of Ethnopharmacology 2011, 138(1), 1–21, Epub 2011 Aug 16. [Google Scholar] [CrossRef] [PubMed]
  31. Li, Y.; Xie, L.; Liu, K.; Li, X.; Xie, F. 2023. Bioactive components and beneficial bioactivities of flowers, stems, leaves of Lonicera japonica Thunberg: A review. Biochemical Systematics and Ecology 2023, 106, 104570. [Google Scholar] [CrossRef]
  32. Xiang, T.; Xiong, Q.B.; Ketut, A.I.; Tezuka, Y.; Nagaoka, T.; Wu, L.J.; Kadota, S. 2001. Studies on the hepatocyte protective activity and the structure-activity relationships of quinic acid and caffeic acid derivatives from the flower buds of Lonicera bournei. Planta Medica 2001, 67(4), 322–325. [Google Scholar] [CrossRef] [PubMed]
  33. Kumar, N.; Singh, B.; Bhandari, P.; Gupta, A.P.; Uniyal, S.K.; Kaul, V.K. 2005. Biflavonoids from Lonicera japonica. Phytochemistry 2005, 66(23), 2740–2744. [Google Scholar] [CrossRef] [PubMed]
  34. Mihai, S.; Dumitrescu, D.; Raducanu, M.A.; Stoicescu, I.; Badea, V. 2019. Phytochemical profile and total antioxidant capacity of Sempervivum ruthenicum Koch hydroethanolic extract. Revista de Chimie 2019, 70(1), 23–26. [Google Scholar] [CrossRef]
  35. Rioux, C.; Jordan, D.C.; Rattray, J.B. 1983. Colorimetric determination of catechol siderophores in microbial culture. Analytical Biochemistry 1983, 133(1), 163–169. [Google Scholar] [CrossRef] [PubMed]
  36. Brand-Williams, W.; Cuvelier, M.E.; Berset, C. 1995. Use of a free radical method to evaluate antioxidant activity. LWT - Food Science and Technology 1995, 28(1), 25. [Google Scholar] [CrossRef]
  37. Ozyürek, M.; Güngör, N.; Baki, S.; Güçlü, K.; Apak, R. 2012. Development of a silver nanoparticle-based method for the antioxidant capacity measurement of polyphenols. Anal Chem. 2012, Sep 18;84(18), 8052-9, Epub 2012 Aug 27. [Google Scholar] [CrossRef] [PubMed]
  38. Stan, M.S.; Voicu, S.N.; Caruntu, S.; Nica, I.C.; Olah, N.K.; Burtescu, R.; Balta, C.; Rosu, M.; Herman, H.; Hermenean, A.; Dinischiotu, A. 2019. Antioxidant and anti-inflammatory properties of a Thuja occidentalis mother tincture for the treatment of ulcerative colitis. Antioxidants (Basel) 2019, 8(9), 416. [Google Scholar] [CrossRef] [PubMed]
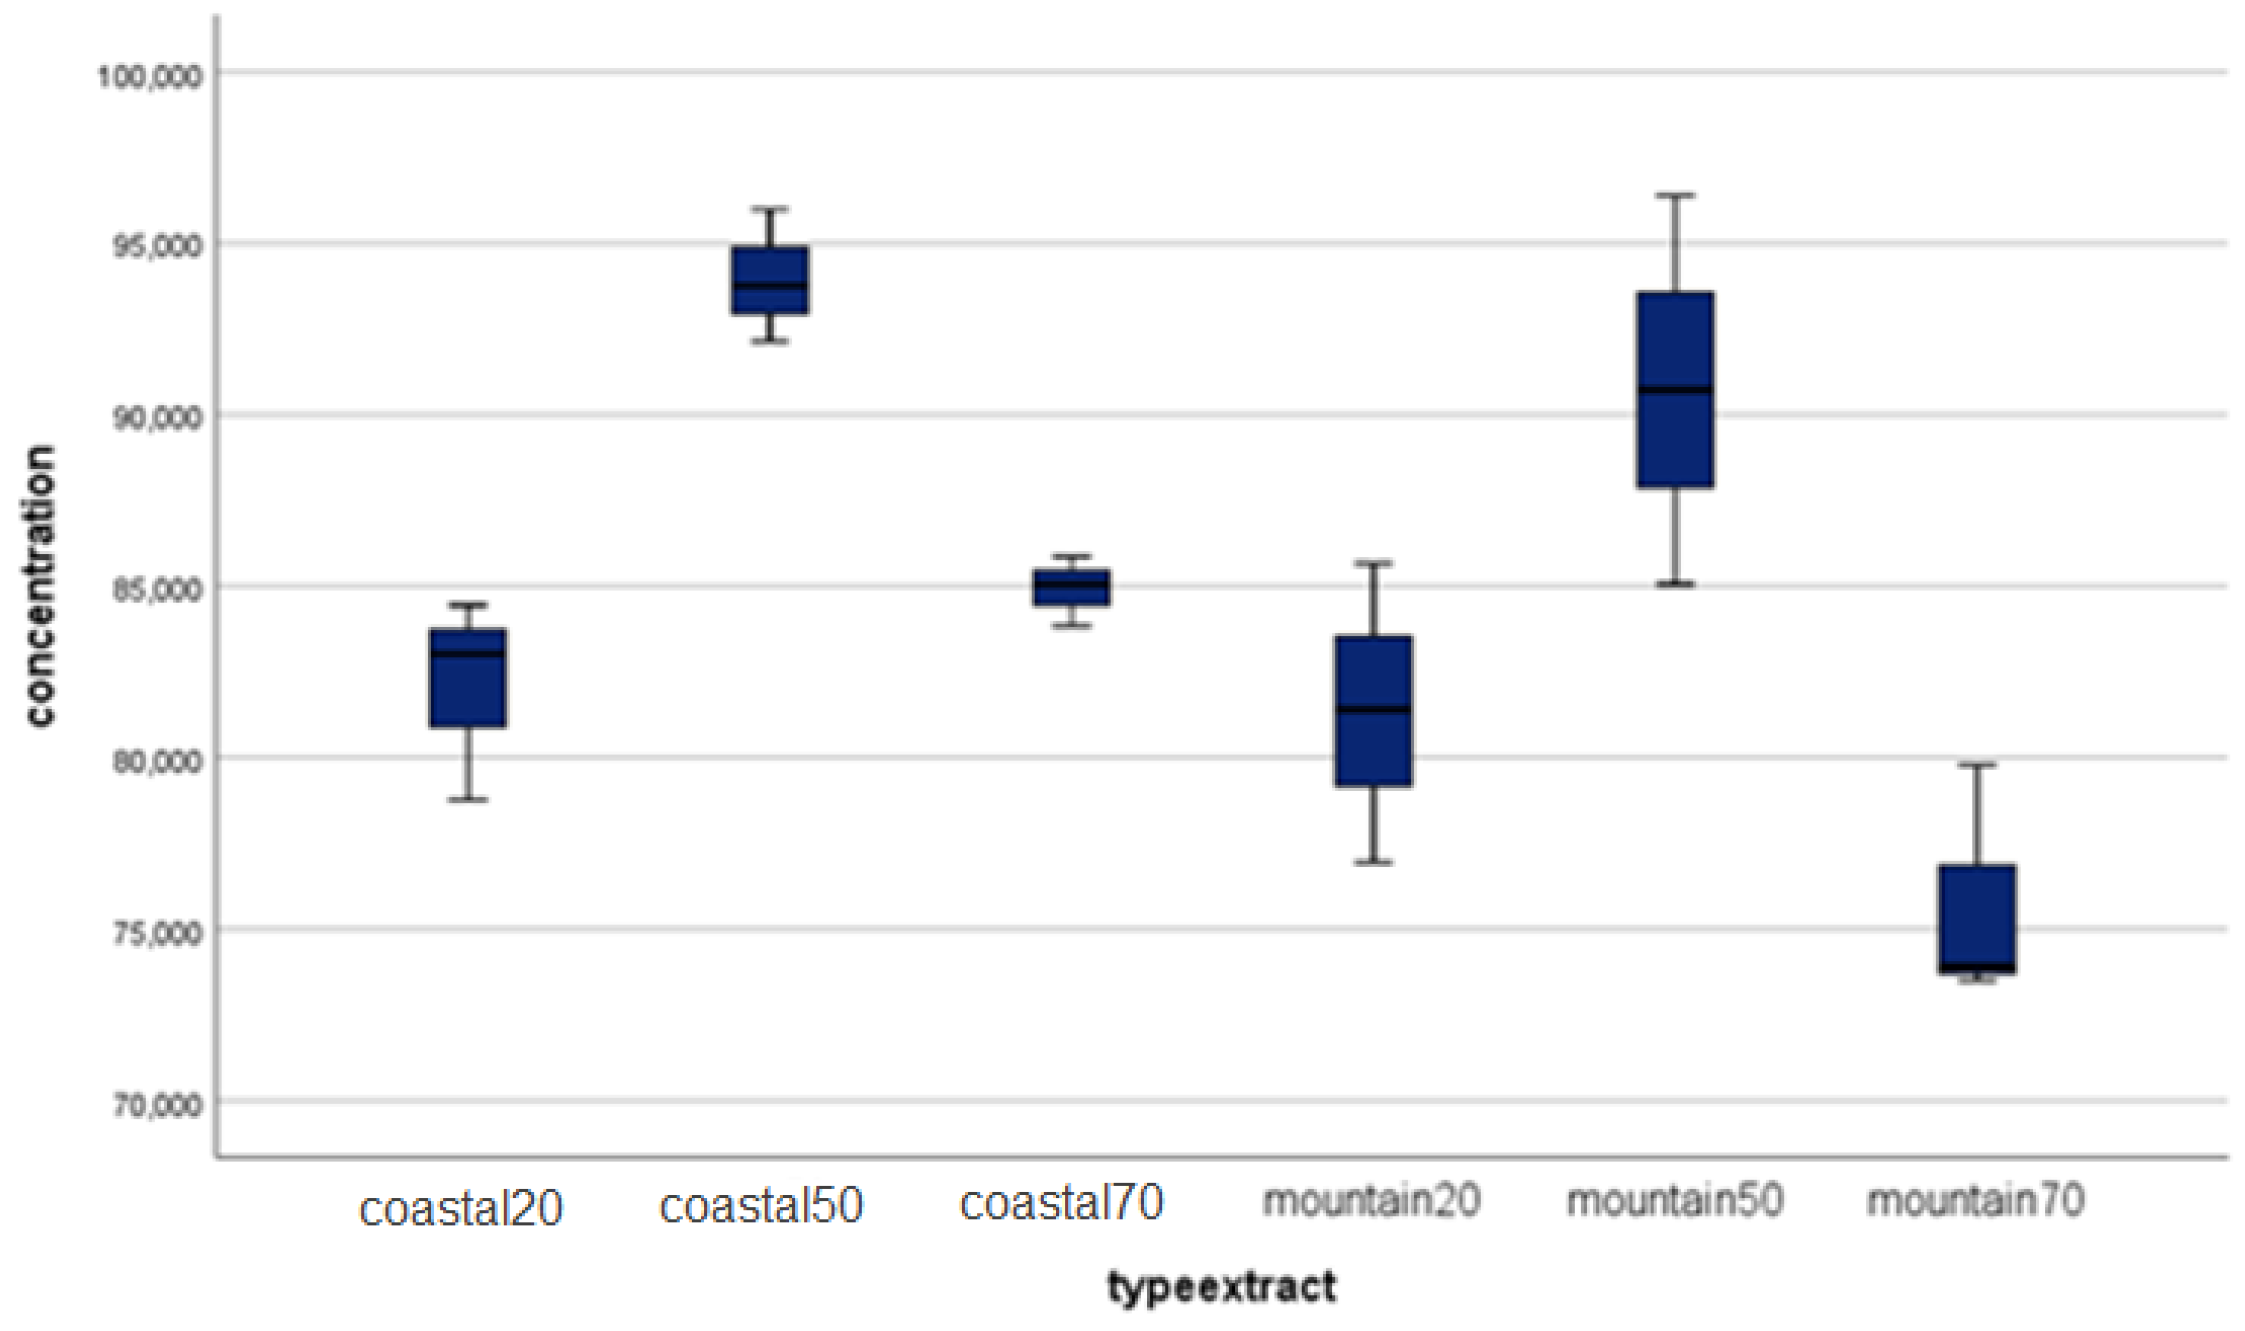
Figure 1. Analysis of total polyphenols in Lonicera japonica Thunb. Extracts.
Preprints 107086 g001
Figure 2. Analysis of flavonoid in Lonicera japonica Thunb. extracts.
Preprints 107086 g002
Figure 3. Analysis of phenol carboxylic acids in Lonicera japonica Thunb. Extracts.
Preprints 107086 g003
Figure 4. The chromatogram of Arbutin from the mountain region.
Preprints 107086 g004
Figure 5. The chromatogram of Arbutin from the coastal region.
Preprints 107086 g005
Figure 6. The chromatogram of Chrysin from the mountain region.
Preprints 107086 g006
Figure 7. The chromatogram of Chrysin from the coastal region.
Preprints 107086 g007
Figure 8. The chromatogram of Vitexin from the mountain region.
Preprints 107086 g008
Figure 9. The chromatogram of Vitexin from the coastal region.
Preprints 107086 g009
Figure 10. The chromatogram of 2-hydroxibenzoic acid from the mountain region.
Preprints 107086 g010
Figure 11. The chromatogram of 2-hydroxibenzoic acid from the coastal region.
Preprints 107086 g011
Figure 12. The chromatogram of MMD extract hightlighting the presence of n-hexadecanoic acid.
Preprints 107086 g012
Figure 13. Interpretation of the chromatogram for the MMD extract.
Preprints 107086 g013
Figure 14. The chromatogram of MMD extract hightlighting the presence of n-decanoic acid.
Preprints 107086 g014
Figure 15. Interpretation of the chromatogram for the MMD extract.
Preprints 107086 g015
Figure 16. The chromatogram of MMD extract hightlighting the presence of thymine.
Preprints 107086 g016
Figure 17. Interpretation of the chromatogram for the MMD extract.
Preprints 107086 g017
Table 1. Calibration curve relationships for the determination of antioxidant activity.
Methods
DPPH assay
Calibration Curve Equation R2
MMD extract y = 16.513x + 45.974 0.9555
ELFM extract y = 29.649x + 7.0996 0.9827
Table 2. Antioxidant activity of the tested Lonicera japonica Thunb. samples
Samples DPPH
(IC50, µg/mL)
CUPRAC
(mM TE */g dry extract)
MMD extract 0.24 675
ELFM extract 1.45 637
Table 3. Compounds in Lonicera japonica ethanolic extracts.
Identified compound Coastal region sample Mountain region sample
Concentration
Mean (mg/mL)a± SD
Retention time
Mean (min)b± SD
Concentration
Mean (mg/mL)a± SD
Retention time
Mean (min)b ± SD
Caffeic acid 19.76 ±0.30 16.4±0.02 19.66 ± 0.30 16.0±0.04
Chlorogenic acid 827.79±12.40 13.9±0.05 781.41 ±11.70 13.7±0.01
Gallic acid 0.05±0.01 8.4±0.01 0.12 ±0.02 8.2±0.07
Rosmarinic acid 0.19±0.03 23.5±0.01 0.89 ±0.01 23.4±0.03
2-hydroxybenzoic acid 6.05±0.09 27.2±0.04 2.98 ±0.05 26.9±0.03
trans-p-coumaric acid 13.31±0.20 20.8±0.01 12.26 ±0.20 20.5±0.01
Apigenin 5.35±0.08 29.8±0.03 4.68 ±0.07 28.2±0.07
Arbutin 0.10±0.02 10.8±0.09 0.008 ±0.01 10.7±0.02
Carnosol 3.20±0.05 31.7±0.01 0.80 ±0.01 31.6±0.01
Chrysin 0.30±0.01 31.1±0.01 0.23 ±0.01 31.0±0.04
Hesperetin 0.58±0.01 28.7±0.02 0.39 ±0.01 28.6±0.02
Hyperoside 28.62±0.40 22.9±0.01 34.65 ±0.50 22.8±0.06
Kaempferol 1.31±0.02 28.9±0.11 0.95 ±0.010 28.8±0.04
Luteolin-7-O-glucozid 34.37±0.50 22.2±0.01 33.88 ±0.50 22.1±0.02
Luteolin 8.19±0.10 28.9±0.01 7.68 ±0.10 28.8±0.09
Myricetin 12.88±0.20 13.8±0.06 23.04 ±0.30 13.5±0.04
Naringenin 0.72±0.01 28.7±0.01 0.93 ±0.01 28.6±0.02
Quercetin 5.03±0.08 28.4±0.05 3.71 ±0.06 28.3±0.04
Rutoside 319.80±4.80 22.7±0.03 277.19 ±4.20 22.7±0.11
Vitexin 0.01±0.01 24.1±0.11 0.01 ±0.01 23.9±0.01
Esculetin 207.61±3.10 15.4±0.01 168.66 ± 2.50 15.1±0.09
n-hexadecanoic acid 6.61±0.02 5.11±0.02 0.01 ±0.01 5.10±0.03
n-decanoic acid 5.21 ±0.01 24.09±0.01 0.01 ±0.01 24.06±0.01
thyamine 1.71 ±0.01 5.58 ±0.02 0.01 ±0.01 5.57 ±0.01
a each value is the mean (mg/100 g of dry sample) of three replications ± standard deviation. b each value is the mean (min) of three replications ± standard deviation.
Table 4. Compounds from the mountain region sample GC/MS.
Compound Retention time, min. Sample area Content by normalization, %
n-hexadecanoic acid 5.20 4.254.87 66.00
thymine 5.60 329505.20 5.10
n-decanoic acid 24.20 112038.00 1.70
Disclaimer/Publisher’s Note: The statements, opinions and data contained in all publications are solely those of the individual author(s) and contributor(s) and not of MDPI and/or the editor(s). MDPI and/or the editor(s) disclaim responsibility for any injury to people or property resulting from any ideas, methods, instructions or products referred to in the content.
Copyright: This open access article is published under a Creative Commons CC BY 4.0 license, which permit the free download, distribution, and reuse, provided that the author and preprint are cited in any reuse.
Prerpints.org logo

Preprints.org is a free preprint server supported by MDPI in Basel, Switzerland.

Subscribe

© 2024 MDPI (Basel, Switzerland) unless otherwise stated