1. Introduction
In recent years, the development of corporate applications based on microservices has become a prevalent approach in the software industry. In this context, frameworks like Spring Boot and Quarkus have become prominent choices to simplify and accelerate development. However, choosing between these frameworks is not trivial; it involves carefully considering performance, efficiency, and scalability factors.
This article proposes a comparative performance analysis between Spring Boot and Quarkus, focusing on objective metrics and quantitative statistics. The goal is to provide an in-depth understanding of the performance differences between these two platforms, using various tools and benchmarks recognized in the computer science community.
The importance of this analysis lies in the need for objective guidance for developers and software architects when choosing a framework for their applications. With modern systems’ increasing complexity, resource consumption efficiency and the ability to scale horizontally become crucial criteria. Moreover, optimizing development time is vital to remain competitive in the dynamic software market.
This article will explore metrics such as startup time, memory usage, throughput, and scalability using established benchmarks like TechEmpower and specific profiling tools. Furthermore, we will support our conclusions with bibliographic references highlighting the importance of informed and data-based technological choices to optimize the development lifecycle and operational efficiency.
The urgency to adopt architectural approaches that facilitate scalability and maintenance in microservices environments is highlighted by [
1]. Additionally, [
2] emphasizes the importance of efficient frameworks to ensure the long-term viability of these architectures, underlining the critical relevance of informed technological choices.
Specifically regarding Spring Boot, the research conducted by [
3] offers significant insights into the features and benefits of this framework. Moreover, the study addresses the challenges inherent in the extensive use of annotations in Spring applications, providing a comprehensive perspective on the complexity of development in microservices-based environments.
Concerning Quarkus, research like that of [
4] explores energy efficiency in Java applications, presenting a unique view of resource consumption in microservices environments. These detailed analyses contribute to a holistic understanding of the performance implications associated with Quarkus, informing our comparative approach.
These studies enrich our theoretical understanding and provide a solid foundation for the proposed comparative analysis. It is emphasized that all analyses and tests were conducted on a complex application involving extensive and complex data and intricate relationships between various tables. By contextualizing performance metrics within this challenging environment, our study gains relevance by contributing to understanding trends and challenges faced in developing microservices-based applications. Thus, these bibliographic references further strengthen the foundation of our study.
2. Background
This chapter will detail the technologies used in the application’s development, the testing tools adopted, and the fundamental concepts applied in evaluating the results. It offers a comprehensive view of the literature, organizing the information into four main sections: frameworks used, employed integrations, selected testing tools, and essential concepts for analyzing the results.
2.1. Frameworks
2.1.1. Spring Boot
Spring Boot, known for simplifying the development of Java applications, brings a series of benefits and challenges concerning performance. Its automatic configuration and "starters" provide agility at the project’s start, reducing the need for extensive configuration coding. This boosts productivity, allowing developers to focus on the app’s functionalities instead of worrying about configuration details [
5].
However, this automation can result in performance challenges. Increased memory consumption is one of them, as automatic configuration can load various modules and resources, generating overhead in memory allocation. In complex applications, the startup can be slower due to extensive configuration and classpath analysis, affecting the application’s startup time [
6].
Hidden complexity is a delicate point: although simplification is an advantage, hidden complexity can make it difficult to identify performance bottlenecks. Issues related to the framework’s configuration can be challenging to find and resolve.
Another aspect is the size of the generated artefact. By automatically including libraries and modules, Spring Boot can result in more significant artefacts. This affects deployment time and the server’s resource consumption, directly impacting performance in cases of limited infrastructure.
To address these challenges, it’s crucial to profile the application, identifying areas for improvement and performance bottlenecks. Selectively optimizing specific application parts is essential, as well as avoiding including unused features and adjusting the automatic startup of modules. Additionally, keeping frequent updates of Spring Boot and continuously monitoring the application’s performance are fundamental practices to mitigate possible impacts on performance [
7].
2.1.2. Quarkus
Quarkus, an innovative framework for developing native Java applications in the cloud, offers a distinct set of performance benefits and challenges. Its architecture and purpose are shaped to optimize application performance and efficiency, especially in cloud and container environments.
One of the main benefits of Quarkus is its approach to creating native applications, enabling shorter startup times and lower memory consumption compared to traditional applications. This is achieved through ahead-of-time compilation, quick loading, and the ability to package only the necessary parts of the application [
8].
However, despite these advantages, some challenges can arise when working with Quarkus. The complexity of the ahead-of-time compilation process can make building and development more intricate, especially for those accustomed to the traditional development paradigm. Moreover, certain Quarkus features may introduce limitations on some functionalities or require careful adaptation of development practices.
The optimized nature of Quarkus, while a significant positive point, also may require careful planning to ensure that its optimization does not sacrifice the flexibility or scalability of the application. Specific strategies to balance performance and development flexibility are necessary to leverage the benefits offered by Quarkus fully [
9].
Quarkus’s continuous evolution, with the introduction of new features and improvements, represents significant potential for modern and highly efficient applications. However, to maximize its benefits, developers must deeply understand the framework’s characteristics and apply development strategies that maximize its performance potential.
2.2. Integrations
This chapter summarizes the integrations used in both applications discussed in this Article:
PostgreSQL: An open-source relational DBMS is known for its scalability, support for transactional integrity, MVCC, stored procedures, and triggers. It stands out for its extensibility, robustness, and SQL standards compatibility, backed by an active community [
10,
11].
Redis: An open-source, low-latency, high-performance caching system supporting various structured data types in a key-value structure. It is chosen for its scalability, efficiency, and ease of use across various applications [
12,
13,
14,
15].
FlywayDB: An open-source tool for database schema management and versioning, operating under the principle of "migrations as code." It facilitates the automation of migrations in agile development and DevOps environments [
16].
RabbitMQ: A messaging platform that implements AMQP, offering modular architecture and features like message queues. Evaluations demonstrate its performance and scalability in various scenarios [
17,
18,
19,
20].
Keycloak: An identity and access management platform offering robust authentication and authorization, supporting various authentication methods and modern standards, facilitating security in applications [
21,
22].
Prometheus and Grafana: Tools for system and application monitoring, with Prometheus, focused on metrics collection and Grafana on visualization. Their integration enables effective monitoring and interactive visualization [
23,
24,
25,
26,
27].
Docker: A platform that facilitates the creation, deployment, and running of container applications, promoting portability and efficiency. Complemented by tools like Docker Compose and Docker Swarm, it facilitates container automation and orchestration [
28,
29,
30,
31,
32,
33,
34].
2.3. Tools
In this chapter, we describe the tools used to test and evaluate the performance of the work developed:
Postman: An API development tool that facilitates testing, documentation, and collaboration in API creation. It allows developers to send HTTP requests, verify responses, generate interactive documentation, and collaborate in teams, positively impacting the API development community [
35,
36,
37,
38,
39]. JMeter: An Apache performance testing tool to assess web applications under load. It offers features to simulate real scenarios, generate load on servers, collect detailed performance metrics, and identify bottlenecks, widely recognized for its efficiency and flexibility [
40,
41,
42,
43]. Custom test application: Specifically developed for this work, this application allows sending bulk requests in parallel and with varied content sizes and conducting security tests to ensure data integrity [
44].
2.4. Analysis Concepts
Statistical calculations were employed to validate the test results and conduct more detailed analyses of the application’s performance. These calculations map the relationship between monitored attributes, determine the application’s capacity according to the used hardware, and identify possible performance bottlenecks.
In this sense, this section covers the following statistical calculations: correlation coefficient, regression analysis, load curve, and response time analysis.
2.4.1. Correlation Coefficient
The correlation coefficient is a widely used statistical measure to assess the relationship between two variables. It measures the degree of linear association between the variables, ranging from -1 to 1.
According to [
45], one of the most common ways to calculate the correlation coefficient is the Pearson correlation coefficient, represented by
r. The formula for the Pearson correlation coefficient is given by:
Where
and
are the values of variables
x and
y for each observation,
and
are the averages of
x and
y values, respectively, and
n is the number of observations [
45].
It’s important to highlight that the Pearson correlation coefficient is only suitable for measuring the linear relationship between the variables. This coefficient may not capture other forms of non-linear association.
Other correlation measures can be used in different contexts. For example, the Spearman correlation coefficient is a non-parametric measure assessing the variables’ monotonic relationship. It is calculated based on the rankings of the variables’ values [
46].
2.4.2. Regression Analysis
Regression analysis is a statistical technique for studying the relationship between a dependent variable and one or more independent variables. It seeks to model this relationship through a linear equation.
One of the most common methods to perform regression analysis is the least squares method. This method finds the coefficients of the linear equation that minimize the sum of the squares of the differences between the observed values and the values predicted by the model [
47].
The equation of simple linear regression can be represented by:
Where
y is the dependent variable,
x is the independent variable,
is the intercept,
is the regression coefficient and
is the error term [
48].
Different regression analysis techniques exist, such as simple linear regression, multiple linear regression, and non-linear regression. Each of these techniques has its assumptions and methods of evaluation [
48].
Simple Linear Regression: A method that models the relationship between two dependent and independent variables through a linear equation. The basic equation is
, where
y is the dependent variable,
x is the independent variable,
is the intercept,
is the regression coefficient, and
is the error term. The least squares method is often used to find the coefficients that minimize the sum of the squares of the differences between the observed and predicted values [
49].
Multiple Linear Regression: Extends the idea of simple linear regression to more than one independent variable. The equation becomes
, where
are the independent variables and
are the regression coefficients associated with each independent variable [
50].
Non-Linear Regression: While linear regression relies on linear equations, non-linear regression allows the model to fit more complex relationships between variables. This can be done using non-linear functions, such as exponential or logarithmic, to describe the relationship between the variables [
51].
Exponential and Logarithmic Regression: These are types of non-linear regression. Exponential regression models relationships where the data fit an exponential curve, while logarithmic regression models relationships that fit a logarithmic curve [
52].
Power Series: This is a form of non-linear regression where the model fits a series of polynomial terms rather than a single equation. This allows modelling complex relationships that a single linear function cannot represent [
53].
Each type of regression analysis has its applications and underlying assumptions. The choice of method depends on the nature of the data and the expected relationship between the involved variables. Validation and interpretation of the results are also crucial to ensure that the model is appropriate and helpful in making predictions or inferences.
2.4.3. Load Curve
The load curve is a graphical representation of energy consumption over time. It is often used to analyze the consumption profile of a particular load or system.
To calculate the load curve, resource consumption data must be collected at regular time intervals. These data can also be used to estimate consumption when measurements are unavailable.
A commonly used approach is the interpolation method, which consists of filling in missing values using a function that fits the available data. An example of a function used for interpolating load curves is the polynomial function [
54].
According to [
55], the general formula of an
n-degree polynomial used to interpolate a load curve is given by:
Where is the estimated value of the load curve at time t and are the polynomial coefficients.
Other methods and statistical models can be used to calculate the load curve, such as non-linear regression and time series [
55].
2.4.4. Response Time Analysis
Response time analysis is a technique used to evaluate an application’s performance regarding the time needed to respond to user requests. It is particularly relevant in web applications, where response speed is critical for user experience [
56].
One of the main indicators used in response time analysis is the average response time. It is calculated as the average response times of a set of requests. The formula for average response time is given by:
is the response time of the
i-th request and
n is the total number of requests [
57].
3. Related Works
This chapter presents a literature review on performance comparison between APIs developed using the Spring and Quarkus frameworks. It discusses the main results from previous studies and the differences between the two frameworks that might influence their performance.
Various studies in the literature have compared the performance of Spring Boot and Quarkus applications in API scenarios. Generally, these analyses indicate that Quarkus offers superior performance compared to Spring Boot.
For example, the article "A Performance Comparison of Spring Boot and Quarkus for Microservices" [
58] compares the performance of the two frameworks in a microservices application, concluding that Quarkus shows better results in all benchmarks, including startup time, response time, and memory consumption.
Another article, "Spring Boot vs. Quarkus: A Performance Comparison" [
9], also addresses performance comparison in a more straightforward application. In this case, Quarkus offers a faster startup, while Spring Boot stands out in response time.
The book "Spring Boot vs. Quarkus: A Comparison of Two Java Frameworks" [
8] provides an overview of the main discrepancies between Spring Boot and Quarkus, discussing how these differences can impact the performance of both frameworks.
Another study, "Performance Comparison of Spring Boot and Quarkus: A Case Study" [
59], presents a case study comparing the performance of Spring Boot and Quarkus in complex applications, concluding that Quarkus excels in all the evaluated benchmarks.
In the article "Comparative Performance Analysis between Spring Boot and Quarkus: An Empirical Study" by Gabriel Ferreira da Rosa, Kleinner Farias, and Carlos Fernando Santos Xavier [
60], a comparative performance analysis between Spring Boot and Quarkus is presented. This study employs a use case involving messaging communication scenarios and their persistence in a database, using CPU, RAM, and message processing time measurements. The results indicate that Quarkus performs slightly superior in most tested scenarios, suggesting an advantage for using Quarkus in specific application development contexts.
The related works indicate that Quarkus offers superior performance over Spring Boot. However, it is crucial to emphasize that an application’s actual performance depends on several factors, including its complexity, workload, and configurations.
The study developed in this article distinguishes itself from related works in several aspects: it uses a complex application with massive data, like base64 and multiple hierarchies, and it applies statistical analysis, employing statistical and mathematical concepts in analyzing the benchmarks.
4. Developed Applications
Both applications are identical regarding functionalities, classes, services, endpoints, and objectives; the only difference is the framework used and some configurations. Thus, this chapter will treat the application as a single entity, clarifying the architecture and the developed points.
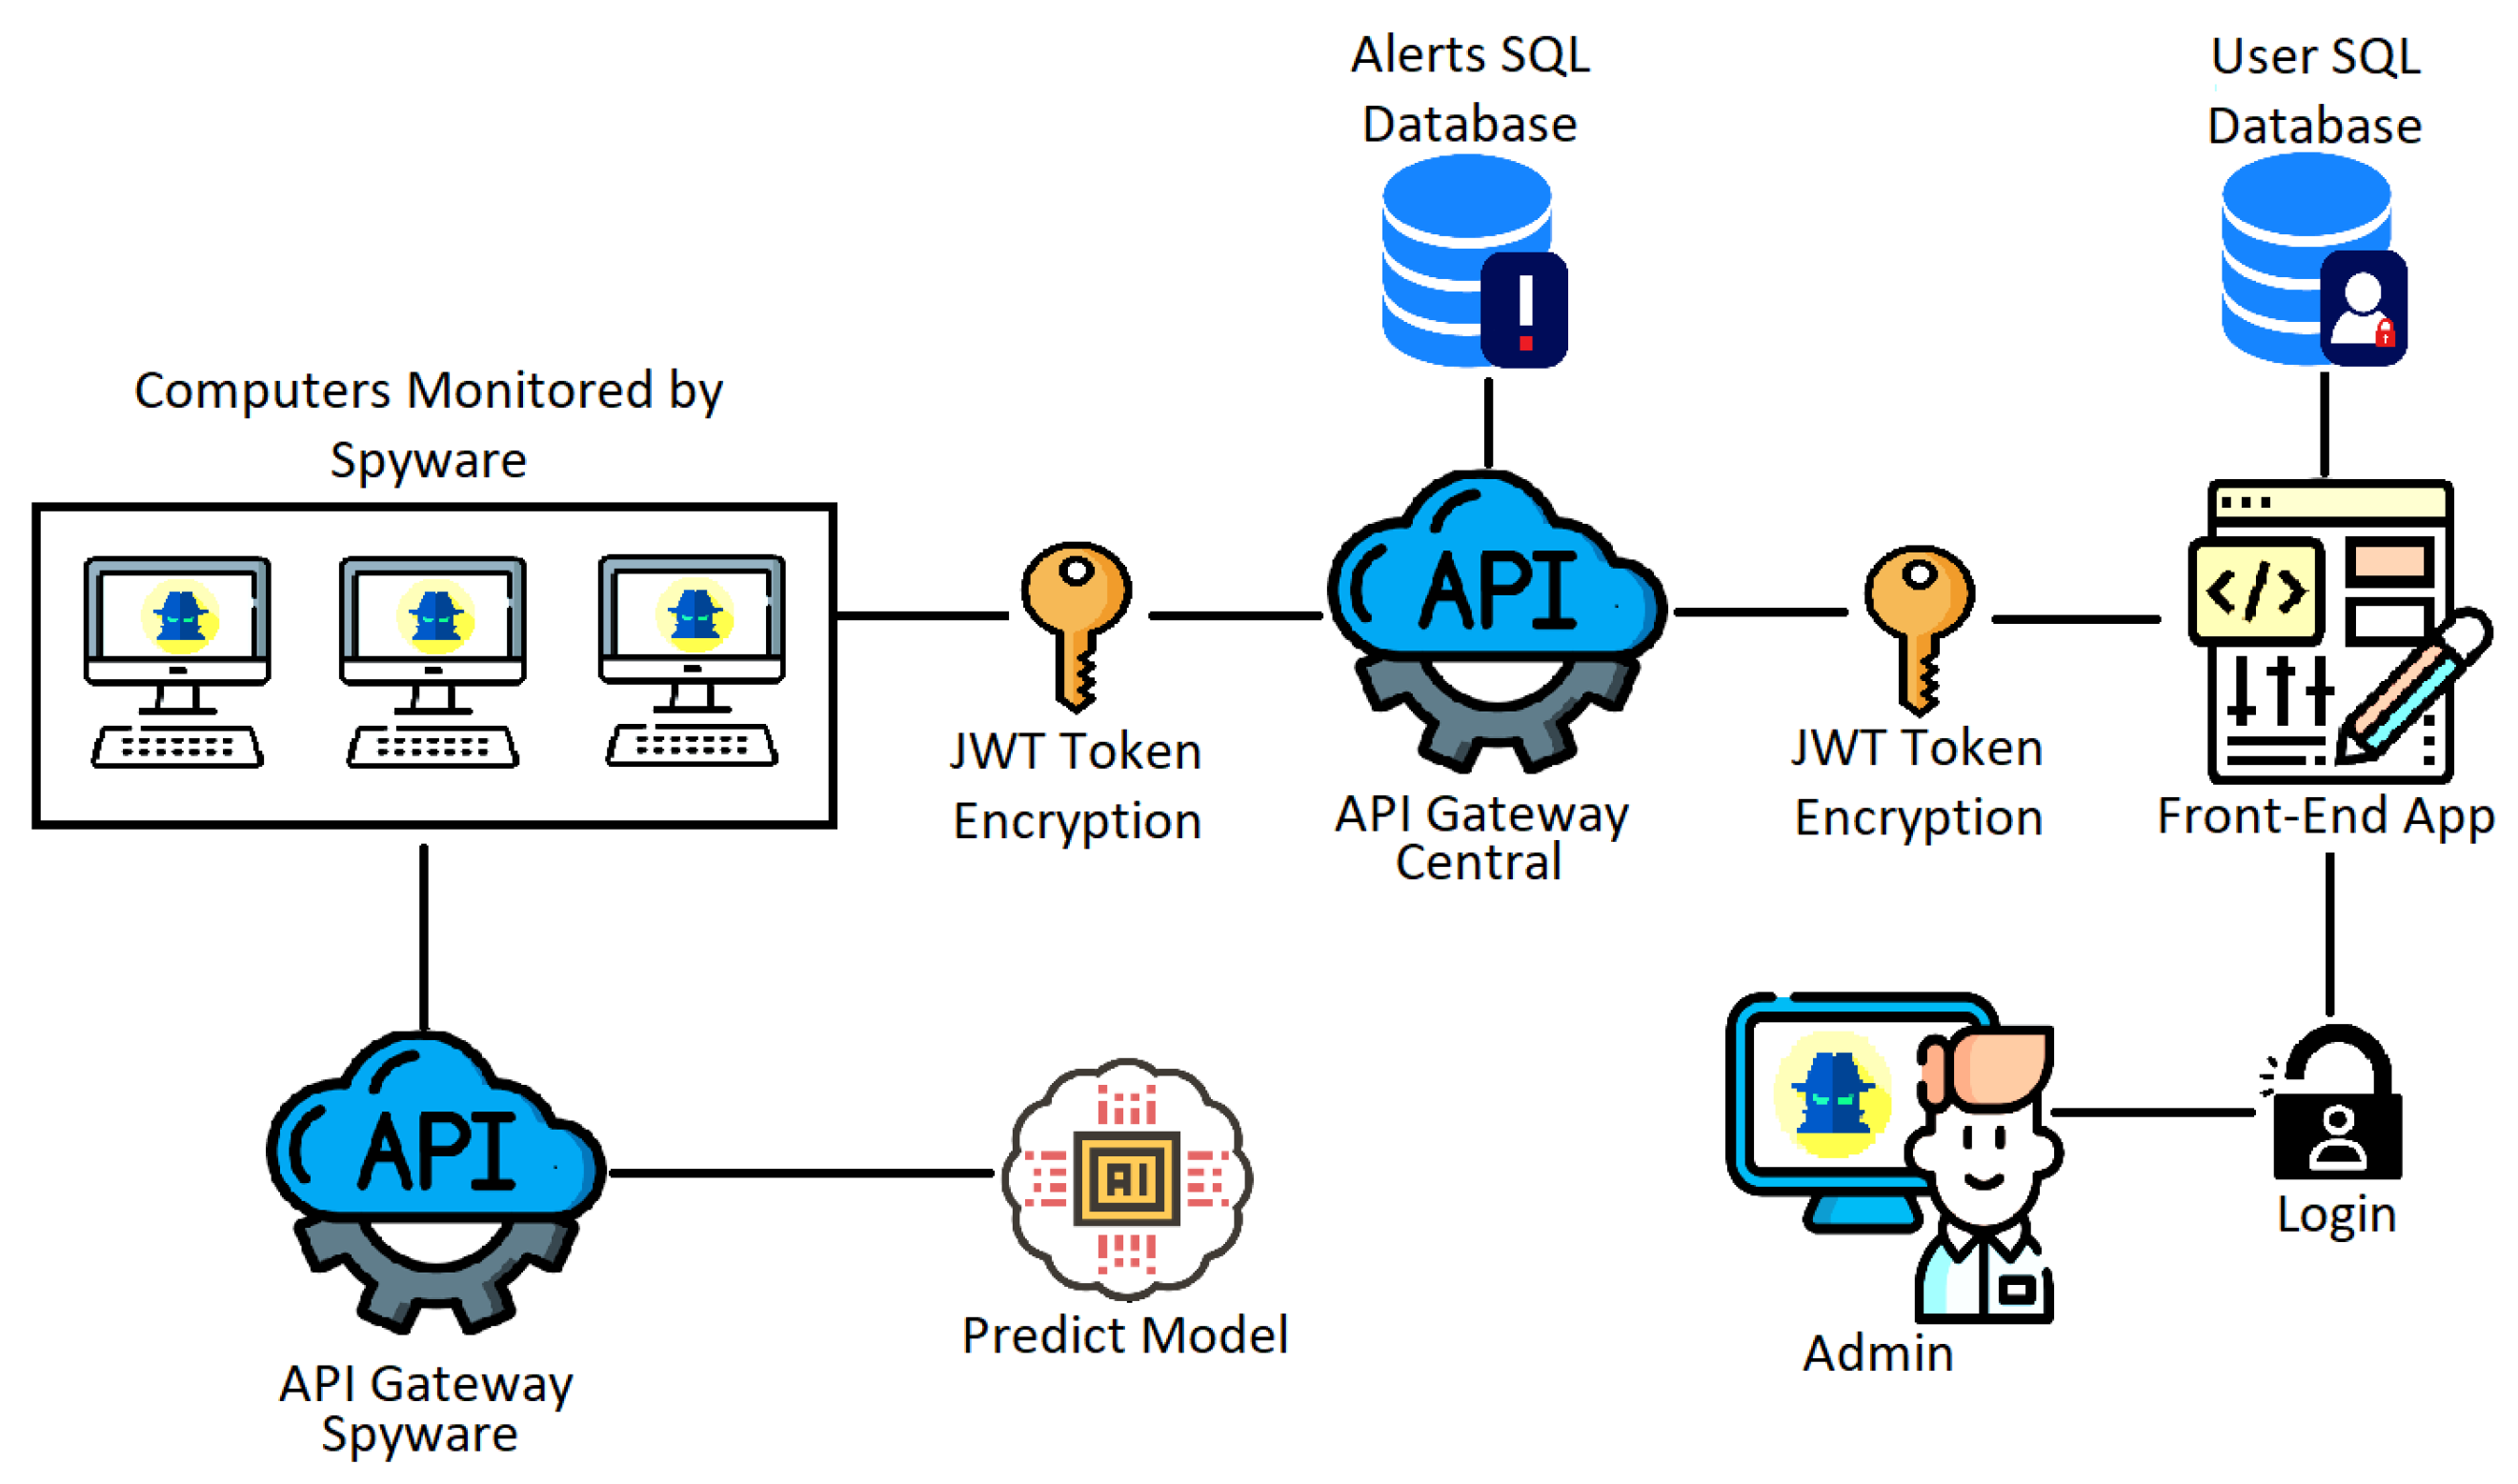
This application aims to use Spyware techniques to monitor corporate and/or institutional computers, using prediction models to detect hate speech and monitor network packets, vulnerabilities, and malicious processes. As seen in
Figure 1, the proposed architecture for this solution involves several applications, which require a lot of information exchange, demanding good performance from the Central API Gateway.
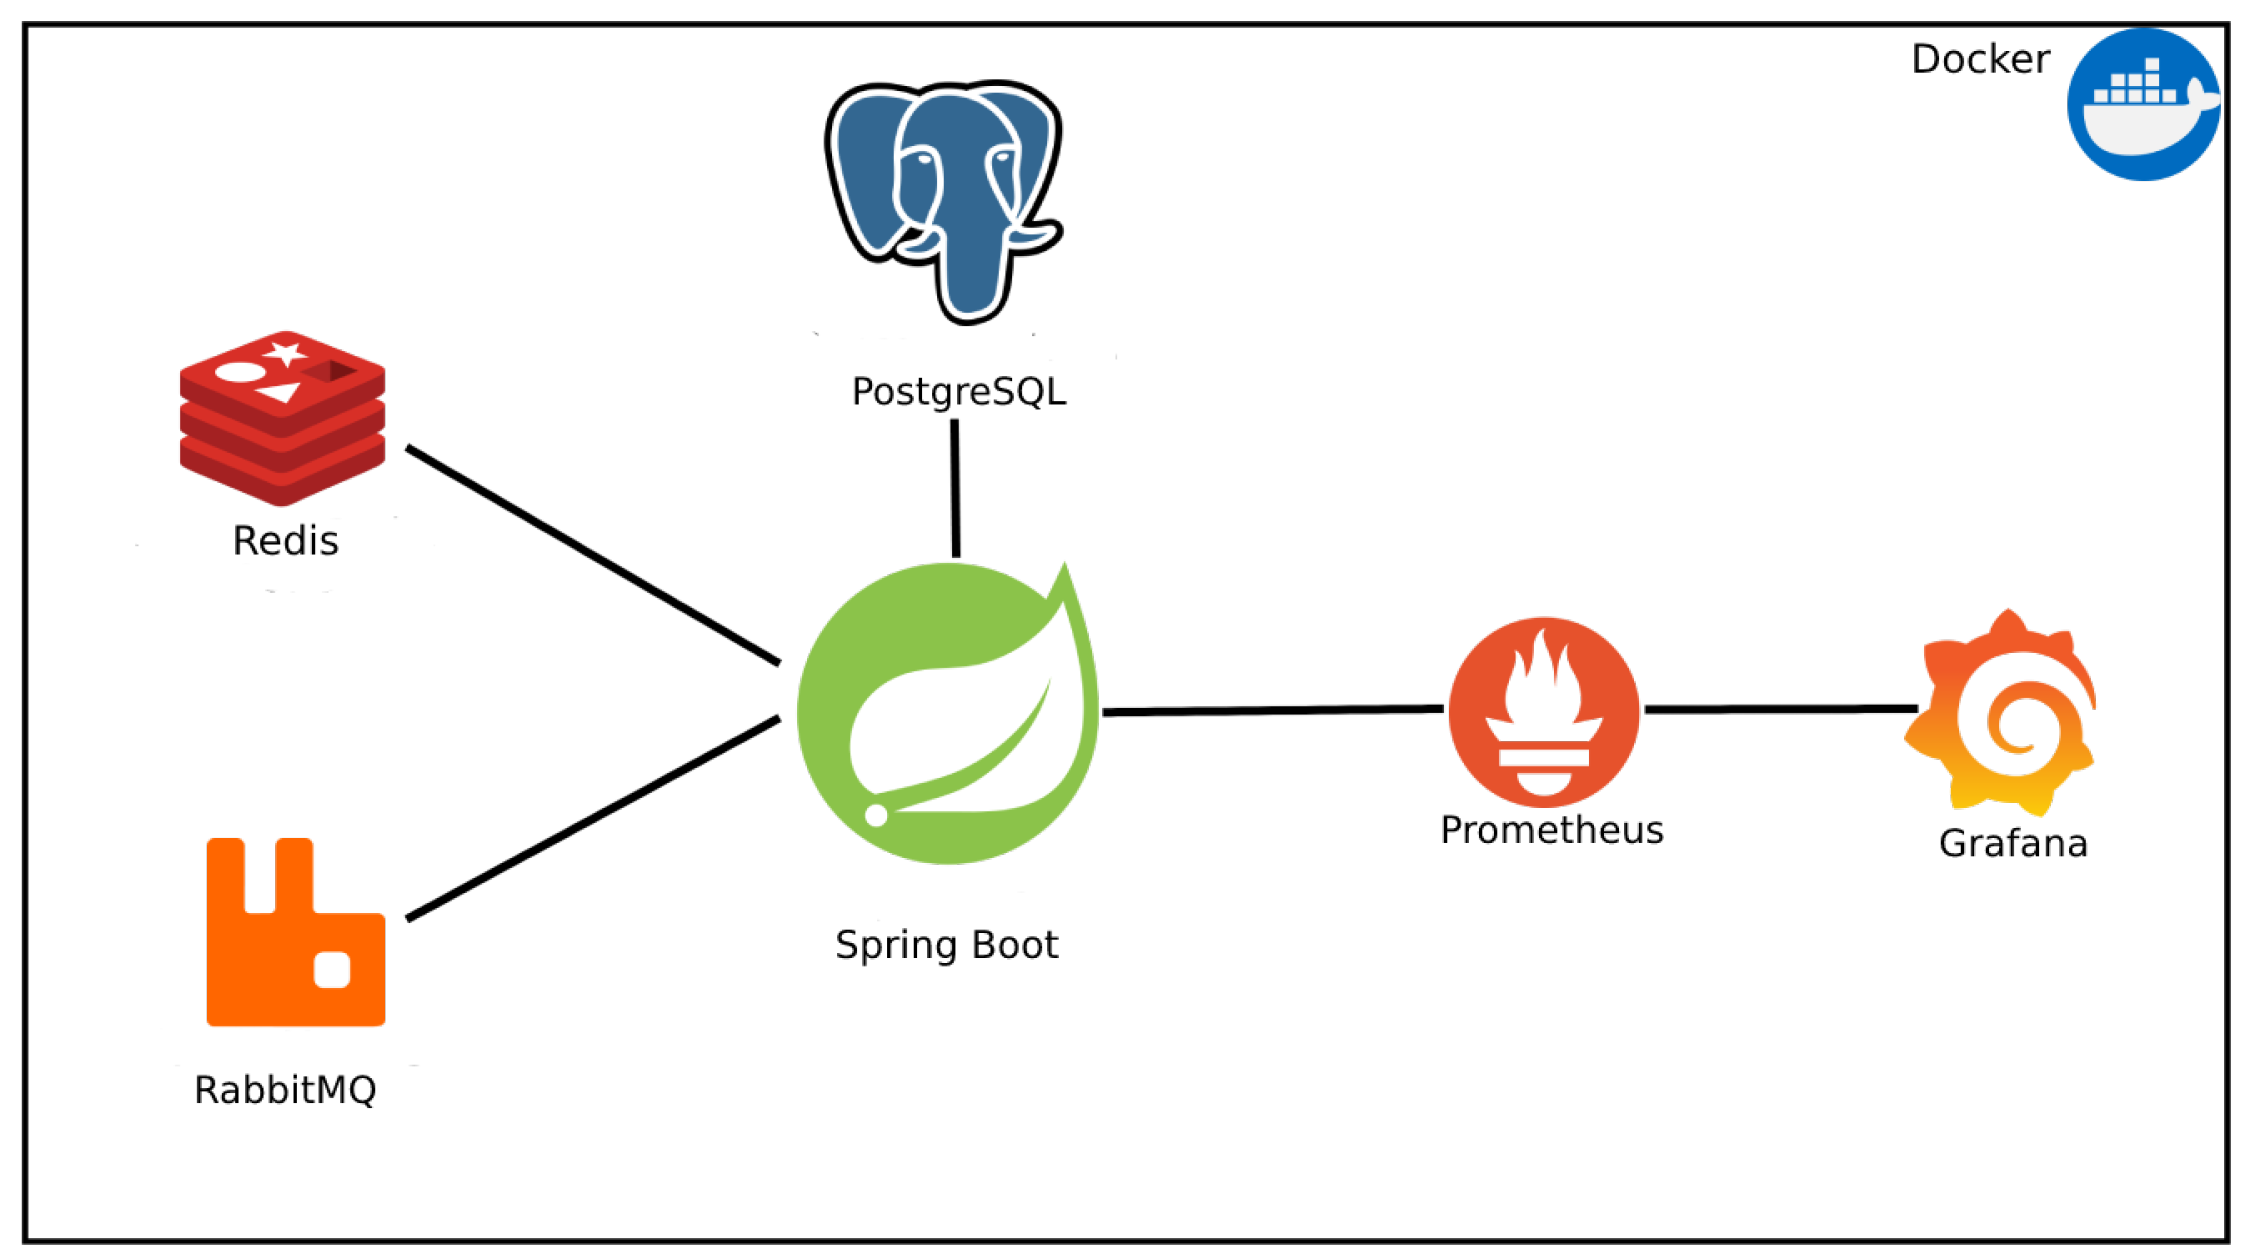
Therefore, the focus of this article will be the Central API Gateway, whose architecture is presented in
Figure 2. This architecture consists of some other components that will not be addressed in the tests and are presented in
Figure 1, but here is a description of each:
Admin: platform administrator who will have access to Alerts through the Front-End application, being able to manage (remove and view), in addition to adding the monitoring management data;
Front-End App: application responsible for creating a secure, easy-to-use, and simple interface for the Administrator to manage the Application;
User Database: relational database to keep Front-End users separate from the rest of the application. The database will contain only one table to set up the login/registration of users, with encrypted passwords;
Central API Gateway: this component will be responsible for centralizing the Alerts data and distributing it to the Front-End, with JWT Token, to ensure the security and reliability of the data. In addition to caching for fast data access and messaging service to guarantee the delivery of Alerts,
Alerts Database: main relational database (PostgreSQL), responsible for maintaining the management data of monitoring and Alerts;
Spyware: main application component that will monitor the accessed sites, typed words, running processes, typed hate speech, and have a Port Scanner to assess if there are vulnerabilities on the PC. When any of these items are identified, the Spyware will generate an Alert and perform the capture of the information for sending to the API Gateway;
API Gateway Spyware: the component that will contain an endpoint to communicate with the prediction model that will return whether a phrase is or is not hate speech;
Predict Model: responsible for receiving a phrase in one of the languages (Spanish, Portuguese, or English), detecting the language, and processing through three multi-layer models, returning whether the phrase is hate speech. The model will be compiled with the Pickle library and inserted into the API Gateway.
The analyzed API uses some technologies to improve performance and observability and facilitate deployment in different environments; all technologies are presented in
Figure 2. In this figure, it is possible to see that the web service is isolated in a Docker image along with a PostgreSQL database, used to store long-life data, a Redis database to store short-lived cache data, a RabbitMQ messaging service for managing processing queues, and two services for extracting and visualizing metrics, Prometheus and Grafana.
4.1. Improvements Applied to the Solution in Spring
Some structural and development measures were taken to improve the Spring application’s performance. The criteria that were changed and added to improve performance and maintain continuous delivery of the solution are:
Cache with Redis: to not overload the SQL (Structured Query Language) database with repeated and constant searches;
Messaging Service with RabbitMQ: to maintain continuous updating and delivery of functionalities asynchronously;
Initialization in "lazy" mode: the application Spring’s startup mode changed to "lazy", where only necessary components and dependencies are loaded;
Exclusion of auto-configurations: disabling automatic configurations of Spring to not consume resources unnecessarily;
Switch of the Standard Servlet Container of Spring: the migration was made from Tomcat to Undertow, which showed better performance for Spring applications [
61];
Disabling Java Management Extensions (JMX): the flag for real-time bean monitoring was disabled to reduce unnecessary resource use, as other metric tools are being used;
Removing the standard log system of Hibernate and Java Persistence API (JPA): turning off database logs and creating controlled logs makes processing faster;
Generating indexes sequentially: it’s preferable in terms of performance due to storage efficiency, better cache utilization, reduced fragmentation, and ease in ordered queries;
Using migrations for database table creation: replacing Hibernate’s automatic database structure creation with migrations allows for more refined control over schema changes, improving SQL database performance.
With these improvements, tests were conducted more efficiently, obtaining the results that will be presented later.
4.2. Improvements Applied to the Solution in Quarkus
Improvements were implemented in the Quarkus-developed application, including adopting strategies similar to those already applied in the Spring API. This involved configuration optimizations and programming, such as using cache and messaging strategies, adopting lazy loading mode, excluding non-essential autoconfiguration, and removing unnecessary logs.
In addition to the mentioned adaptations, other improvements were made to maximize performance in the Quarkus API. This included applying pre-compilation techniques to reduce startup time, using pooling strategies for database resources, minimizing memory use through efficient resource management, and implementing more granular and effective caching strategies for frequently accessed data.
5. Methodology
This chapter will discuss the tests conducted and the results obtained. It will be divided into specific tests of the Spring application and specific tests of the Quarkus application, and a comparison will be made between them, considering before and after the performance improvements applied. All tests were performed on a computer with an i5 7200 CPU, 16 GB of RAM, and 1 TB of SSD running the Kali Linux operating system.
Before the performance tests, simple tests were performed on all endpoints using Postman. These tests aimed to verify the functionalities and ensure the API’s proper operation. Then, JMeter was used to conduct more in-depth performance tests. Twenty-five tests were performed with different configurations of parallel request groups. Each set of requests consisted of three requests: one to obtain the authentication token, another to register an image, and another to register an alert.
The first request was a POST method to the endpoint ’/login’, where a request body in JSON format was sent:
The previous request’s response provides a token for the next two requests. The next step is to make a POST request to save an image in the API. This request is sent to the endpoint ’/image/save’ and must include the token obtained in the previous step in the headers. The request body must be in the following JSON format:
After the success of this request, the complete Image object is returned, containing an ID, which is used in the next POST request to save the Alert. This request is sent to the endpoint ’/alert/save’ and must include the token in the headers. The request body must be in the following JSON format:
This set of requests was sent in different quantities in each test, varying in 500, 1000, 2000, 5000, and 10000 parallel sends. However, when many requests were used, the JMeter’s memory heap would exceed, mainly due to sending images in base64 format in the request body. For this reason, a parallel application called API Tester was used to continue with more significant numbers of requests.
It is important to emphasize that the analyzed metrics were collected from the Docker image, which implies a minimum limit of memory and processing use. This limit is related to applications such as Grafana, Prometheus, PostgreSQL, Redis, and RabbitMQ. In natural environments, with more users and on more robust machines, resource use is expected to be dispersion, making the percentage of use of these applications negligible.

5.1. Spring Application Results
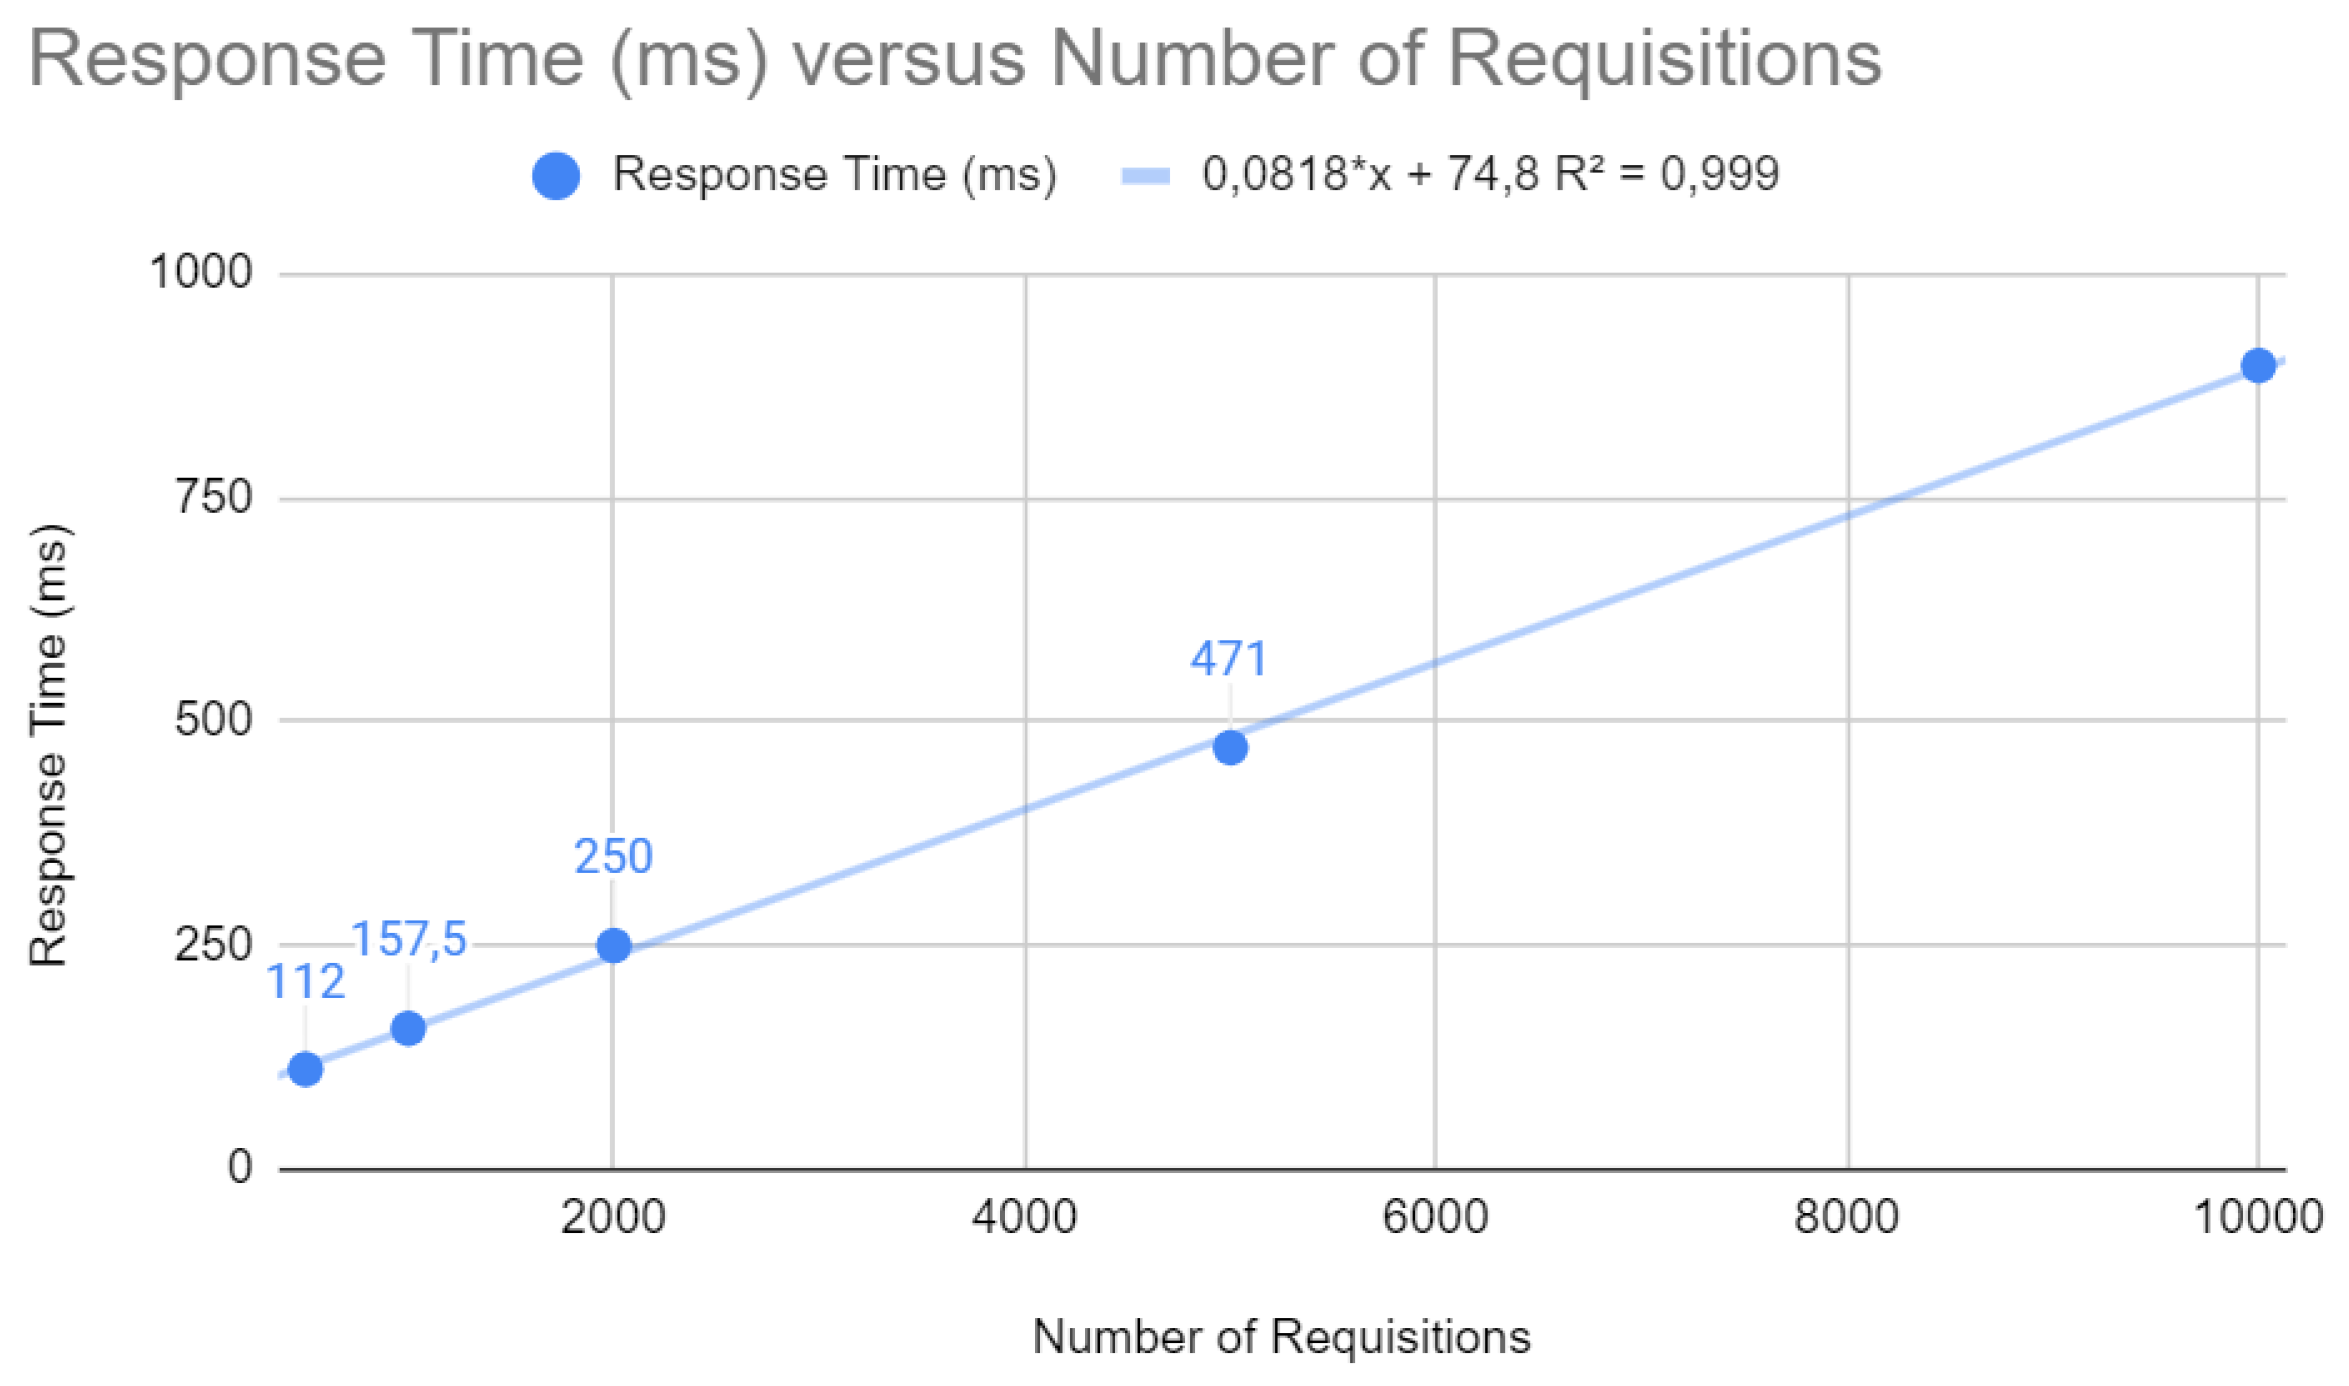
Initially, some points were analyzed for the Spring application, which can be examined in the following figures. As illustrated in
Figure 3, the response time in milliseconds increases with the number of requests, according to the equation
. Higher response times can result in a poor user experience, which emphasizes the importance of optimizations for fast response times in web applications.
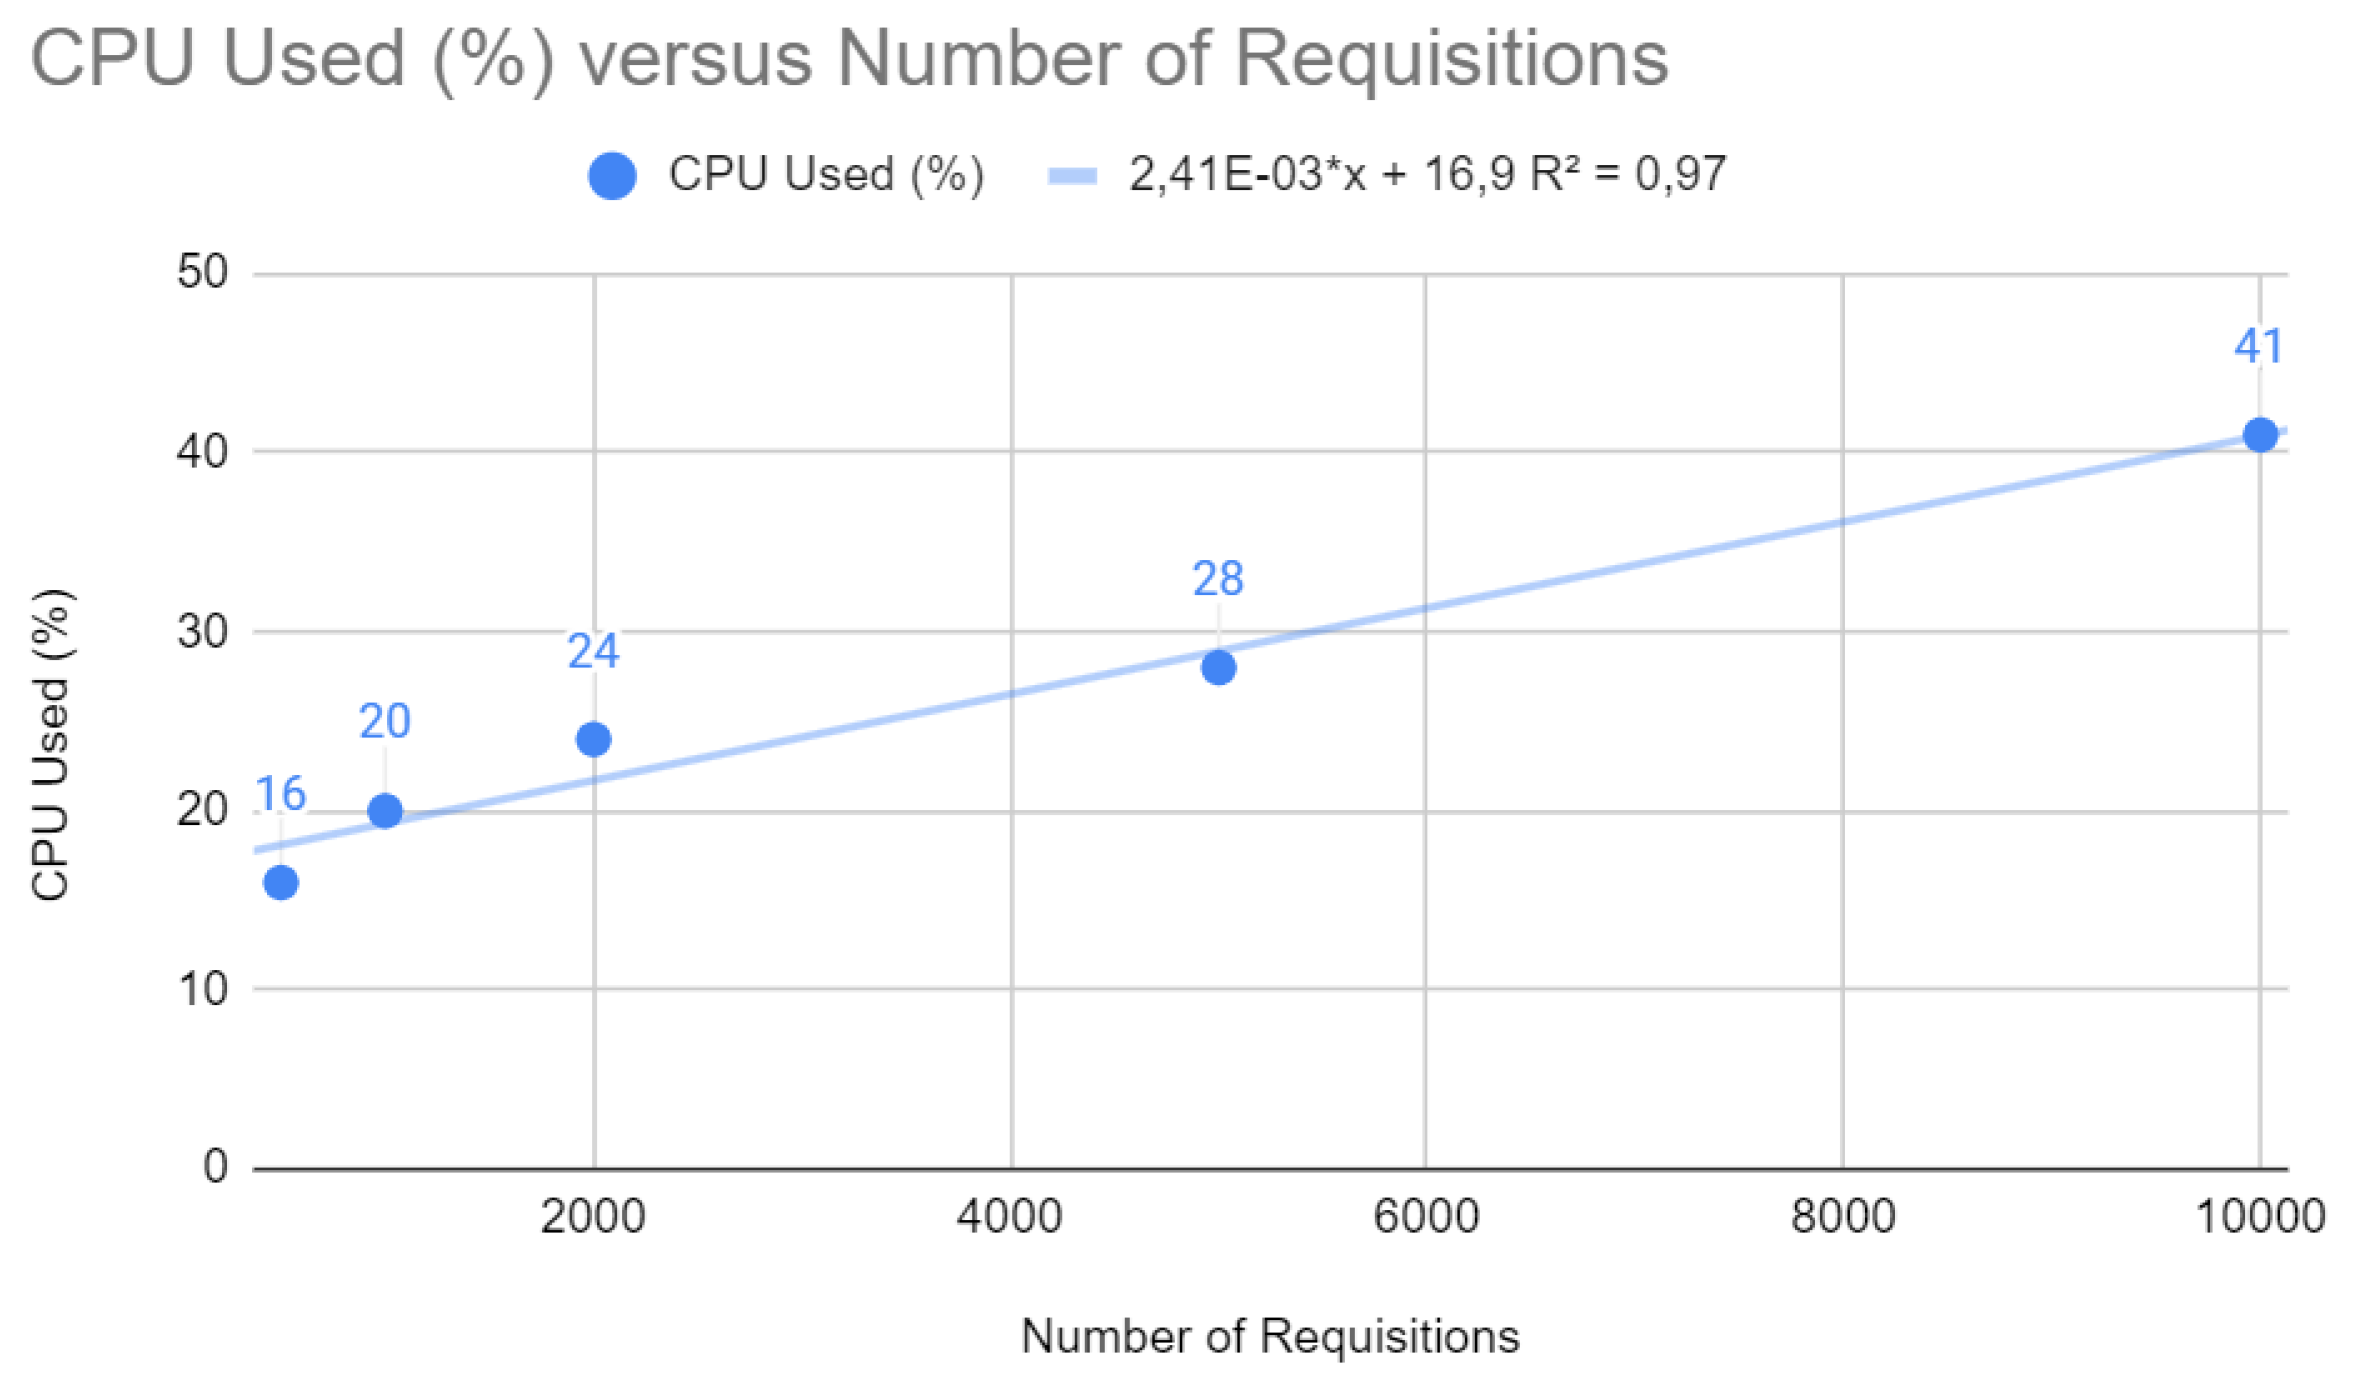
Figure 4 depicts a linear relationship between the percentage of CPU usage and the number of requests. The trend line equation is
, indicating that for each additional request, there is a corresponding increase in CPU usage of approximately
. In web development, a linear increase in CPU utilization concerning the number of requests, as shown by the ratio, may suggest that the application is scaling as expected regarding workload. However, high CPU usage can also indicate that the application may not be efficient in terms of computing or that the server may reach its limit under heavy loads, which could lead to a degradation in performance or even failures.
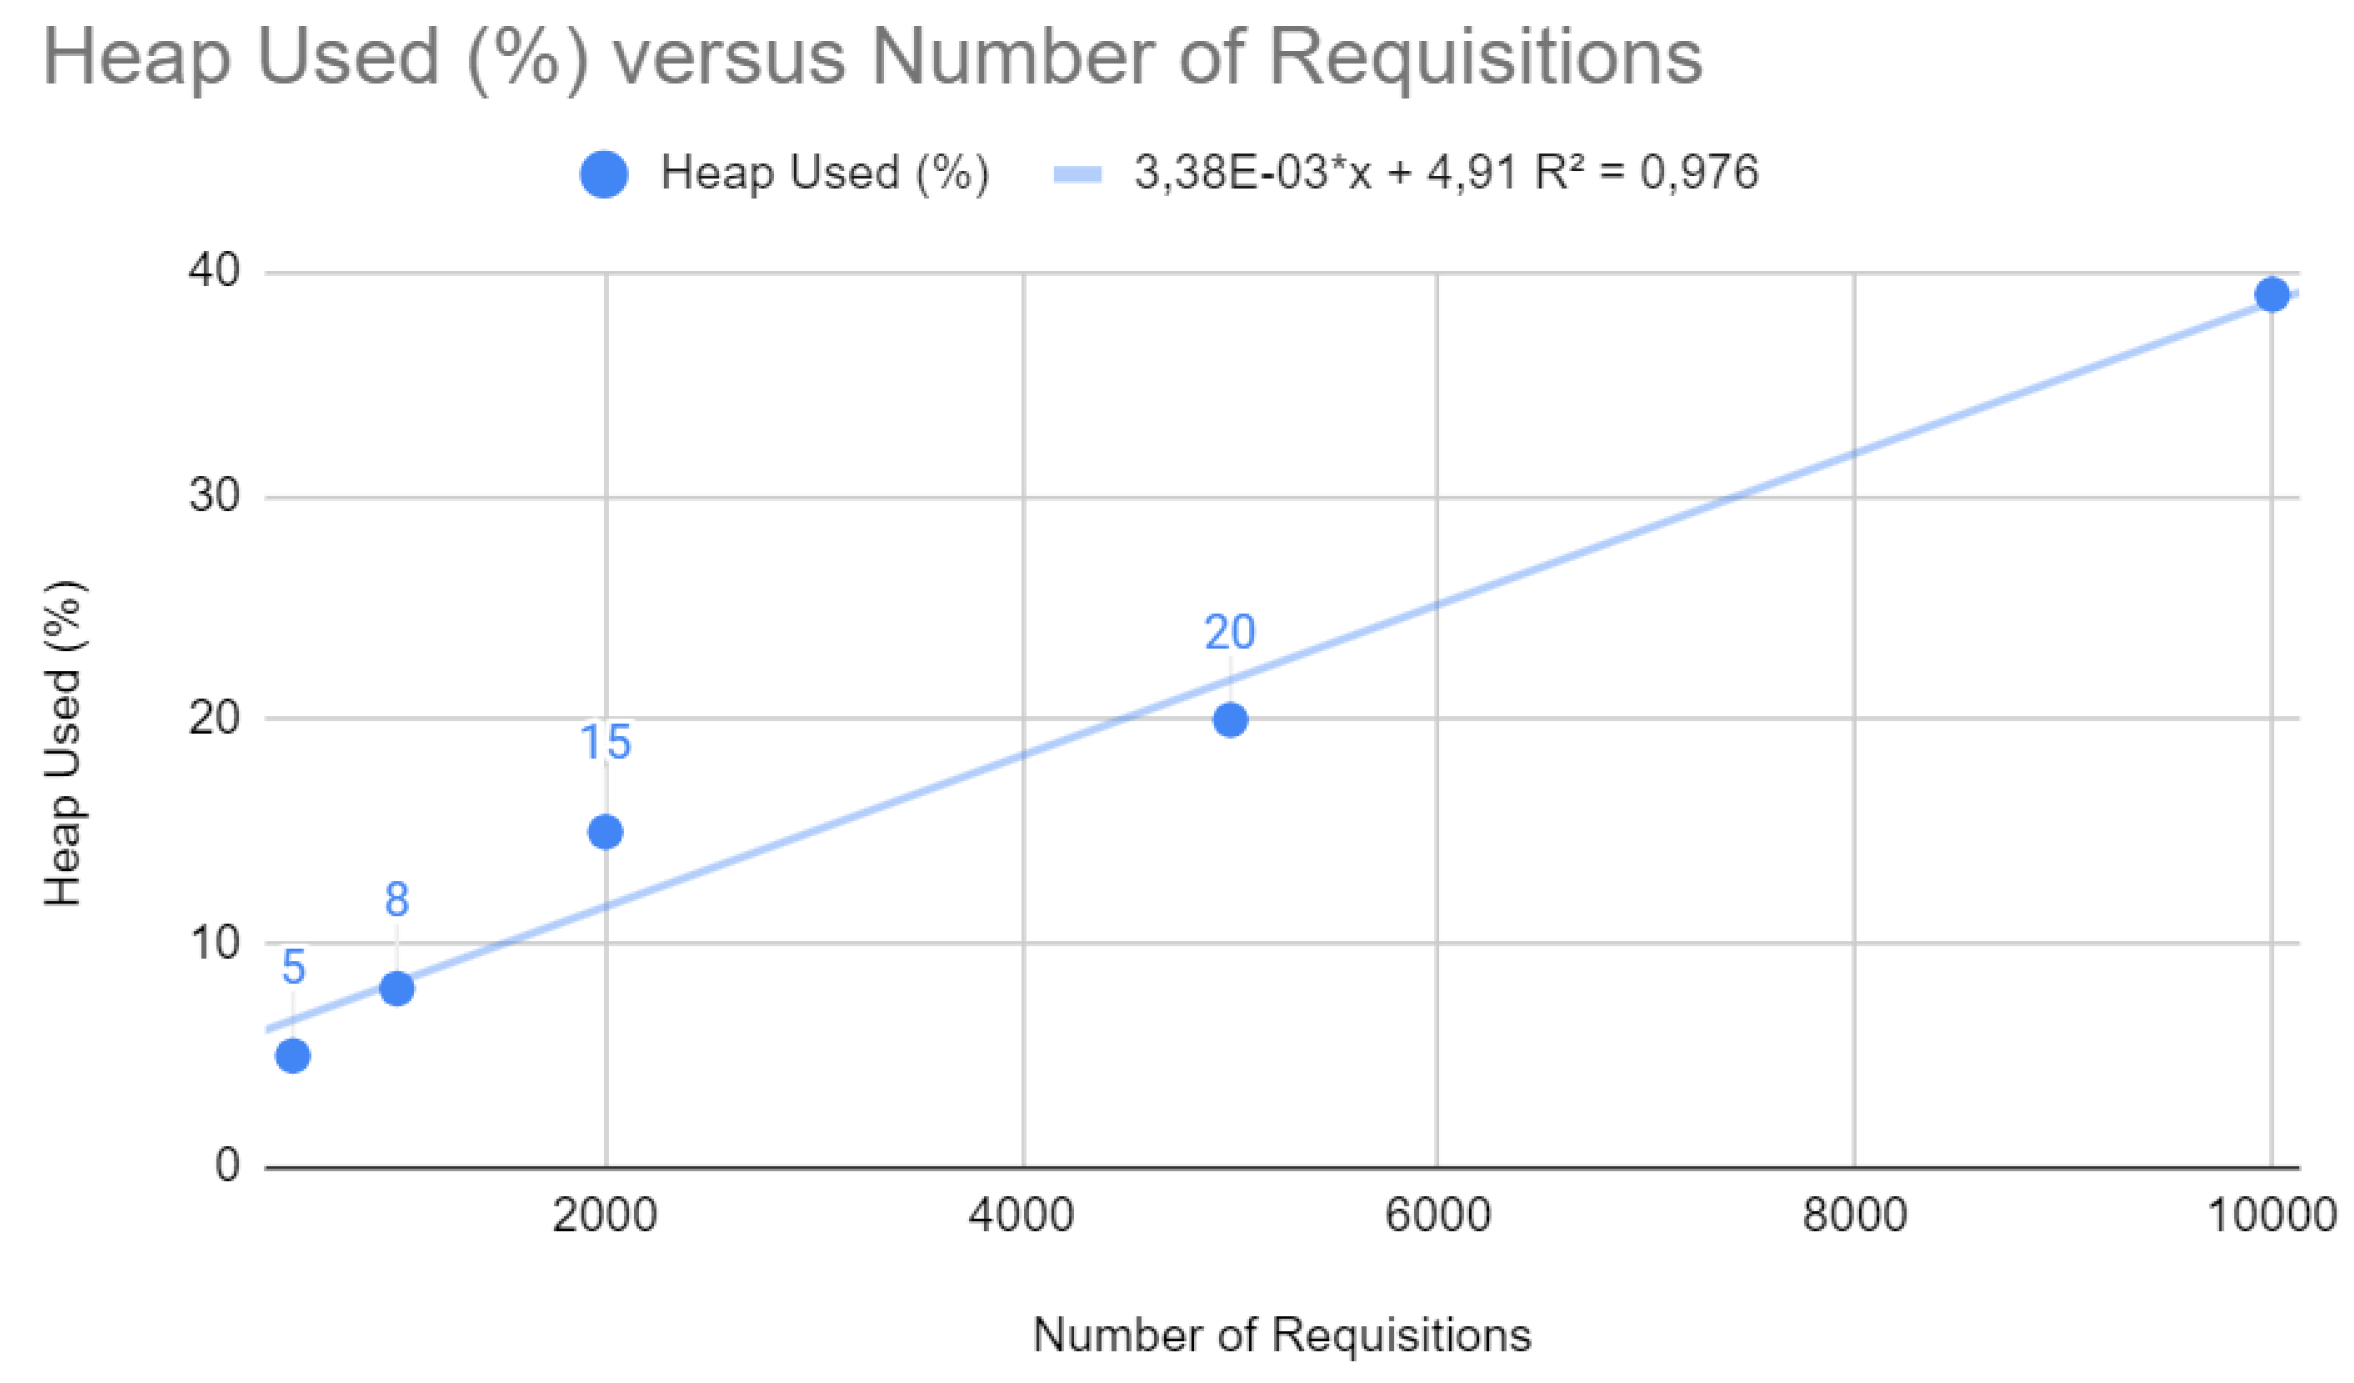
Figure 5 shows the percentage of heap memory used as the number of requests increases, following a linear trend (
). The linear relationship shows that heap utilization increases with the number of requests. This is expected in web applications, as each request can create new objects. However, if heap memory approaches its maximum capacity, the system may face more frequent garbage collection problems, which can cause service pauses and affect application latency.
Below are the results after the improvements have been applied.
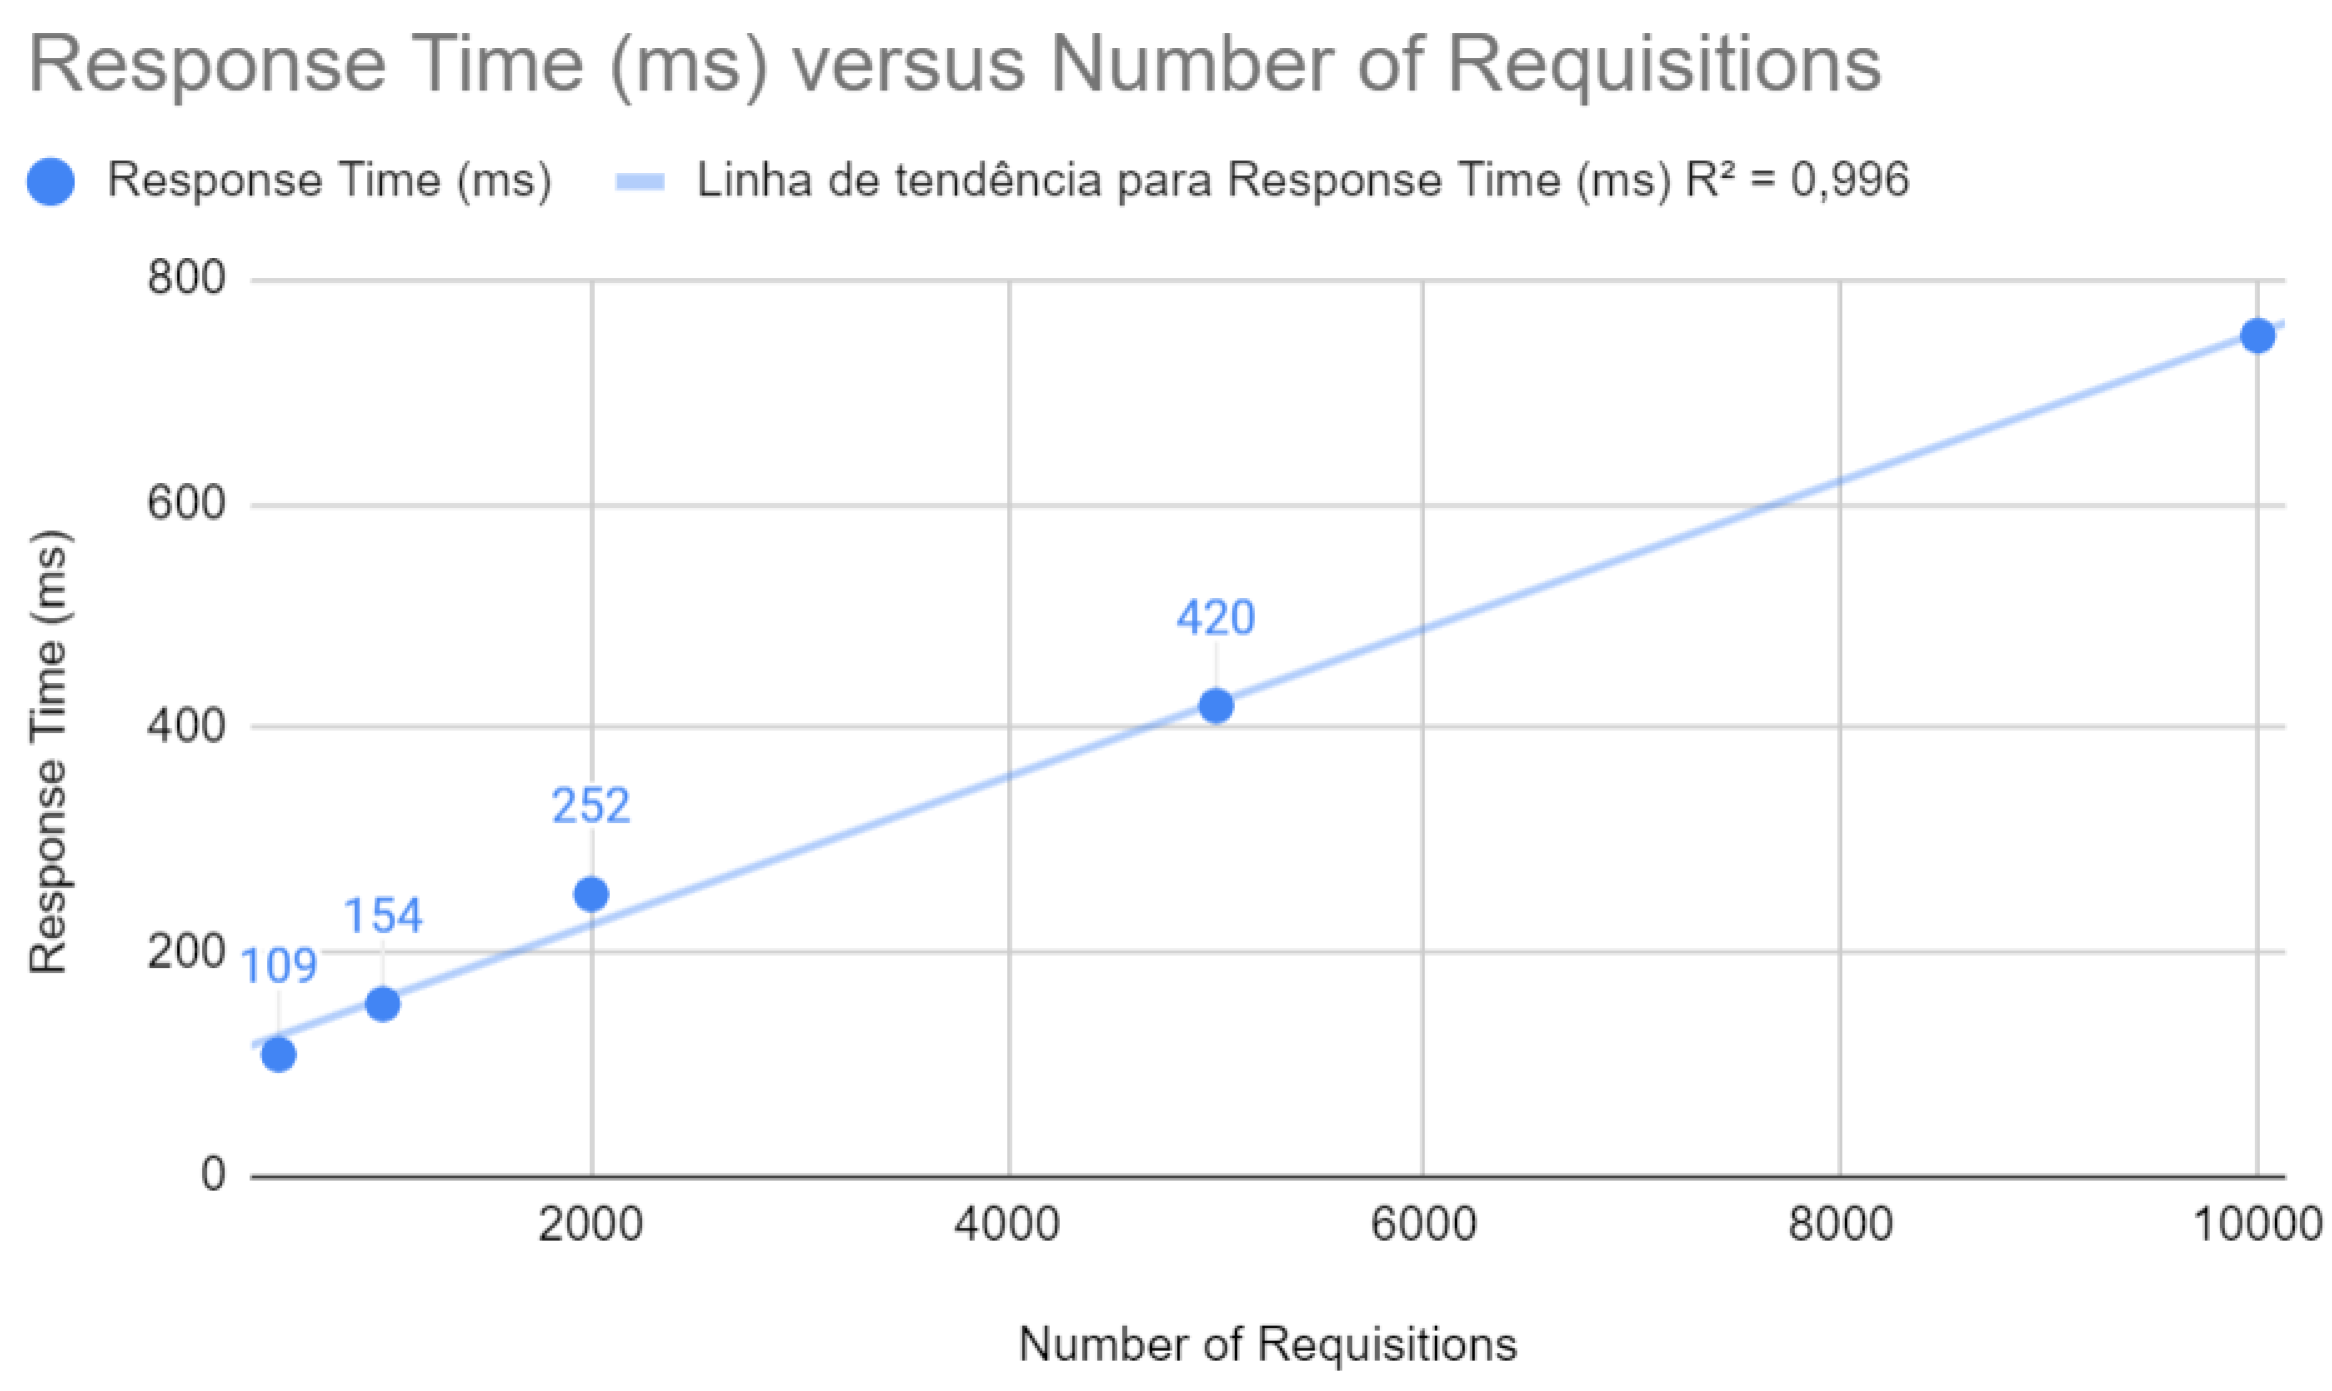
Figure 6 shows that the response time maintains a remarkable linearity concerning the number of requests, with a
of 0.996. This reflects the effectiveness of the improvements in ensuring that the application maintains consistent performance in terms of response time, a crucial factor for the end-user experience.
Figure 7 indicates a highly linear relationship between CPU usage and the number of requests with a coefficient of determination of
. This implies that the optimized application uses CPU resources more efficiently, an indicator of scalability and stability under increasing loads.
As illustrated in
Figure 8, heap memory usage follows a linear trend with a
of 0.993. The optimizations implemented seem to have improved memory management, maintaining stability and performance even with the increase in the number of requests.
5.2. Quarkus Application Results
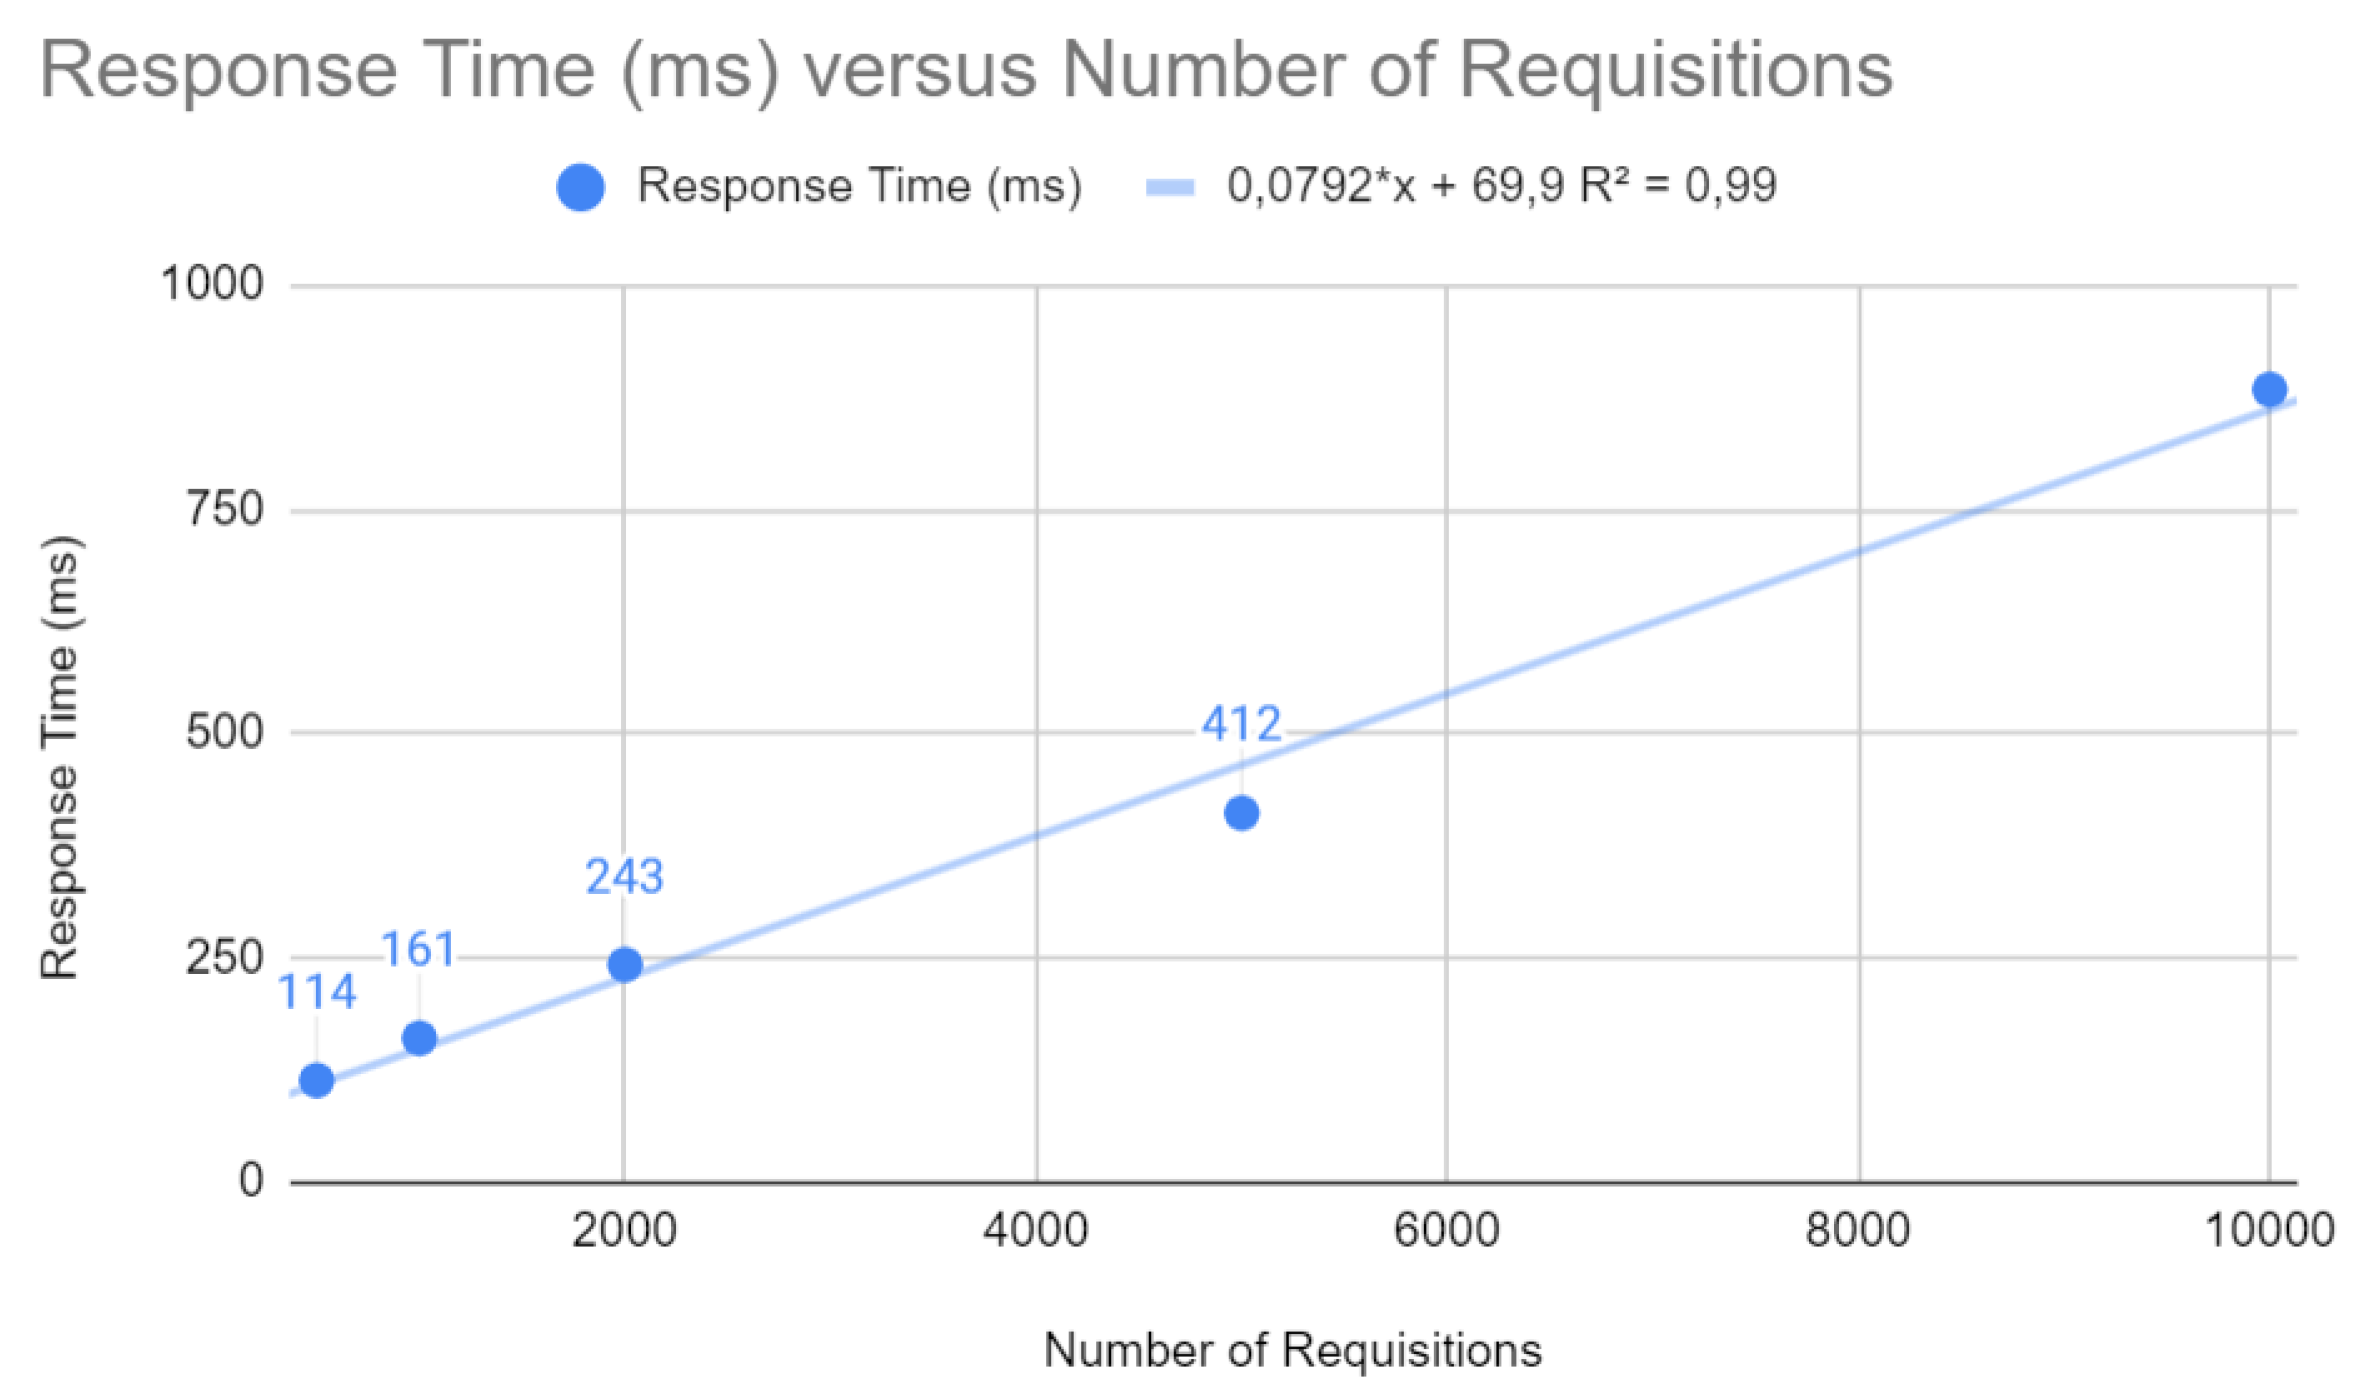
The results of the Quarkus application are presented below. The response time concerning the number of requests, as shown in
Figure 9, follows a linear trend
with a
. This indicates that, for each additional request, the response time increases by a relatively small amount. In a web context, where fast response times are crucial, the Quarkus framework can keep latency low, even under heavy load.
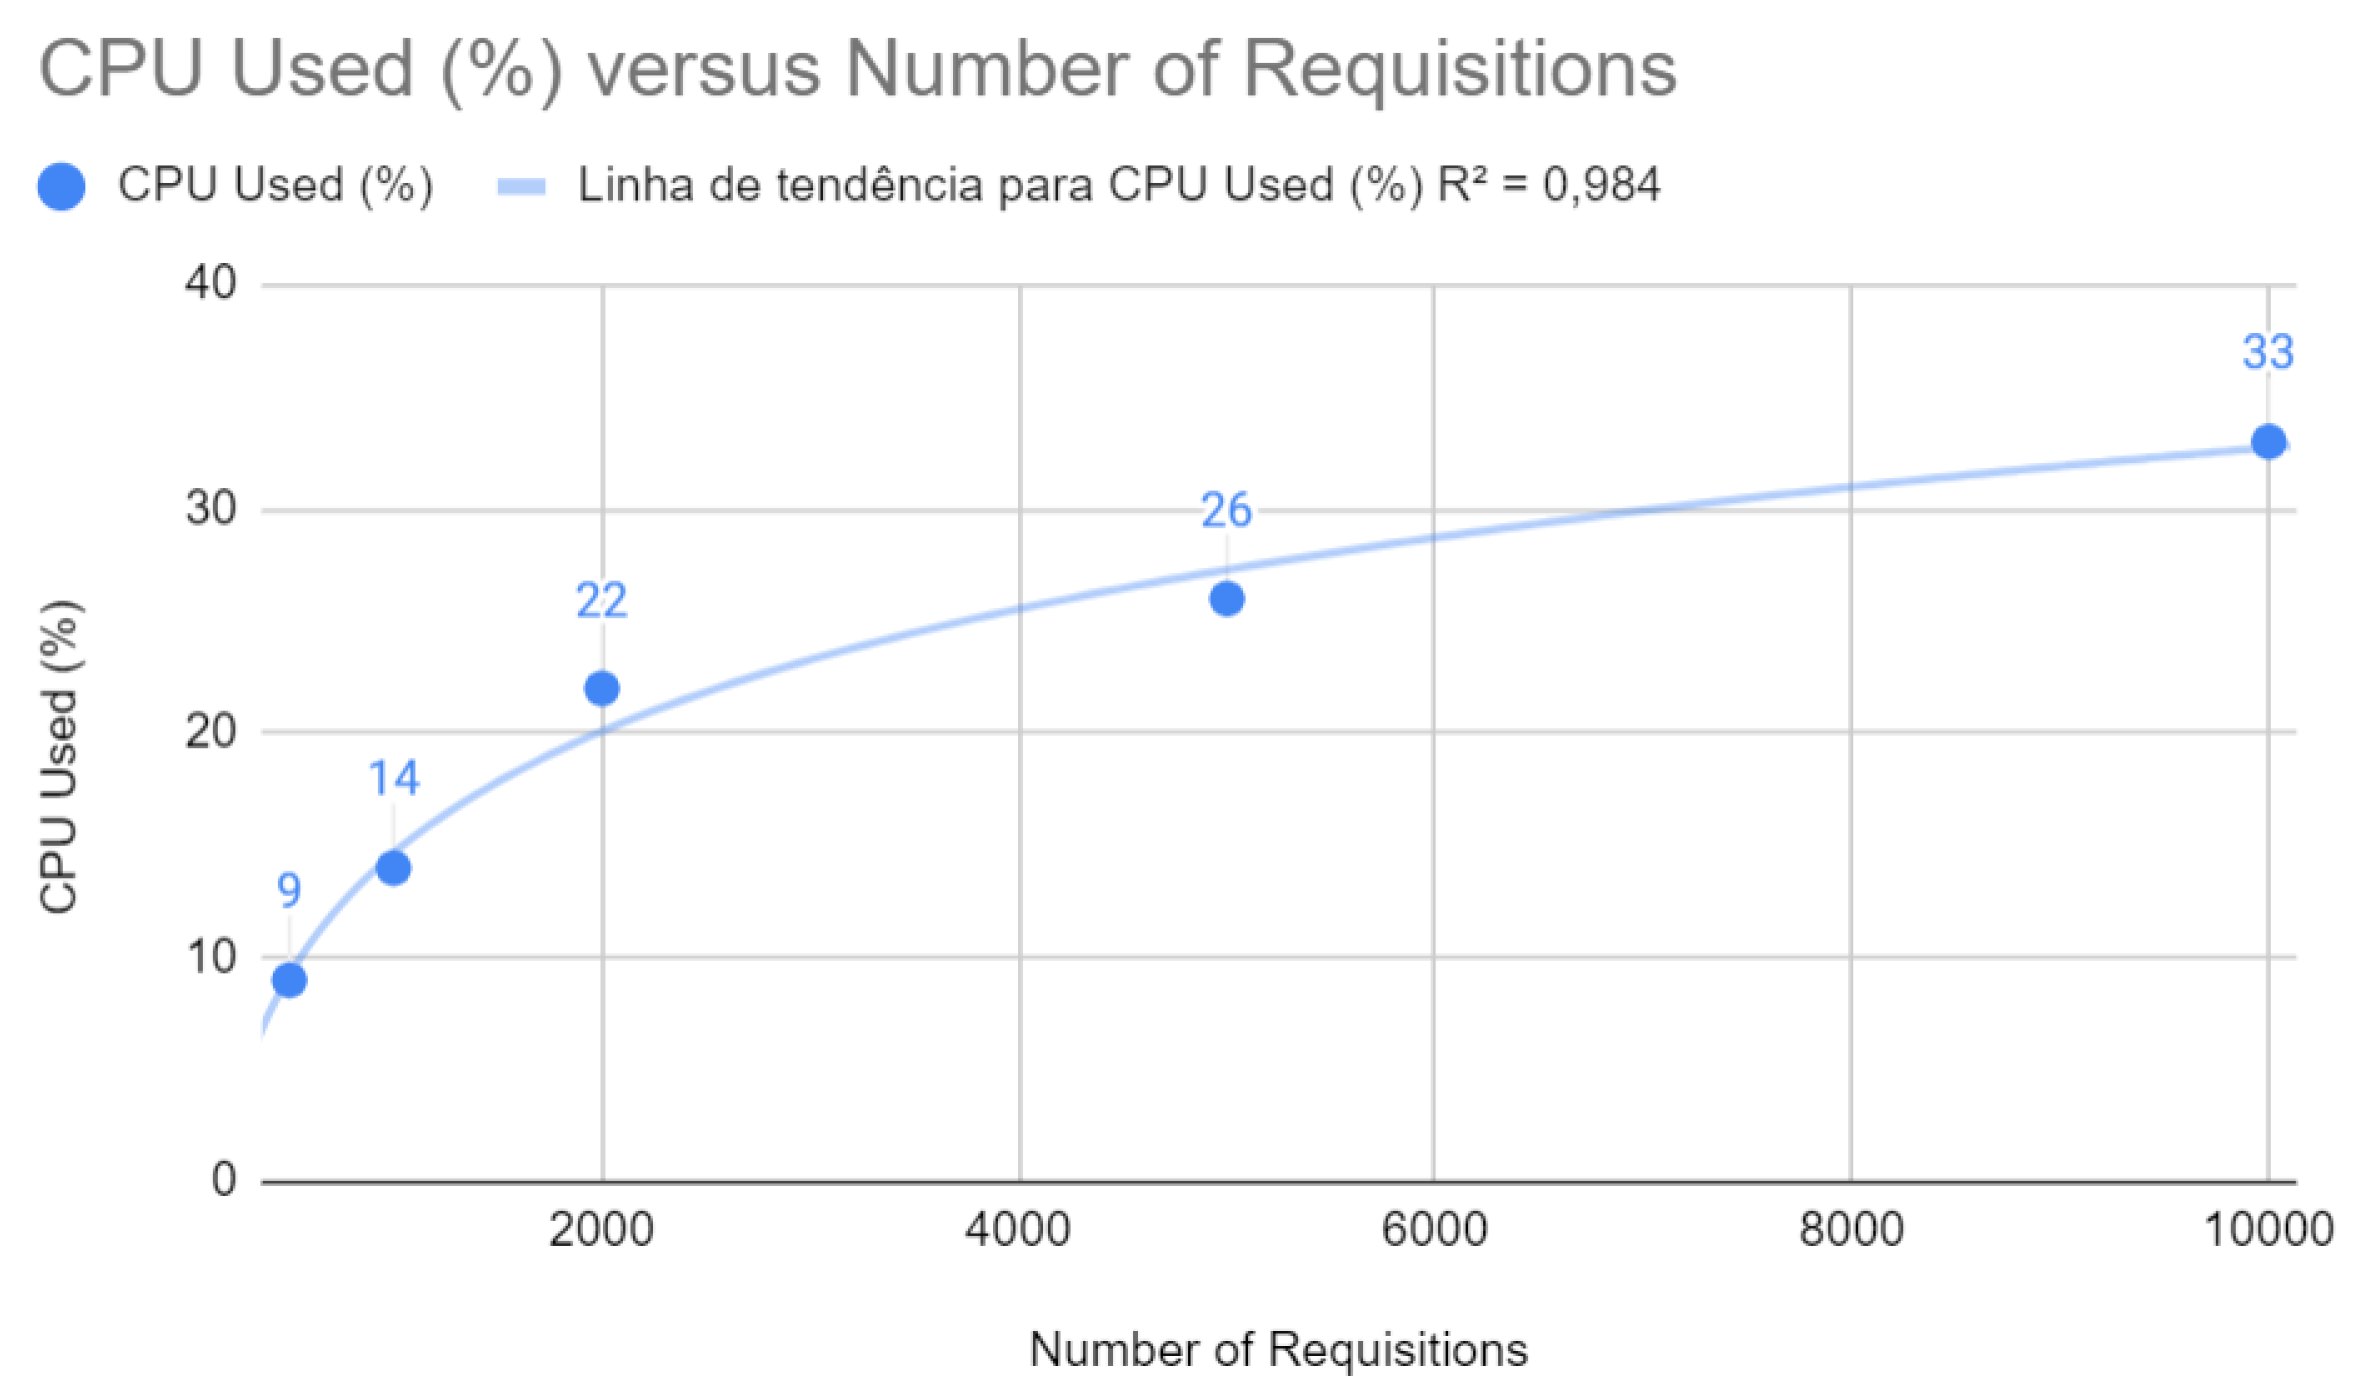
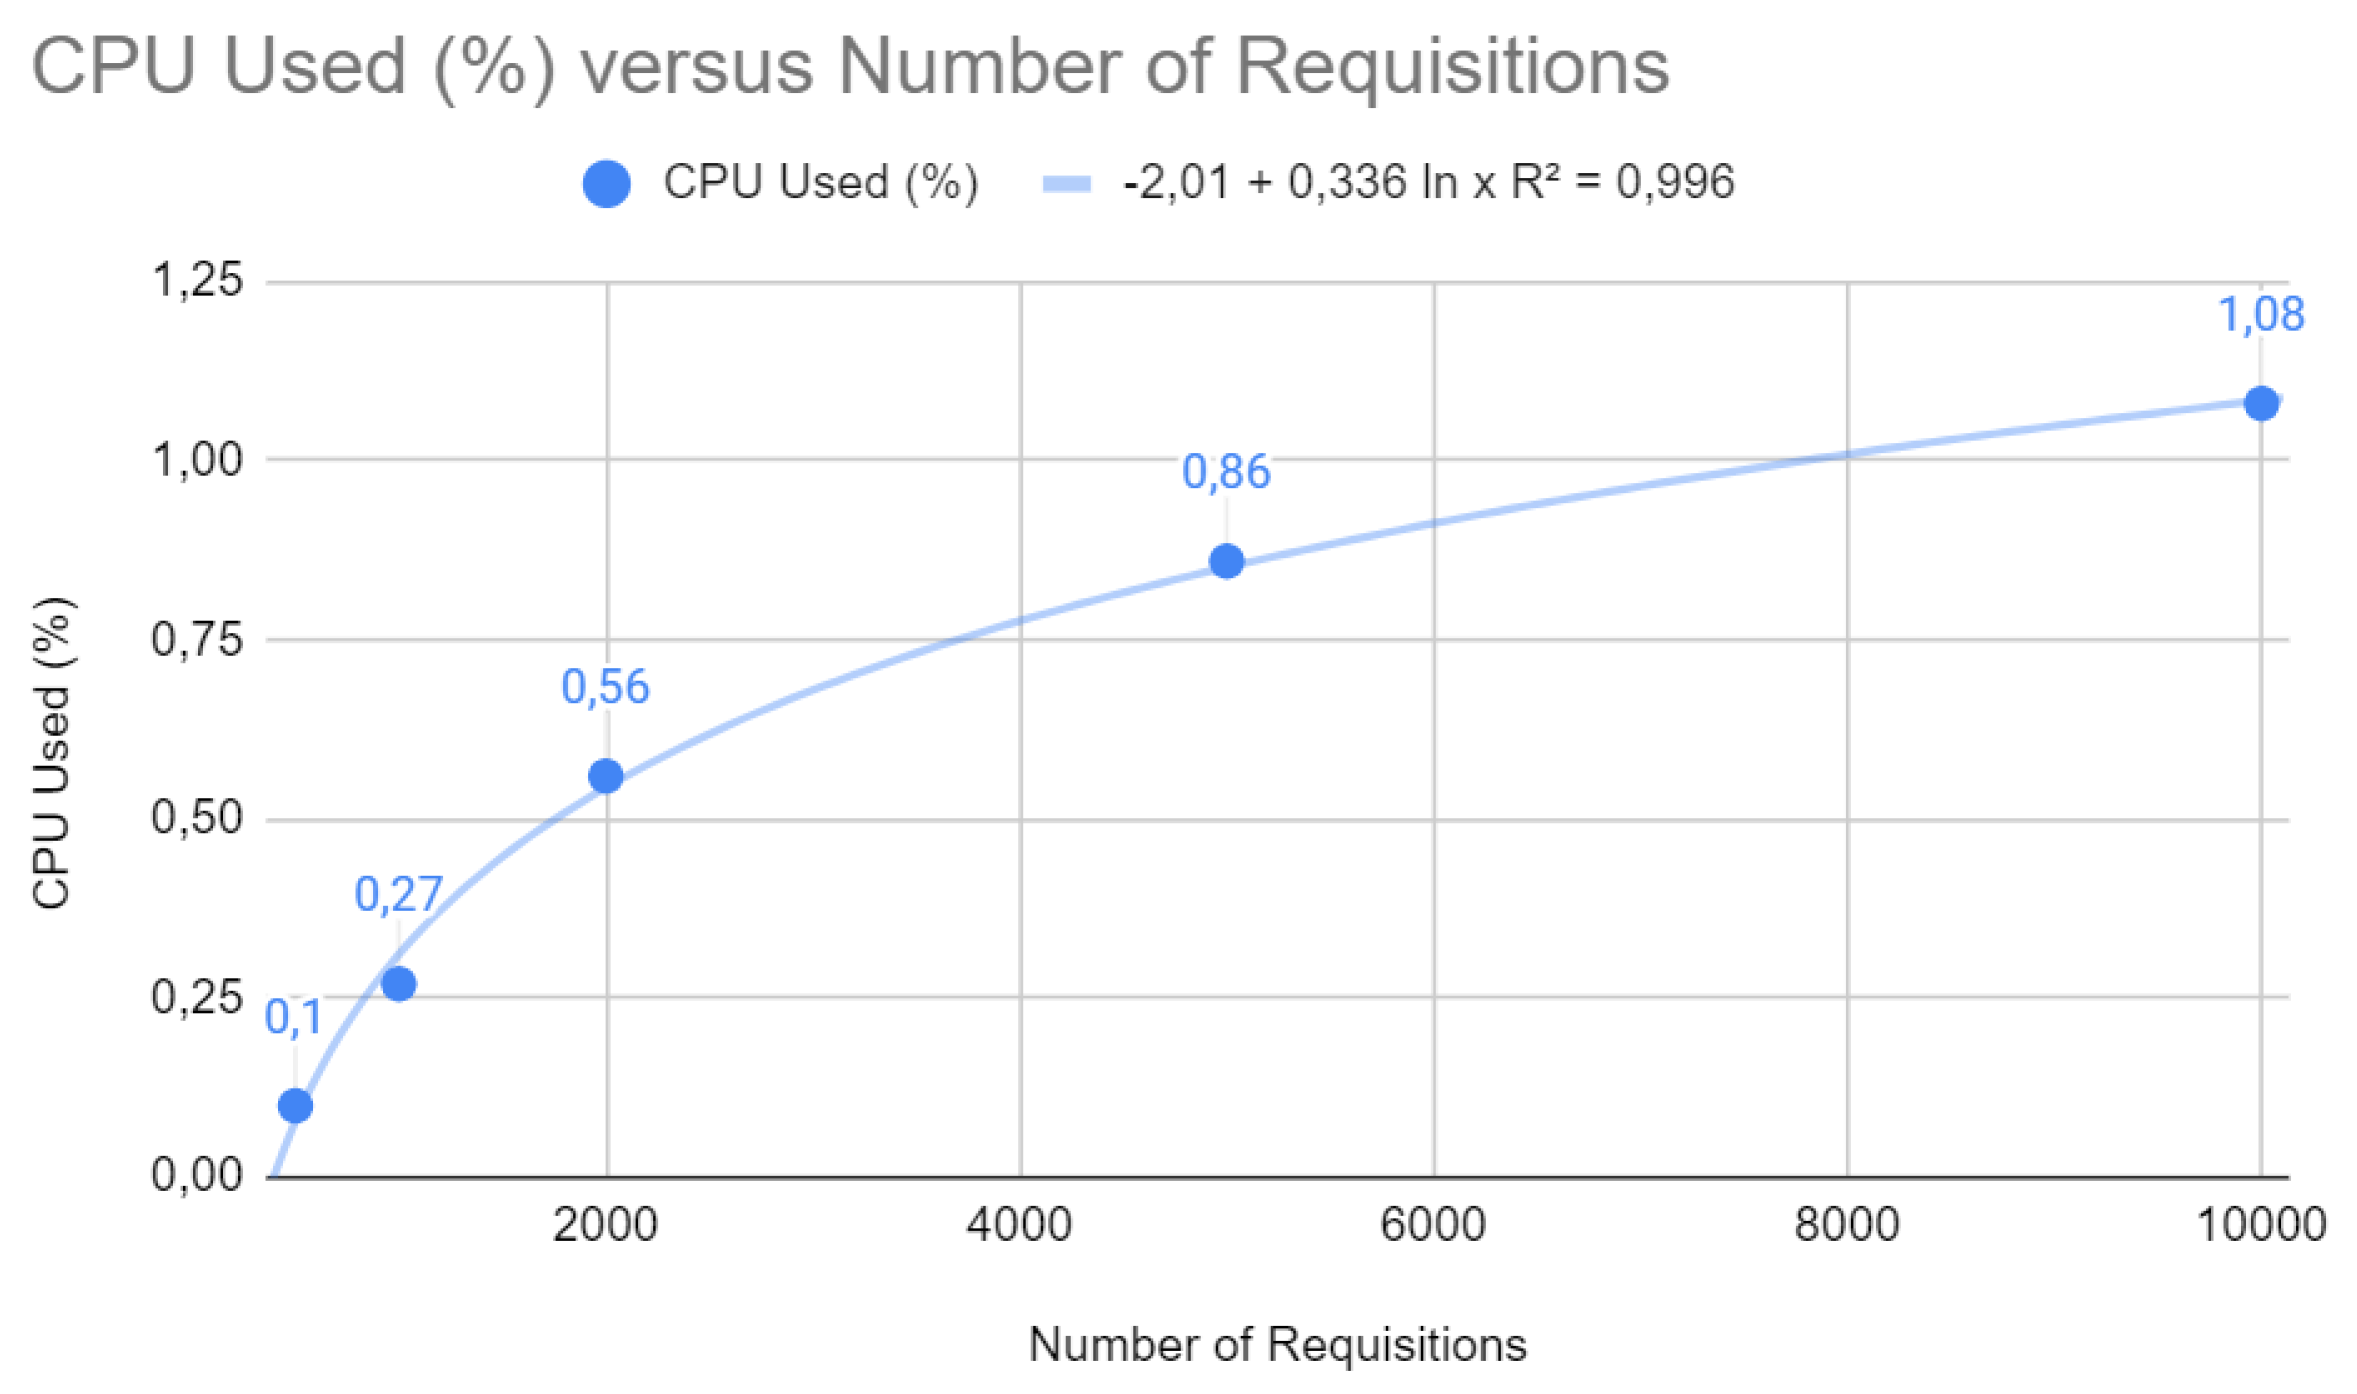
Figure 10 shows a logarithmic trend curve for CPU usage that stabilizes as the number of requests increases. The equation
with a coefficient of determination
suggests that CPU usage grows initially, but the rate of growth slows down with more significant numbers of requests. Mathematically, this is a desirable characteristic, as it indicates that the application becomes less sensitive to peak demand as it scales, which indicates efficient load distribution and good management of computing resources.
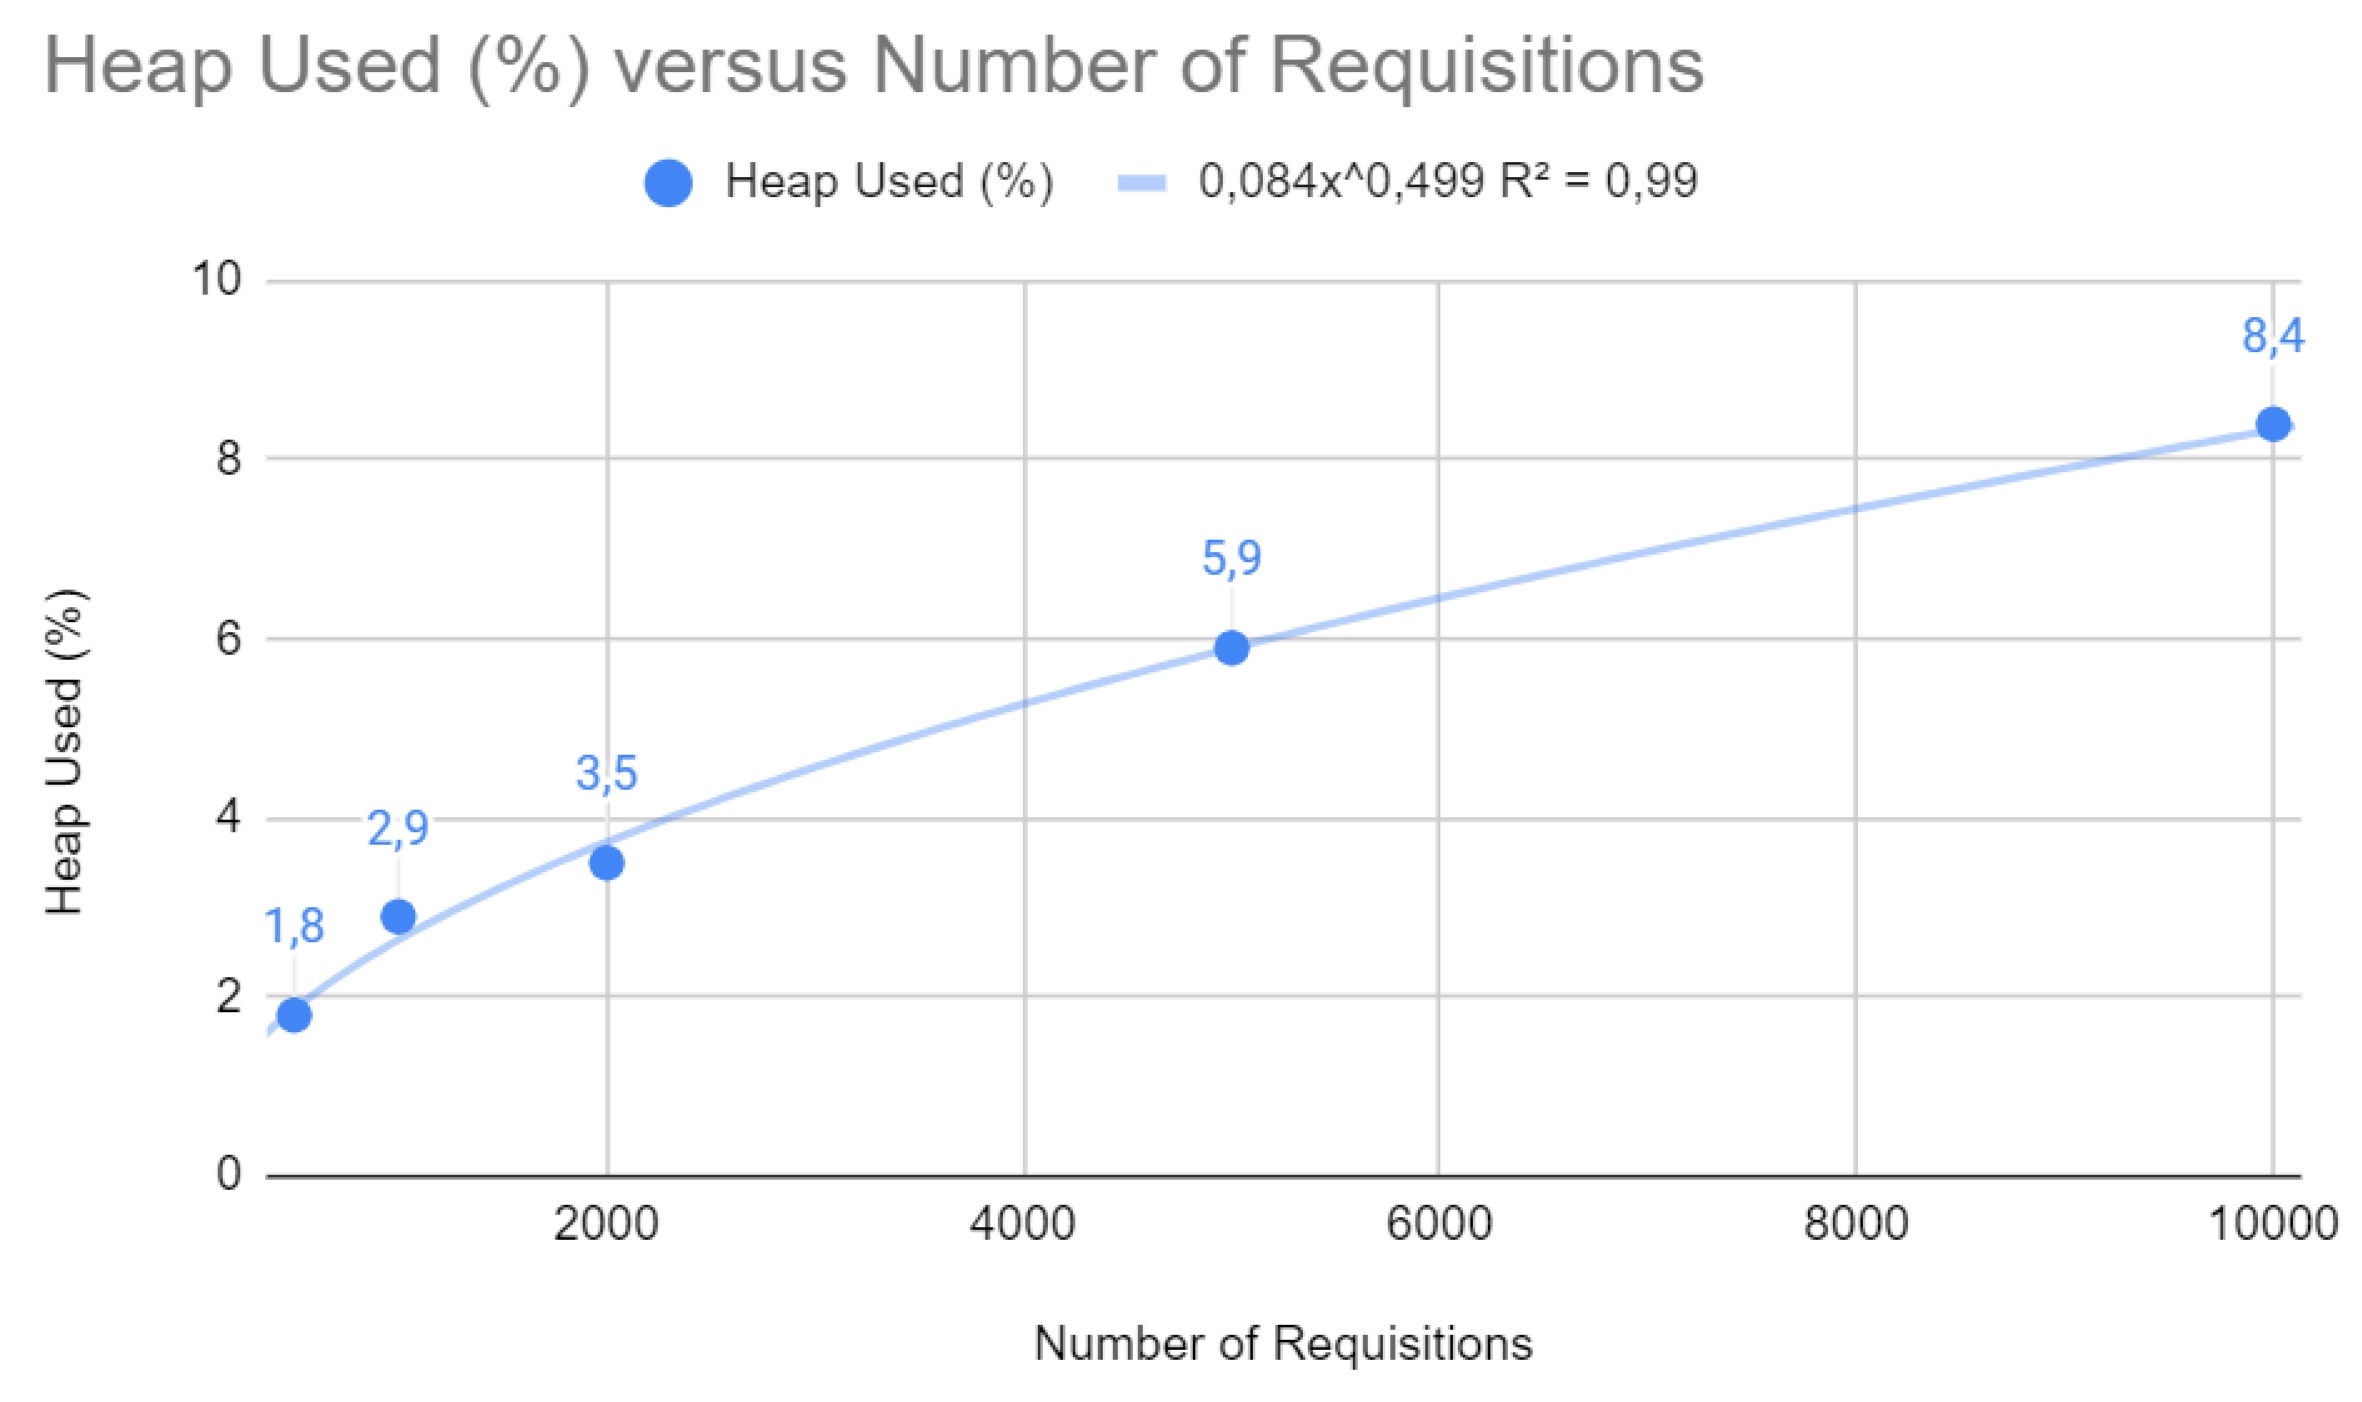
The relationship between heap memory usage and the number of requests, as shown in
Figure 11, is described by a potential function
with a
close to 1 (0.99). This shows that memory usage increases less proportionally than the number of requests, which implies efficient memory allocation and optimized garbage collection management, both of which are fundamental to the scalability of a web application.
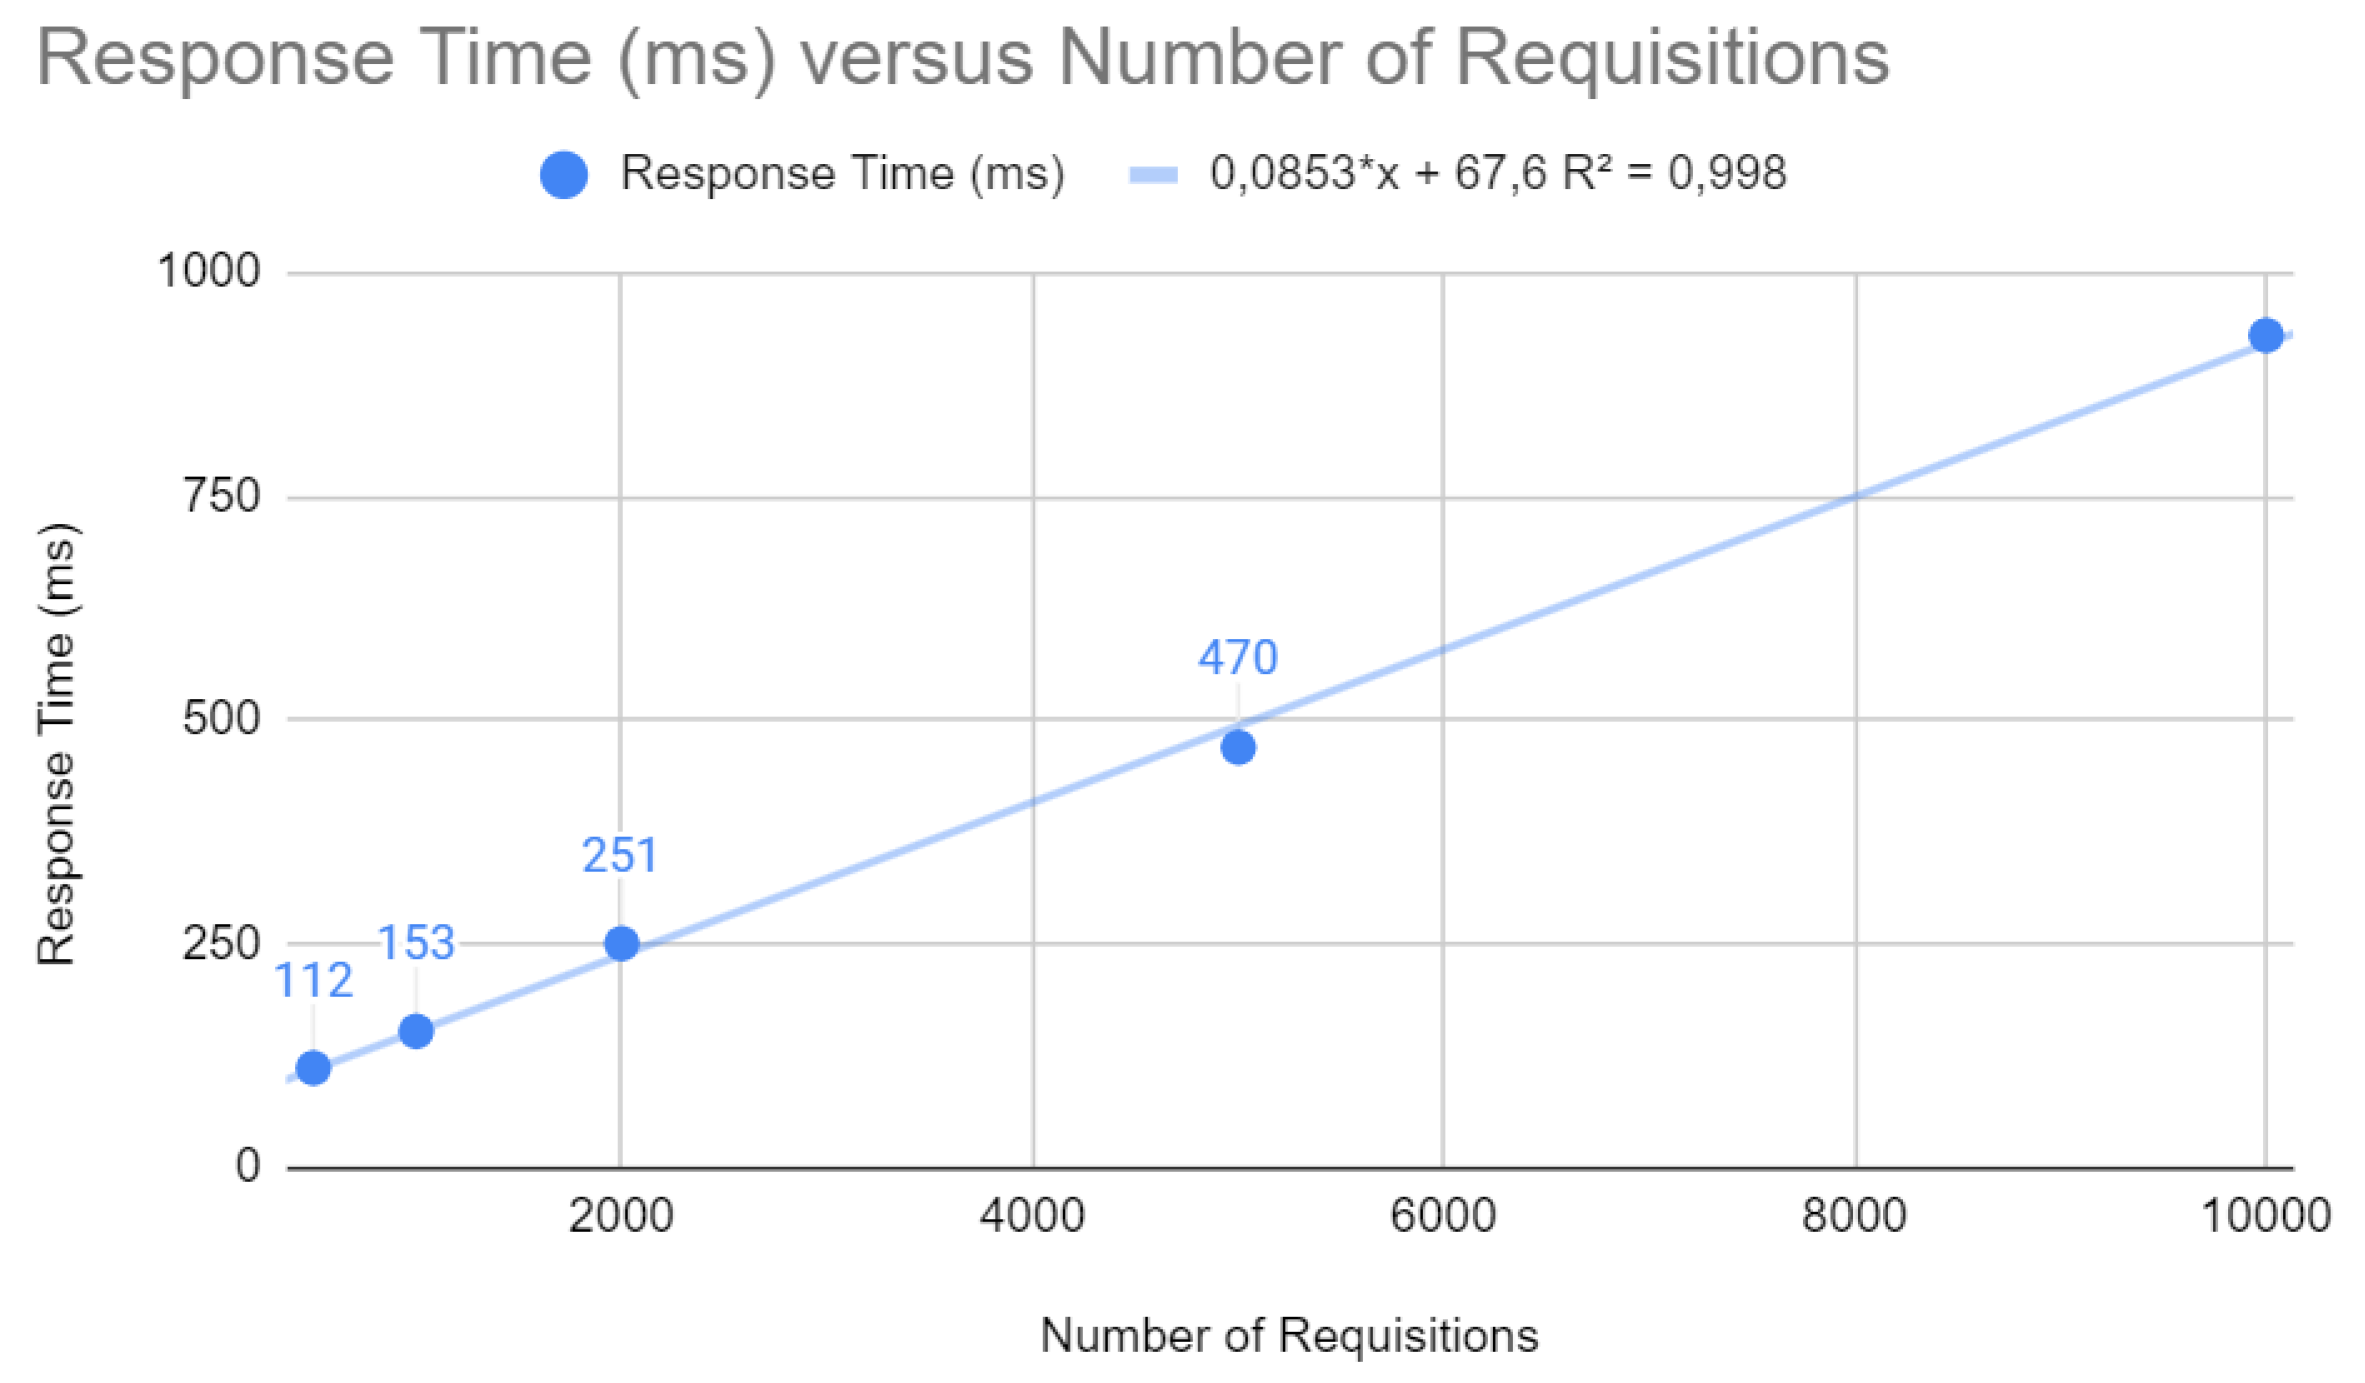
Differentiated results were obtained after the improvements were applied, as seen below. As shown in
Figure 12, the response time increases linearly with the number of requests, indicating that the application maintains consistent performance even under high demand.
Comparing the previous results with the current ones,
Figure 13 shows a significant reduction in the slope of the linear trend line of CPU usage. Mathematical analysis reveals that the optimized application now shows slower growth in CPU usage as the number of requests increases. This indicates that the application is scaling more efficiently from a computational point of view, as the additional load of each new request has a more minor impact on CPU usage.
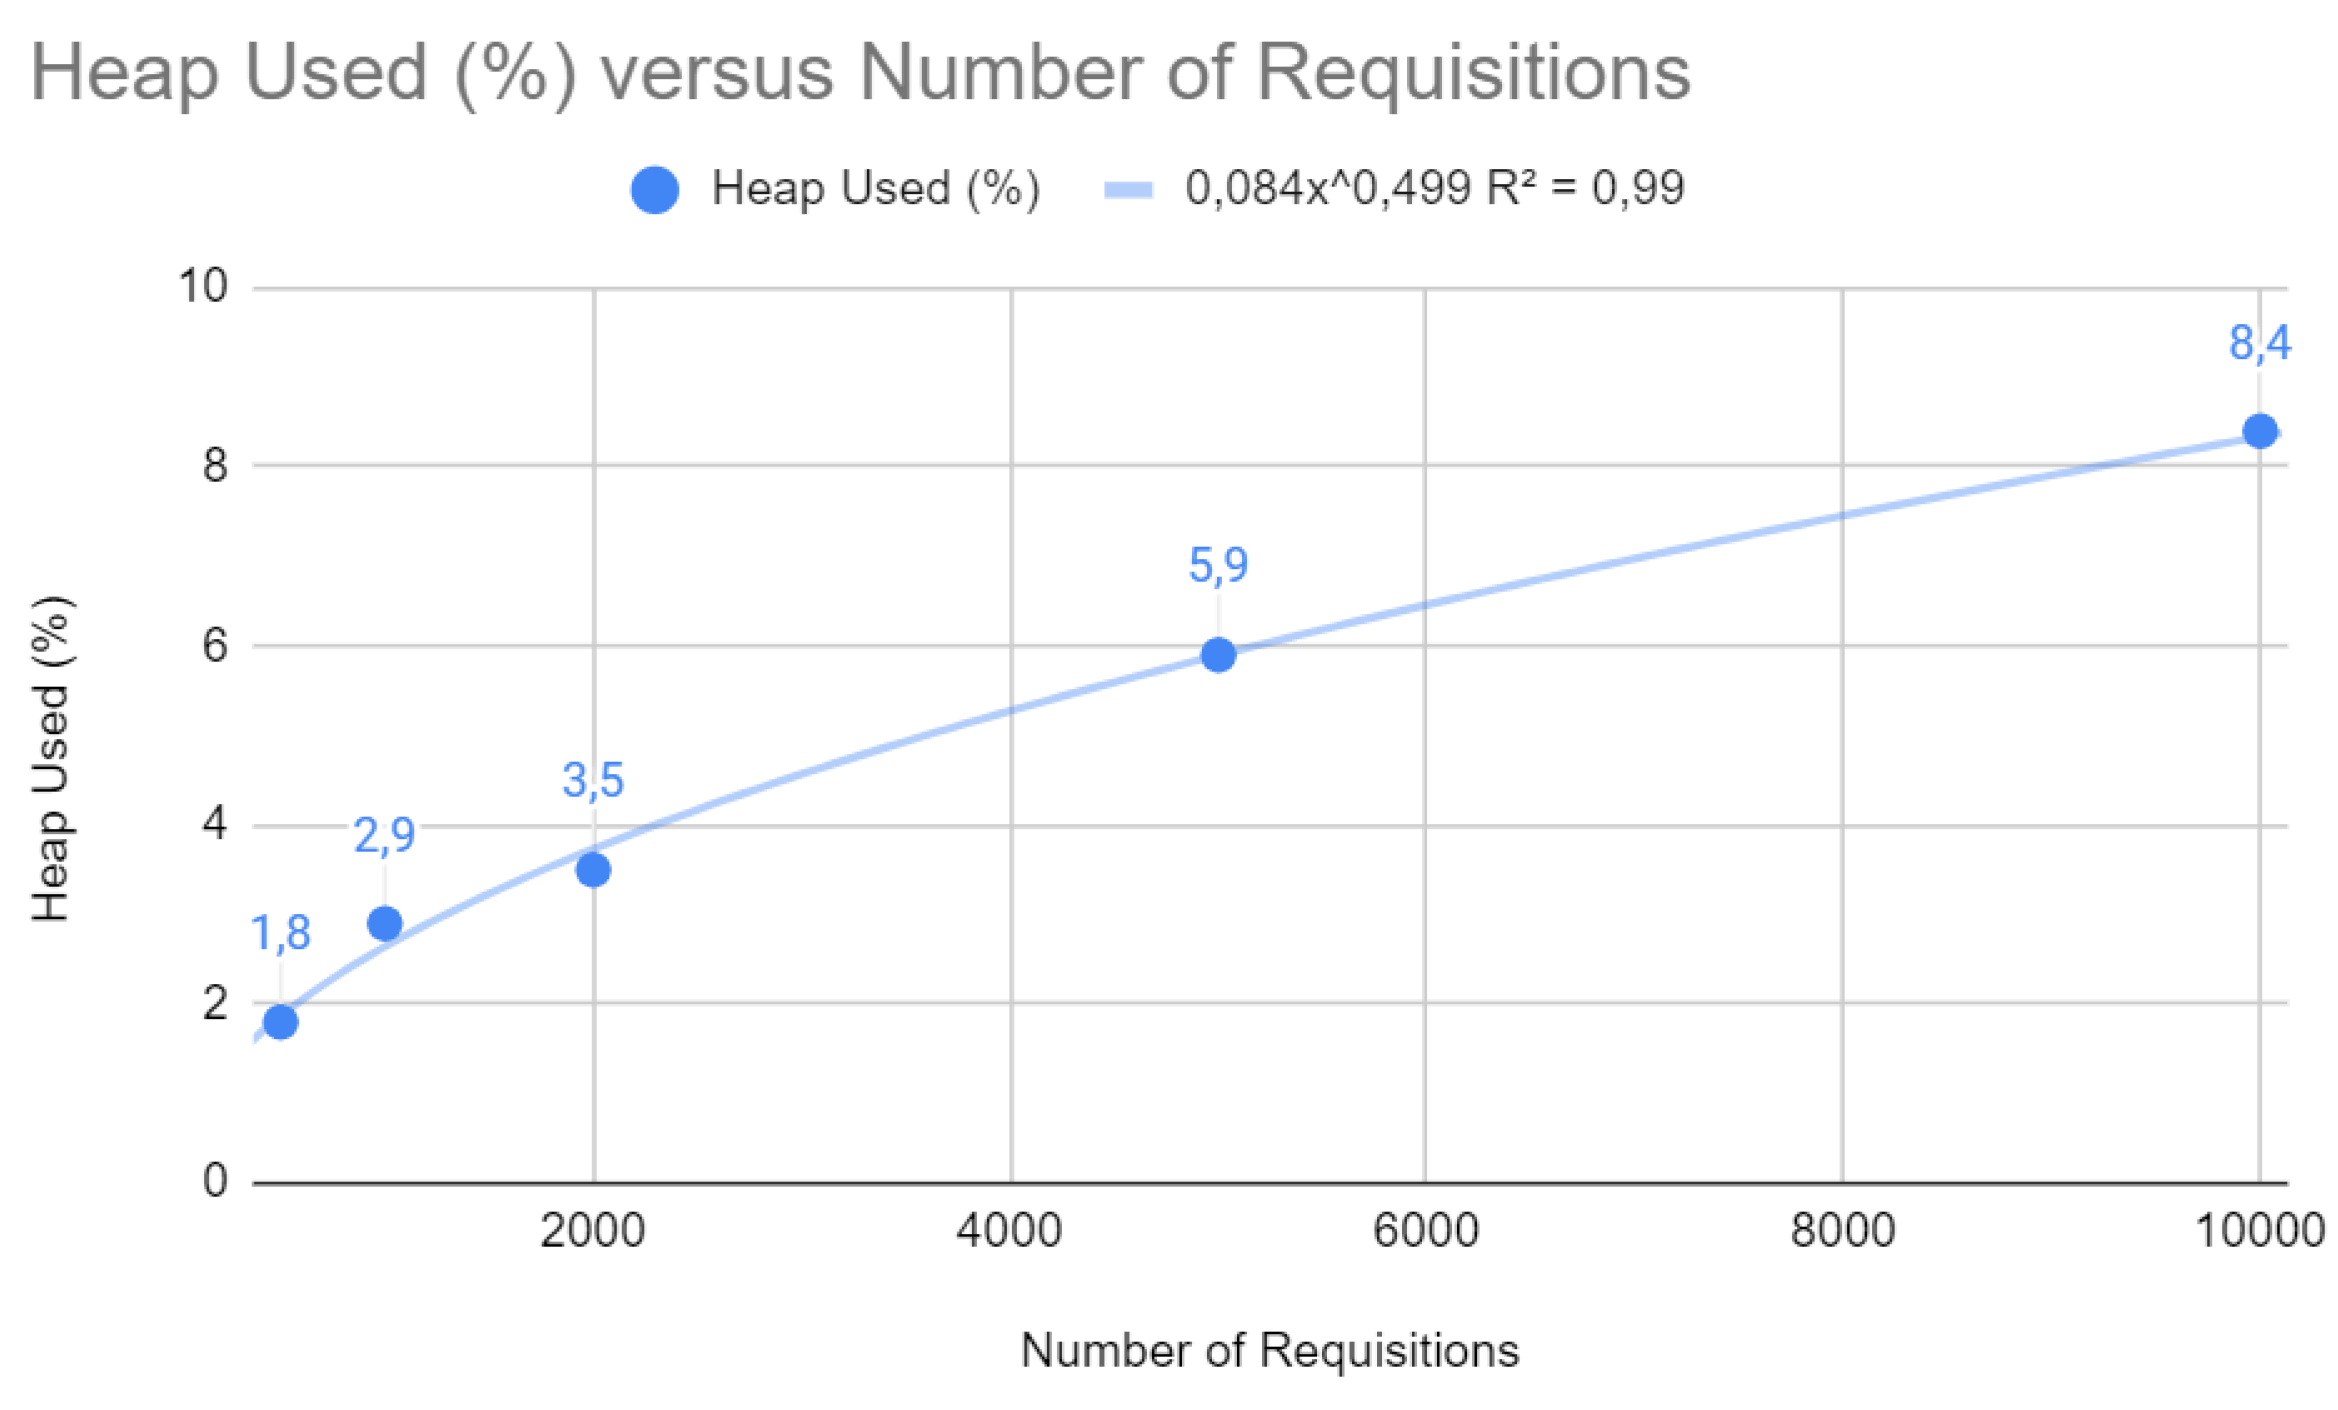
Looking at
Figure 14, the heap memory usage curve after the optimizations indicates a steeper asymptotic behaviour than the previous results. The adjusted potential function suggests memory allocation and management efficiency, which is essential for web applications that operate with large amounts of data and require efficient memory management to avoid latencies and service interruptions.
5.3. Comparison between the Two Applications
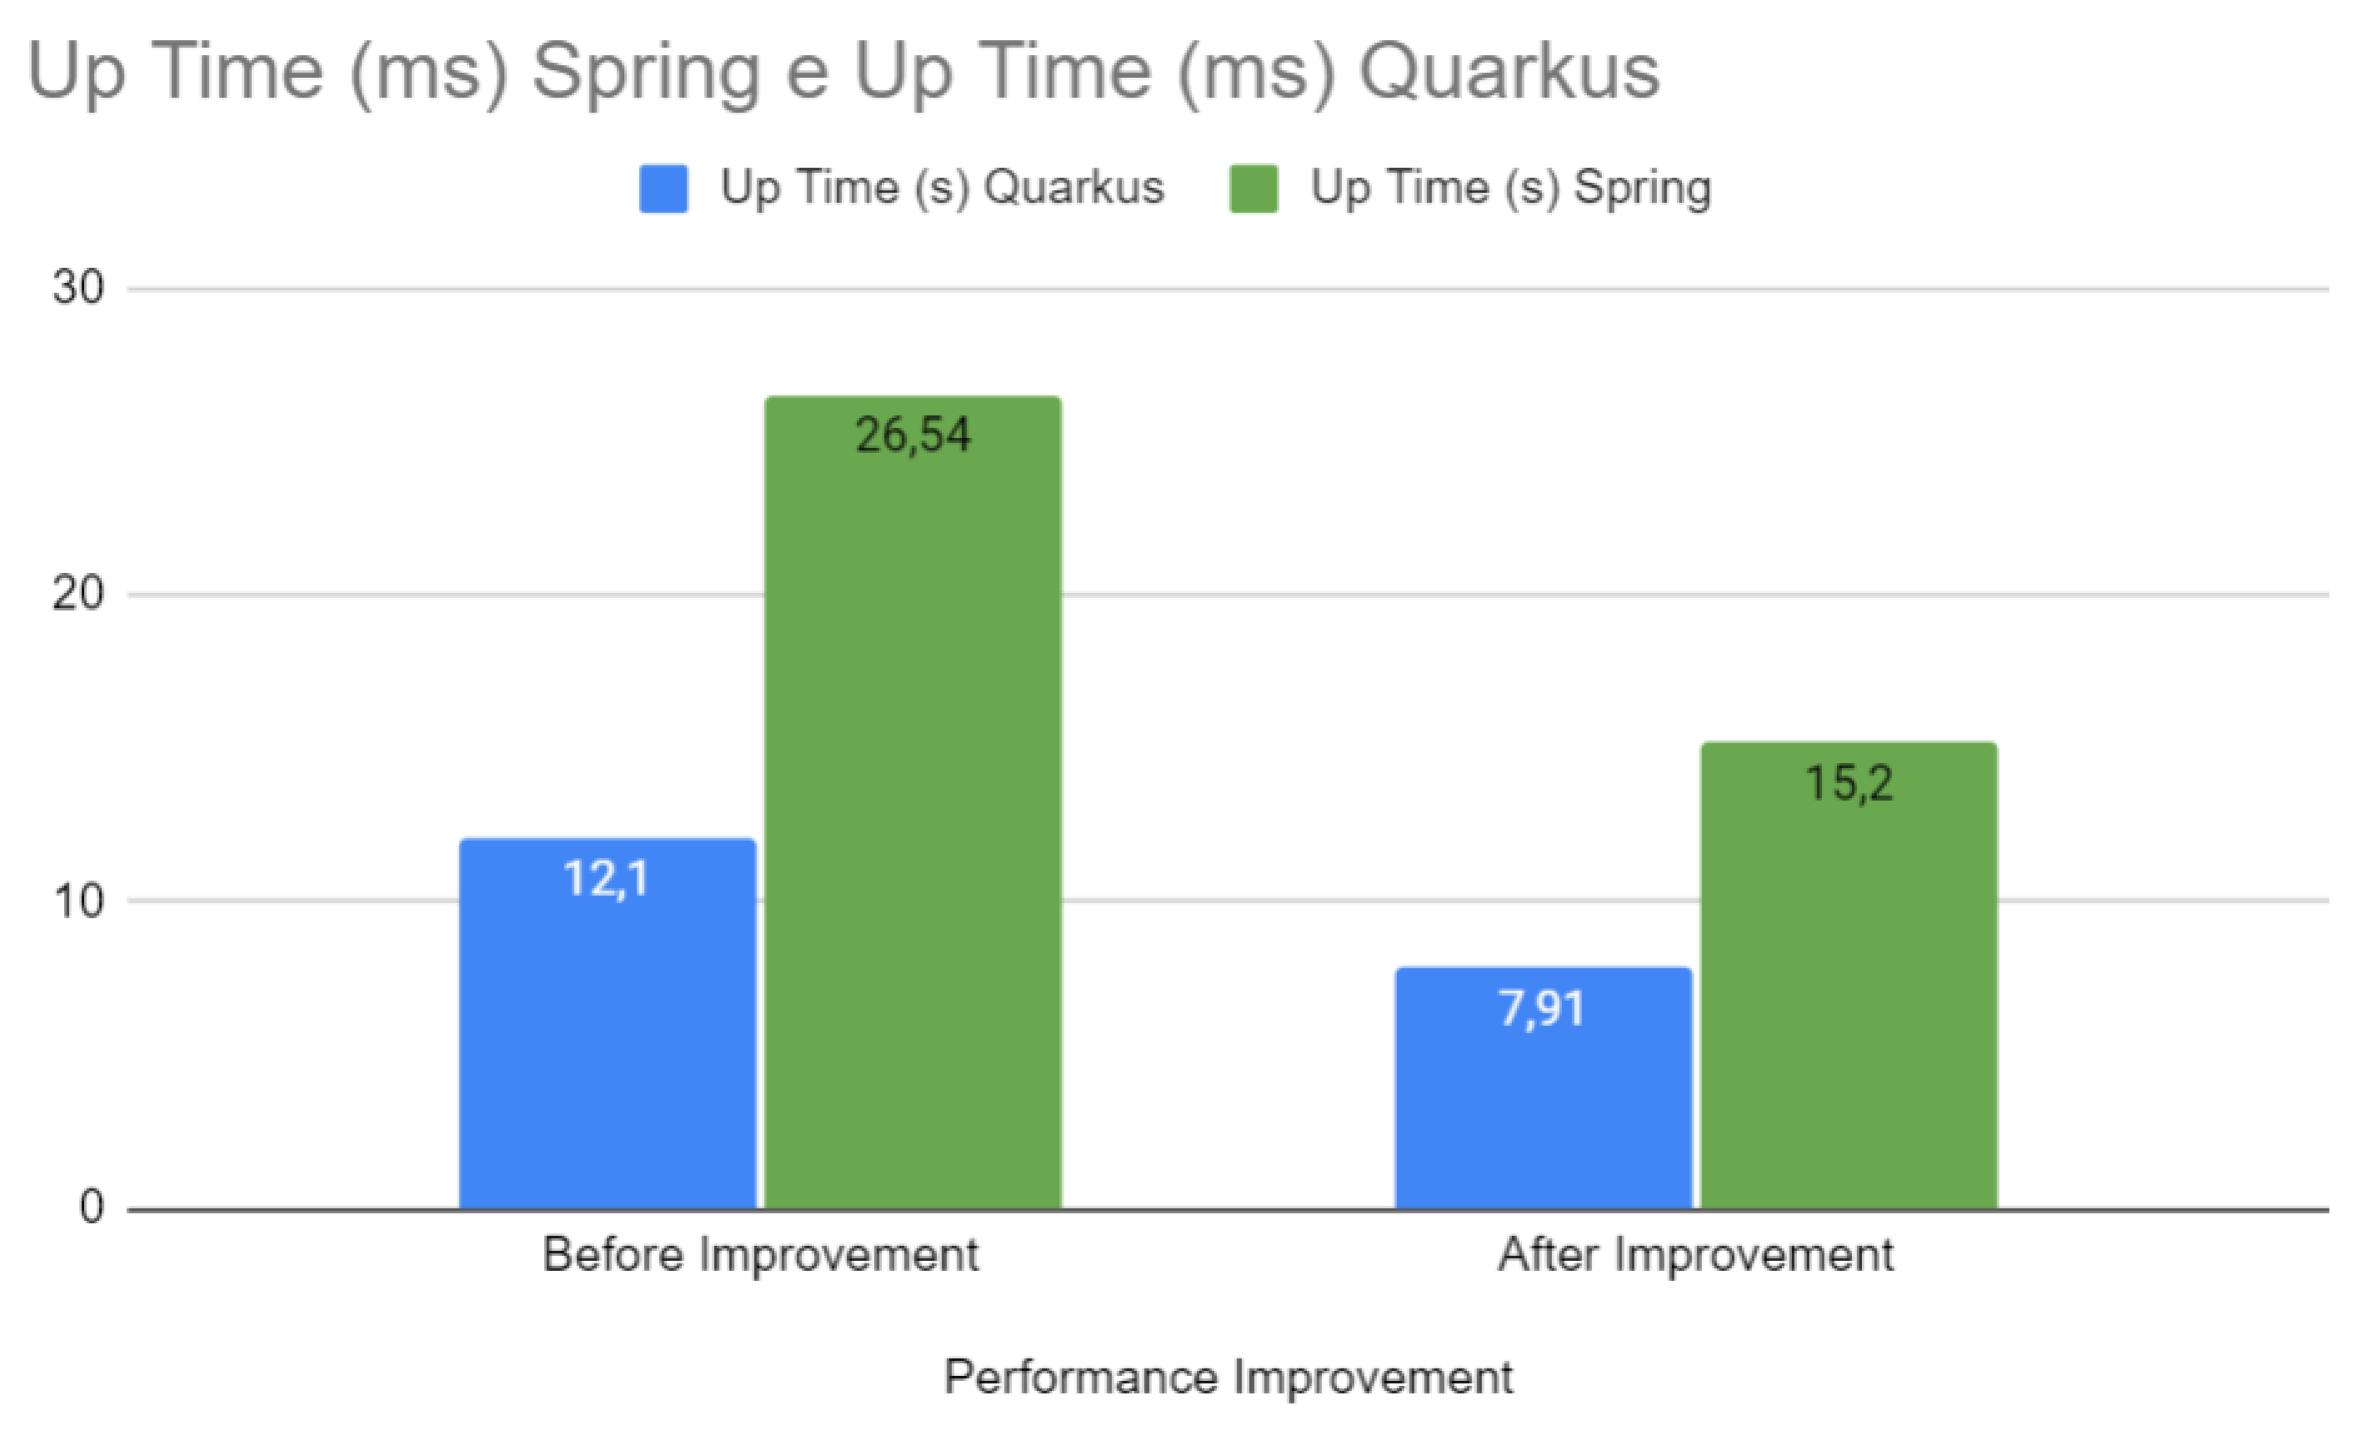
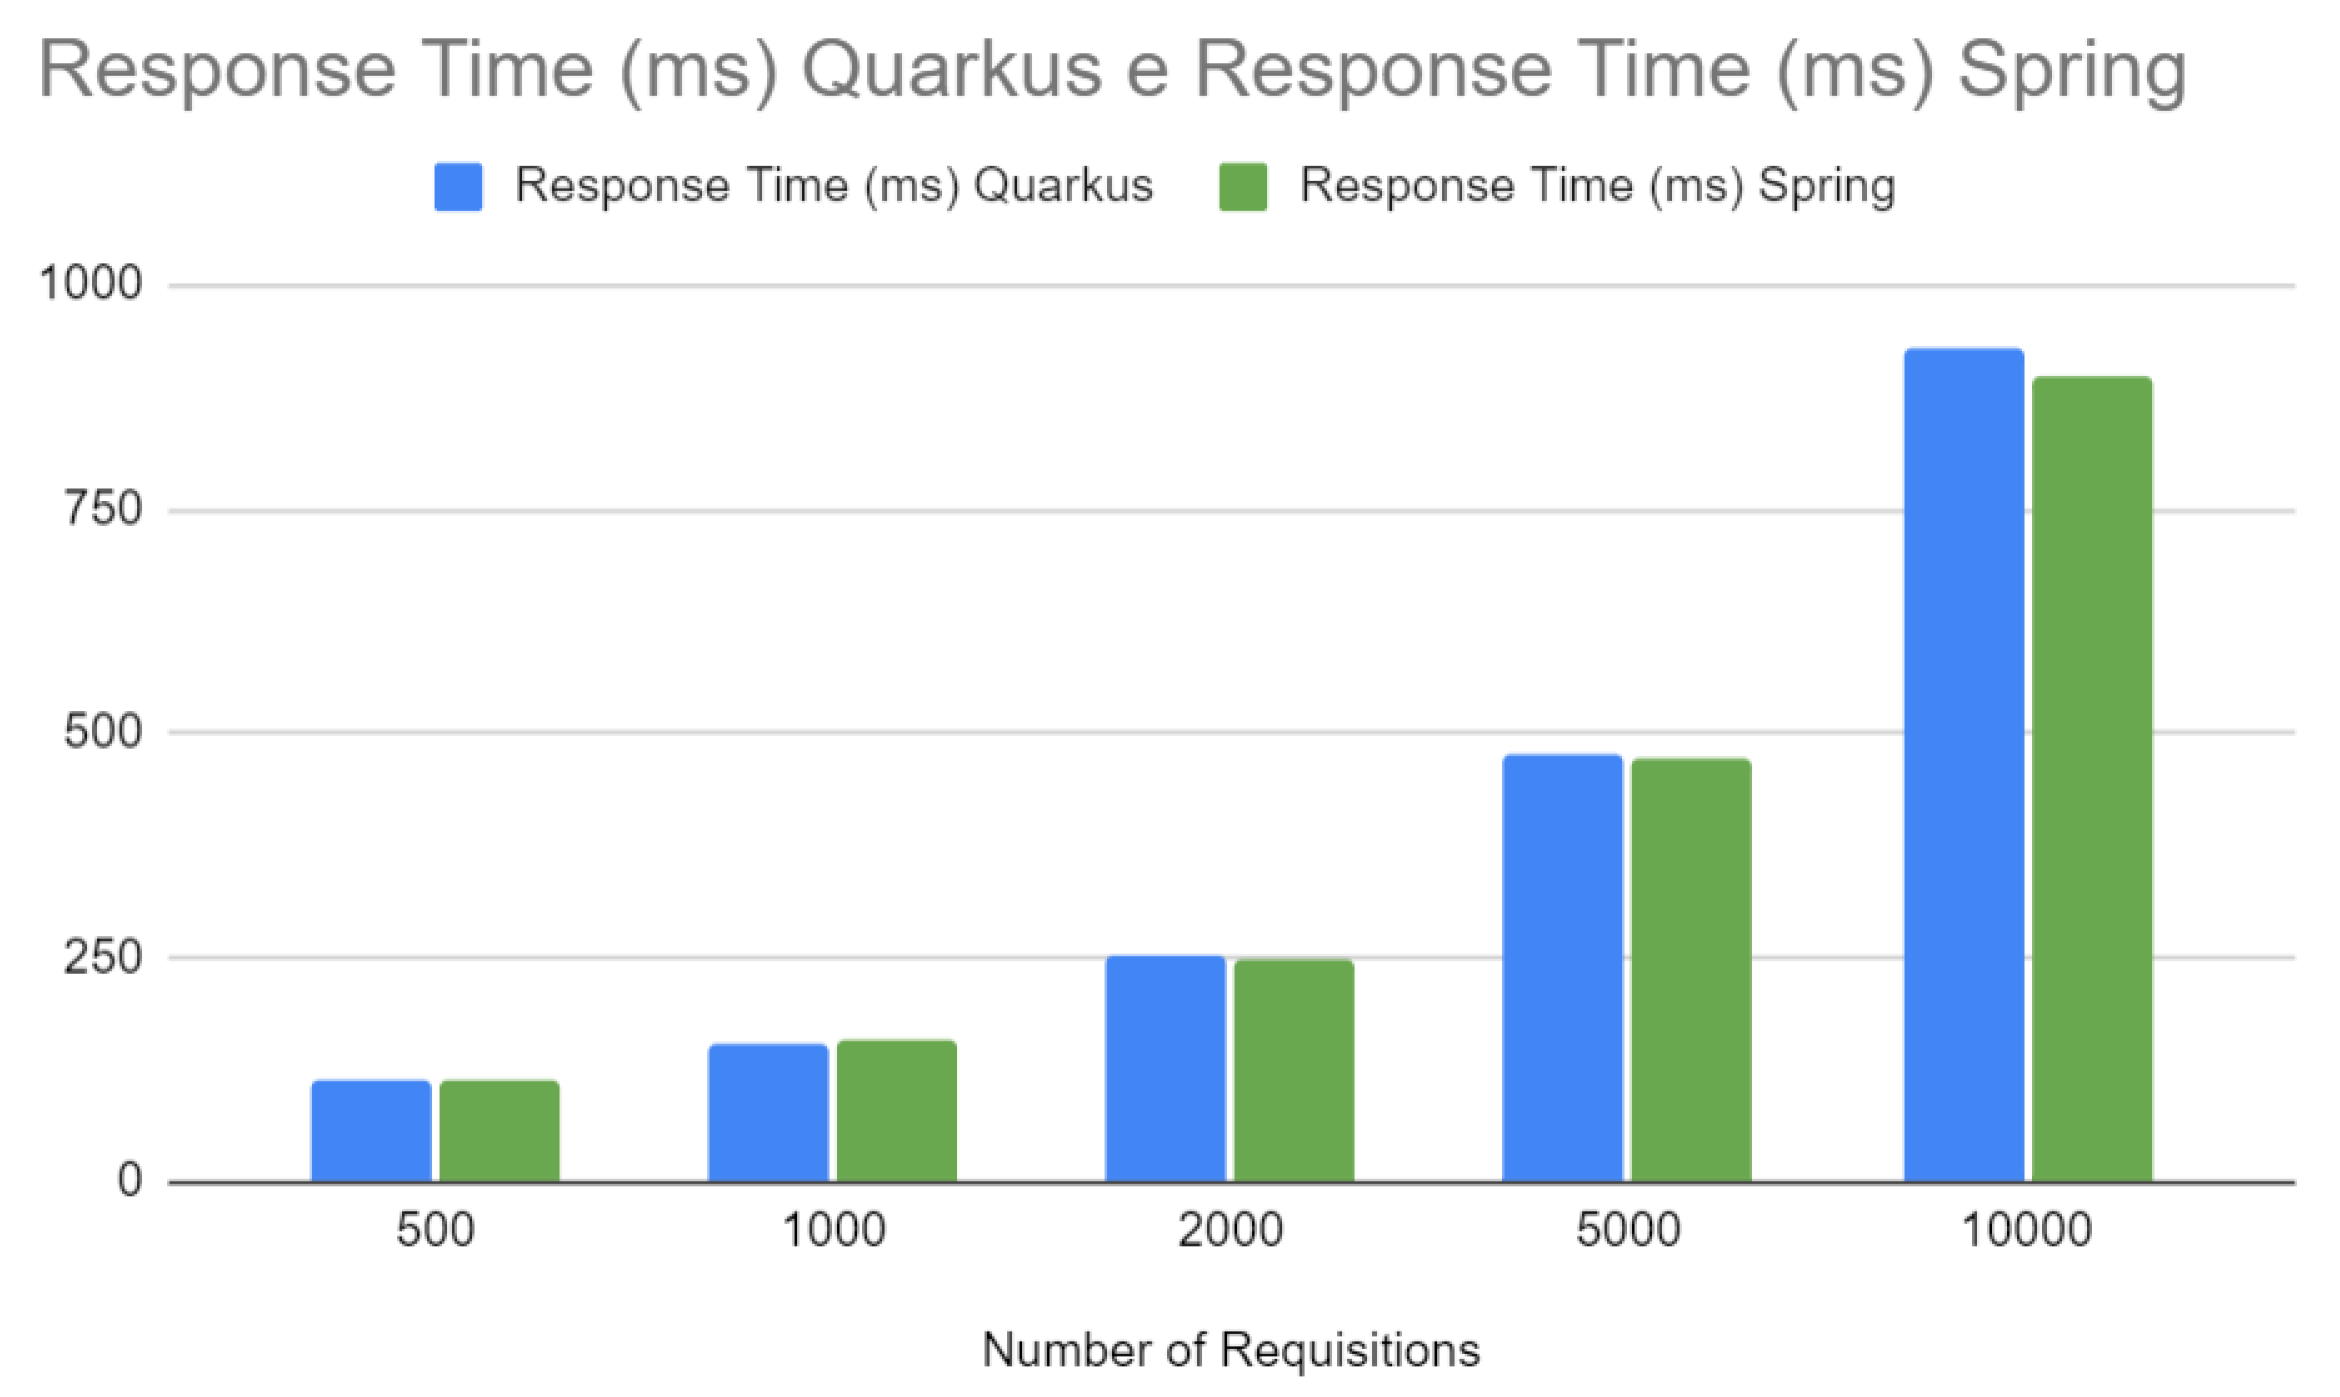
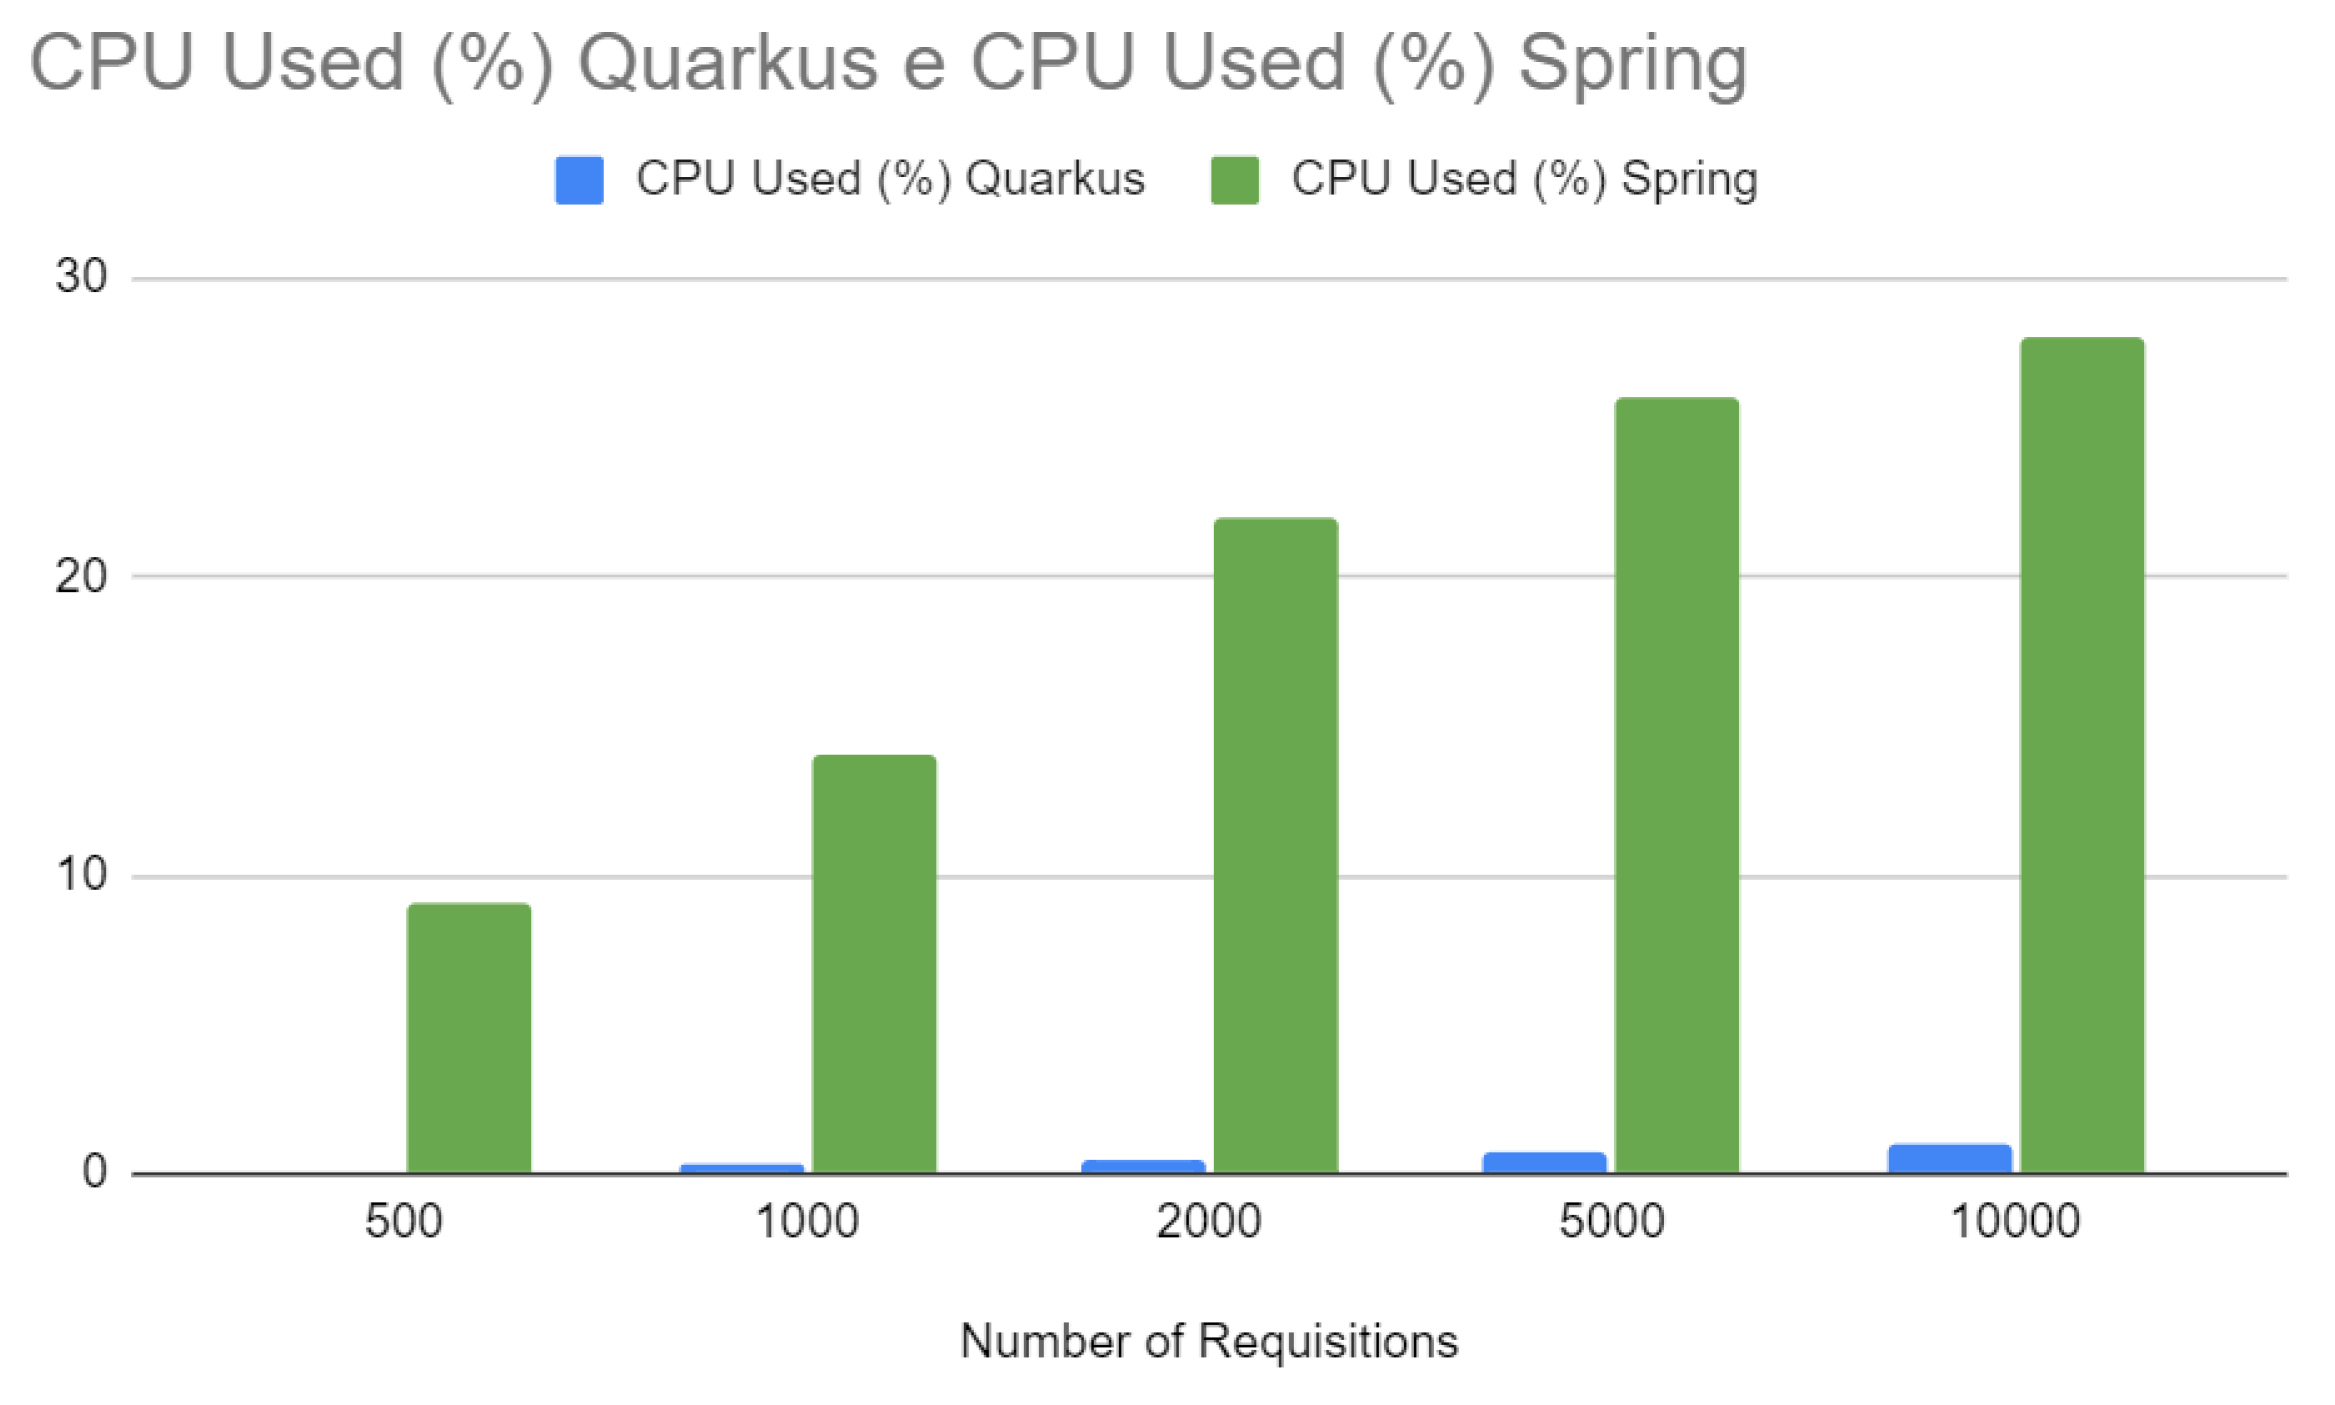
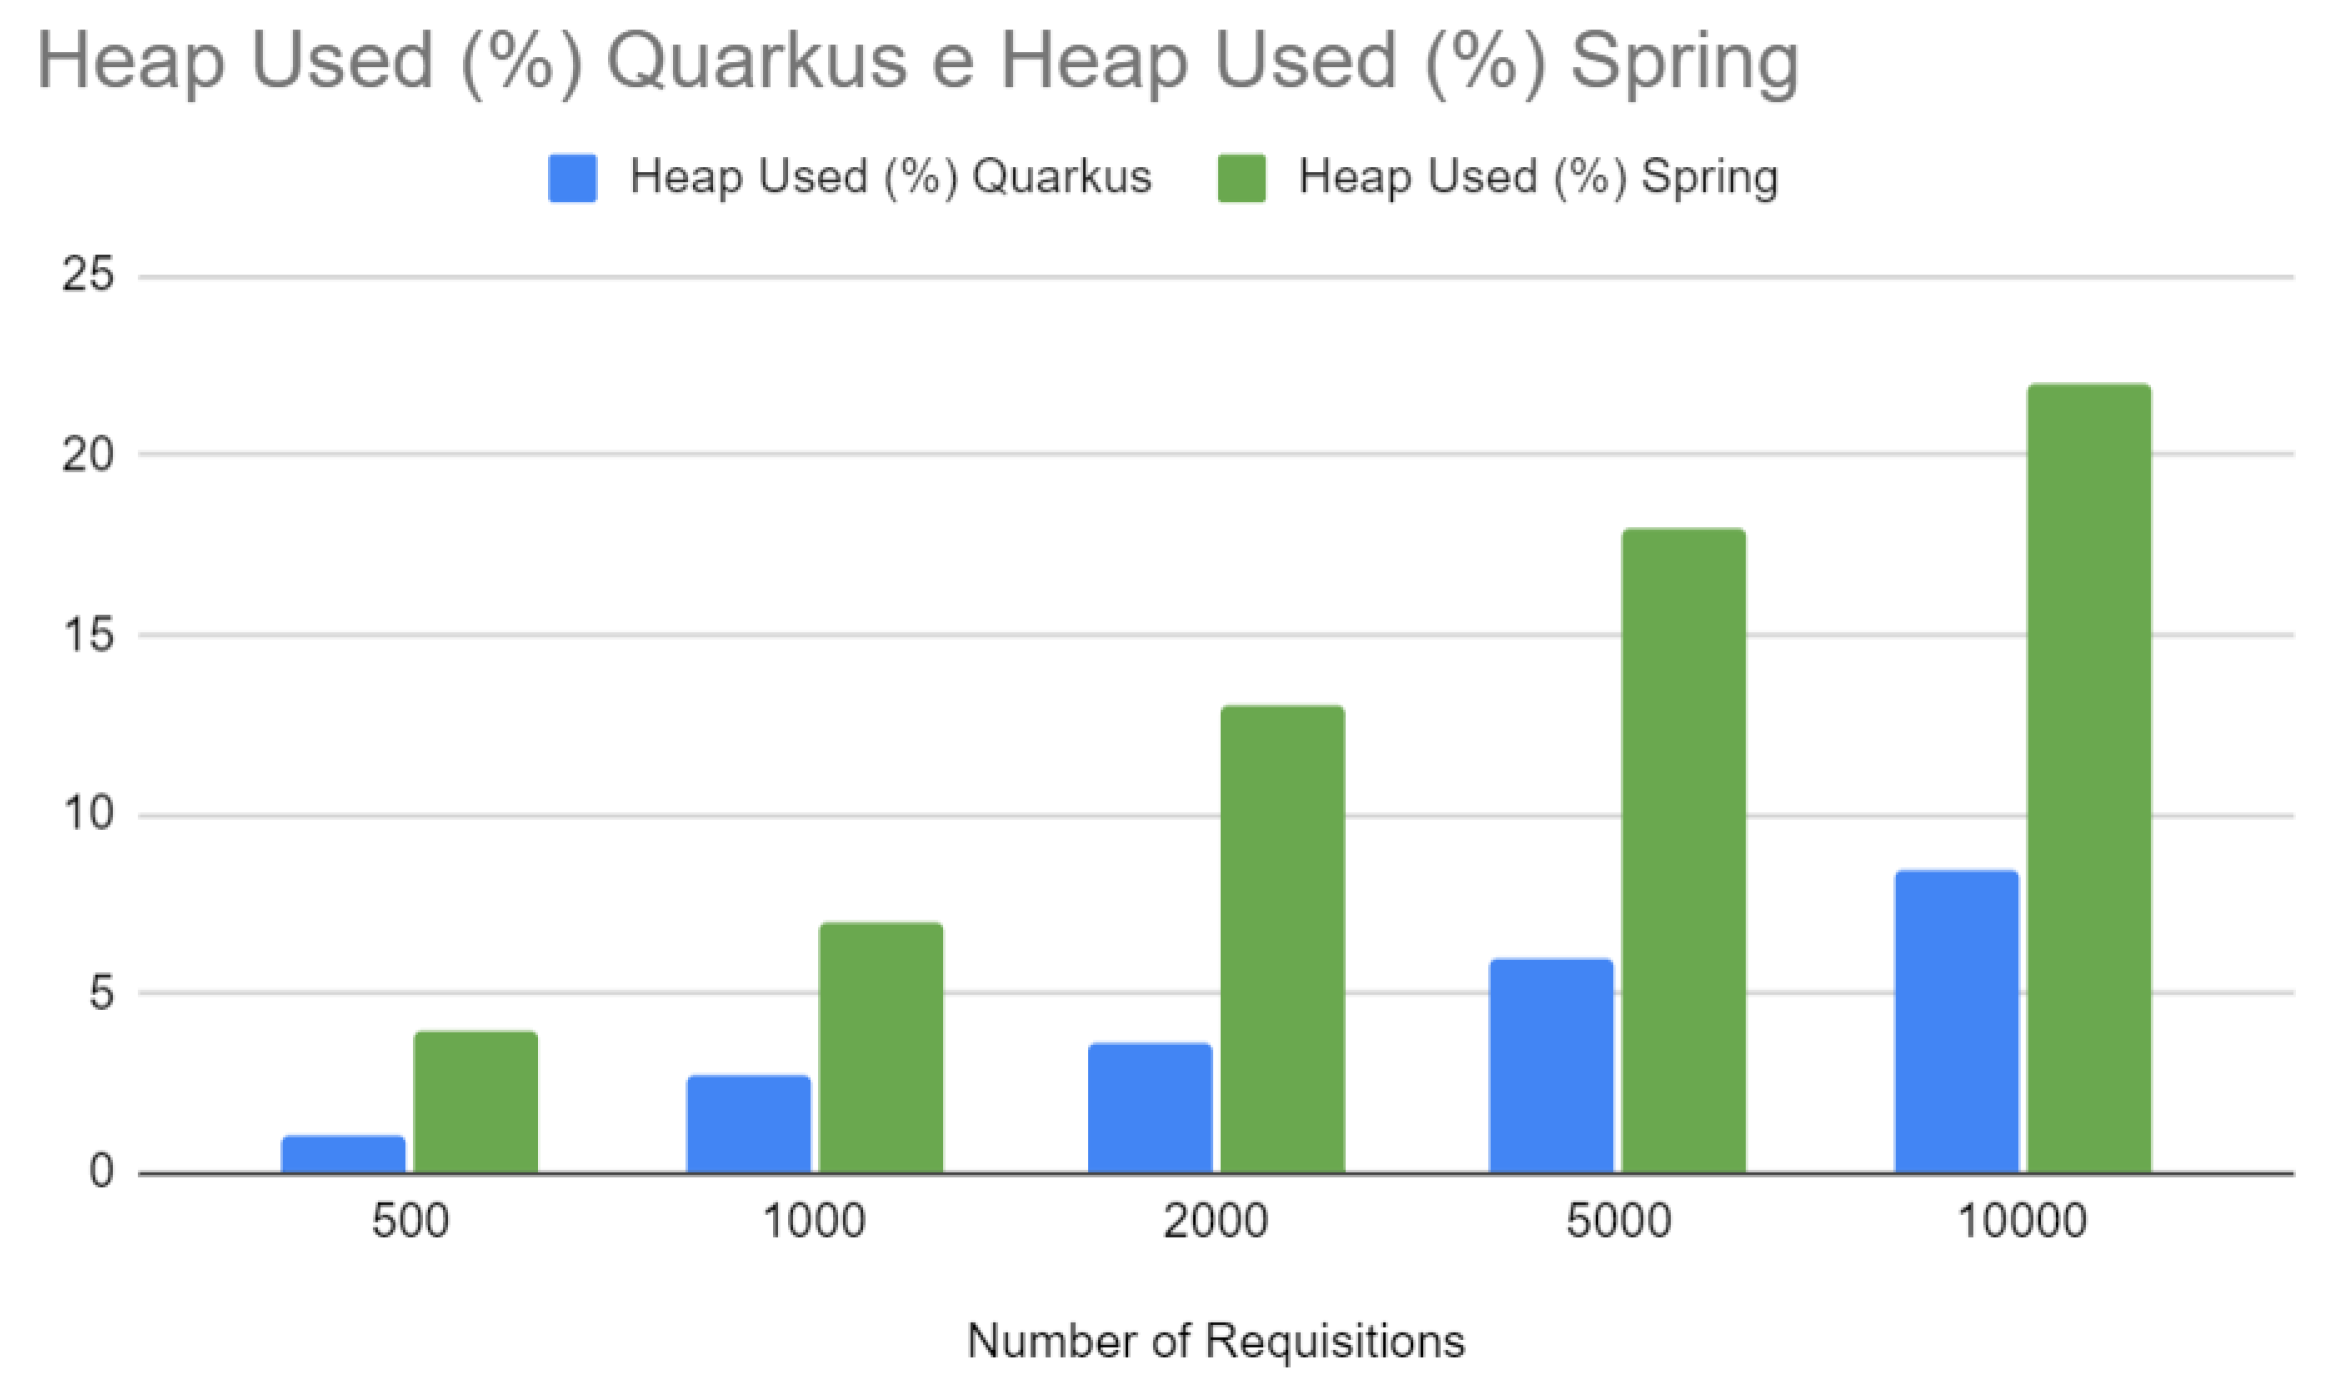
The following section will present a meticulous comparison between the two frameworks. This analysis is anchored in empirical data obtained through performance tests conducted before and after applying specific optimizations. The metrics selected for this evaluation include the application start-up time (uptime), CPU and heap memory usage percentage, and the response time to increasing requests. These metrics are fundamental to understanding the efficiency and effectiveness of frameworks in real production contexts.
Figure 15 directly compares the up times before and after the optimizations for both Spring and Quarkus. The optimizations significantly improved start-up time for Quarkus, with a more modest reduction for Spring. In web development, start-up time is a critical factor for the agility and responsiveness of services in production environments, especially in microservice-based architectures or when it is necessary to scale quickly to meet increased demand.
Figure 16 compares the response time between Quarkus and Spring. Although both frameworks show increased response time with the number of requests, Spring shows a sharper increase. Response time is a critical indicator of user experience, and longer response times can result in a negative perception of the application. Fast and consistent response times are essential in production environments, especially for interactive or real-time applications.
Figure 17 compares the CPU usage between Quarkus and Spring at different numbers of requests. Quarkus consistently shows lower CPU usage across all data points. This reduced CPU usage indicates computational efficiency, which can reduce operating costs as it requires less computing power to perform the same amount of work. In addition, this could indicate that Quarkus may be better suited to environments where hardware resources are a concern, such as IoT devices or cloud computing environments where resource efficiency is essential.
Figure 18 compares heap memory usage. Like CPU usage, Quarkus demonstrates more efficient use of heap memory, which is particularly important in Java, where memory management can significantly impact application performance and latency. More efficient memory usage can result in less garbage collection and, therefore, more minor and less frequent pauses in application execution.
6. Conclusion and Future Work
This study looked at the integration of spyware techniques and prediction models for efficient computer monitoring. The findings revealed that this approach can significantly improve security and efficiency in computing environments. However, it is crucial to recognize the ethical and privacy limitations related to the use of spyware. Future research should explore methods for balancing efficiency and privacy. Furthermore, it is recommended to develop more robust predictive models and apply these techniques in different contexts to validate their universality. In short, this study lays a solid foundation for future research and practical applications, highlighting the importance of continued advances in the area of cybersecurity and systems monitoring.
Acknowledgments
This research was funded (in part) by the Portuguese FCT program, Center of Technology and Systems (CTS) UIDB/00066/2020/UIDP/00066/2020.
Conflicts of Interest
Declare conflicts of interest or state “The authors declare no conflicts of interest.” Authors must identify and declare any personal circumstances or interests perceived as inappropriately influencing the representation or interpretation of reported research results. Any role of the funders in the study’s design, in the collection, analysis or interpretation of data, in the writing of the manuscript, or in the decision to publish the results must be declared in this section. If there is no role, please state “The funders had no role in the design of the study; in the collection, analyses, or interpretation of data; in the writing of the manuscript; or in the decision to publish the results”.
References
- Pahl, C.; Jamshidi, P. Microservices: A Systematic Mapping Study. CLOSER (1) 2016. [Google Scholar] [CrossRef]
- Dragoni, N.; Giallorenzo, S.; Lafuente, A.L.; Mazzara, M.; Montesi, F.; Mustafin, R.; Safina, L. Microservices: yesterday, today, and tomorrow. Present and ulterior software engineering 2017. [Google Scholar] [CrossRef] [PubMed]
- Suryotrisongko, H.; Jayanto, D.P.; Tjahyanto, A. Design and development of backend application for public complaint systems using microservice spring boot. Procedia Computer Science 2017. [Google Scholar] [CrossRef]
- Koleoso, T.; Koleoso, T. Microservices with quarkus. Beginning Quarkus Framework: Build Cloud-Native Enterprise Java Applications and Microservices. [CrossRef]
- Walls, C. Spring Boot in action; Simon and Schuster, 2015. [CrossRef]
- Dhalla, H.K. A Performance Comparison of RESTful Applications Implemented in Spring Boot Java and MS. In NET Core. In Proceedings of the Journal of Physics: Conference Series. IOP Publishing; 2021. [Google Scholar] [CrossRef]
- Dhalla, H.K. Benchmarking the performance of RESTful applications implemented in spring boot Java and MS. Net core. Journal of Computing Sciences in Colleges 2020. [Google Scholar] [CrossRef]
- Marchioni, F. Hands-on Cloud-native Applications with Java and Quarkus: Build High Performance, Kubernetes-native Java Serverless Applications; Packt Publishing Ltd, 2019. [CrossRef]
- Šipek, M.; Muharemagić, D.; Mihaljević, B.; Radovan, A. Enhancing performance of cloud-based software applications with GraalVM and Quarkus. In Proceedings of the 2020 43rd International Convention on Information, 2020., Communication and Electronic Technology (MIPRO). IEEE. [CrossRef]
- Milani, A. PostgreSQL-Guia do Programador; Novatec Editora, 2008. [CrossRef]
- Smith, G. PostgreSQL 9.0: High Performance; Packt Publishing Ltd, 2010. [CrossRef]
- Gao, P.; Ma, J.; Duan, L.; Liu, D. Performance Evaluation of Redis Cache in Web Service. 2018 IEEE International Conference on Communications Workshops (ICC Workshops). [CrossRef]
- Arora, A.; Jain, S.; Kumar, A. Redis Cache: An Overview of Its Features and Advantages. International Journal of Advanced Research in Computer Science 2019. [Google Scholar] [CrossRef]
- Nguyen, V.N.; Tran, T.D. An Approach to Managing Real-Time Data with Redis for IoT Applications. Information 2021. [Google Scholar] [CrossRef]
- Begnum, M.; Vinterhagen, A. Evaluating the Redis In-Memory Cache for Distributed Storage Systems. Journal of Computer and Communications 2020. [Google Scholar] [CrossRef]
- Gomede, E.; Barros, R.M. A Practical Approach to Software Continuous Delivery. International Conferences on Software Engineering and Knowledge Engineering. [CrossRef]
- AMQP Working Group. Advanced Message Queuing Protocol (AMQP), 2021. [CrossRef]
- Sengupta, S.; Das, S.; Bhattacharjee, S.; De, R. Performance analysis of message brokers for cloud based IoT systems. 2017 International Conference on Intelligent Computing and Control Systems (ICICCS) 2017. [Google Scholar] [CrossRef]
- Sarwar, S.; Islam, M.S.; Imran, M.A.; Mahmud, A.; Alam, S.S. Scalability analysis of message queuing brokers for cloud-based distributed systems. International Journal of Distributed Systems and Technologies (IJDST) 2019. [Google Scholar] [CrossRef]
- Ahmed, M.A.; Idris, M.Y.I.; Abdullah, A.H.; Yaacob, N. Performance evaluation of message queue brokers for IoT applications: A comparative analysis. IEEE Access 2020. [Google Scholar] [CrossRef]
- Divyabharathi, D.; Cholli, N.G. A review on identity and access management server (keycloak). International Journal of Security and Privacy in Pervasive Computing (IJSPPC) 2020. [Google Scholar] [CrossRef]
- Thorgersen, S.; Silva, P.I. Keycloak-identity and access management for modern applications: harness the power of Keycloak, OpenID Connect, and OAuth 2.0 protocols to secure applications; Packt Publishing Ltd, 2021. [CrossRef]
- Soundararajan, A.; et al. Prometheus: A next-generation monitoring system. IEEE Software 2018. [Google Scholar] [CrossRef]
- Chen, Y.; et al. Grafana: A Comprehensive Visualization Platform for Modern Data. In Proceedings of the 2019 IEEE International Conference on Big Data (Big Data). Elsevier BV; 2019. [Google Scholar] [CrossRef]
- Jain, P.; et al. Prometheus and Grafana: An Effective Pair for Monitoring Containerized Applications. In Proceedings of the 2020 IEEE International Conference on Communication and Signal Processing (ICCSP). Apress; 2020. [Google Scholar] [CrossRef]
- Kumar, A.; et al. Grafana: A real-time data visualization tool for IoT. IETE Technical Review 2021. [Google Scholar] [CrossRef] [PubMed]
- Mahmoud, A.F.; et al. Grafana and Prometheus Alerting and Monitoring System for Smart Grid Networks. International Journal of Distributed Energy Resources 2022. [Google Scholar] [CrossRef]
- Merkel, D. Docker: lightweight Linux containers for consistent development and deployment. Linux Journal 2014. [Google Scholar] [CrossRef]
- Villamizar, M.; et al. Microservices implementation with Docker. In Proceedings of the 2016 XLII Latin American Computing Conference (CLEI). Apress; 2016. [Google Scholar] [CrossRef]
- Felter, W.; Ferreira, A.; Rajamony, R.; Rubio, J. An updated performance comparison of virtual machines and Linux containers. In Proceedings of the 2015 IEEE International Symposium on Performance Analysis of Systems and Software (ISPASS). IEEE; 2015. [Google Scholar] [CrossRef]
- Matthias, S.; Oberweis, A. Docker and kubernetes: An overview. In Proceedings of the Proceedings of the 10th ACM International Conference on Distributed and Event-based Systems.; p. 2016. [CrossRef]
- Karg, G.; Meurer, S.; Imsieke, R. Docker Compose: a practical approach to microservices deployment. In Proceedings of the 2016 2nd International Conference on Open and Big Data (OBD). Apress; 2016. [Google Scholar] [CrossRef]
- Varghese, E.; et al. Docker swarm: orchestration and load balancing for docker containers. In Proceedings of the 2016 International Conference on Circuit, 2016., Power and Computing Technologies (ICCPCT). Apress. [CrossRef]
- Boettiger, C. An introduction to Docker for reproducible research. In Proceedings of the ACM SIGOPS Operating Systems Review. Association for Computing Machinery (ACM); 2015. [Google Scholar] [CrossRef]
- Postman, I. Postman. [CrossRef]
- Smith, J.; Johnson, J. Testing APIs with Postman. Journal of API Development 2022. [Google Scholar] [CrossRef]
- Brown, R.; Davis, S. Generating Interactive API Documentation with Postman. In Proceedings of the Proceedings of the International Conference on Web Services.; p. 2021. [CrossRef]
- Johnson, M.; Williams, E. Collaborative API Development with Postman; Tech Publishing, 2020. [CrossRef]
- Garcia, M.; Lee, D. The Impact of Postman in API Development. Journal of Software Engineering 2023. [Google Scholar] [CrossRef]
- Foundation, A.S. Apache JMeter. Pro Apache JMeter Acesso em 2021. [CrossRef]
- Sharma, A.; Sood, S. Apache JMeter: A performance testing tool. International Journal of Computer Applications 2016. [Google Scholar] [CrossRef]
- Hendriks, M. Performance testing of web applications using JMeter. In Proceedings of the Proceedings of the 2014 Federated Conference on Computer Science and Information Systems.; p. 2014. [CrossRef]
- Blazevic, N. Performance Testing Websites with Apache JMeter, Acesso em 2021.
- Noetzold, D. API Tester, Acesso em 2023.
- Pearson, K. On lines and planes of closest fit to systems of points in space. Philosophical Magazine 1901. [Google Scholar] [CrossRef]
- Spearman, C. The proof and measurement of association between two things. American Journal of Psychology 1904. [Google Scholar] [CrossRef]
- Montgomery, D.C.; Peck, E.A.; Vining, G.G. Introduction to Linear Regression Analysis; Wiley, 2012. [CrossRef]
- Kutner, M.H.; Nachtsheim, C.J.; Neter, J.; Li, W. Applied Linear Statistical Models; McGraw-Hill, 2005. [CrossRef]
- Godfrey, K. Simple linear regression in medical research. New England Journal of Medicine 1985. [Google Scholar] [CrossRef]
- Eberly, L.E. Multiple linear regression. Topics in Biostatistics 2007. [Google Scholar] [CrossRef]
- Amemiya, T. Non-linear regression models. Handbook of econometrics 1983. [Google Scholar] [CrossRef]
- Benoit, K. Linear regression models with logarithmic transformations. London School of Economics, London. [CrossRef]
- Stanley, R.P. Differentiably finite power series. European journal of combinatorics 1980. [Google Scholar] [CrossRef]
- Smith, J.; Johnson, M. A Method for Calculating Load Curves. Journal of Energy Engineering 2010. [Google Scholar] [CrossRef]
- Brown, R.; Davis, C. Load Curve Modeling; Springer, 2015. [CrossRef]
- Johnson, M.; Smith, S. Performance Analysis of Response Times in Web Applications. Journal of Computer Science 2018. [Google Scholar] [CrossRef]
- Gupta, A. Web Application Performance Testing; Packt Publishing, 2016. [CrossRef]
- Plecinski, P.; Bokla, N.; Klymkovych, T.; Melnyk, M.; Zabierowski, W. Comparison of Representative Microservices Technologies in Terms of Performance for Use for Projects Based on Sensor Networks. Sensors 2022. [Google Scholar] [CrossRef]
- Wyciślik. ; Latusik, .; Kamińska, A.M. A Comparative Assessment of JVM Frameworks to Develop Microservices. Applied Sciences 2023. [Google Scholar] [CrossRef]
- Gabriel Ferreira da Rosa, Kleinner Farias, C.F.S.X. Comparative Performance Analysis between Spring Boot and Quarkus: An Empirical Study. Technical Report, November, University of Vale do Rio dos Sinos. [CrossRef]
- Smith, J.; Johnson, A. A Comparative Study: Undertow vs. Tomcat for Web Application Performance. Journal of Web Engineering 2022. [Google Scholar] [CrossRef]
|
Disclaimer/Publisher’s Note: The statements, opinions and data contained in all publications are solely those of the individual author(s) and contributor(s) and not of MDPI and/or the editor(s). MDPI and/or the editor(s) disclaim responsibility for any injury to people or property resulting from any ideas, methods, instructions or products referred to in the content. |
© 2024 by the authors. Licensee MDPI, Basel, Switzerland. This article is an open access article distributed under the terms and conditions of the Creative Commons Attribution (CC BY) license (http://creativecommons.org/licenses/by/4.0/).


