1. Introduction
The honey bee (
Apis mellifera), belonging to the Apidae family within the Hymenoptera order, exhibits complete metamorphosis. Its life cycle encompasses four distinct stages: egg, larva, pupa, and adult [
1]. It is now understood that worker bees and queens develop from fertilized eggs, whereas drones evolve from unfertilized eggs. The fertilized eggs laid by the queen bee in the cell hatch into little larvae after three days. Then the nurse bees secrete worker jelly to feed the little larvae, a process that lasts for three days [
2]. During the initial stages of larvae development, specifically from the onset of 4-day-old larvae, nurse bees nourish the worker larvae with a blend of pollen and honey until they reach 6 days of age. Concurrently, the bodies of the larvae undergo rapid development and expansion throughout this period [
3]. The worker bee larvae cease feeding at the conclusion of their sixth day and subsequently undergo a three-day phase [
4]. As they reach the latter part of their ninth day, the larvae initiate eye development, completing the transition into pupal morphology by the tenth day [
4]. Following pupation, the worker bees emerge from the cell on the eighth day, assuming the adult bee morphology [
5].
Beekeeping yields a diverse array of bee products renowned for their substantial economic value and crucial role in human health [
6]. Meanwhile, honey bees play an important role in increasing crop production and maintaining ecosystems, generating significant ecological value [
7]. Nonetheless, the viability of honey bee colonies faces formidable challenges due to escalating environmental pollution, prevalence of parasites and pathogens, posing a threat to environmental homeostasis that cannot be overlooked [
8]. In response to these concerns, scientists are actively investigating key organs and tissues, with a focus on the hemolymph among several others. Serving as a vital transport system for hormones in insects, the hemolymph plays a pivotal role in integrating hormonal and nutrient signals. The hemolymph composition is a reflection of the metabolic state of the organs that produce the hemolymph, not vice versa. [
9]. Consequently, hemolymph plays a regulatory role by transporting metabolites and energy necessary for the regulation of physiological activities released by the fat body to various tissues and organs of insects, coordinating growth, development, body size, longevity, biological clock, feeding behavior, and courtship behavior. [
10,
11]. During the feeding stage, worker bee larvae amass substantial nutrient reserves, including sugars, proteins, lipids, and vitamins. These stored nutrients are subsequently utilized to facilitate the pupation process [
12]. Consequently, the transformation of worker bee larvae into pupae involves highly intricate metabolic processes. However, our understanding of the mechanisms underlying metabolite changes in the hemolymph during this transition in
Apis mellifera worker larvae lags behind, highlighting the need for further research in this area.
In this study, LC-MS was utilized to identify metabolites present in the hemolymph of the final instar larvae of Apis mellifera worker bees across the feeding, prepupal, and pre-pupae stages. The objective was to identify differential metabolites and conduct a comprehensive analysis of the associated metabolic pathways, incorporating the Kyoto Encyclopedia of Genes and Genomes (KEGG). Examining the temporal pattern of metabolite changes during metamorphosis in the last instar of Apis mellifera worker bees contributes significantly to advancing our understanding of metabolic regulation throughout the larvae-to-pupae metamorphosis in Hymenoptera insects.
2. Results
2.1. PCA, PLS-DA, and Ingredient of Metabolomics in Hemolymph of Apis mellifera Larvae
A comprehensive analysis of
Apis mellifera larval hemolymph at three physiological stages detected a total of 3661 metabolites, with 1620 in positive ionization mode and 2041 in negative ionization mode (
Table 1).
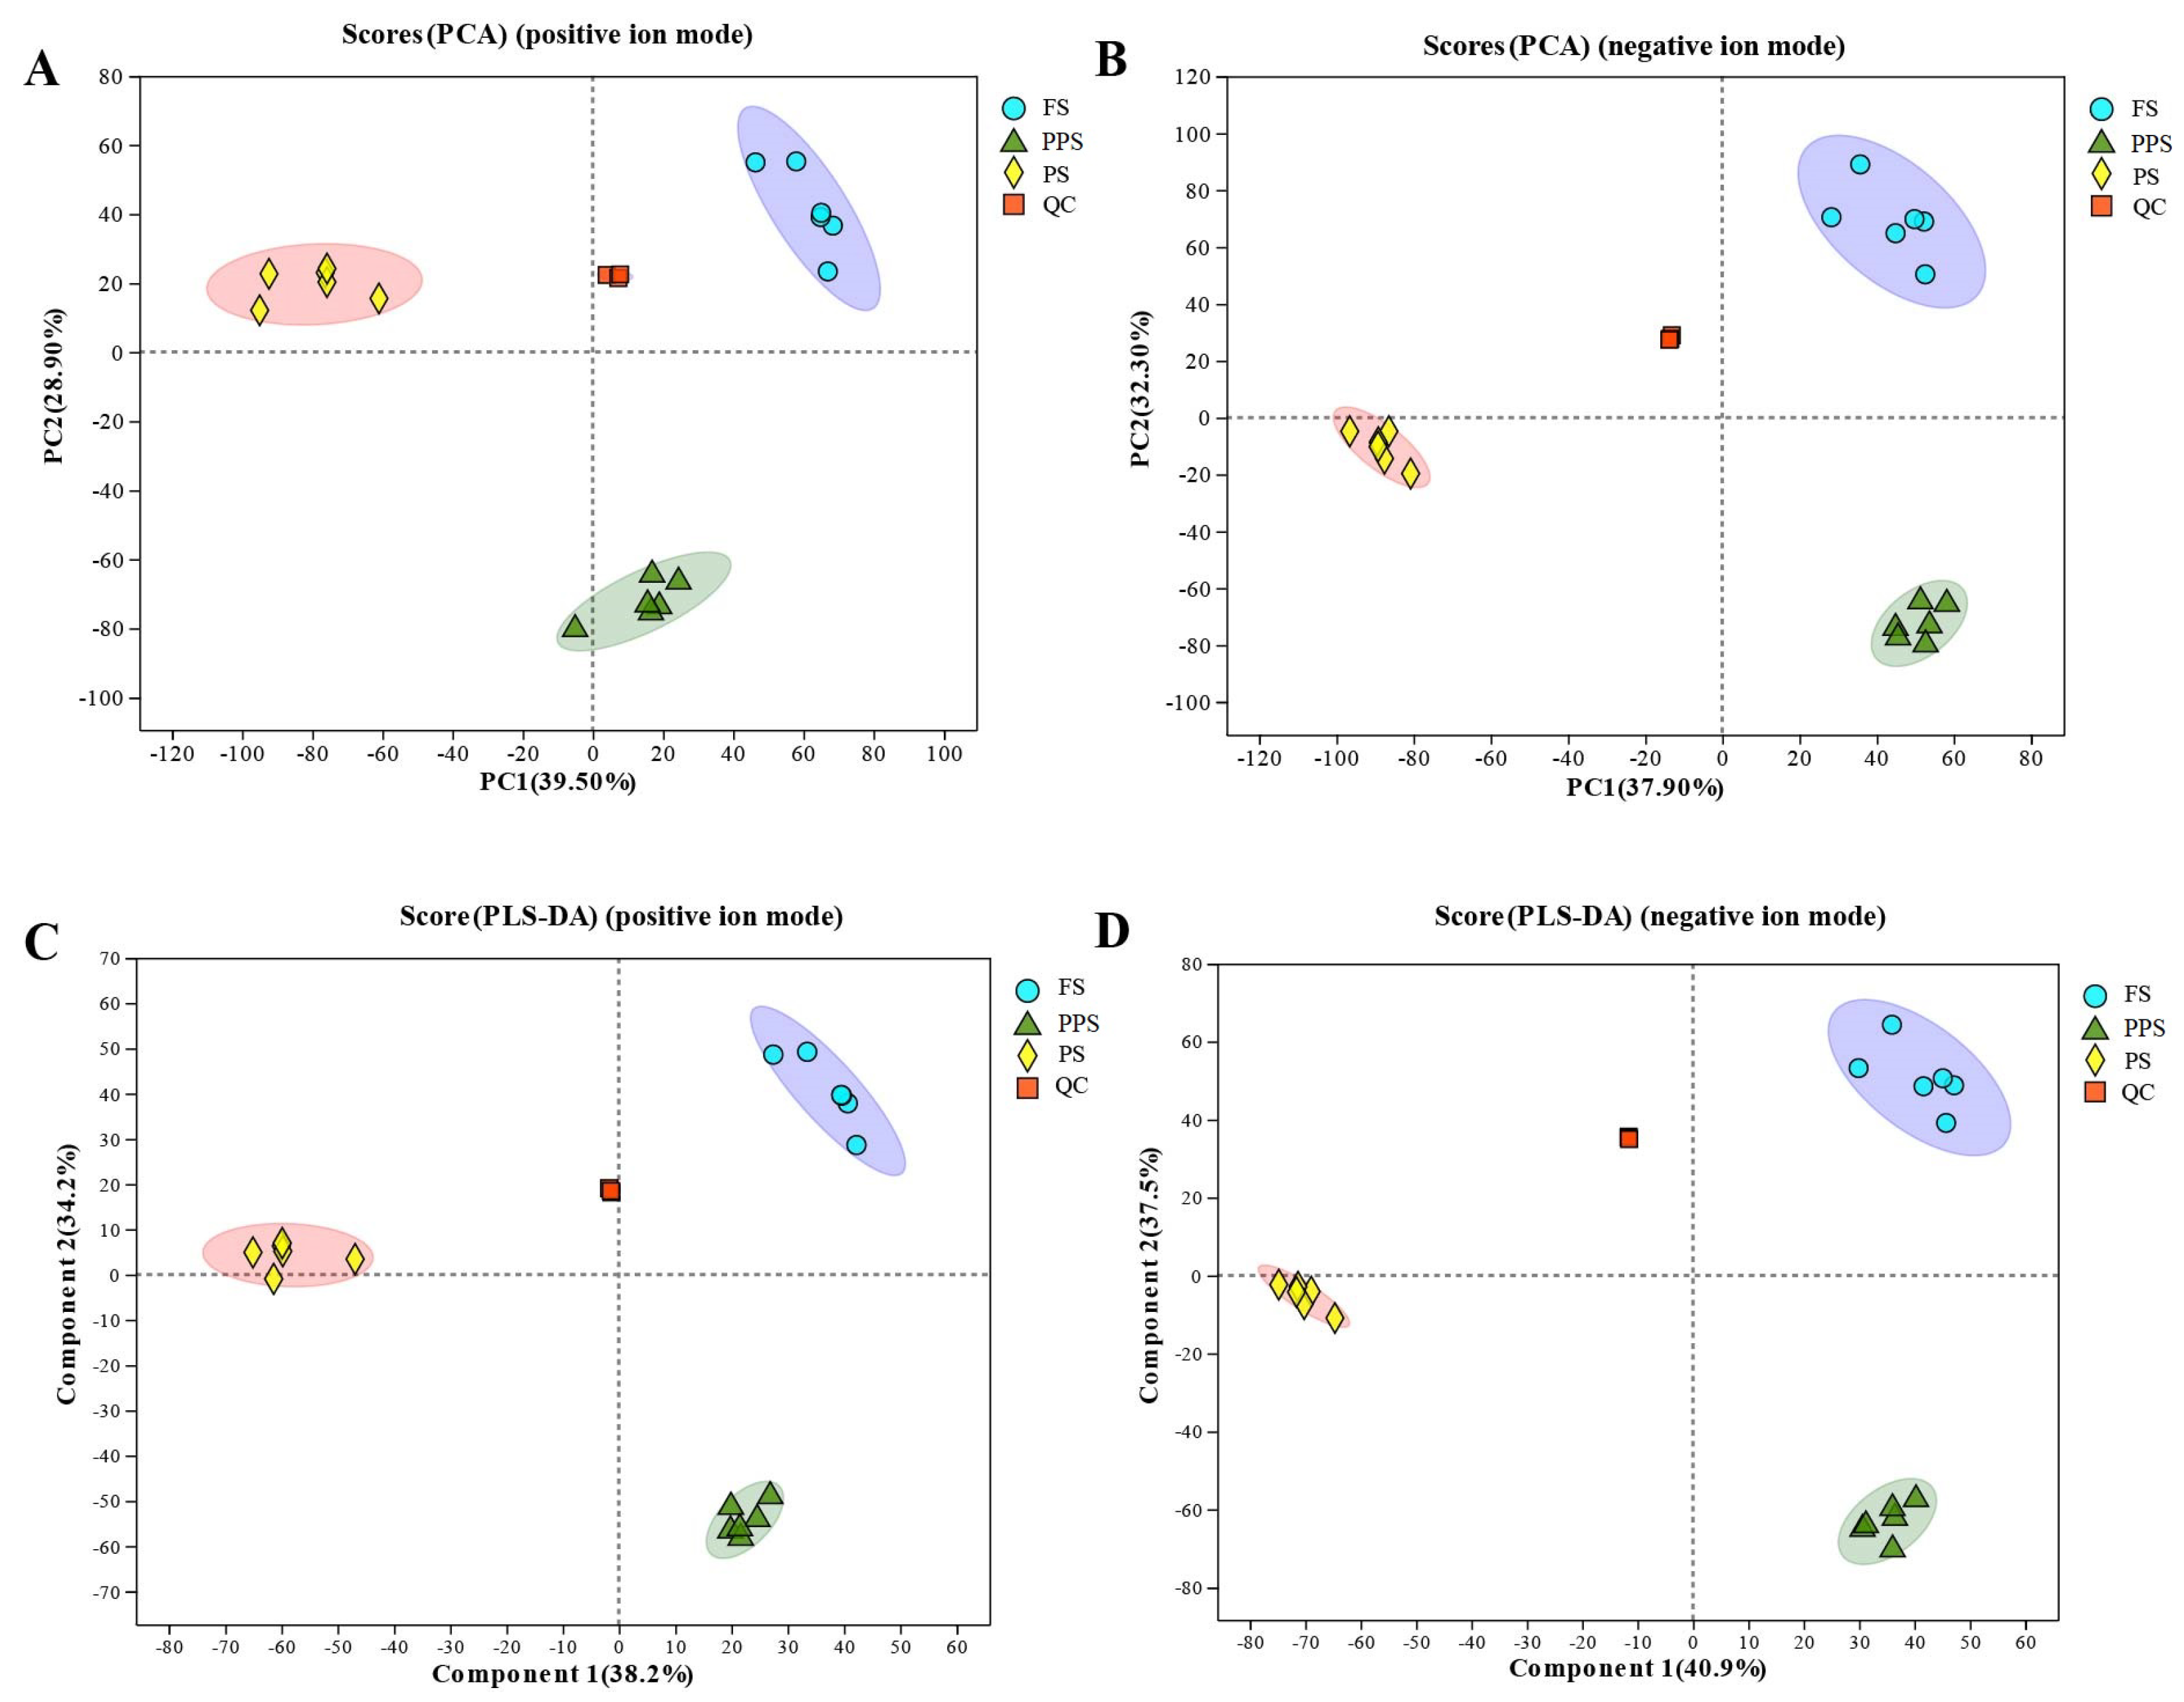
PCA was employed to assess the magnitude of metabolite changes from the feeding stage to the pre-pupal stage. The clustering results from PCA demonstrated distinct clustering of hemolymph samples within the same stage, while samples from different stages exhibited considerable variation (Fig
Figure 1A, B). This pattern indicated biologically repetitive sampling, with samples from all three stages clearly differentiated.
The PLS-DA model plot, in both positive and negative ion modes, revealed a distinct distribution pattern. Specifically, samples from the feeding stage were positioned in the first quadrant of the positive half-axis, those from the prepupal stage in the third quadrant of the positive half-axis, and pre-pupal stage samples were consistently distributed in the negative half-axis (
Figure 1C, D). This separation indicated significant differences in metabolites among the three physiological periods, with PPS and PS samples distinctly differing from FS samples and from each other within PPS and PS.
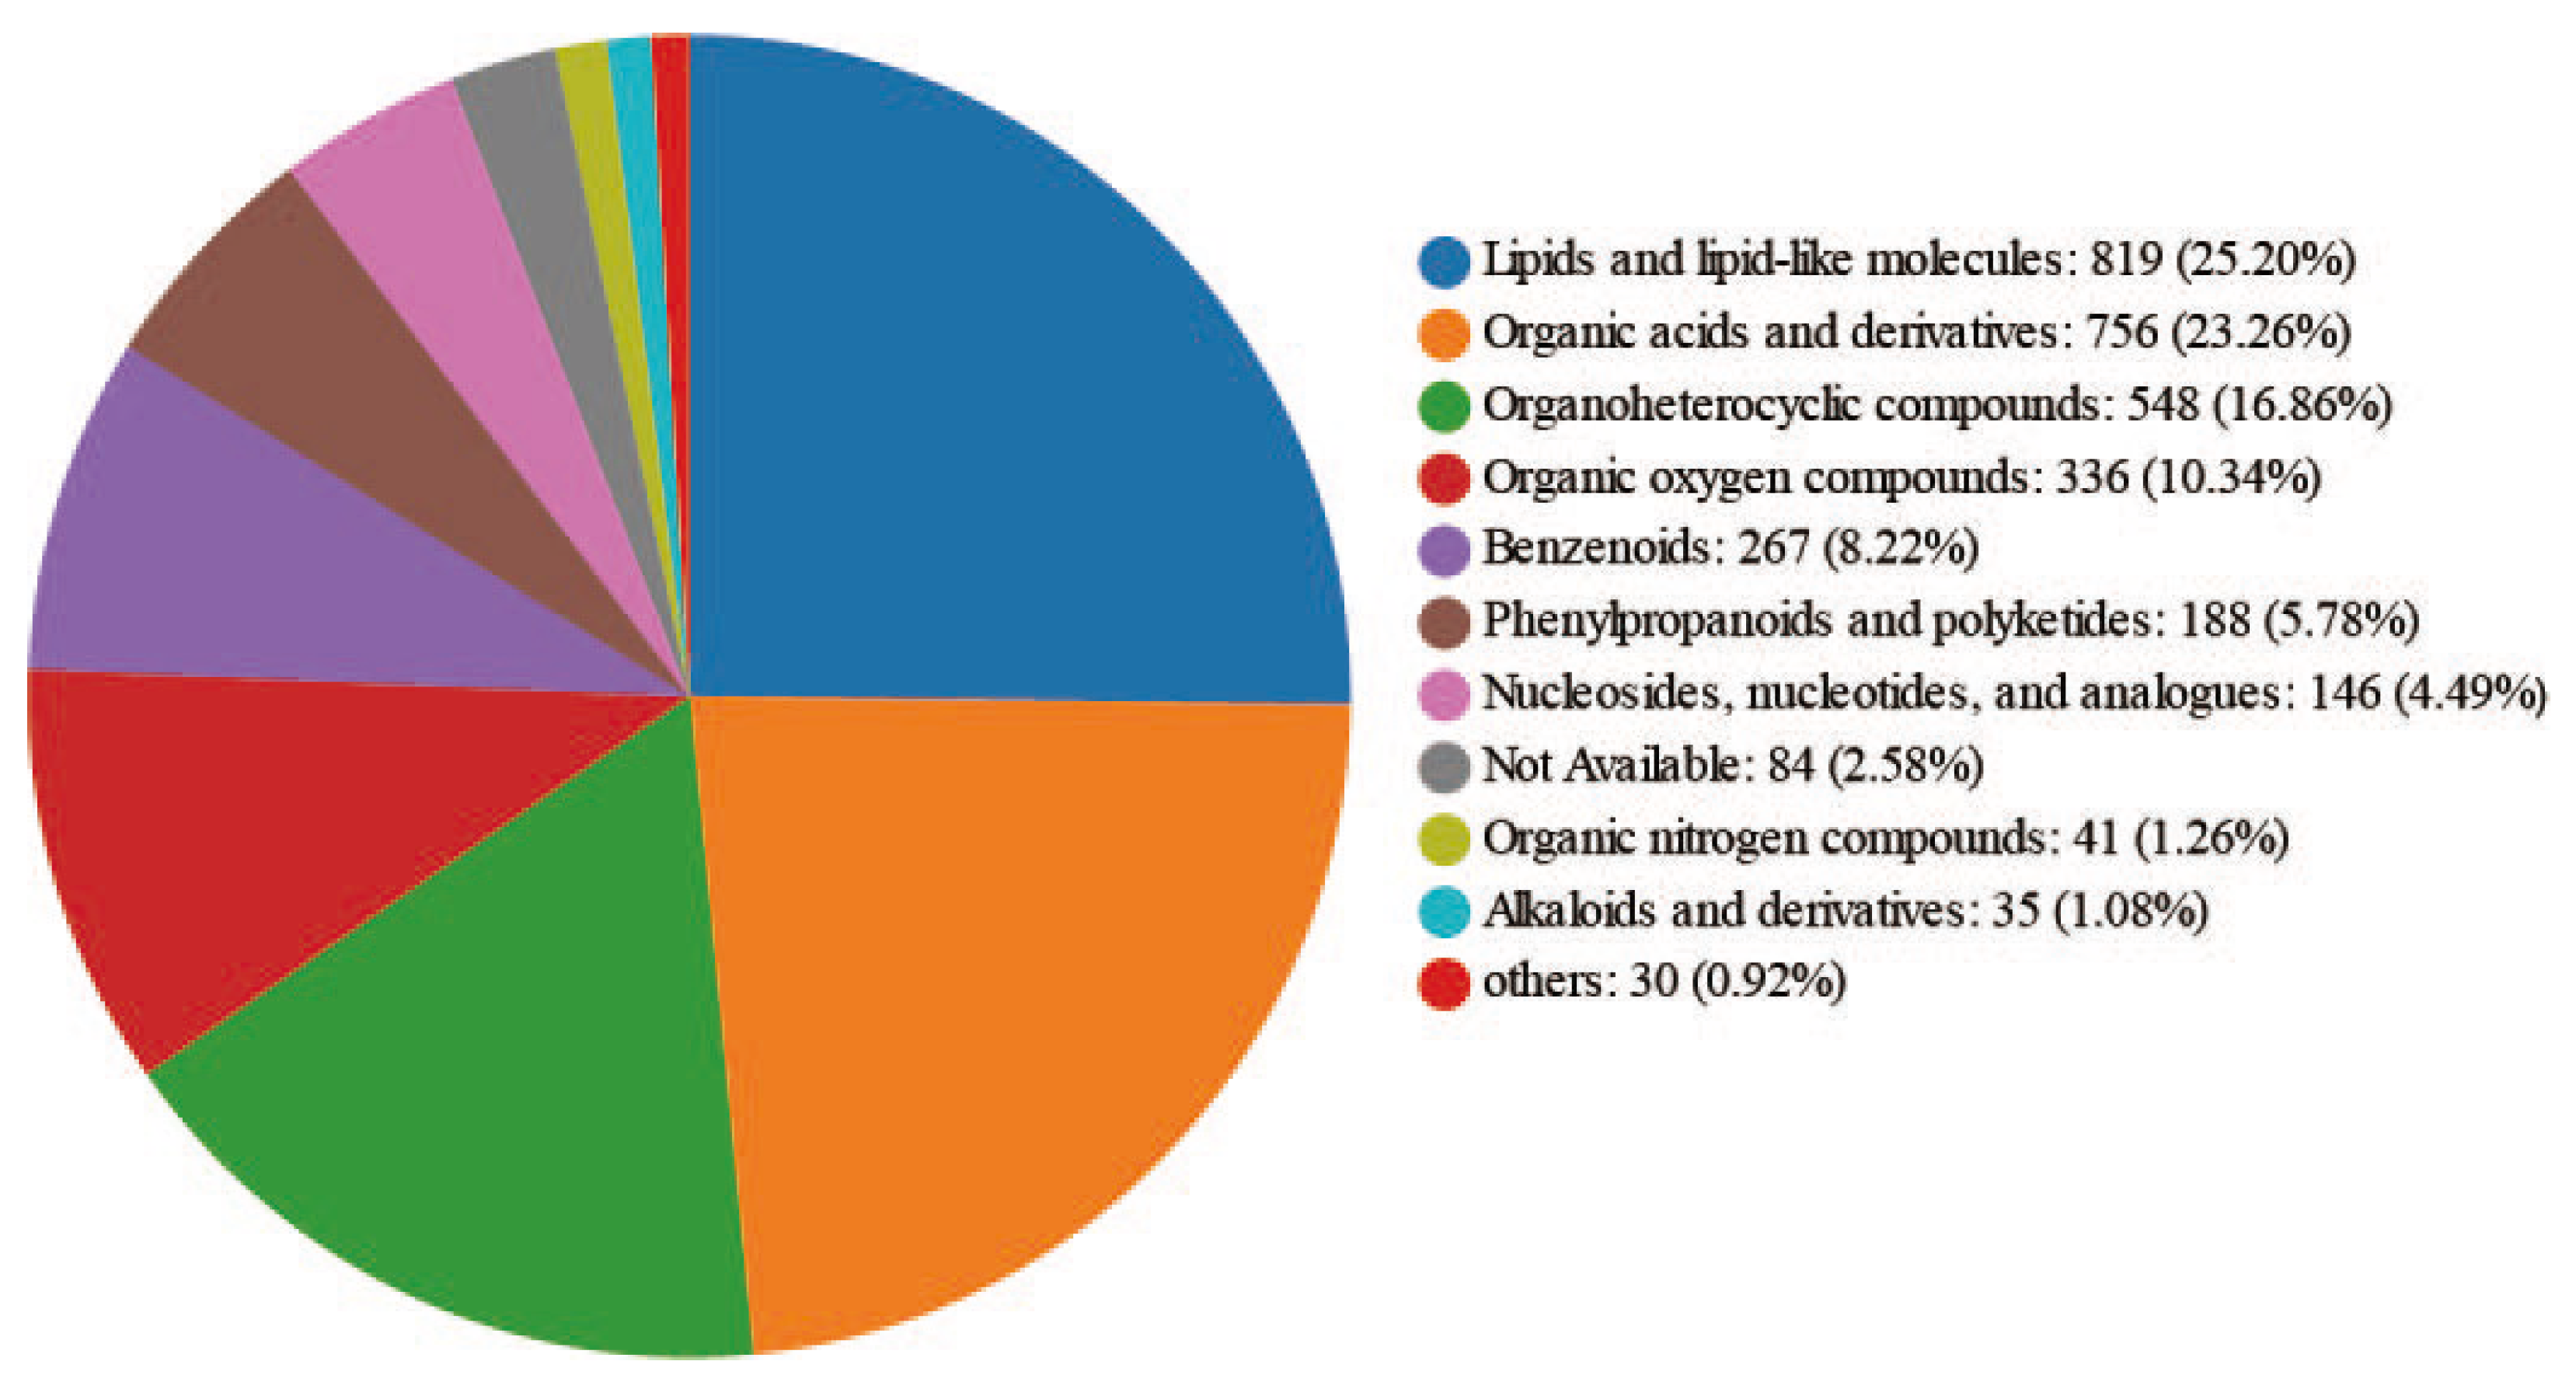
Hierarchical classification, based on the Human Metabolome Database 4.0(
https://hmdb.ca) (
Figure 2), highlighted the top three metabolites with the highest content in major replicate analyses: lipids and lipid-like molecules, organic acids, and organoheterocyclic compounds, respectively.
Note: (1) Ion mode: the ion mode of the substance detected by the mass spectrometer, including pos (positive ion mode) and neg (negative ion mode). (2) All peaks: the number of peaks extracted by the software. (3) Identified metabolites: the number of metabolites finally identified by the first and second level of mass spectrometry data. (4) Metabolites in library: the number of metabolites annotated to public databases such as HMDB, KEGG and Lipidmaps.
2.2. Metabolite Identification of the Hemolymph at Different Physiological Stages of Apis mellifera
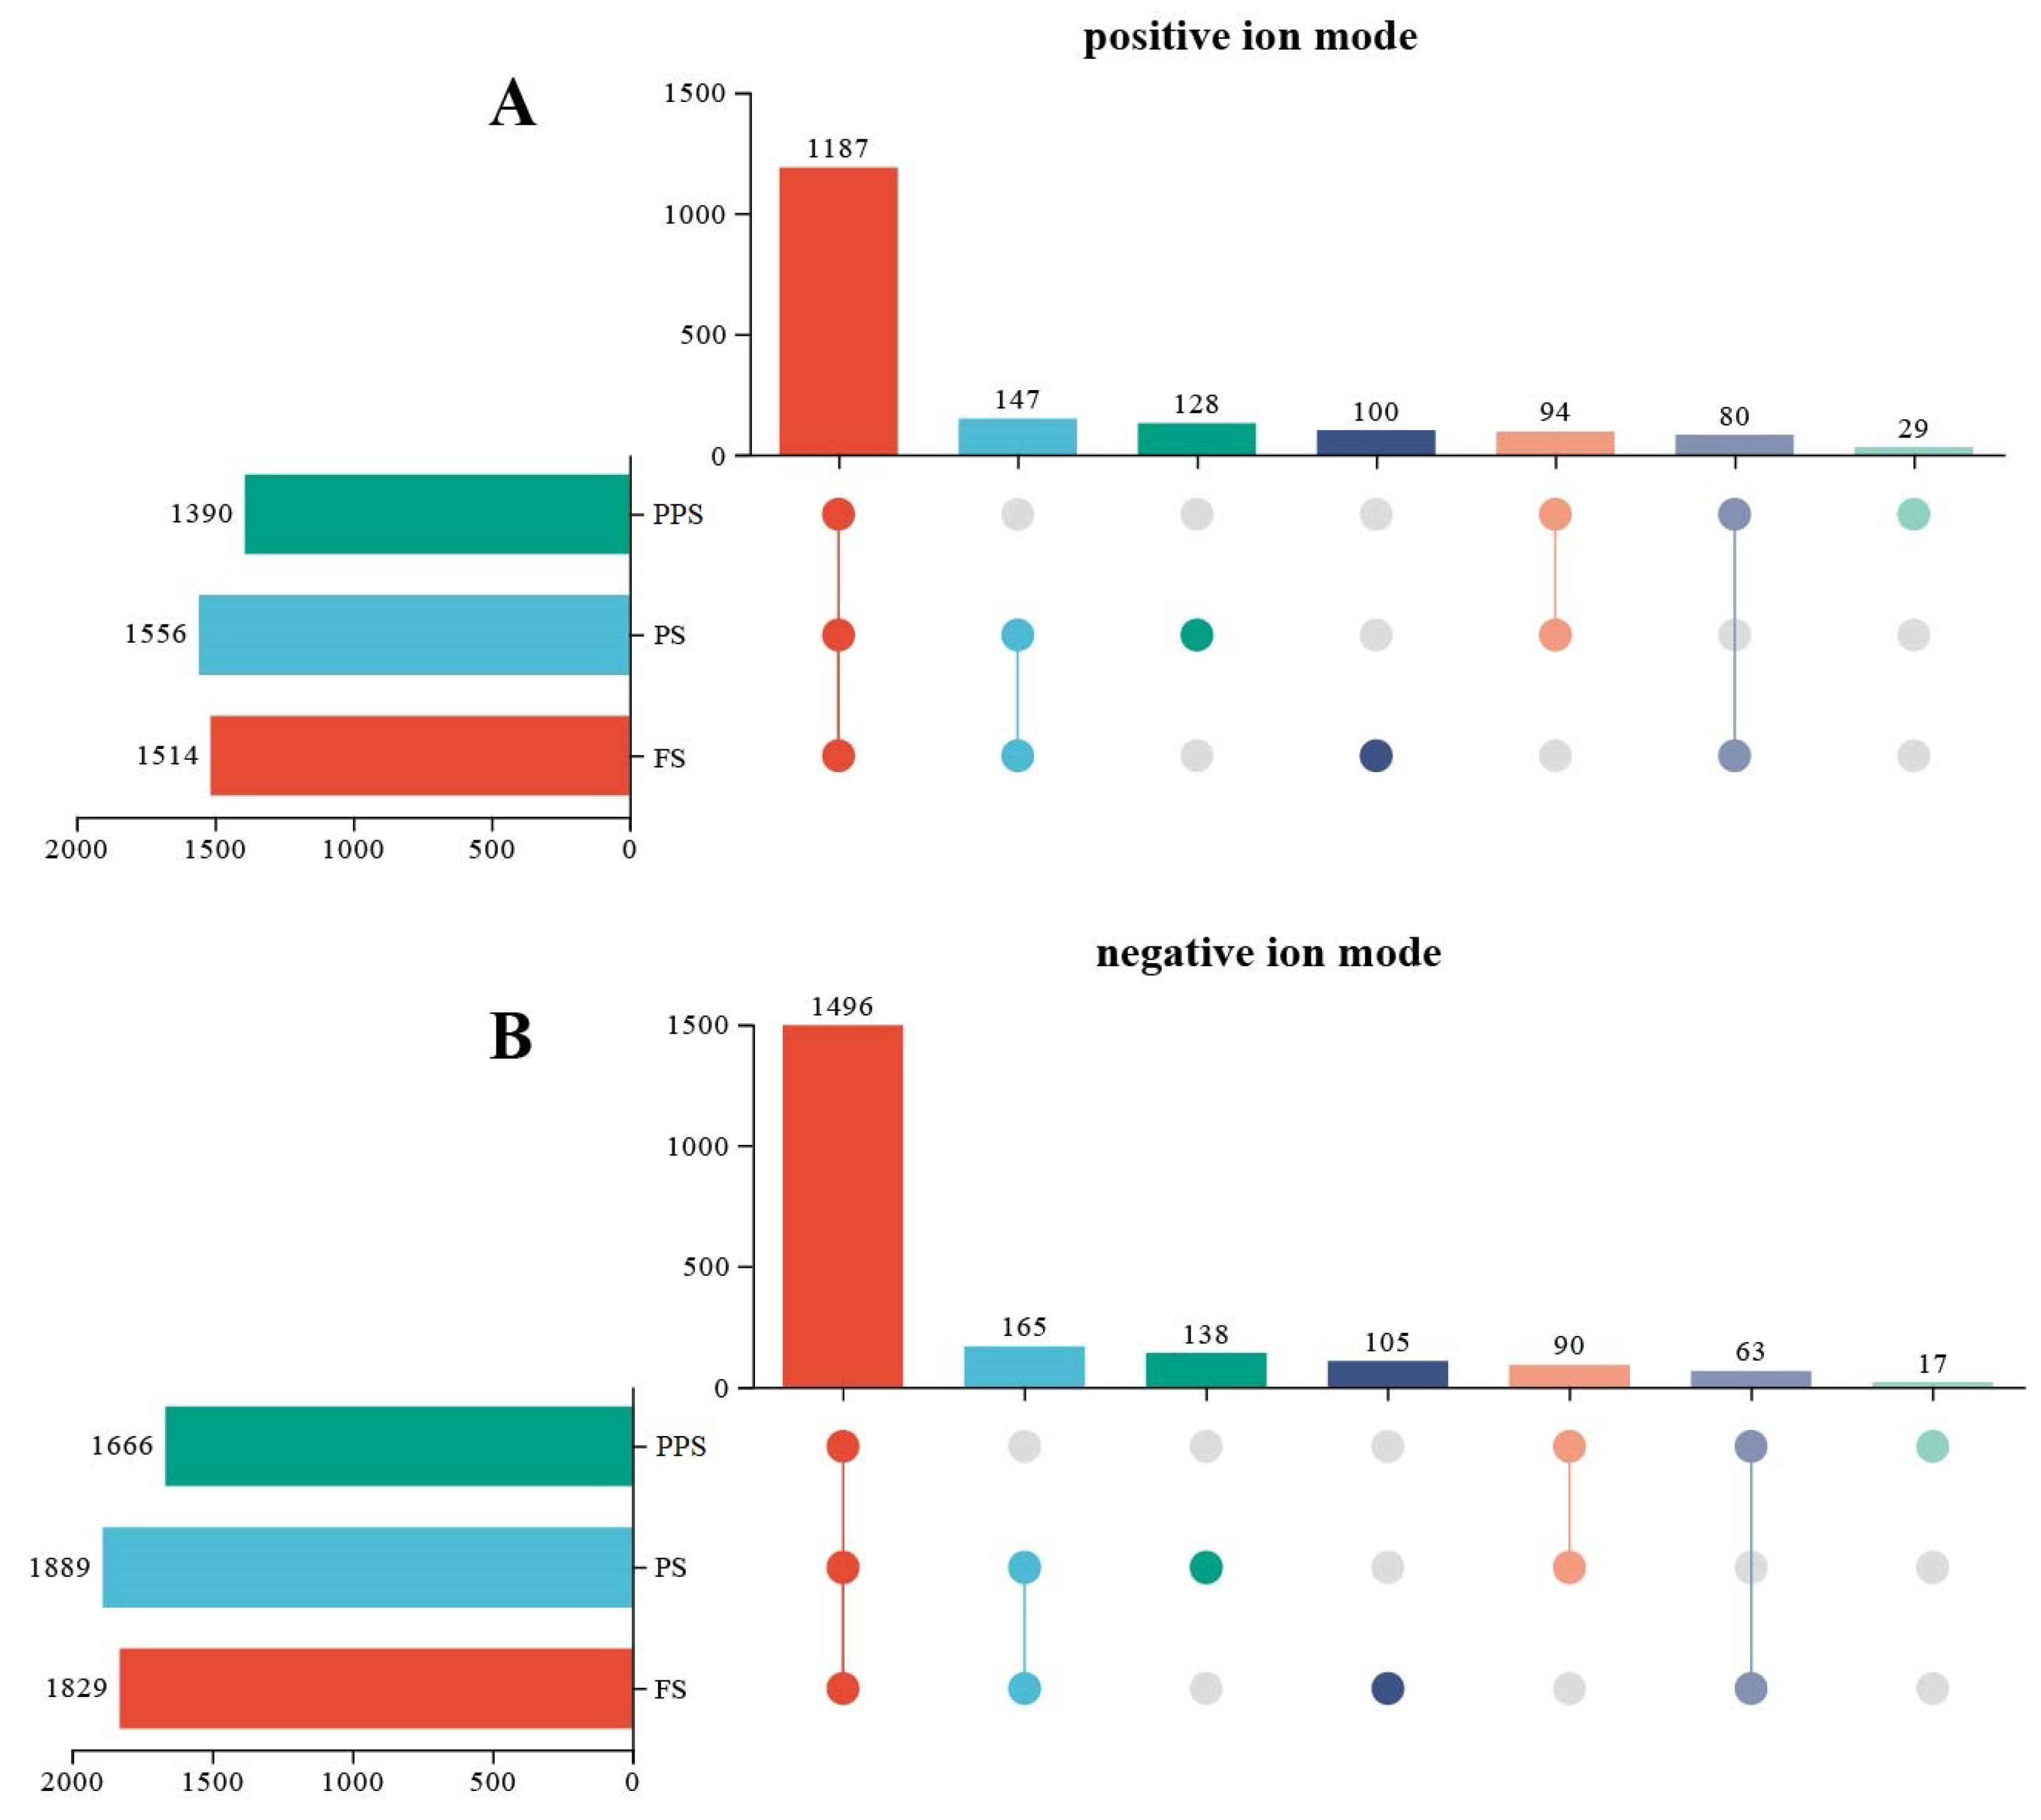
A comparative analysis was conducted utilizing the molecular mass of metabolites and secondary mass spectrometry information retrieved from KEGG, HMDB, and Metabolite Link (Metlin) databases. In the positive ion mode, a total of 1187 metabolites were identified in the hemolymph of larvae across the three physiological stages. Among these, 100 metabolites were specific to the feeding stage, 29 were specific to the prepupal stage, and 128 were specific to the pre-pupal stage (
Figure 3A).
In the negative ion mode, a total of 1496 metabolites were identified in the hemolymph of larvae across the three physiological stages. Among these, 105 metabolites were specific to FS, 17 were specific to PPS, and 138 were specific to PS (
Figure 3B).
2.3. Differential Metabolite Analysis of Hemolymph at Different Physiological Stages of Apis mellifera
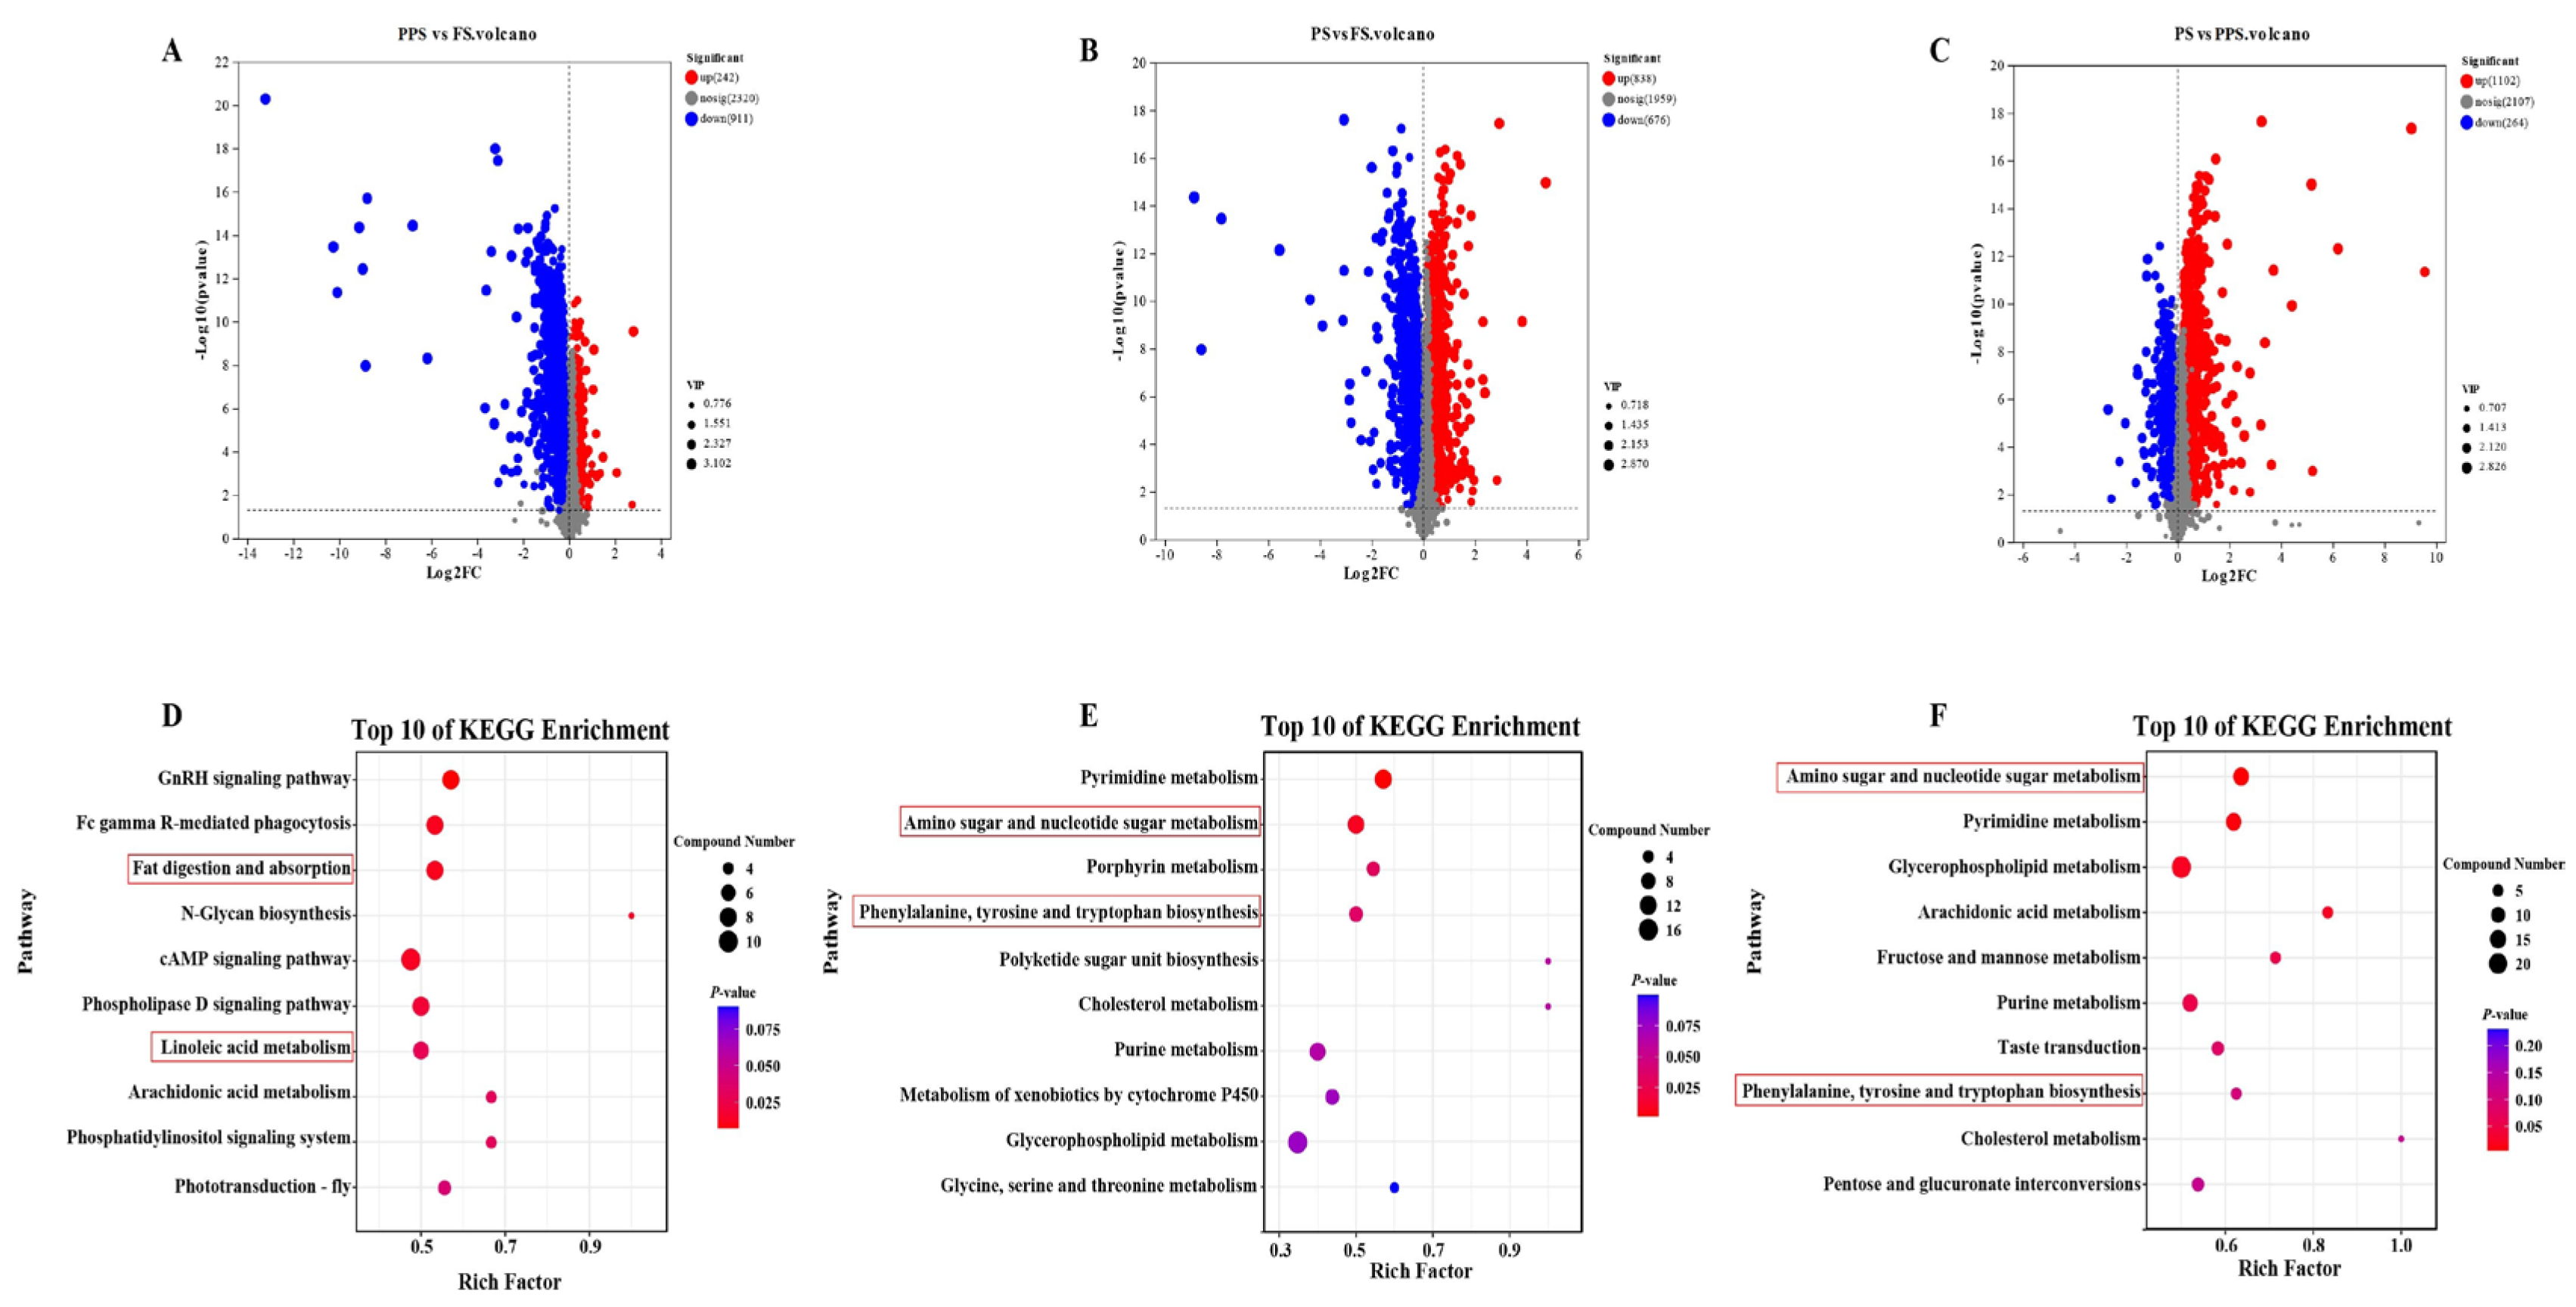
Comparing the prepupal stage with the feeding stage, a total of 1,153 differential metabolites were identified, with 242 up-regulated and 911 down-regulated (
Figure 4A). In the pre-pupal stage compared to FS, 1,514 differential metabolites were identified, of which 838 were up-regulated, and 676 were down-regulated (
Figure 4B). When PS was compared with FS, it revealed a total of 1,366 differential metabolites, with 1,102 up-regulated and 264 down-regulated (
Figure 4C).
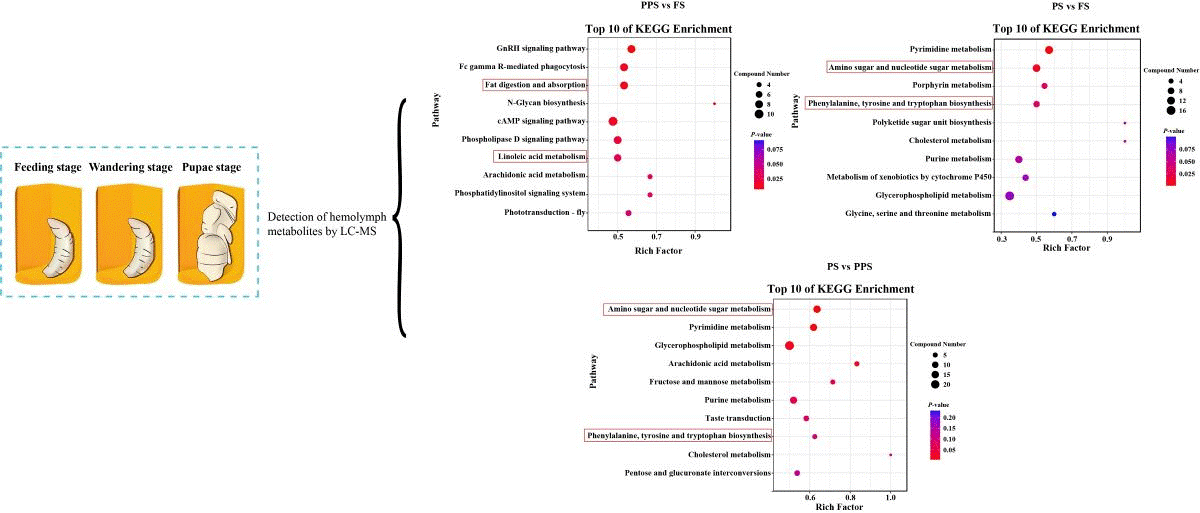
KEGG enrichment of up-regulated differential metabolites in PPS vs. FS revealed the top ten pathways in terms of enrichment scores were the GnRH signaling pathway, fc gamma R-mediated phagocytosis, fat digestion and absorption, N-Glycan biosynthesis, cAMP signaling pathway, phospholipase D signaling pathway, linoleic acid metabolism, arachidonic acid metabolism, phosphatidylinositol signaling system, and phototransduction - fly (
Figure 4D). For PS vs. FS upregulated differential metabolites, the top ten pathways with the highest KEGG enrichment scores were pyrimidine metabolism, amino sugar and nucleotide sugar metabolism, porphyrin metabolism, phenylalanine, tyrosine and tryptophan biosynthesis, polyketide sugar unit biosynthesis, cholesterol metabolism, purine metabolism, metabolism of xenobiotics by cytochrome P450, glycerophospholipid metabolism, and glycine, serine and threonine metabolism (
Figure 4E). Analysis of KEGG enrichment of up-regulated differential metabolites for PS vs. FS showed that the top ten pathways were amino sugar and nucleotide sugar metabolism, pyrimidine metabolism, glycerophospholipid metabolism, arachidonic acid metabolism, fructose and mannose metabolism, purine metabolism, taste transduction, phenylalanine, tyrosine and tryptophan biosynthesis, cholesterol metabolism, and pentose and glucuronate interconversions (
Figure 4F).
3. Discussion
Hemolymph serves as a vital circulatory fluid throughout the honey bee's body, playing a central role in transporting hormones and small-molecule regulatory factors that are crucial for regulating honey bee development [
13,
14]. In this study, metabolomics was employed to investigate differences in the composition of hemolymph metabolites in larvae of worker bees (
Apis mellifera) across three physiological developmental stages. Both PCA and PLS-DA modeling consistently revealed that samples within each group were clustered together, while the three groups were distinctly separated from each other. This suggests significant variations in the metabolism of honey bee larvae across different physiological stages.
Upon analyzing the metabolites of the three physiological stages and comparing the differences, a notable increase in up-regulated differential metabolites of 3.46 and 4.55 was observed for PS vs. FS and PS vs. PPS compared to PPS vs. FS, respectively. This indicates the necessity for the hemolymph of pupae stage larvae to mobilize a greater number of metabolites to fulfill the requirements of larvae pupation and set the stage for subsequent emergence from cells [
15,
16,
17].
The linoleic acid metabolism process involves four steps: oxidation, assembly, transport, and clearance. Initially, fatty acids undergo oxidation in the insect fat body to be converted into linoleic acid, which is then released into the hemolymph. Subsequently, the hemolymph transports linoleic acid to target cells [
18,
19]. Once inside the cell, carrier proteins facilitate the transport of linoleic acid across the cell membrane into the cytoplasm [
20]. Linoleic acid is then bound to the cytoplasmic enzyme "glucokinase", activating glycolipid metabolism and promoting a reduction in blood glucose concentration within the cell [
21]. Lastly, cellular scavenging mechanisms eliminate excess blood glucose and its metabolites, particularly linoleic acid, to prevent excessive accumulation [
22]. The top 10 enriched pathways for up-regulated differential metabolites in PPS vs FS include "linoleic acid metabolism". This can be attributed to FS larvae being fed substantial amounts of high-sugar compounds, such as honey and pollen, by nurse bees. In contrast, PPS larvae need to consume the fats and fatty acids converted from sugars during the FS stage to sustain their own existence [
3,
23]. This inference is supported by the enrichment of "fat metabolism and absorption" pathways in the hemolymph of PPS vs FS. Intriguingly, the levels of linoleic acid in the hemolymph of PPS were significantly lower than those of FS (
P < 0.05) (
Figure S1A). This observation may elucidate the ability of honey bee worker bees to consume high-sugar foods throughout their lives without experiencing excessive blood glucose levels. It also suggests that honey bees serve as a valuable model for studying diabetes and hyperlipidemic diseases [
24].
In the top 10 enriched pathways for up-regulated differential metabolites in both PS vs. FS and PS vs. PPS, pathways such as amino sugar and nucleotide sugar metabolism and phenylalanine, tyrosine, and tryptophan biosynthesis were consistently identified. Uridine diphosphate-N-acetylglucosamine in the amino sugar and nucleotide sugar metabolism pathway serves as a crucial precursor for lipopolysaccharide synthesis in honey bees [
25]. The wings of honey bees consist of a double body wall, each containing multiple layers of chitin [
26]. Chitin synthesis is essential for the growth and development of insects, including honey bee pupal stage larvae, which need to shed their old epidermal bonds before significant cuticle growth [
27]. Chitin synthase is responsible for synthesizing chitin using uridine diphosphate-N-acetylglucosamine [
28]. The metabolomic results revealed a significantly higher uridine diphosphate-N-acetylglucosamine content in the pre-pupal stage compared to both the feeding stage and prepupal stage (
F 2,15 = 101.39,
P < 0.001) (
Figure S1B). This elevated content indicates preparation for the later stages of worker bee emergence from cells. Insects, including honey bees, exhibit melanin in the epidermis and hemolymph, and it is synthesized through tyrosine metabolism. Melanin plays a crucial role in processes such as epidermal tanning (darkening and sclerosis), as well as wing and eye pigmentation post-molting [
29]. Ommochromes, a type of ophthalmic pigment, contribute to the coloring of insect eyes, eggs, and body walls. They are primarily synthesized through tryptophan metabolism and can manifest various colors, such as yellow, red, brown, and black. Ommochromes serve roles in insects such as coloring the eyes and removing excess tryptophan for detoxification [
30,
31]. Consequently, the enriched phenylalanine, tyrosine, and tryptophan biosynthesis pathway in the hemolymph of PS larvae is primarily implicated in the coloration of the compound eyes, thorax, and abdomen of worker bees. Similarly, tyrosine and tryptophan levels were significantly higher in PS hemolymph than in FS and PPS (
F 2,15 = 52.49,
P < 0.001;
F 2,15 = 612.36,
P < 0.001) (
Figure S1C, D), providing strong support for this conclusion.
4. Materials and Methods
4.1. Insect Rearing
Three colonies of honey bees (Apis mellifera) were maintained at the Honeybee Research Institute of Jiangxi Agricultural University, China (28.46°N, 115.49°E) to supply larvae and pupae for the experiment, with each colony housing eight combs. Acquired from a local commercial beekeeper in March 2023, all three experimental colonies underwent a period of more than 6 months under natural conditions at the experimental field. To ensure the uniform age of larvae and pupae, queens were confined to lay eggs on fresh comb for a duration of 12 hours. Subsequently, the combs with eggs were positioned in the upper level of Langstroth standard hives for incubation.
4.2. Chemicals and Reagents
The following reagents were used: methanol, acetonitrile, and isopropanol (Fisher Scientific Inc., Waltham, MA, USA), water (Millipore, Billerica, MA, USA), L-2-chlorophenylalanine (Sigma, St. Louis, MO, USA; purity ≥ 99%), formic acid (Shanghai Macklin Biochemical Technology Co., Shanghai, China).
4.3. Collection of Hemolymph from Larvae and Pupae
To harvest same-aged honey bee larvae, queens were caged on a fresh wax comb and allowed to lay eggs for 6 h inside the colony. Then, the comb with eggs was incubated in the top layer of the Langstroth hive. Upon the hatching of eggs into small larvae, six biological replicates of both larvae and pupae were gathered at 5 days old (feeding stage, FS), 9 days old (prepupal stage, PPS), and 13 days old (pupae stage, PS). All periods of larvae or pupae are naturally reared by nurse workers. The larvae or pupae were carefully extracted from the comb, placed in asepsis petri dishes, and subjected to three rinses with asepsis double-distilled water to ensure the cleanliness of their body surfaces. Subsequently, the larvae were gently dried with sterile filter paper. Positioning the larvae on sterile filter paper, a small asepsis incision was made in the head using scissors, and the hemolymph was aspirated with an asepsis pipette and then transferred to a 1.5 mL sterile EP tube. The collected volume of bee larval hemolymph in each EP tube was 800 µL. After centrifugation at 14,000 × g for 15 minutes at 4°C, 450 µL of supernatant was removed from a fresh 2 mL freezing tube and rapidly frozen in liquid nitrogen for subsequent analysis.
Each honey bee colony contributed two biological replicates, consisting of eight individuals per biological replicate. In total, 18 samples were collected for the hemolymph metabolome study.
4.4. Pre-Treatment of Hemolymph Samples
A volume of 300 µL of the sample was accurately aspirated into a 2 mL centrifuge tube, and a 6 mm diameter grinding bead was added. Subsequently, 240 µL of aqueous methanol with water in a ratio of 4:1 (v:v) was added, with L-2-chlorophenylalanine introduced as an internal standard at a concentration of 0.02 mg/mL in the sample. Following a 6-minute grinding period at -10 ℃ and 50 Hz, the centrifuge tubes were placed into a frozen tissue grinder (SCIENTZ, Ningbo, China) and subjected to extraction through low-temperature ultrasonication for 30 minutes at 5 ℃ and 40 KHz. Lastly, the sample was extracted at -20 ℃ for 30 minutes, followed by centrifugation for 15 minutes at 13000 × g and 4 ℃. The supernatant was then transferred to a 1.5 mL vial with an internal cannula for subsequent analysis.
4.5. LC-MS Method
Samples (3 μL) were injected into an ACQUITY UPLC HSS T3 column (100 mm × 2.1 mm, 1.8 µm; Waters, Milford, USA) using the Ultra High-Performance Liquid Chromatography-Fourier Transform Mass Spectrometry UHPLC-Exploris 240 system (Fisher Scientific Inc.). The column was washed with a gradient of mobile phases A and B for 8 minutes at a flow rate of 0.5 mL/min. Mobile phase A consisted of 95% water + 5% acetonitrile (containing 0.1% formic acid), while mobile phase B comprised 47.5% acetonitrile + 47.5% isopropanol + 5% water (containing 0.1% formic acid). The column temperature was maintained at 40 ℃, and the flow rate was set at 0.4 mL/min.
Mass spectrometry conditions involved the ionization of samples via electrospray ionization, with mass spectrometry signals collected in positive and negative ion scanning modes, respectively. Specific details of the parameters are provided in
Table S1.
4.6. Quality Control
Quality control (QC) samples were generated by combining equal volumes of extracts from all individual samples. Each QC sample shared an identical volume with the individual samples and underwent the same processing and assay procedures as the analyzed samples. These QC samples were systematically integrated into the instrumental analysis to assess the overall stability and consistency of the entire assay process.
4.7. Identification of Metabolites in Hemolymph
The raw data underwent processing using the metabolomics software ProgenesisQI (Waters Corporation, Milford, USA), encompassing baseline filtering, peak identification, integration, retention time correction, and peak alignment. This comprehensive analysis resulted in a data matrix containing information on retention time, mass-to-charge ratio, and peak intensity. The finalized data matrix encapsulated essential details for subsequent analyses.
Following this, the software executed a characteristic peak search for library identification, aligning the MS and MS/MS mass spectral information with the metabolic data library. Metabolite identification was then carried out using the software, which matched the MS and MS/MS mass spectral information with the metabolic database. The MS mass error was set to less than 10 ppm, and metabolites were identified based on secondary mass spectral matching scores. Comparison databases utilized were accessible from
http://www.hmdb.ca/ and
https://metlin.scripps.edu.
The initial preprocessing step involved the data matrix, where missing values were addressed using the 80% rule. Variables with more than 80% non-zero values in at least one set of samples were retained, and missing values were then imputed with the smallest values from the original matrix. To mitigate errors arising from sample preparation and instrument instability, the response intensities of sample mass spectral peaks were normalized through the sum normalization method, resulting in a normalized data matrix. Furthermore, variables with a relative standard deviation (RSD) exceeding 30% were eliminated from the QC samples and log10-transformed to yield the final data matrix for subsequent analysis.
Subsequently, PCA and PLS-DA were conducted on the preprocessed data matrices using the ropls package in R (Version 1.6.2). Model stability was evaluated through 7 cycles of cross-validation. Significant metabolites were chosen based on Variable Importance in Projection (VIP) values obtained from the Orthogonal Partial Least Squares Discriminant Analysis (OPLS-DA) model and the student's t-test P-value. Metabolites with VIP > 1 and P < 0.05 were regarded as statistically significant.
Differential metabolites were identified through metabolic pathway annotation using the KEGG database (
https://www.kegg.jp/kegg/pathway.html) to explore pathways associated with these metabolites. Pathway enrichment analysis was conducted using the Python package "scipy. stats", and Fisher's exact test was employed to determine the experimental treatments most relevant to the biological pathways.
4.8. Data Analysis
Independent samples t-test, analysis of variance, and least significant difference were used to determine the significance of the differences, and P < 0. 05 was considered as statistical significance. The data were expressed as mean ± SD.
Supplementary Materials
The following supporting information can be downloaded at the website of this paper posted on Preprints.org, Table S1: Mass spectrometry parameters; Figure S1: The relative abundance of linoleic acid, uridine diphosphate-N-acetylglucosamine, tyrosine and tryptophan in different developmental stages of Apis mellifera. (A) Relative abundance of linoleic acid in FS and PPS; (B) Relative abundance of uridine diphosphate-N-acetylglucosamine in FS, PPS and PS; (C) Relative abundance of tyrosine in FS, PPS and PS; (D) Relative abundance of tryptophan in FS, PPS and PS.
Author Contributions
Z.L. designed research; Z.L. S.Z. and B.L. performed research; L.L., H.Z. and W.G provided guidance for data; Z.L. and D.G analyzed data; Z.L. wrote the paper. All authors have read and agreed to the published version of the manuscript.
Funding
This work was supported by the Special Funds for Construction of Modern Agricultural Industrial Technology System in Jiangxi Province (Grant Number: JXARS-14) and Jiangxi Provincial Natural Science Foundation (Grant Number: 20224BAB215037).
Institutional Review Board Statement
Not applicable.
Informed Consent Statement
Not applicable.
Data Availability Statement
The data in this study are available upon reasonable request.
Acknowledgments
This is a contribution from the College of Life Science and Resources and Environment, Yichun University.
Conflicts of Interest
The authors declare that they have no known competing financial interests or personal relationships that could have appeared to influence the work reported in this paper.
References
- Wang, Y.; Ma, L.-T.; Xu, B.-H. , Diversity in life history of queen and worker honey bees, Apis mellifera L. J. Asia Pac. Entomol 2015, 18, 145–149. [Google Scholar] [CrossRef]
- Vázquez, D. E.; Farina, W. M. , Locomotion and searching behaviour in the honey bee larva depend on nursing interaction. Apidologie 2021, 52, 1368–1386. [Google Scholar] [CrossRef]
- Barie, K.; Amsalem, E. , The influence of the social environment on larval development and resulting caste in Bombus impatiens. Anim Behav. 2023, 200, 49–57. [Google Scholar] [CrossRef]
- da Cruz-Landim, C.; Patrício, K.; Antonialli Jr, W. F. , Cell death and ovarian development in highly eusocial bees (Hymenoptera, Apidae): Caste differentiation and worker egg laying. J Morphol Sci. 2017, 23, 27–42. [Google Scholar]
- Noël, A.; Dumas, C.; Rottier, E.; Beslay, D.; Costagliola, G.; Ginies, C.; Nicolè, F.; Rau, A.; Le Conte, Y.; Mondet, F. , Detailed chemical analysis of honey bee (Apis mellifera) worker brood volatile profile from egg to emergence. Plos one 2023, 18, e0282120. [Google Scholar] [CrossRef]
- Vásquez-Ibarra, L.; Iriarte, A.; Rebolledo-Leiva, R.; González-Araya, M. C.; Angulo-Meza, L. , Determining the key factors that contribute to the eco-efficiency level of honey production using life cycle approaches. INT J Life Cycle Ass. 2023, 1–11. [Google Scholar] [CrossRef]
- Zariman, N. A.; Omar, N. A.; Huda, A. N. , Plant Attractants and Rewards for Pollinators: Their Significant to Successful Crop Pollination. I J Life Sciand Biotech. 2022, 5, 270–293. [Google Scholar] [CrossRef]
- VanEngelsdorp, D.; Evans, J. D.; Saegerman, C.; Mullin, C.; Haubruge, E.; Nguyen, B. K.; Frazier, M.; Frazier, J.; Cox-Foster, D.; Chen, Y. , Colony collapse disorder: a descriptive study. PloS one 2009, 4, e6481. [Google Scholar] [CrossRef]
- Malita, A.; Rewitz, K. , Interorgan communication in the control of metamorphosis. Curr Opin Insect Sci. 2021, 43, 54–62. [Google Scholar] [CrossRef]
- Schooley, D. A.; Horodyski, F. M.; Coast, G. M. , Hormones controlling homeostasis in insects. In Insect endocrinology, Elsevier: 2012; pp 366-429.
- Gäde, G. , Regulation of intermediary metabolism and water balance of insects by neuropeptides. Annu Rev Entomol. 2004, 49, 93–113. [Google Scholar] [CrossRef]
- Wang, Y.; Li-Byarlay, H. , Physiological and molecular mechanisms of nutrition in honey bees. In Advances in Insect Physiology, Elsevier: 2015; Vol. 49, pp 25-58.
- Liberti, J.; Kay, T.; Quinn, A.; Kesner, L.; Frank, E. T.; Cabirol, A.; Richardson, T. O.; Engel, P.; Keller, L. , The gut microbiota affects the social network of honeybees. NAT Ecol Evol. 2022, 6, 1471–1479. [Google Scholar] [CrossRef] [PubMed]
- Pasquier, C.; Robichon, A. , Temporal and sequential order of nonoverlapping gene networks unraveled in mated female Drosophila. Life Sci Alliance. 2022, 5. [Google Scholar] [CrossRef] [PubMed]
- Gillette, C. M.; Tennessen, J. M.; Reis, T. , Balancing energy expenditure and storage with growth and biosynthesis during Drosophila development. Dev Biol. 2021, 475, 234–244. [Google Scholar] [CrossRef] [PubMed]
- Oliveira, A. C.; Rebelo, A. R.; Homem, C. C. , Integrating animal development: how hormones and metabolism regulate developmental transitions and brain formation. Dev Biol. 2021, 475, 256–264. [Google Scholar] [CrossRef] [PubMed]
- Tellis, M. B.; Kotkar, H. M.; Joshi, R. S. , Regulation of trehalose metabolism in insects: from genes to the metabolite window. Glycobiology 2023, 33, 262–273. [Google Scholar] [CrossRef] [PubMed]
- Song, Y.; Gu, F.; Liu, Z.; Li, Z.; Wu, F. a.; Sheng, S. , The key role of fatty acid synthase in lipid metabolism and metamorphic development in a destructive insect pest, Spodoptera litura (Lepidoptera: Noctuidae). INT J Mol Sci 2022, 23, 9064. [Google Scholar] [CrossRef] [PubMed]
- Kaczmarek, A.; Boguś, M. , The metabolism and role of free fatty acids in key physiological processes in insects of medical, veterinary and forensic importance. PeerJ 2021, 9, e12563. [Google Scholar] [CrossRef] [PubMed]
- Pei, D. , How do biomolecules cross the cell membrane? Acc. Chem. Res. 2022, 55, 309–318. [Google Scholar] [CrossRef]
- Yan, B.; Fung, K.; Ye, S.; Lai, P.-M.; Wei, Y. X.; Sze, K.-H.; Yang, D.; Gao, P.; Kao, R. Y.-T. , Linoleic acid metabolism activation in macrophages promotes the clearing of intracellular Staphylococcus aureus. Chem Sci. 2022, 13, 12445–12460. [Google Scholar] [CrossRef]
- Unuofin, J. O.; Lebelo, S. L. , Antioxidant effects and mechanisms of medicinal plants and their bioactive compounds for the prevention and treatment of type 2 diabetes: an updated review. OXID Med Cell Longev. 2020, 2020. [Google Scholar] [CrossRef]
- Standifer, L. , Honey bee nutrition supplemental feeding. Beekeeping in the United States Agriculture Handbook 2003, 335, 39–45. [Google Scholar]
- Wang, X.; Qi, Y.; Zheng, H. , Dietary polyphenol, gut microbiota, and health benefits. Antioxidants 2022, 11, 1212. [Google Scholar] [CrossRef] [PubMed]
- Boucias, D. G.; Pendland, J. C. , Principles of insect pathology. Springer Science & Business Media: 2012.
- Yu, L.; Zhao, J.; Wang, W.; Zong, L.; Ge, S.; Yan, S. , Structural stabilization of honeybee wings based on heterogeneous stiffness. Soft Matter 2023, 19, 841–850. [Google Scholar] [CrossRef] [PubMed]
- Yu, J.; Wang, H.; Chen, W.; Song, H.; Wang, Y.; Liu, Z.; Xu, B. , 20-Hydroxyecdysone and receptor interplay in the regulation of hemolymph glucose level in honeybee (Apis mellifera) larvae. Metabolites 2023, 13, 80. [Google Scholar] [CrossRef] [PubMed]
- Shi, J. F.; Fu, J.; Mu, L. L.; Guo, W. C.; Li, G. Q. , Two Leptinotarsa uridine diphosphate N-acetylglucosamine pyrophosphorylases are specialized for chitin synthesis in larval epidermal cuticle and midgut peritrophic matrix. Insect Biochem Molec 2016, 68, 1–12. [Google Scholar] [CrossRef] [PubMed]
- Whitten, M. M.; Coates, C. J. , Re-evaluation of insect melanogenesis research: Views from the dark side. Pigm Cell Melanoma R. 2017, 30, 386–401. [Google Scholar] [CrossRef] [PubMed]
- Figon, F.; Casas, J. , Ommochromes in invertebrates: biochemistry and cell biology. Biological Reviews 2019, 94, 156–183. [Google Scholar] [CrossRef]
- Shamim, G.; RANjAN, S. K.; PANdEy, D. M.; RAmANI, R. , Biochemistry and biosynthesis of insect pigments. EJE 2014, 111, 149–164. [Google Scholar] [CrossRef]
|
Disclaimer/Publisher’s Note: The statements, opinions and data contained in all publications are solely those of the individual author(s) and contributor(s) and not of MDPI and/or the editor(s). MDPI and/or the editor(s) disclaim responsibility for any injury to people or property resulting from any ideas, methods, instructions or products referred to in the content. |
© 2024 by the authors. Licensee MDPI, Basel, Switzerland. This article is an open access article distributed under the terms and conditions of the Creative Commons Attribution (CC BY) license (https://creativecommons.org/licenses/by/4.0/).
