Submitted:
23 May 2024
Posted:
24 May 2024
You are already at the latest version
Abstract
Keywords:
Introduction
1.1. Overview
1.2. Problem Statement
1.3. Objectives
- To identify the appropriate sign language recognition CNN based algorithm.
- To prepare Malaysian Sign Language dataset.
- To test the performance of the proposed model in a website application environment.
1.4. Scope of The Study
1.5. Project Limitation
Literature Review
2.1. Convolutional Neural Network
2.2. Sign Language Recognition
2.3. Related Work
Methodology
3.1. Model Framework
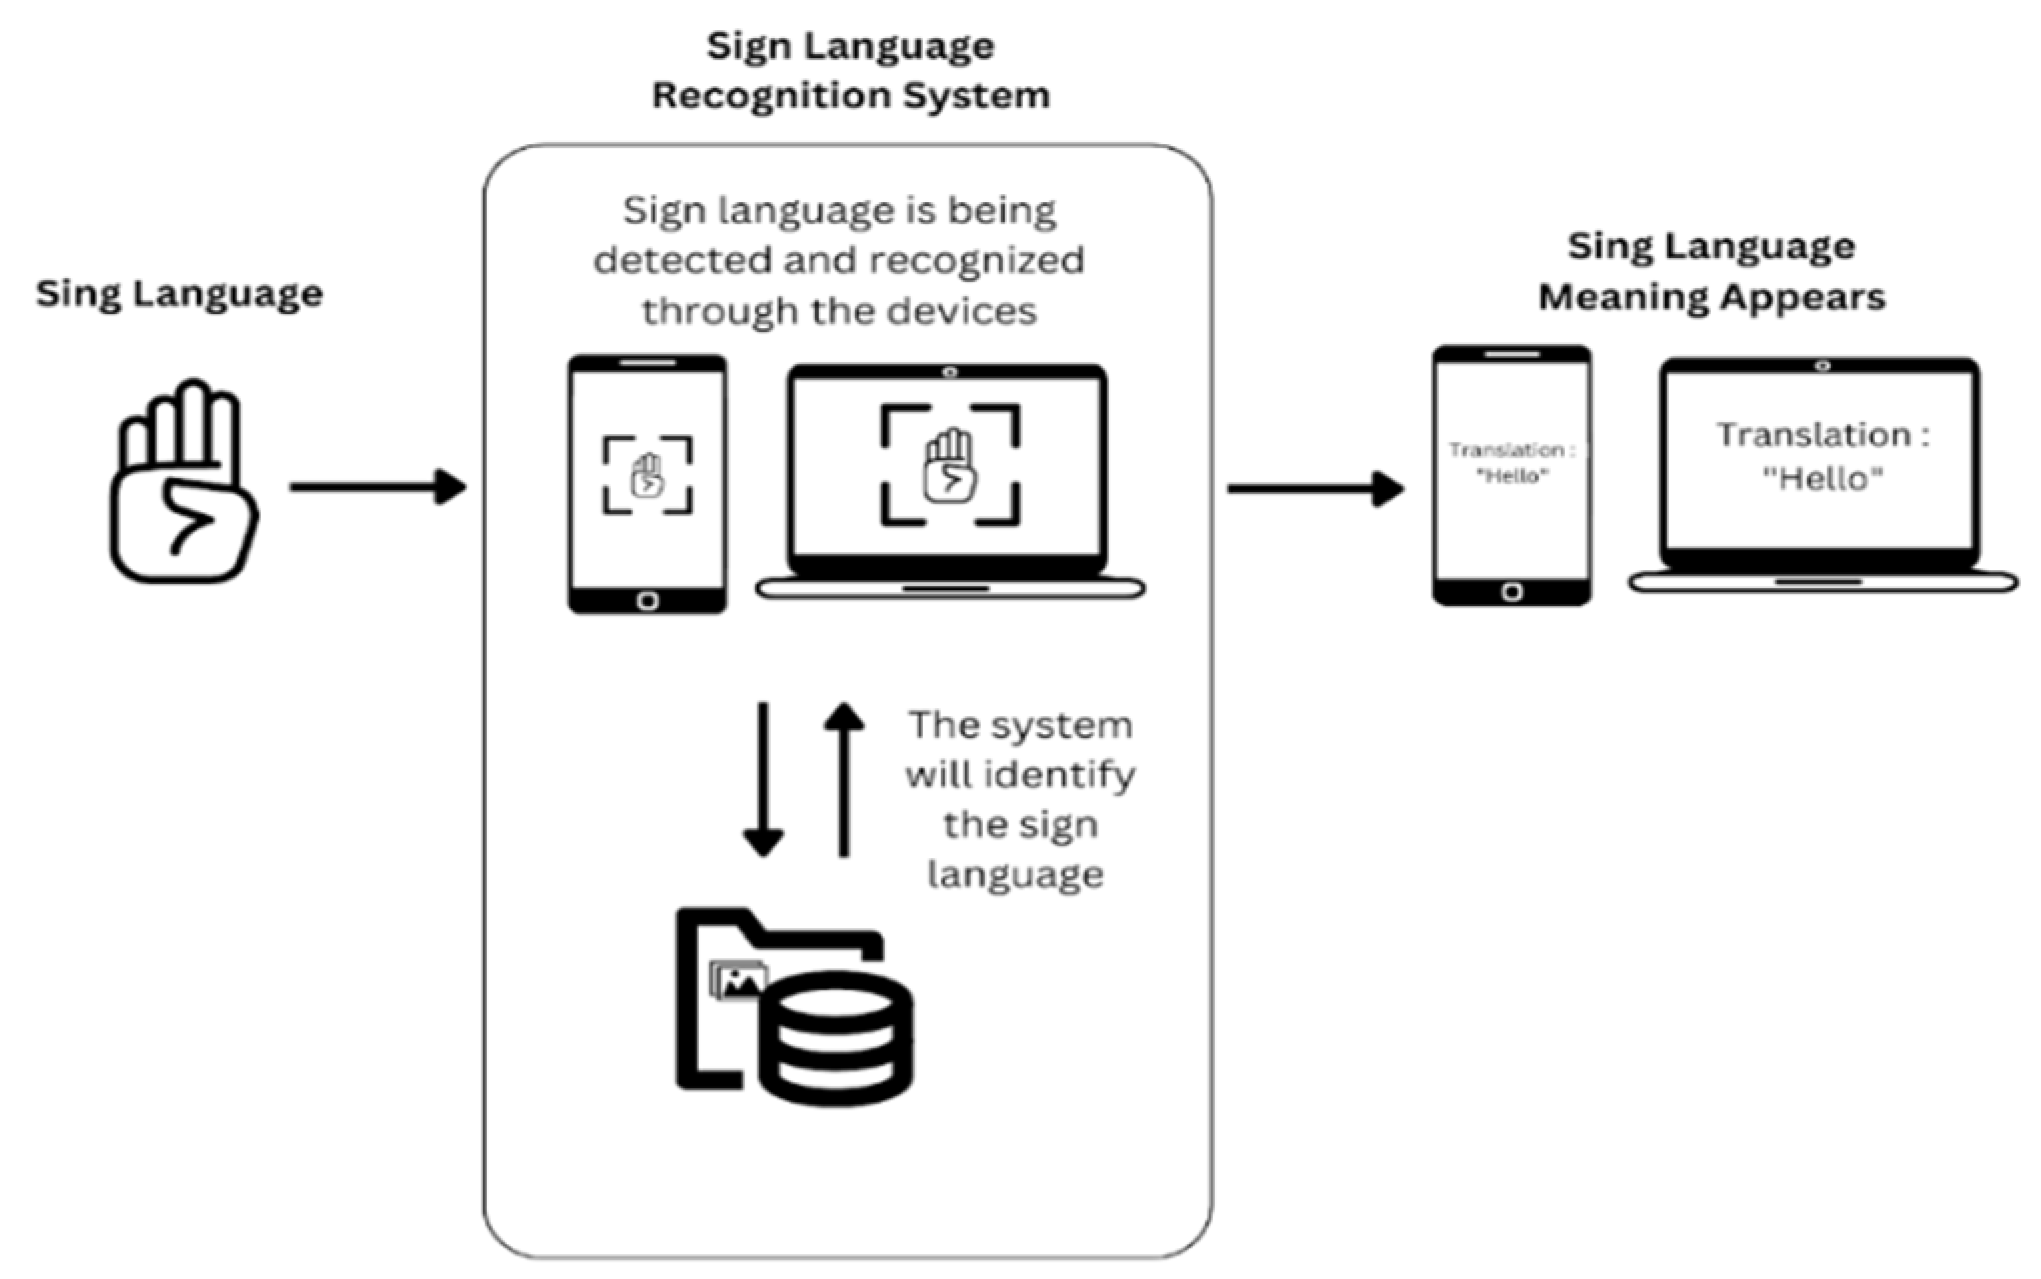
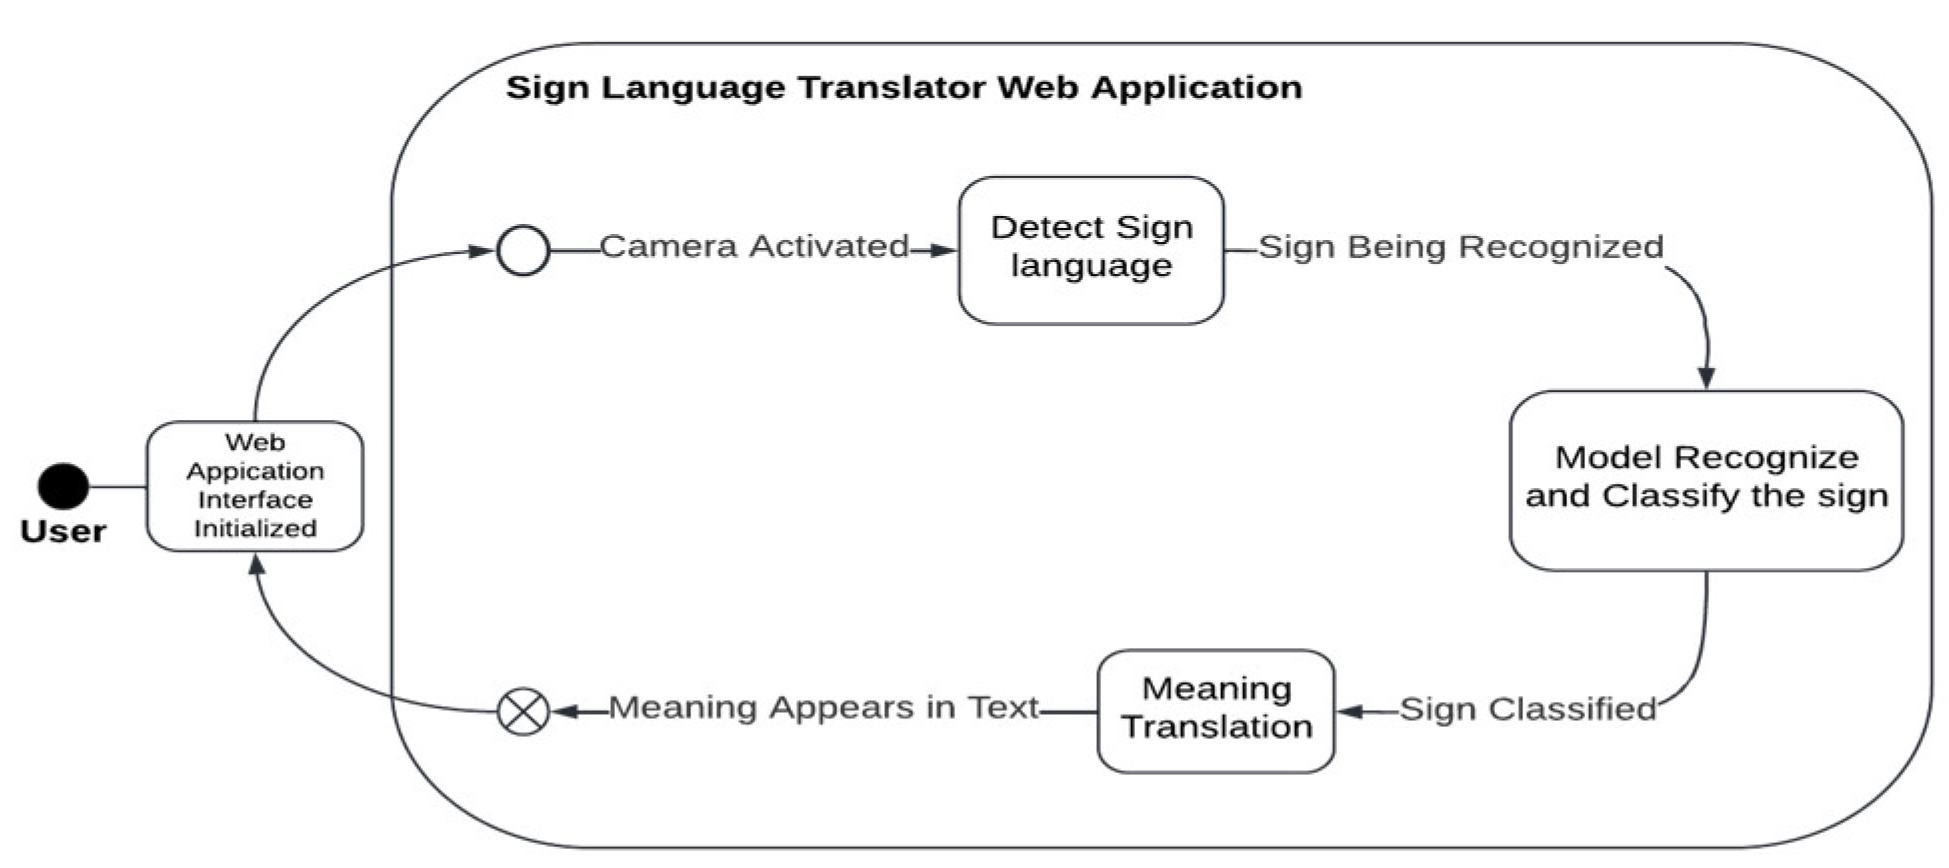
3.2. Project Development
3.2.1. Malaysian Sign Language Dataset
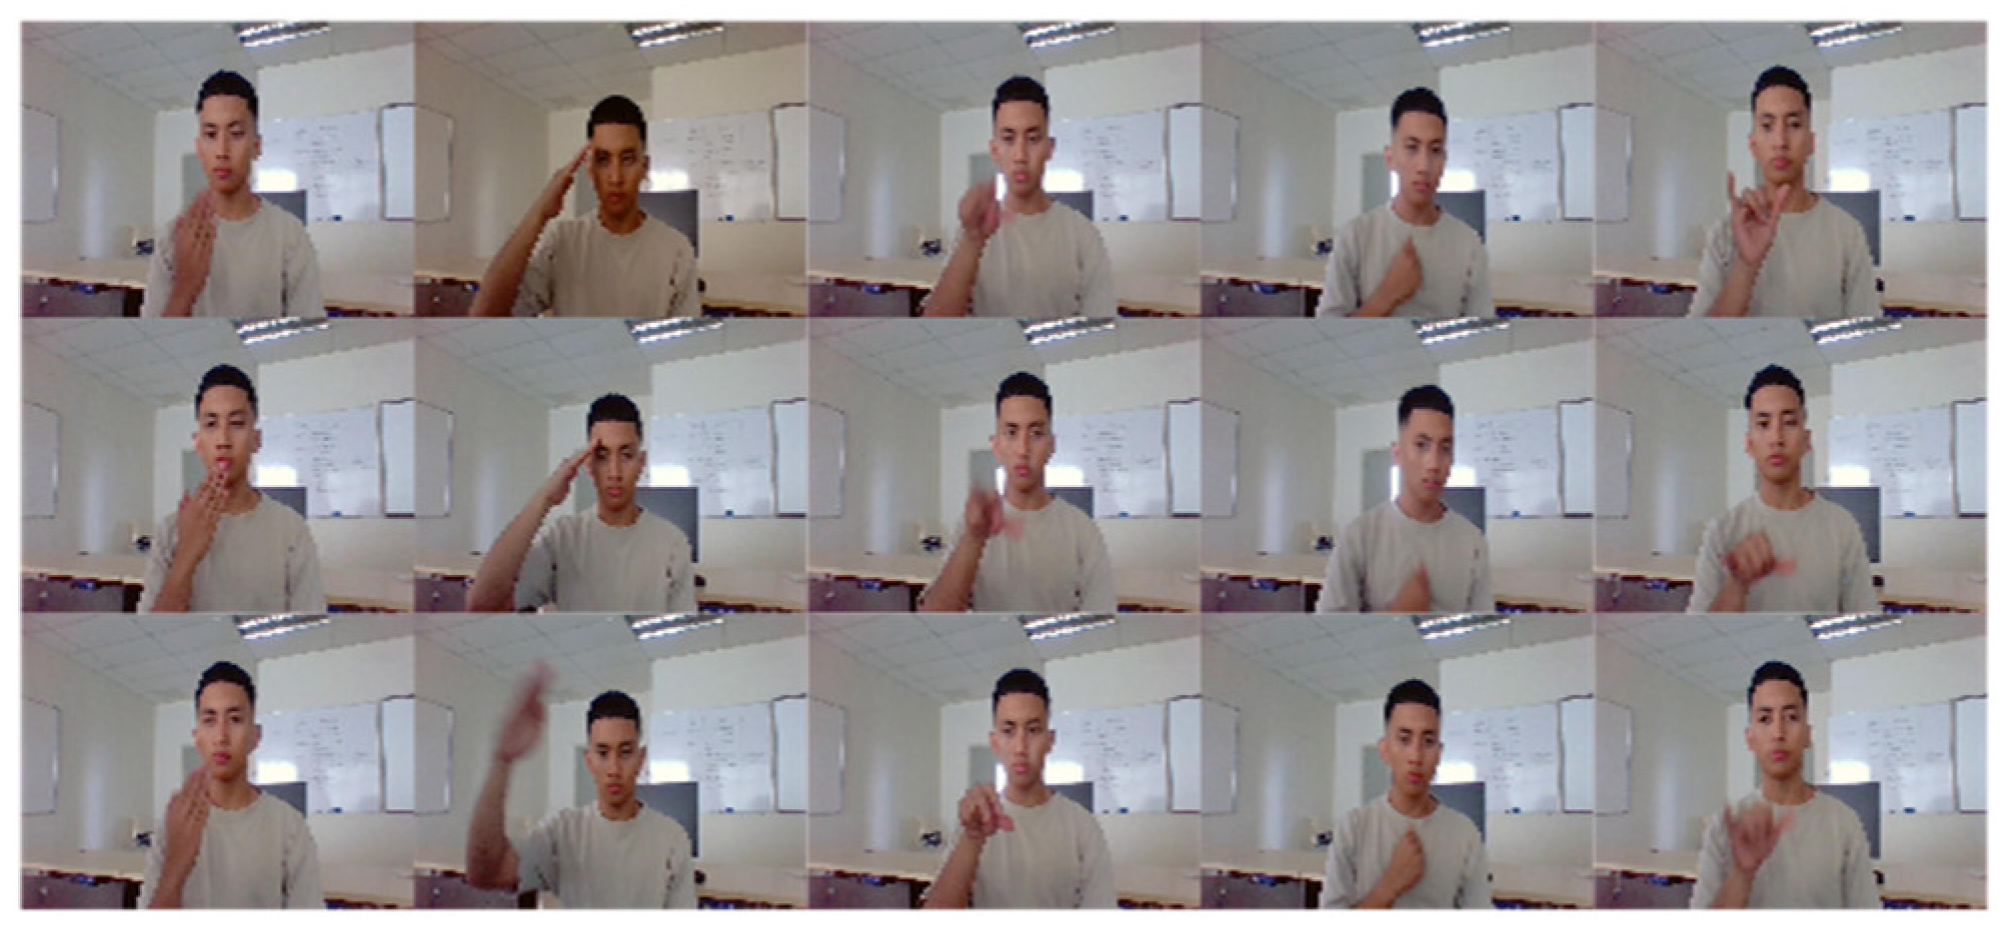
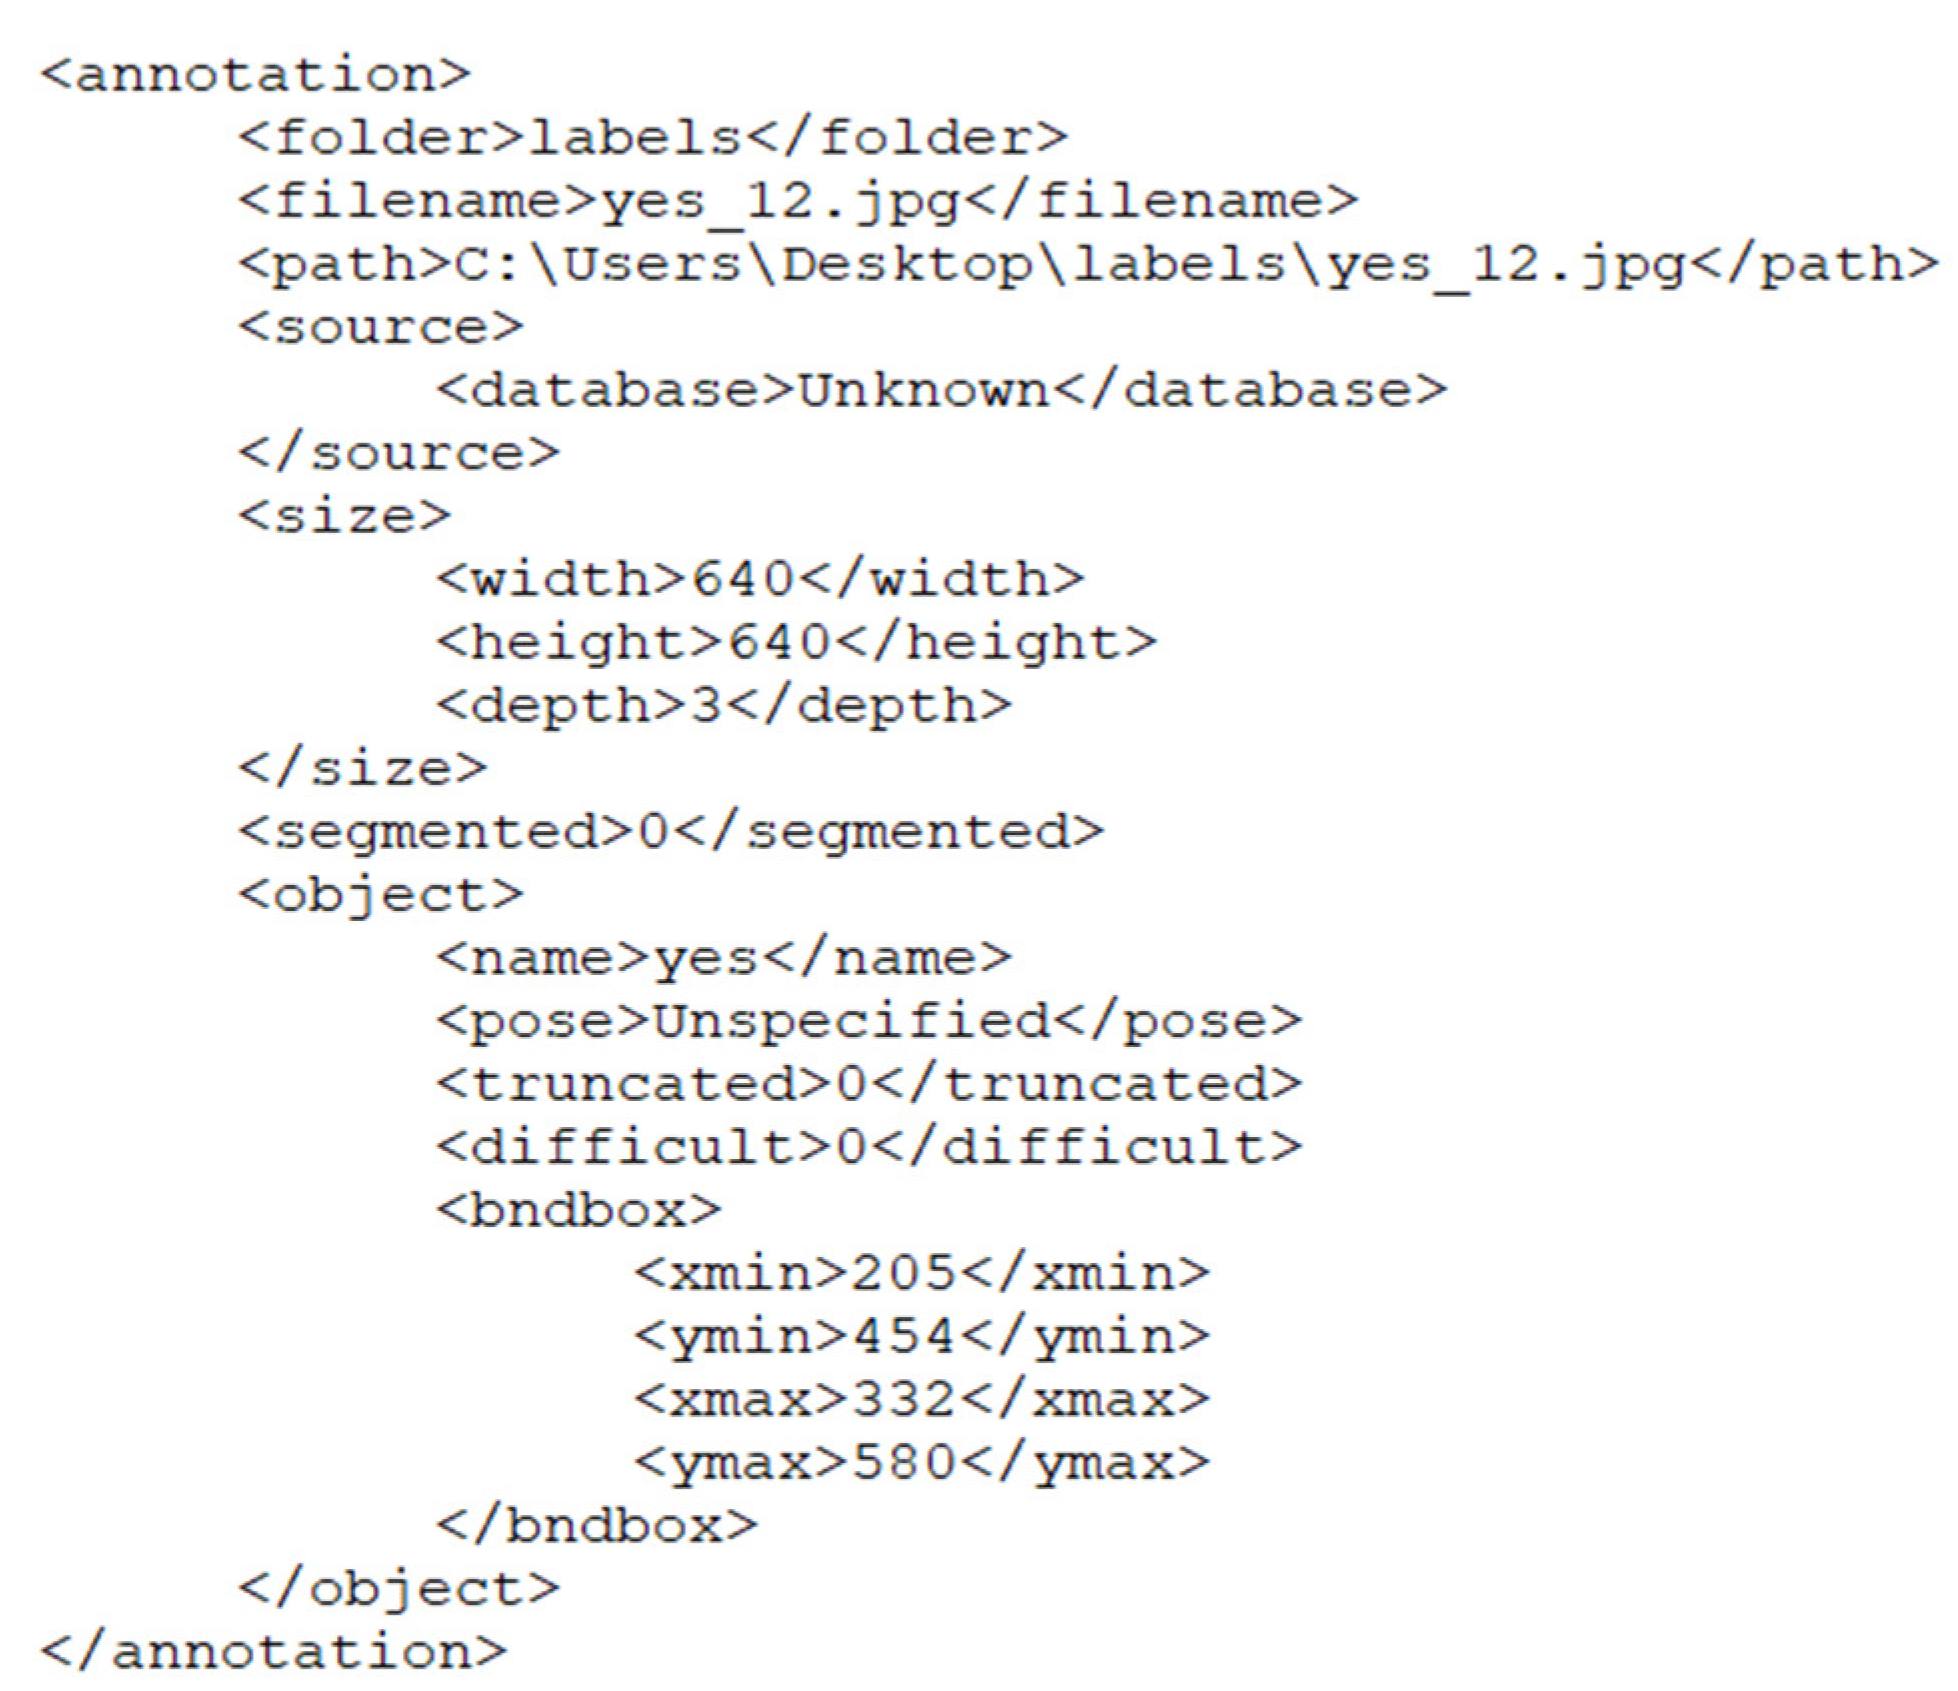
3.2.2. Sign Language Recognition Model
3.2.2.1. MobileNetV1 Pretrained Model
3.2.2.2. MobileNetV1 Architecture


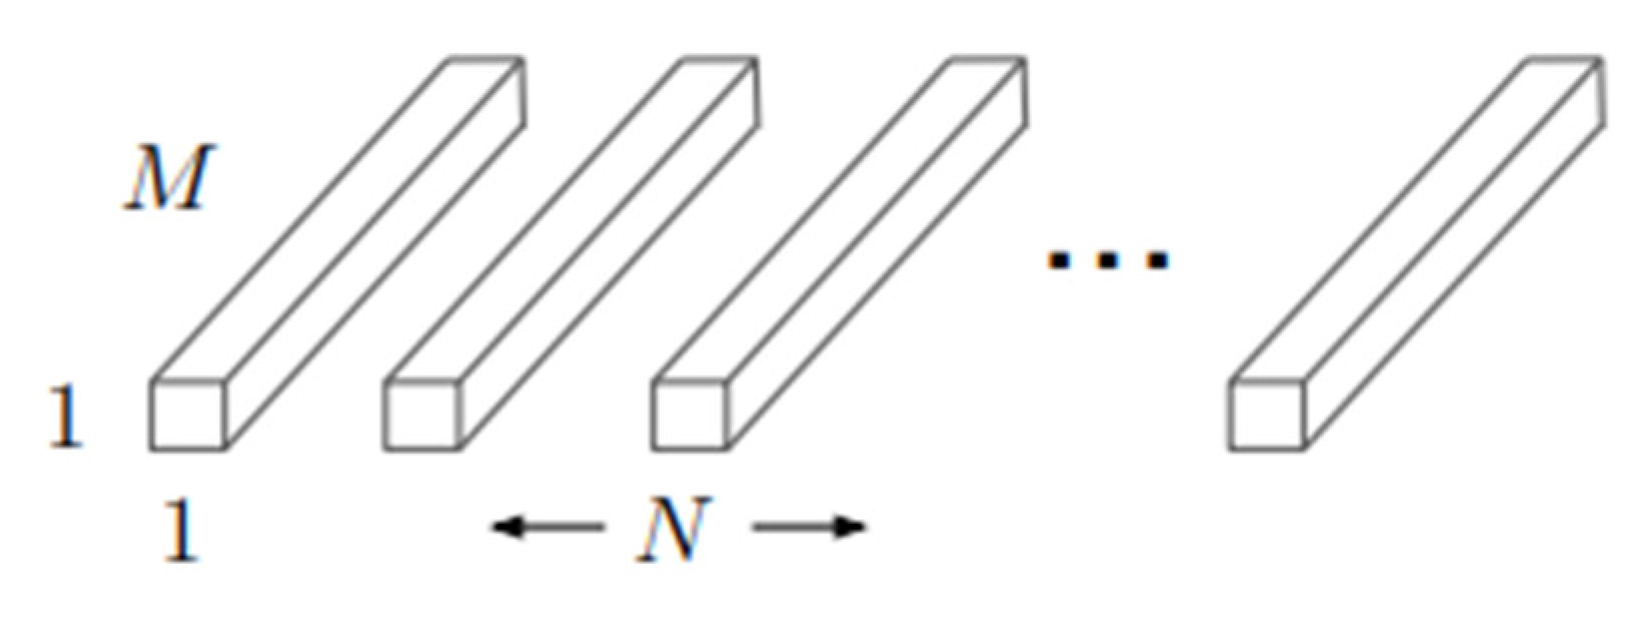
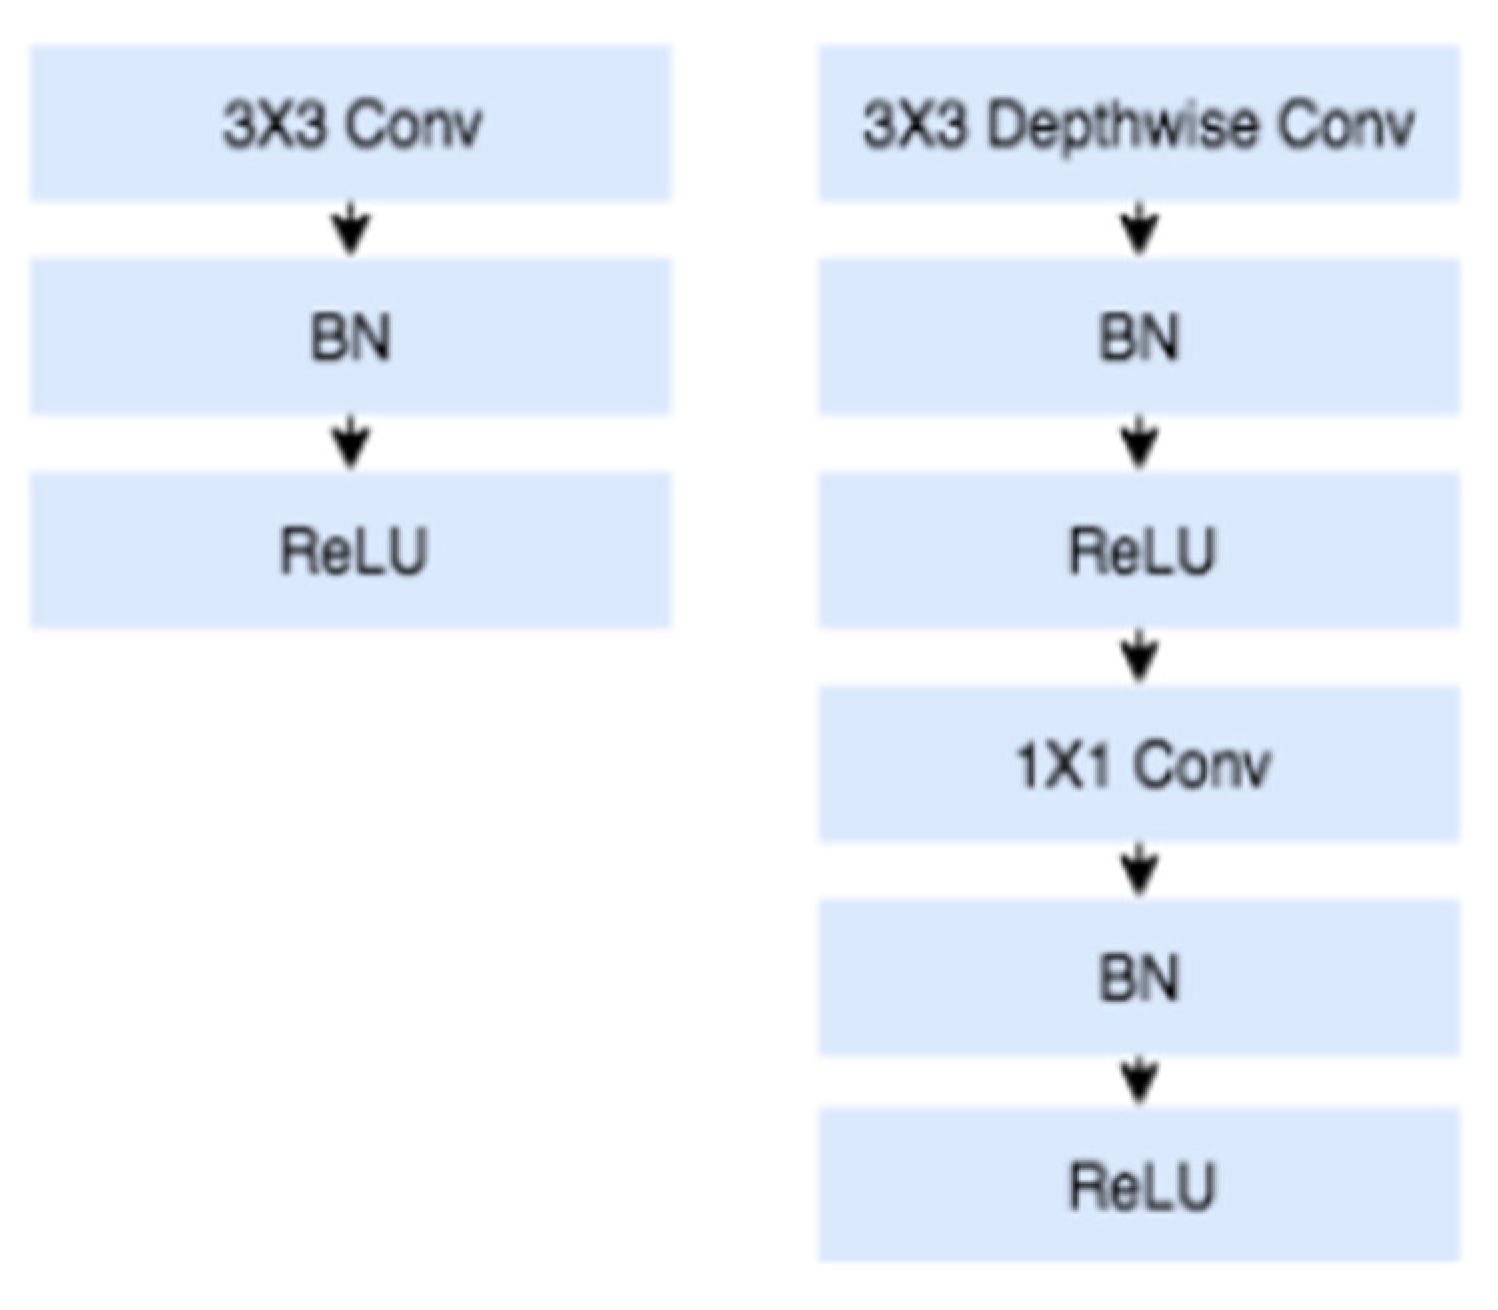
3.2.2.3. Tensorflow Object Detection API
3.2.2.4. Model Deployment Using Streamlit
3.3. Testing and Evaluation Metrics
| Test | Environment Background | Subject Background | Angle 1 | Angle 2 | Angle 3 |
|---|---|---|---|---|---|
| Test 1 |
Similar |
Similar |
Lean Left |
Straight |
Lean Right |
| Test 2 | Different | ||||
| Test 3 |
Different |
Similar | |||
| Test 4 | Different |
Results and Discussion
4.1. Testing
4.2. Results
|
Class |
Orientation |
Average Score |
||
| Left | Straight | Right | ||
| hello | 87.00 | 95.20 | 49.60 | 77.27 |
| no | 83.40 | 88.60 | 61.00 | 77.67 |
| yes | 72.20 | 93.80 | 54.00 | 73.33 |
| sorry | 45.80 | 92.40 | 71.20 | 69.80 |
| thanks | 52.40 | 96.00 | 73.60 | 74.00 |
| Total Average Score | 74.41 | |||
|
Class |
Orientation |
Average Score |
||
| Left | Straight | Right | ||
| hello | 66.40 | 83.00 | 67.20 | 72.20 |
| no | 0.00 | 73.00 | 13.00 | 28.67 |
| yes | 59.80 | 91.80 | 59.80 | 70.47 |
| sorry | 15.00 | 16.60 | 12.20 | 14.60 |
| thanks | 24.60 | 96.00 | 84.40 | 68.33 |
| Total Average Score | 50.85 | |||
|
Class |
Orientation |
Average Score |
||
| Left | Straight | Right | ||
| hello | 52.60 | 60.40 | 12.20 | 41.73 |
| no | 64.20 | 87.60 | 12.00 | 54.60 |
| yes | 0.00 | 92.00 | 18.40 | 36.80 |
| sorry | 64.80 | 86.80 | 44.80 | 65.47 |
| thanks | 0.00 | 93.00 | 27.40 | 40.13 |
| Total Average Score | 47.75 | |||
|
Class |
Orientation |
Average Score |
||
| Left | Straight | Right | ||
| hello | 78.40 | 76.00 | 0.00 | 51.47 |
| no | 26.60 | 50.60 | 0.00 | 25.73 |
| yes | 0.00 | 80.20 | 14.80 | 31.67 |
| sorry | 27.20 | 86.60 | 0.00 | 37.93 |
| thanks | 90.20 | 96.00 | 82.80 | 89.67 |
| Total Average Score | 47.29 | |||
4.3. Evaluation
Conclusion
5.1. Social Impact
5.2. Future Work
References
- Alnaim, N. (2020). Hand gesture recognition using deep learning neural networks, Brunel University London.
- Airehrour, D.; Gutierrez, J.; Ray, S.K. (2015, November). GradeTrust: A secure trust based routing protocol for MANETs. In 2015 International Telecommunication Networks and Applications Conference (ITNAC) (pp. 65-70). IEEE.
- Anwesa Chaudhuri, A.C.; Sanjib Ray, S.R. (2015). Antiproliferative activity of phytochemicals present in aerial parts aqueous extract of Ampelocissus latifolia (Roxb.) Planch. on apical meristem cells.
- Balakrishnan, S.; Ruskhan, B.; Zhen, L.W.; Huang, T.S.; Soong, W.T. Y.; Shah, I.A. Down2Park: Finding New Ways to Park. Journal of Survey in Fisheries Sciences 2023, 322–338. [Google Scholar]
- Fujiyoshi, H.; Hirakawa, T.; Yamashita, T. Deep learning-based image recognition for autonomous driving. In IATSS Research 2019, 43. [Google Scholar] [CrossRef]
- Goldsborough, P. (2016). A Tour of TensorFlow Proseminar Data Mining. Arxiv.
- Gouda, W.; Almurafeh, M.; Humayun, M.; Jhanjhi, N.Z. (2022, February). Detection of COVID-19 based on chest X-rays using deep learning. In Healthcare (Vol. 10, No. 2, p. 343). MDPI.
- Hussain, S.J.; Irfan, M.; Jhanjhi, N.Z.; Hussain, K.; Humayun, M. Performance Enhancement in Wireless Body Area Networks with Secure Communication. Wireless Personal Communications 2021, 116. [Google Scholar] [CrossRef]
- Humayun, M.; Ashfaq, F.; Jhanjhi, N.Z.; Alsadun, M.K. Traffic management: Multi-scale vehicle detection in varying weather conditions using yolov4 and spatial pyramid pooling network. Electronics 2022, 11, 2748. [Google Scholar] [CrossRef]
- Ioffe, S.; Szegedy, C. (2015). Batch normalization: Accelerating deep network training by reducing internal covariate shift. 32nd International Conference on Machine Learning, ICML 2015, 1.
- John, V.; Boyali, A.; Mita, S.; Imanishi, M.; Sanma, N. Deep Learning-Based Fast Hand Gesture Recognition Using Representative Frames. 2016 International Conference on Digital Image Computing: Techniques and Applications, DICTA 2016, 2016. [Google Scholar] [CrossRef]
- Jhanjhi, N.Z.; Brohi, S.N.; Malik, N.A.; Humayun, M. (2020, October). Proposing a hybrid rpl protocol for rank and wormhole attack mitigation using machine learning. In 2020 2nd International Conference on Computer and Information Sciences (ICCIS) (pp. 1-6). IEEE.
- Kellogg, B.; Talla, V.; Gollakota, S. (2014). Bringing gesture recognition to all devices. Proceedings of the 11th USENIX Symposium on Networked Systems Design and Implementation, NSDI 2014.
- Leksut, J.T.; Zhao, J.; Itti, L. Learning visual variation for object recognition. Image and Vision Computing 2020, 98. [Google Scholar] [CrossRef]
- Liu, W.; Anguelov, D.; Erhan, D.; Szegedy, C.; Reed, S.; Fu, C.Y.; Berg, A.C. SSD: Single shot multibox detector. Lecture Notes in Computer Science (Including Subseries Lecture Notes in Artificial Intelligence and Lecture Notes in Bioinformatics), 2016; 9905 LNCS. [Google Scholar] [CrossRef]
- Lim, M.; Abdullah, A.; Jhanjhi, N.Z.; Khan, M.K.; Supramaniam, M. Link prediction in time-evolving criminal network with deep reinforcement learning technique. IEEE Access 2019, 7, 184797–184807. [Google Scholar] [CrossRef]
- Mallick, C.; Bhoi, S.K.; Singh, T.; Swain, P.; Ruskhan, B.; Hussain, K.; Sahoo, K.S. Transportation Problem Solver for Drug Delivery in Pharmaceutical Companies using Steppingstone Method. International Journal of Intelligent Systems and Applications in Engineering 2023, 11. [Google Scholar]
- Mitra, S.; Acharya, T. Gesture recognition: A survey. IEEE Transactions on Systems, Man and Cybernetics Part C: Applications and Reviews, 2007; 37. [Google Scholar] [CrossRef]
- Mujahid, A.; Awan, M.J.; Yasin, A.; Mohammed, M.A.; Damaševičius, R.; Maskeliūnas, R.; Abdulkareem, K.H. Real-time hand gesture recognition based on deep learning YOLOv3 model. Applied Sciences (Switzerland) 2021, 11. [Google Scholar] [CrossRef]
- Neethu, P.S.; Suguna, R.; Sathish, D. An efficient method for human hand gesture detection and recognition using deep learning convolutional neural networks. Soft Computing 2020, 24. [Google Scholar] [CrossRef]
- Oudah, M.; Al-Naji, A.; Chahl, J. Computer Vision for Elderly Care Based on Deep Learning CNN and SVM. IOP Conference Series: Materials Science and Engineering, 2021; 1105. [Google Scholar] [CrossRef]
- Riskhan, B.; Muhammad, R. Docker in Online Education: Have the Near-native Performance of CPU, Memory and Network? International Journal of Computer Theory and Engineering 2017, 9, 290–293. [Google Scholar] [CrossRef]
- Riskhan, B.; Safuan, H.A. J.; Hussain, K.; Elnour, A.A. H.; Abdelmaboud, A.; Khan, F.; Kundi, M. An Adaptive Distributed Denial of Service Attack Prevention Technique in a Distributed Environment. Sensors 2023, 23. [Google Scholar] [CrossRef] [PubMed]
- Ray, S.K.; Sinha, R.; Ray, S.K. (2015, June). A smartphone-based post-disaster management mechanism using WiFi tethering. In 2015 IEEE 10th conference on industrial electronics and applications (ICIEA) (pp. 966-971). IEEE.
- Saha, S. A Comprehensive Guide to Convolutional Neural Networks — the ELI5 way. Towards Data Science 2015.
- Singhal, V.; Jain, S.S.; Anand, D.; Singh, A.; Verma, S.; Rodrigues, J.J. . & Iwendi, C. Artificial intelligence enabled road vehicle-train collision risk assessment framework for unmanned railway level crossings. IEEE Access 2020, 8, 113790–113806. [Google Scholar]
- Taj, I.; Zaman, N. Towards industrial revolution 5.0 and explainable artificial intelligence: Challenges and opportunities. International Journal of Computing and Digital Systems 2022, 12, 295–320. [Google Scholar] [CrossRef]
- Yamashita, R.; Nishio, M.; Do, R.K. G.; Togashi, K. (2018). Convolutional neural networks: an overview and application in radiology. In Insights into Imaging (Vol. 9, Issue 4). [CrossRef]
- Zeng, Z.; Gong, Q.; Zhang, J. (2019). CNN model design of gesture recognition based on tensorflow framework. Proceedings of 2019 IEEE 3rd Information Technology, Networking, Electronic and Automation Control Conference, ITNEC 2019. [CrossRef]
Disclaimer/Publisher’s Note: The statements, opinions and data contained in all publications are solely those of the individual author(s) and contributor(s) and not of MDPI and/or the editor(s). MDPI and/or the editor(s) disclaim responsibility for any injury to people or property resulting from any ideas, methods, instructions or products referred to in the content. |
© 2024 by the authors. Licensee MDPI, Basel, Switzerland. This article is an open access article distributed under the terms and conditions of the Creative Commons Attribution (CC BY) license (https://creativecommons.org/licenses/by/4.0/).


