1. Introduction
Oral cancer, encompassing areas such as the lips, gums, tongue, and palate, is one of the most frequently occurring malignancies, ranking 6th in terms of frequency around the globe [
1,
2,
3]. More than 90% of oral cancer cases are histologically represented by oral squamous cell carcinoma (OSCC), which originates from the stratified squamous cell epithelial lining the oral cavity, where it can develop from clinically normal mucosa or premalignant lesions [
4,
5]. OSCC is considered a highly prevalent and lethal malignancy due to its highly aggressive behavior, marked by invasive growth and a bold propensity for metastasis. Only in 2023, 377.713 new OSCC cases, as well as 177.757 deaths were globally reported [
4,
5,
6]. Despite advancements in treatment, the prognosis for OSCC remains disheartening, with a five-year survival rate of about 40% [
2,
6,
7,
8]. At the same time, post to primary treatment one in two patients exhibits recurrence, metastasis or second primary malignant tumor development, mainly within the first two years [
1,
2,
3,
4].
One of the major challenges contributing to the high mortality rates associated with OSCC is late diagnosis. In fact, around 50% of patients are diagnosed in advanced stages (III or IV), when lymphatic infiltration has already occurred [
1,
7,
8]. This is mainly because the early stages of oral carcinogenesis are usually asymptomatic, hence, the vast majority of patients delay in seeking dental or medical attention until persistent symptoms occur, which histologically translates in an already formed, aggressive neoplasm [
7]. Moreover, this can also occur due to a misdiagnosis or negligence of a possibly precancerous oral condition such as leukoplakia or erythroplakia, which are common predecessors of OSCC and are occasionally found adjacent to malignant lesions [
2,
5,
7]. Current diagnostic approaches, which involve a clinical oral examination, followed by a biopsy of the suspicious tissue, as well as MRI and CT scans, can be excessively time-consuming, also adding to the already existing problem of a ticking clock [
2,
3,
4]. The importance of developing reliable diagnostic techniques to detect presymptomatic OSCC in its early stages is underlined, considering that timely diagnosis in stage I or II can more than double the survival rates of patients up to 80% [
1,
7,
9].
Minimally- or non-invasive methods, such as “liquid biopsy,” which involve screening of specific molecules in biofluids, as diagnostic markers, have demonstrated substantial promise for clinical application in the field of precision oncology, regarding cancer detection in manageable early stages [
10,
11,
12,
13]. OSCC stands out as an ideal neoplasm for liquid biopsy, primarily due to its accessibility and its direct interaction with the oral environment, ensuring that the molecules of interest, such as microRNAs, exosomes, cell-free tumor DNA or circulating tumor cells, are shed directly from the tumor site into the saliva, making it a particularly valuable sample for oral cancer detection, even in the earliest of stages. However, reliable detection primarily requires the identification of the most specific and representative disease-reflective biomarkers, a task that remains challenging [
9,
11,
14].
MicroRNAs (miRNAs) have emerged as key players in liquid biopsy, as they offer several advantages as biomarkers, including stability in body-fluids, as well as characteristic expressional dysregulation patterns (significant up- or down-regulation) in cancerous compared to normal tissues [
8,
9]. MiRNAs are small RNA molecules, 18-25 nucleotides long, that regulate gene expression by complimentarily binding to specific sites within the untranslated regions (UTRs) of the messenger RNAs (mRNAs) of their target genes, leading to mRNA degradation or inhibition of protein translation, thereby reducing the levels of the encoded protein products [
3,
8,
12,
15,
16].
In recent years, numerous miRNAs have been extensively studied for their expression patterns in OSCC, reflecting their potential as diagnostic targets [
6,
8,
9,
17,
18,
19,
20,
21,
22,
23,
24,
25,
26,
27,
28]. However, this surge in research has led to a plethora of data with over 200 miRNAs reported to be either upregulated or downregulated in OSCC derived samples (tissue, saliva and blood), while the majority exhibits similar dysregulation patterns in other malignancies as well. Therefore, significant challenges occur as to the interpretation of experimental data, but mainly the identification of the few truly disease-specific molecules that can be reliably utilized as biomarkers for OSCC diagnosis, especially in its early asymptomatic stages [
8].
Recently, in response to the above challenge, our group developed a combinatory bioinformatic methodology, which managed to identify the 5 most OSCC-specific miRNAs (miR-34a-5p, miR-155-5p, miR-124-3p, miR-1-3p, and miR-16-5p), out of all experimentally validated miRNAs that exhibit dysregulation in OSCC and are proposed as potential diagnostic markers [
8]. This became possible through exploiting the intricate relations between genetics and epigenetics and the expressional reverse interplay between miRNA and target-gene expression levels. This in silico methodology was designed to identify the most disease-specific miRNA molecules involved in the development of OSCC, based on: a) their ability to simultaneously target and possibly regulate of at least 60% of the 15 most important OSCC-related oncogenes and more than 60% of the 5 mainly implicated tumor suppressor genes, that exhibit characteristic up-regulation and down-regulation in OSCC tumors, respectively [
8,
18,
29], and b) the nature of their reported dysregulation (up- or down-regulation) in OSCC-derived specimens, to functionally document their putative regulatory role in OSCC development, through the inverse relations between miRNA levels and the expression of their target-genes [
8].
Building upon our prior research on OSCC, we utilized experimental epigenomic data on miRNA expression in humans and genomic expression data constituting the genetic signature of each early OSCC stage, spanning from hyperplasia and precancerous dysplasia to the early invasion of malignant OSCC cells. We based our research on the findings of the award-winning experimental hamster model of sequential oral oncogenesis, previously developed by our group [
30,
31]. Such description of sequential oral oncogenesis is not yet available in humans, and our hamster model is considered to be quite representative of the respective human pathology. This animal model encompasses all of the distinctive stages of oral carcinogenesis, ranging from the earliest stage of precancerous hyperkeratosis to moderately developed OSCC, illustrating the signature expressional patterns of critical oncogenes and tumor suppressor genes at each stage [
30,
31]. The aim of this study lies in identifying the stage-specific miRNAs that govern the consecutive initial phases of OSCC tumorigenesis. More specifically, the progression from hyperplasia to precancerous dysplasia, and ultimately the malignant transformation from dysplasia to early invasion of OSCC cells, which also incorporates the “stage 0” of “
in situ carcinoma”, the timely detection of which could drastically impact prognostic and therapeutic outcomes for patients with OSCC.
4. Discussion
Despite some advancements in diagnosis and treatment, the outlook for OSCC remains bleak, as indicated by its approximately 40% five-year survival rate [
2,
6,
7,
8], while recurrence or metastasis is extremely likely to develop within the first two years post-treatment [
1,
2,
3,
4]. Late diagnosis is one of the main obstacles that contributes to the high mortality rates associated with OSCC, with one in two patients diagnosed in an advanced stage [
1,
7,
8]. MiRNAs, a class of crucial epigenetic regulators of gene expression, have emerged as key players in precision oncology, serving as ideal biomarkers for liquid biopsy, since they exhibit strong diagnostic potential by reflecting a tissue’s malignant state through the quantification of their expressional dysregulation [
3,
8,
9,
12,
16]. In recent years, the expression of numerous miRNAs has been studied in OSCC, resulting in a vast number of experimental data with at least 256 molecules reported to be either upregulated or downregulated in OSCC derived-samples (tissue, saliva or blood) [6,8,9,17-28), while the majority exhibits similar dysregulation in other neoplasms as well. Consequently, there is a state of disarray regarding the interpretation of findings and the identification of the most representative molecules for the disease at large, but particularly for its early asymptomatic stages [
8].
In 2023, our group established a combinatory bioinformatic methodology that managed to identify the 5 most specific miRNAs for OSCC (miR-34a-5p, miR-155-5p, miR-124-3p, miR-1-3p, and miR-16-5p) out of all miRNAs that exhibit dysregulation in the malignancy, thus serving as the most suitable of all proposed miRNA-biomarkers for minimally invasive biopsy. This became possible by exploiting the intricate relationship between genetics and epigenetics, as well as the expressional reverse interplay that exists between the levels of miRNA molecules and those of their target-genes [
8]. However, the challenge of revealing highly specific biomarkers that can reflect the carcinogenic potential of a precancerous lesion or even a seemingly healthy oral mucosa which already hosts dysplastic or invasive malignant OSCC cells, remained unsolved.
Continuing and advancing this previous work, we decided to dive deeper into the epigenetic mechanisms of OSCC, by identifying the most important miRNA molecules that govern the distinct initial stages of oral tumorigenesis that precede the development of a clinically detectible malignant lesion. Those include the precancerous stages of oral hyperplasia and dysplasia and the malignant stage of early invasion, which are typically asymptomatic, yet critical for timely therapeutic intervention that could hold the key to improving the prognosis of patients, by almost doubling their odds for survival. To identify the miRNAs in question, we employed our previously developed methodology (for the identification of disease-specific molecules) and tailored it in a stage-specific setup, by inputting genomic data, highly characteristic of each histological stage. These data were derived from our hamster model of sequential oral oncogenesis [
30,
31]. This animal system is quite representative of the respective human pathology and encompasses the expressional variations of critical cell-cycle regulatory genes through the course of oral tumorigenesis, thus portraying the genetic expression signature of each stage spanning from clinically normal oral mucosa to moderately-differentiated OSCC. We focused on the precancerous stages of hyperplasia and dysplasia, as well the initial malignant stage of early invasion, in an attempt to capture malignant transformation.
Following the updating of our developed databases on experimentally verified dysregulated miRNAs in OSCC, we developed two gene-panels for each stage of OSCC oncogenesis (hyperplasia, dysplasia, early invasion), according to their expression (up- or down-regulation) during each stage, according to this established animal model. A primary bioinformatic analysis of miRNA/target interactions was performed on each panel at each stage to identify all miRNAs that are expected to target and thus potentially regulate the expression of each included gene. This step was followed by a filtering process, during which, miRNAs that simultaneously target over 75% of each panel’s genes were extracted. Finally, from those sets of results, the miRNA molecules that exhibit the opposite expressional dysregulation in OSCC-derived tissue and/or saliva specimens, with respect to one of their target genes, were yielded as the most stage-specific for each of the histological stages. In this study we particularly confined our filtration criteria to miRNA molecules that exhibit dysregulation in tissue and saliva samples, to enhance the specificity and reliability of our results, by increasing the possibility that the miRNAs in question are from the tumor itself or are directly secreted into the surrounding saliva from the malignant lesion.
According to our findings, the most stage-specific dysregulated miRNAs for oral hyperplasia are the significantly downregulated molecules: miR-34a-5p, miR-124-3p (tissue and saliva), and miR-125b-5p (tissue). As to the next stage of oral dysplasia, miR-34a-5p, miR-124-3p, miR-125b-5p that exhibit diminished expression in OSCC-derived tissue and saliva samples, and finally miR-1-3p, which demonstrates significant downregulation in OSCC tumor tissue, are yielded as the most stage-representative. Lastly, for the initial cancerous phase of early invasion, the downregulated miR-34a-5p, miR-124-3p (tissue and saliva), miR-125b-5p, miR-1-3p (tissue) and miR-147a (saliva), are the most stage-specific and indicative of malignant transformation.
Conclusively, the stages of oral hyperplasia, dysplasia and OSCC early invasion are characterized by the low expression of three common microRNAs (miR-34a-5p, miR124-3p, and miR-125b-5p). The dysplasia stage is distinguished from the preceding hyperplasia by the presence of the additional underexpressed miR-1-3p, which also serves as a linkage between the precancerous stage of dysplasia and the cancerous early invasion of OSCC cells. Last, the initial malignant stage of early invasion is entirely distinguished from the preceding two precancerous stages, by means of three additional molecules: miR-147a, the expression of which is considerably diminished, as well as miR-155-5p and miR-423-3p, whose expression is substantially increased in OSCC, but also miR-34a-5p, which has been found to be overexpressed in a small number of studies, unlike the majority, which reports it as significantly downregulated in this particular malignancy (
Table 5).
The key role of miR-34a-5p in OSCC remained a big mystery in our previous work as well, as it met the criteria for yielding the most disease-specific molecule in the upregulated oncogene panel with a target score of 100% (15/15 oncogenes), as well as within the downregulated tumor suppressor gene panel by targeting 5/5 genes, alongside miR-155-5p. Therefore, its stage-specific role that was revealed in this current study might provide insight into its multifaceted role in malignancy, granted that it is downregulated in the precancerous stages of hyperplasia and dysplasia, while the spike in its expression is detected during the initial malignant stage of early invasion. Hence, the fact that it is reported as downregulated in the majority of studies, but upregulated in a small subgroup, might rely on the presence of all histological stages in the OSCC tissue specimens from which RNA was extracted for its quantification. Thus, it is possible that the studies reporting its upregulation in OSCC included smaller-sized, recently developed tumors with a significant presence of the “early invasion” stage in their histological microenvironment.
Ultimately, considering the outcomes derived from our prior research [
8] on identifying the 5 most disease-specific miRNAs (miR-155-5p, miR-34a-5p, miR-124-3p, miR-1-3p and miR-16-5p) for overall OSCC (among 239 dysregulated molecules), it is evident from the current analysis that most of these disease-specific molecules appear at different stages of OSCC oncogenesis. Specifically, miR-34a-5p and miR-124-3p (downregulated) are found to coexist in all three studied stages. Disease-specific miR-1-3p is introduced during the stages of dysplasia and early invasion and finally, the most important upregulated disease-specific molecule, miR-155-5p, stands among the four dysregulated miRNAs that distinguish the cancerous from the precancerous state of oral mucosa (
Table 5).
The sole constraint to the conduction of a study that incorporates human and animal molecular data, is the possible slight distinction between an animal model and the molecular makeup of the respective human system. In order to eliminate this limitation, we aimed to proactively address it during the designing phase of the study protocol, by utilizing this particular model of oral oncogenesis over any alternative animal system. The Syrian golden hamster (
Mesocricetus auratus) cheek-pouch oral carcinogenesis model is widely recognized as the most well-established system, in which the events, which lead to the development of malignant and premalignant oral pathologies, are of great resemblance to those governing the respective human pathologies. Furthermore, the genes that comprise each stage’s dysregulated expressional signature have already been confirmed to play a key part in the development and progression of human OSCC as well [
8,
18,
29,
32]. However, a definitive experimental staging system of their precise expressional disequilibrium, at each stage of human oral oncogenesis, is currently unavailable. Finally, all the experimental miRNA expression data incorporated for the analyses of this study are derived solely from research conducted on OSCC tissue and saliva specimens of human origin, while their reported dysregulation has already been strongly associated with OSCC pathogenesis.
Overall, this study has yielded valuable insights into the role of miRNAs in the early stages of oral oncogenesis, through mapping the genetic/epigenetic interactions that govern each stage, by leveraging on the complex interplay between miRNAs and their target genes. Armed with a comprehensive bioinformatic methodology that integrates experimental epigenomic and genomic data, we successfully identified these three sets of molecules as the most specific for the earliest stages of OSCC development, among a multitude of candidates. Amongst our findings, the miRNAs marking the transition from precancerous dysplasia to early invasion of malignant OSCC cells, are considered of the highest importance, since their dysregulation governs malignant transformation, which includes the “stage 0” of the neoplasm. The revealing of both their disease-specific and stage-specific roles, combined with their stability and measurable expression in accessible biological specimens, elucidates their immense potential as diagnostic biomarkers that could potentially indicate the histological stage of oral mucosa in real-time. Their prospective clinical application expands beyond diagnosing a visible, oral lesion of concern, but might also hold the key to presymptomatic detection of OSCC, during its earliest stages as a part of routine oral screening (
Figure 22).
The presented targeted molecular profiling approach boldly underlines the potential of miRNAs as valuable biomarkers. In addition, the employed methodology might also serve as a crucial bridge between the global imperative to advance liquid biopsy and its actual implementation, by circumventing the noise generated by the multitude of dysregulated molecules, thus elucidating the select ones holding the highest diagnostic value.
Figure 1.
The hamster model of sequential οral oncogenesis (Vairaktaris et al. 2008, Yapijakis et al. 2019) has been developed in order to genetically map the multistep process of OSCC tumorigenesis in Syrian hamsters, a model organism, ideal for the study of human oral pathologies (see text in Methodology for details). The expression levels of the EGFR, ERBB2, ERBB3, FGFR2, FGFR3, MYC, NRAS, ETS1, HRAS, C-FOS, JUN and MKI67 oncogenes, the apoptosis markers BAX and BCL2, and the tumor suppressor genes TP53 and CDKN2A (P16), were assessed in each stage in order to depict its respective dysregulated genetic signature. The pertained sequential stages of oral oncogenesis included: normal mucosa, hyperkeratosis, hyperplasia, dysplasia, early invasion, well-differentiated, and moderately differentiated OSCC. For this study, we selected oral hyperplasia and dysplasia as the primary precancerous stages and ultimately the following malignant stage of early invasion, in order to capture the juncture where malignant transformation takes place, which also encompasses the “stage 0” of carcinoma in situ. This figure illustrates the signal-transduction pathways governing oral oncogenesis, while the expressional dysregulation of the examined variables is displayed by arrows pointing upwards or downwards in each histological stage (hyperplasia, dysplasia, and early invasion). The red upward arrows indicate a significant increase in expression during those stages, as compared to normal oral mucosa (for the precancerous hyperplasia and dysplasia) or compared to the mean expression of these factors in normal mucosa and precancerous stages (for the malignant stage of early invasion). The downward blue arrows respectively illustrate the significant downregulation of the studied variables in the depicted stages.
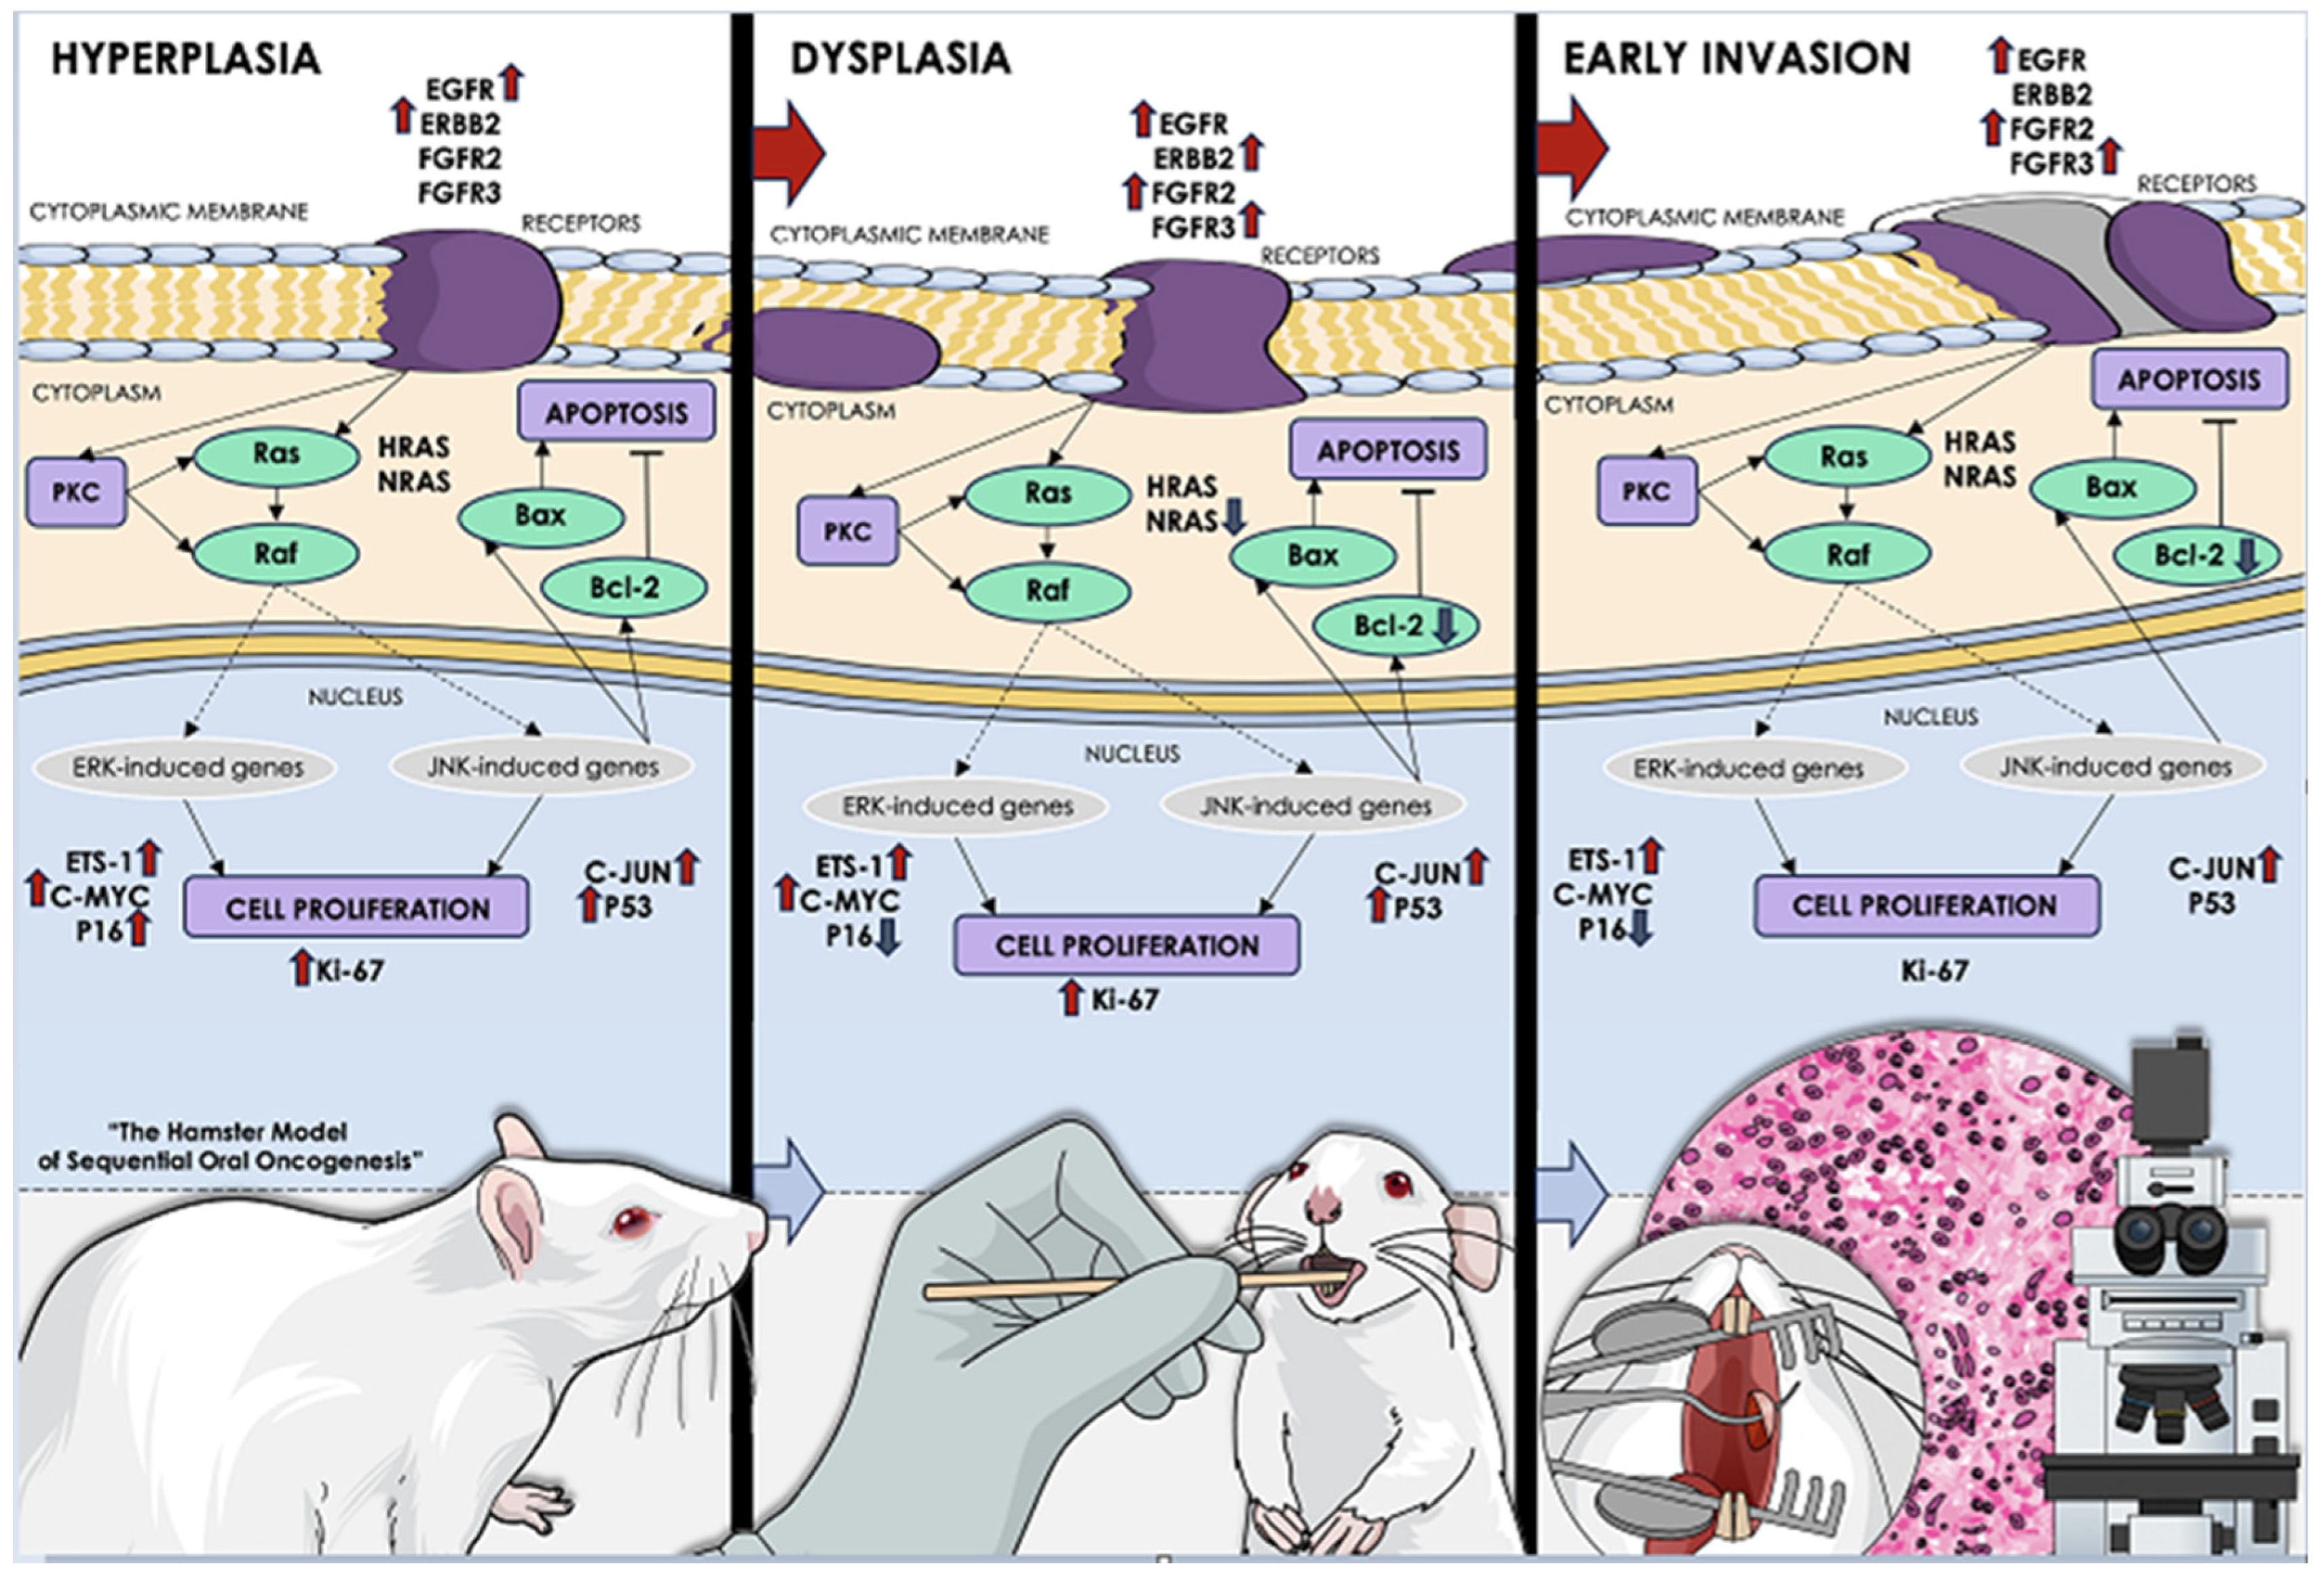
Figure 2.
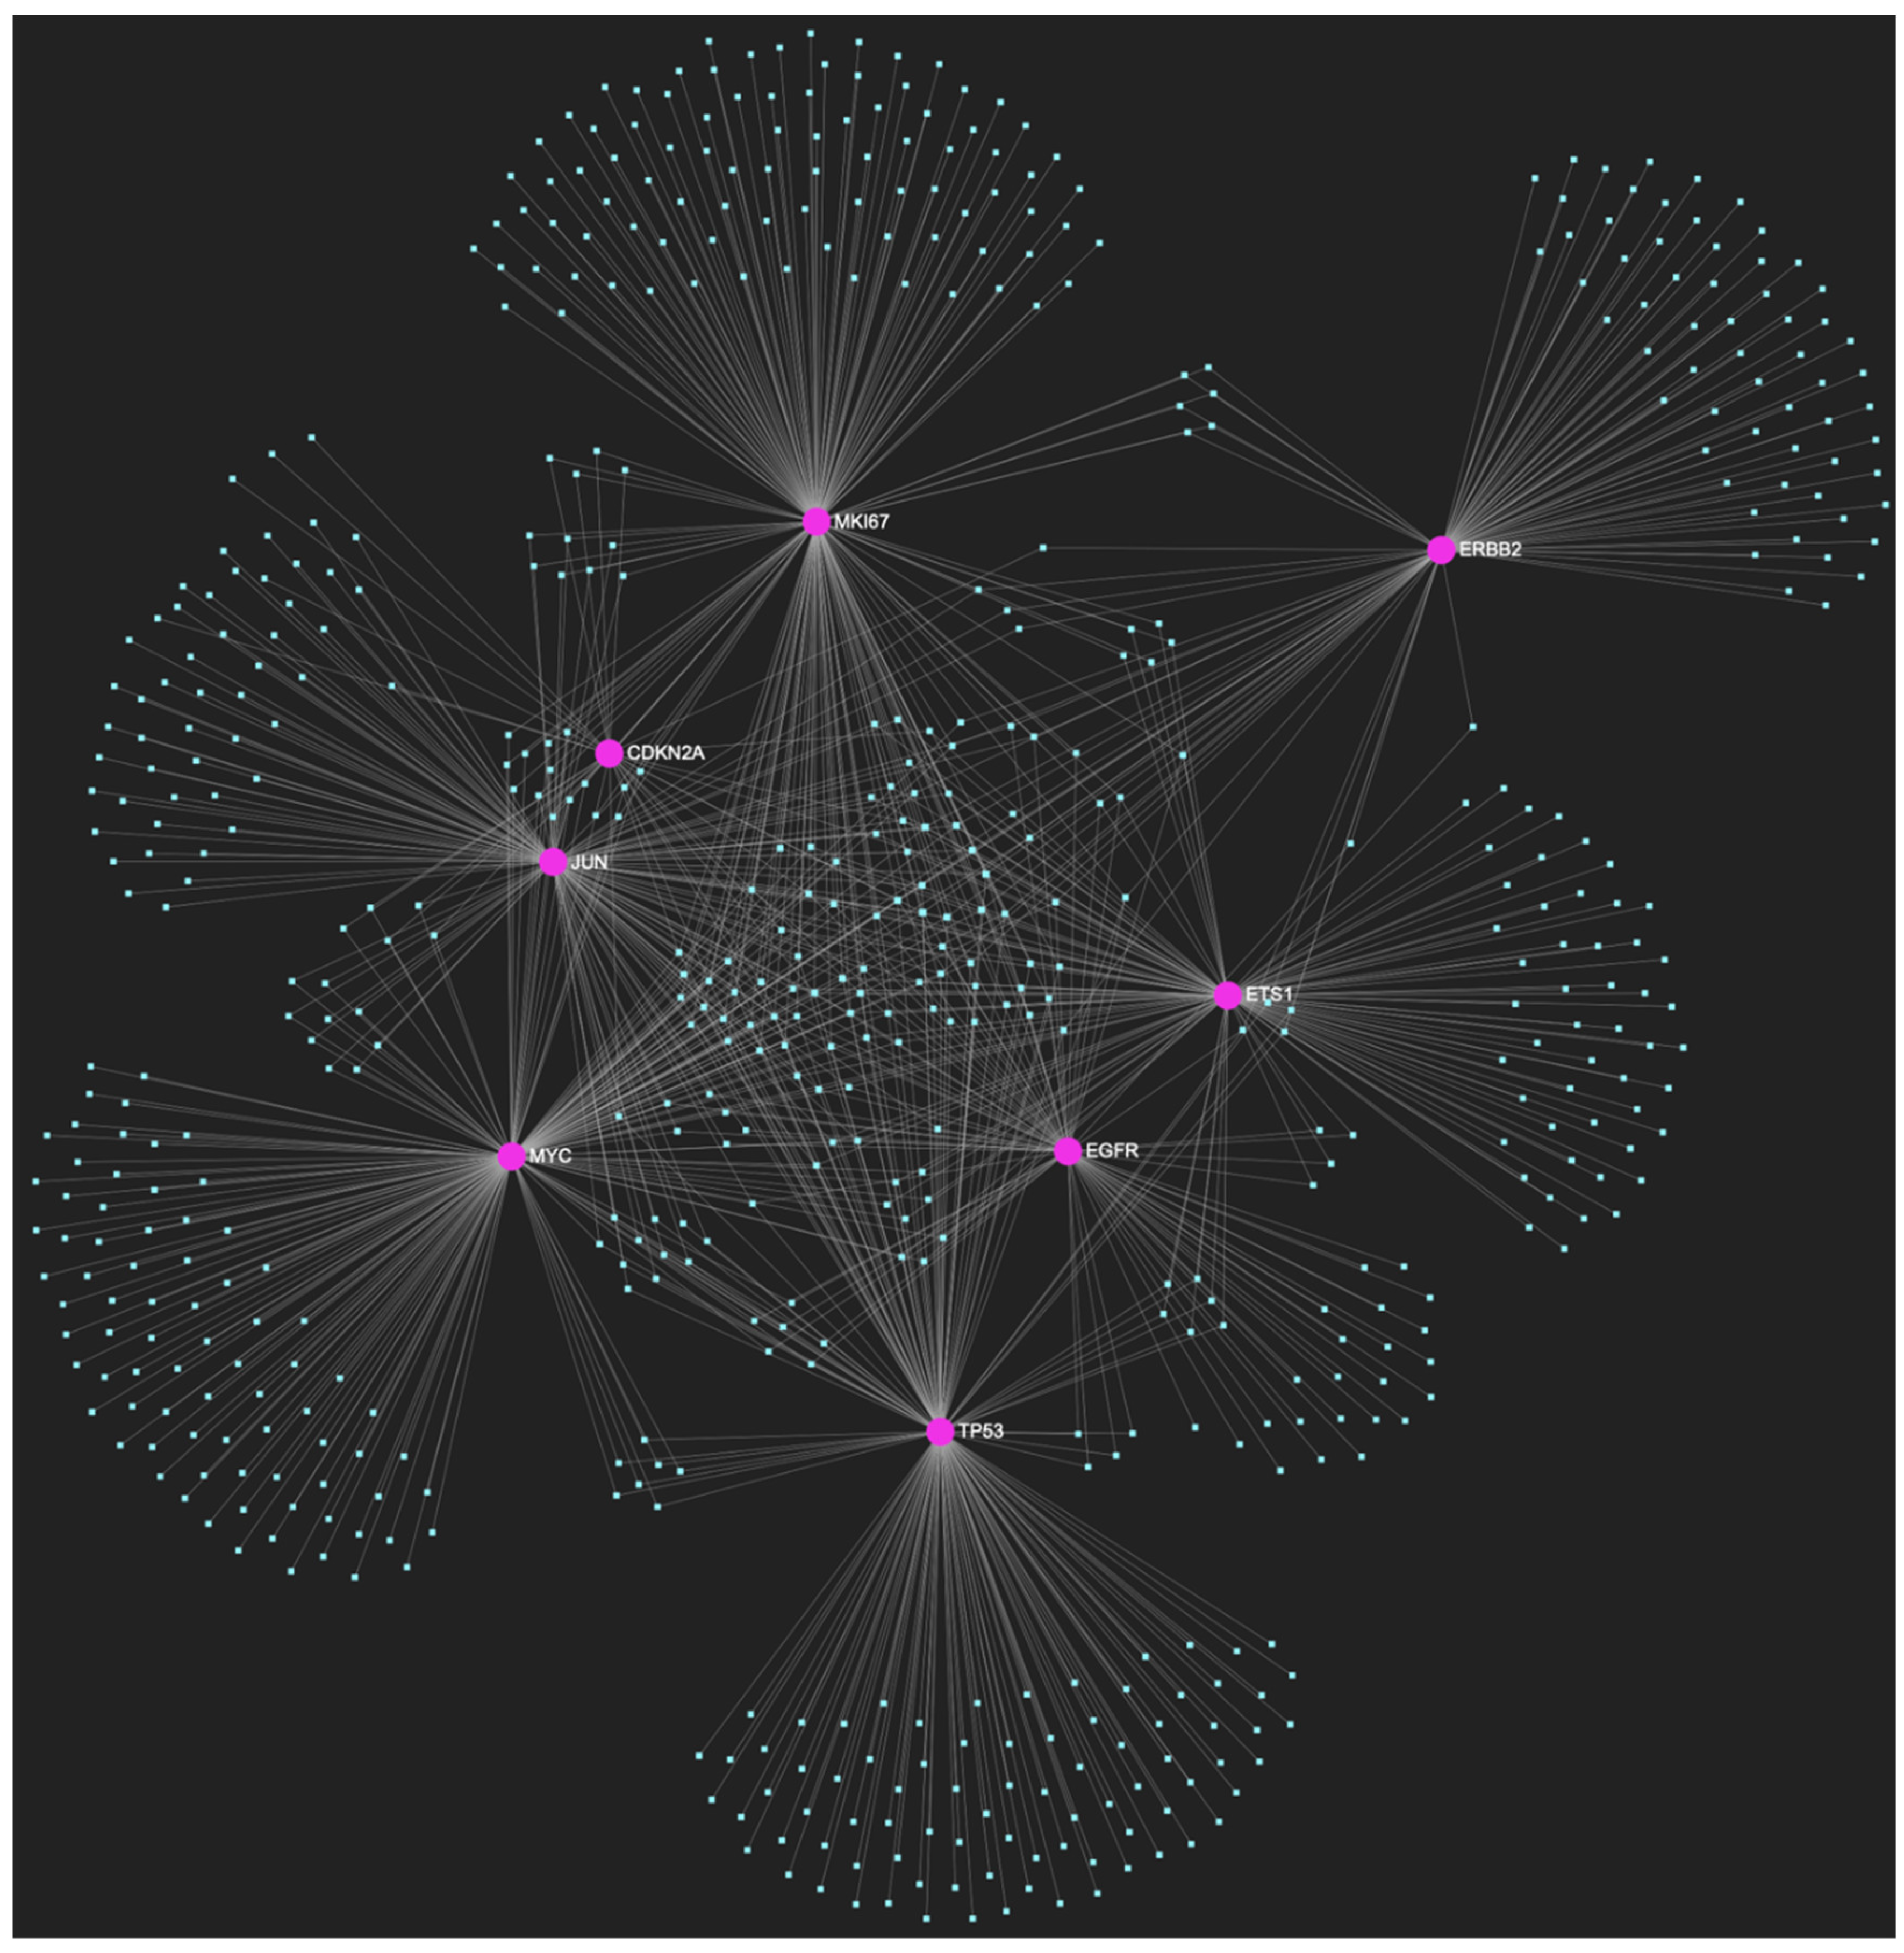
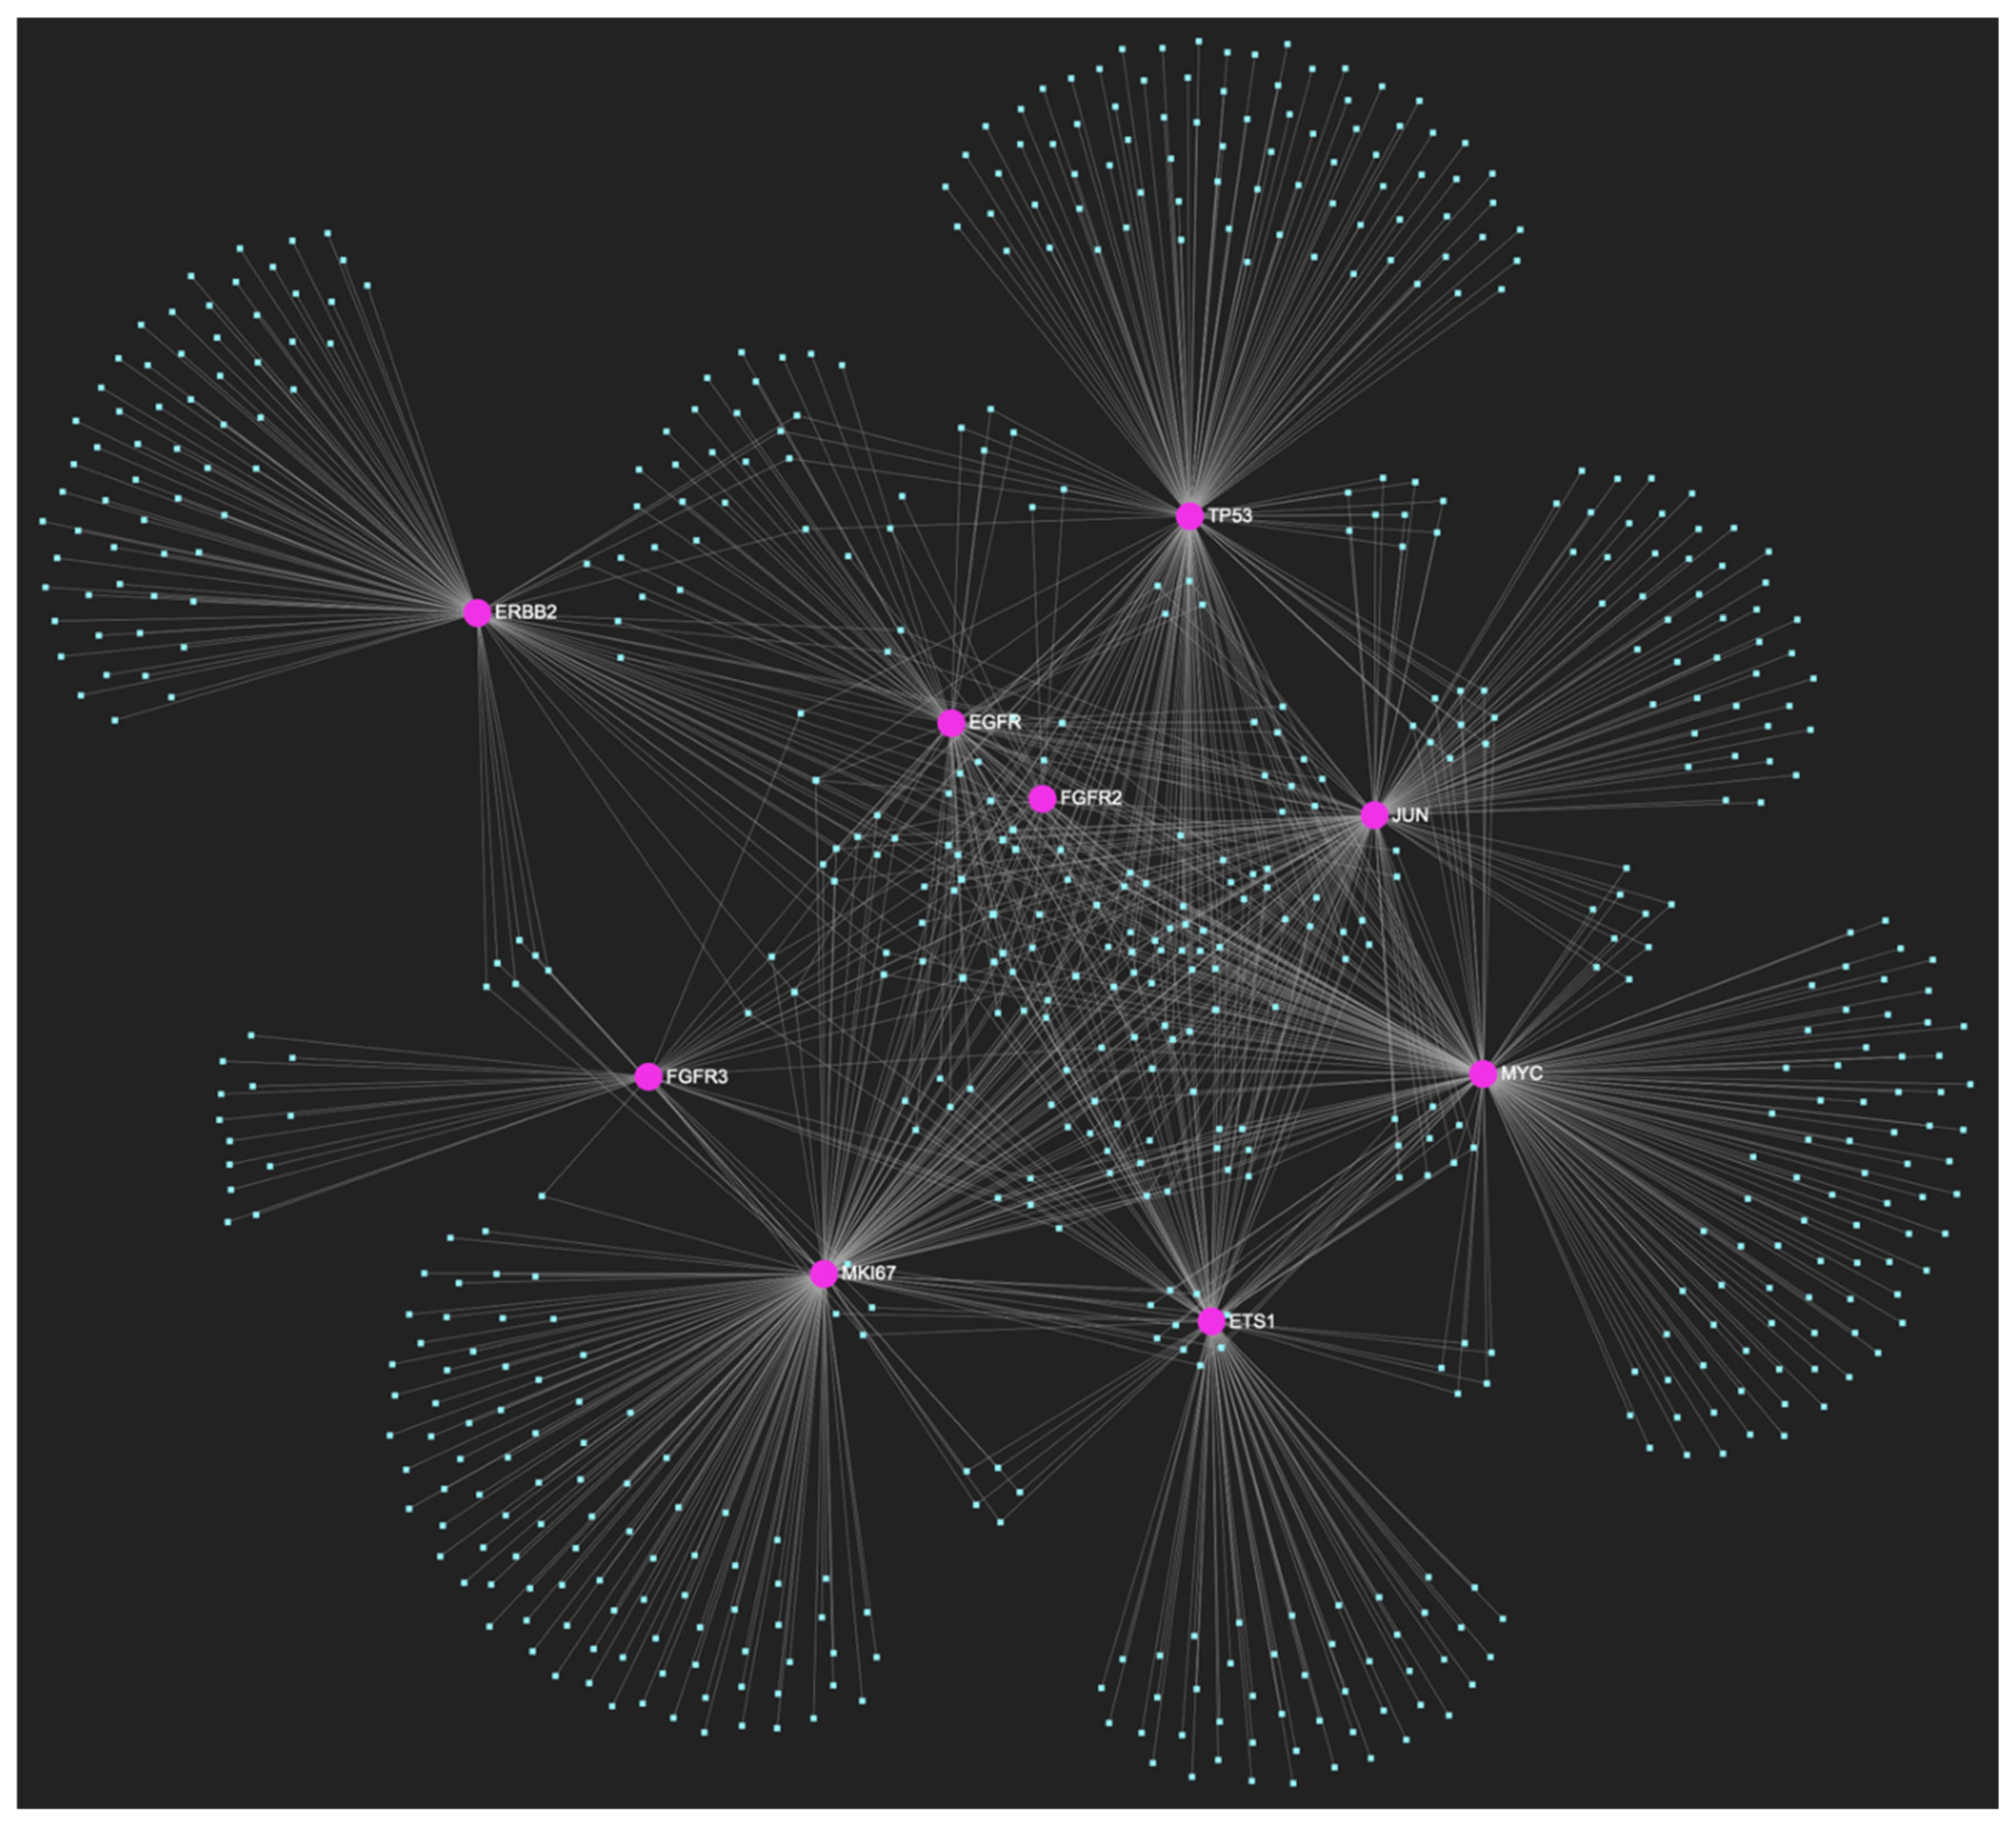
The miRNA/target interaction network, depicts the 647 miRNA molecules that are predicted to target and possibly regulate at least one of the 8 genes that comprise the upregulated gene panel developed for the stage of oral hyperplasia, according to the genomic data acquired by the hamster model of sequential oral oncogenesis. The encompassed characteristically upregulated genes for this particular stage include the EGFR, ERBB2, JUN, ETS1, MYC and MKI67 (Ki-67) oncogenes, as well as the CDKN2A (p16) and TP53 (p53) tumor suppressor genes. The pink graphic elements illustrate the genes that comprise the panel, while the light blue dots across the illustration represent the miRNA molecules that are expected to target at least one of them, and possibly regulate its post-transcriptional expression.
Figure 3.
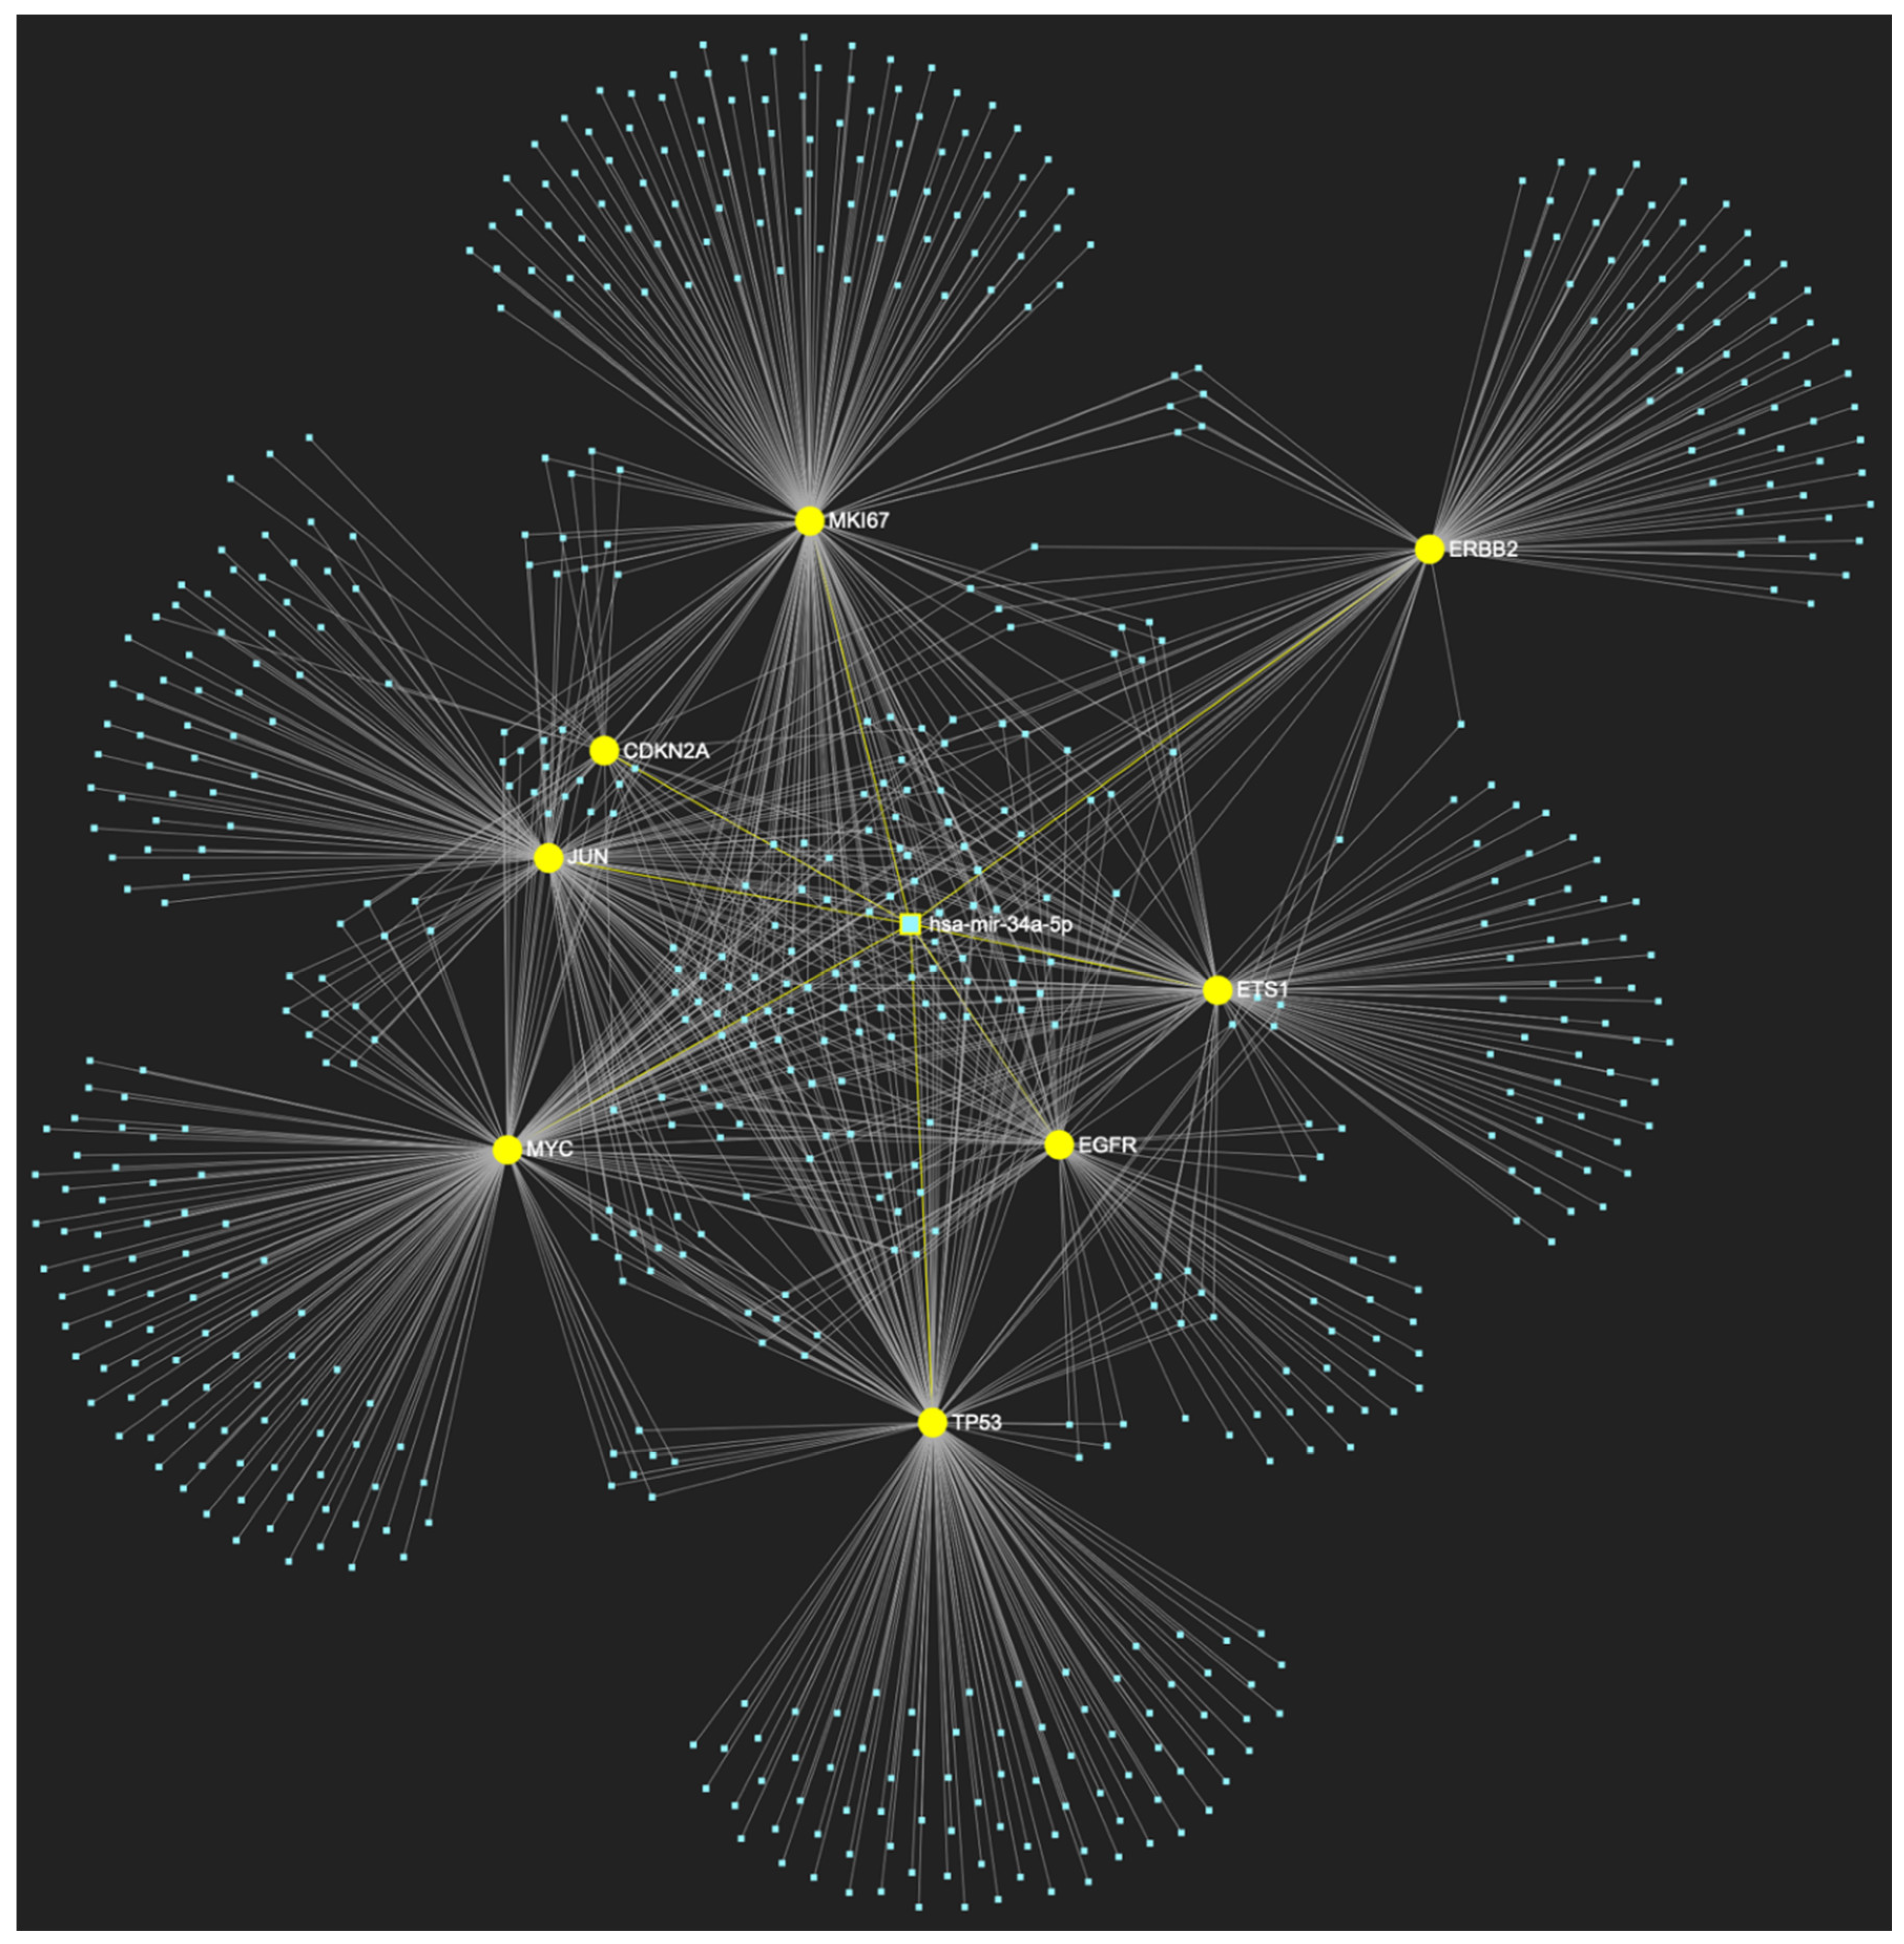
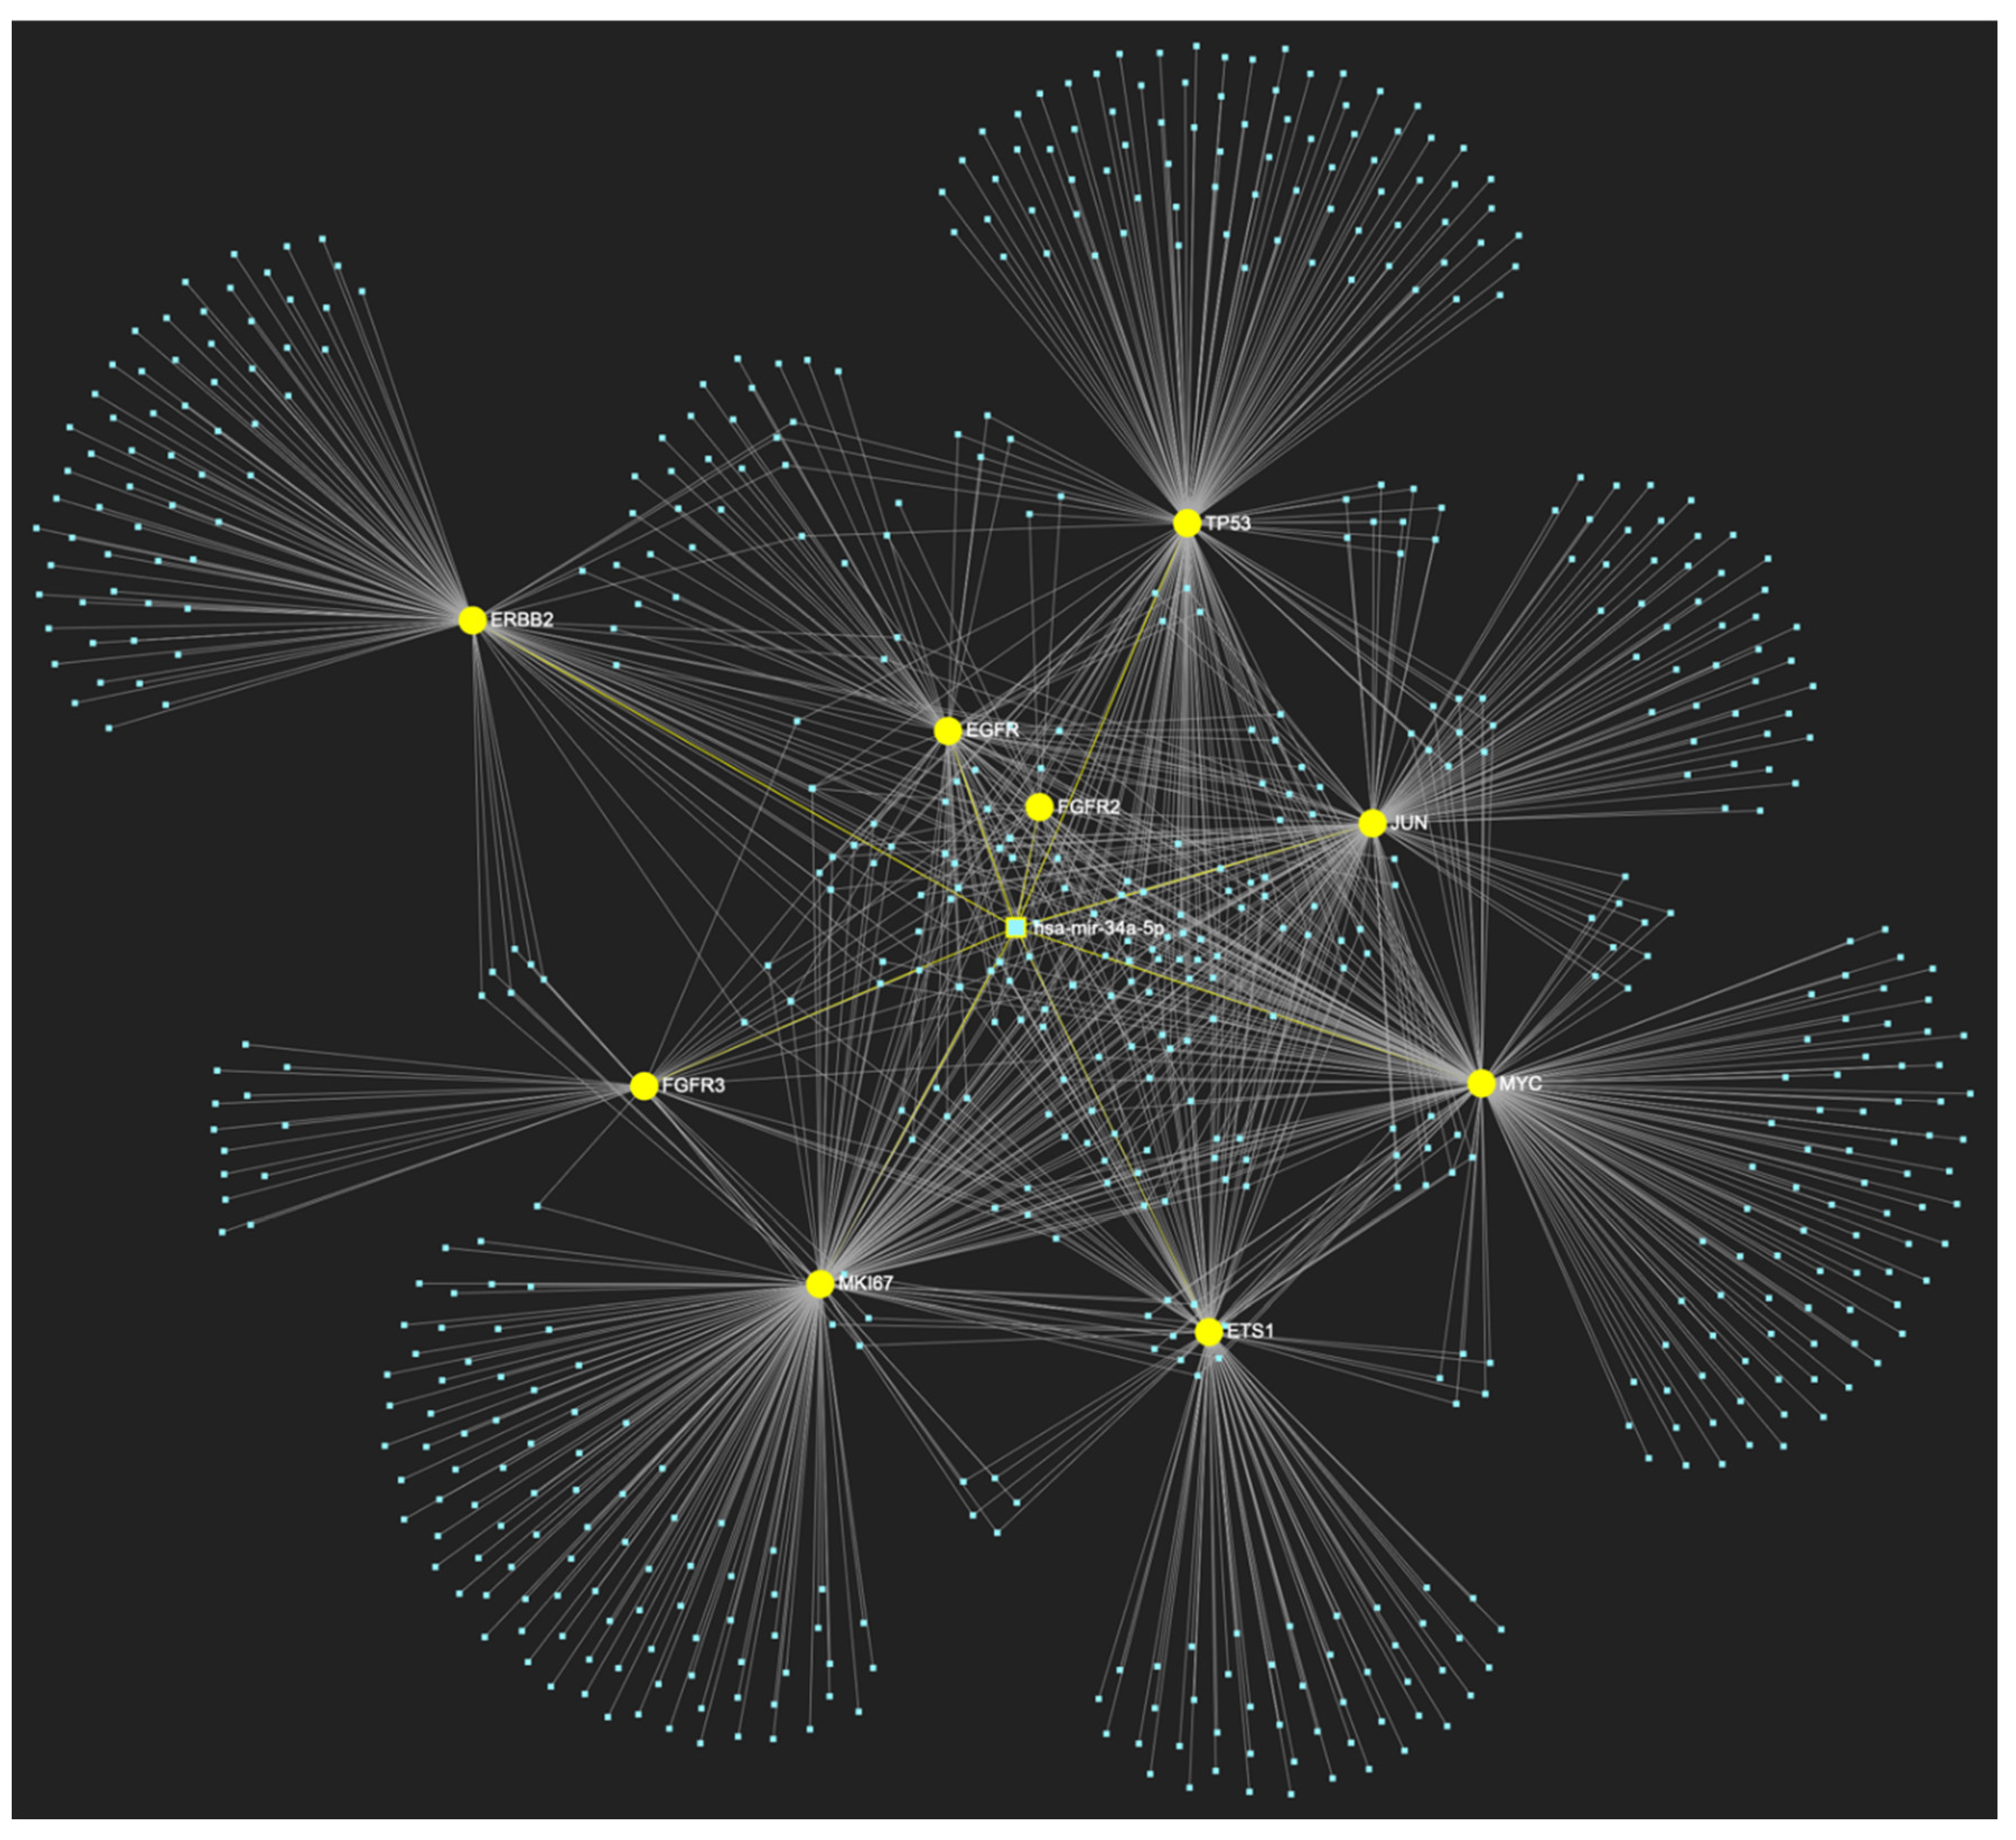
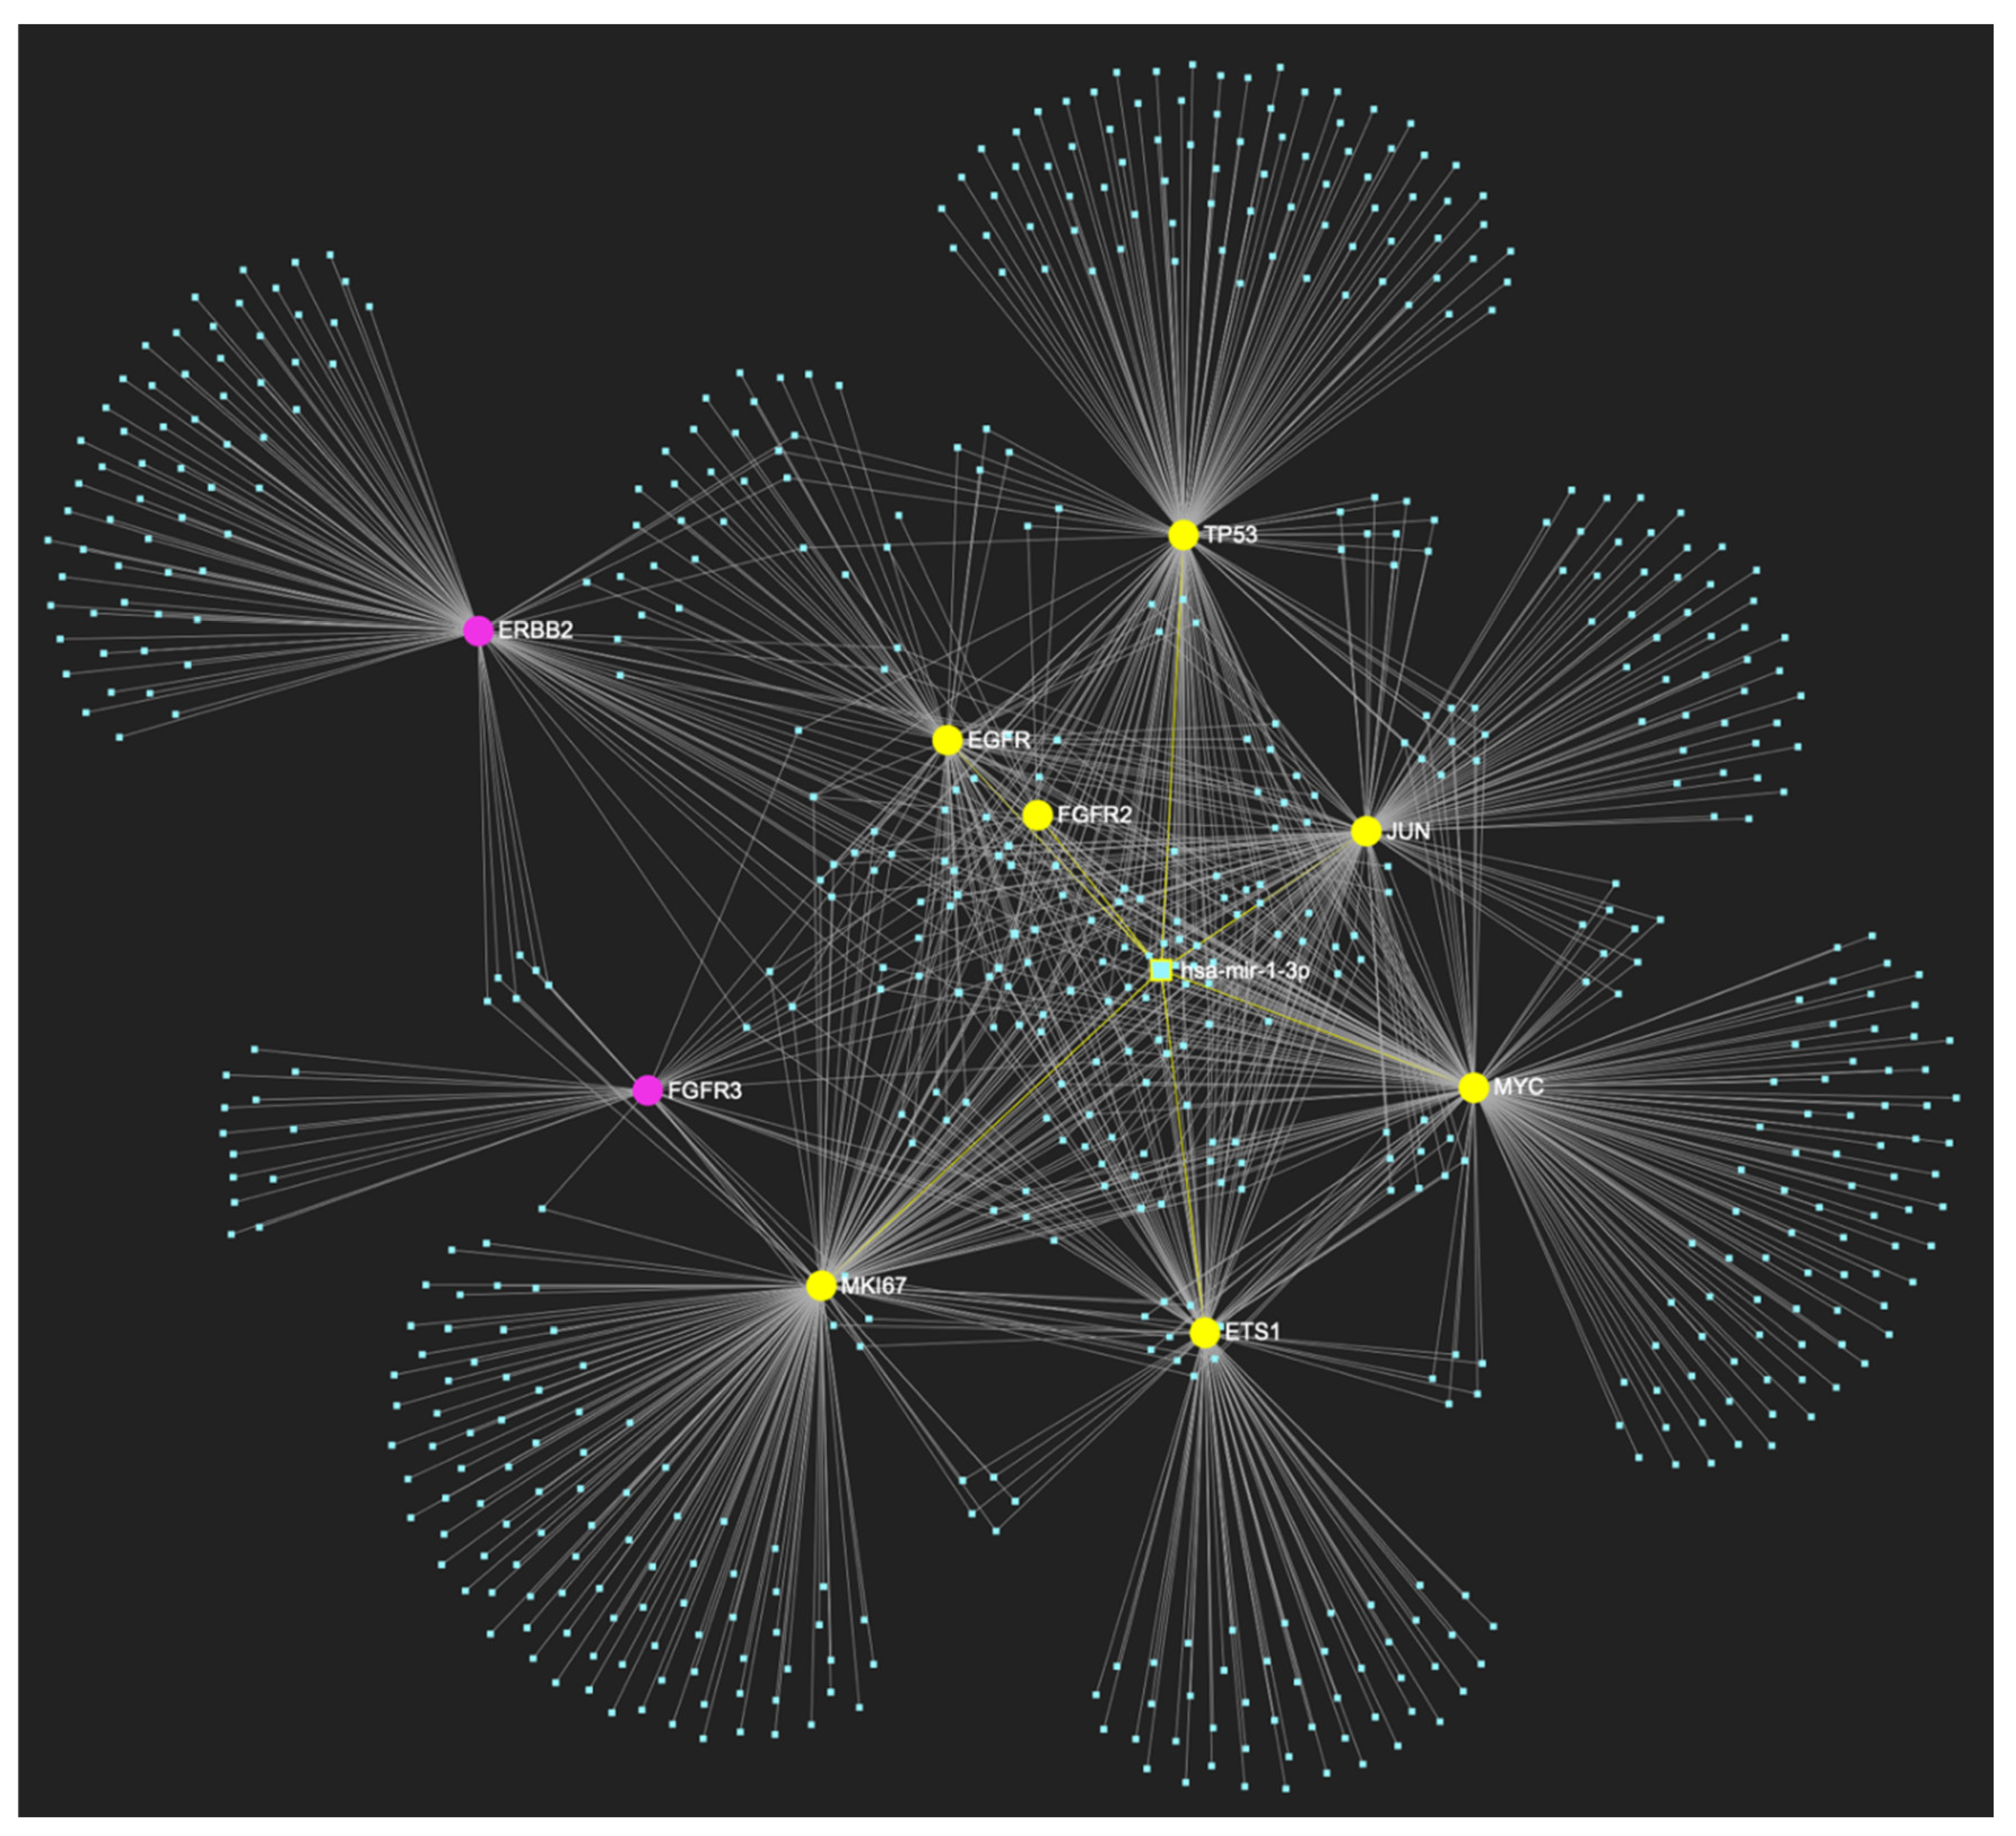
MiR-34a-5p, which has mostly been documented to exhibit decreased expression in OSCC (but has also been reported as overexpressed by a minimal number of studies), is predicted to simultaneously target and possibly regulate the expression of the total of 8 genes (Target score: 100%) that are characteristically upregulated during the stage of oral hyperplasia (EGFR, ERBB2, JUN, ETS1, MYC, MKI67, CDKN2A, TP53), according to the hamster model of sequential oral oncogenesis, and comprise our stage-specific upregulated gene panel developed for that particular stage. The yellow graphic elements depict the genes that are specifically targeted by miR-34a-5p, along with their pertaining connecting nodes. The light blue dots across the illustration represent the remaining miRNA molecules that are expected to target at least one gene in this network.
Figure 4.
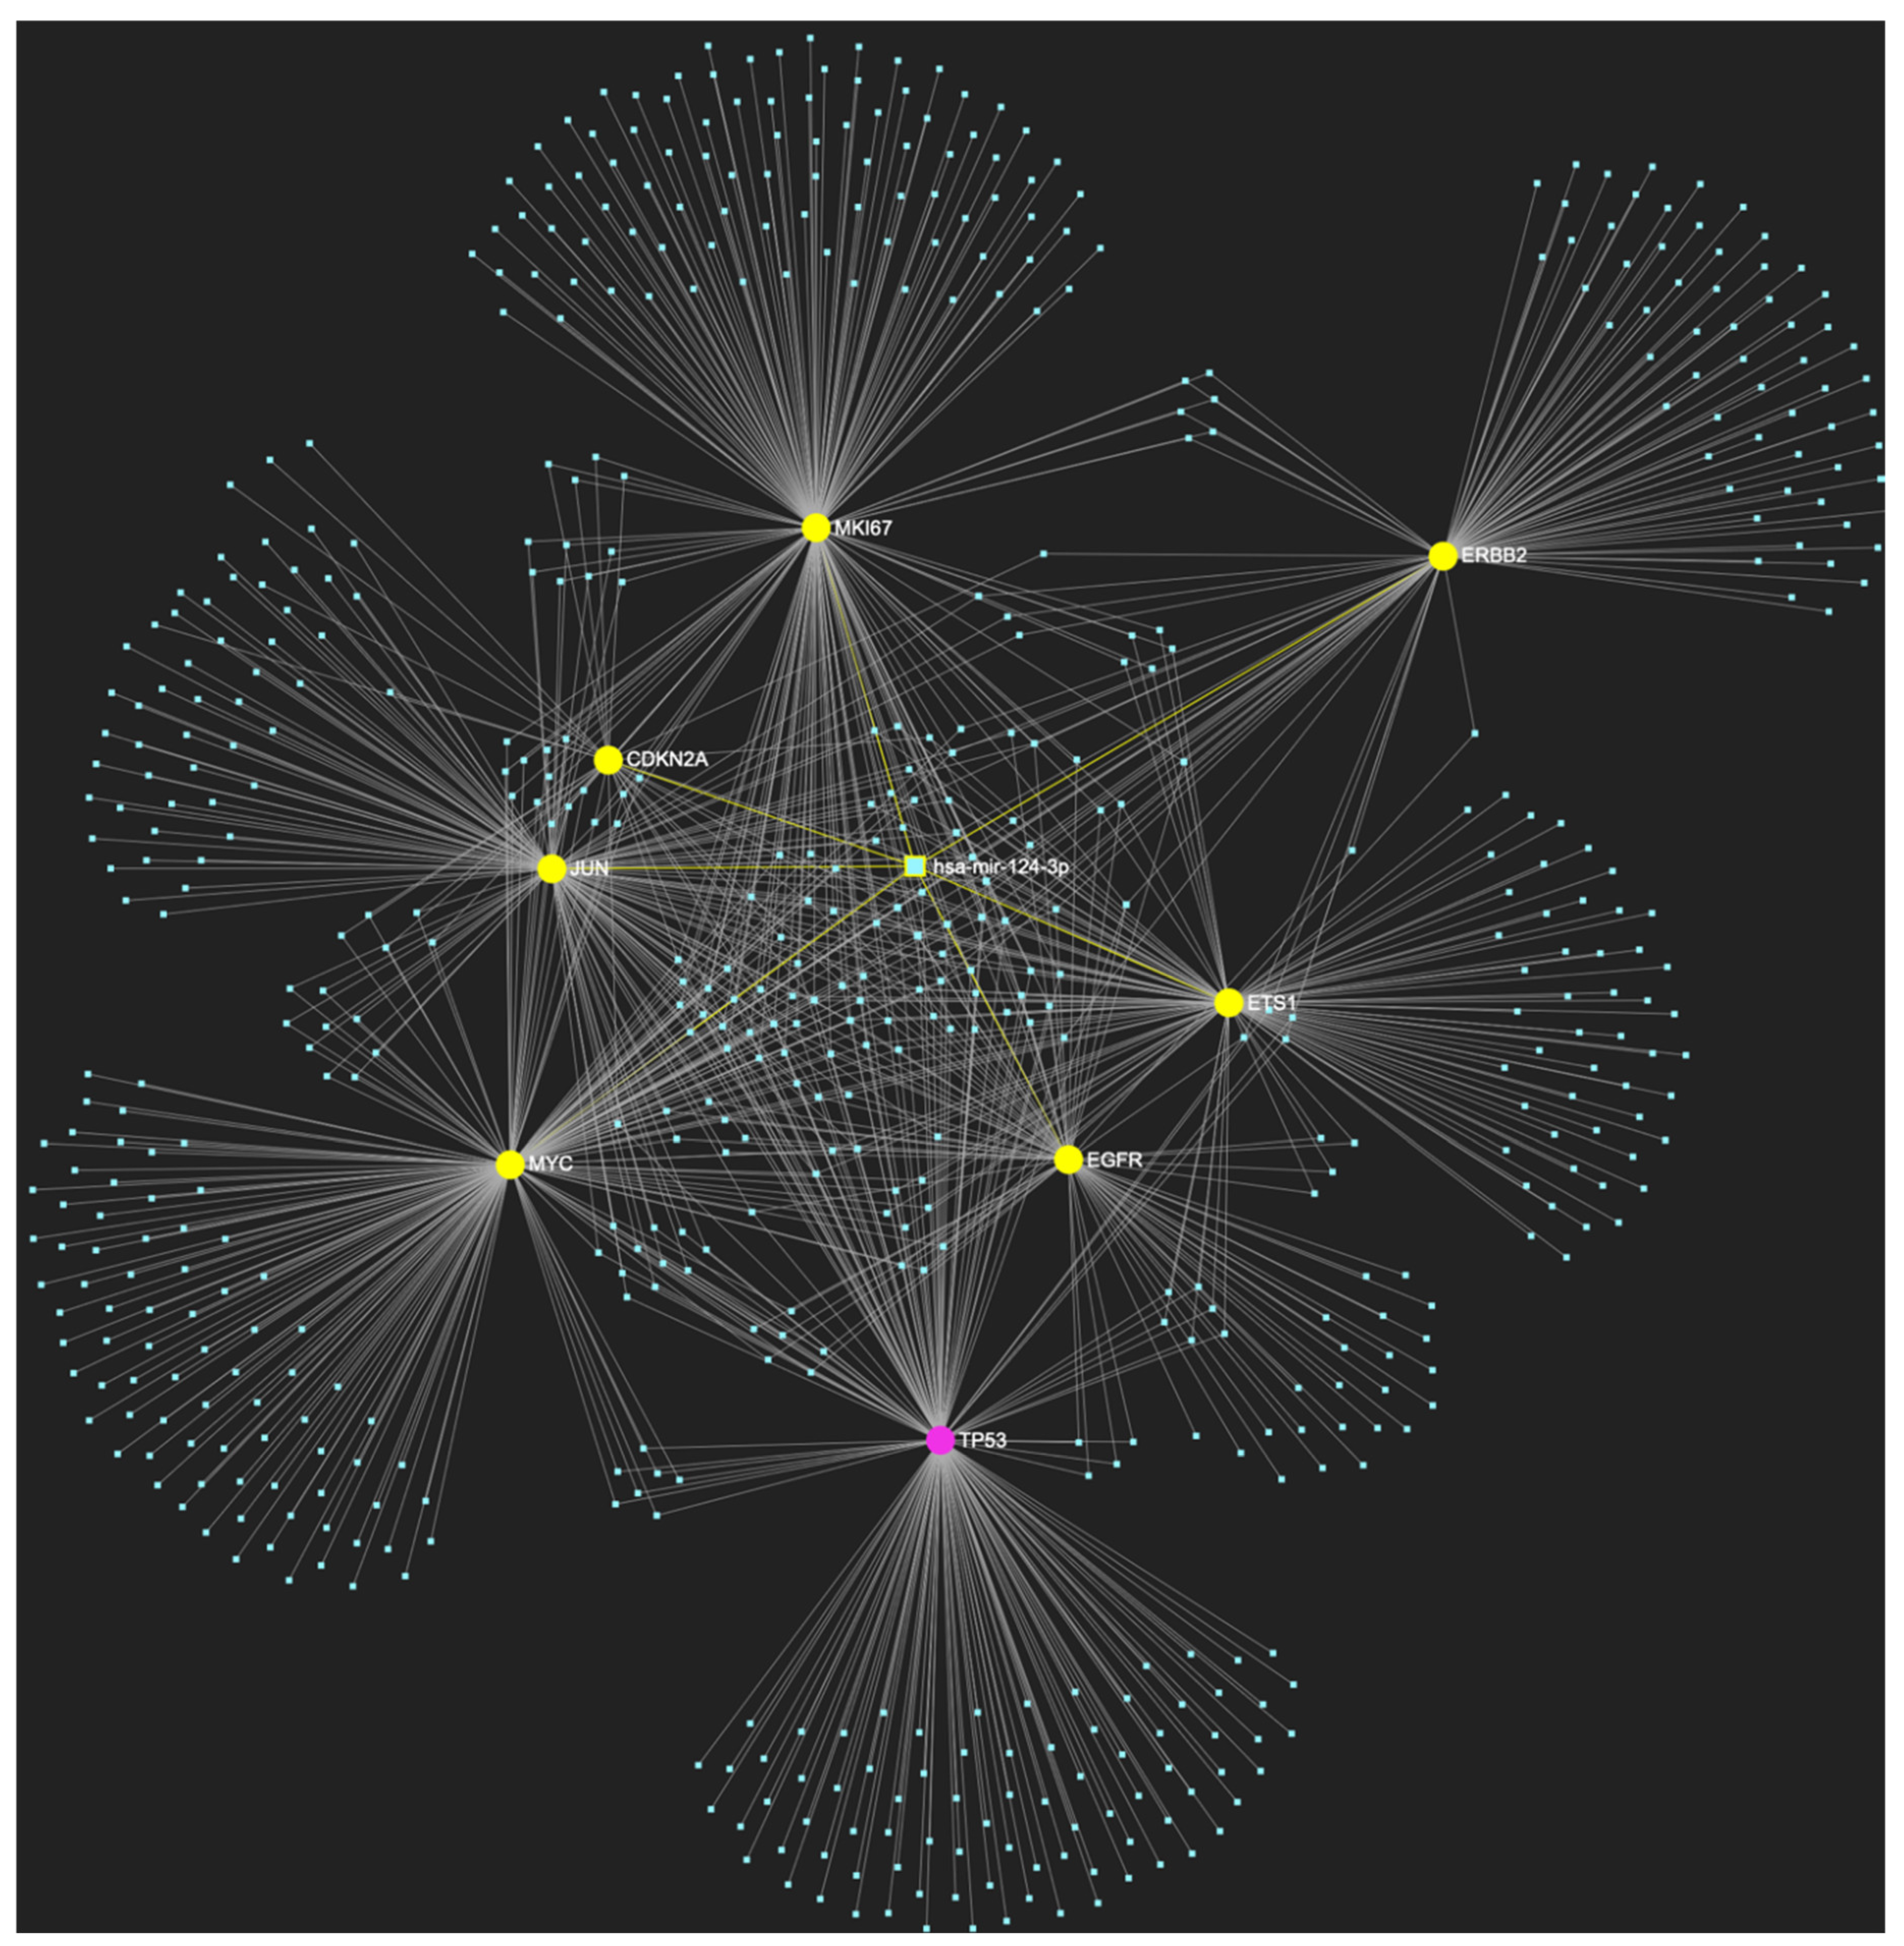
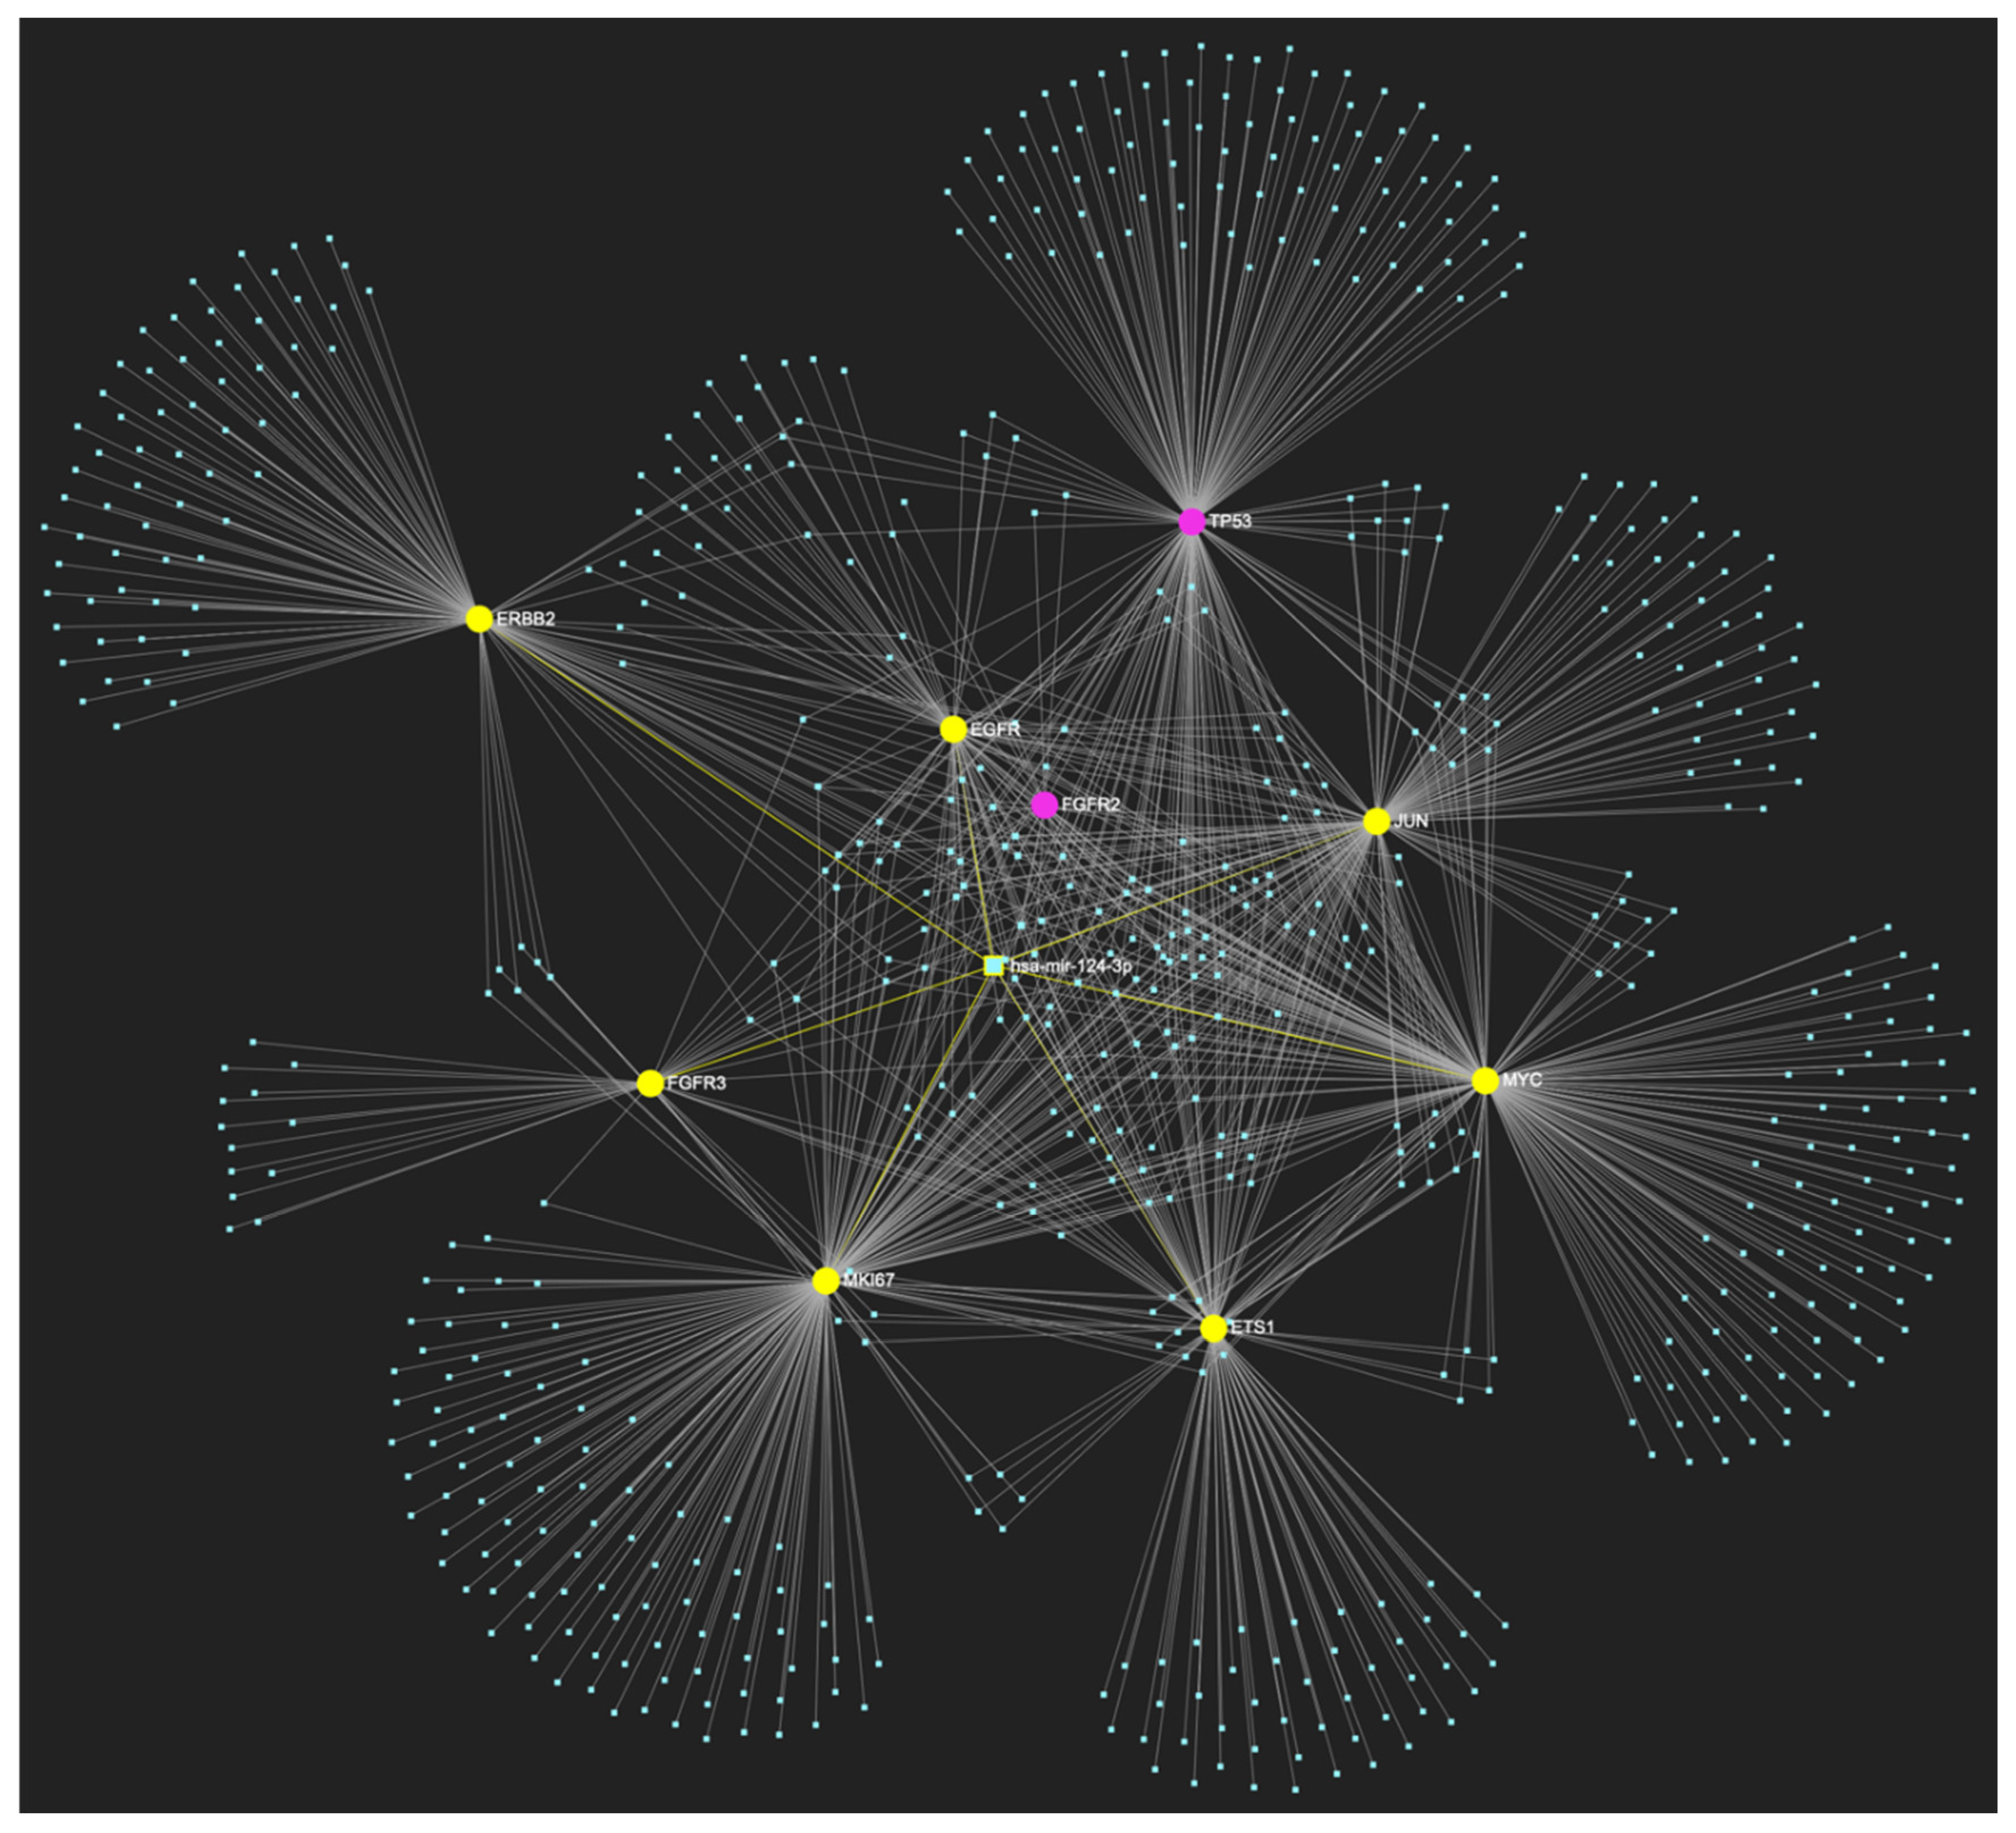
MiR-124-3p, which demonstrates significant downregulation in OSCC, is predicted to simultaneously target and possibly regulate the expression of 7 (EGFR, ERBB2, JUN, ETS1, MYC, MKI67, CDKN2A) out of the 8 genes that comprise the upregulated gene panel developed for the stage of oral hyperplasia, according to the hamster model of sequential οral oncogenesis, demonstrating a Target Score of 87.5%. The yellow graphic elements depict the genes that are specifically targeted by miR-124-3p, along with their pertaining connecting nodes. The pink elements illustrate the genes that are not targeted by this particular miRNA, while the light blue dots across the illustration represent the remaining miRNA molecules that are expected to target at least one gene in this network.
Figure 5.
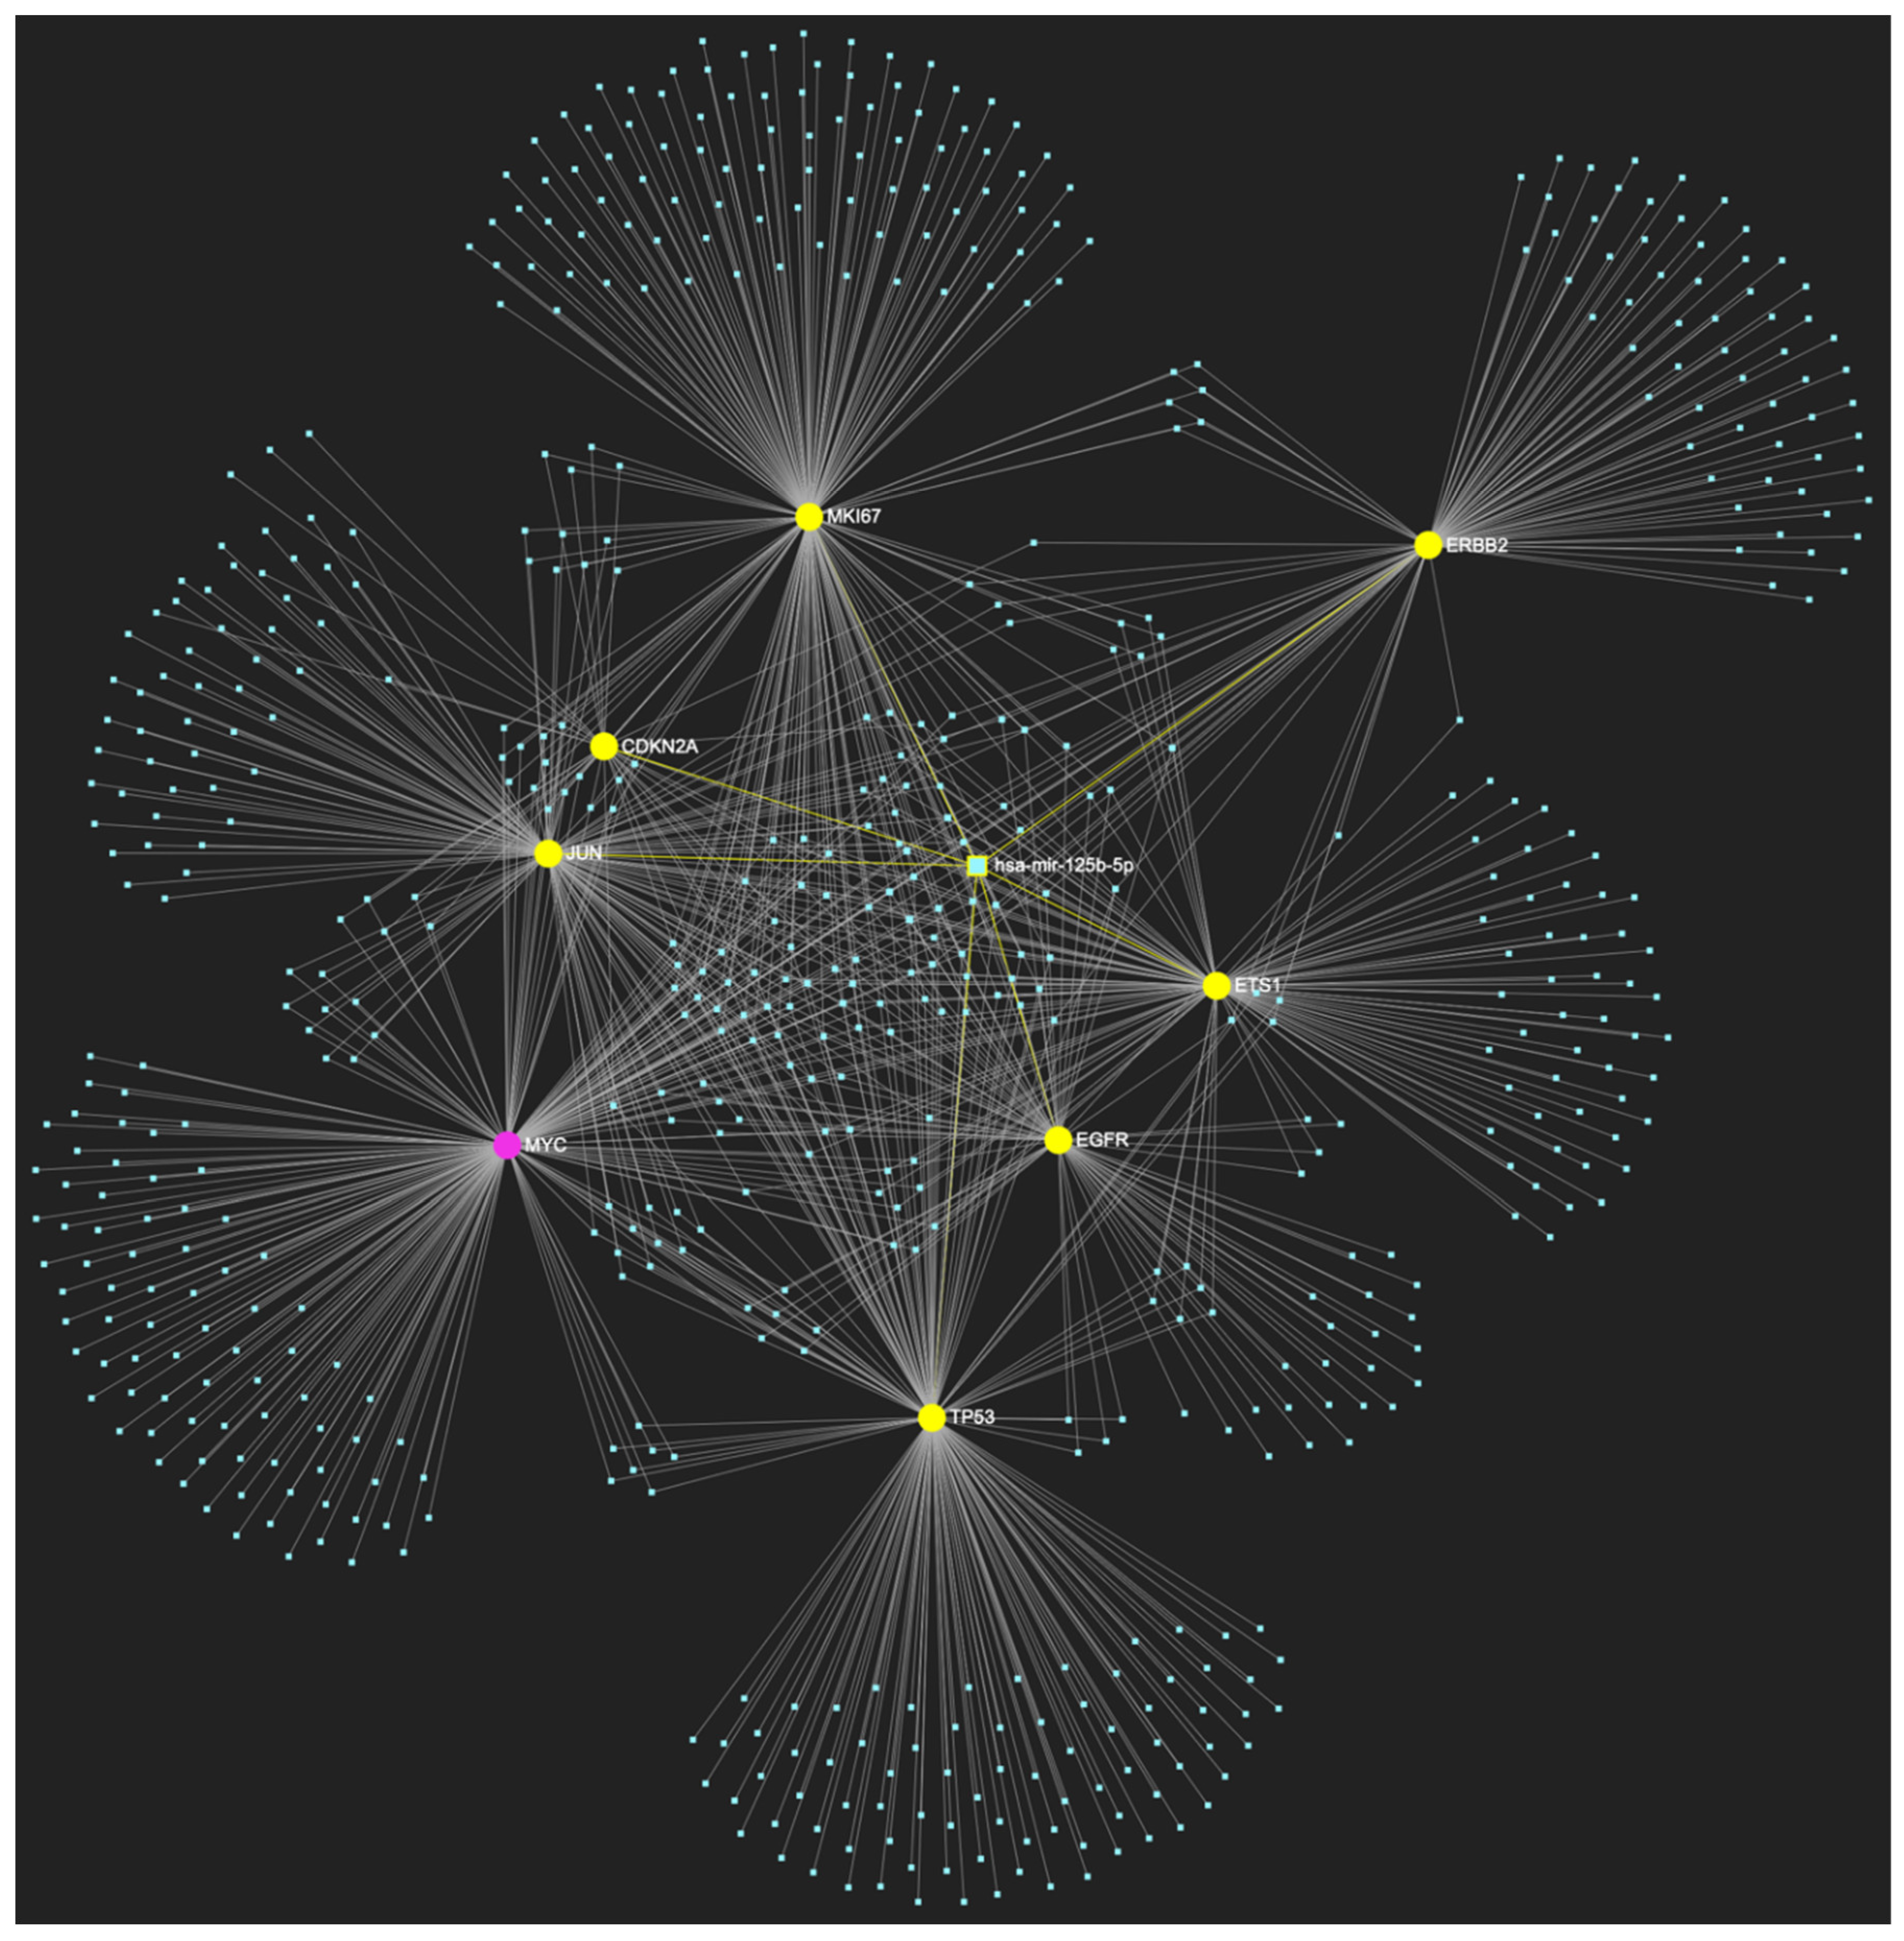
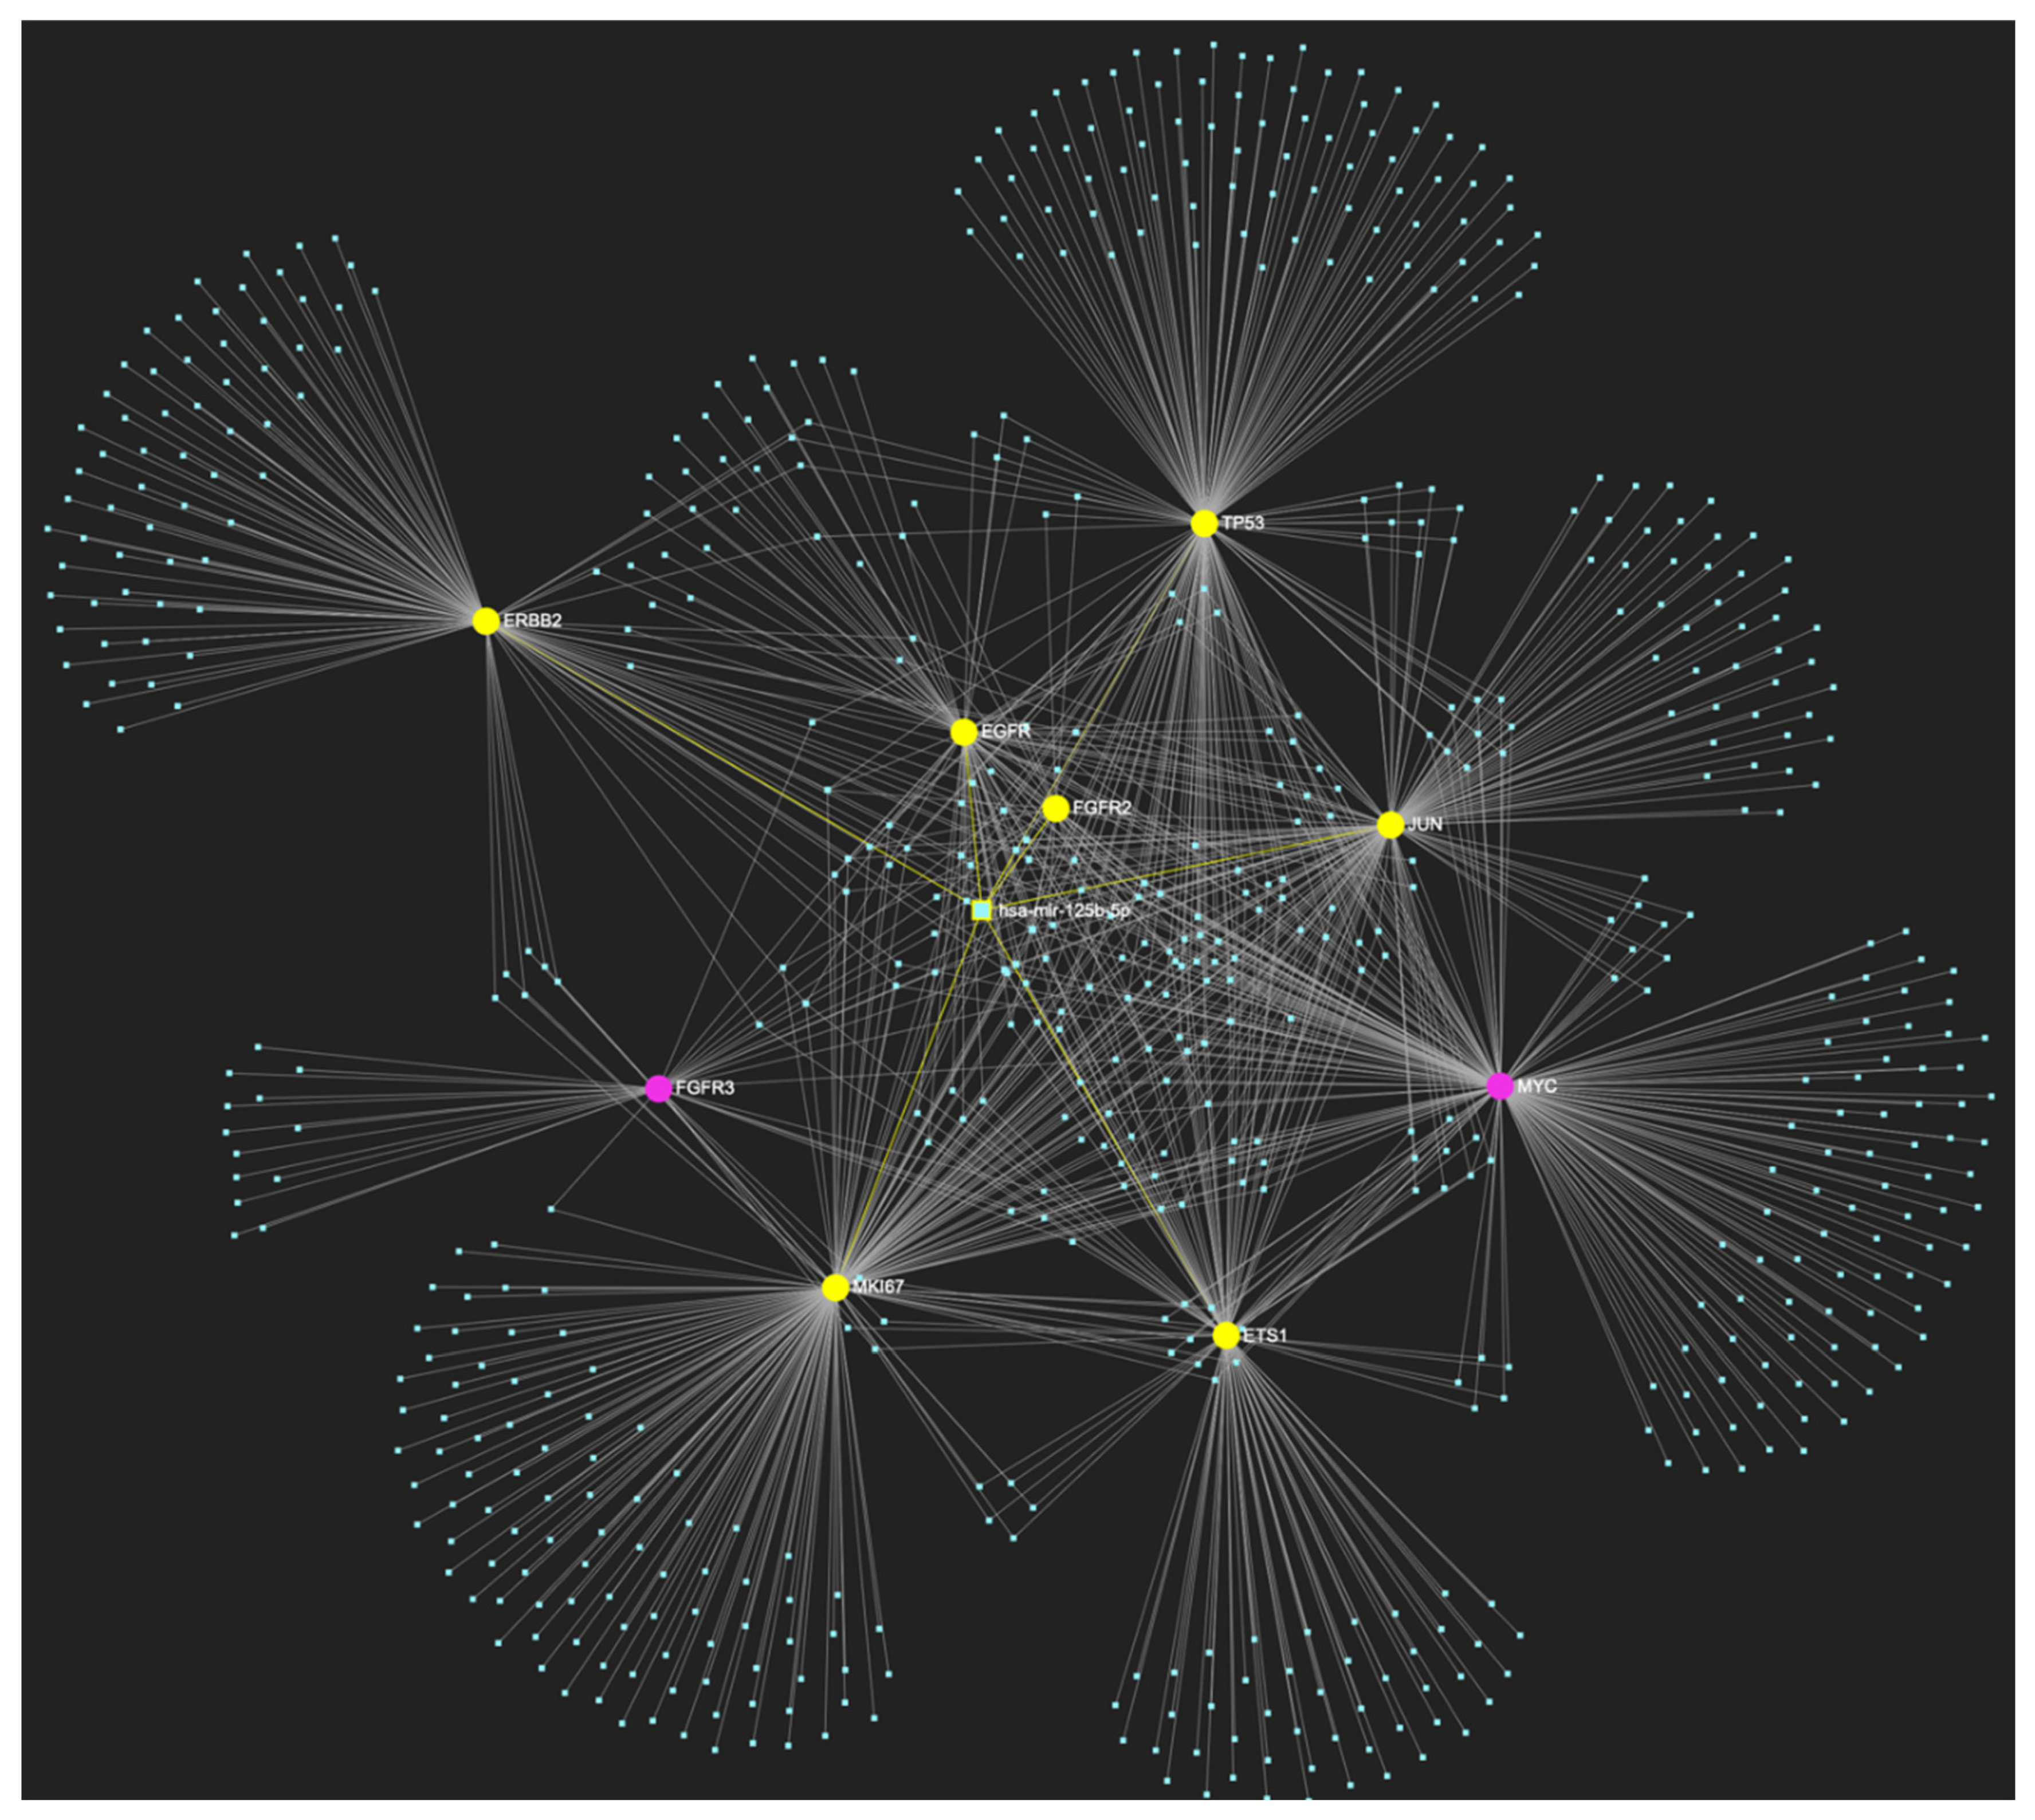
MiR-125b-5p, which is reported to be significantly underexpressed in OSCC, is predicted to simultaneously target and possibly regulate the expression of 7 (EGFR, ERBB2, JUN, ETS1, MKI67, TP53 and CDKN2A) out of the 8 genes that comprise the upregulated gene panel developed for the stage of oral hyperplasia, according to the hamster model of sequential οral oncogenesis (Target Score: 87.5%). The yellow graphic elements depict the genes that are specifically targeted by miR-125b-5p, along with their pertaining connecting nodes. The pink elements illustrate the genes that are not targeted by this particular miRNA, while the light blue dots across the illustration represent the remaining miRNA molecules that are expected to target at least one gene in this network.
Figure 6.
The miRNA/target interaction network, depicts the 658 miRNA molecules that are predicted to target and possibly regulate at least one of the 9 genes that comprise the upregulated gene panel developed for the stage of oral dysplasia, according to the genomic data acquired by the hamster model of sequential οral oncogenesis. The encompassed characteristically upregulated cell-cycle-regulatory genes for this particular stage include the EGFR, ERBB2, FGFR2, FGFR3, ETS1, MYC, JUN, TP53 and MKI67 (Ki-67). The pink graphic elements illustrate the genes that comprise the panel, while the light blue dots across the illustration represent the miRNA molecules that are expected to target at least of them, and possibly regulate its post-transcriptional expression.
Figure 7.
MiR-34a-5p, which is primarily reported for demonstrating reduced expression in OSCC (but has also been reported as overexpressed by a minimal number of studies), is predicted to simultaneously target and possibly regulate the expression of all the 9 genes (Target score: 100%) that are characteristically upregulated during the stage of oral dysplasia (EGFR, ERBB2, FGFR2, FGFR3, ETS1, JUN, MYC, MKI67 and TP53), according to the hamster model of sequential οral oncogenesis, and comprise our stage-specific upregulated gene panel developed for that particular stage. The yellow graphic elements depict the genes that are specifically targeted by miR-34a-5p, along with their pertaining connecting nodes. The light blue dots across the illustration represent the remaining miRNA molecules that are expected to target at least one gene in this network.
Figure 8.
MiR-124-3p, which exhibits a significant decrease in OSCC, is predicted to simultaneously target and possibly regulate the expression of 7 (EGFR, ERBB2, FGFR3, ETS1, MYC, JUN, MKI67) out of the 9 genes in the upregulated gene panel developed for the stage of oral dysplasia, according to the hamster model of sequential οral oncogenesis, (Target Score: 77.8%). The yellow graphic elements depict the genes that are specifically targeted by miR-124-3p, along with their pertaining connecting nodes. The pink elements illustrate the genes that are not targeted by this particular miRNA, while the light blue dots across the illustration represent the remaining miRNA molecules that are expected to target at least one gene in this network.
Figure 9.
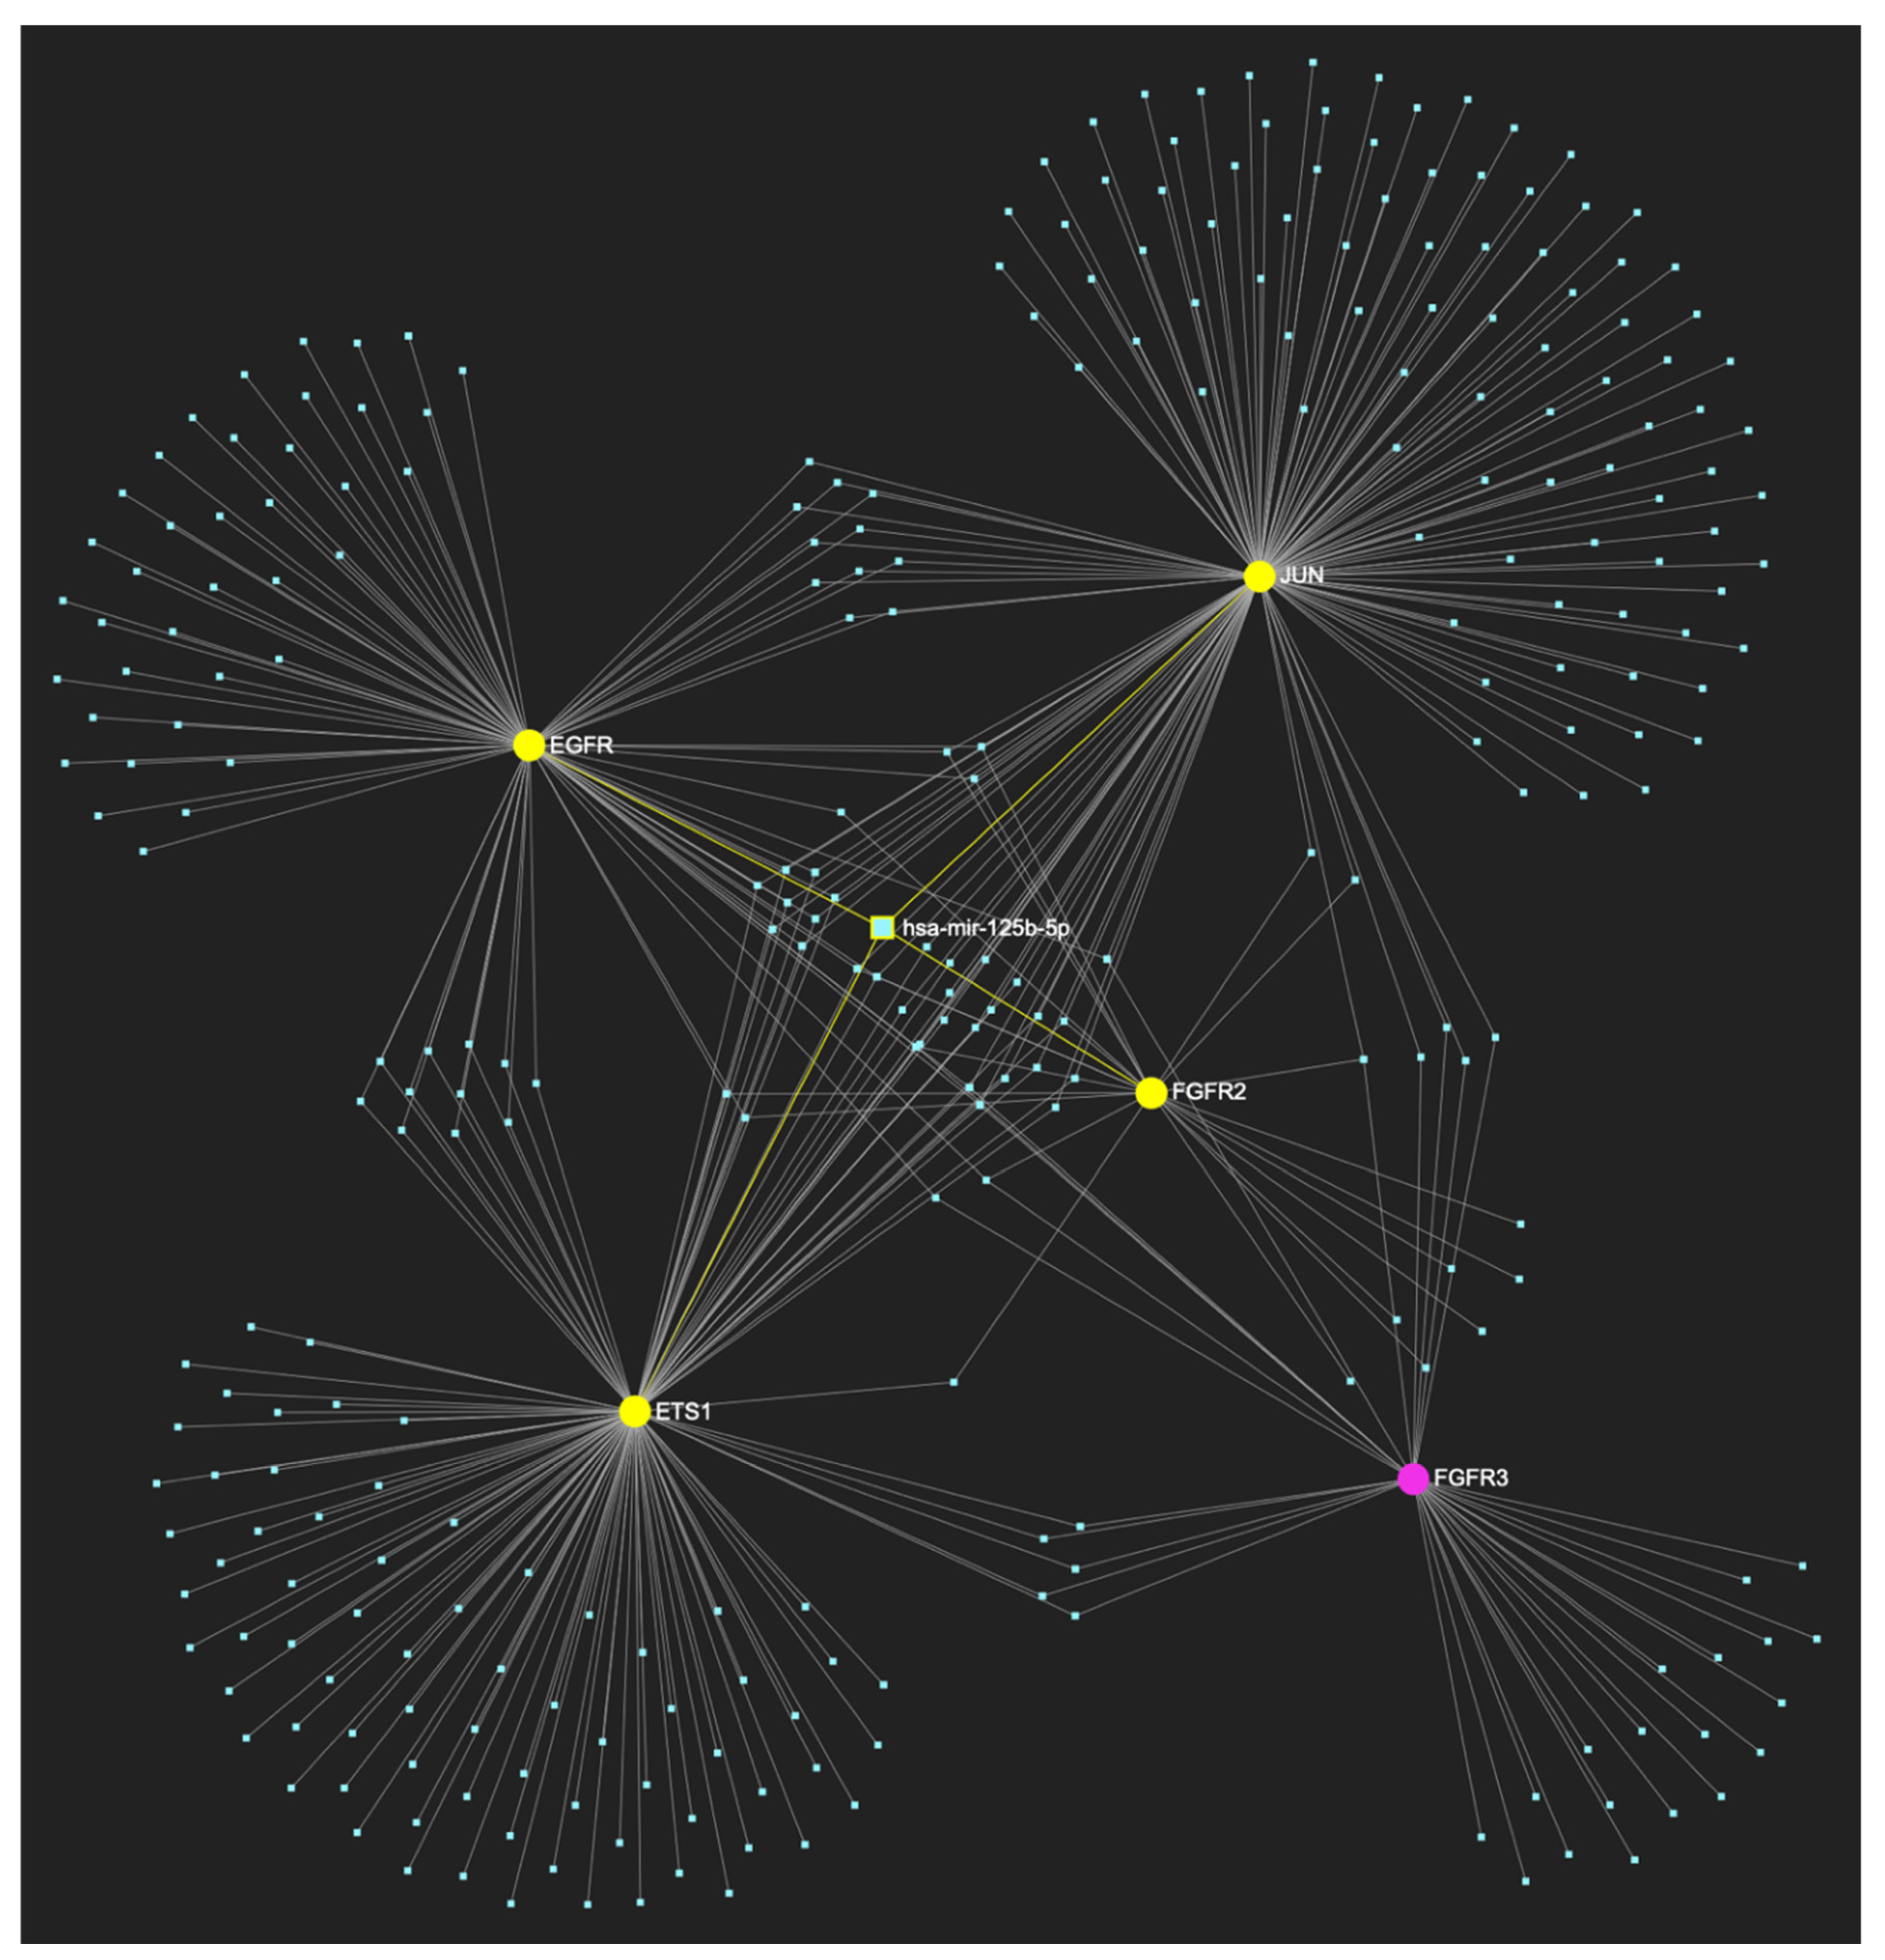
MiR-125b-5p, the levels of which are characteristically decreased in OSCC, is predicted to simultaneously target and possibly regulate the expression of 7 (EGFR, ERBB2, FGFR2, ETS1, JUN, TP53, MKI67) out of the 9 genes that comprise the upregulated gene panel developed for the stage of oral dysplasia, according to the hamster model of sequential οral oncogenesis, thus demonstrating a Target Score of 77.8%. The yellow graphic elements depict the genes that are specifically targeted by miR-125b-5p, along with their pertaining connecting nodes. The pink elements illustrate the genes that are not targeted by this particular miRNA, while the light blue dots across the illustration represent the remaining miRNA molecules that are expected to target at least one gene in this network.
Figure 10.
MiR-1-3p, which is significantly underexpressed in OSCC, is predicted to target and potentially regulate the expression of 7 (EGFR, FGFR2, ETS1, MYC, JUN, TP53, MKI67) out of the 9 genes that comprise the upregulated gene panel developed for the stage of oral dysplasia, according to the hamster model of sequential οral oncogenesis, demonstrating a Target Score of 77.8%. The yellow graphic elements depict the genes that are specifically targeted by miR-1-3p, along with their pertaining connecting nodes. The pink elements illustrate the genes that are not targeted by this particular miRNA, while the light blue dots across the illustration represent the remaining miRNA molecules that are expected to target at least one gene in this network.
Figure 11.
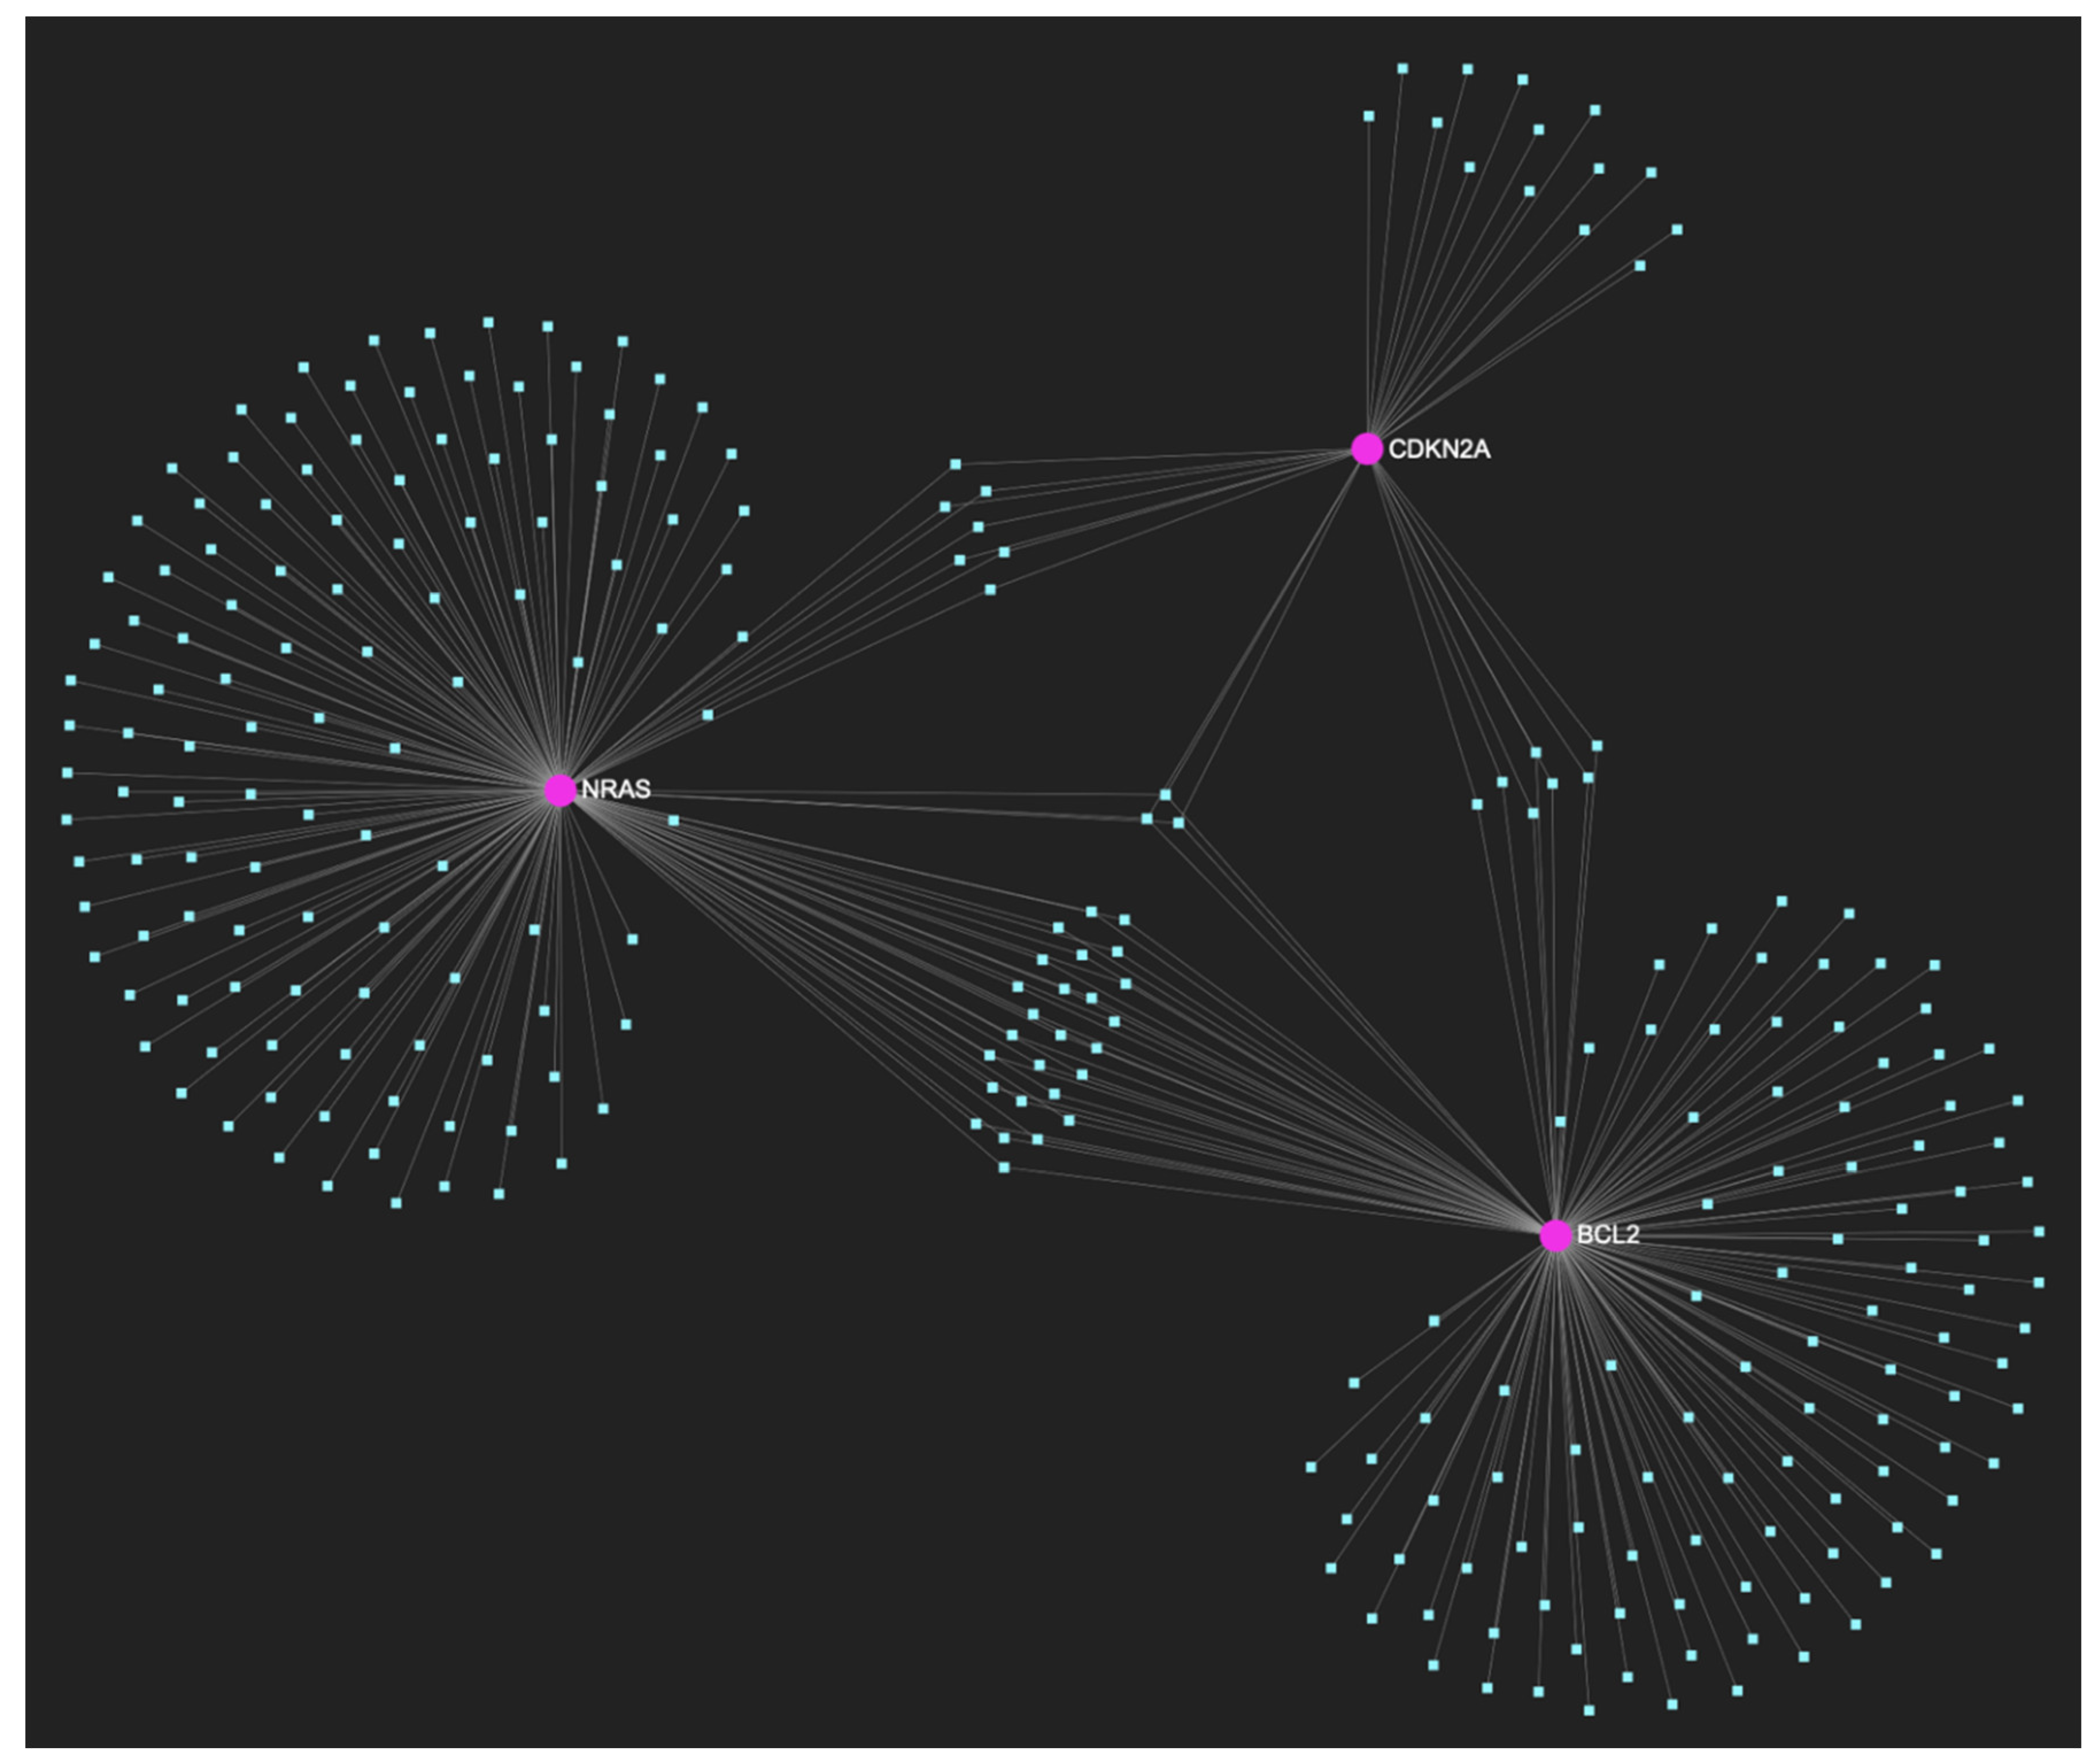
The miRNA/target interaction network, illustrates the 276 miRNA molecules that are predicted to target and possibly regulate at least one out of the 3 genes that comprise the downregulated gene panel developed for the precancerous stage of oral dysplasia, according to the genomic data acquired by the hamster model of sequential οral oncogenesis, comprised of the NRAS and BCL2 oncogenes, as well as the CDKN2A tumor suppressor gene. The pink graphic elements illustrate the genes that comprise the panel, while the light blue dots across the illustration represent the miRNA molecules that are expected to target at least of them, and possibly regulate its post-transcriptional expression.
Figure 12.
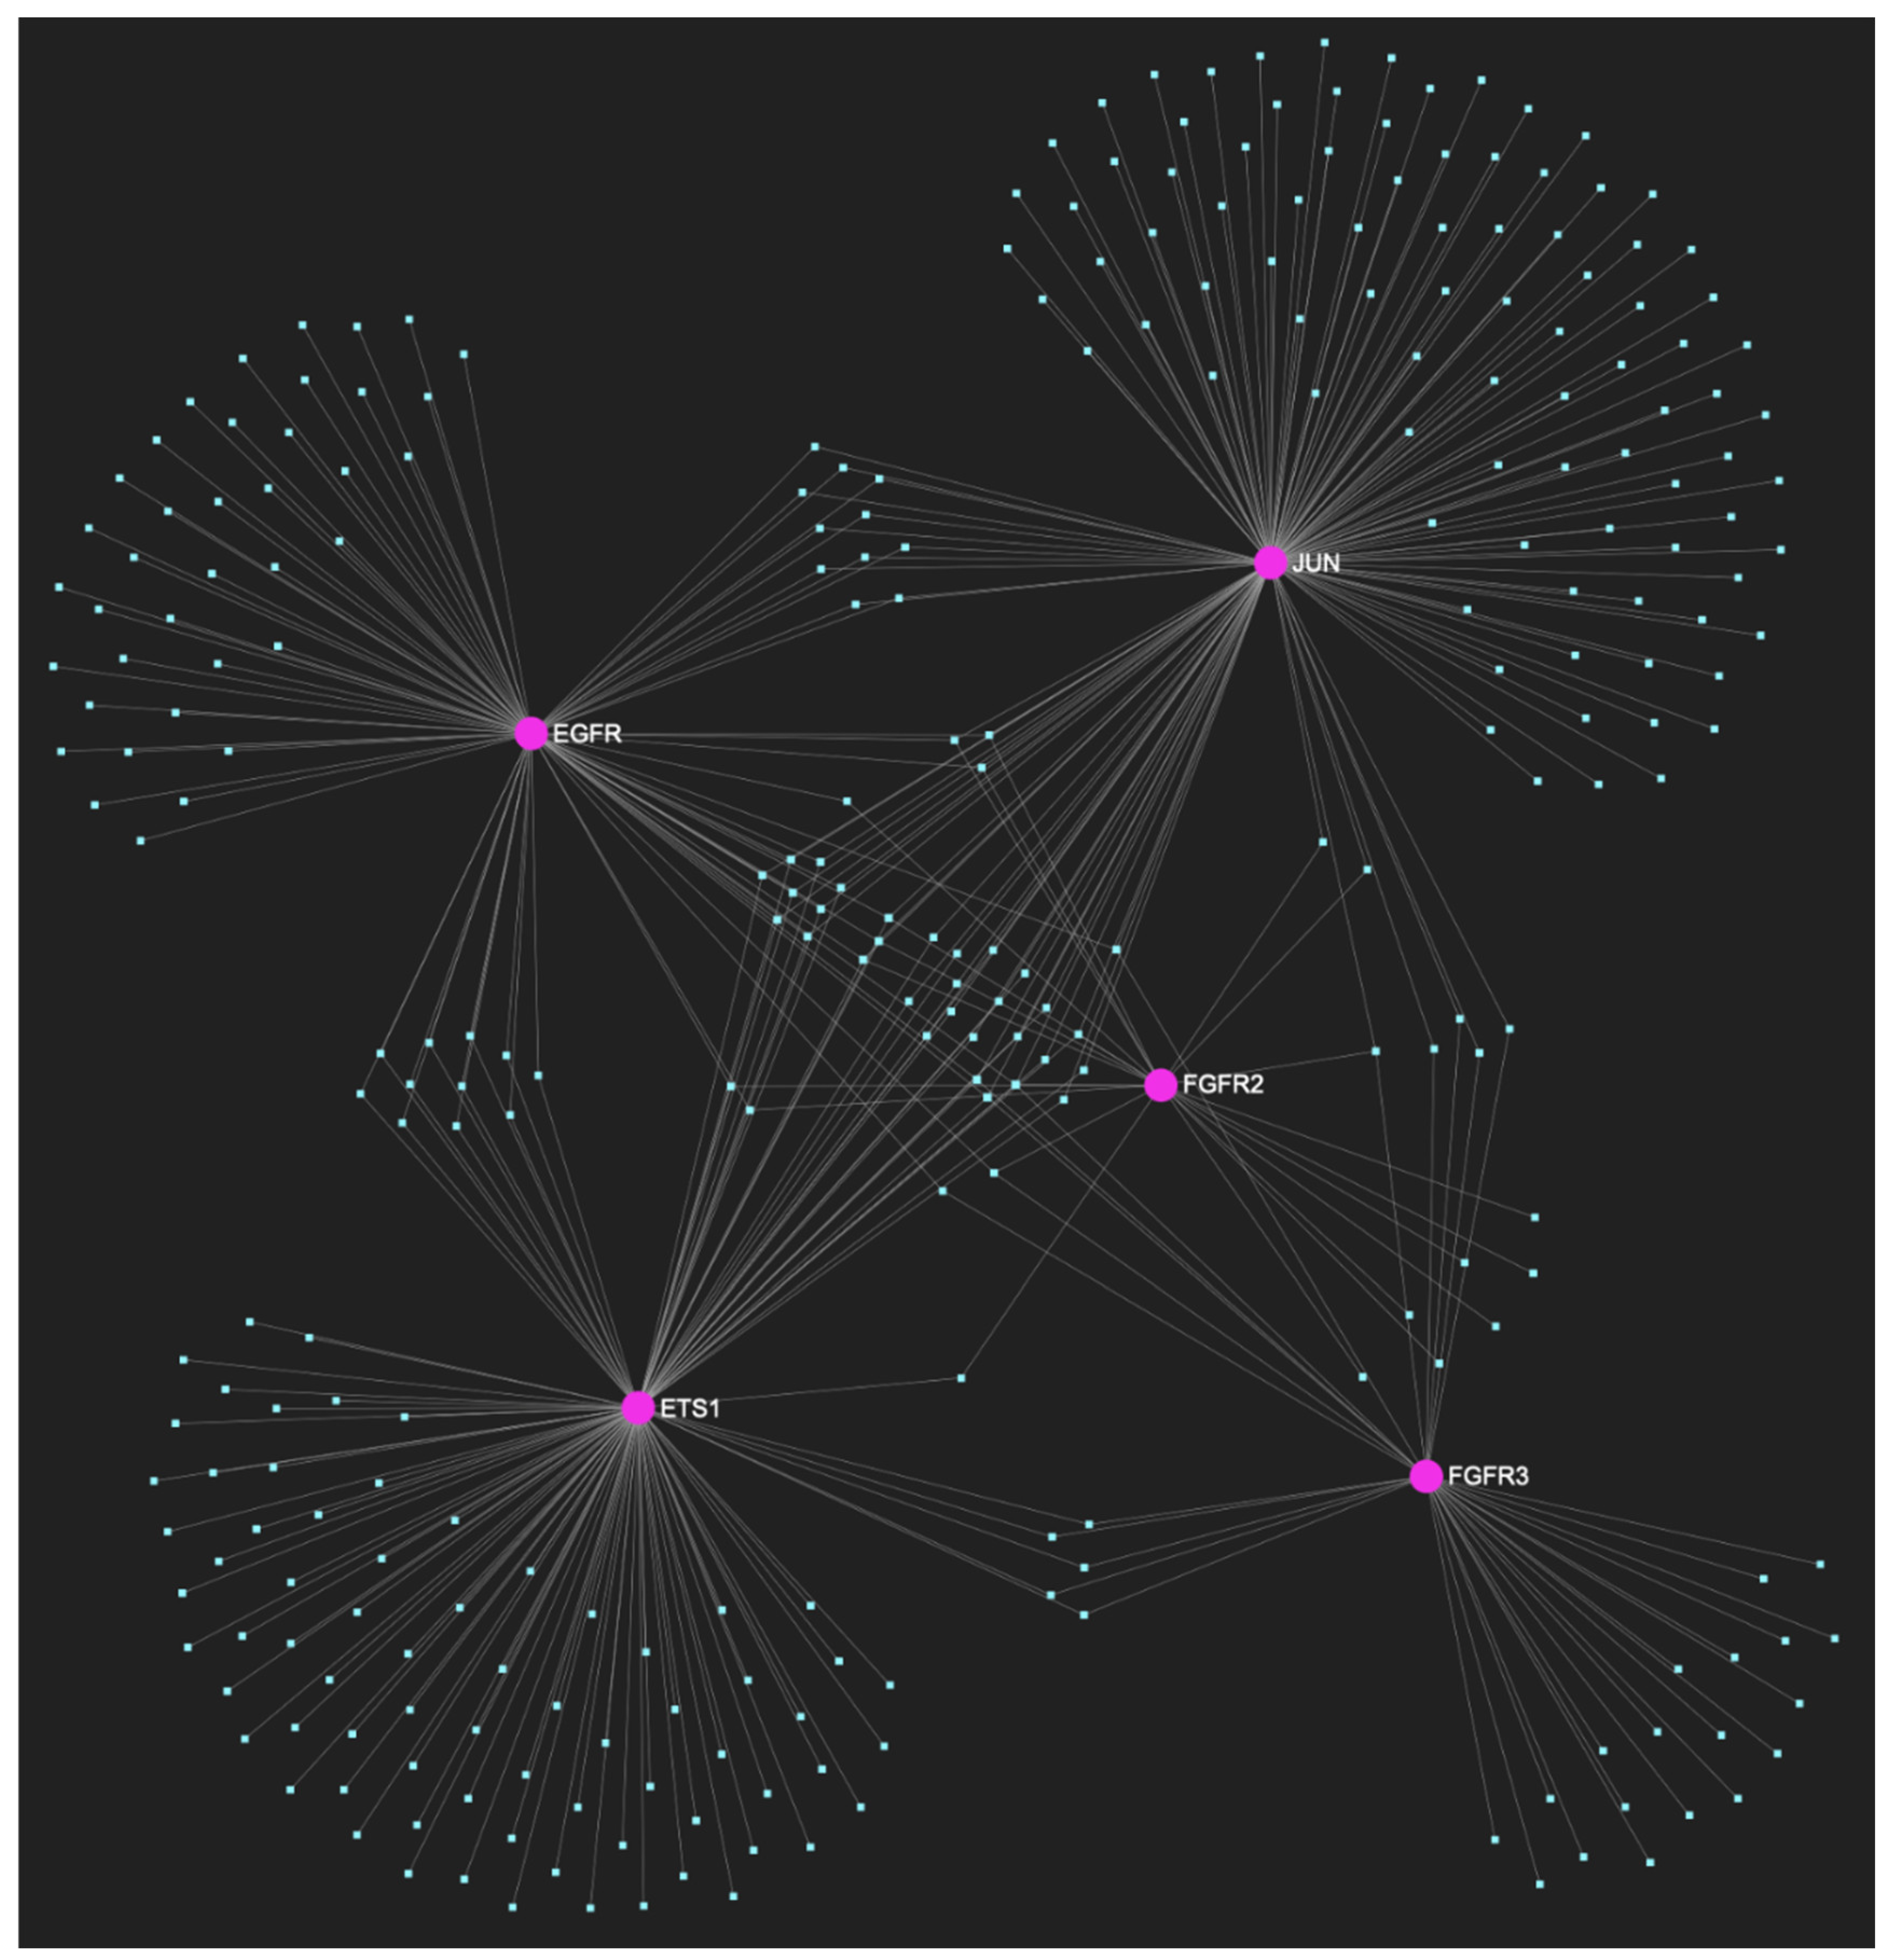
The miRNA/target interaction network, depicts the 303 miRNA molecules that are predicted to target and possibly regulate at least one of the 5 oncogenes (EGFR, FGFR2, FGFR3, ETS1 and JUN) that comprise the upregulated gene panel developed for the initial cancerous stage of early invasion, according to the genomic data acquired by the hamster model of sequential οral oncogenesis. The pink graphic elements illustrate the genes that comprise the panel, while the light blue dots across the illustration represent the miRNA molecules that are expected to target at least of them, and possibly regulate its post-transcriptional expression.
Figure 13.
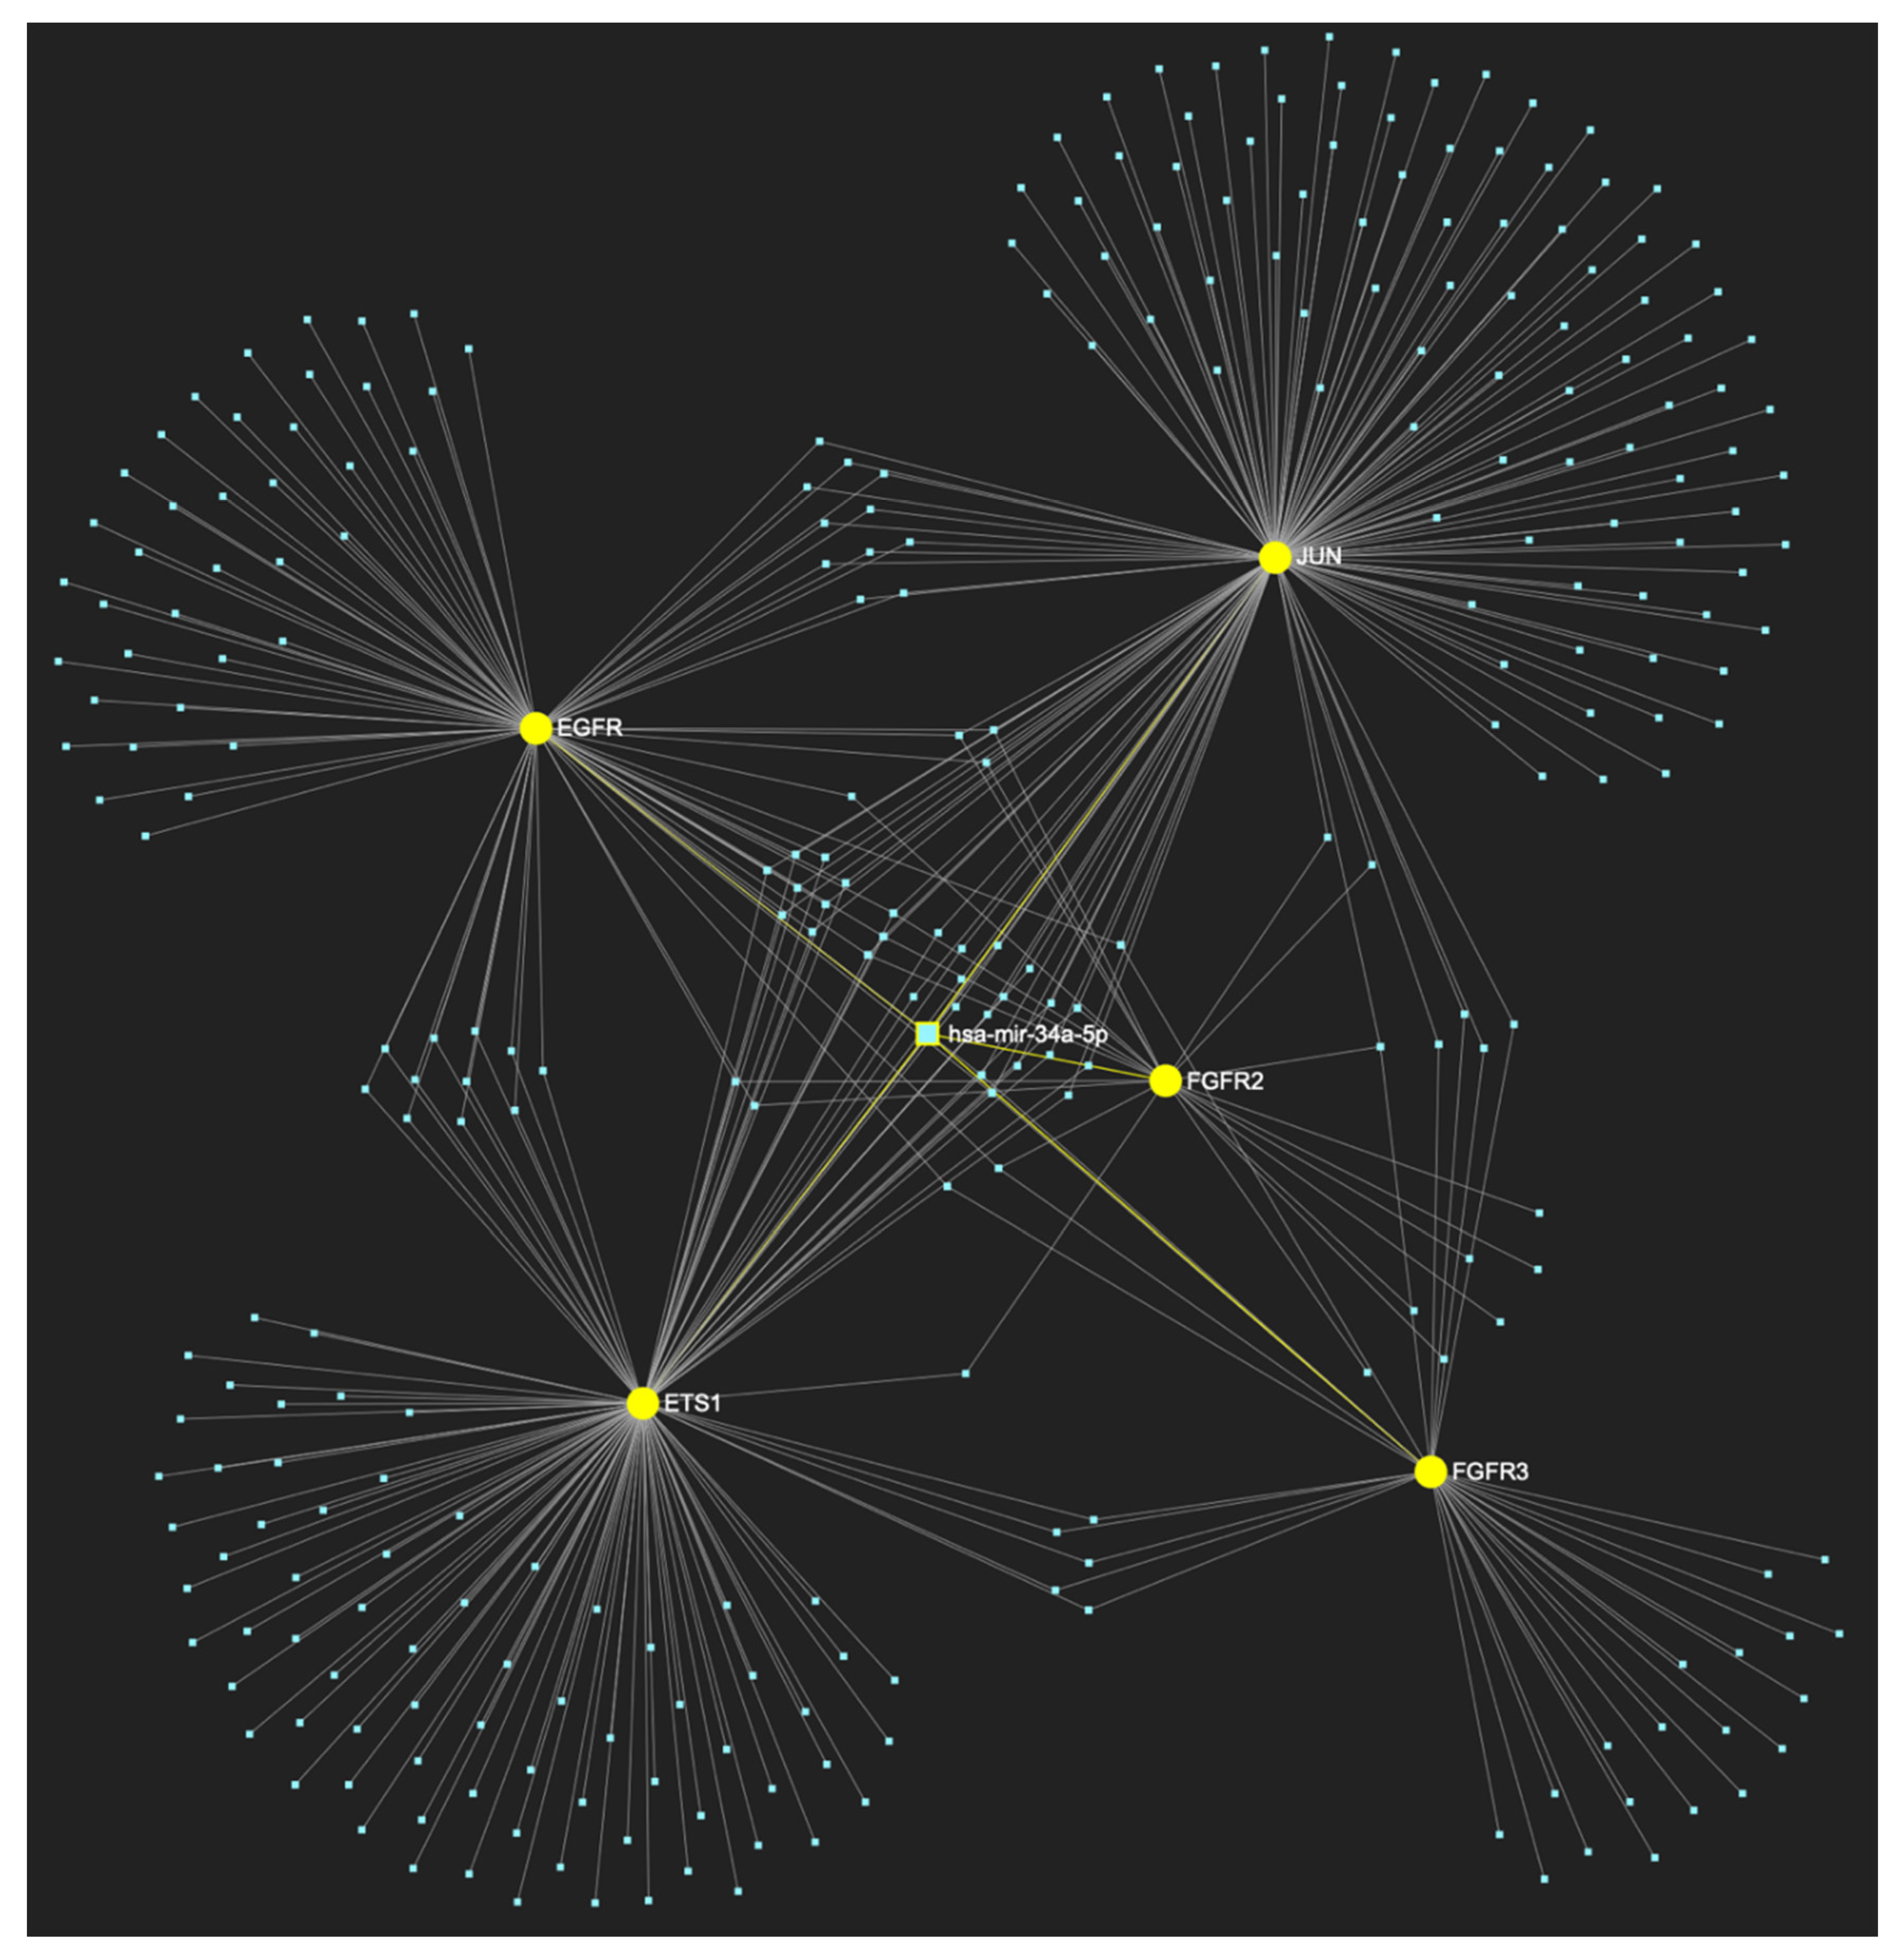
MiR-34a-5p, which is primarily reported for demonstrating reduced expression in OSCC (but has also been reported as overexpressed by a minimal number of studies), is predicted to target and possibly regulate the expression of all 5 oncogenes (Target score: 100%), which are characteristically overexpressed during the initial cancerous stage of early invasion (EGFR, FGFR2, FGFR3, ETS1 and JUN), according to the hamster model of sequential οral oncogenesis, and comprise our stage-specific upregulated gene panel developed for that particular stage. The yellow graphic elements depict the genes that are specifically targeted by miR-34a-5p, along with their pertaining connecting nodes. The light blue dots across the illustration represent the remaining miRNA molecules that are expected to target at least one gene in this network.
Figure 14.
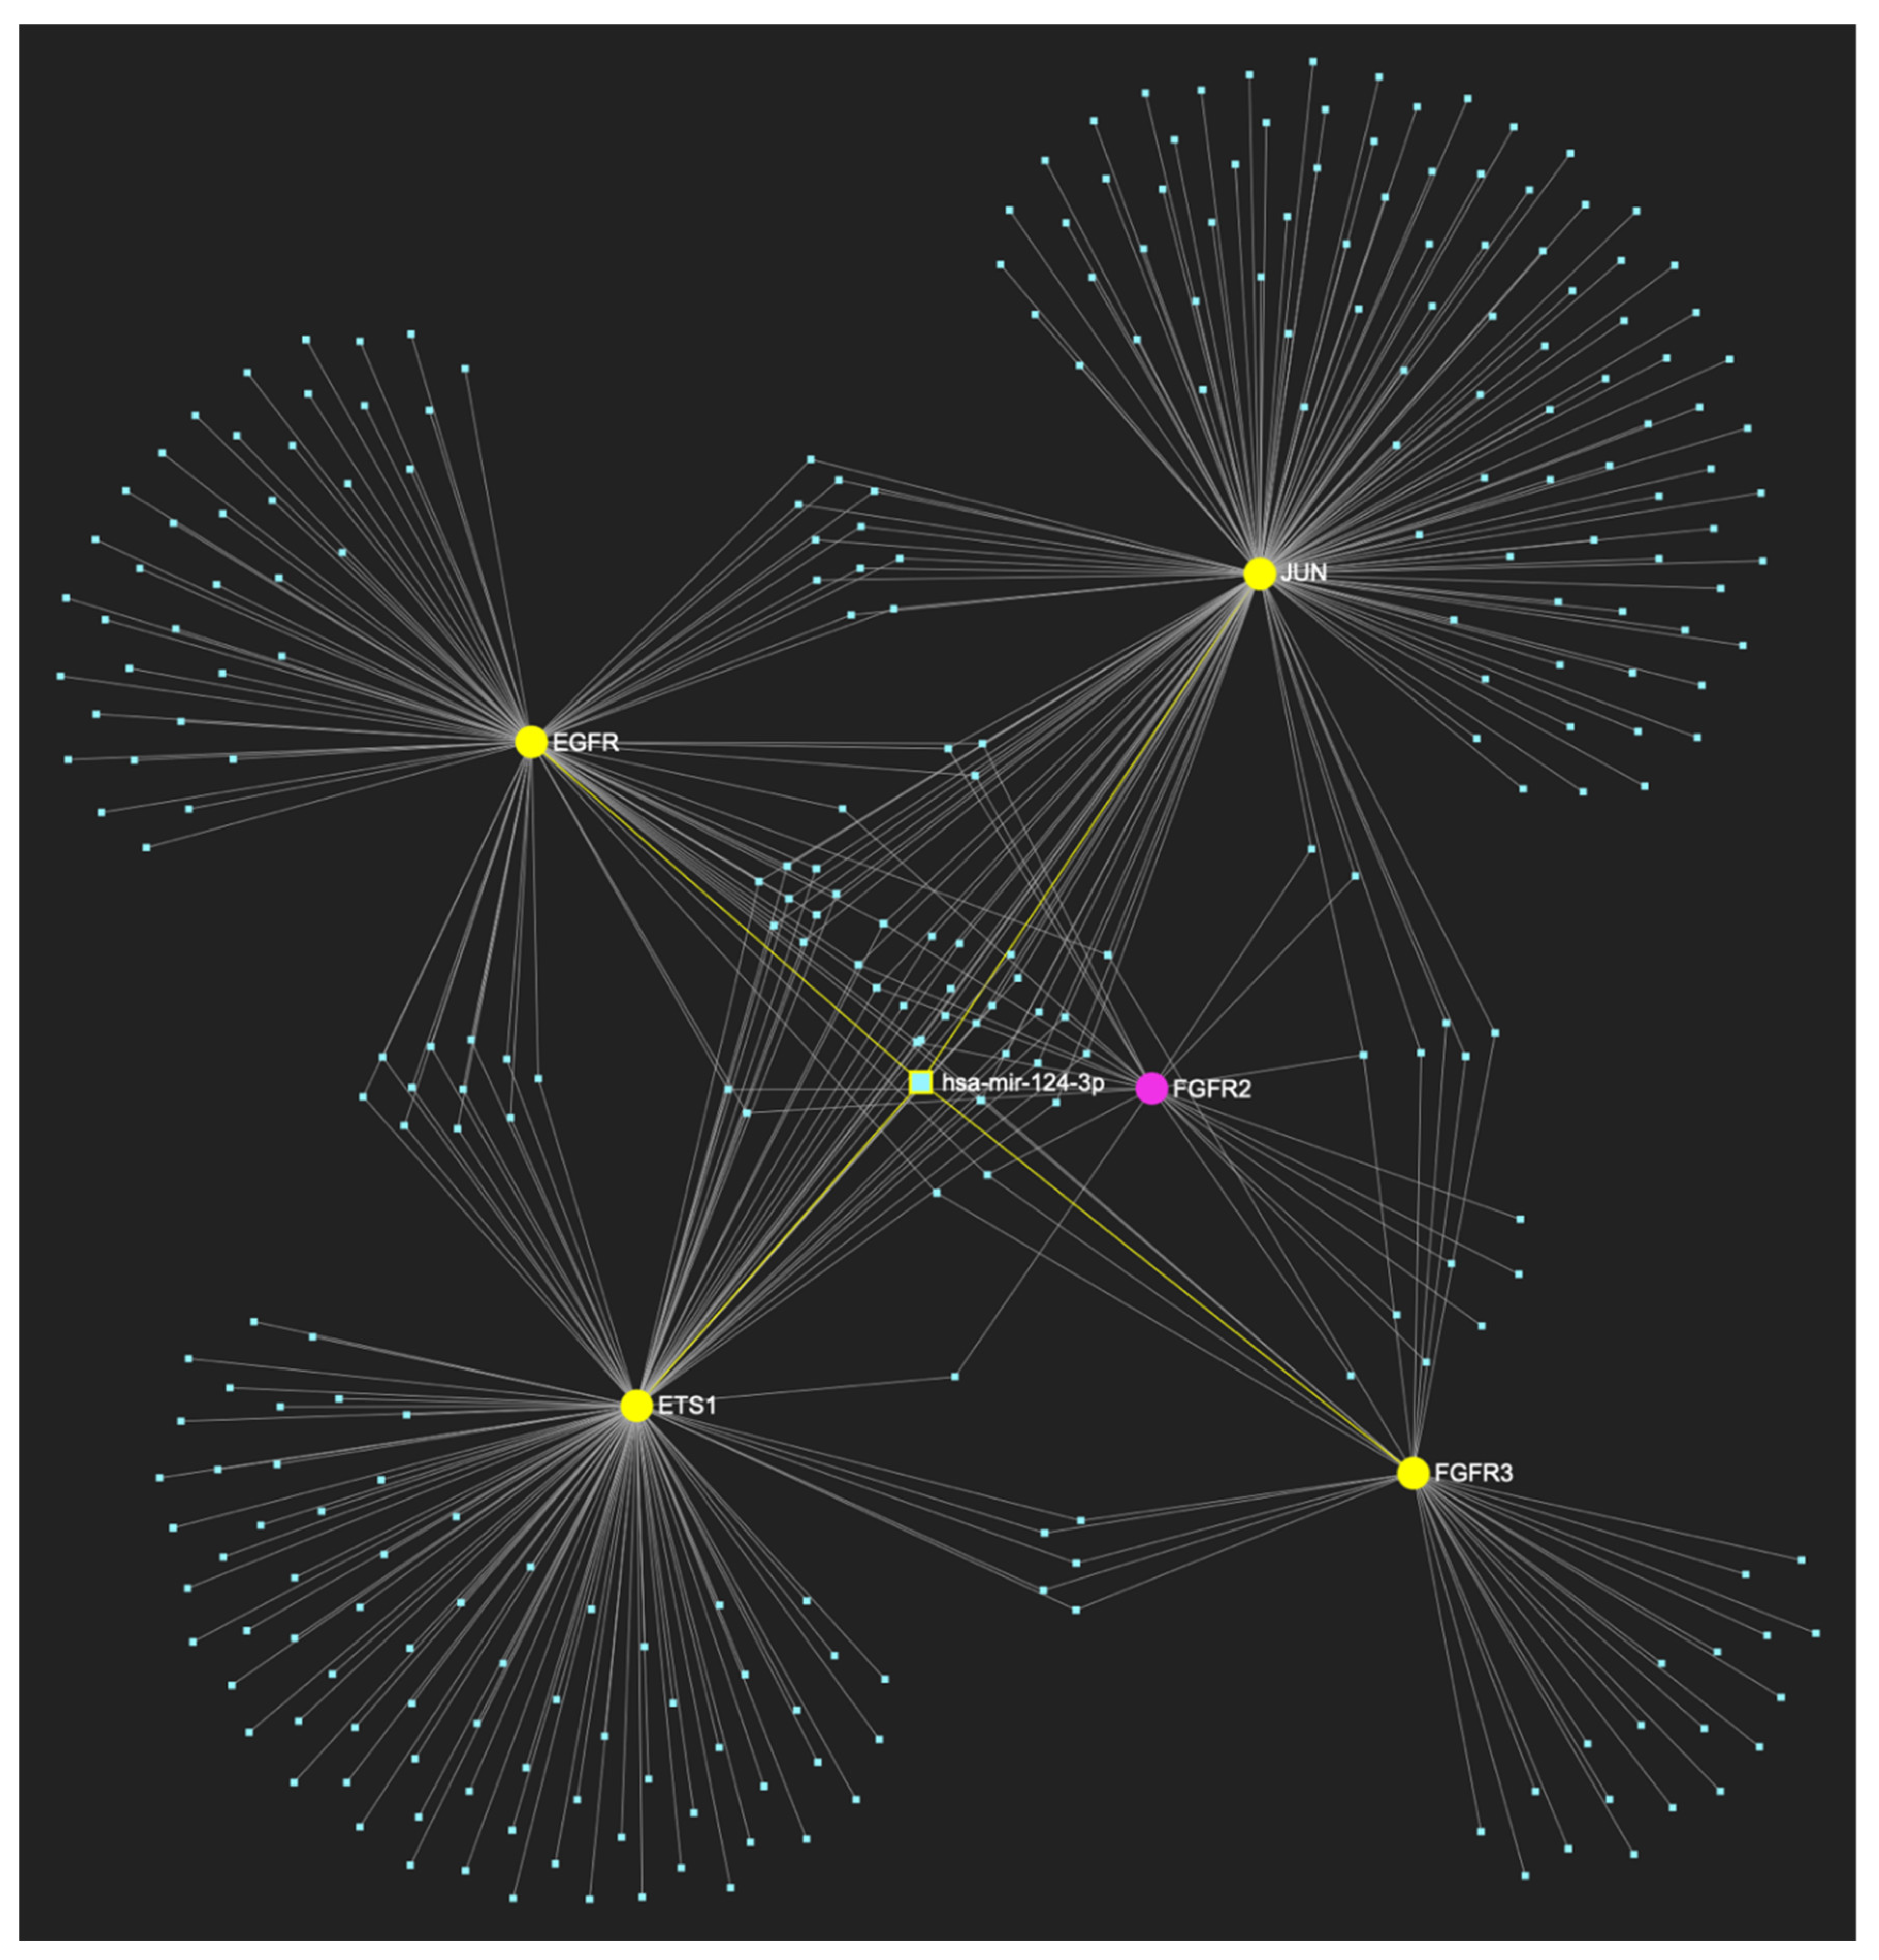
MiR-124-3p, which exhibits a significant decrease in OSCC, is predicted to simultaneously target and possibly regulate the expression of 4 (EGFR, FGFR3, ETS1 and JUN) out of 5 genes comprising the upregulated gene panel established for the initial cancerous stage of early invasion, according to the hamster model of sequential οral oncogenesis, demonstrating a “Target Score” of 80%. The yellow graphic elements depict the genes that are specifically targeted by miR-124-3p, along with their pertaining connecting nodes. The pink elements illustrate the genes that are not targeted by this particular miRNA, while the light blue dots across the illustration represent the remaining miRNA molecules that are expected to target at least one gene in this network.
Figure 15.
MiR-125b-5p, the levels of which are characteristically decreased in OSCC, is predicted to simultaneously target and possibly regulate the expression of 4 (EGFR, FGFR2, ETS1 and JUN) out of 5 genes that make up the upregulated gene panel developed for the initial malignant stage of early invasion, according to the hamster model of sequential οral oncogenesis, suggesting a Target Score of 80%. The yellow graphic elements depict the genes that are specifically targeted by miR-125b-5p, along with their pertaining connecting nodes. The pink elements illustrate the genes that are not targeted by this particular miRNA, while the light blue dots across the illustration represent the remaining miRNA molecules that are expected to target at least one gene in this network.
Figure 16.
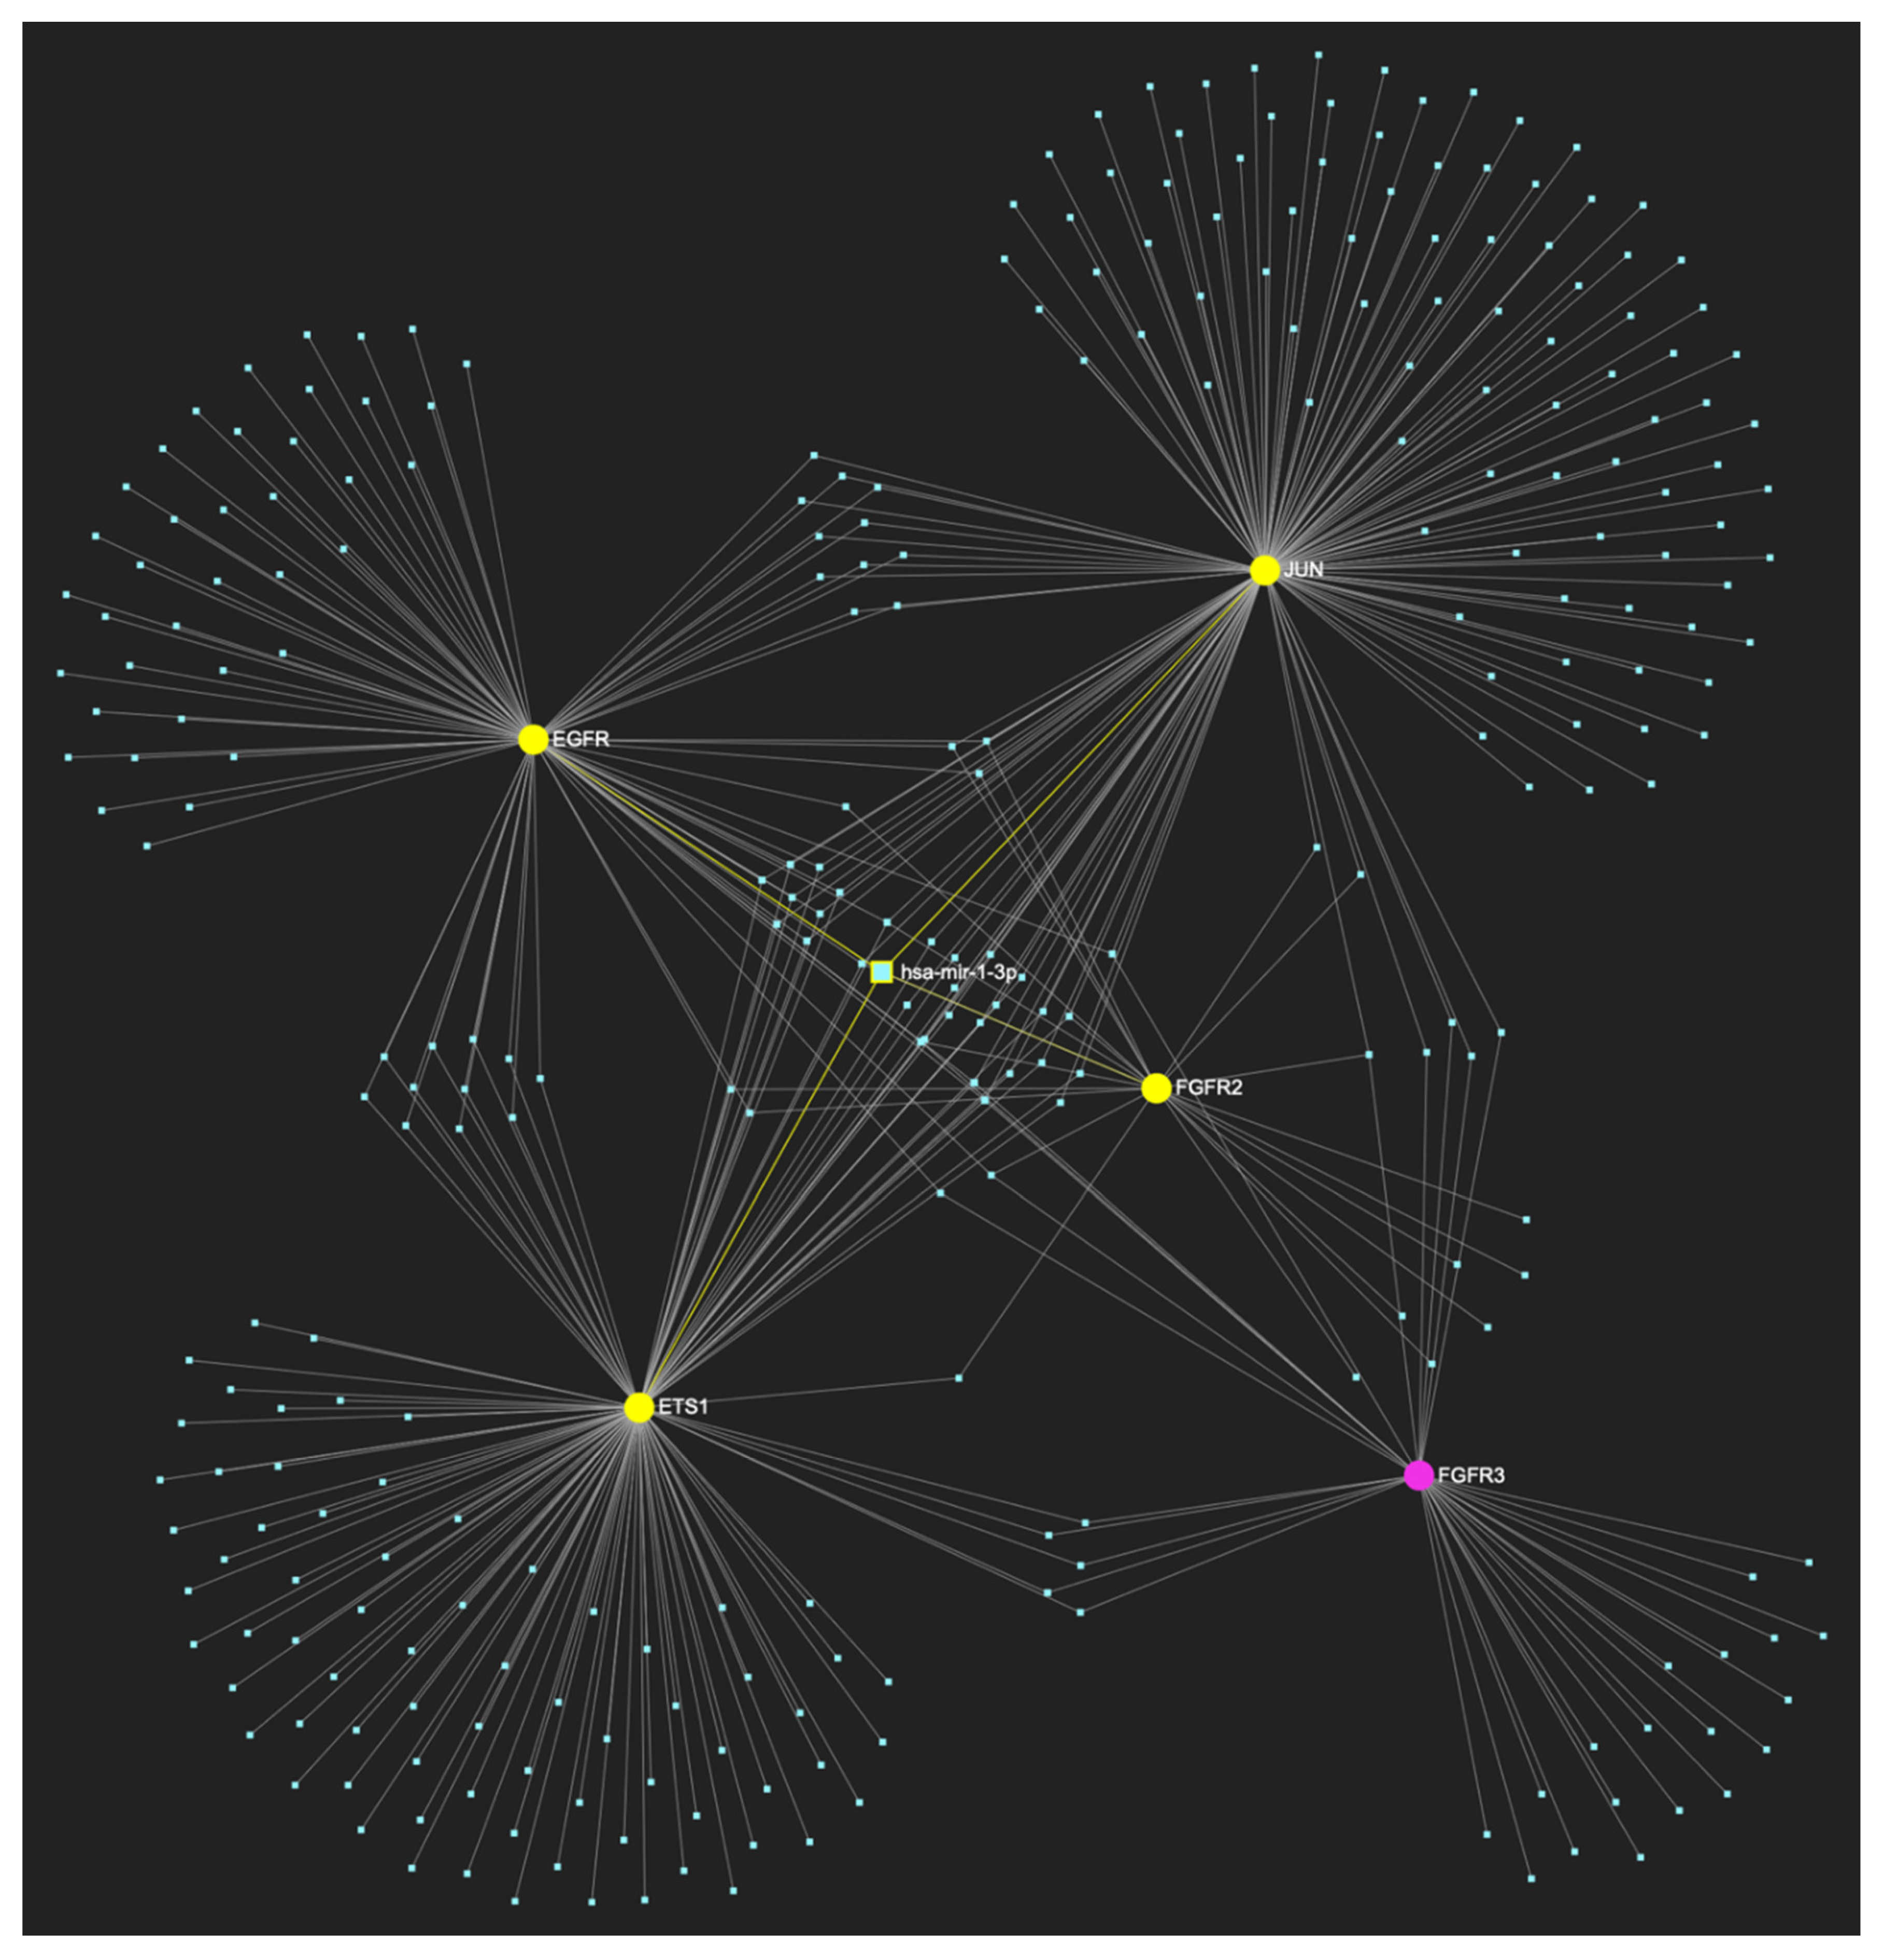
MiR-1-3p, which is significantly underexpressed in OSCC, is expected to target and potentially control the expression of 4 (EGFR, FGFR2, ETS1 and JUN) out of 5 genes that make up the upregulated gene panel developed for the initial malignant stage of early invasion, according to the hamster model of sequential οral oncogenesis, signifying a Target Score of 80%. The yellow graphic elements depict the genes that are specifically targeted by miR-1-3p, along with their pertaining connecting nodes. The pink elements illustrate the genes that are not targeted by this particular miRNA, while the light blue dots across the illustration represent the remaining miRNA molecules that are expected to target at least one gene in this network.
Figure 17.
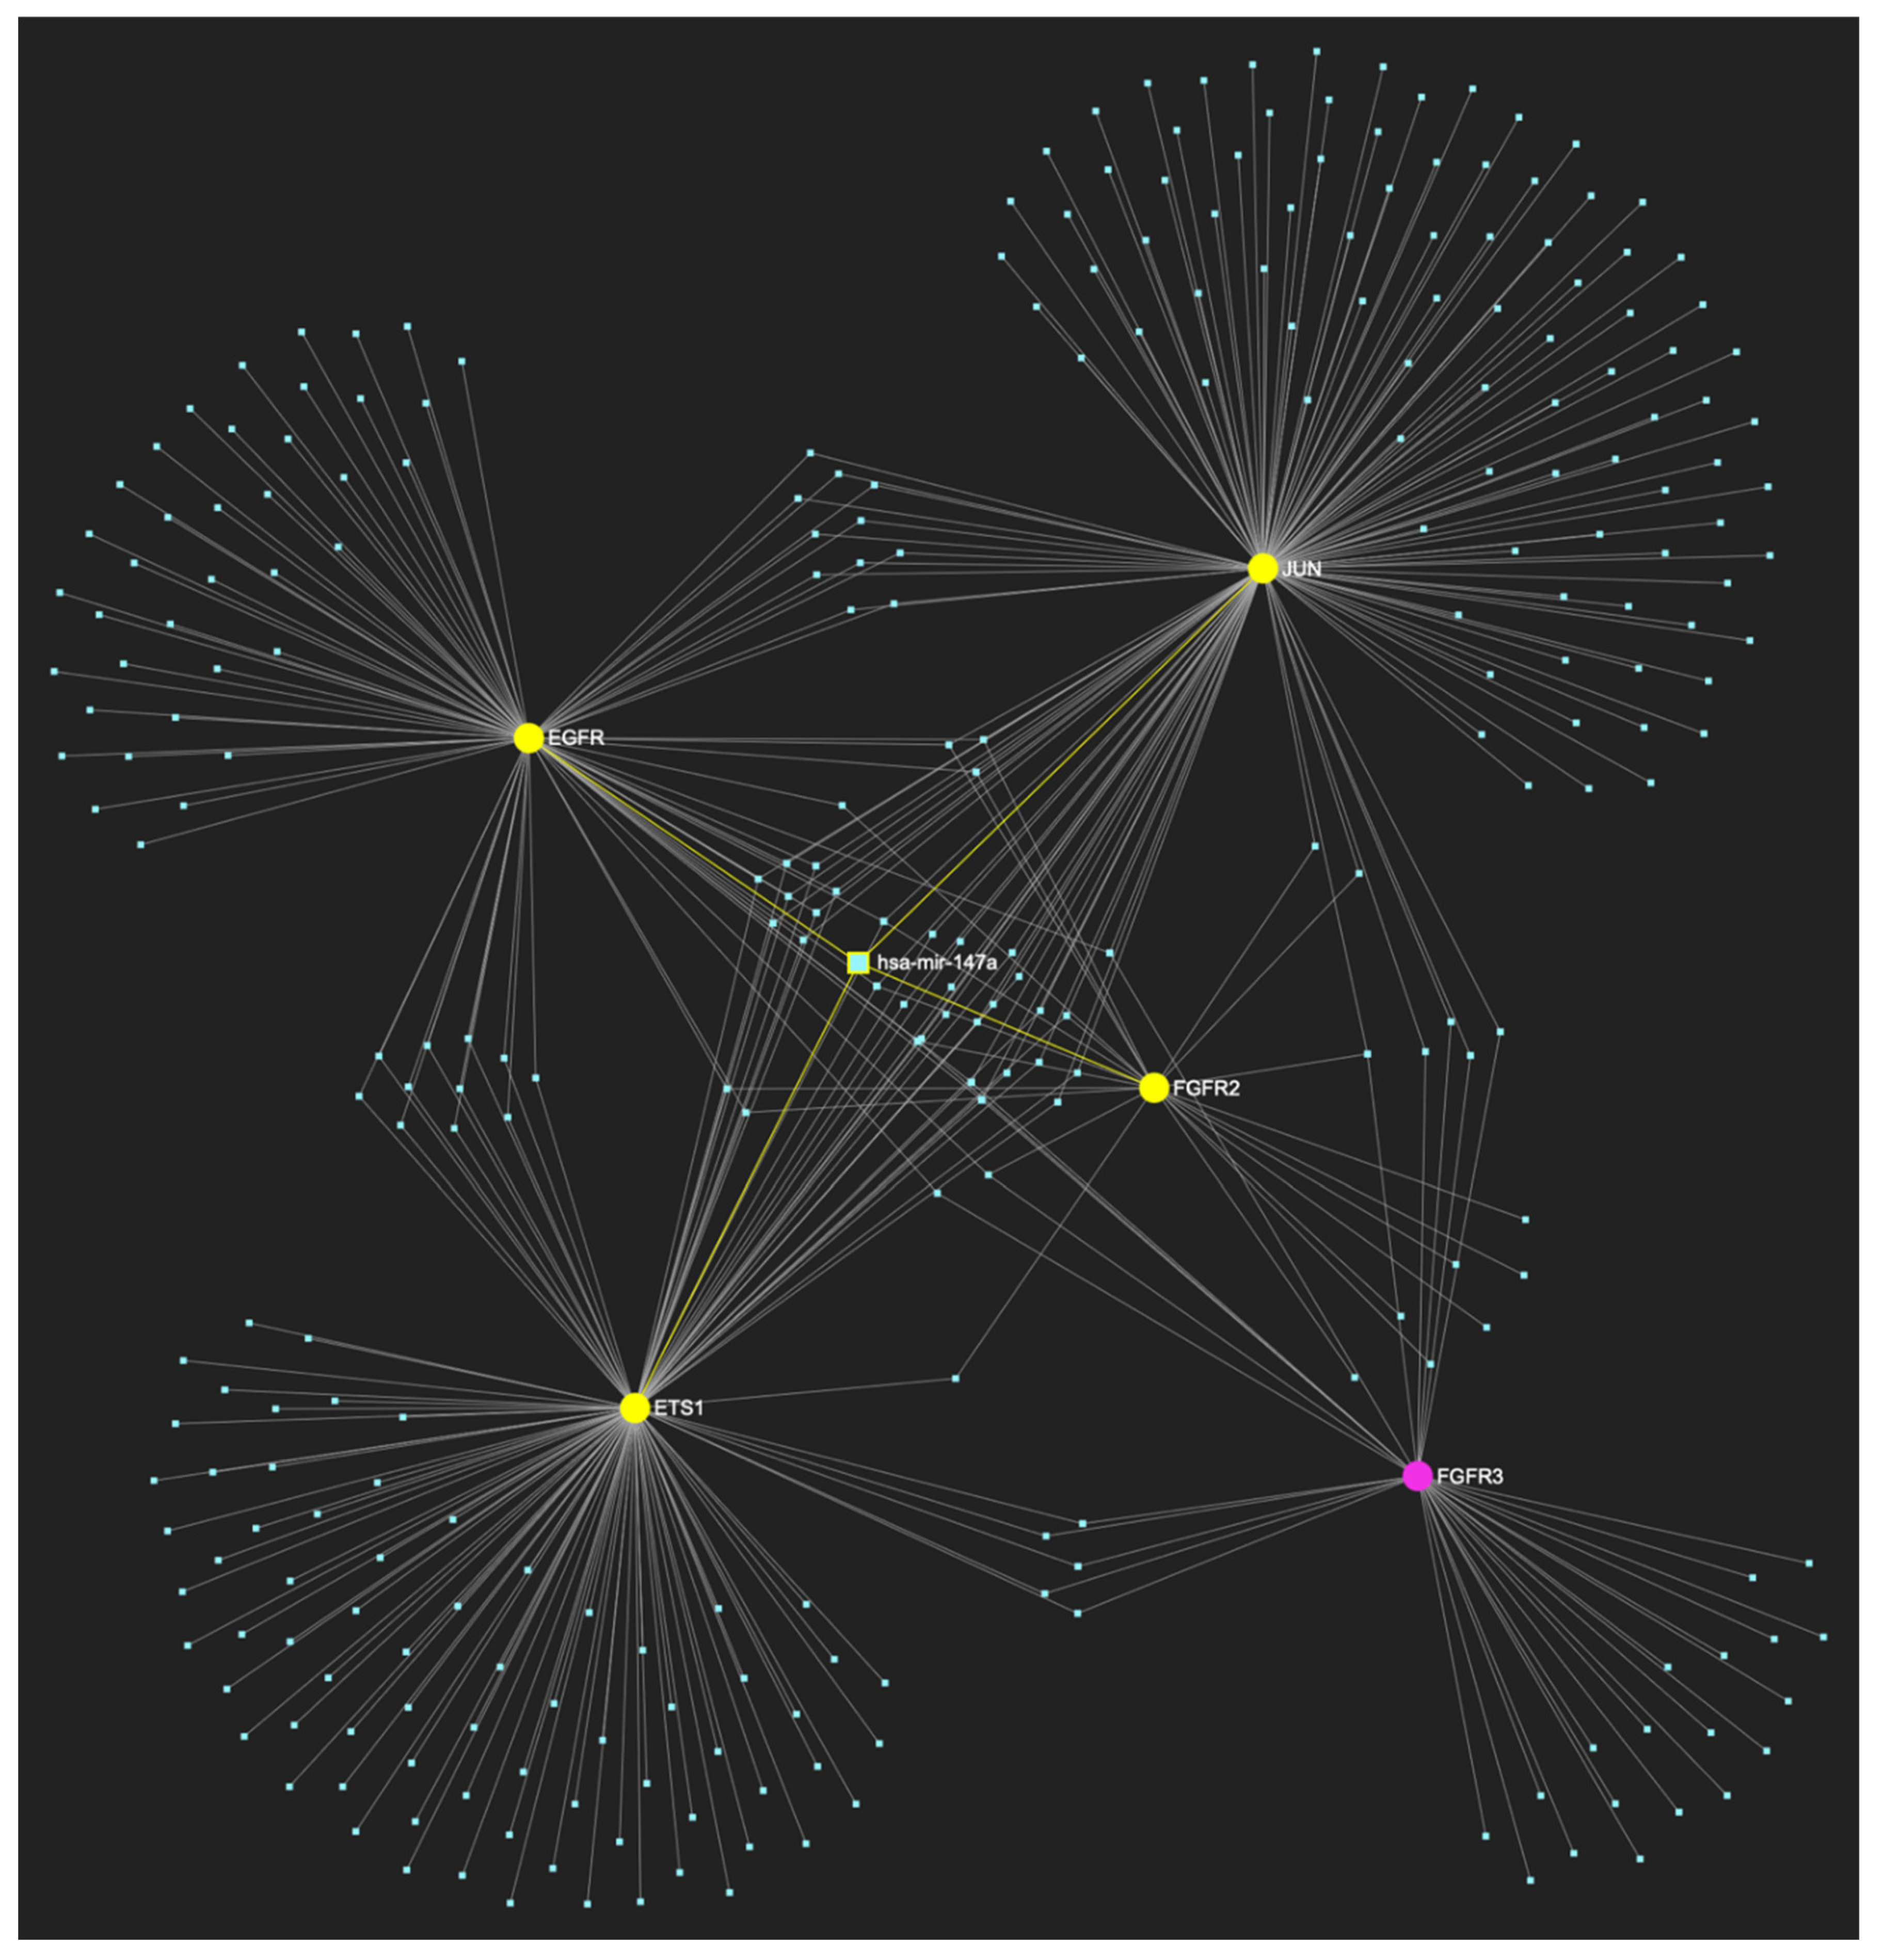
MiR-147a, which is boldly reduced in OSCC, is expected to target and possibly regulate the expression of 4 (EGFR, FGFR2, ETS1 and JUN) out of 5 genes comprising the upregulated gene panel established for the initial malignant stage of early invasion, according to the hamster model of sequential οral oncogenesisOncogenesis, indicating a “Target Score” of 80%. The yellow graphic elements depict the genes that are specifically targeted by miR-147a, along with their pertaining connecting nodes. The pink elements illustrate the genes that are not targeted by this particular miRNA, while the light blue dots across the illustration represent the remaining miRNA molecules that are expected to target at least one gene in this network.
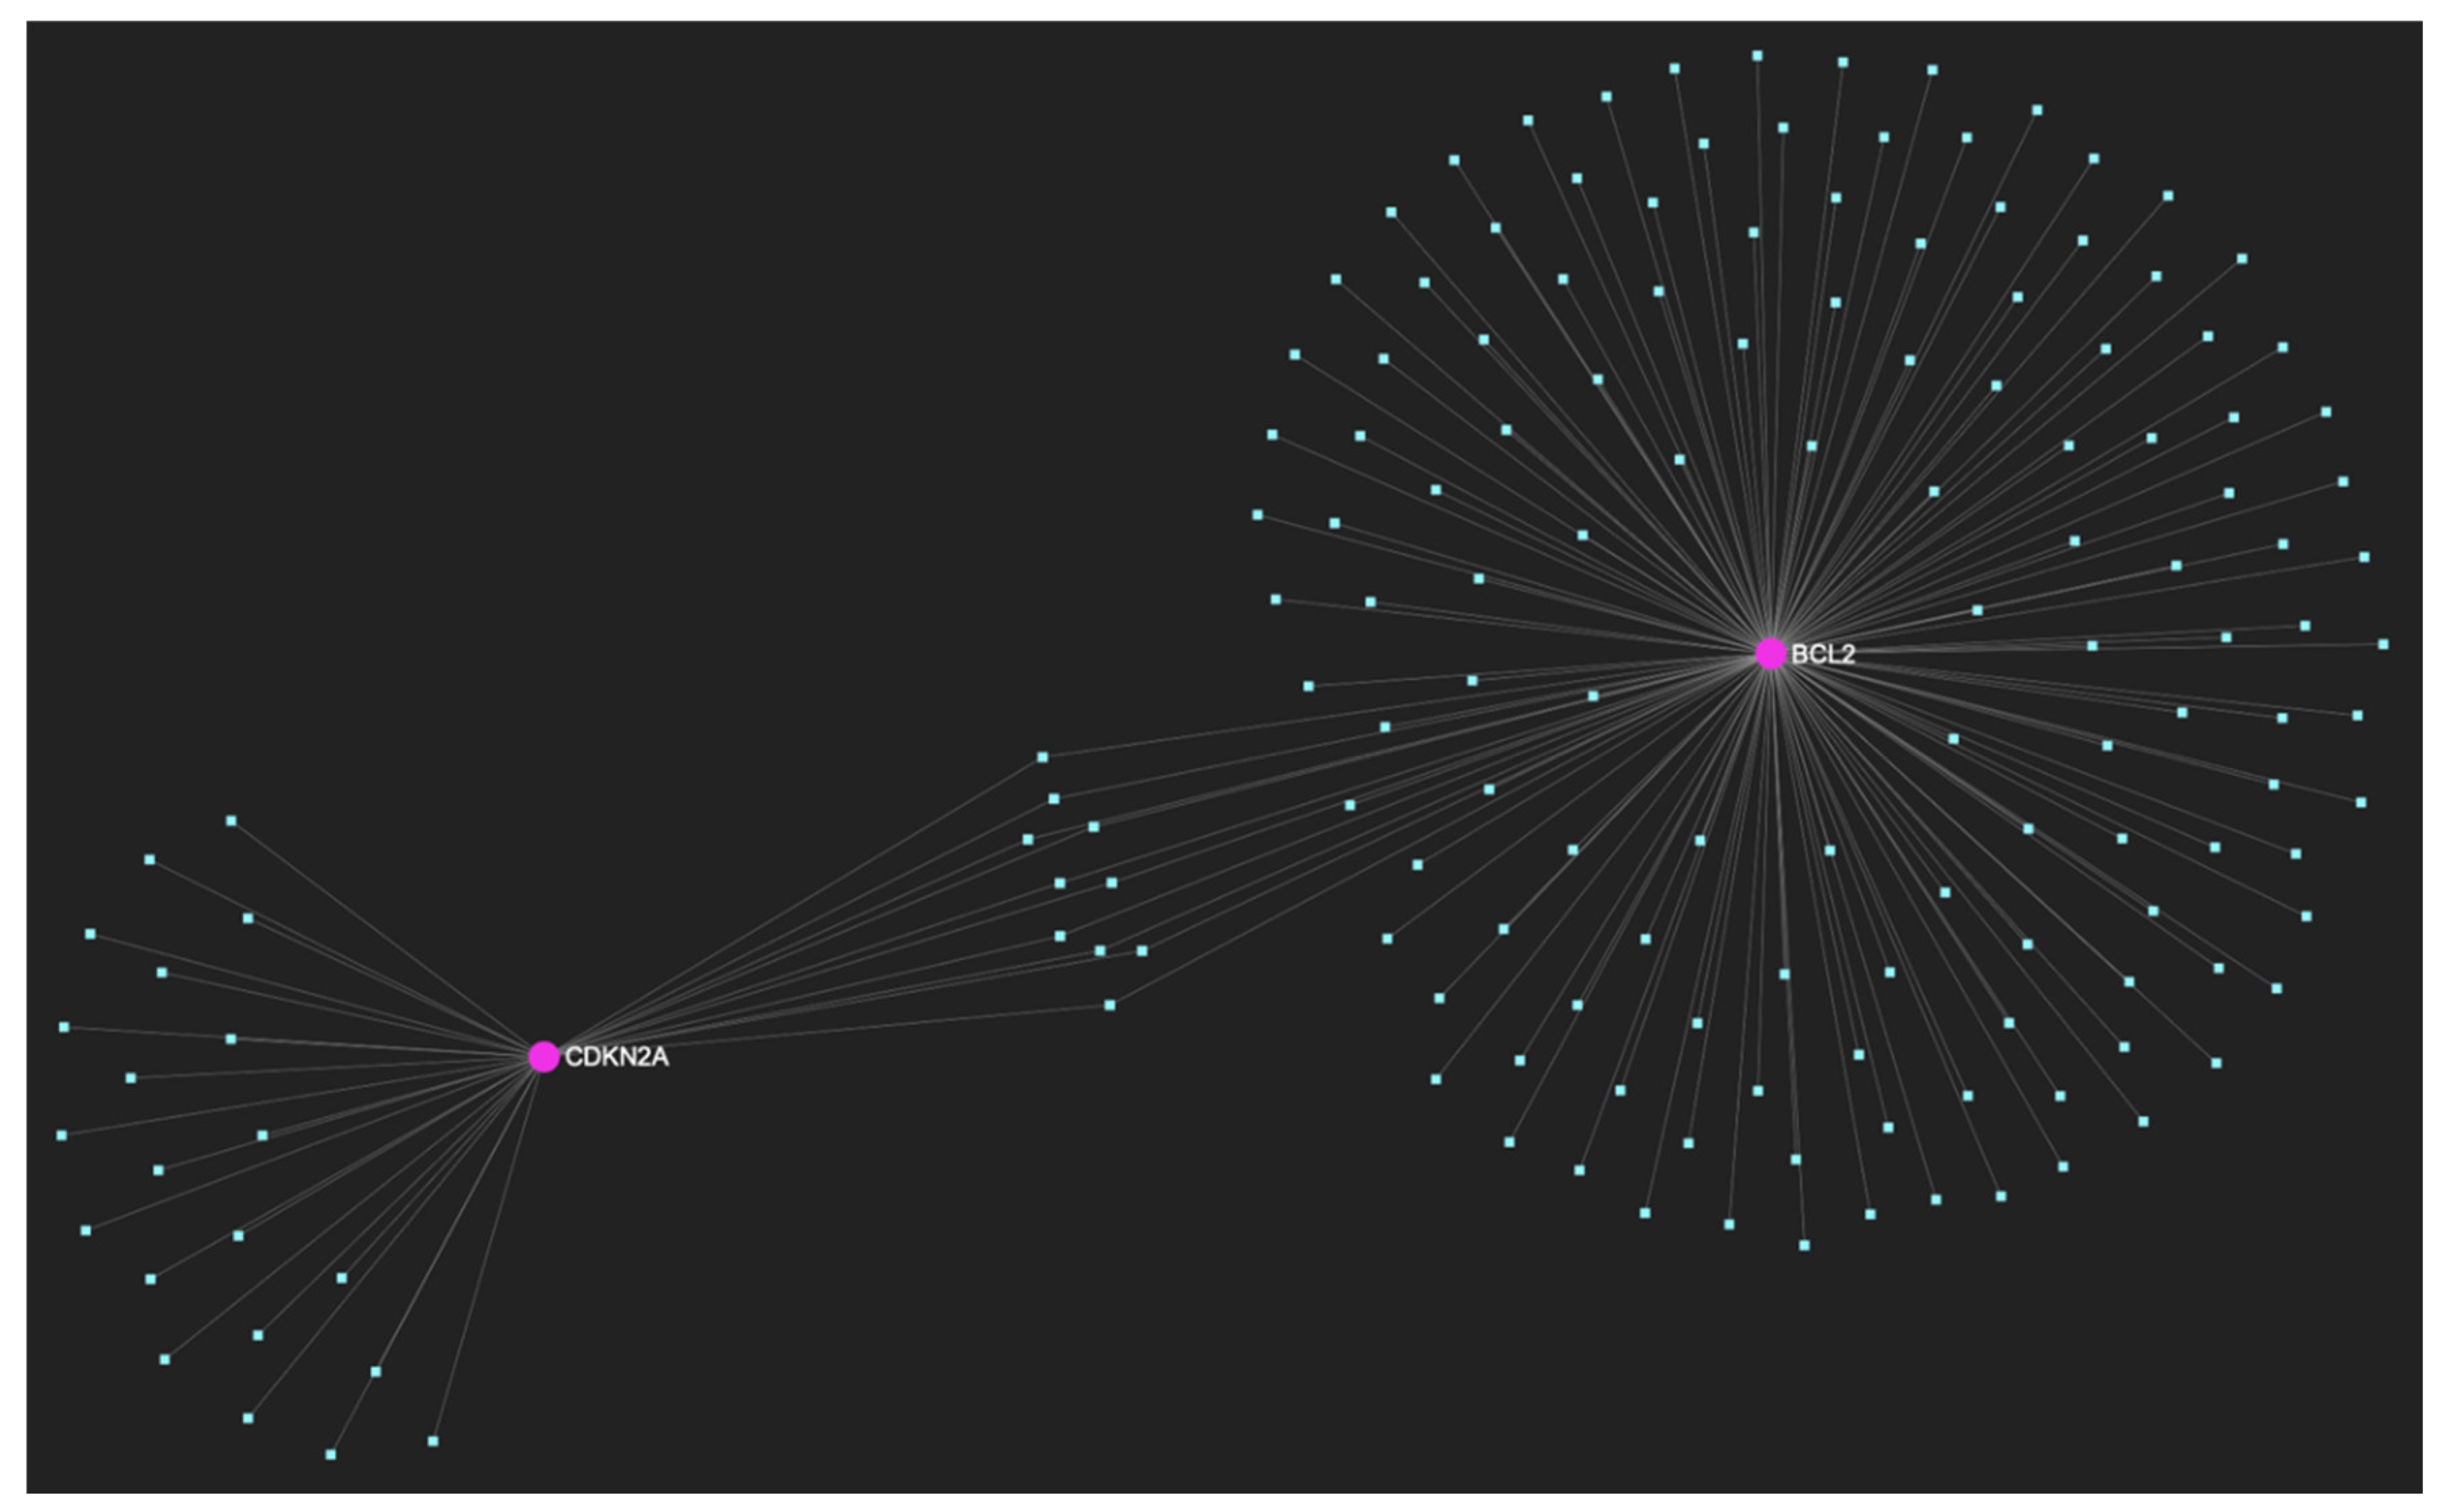
Figure 18.
The miRNA/target interaction network, demonstrates the 159 miRNA molecules that are predicted to target and possibly regulate at least one of the 2 genes (CDKN2A and BCL2) encompassing the downregulated gene panel developed for the initial malignant stage of early invasion, according to the genomic data acquired by the hamster model of sequential οral oncogenesis. The pink graphic elements illustrate the genes that comprise the panel, while the light blue dots across the illustration represent the miRNA molecules that are expected to target at least one of them, and possibly regulate its post-transcriptional expression.
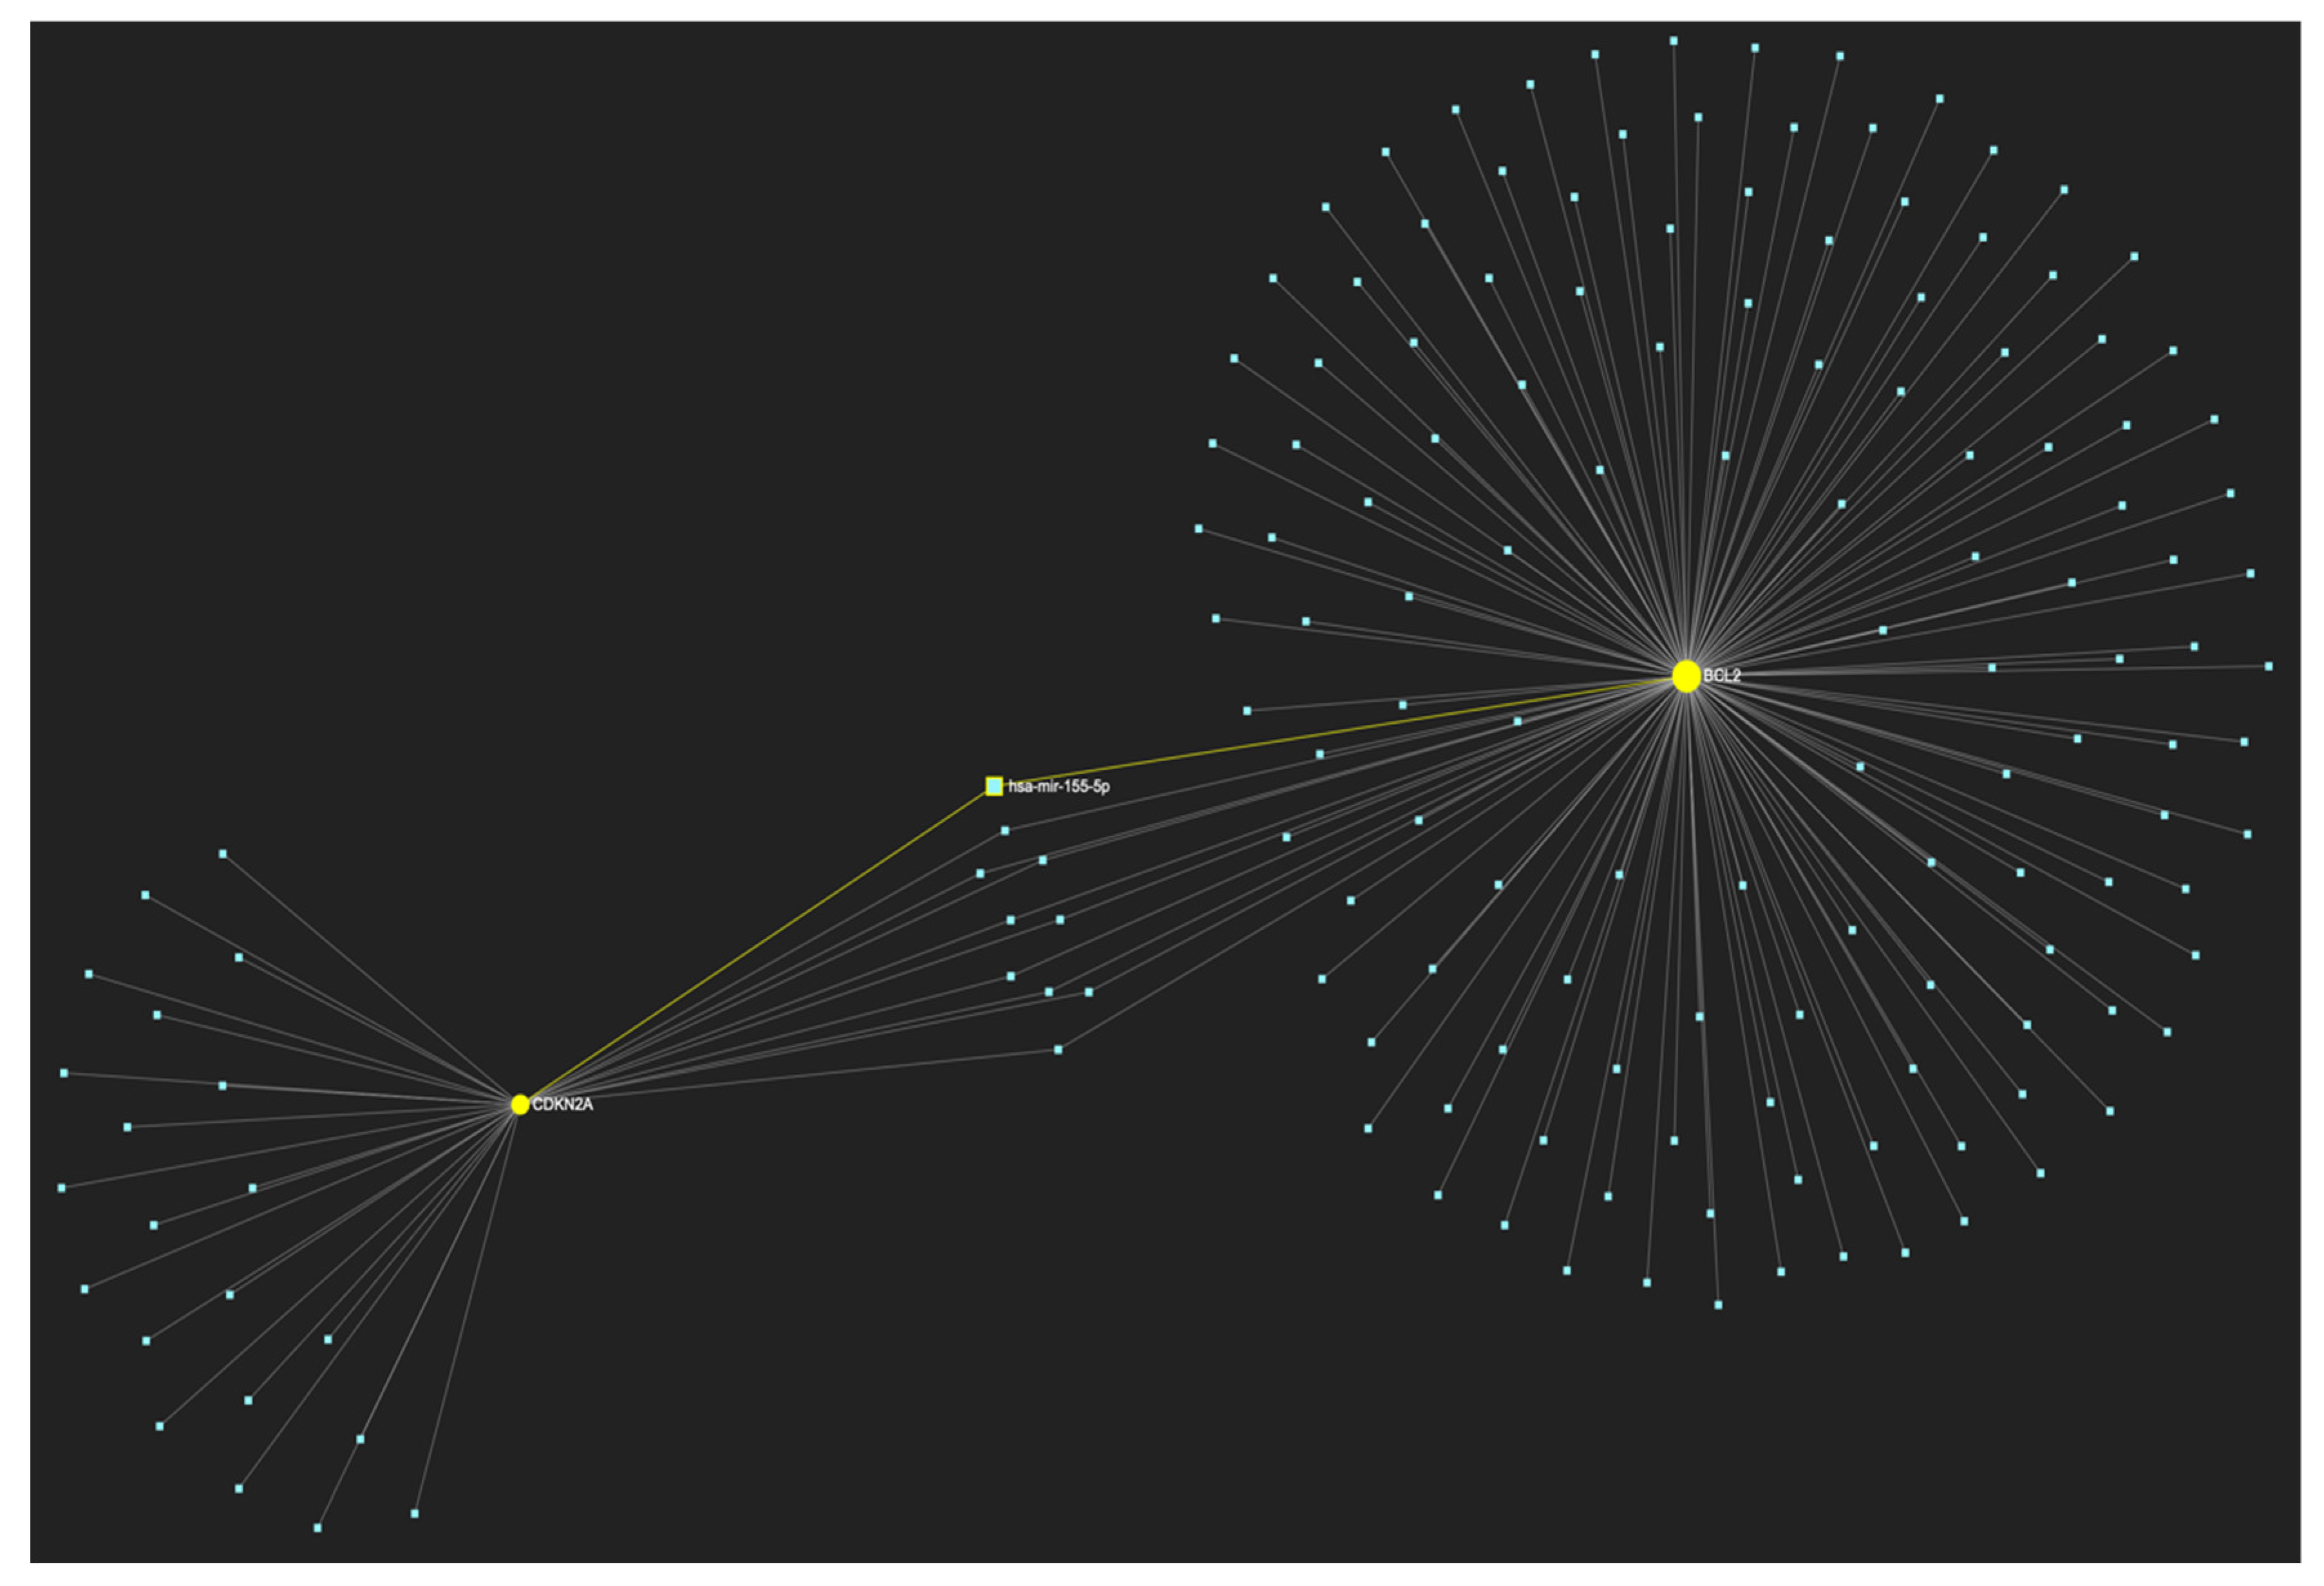
Figure 19.
MiR-155-5p, a molecule that has been extensively studied and found to be increased in OSCC, is expected to target and possibly regulate the expression of both CDKN2A and BCL2 genes (Target score: 100%), which exhibit significant downregulation during the stage of early invasion, according to the hamster model of sequential οral oncogenesisOncogenesis, and comprise our stage-specific upregulated gene panel developed for that particular stage. The yellow graphic elements depict the genes that are specifically targeted by miR-155-5p, along with their pertaining connecting nodes. The light blue dots across the illustration represent the remaining miRNA molecules that are expected to target at least one gene in this network.
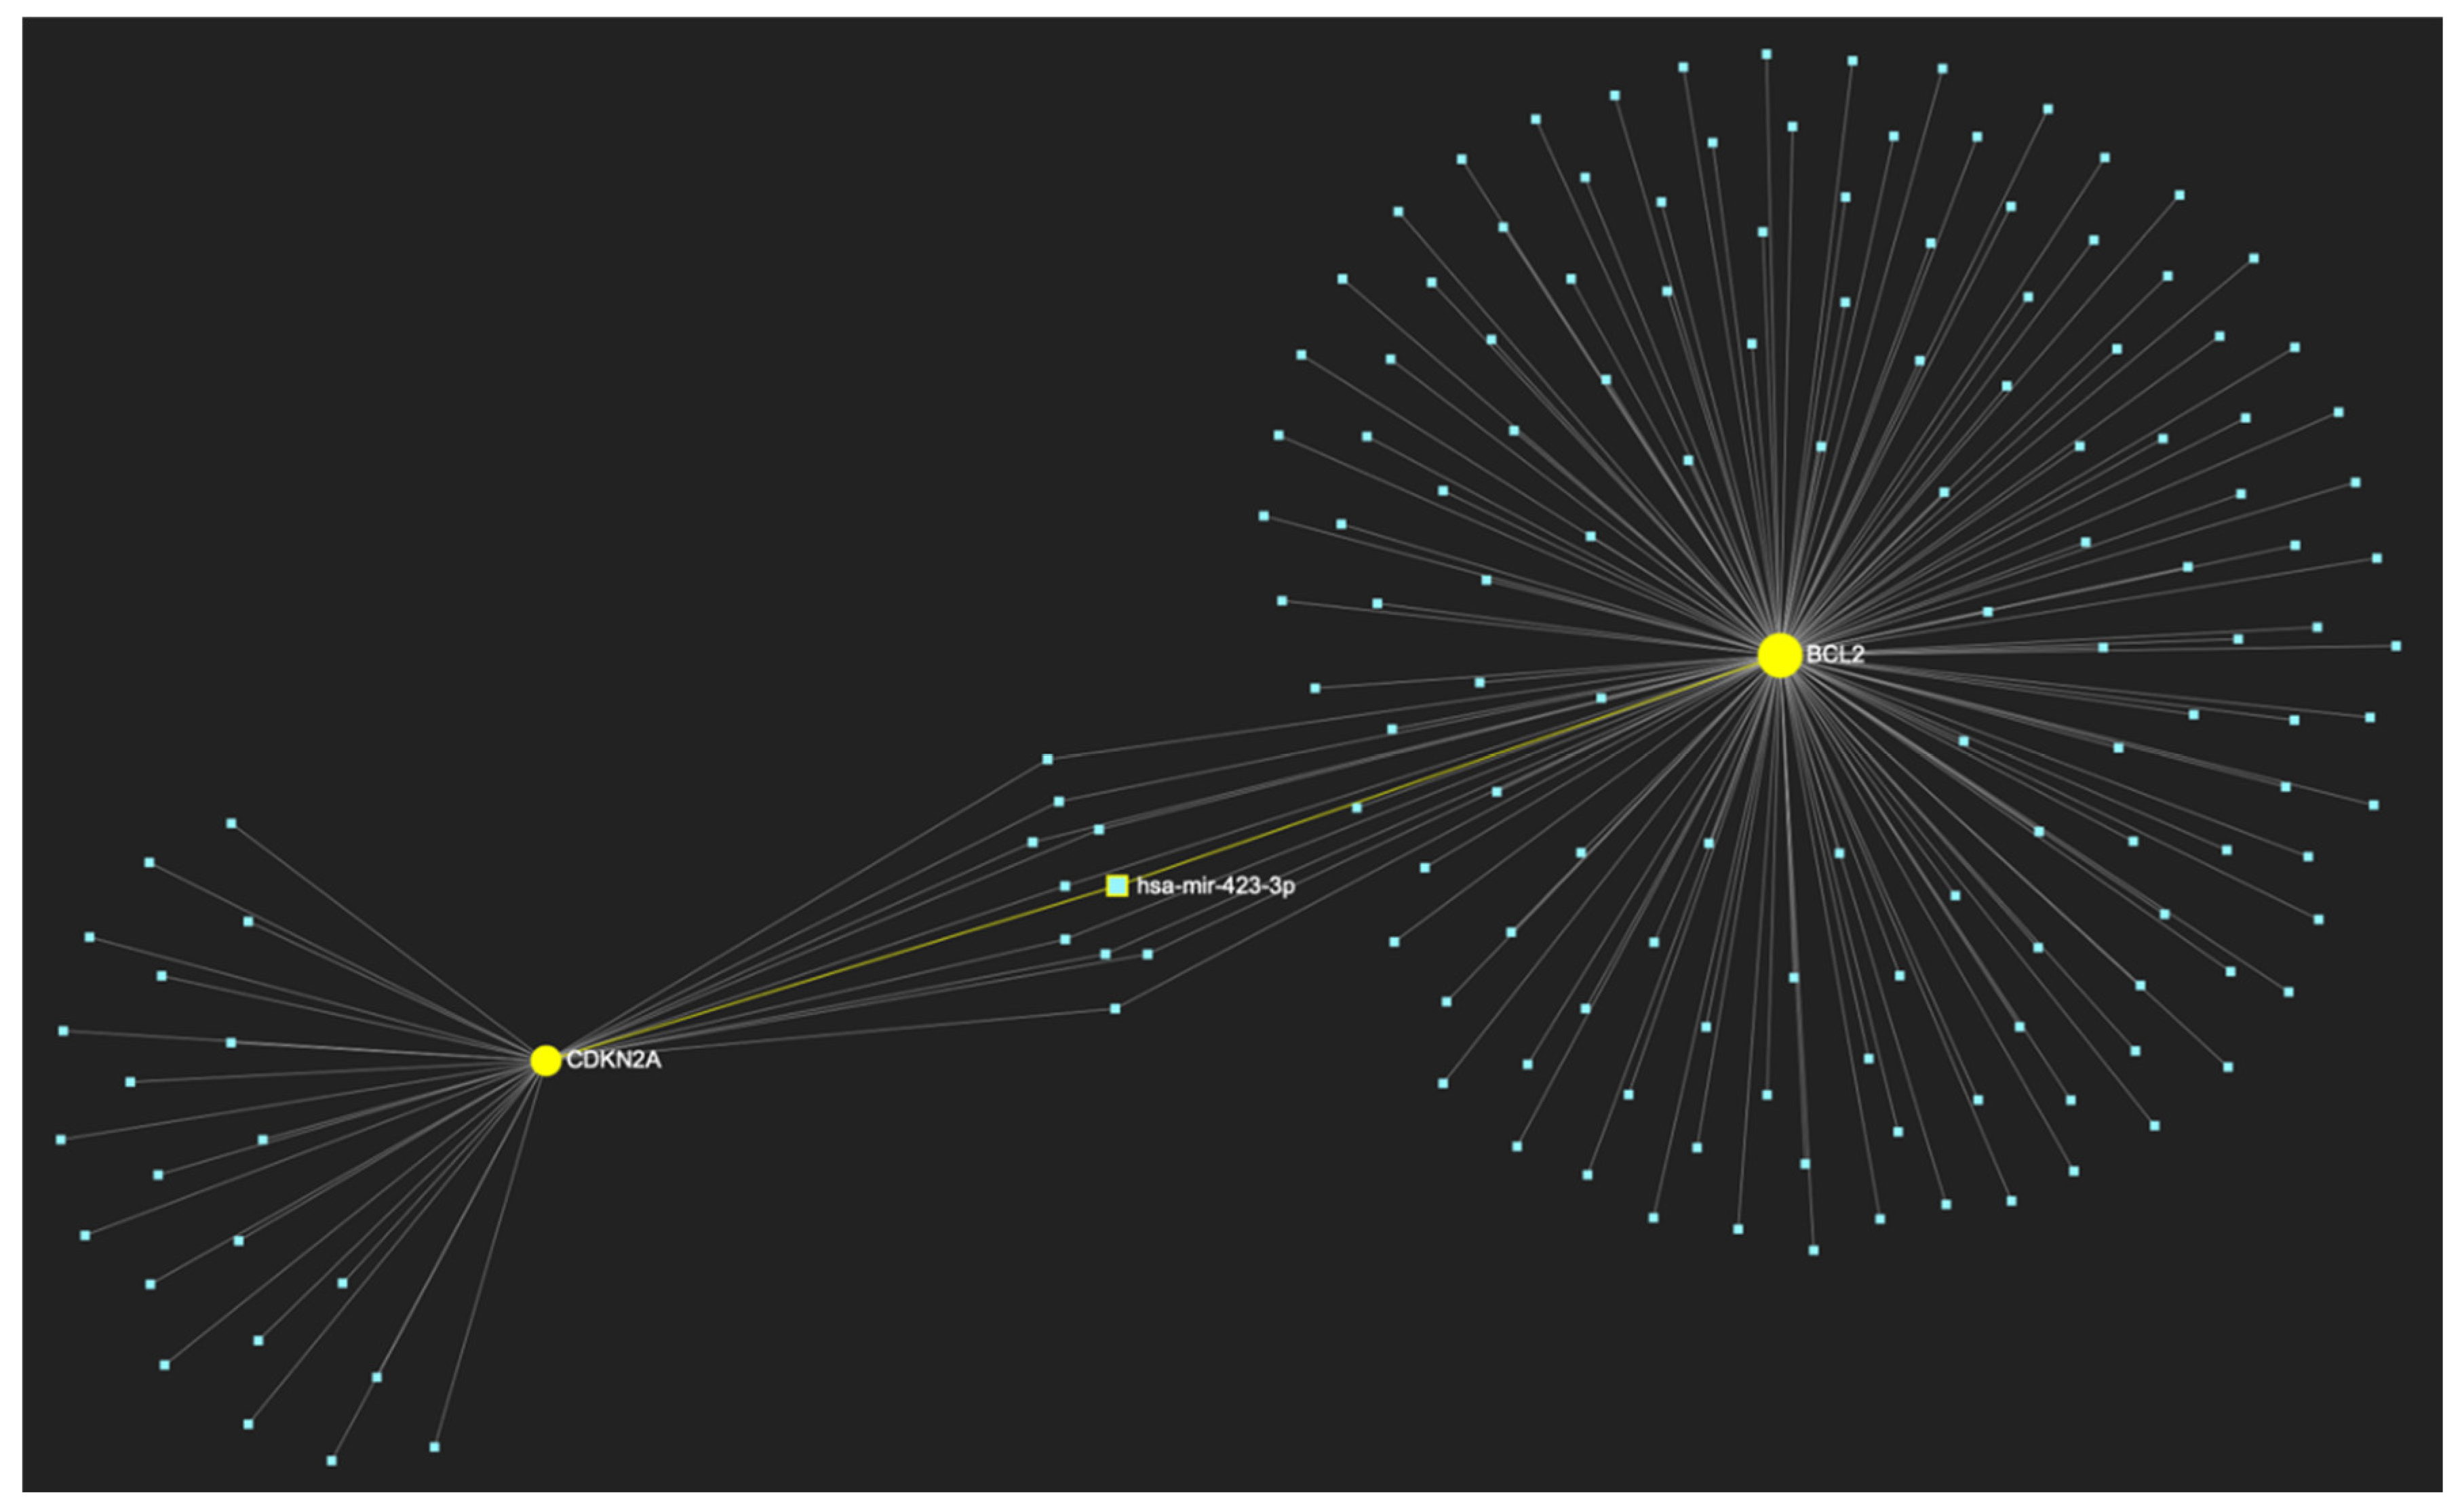
Figure 20.
MiR-423-3p, a molecule that has been reported to demonstrate significant upregulation in OSCC, is predicted to target and possibly regulate the expression of both CDKN2A and BCL2 genes (Target score: 100%), which exhibit significant downregulation during the stage of early invasion according to the hamster model of sequential οral oncogenesisOncogenesis. The yellow graphic elements illustrate the genes that are specifically targeted by miR-423-3p, along with their pertaining connecting nodes. The light blue dots across the illustration represent the remaining miRNA molecules that are expected to target at least one gene in this network.
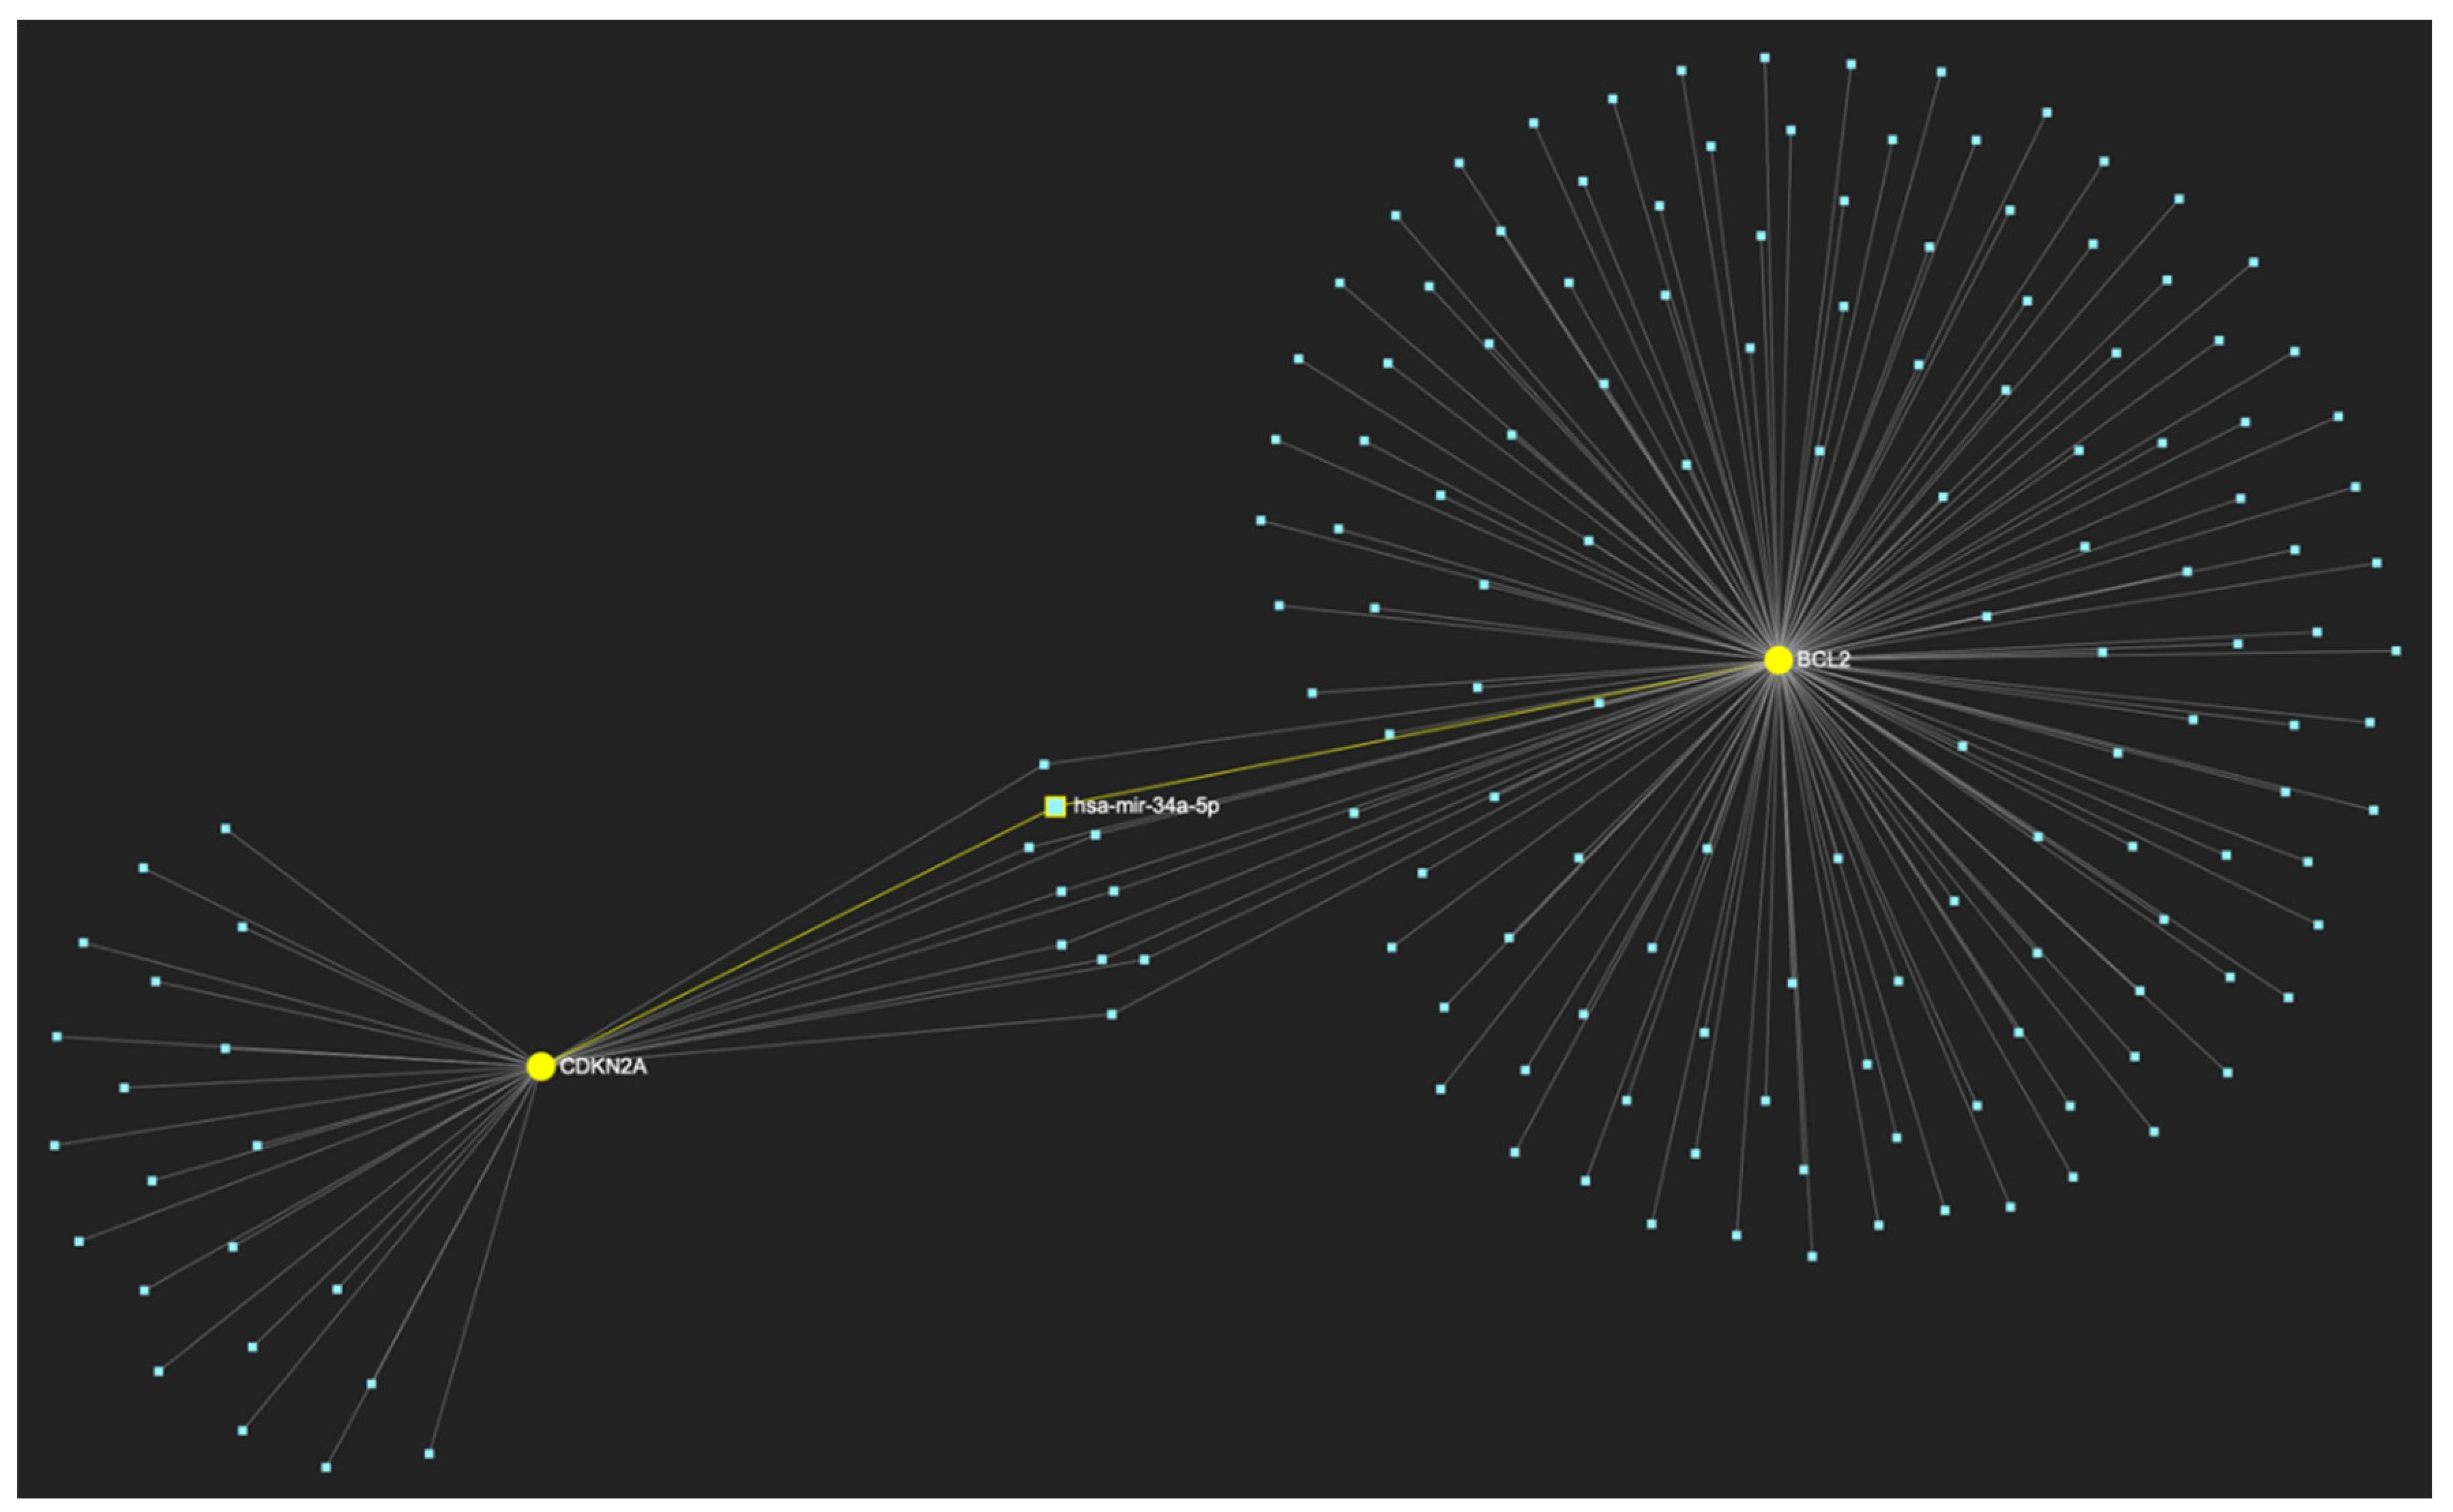
Figure 21.
MiR-34a-5p, which has been reported as overexpressed by a minimal number of studies, in contrast with the majority that portrays it as a significantly downregulated molecule in OSCC, is predicted to target and possibly regulate the expression of both CDKN2A and BCL2 genes (Target score: 100%), which exhibit significant downregulation during the stage of early invasion, according to the hamster model of sequential οral oncogenesisOncogenesis, and comprise our stage-specific upregulated gene panel developed for that particular stage. The yellow graphic elements depict the genes that are specifically targeted by miR-34a-5p, along with their pertaining connecting nodes. The light blue dots across the illustration represent the remaining miRNA molecules that are expected to target at least one gene in this network.
Figure 22.
Graphical illustration of the key miRNA molecules that are expected to govern each initial stage of OSCC tumorigenesis (hyperplasia, dysplasia, and early invasion of OSCC cells), as well as the overall malignancy, by exhibiting dysregulated expression patterns, as determined by our current and preceding research. The arrows next to each miRNA subset in each stage illustrate the kind of the expressional dysregulation of those molecules in OSCC-derived tissue and/or saliva specimens. The upward arrows depict the experimentally-verified significant overexpression of the respective molecules in those biospecimens, while the downward arrows represent their significant downregulation, compared to respective normal/control samples. The dysregulation of the illustrated molecules has been strongly associated with OSCC, among over 250 other miRNAs in the available literature. The revealing of their disease-specific and stage-specific roles, alongside their stability and feasible quantification in those accessible biological materials, highlights their potential as diagnostic biomarkers that can possibly depict the histological stage of oral mucosa in real-time. Their potential clinical utilization transcends the diagnosis of a suspicious oral lesion, but might also hold the key to presymptomatic detection of OSCC, during its earliest stages as a part of regular oral screening.
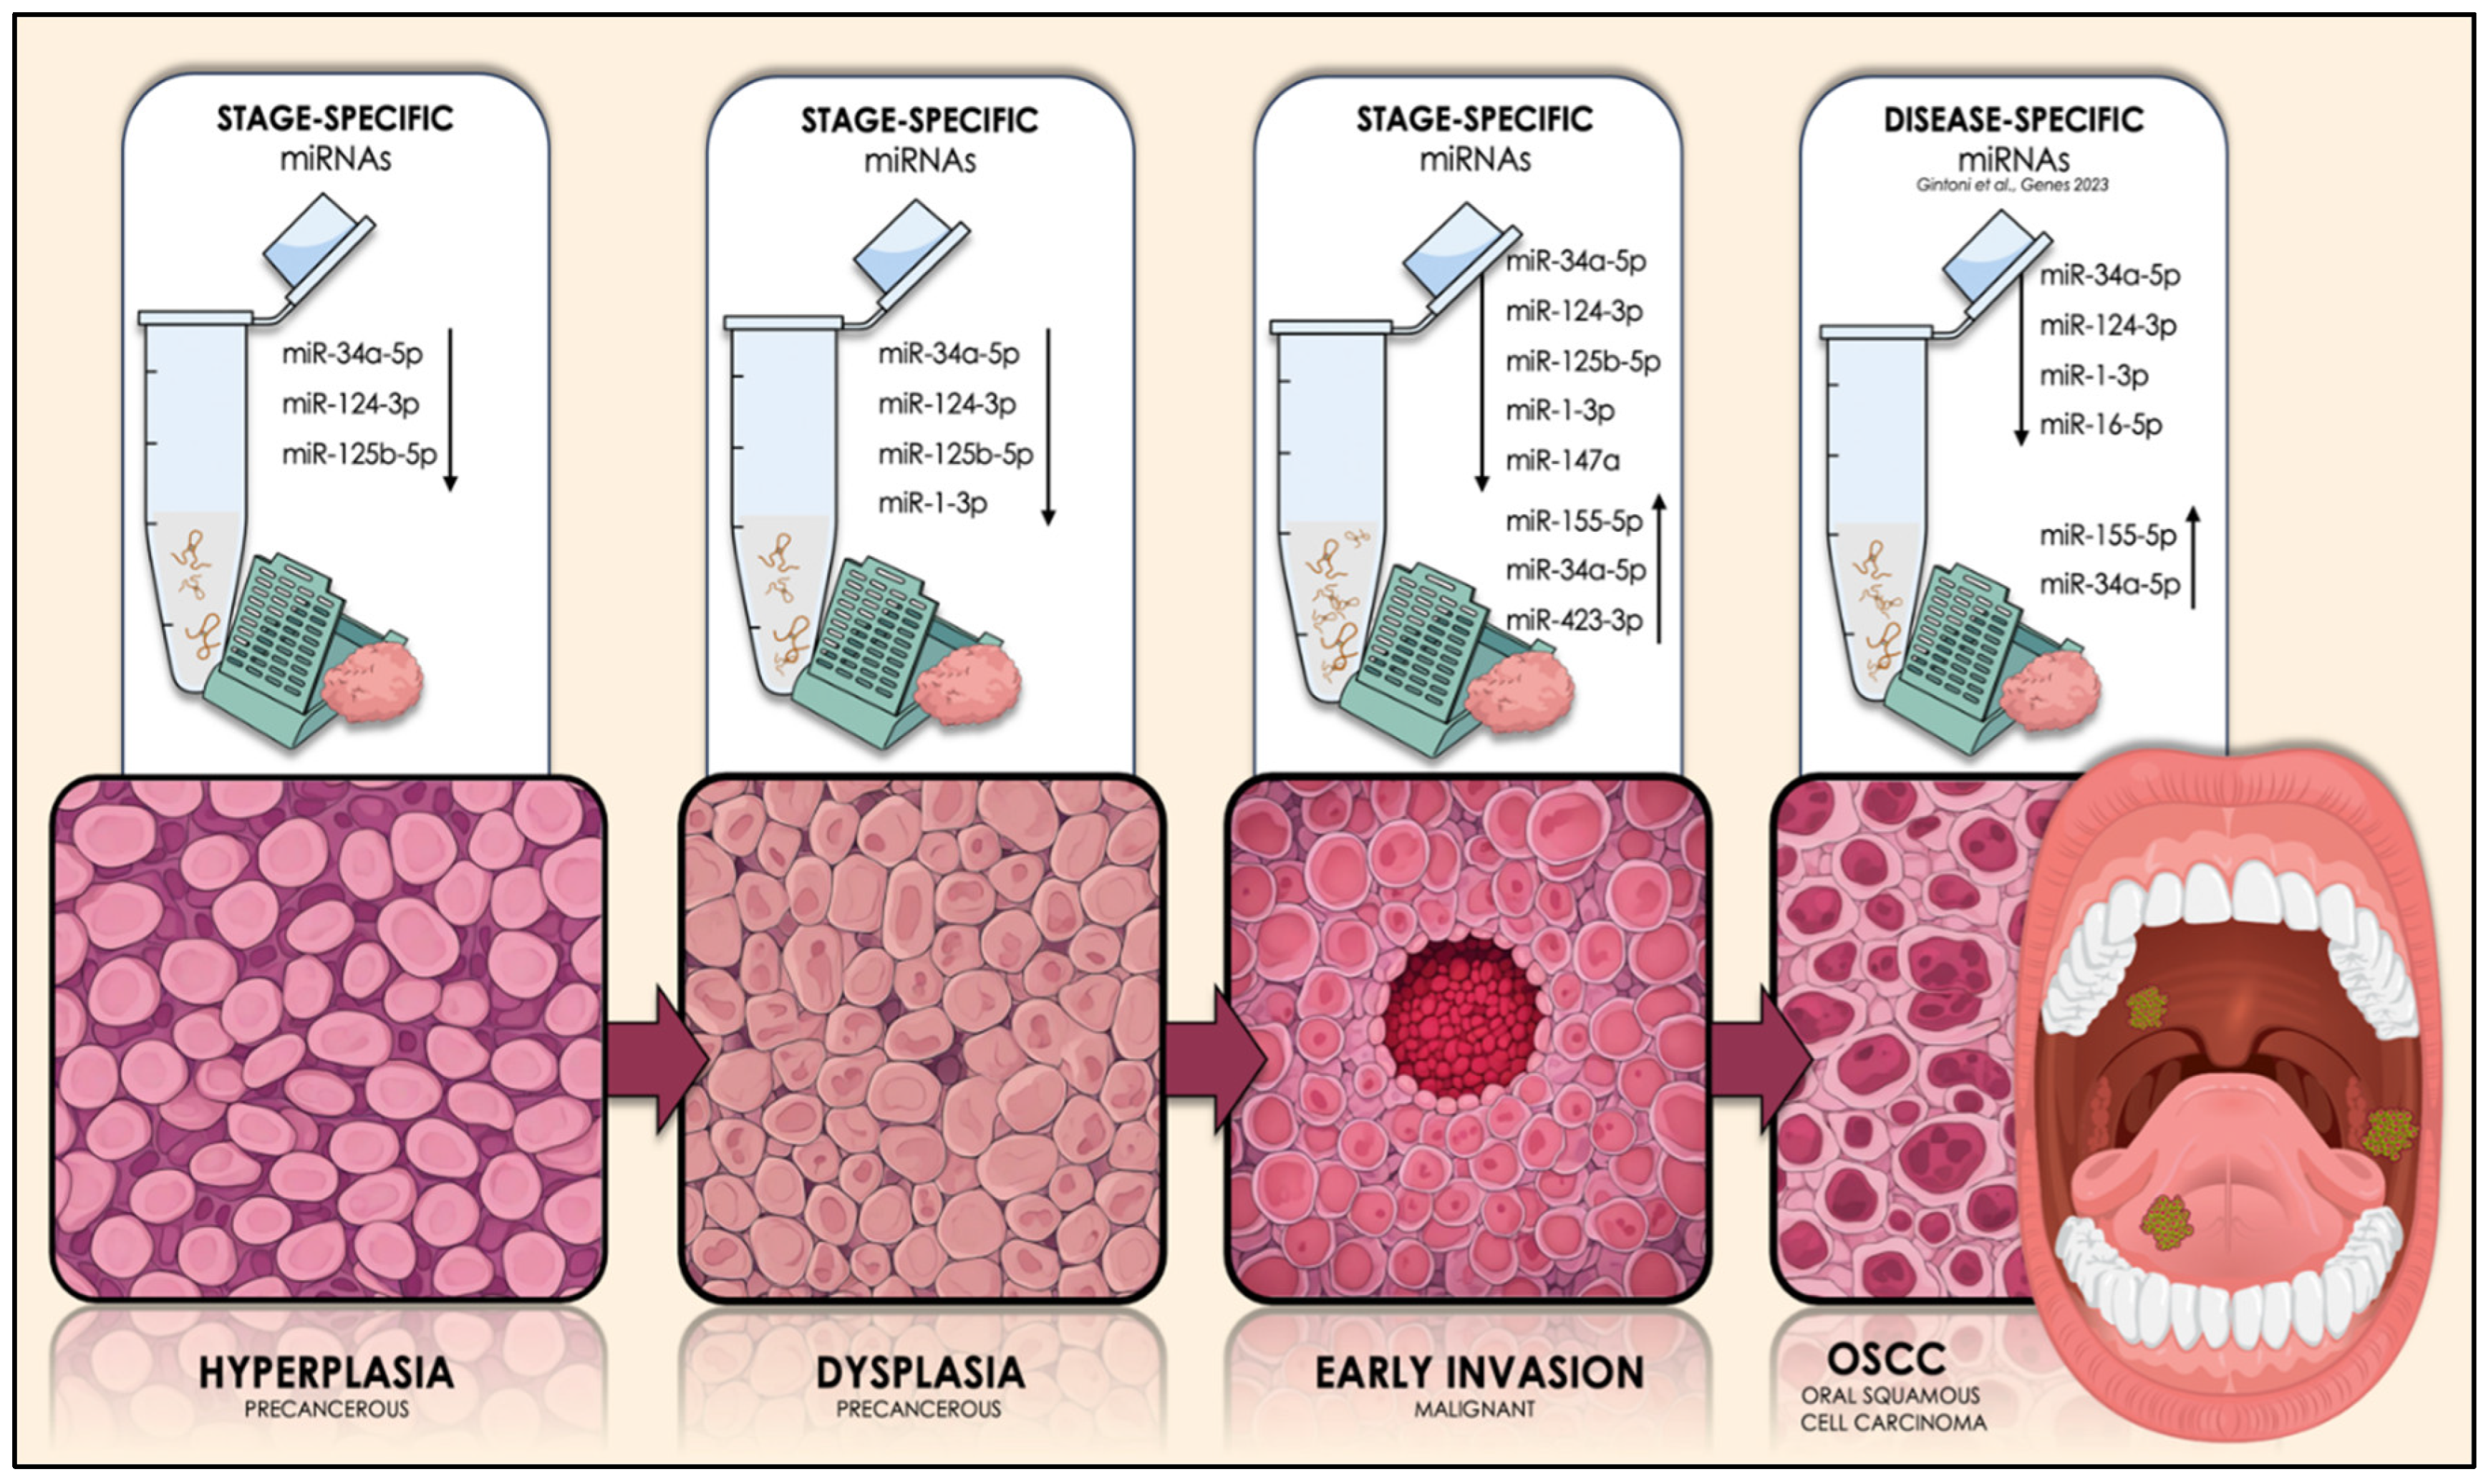
Table 1.
MiRNA molecules that have been experimentally documented to demonstrate significantly upregulated and downregulated expression levels in OSCC-derived tissue and/or saliva specimens, compared to normal respective biosamples and were included in the relevant literature that met the criteria of our search in the time period between June 20, 2023, and April 11, 2024. The 7 encompassed miRNA molecules were added to the previously developed database of 106 upregulated miRNAs in OSCC, as well as 10 molecules in the respective developed database of 133 downregulated miRNAs in OSCC created database [
8].
| Upregulated miRNAs in OSCC (Tissue and/or Saliva Specimens) |
|---|
| ↑ miRNA |
Sample Source |
| miR-1307-5p |
Saliva (Exosomes) (26)
Saliva (26)
Tissue (28)
Tissue, Cell-lines (6)
Tissue, Cell-lines (6)
Tissue, Saliva (26-27)
Tissue, Cell-lines (6) |
| miR-193b-3p |
| miR-19a-3p |
| miR-200c-3p |
| miR-23a-3p |
| miR-345-5p |
| miR-378a |
| Downregulated miRNAs in OSCC (Tissue and/or Saliva Specimens) |
|
↓miRNA
|
Sample Source |
| let-7g-5p |
Tissue (28) |
| miR-133b |
Tissue (27) |
| miR-140-5p |
Saliva (Exosomes) (26) |
| miR-143-5p |
Saliva (Exosomes) (26) |
| miR-15a-5p |
Saliva (26) |
| miR-16-1-3p |
Saliva (26) |
| miR-30c-5p |
Saliva (26) |
| miR-363-3p |
Tissue (28) |
| miR-3928 |
Saliva (26) |
| miR-424-3p |
Saliva (26) |
Table 2.
Overview of the results obtained from the miRNA/target interaction analysis and stage-specific miRNA selection process for the stage of oral hyperplasia. MiR-34a-5p simultaneously targets 100% (8/8) of characteristically upregulated genes for this particular stage, while miR-124-3p and miR-125b-5p target and possibly regulate 87.5% (7/8) of the developed panel’s target-genes. All three miRNAs exhibit significant downregulation in tissue and/or saliva specimens derived from OSCC patients, compared to non-OSCC samples.
| miRNA |
Reported Expression in OSCC |
Predicted Target Genes Upregulated in Oral Hyperplasia (8) |
Target Score |
| hsa-miR-34a-5p |
↓ |
EGFR, ERBB2, JUN, ETS1, MYC, MKI67, TP53, CDKN2A |
8/8 (100%) |
| hsa-miR-124-3p |
↓ |
EGFR, ERBB2, JUN, ETS1, MYC, MKI67, CDKN2A |
7/8 (87.5%) |
| hsa-miR-125b-5p |
↓ |
EGFR, ERBB2, JUN, ETS1, MKI67, TP53, CDKN2A |
7/8 (87.5%) |
Table 3.
Overview of the results obtained from the miRNA/target interaction analysis and stage-specific miRNA selection process for the precancerous stage of oral dysplasia. MiR-34a-5p simultaneously targets 100% (9/9) of characteristically upregulated genes for this particular stage, while miR-124-3p, miR-125b-5p and miR-1-3p target and possibly regulate 77.8% (7/9) of the developed panel’s target-genes. All three miRNAs exhibit significant downregulation in tissue and/or saliva specimens derived from OSCC patients, compared to non-OSCC samples.
| miRNA |
Reported Expression in OSCC |
Predicted Target Genes Upregulated in Oral Dysplasia (9) |
Target Score |
| hsa-miR-34a-5p |
↓ |
EGFR, ERBB2, FGFR2, FGFR3, ETS1, MYC, JUN, TP53, MKI67 |
9/9 (100%) |
| hsa-miR-124-3p |
↓ |
EGFR, ERBB2, FGFR3, ETS1, MYC, JUN, MKI67 |
7/9 (77.8%) |
| hsa-miR-125b-5p |
↓ |
EGFR, ERBB2, FGFR2, ETS1, JUN, TP53, MKI67 |
7/9 (77.8%) |
| hsa-miR-1-3p |
↓ |
EGFR, FGFR2, ETS1, MYC, JUN, TP53, MKI67 |
7/9 (77.8%) |
Table 4.
Overview of the results obtained from the miRNA/target interaction analysis and stage-specific miRNA selection process for both panels. Regarding the upregulated gene panel, which characterizes the initial cancerous stage of early invasion for OSCC. MiR-34a-5p simultaneously targets 100% (5/5) of the significantly upregulated genes for this particular stage, while miR-124-3p, miR-1-3p, miR-125b-5p and miR-147a target and possibly regulate 80% (4/5) of the developed panel’s target-genes, in two different combinations. The total of these five miRNAs exhibits significantly decreased levels in tissue and/or saliva biosamples, derived from OSCC patients, compared to normal/control specimens. As to the downregulated gene panel, reflecting the first malignant stage of OSCC oncogenesis, namely “early invasion”. Only 3 miRNA molecules (miR-155-5p, miR-423-3p and miR-34a-5p) simultaneously target and potentially regulate the expression of both CDKN2A and BCL2 genes, while demonstrating increased expression levels in OSCC tissue and/or saliva specimens.
| miRNA |
Reported Expression in OSCC |
Predicted Target Genes Upregulated in OSCC Early Invasion (5) |
Target Score |
| hsa-miR-34a-5p |
↓ (mostly) |
EGFR, FGFR2, FGFR3, ETS1, JUN |
5/5 (100%) |
| hsa-miR-124-3p |
↓ |
EGFR, FGFR3, ETS1, JUN |
4/5 (80%) |
| hsa-miR-125b-5p |
↓ |
EGFR, FGFR2, ETS1, JUN |
4/5 (80%) |
| hsa-miR-1-3p |
↓ |
EGFR, FGFR2, ETS1, JUN |
4/5 (80%) |
| hsa-miR-147a |
↓ |
EGFR, FGFR2, ETS1, JUN |
4/5 (80%) |
| |
|
|
|
| miRNA |
Reported Expression in OSCC |
Predicted Target Genes Downregulated in OSCC Early Invasion (2) |
Target Score |
| hsa-miR-155-5p |
↑ |
CDKN2A, BCL2 |
2/2 (100%) |
| hsa-miR-423-3p |
↑ |
CDKN2A, BCL2 |
2/2 (100%) |
| hsa-miR-34a-5p |
↑ (rarely) |
CDKN2A, BCL2 |
2/2 (100%) |
Table 5.
Inclusive stage-specific results for all selected early stages of OSCC oncogenesis, as well as disease-specific findings for overall OSCC. Early invasion, dysplasia and hyperplasia are characterized by the low expression of three common microRNAs (miR-34a-5p, miR124-3p, and miR-125b-5p). The precancerous dysplasia stage is distinguished from hyperplasia by the underexpressed miR-1-3p molecule. Lastly, the malignant stage of early invasion is distinguished from the two preceding precancerous stages, by four miRNAs: the downregulated miR-147a, as well as miR-155-5p and miR-423-3p, whose expression is significantly elevated in OSCC, but also miR-34a-5p, which has been found to be overexpressed in a restricted number of studies. Ultimately, 4 of the 5 most disease-specific miRNAs (miR-155-5p, miR-34a-5p, miR-124-3p and miR-1-3p miR-16-5p) for overall OSCC, revealed in our previous study, are among the most specific results regarding each sequential stage of oncogenesis. More specifically, miR-34a-5p and miR-124-3p (downregulated) are found to coexist in all three selected early stages, while miR-1-3p is introduced during the stages of dysplasia and early invasion. Finally, the upregulated miR-155-5p, stands among the dysregulated miRNAs that particularly distinguish the cancerous stage of early invasion.
| Oral Hyperplasia |
Oral Dysplasia |
Early Invasion |
OSCC
(Gintoni et al. 2023) |
| miRNA |
Expression |
miRNA |
Expression |
miRNA |
Expression |
miRNA |
Expression |
| miR-34a-5p |
↓ |
miR-34a-5p |
↓ |
miR-34a-5p |
↓ (mostly) |
miR-34a-5p |
↓ |
| miR-124-3p |
↓ |
miR-124-3p |
↓ |
miR-124-3p |
↓ |
miR-124-3p |
↓ |
| miR-125b-5p |
↓ |
miR-125b-5p |
↓ |
miR-125b-5p |
↓ |
miR-1-3p |
↓ |
| |
|
hsa-miR-1-3p |
↓ |
miR-1-3p |
↓ |
miR-16-5p |
↓ |
| |
|
|
|
miR-147a |
↓ |
miR-155-5p |
↑ |
| |
|
|
|
miR-155-5p |
↑ |
miR-34a-5p |
↑ (rarely) |
| |
|
|
|
miR-423-3p |
↑ |
|
|
| |
|
|
|
miR-34a-5p |
↑(rarely) |
|
|

