1. Introduction
Climate change is having an increasingly noticeable impact on many parts of the world, exposing communities everywhere to changes and disruptions in weather patterns, the dynamics of wildlife and vegetation, and the quality, accessibility, and availability of water and food resources [
1]. Comparably, a large body of research from throughout the globe has shown that urbanization and climate change are the two main contributors to raising the frequency and intensity of major flooding occurrences [
2,
3,
4]. Floods are occurring more frequently and with greater severity as a result of climate change’s profound effects on the water cycle, water availability, and quality [
5] and extreme precipitation patterns [
6]. For instance, severe floods in May 2022 claimed the lives of 79 people in the Brazilian states of Pernambuco, Alagoas, and Paraiba and forced 3,957 more to flee their homes [
7]. Furthermore, the amount of natural vegetation in the watershed decreased because of anthropogenic activities and infrastructure developments. This raises the percentage of impervious areas and significantly lowers the infiltration capacity during rainfall events, increasing surface runoff and subsequently increasing the severity of flooding [
6]. The necessity of appropriate policies and actions for land use and cover climate change adaptation to combat the impacts of climate change is highlighted by the growing urgency of the climate catastrophe [
8].
Local governments must keep preparing through adaptation as the effects of climate change become more apparent in communities throughout the world. Freshwater supply is crucial to society’s sustainability and well-being, and in light of the problems caused by climate change, effective management of this resource is even more relevant [
9]. Under future climatic circumstances, [
10] show declining water quality and decreased availability in three Brazilian rivers. Brazil is highly vulnerable to the El Niño and La Niña global phenomenon. El Niño affects the eastern Amazon (in the tropical region), the extra-tropical area in the southern region, and the northern portion of the northeast region of Brazil. Conversely, Brazil’s northeast typically experiences more rain during a La Niña, while the south experiences drought. A more severe drought can have a significant impact on freshwater ecosystems and raise the risk of rainforest fires. Variations in temperature and precipitation may influence disease transmission, sea level rise, and storm surges, all of which may have a significant effect on the Amazon’s lowland regions. Therefore, raising awareness regarding and understanding the daily requirements of both decision-makers and their constituents, and their capacity to integrate climate change adaptation into other sustainable policy objectives, local governments are typically at the forefront of climate change adaptation and planning [
11].
A little over 12% of the fresh water on Earth is found in Brazil. However, water scarcity is a major problem in some places, though. For instance, the semi-arid Northeast area of Brazil contains only 5% of the country’s total water, yet it is household to 28% of the country’s population and 18% of its territory [
12,
13]. The São Francisco River, one of Brazil’s largest, is one of the most significant water supplies for this entire region. The basin spans almost 2,900 km and has a surface area of 639,219 km
2, or roughly 8% of Brazil’s total land area. Nearly every kind of water usage is served by the basin, including irrigation, fishing, hydropower, and transportation in addition to home and industrial supply and irrigation. Due to its relevance is going to be the study area of this research.
With its well-known, straightforward guidelines and system of climate symbol letters, Köppen’s climate classification [
14,
15,
16,
17] is still the most used system by geographical, meteorologists, and climatological researchers worldwide. This climate classification system has been consistently reviewed by other researchers; as such, after Geiger’s [
18] revision, this system is known as the Köppen-Geiger (KG) climate classification. The KG classification is still highly significant for Brazil [
19] and is used as a basis for agroclimatic studies [
20,
21,
22]. However, is also being used for studies on a regional scale, as for the Iberian Peninsula [
23] and worldwide [
24,
25,
26]. Having this rationale in mind the main goal of this study is to analyze changes in the KG climate classification system in the S. Francisco River Basin in Brazil. This will be performed by using a state-of-the-art dataset with very high resolution. Changes in mean air temperature and total precipitation projections for the climate change impacts in this territory are thus undertaken by comparing 1970–2000 and 2041–2060 under two Shared Socioeconomic Pathways (SSPs) SSP2-4.5 and SSP5-8.5. Towards a secondary objective, the historical water surface variation, changes in land use and cover, as well as some socioeconomic indicators (Human Development Index, HDI) and demographics are performed for 1985–2022. The knowledge of these past conditions due to their dependence on climatic conditions will allow us to identify the areas most prone to be impacted by climate change. This information is thus considered highly relevant for promoting better water management policies, agriculture practices, and more sustainable planning strategies not only for decision-makers but also for the local population and stakeholders.
2. Materials and Methods
2.1. Study Area
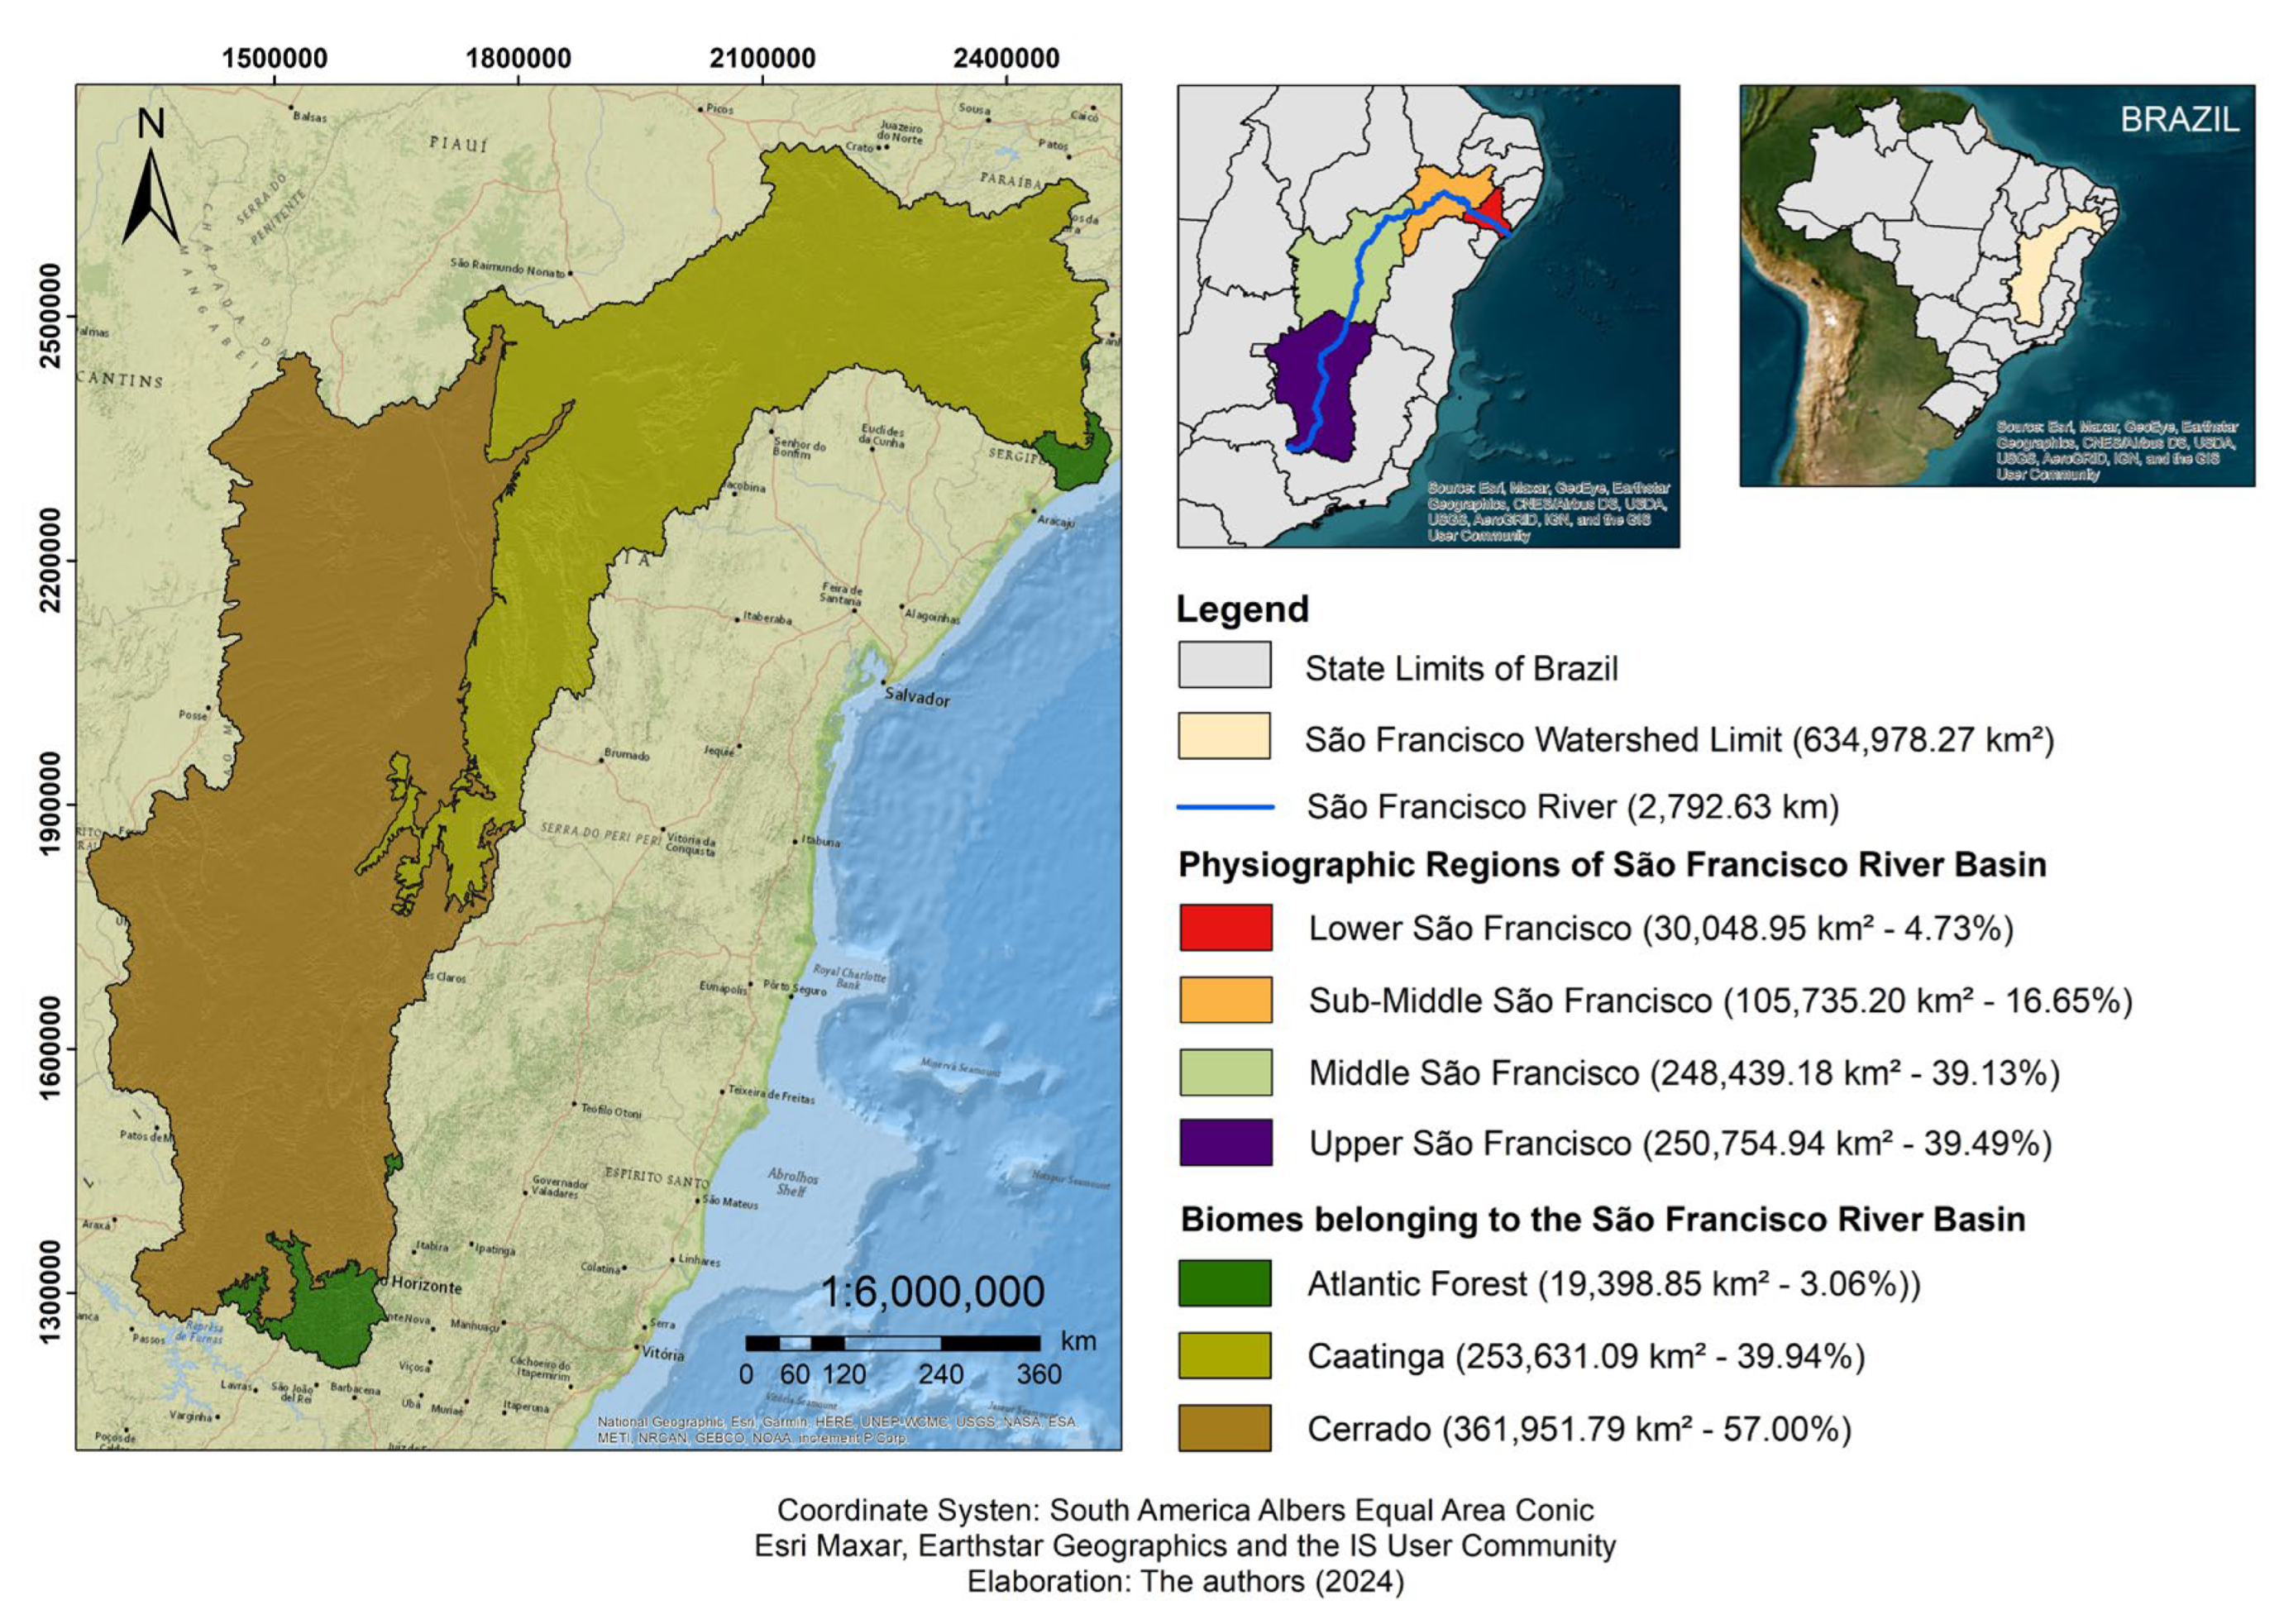
The S. Francisco River basin in central-eastern Brazil is the research region (
Figure 1). The area covered by the São Francisco River basin is equivalent to 8% of the entire country. Stretching 2,792.63 km in length and encompassing a drainage area of over 634,978.27 km
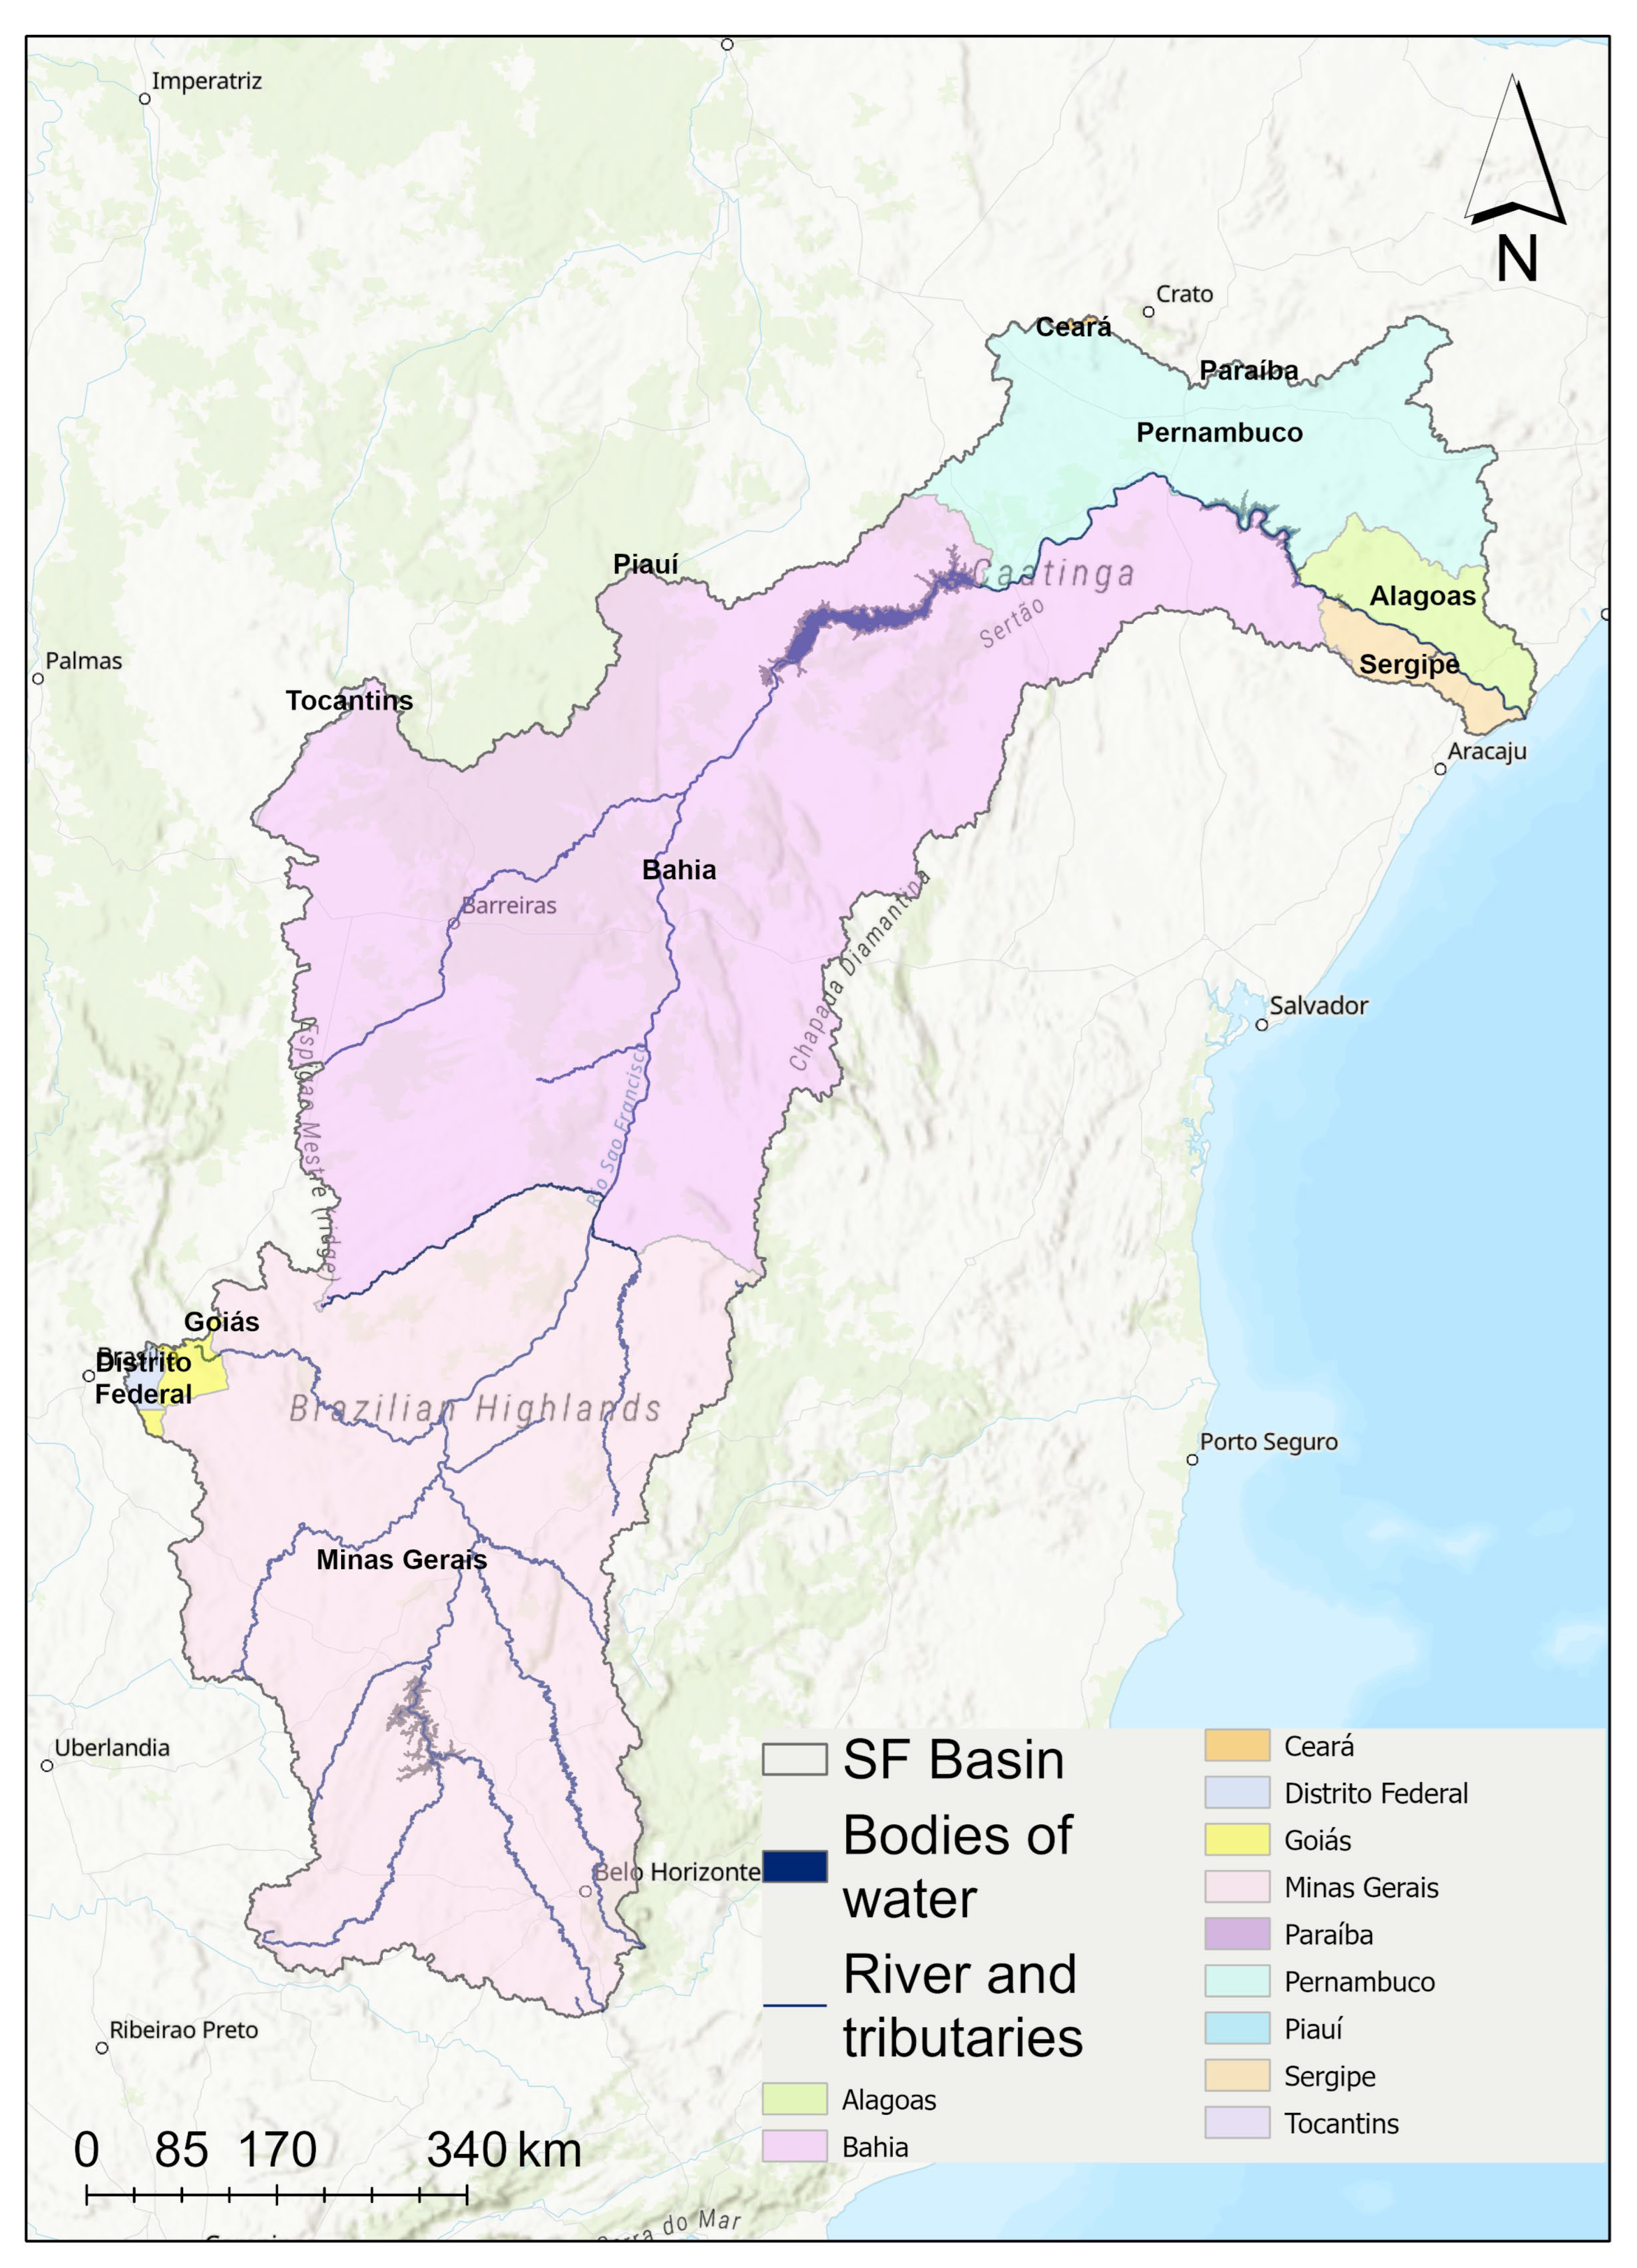
2; the river rises in the Serra da Canastra in Minas Gerais and flows into the Atlantic Ocean along the border between the states of Alagoas (AL) and Sergipe (SE). This enormous territory; which includes the Federal District and 505 municipalities spread throughout six states (Minas Gerais (MG); Goiás (GO); Bahia (BA); Pernambuco (PE); Alagoas (AL); and Sergipe (SE)) unites the nation’s Northeast; Southeast; and Midwest areas (
Figure A1)
Upper, Middle, Sub-middle and Lower São Francisco are the four physiographic (
Figure 1) zones or regions that make up the basin, which is one of the twelve hydrographic regions in Brazil. These divisions are primary units of study and were made for planning purposes. Namely, these physiographic zones of the basin in terms of areas account for: the Upper (about 40% of the watershed area), Middle (39% of the watershed area), Sub-middle (17% of the basin area), and Lower São Francisco (5% of the watershed area). Consider the states these regions encompass: Low (43.9% Alagoas, 23.8% Sergipe, 22.8% Pernambuco, 9.5% Bahia), Sub-middle (59.4% Pernambuco, 39.5% Bahia, 1.1% Alagoas), Medium (100.0% Bahia), and High SF (92.6% Minas Gerais, 5.6% Bahia, 1.2% Goiás, 0.5% Federal District).
Owing to its extension, it has two navigable routes: the low, which is 238 km long and connects Piranhas (AL) and the entrance of the Atlantic Ocean, and the medium, which is around 1,373 km long and runs between Pirapora (MG) and Juazeiro (BA) / Petrolina (PE). With 168 tributaries, the São Francisco River serves as the basin’s primary watercourse. Of them, 69 are intermittent rivers that dry up during the dry season, and 99 are perennial rivers.
A large portion of the drainage basin is dominated by recent alluviums, sandstones, and limestones, which encourage the retention and release of water during the dry months. As a result, in Pirapora (MG), Januária (MG), and even Carinhanha (BA), the minimum rainfall occurs in September, two months after the minimum rainfall of July (
Figure A2a). The São Francisco’s water volume decreases as it enters the semi-arid sertaneja zone despite high evaporation, little rainfall, and the right bank’s temporary tributaries. However, it stays perennial because of the feedback mechanism from its upper course and the tributaries in the middle of Minas Gerais and western Bahia. In this portion, the flood period occurs from October to April, with maximum height in March, at the end of the rainy season (
Figure A2a). The ebbs are observed from May to September, conditioned to the dry season. A few of the principal reservoirs on the São Francisco River are Três Marias in Minas Gerais, Sobradinho in Paulo Afonso, and Itaparica in Bahia and Xingó, which are situated between the states of Alagoas and Sergipe, for managing the river’s flow and/or producing hydroelectric power.
The São Francisco Basin boasts a diverse range of environments, with parts of several biomes such as the Atlantic Forest, Cerrado, Caatinga, coastal, and insular (
Figure 1 and
Figure A1). Nearly half of the basin is covered by the Cerrado, which extends from Minas Gerais to the west and south of Bahia. The Caatinga, on the other hand, is more common in the northeast of Bahia due to harsher weather. There is a remnant of the Atlantic Forest on the Upper São Francisco, mostly in the headwaters, that has been destroyed by meadows and agricultural use. There are areas of dry woodland that border the rivers, where the humidity is higher. In general, the area of the basin affected by anthropogenic activity was estimated to have reached 24.8% in 1985. Pastures accounted for 16.6% of this total, followed by agriculture at 7%, reforestation at 0.9%, and other uses at 0.3%.
There are utter differences in the demographic profile between areas (mainly High and Low SF) with high wealth care resources and demographic density and others with low income and demographic density. There are records of significant drought episodes in the semi-arid region that make up around 54% of the river basin’s total area. Due to its area, and socio-economic relevance, the impacts of climate change are going to be analyzed.
2.1. Dataset for the Köppen-Geiger Classification System Computation
In this research, to identify the impact of climate change on the study area gridded datasets of monthly precipitation (in mm), maximum, minimum, and mean temperatures (°C), with a 10-minute spatial resolution, were retrieved from the WorldClim dataset [
27]. Monthly averages between 1970 and 2000 were considered as the historical period (baseline climate), whereas for assessing the future climate monthly averages from 2041 to 2060 (20 years) were selected. These datasets were generated by state-of-the-art Global Climate Models (GCMs) within the framework of the Coupled Model Intercomparison Project (CMIP6) [
28]. The previous Representative Concentration Pathways (RCPs) were reformulated in CMIP6 giving rise to the Shared Socioeconomic Pathways (SSPs). In this study, two SSPs are considered the SSP2-4.5 and SSP5-8.5, or simply SSP2 and SSP5. Biases in climate model simulations are a regular issue that users encounter when utilizing the output of climate models. The results will typically differ from the impacts model output when utilizing real observed climate as input if the raw model outputs are used as inputs directly into the impacts model. In the last few years, bias correction has drawn a lot of attention. In this case, the downscaling and bias correction of raw GCM data was carried out by the data providers by using WorldClim v2.1 as the baseline climate [
28]. Assuming a high degree of spatial autocorrelation, the data providers’ calibration was produced by calculating the absolute or relative difference between the GCM outputs for the baseline and target periods (2041–2060 in this study), with global cross-validation correlations of roughly 0.86 for precipitation and 0.99 for temperatures [
27]. Overall, a 14-member ensemble of bias-corrected monthly datasets for 2041−2060 was chosen, comprising the following GCMs: ACCESS-CM2, BCC-CSM2-MR, CanESM5, CMCC-ESM2, CNRM-CM6-1, EC-Earth3-Veg, FIO-ESM-2-0, GISS-E2-1-G, HadGEM3-GC31-LL, INM-CM4-8, IPSL-CM6A-LR, MIROC-ES2L, MPI-ESM1-2-HR, UKESM1-0-LL. This bias-corrected ensemble was subsequently used to compute the KG climate classification system for the period between 1970–2000 and 2041–2060 under SSP2 and SSP5.
2.2. The Köppen-Geiger Classification System
The purpose of this study is to evaluate how the global KG climate classification system in the S. Francisco River Basin has changed under SSP2 and SSP5 between the historical period (1970–2000) and the future (2041–2060). The five main terrestrial climate types—A (tropical), B (dry), C (temperate), D (continental), and E (polar)—are subdivided into smaller categories and are represented by capital letters (
Table 1) in the KG climate categorization system [
14,
15,
16,
17,
18]. The second letter represents the type of seasonal precipitation; a dry summer is represented by the letter s, a dry winter by the letter w, and no dry season by the letter f. The heat level is indicated by the third letter, which is a for a hot summer, b for a warm summer, c for a chilly summer, d for an extremely cold winter, h for a hot climate, and k for a cold climate.
It is noteworthy that a second letter, m, which indicates a clearly defined monsoon regime, can also be linked to the A climatic type. W and S correspond to arid and semi-arid climates, respectively, in the B type. Lastly, the polar E type is connected to either T or F, which stands for the tundra and ice cap, respectively.
Since the KG climate categorization system has undergone revisions and updates throughout time [
29,
30,
31], this study examines it to evaluate the changes in the climate in the S. Francisco River basin. The approach for the KG class denomination and calculation (thresholds for temperature and precipitation) used in this work was based on [
24] and was presented by [
23] (see
Table 3, Table 4 and Table 5) for a complete type of description and definition criteria. As a result,
Table 1 provides a brief description of the 31 KG climatic types. The color scheme for all figures presented in the results section was adopted by [
25,
26].
2.3. Water Surface, Land Use, and Cover Datasets
Considering the assessment of historical conditions regarding water surface variations, land use, and cover data were obtained from MapBiomas - Brazil and the socioeconomic indicators for the study area were retrieved from the Brazilian Statistics Institute - IBGE and Institute for Applied Economic Research - IPEA [
32,
33]. The historical periods for these datasets depend on data availability; therefore, the period between 1985 and 2022 was retrieved and analyzed.
To categorize El Niño and La Niña episodes in the eastern tropical Pacific, NOAA [
34,
35] now adopts the Oceanic Niño Index (ONI) as a norm [
36]. This is the Niño 3.4 region’s (i.e., 5°N−5°S, 120°−170°W) mean 3-month sea level temperature (SST) anomaly. Events are defined as five consecutive overlapping three-month periods that fall at or below the ‒0.5 anomaly for cool events (La Niña) and at or above the +0.5 anomaly for warm events (El Niño). Weak (0.5 to 0.9 SST anomaly), Moderate (1.0 to 1.4), Strong (1.5 to 1.9), and Very Strong (≥ 2.0) incidents are further subdivided under the threshold. A report’s classification of an occurrence as weak (W), moderate (M), strong (S), or very strong (VS) depends on whether it met or exceeded the highest category’s criterion for a minimum of three consecutive, overlapping three-month periods (
Table A1).
El Niño, a natural phenomenon centered in the Equatorial Pacific Ocean, can affect atmospheric conditions globally, including Brazil. Depending on the area, it can also result in severe droughts, torrential rainfall, or even storms in addition to raising average temperatures. From a Brazilian perspective, El Niño usually results in severe rains in the south, droughts in the north, and erratic rainfall in the west-central regions of the nation, which produce most of the nation’s grain and soybeans. Therefore, the spatial distribution of the water surface variation periods was chosen for different intensities of La Niña and El Niño years. Namely, 1985 (weak La Niña), 2003 (moderate El Niño), 2015 (very strong El Niño), 2021 (moderate La Niña). However, it is worth noting that the correlation between these teleconnections and the impacts within the S. Francisco watershed is out of the scope of this study.
2.4. Socioeconomic and Demographic Indicators
Toward the evaluation of the socioeconomic development impact of climate change in the S. Francisco watershed territory, the Human Development Index (HDI) was analyzed. A long and healthy life, knowledge, and a reasonable standard of living are three important aspects of human development that the HDI measures in summary form. Life expectancy at birth is used to measure the health dimension, while the mean number of years spent in school for persons over 25 and the anticipated number of years spent in school for children who are ready to start school are used to measure the education dimension. Gross national income (GNI) per capita is used to measure the standard of living. The logarithm of income is used by the HDI to represent how money becomes less significant as GNI increases. The geometric mean is then used to combine the results for the three HDI dimension indices into a composite index [
37]. By posing the question of how two nations with the same level of GNI per capita may have different outcomes in terms of human development, the HDI can be used to challenge national policy decisions. These differences might spark discussion regarding the priorities of public policy. However, is worth mentioning that the HDI can oversimplify and only partially represent the scope of human growth since it doesn’t address issues like poverty, human security, empowerment, or inequality. However, the normalized indices for each of the three dimensions’ geometric means make up the HDI still a good indicator of socioeconomic development. The HDI dataset was retrieved from IBGE [
32].
To facilitate the evaluation, HDI and the total population on the NUTS 3 (Nomenclature of territorial units for statistics) on a municipality level within this region was divided into the rural and the urban populations by using the 2010 Census data [
32]. Overall, the 505 municipalities comprised within the S. Francisco watershed were analyzed.
3. Results
In this section, the results are going to be presented as follows. In the first section an assessment of total precipitation, mean air temperature, and projections for the KG climate classification system is presented for the S. Francisco River basin for 1970‒2000, and 2041‒2060 under SSP2 and SSP5. The following sections present historical conditions for this study area between 1981 and 2022. Towards this aim, the second section is devoted to the water resources, with an emphasis on the spatial representation of years in which La Niña and El Niño had different intensities. Statistically significant trends (at a 5% confidence level) are also assessed. In the third section, the Land use and cover change is going to be analyzed. Like in the previous sections, statistically significant trends (at a 5% confidence level) for the land use classes are addressed. Lastly, an assessment of socioeconomic and demographic factors for the study area is described by using the 2010 Census data.
3.1. Projections for the Köppen-Geiger Climate Classification System
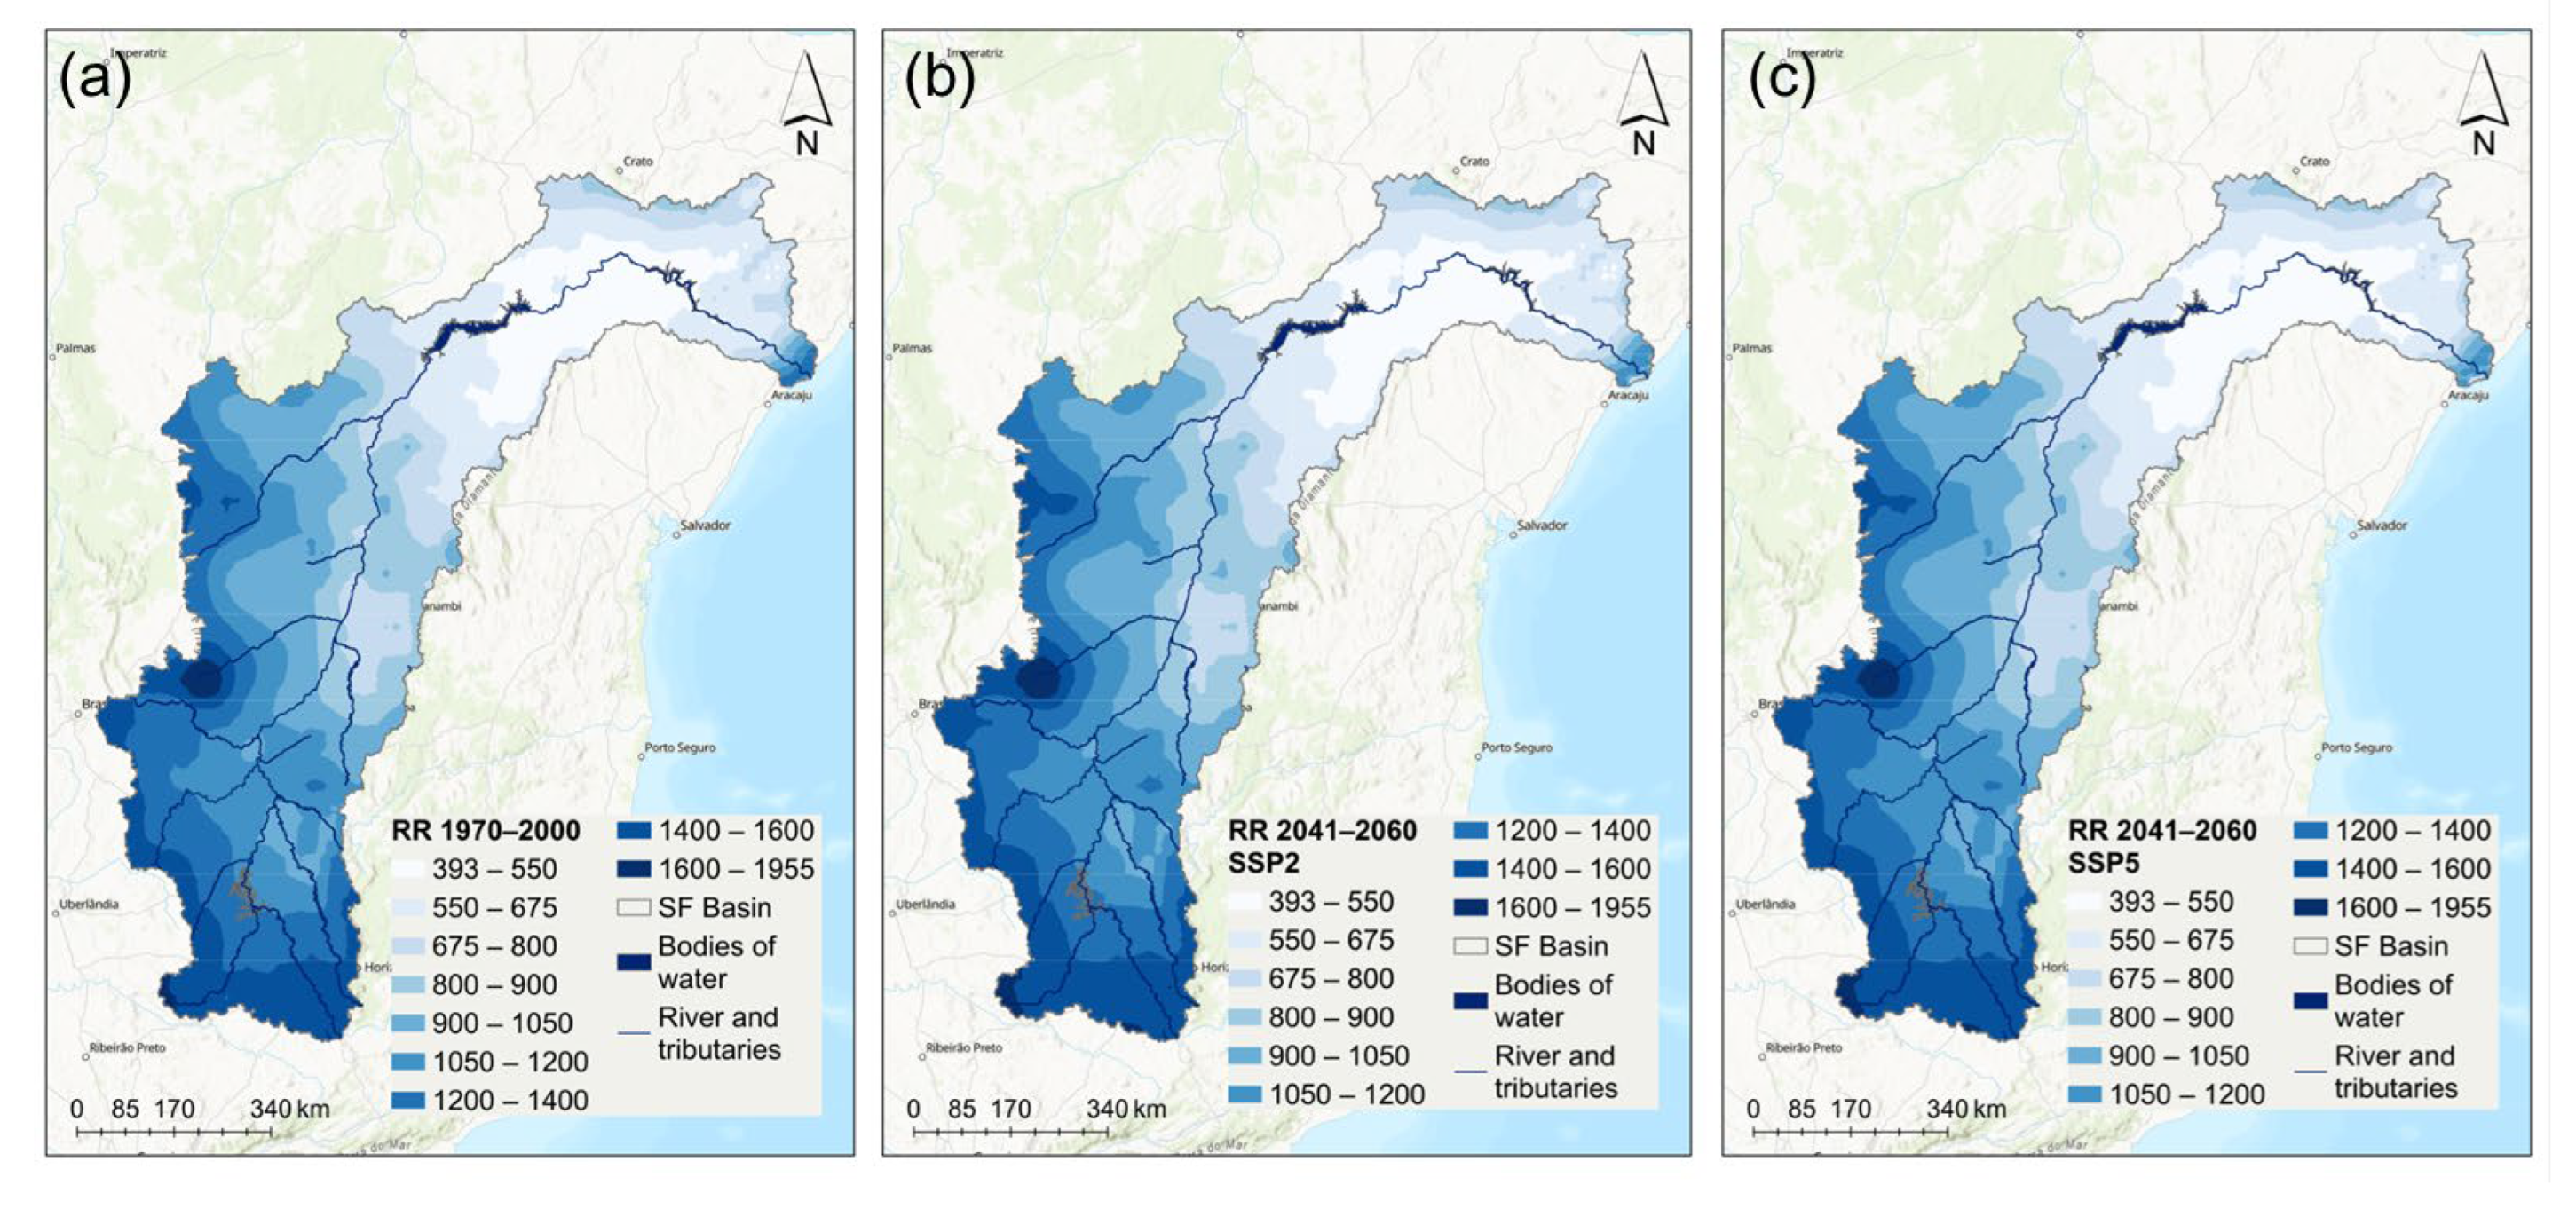
Since the KG classification system is attained from the precipitation and air temperature datasets, a comparison of the spatial distribution of these two variables between the historical period and 2041‒2060 under SSP2 and SSP5 for the S. Francisco River basin is presented. Results show that the total mean annual precipitation spatial distribution is higher in the southern portion of the S. Francisco River basin (Upper and Middle physiographic regions) in comparison with the lowest values observed towards its mouth (
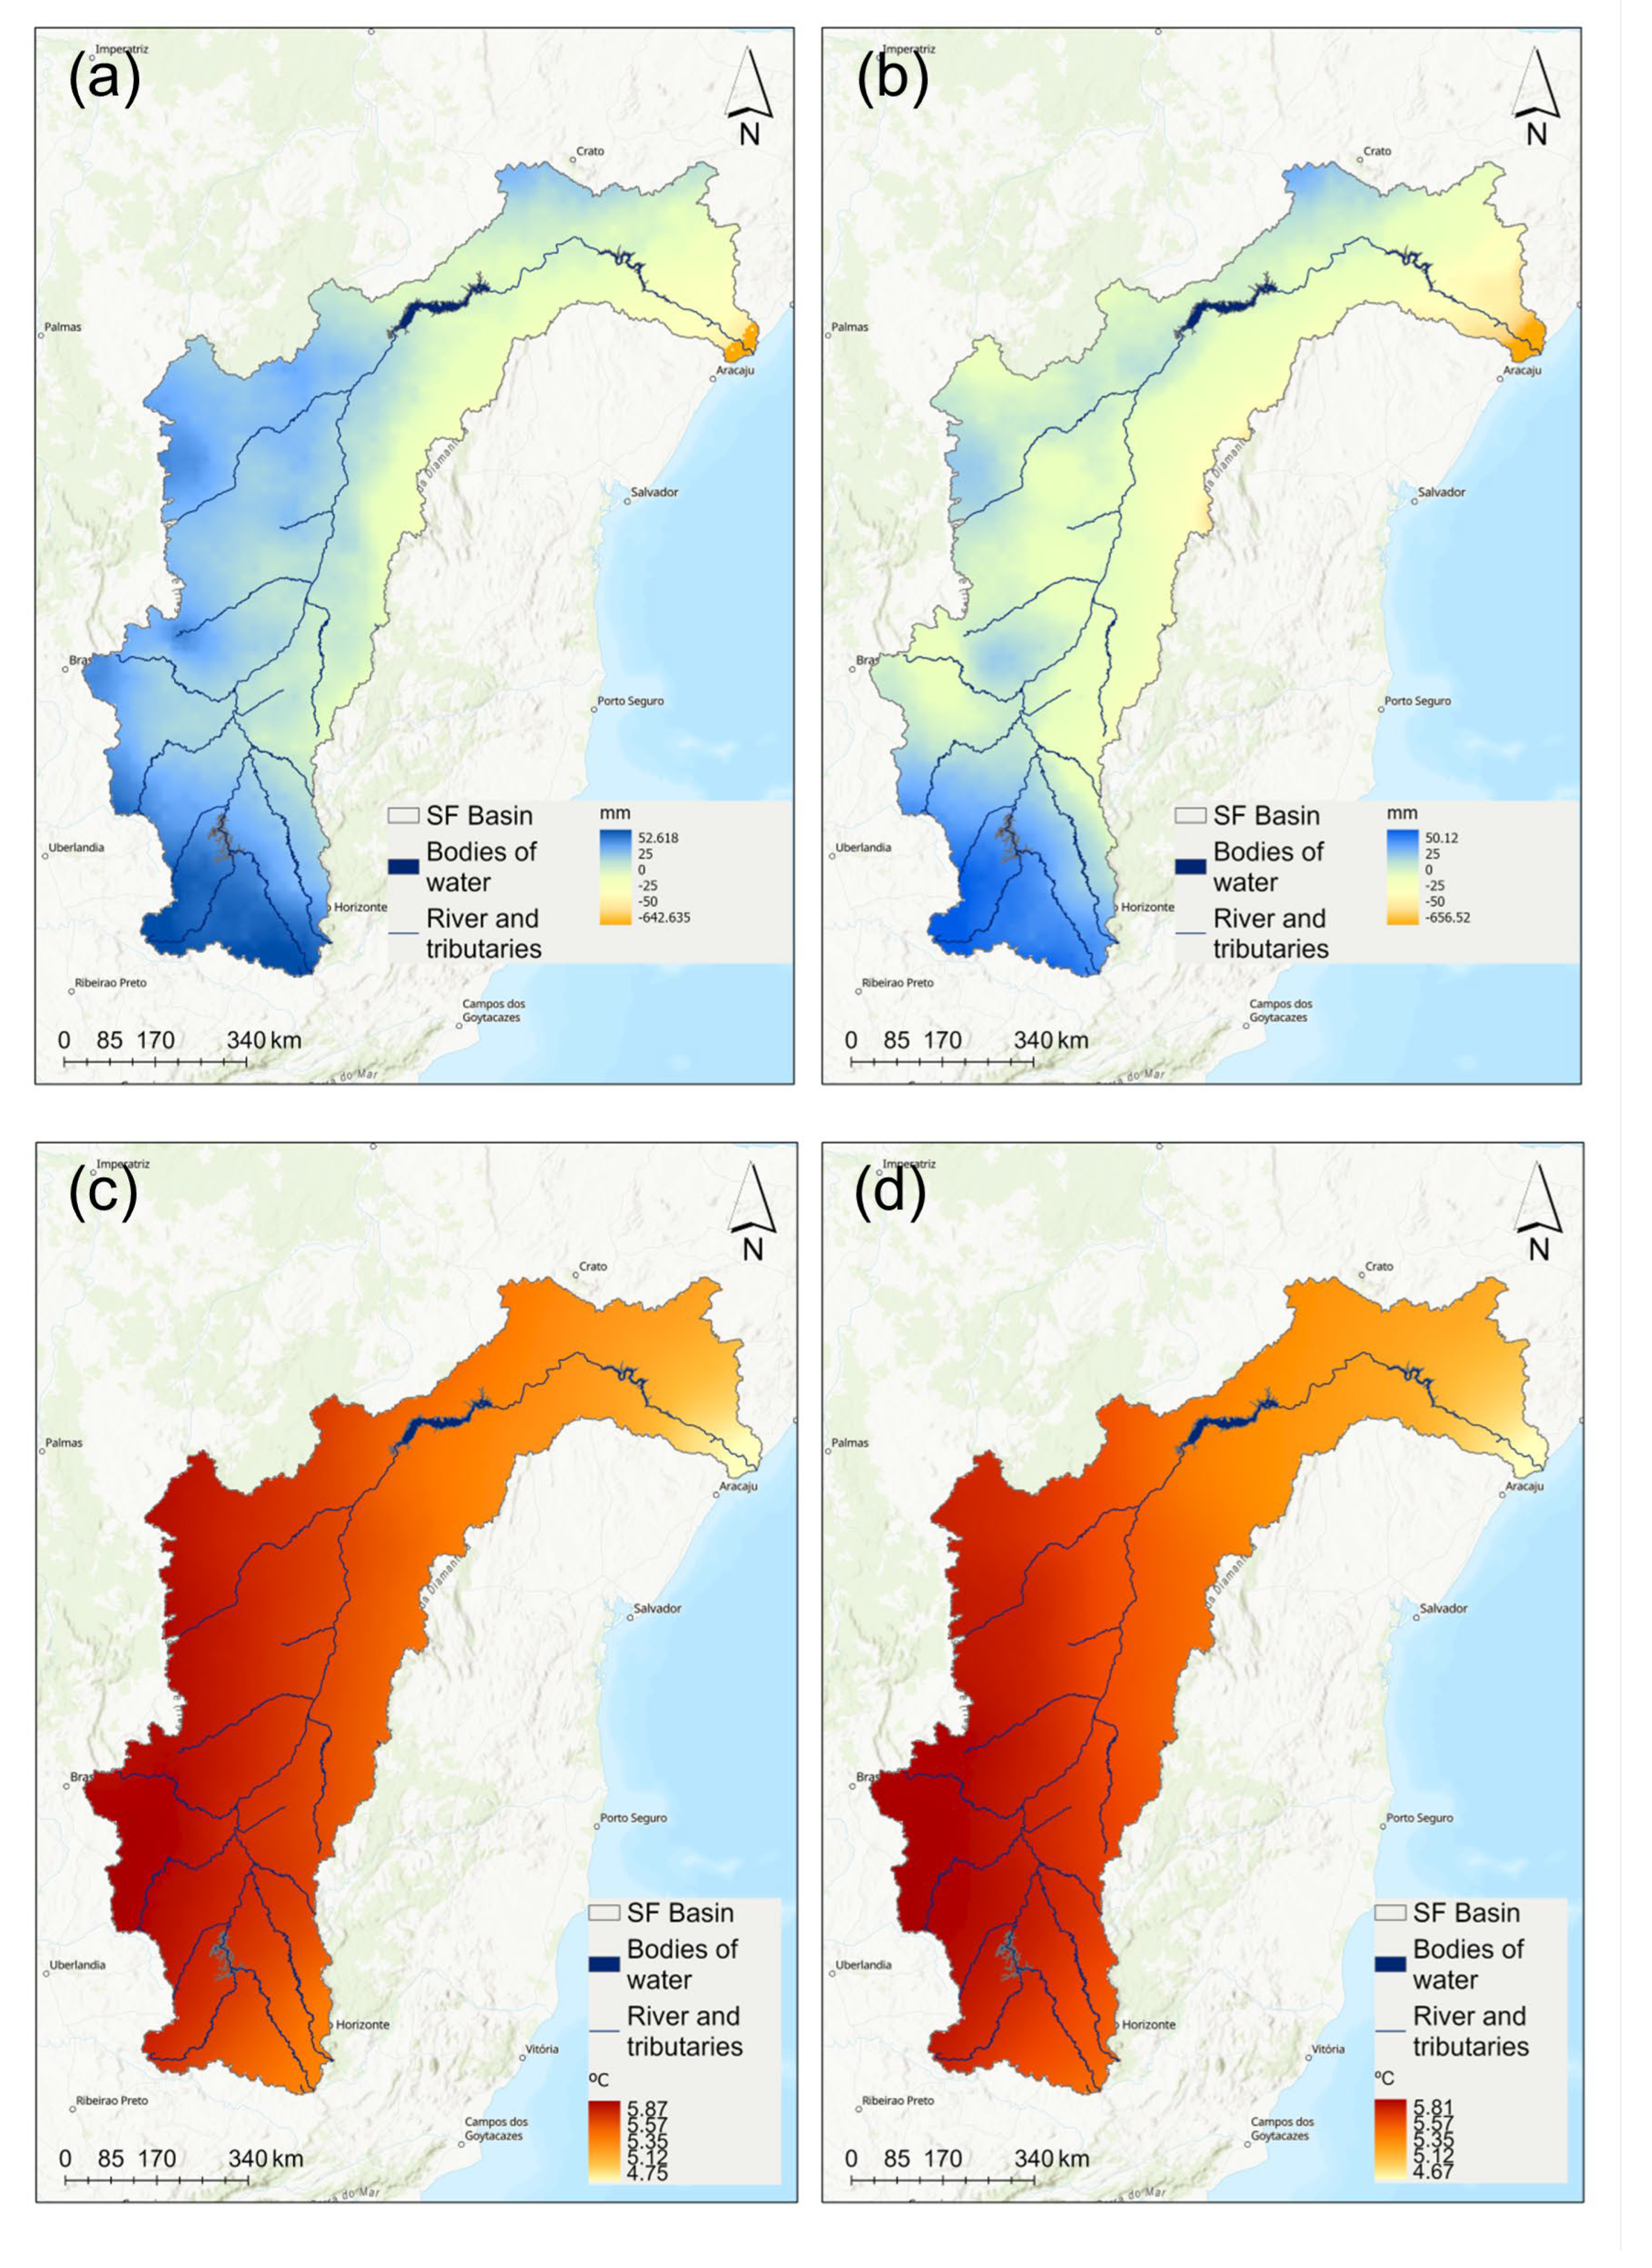
Figure 2). For the historical period, the maximum total mean annual values reached 1,955 mm whereas the minimum was 393 mm. Projections show a similar pattern for the future under both SSPs, for which is projected a decrease in total precipitation mainly in the Sub-middle and Lower physiographic regions with higher expression under SSP5. Results project a range for the difference between the future and the historical period (1970‒2000) values from 52.62 to ‒642.635 mm under SSP2; and between 50.12 to ‒656.52 mm under SSP5 (
Figure A3a,b). These outcomes predict higher decreases in precipitation until 2060 mainly in the Lower (maximum differences) and Sub-middle physiographic regions. These spatial differences in the total mean annual precipitation can also be depicted in the total mean monthly precipitation values project changes within the seasonal cycle (
Figure A2).
The ombrothermic graphics (
Figure A2) reveals a seasonal variability for the total precipitation that is predicted to be maintained under future conditions. These variations are projected to be influenced by the scenario, mainly for the transitional seasons.
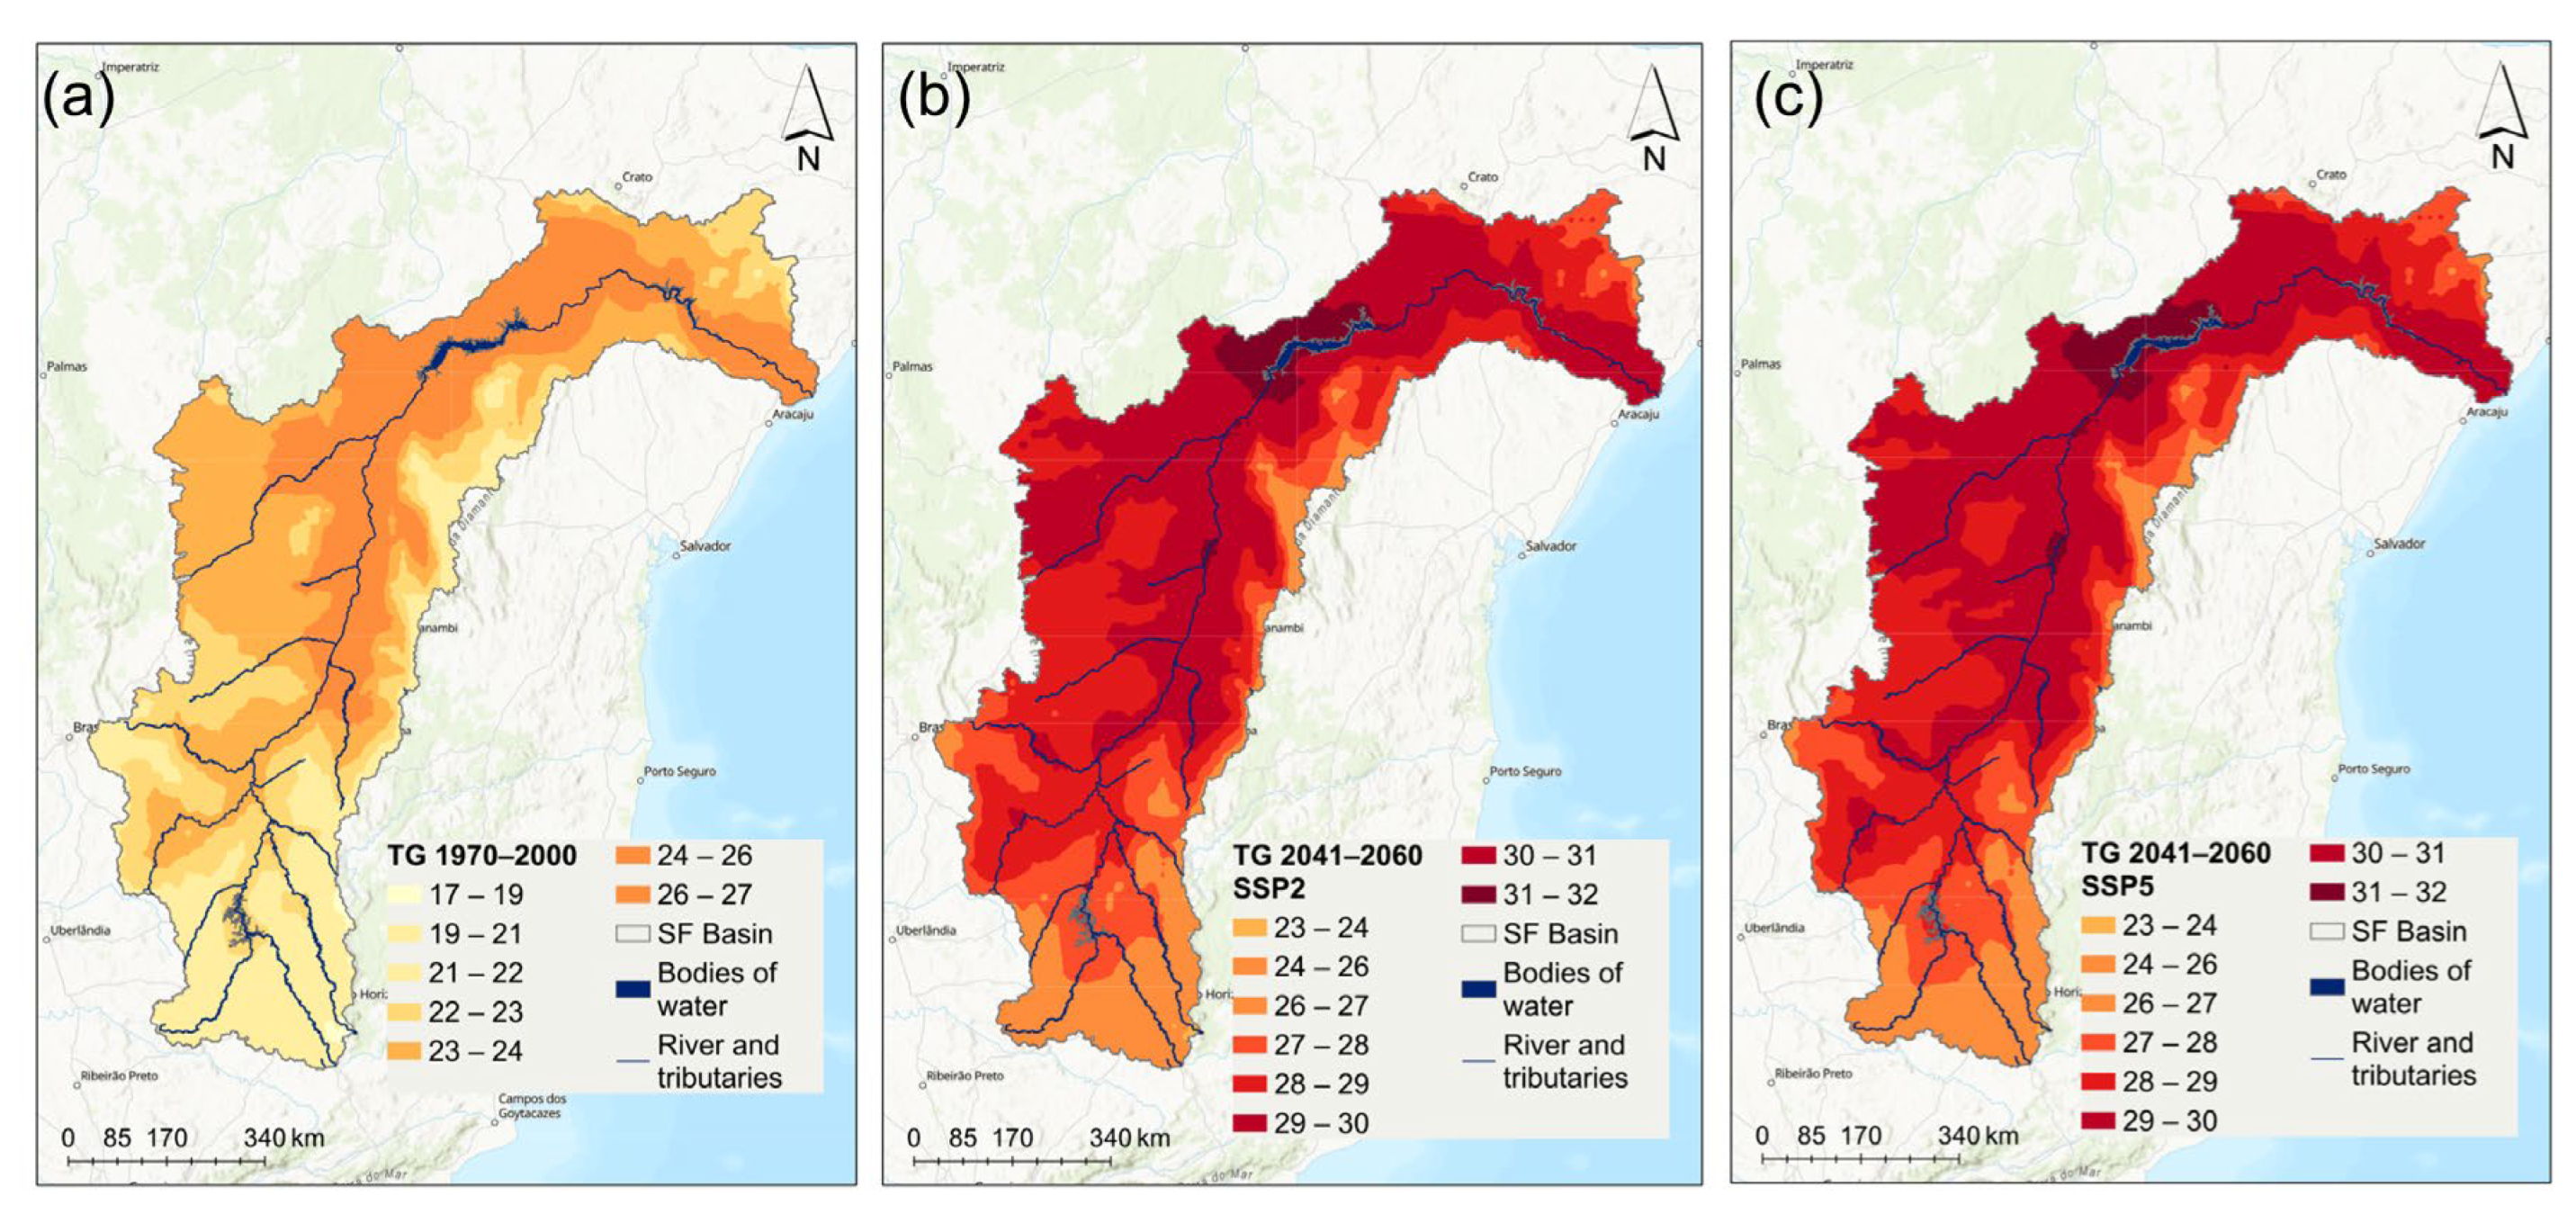
For the mean air temperatures, the changes between the spatial distributions for 2041‒2060 under SSP2 (
Figure 3b) and under SSP5 (
Figure 3c) and the historical period 1970‒2000 (
Figure 3a) are quite striking (
Figure A3c,d). While for the past conditions, the mean air temperatures ranged between 17 to 29 °C; under future conditions is it predicted to vary from 23 to 32 °C under both SSPs. Increasingly higher temperatures are projected to be found from the Lower to the Upper physiographic regions of the S. Francisco River basin. The differences between 2041‒2060 under SSP2 and the historical period are predicted to range from 4.75 and 5.67°C; whilst under SSP5 are projected to vary from 4.67 and 5.81°C (
Figure A3c,d). It is worth mentioning that the highest values above 30 °C are expected to be in the Sub-middle physiographic region holding the major water surface areas. This region comprises the main water reservoirs not only in which hydroelectric energy is produced, but also holds water for agricultural purposes, livestock, industrial, and human consumption. It is worth mentioning that these regions are the ones projected to undertake a decrease in total precipitation that can reach values around 656 mm until 2060 under SSP5 (around 643 mm under SSP2). This predicted striking rise in temperatures can also be depicted in the ombrothermic graphic (
Figure A2).
The ombrothermic graphics (
Figure A2) reveals a seasonal variability for the mean air temperatures that are predicted to be maintained under future conditions. Mean values are observed for July and June however, these values were around 20.5°C while in the future are projected to be around 26°C under both SSPs. These variations are projected to be influenced by the scenario, mainly for the transitional seasons. Major air temperature values were depicted for December, February (Maximum), January, and March, but also October, and November (around 24°C) for 1970‒2000 (
Figure A2a); whilst are predicted to exceed 29°C, with the maximum now projected to occur in October for 2041‒2060 under both SSPs (Figures A2b,c). Overall, the minimum monthly temperatures projected for the future are almost 2°C above the maximum monthly values observed for the historical period.
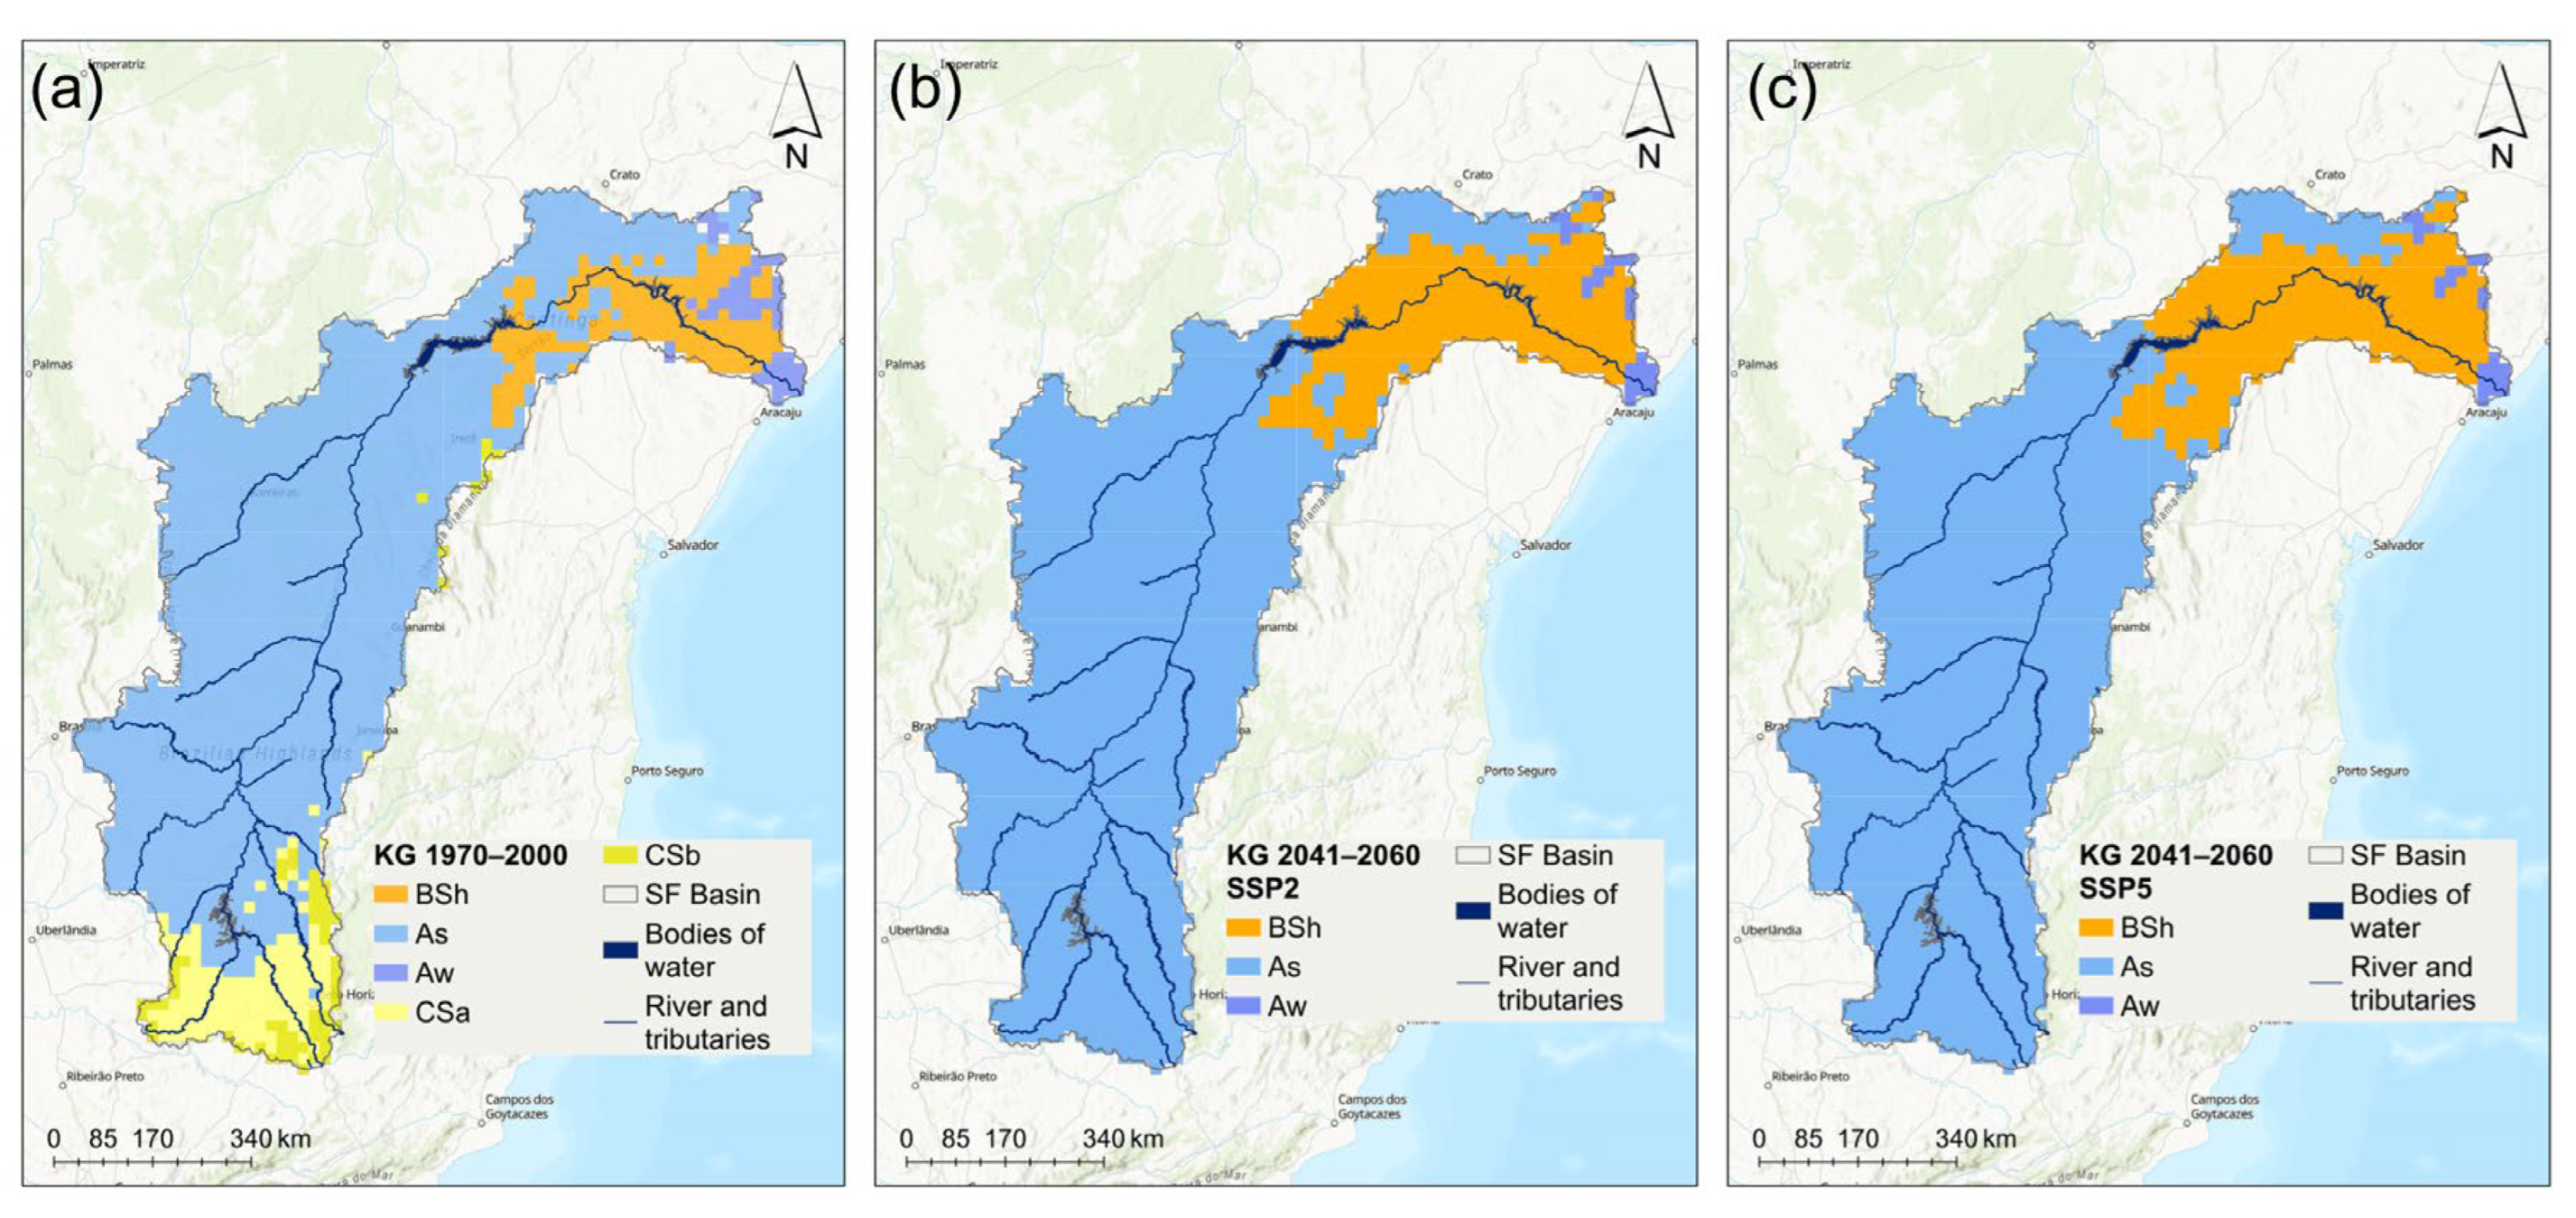
Major changes are depicted when comparing the KG climate types between the historical period and 2041‒2060 under both SSPs (
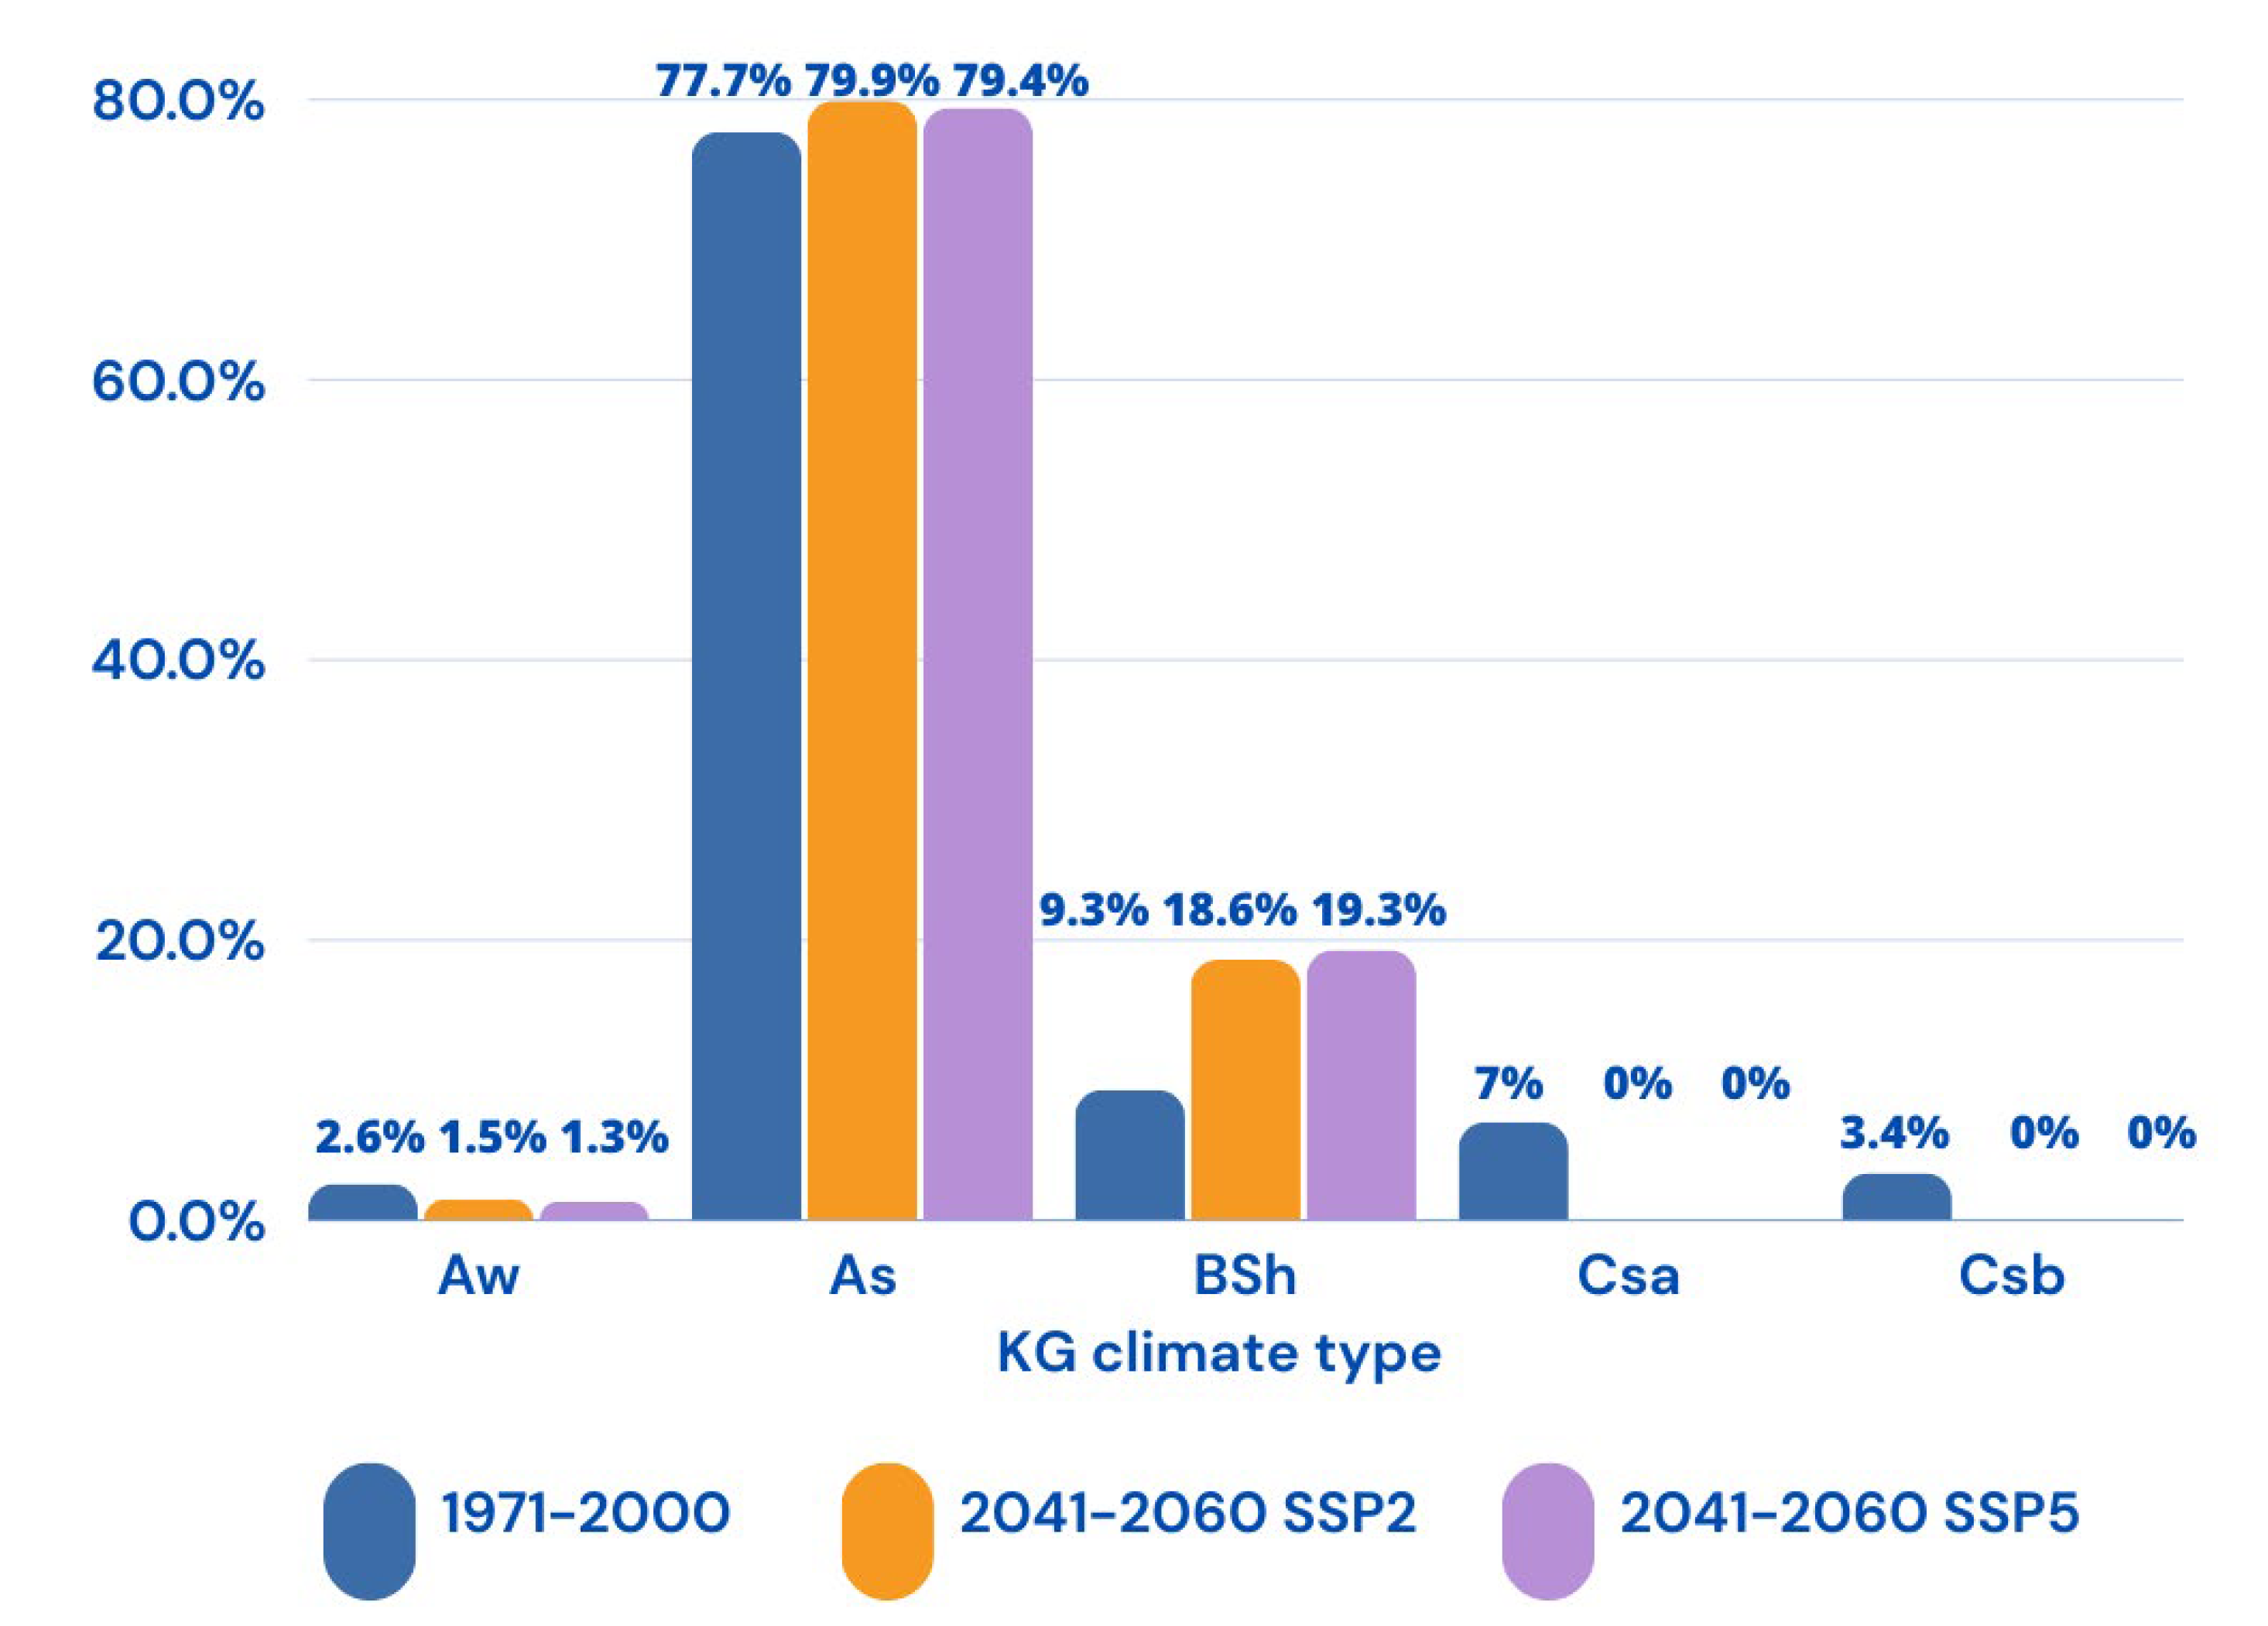
Figure 4). Indeed, results show that foremost changes are projected mainly in the vicinity of the source (Upper physiographic zone) and mouth (Lower and part of the Sub-middle physiographic regions) of the S. Francisco River basin. Between 1970‒2000, the region comprising the source presented Csa (hot-summer Mediterranean) and Csb (warm-summer Mediterranean) climate types (
Figure 5). These climate types are predicted to be replaced by the As (Tropical savanna with dry summer) pointing out a climate change towards a more hot and dry regime. This anticipated change is followed by an increase of the BSh (semi-arid hot) climate type from the northernmost Sub-middle physiographic region toward the mouth (comprising the Lower physiographic zone) of the river. Let us recall (
Figure 1) that this river basin is divided into four physiographic zones from the source (Upper physiographic zone) Middle, and Sub-middle towards the mouth which is comprised of the Lower physiographic region.
Figure 5 summarizes these striking climate types of changes. Results point out the disappearance of the Mediterranean-like climate types (hot-summer (Csa) and warm-summer (Csb)) until 2070 under both SSPs. From five climate types, it predicted that this region would remain with three. Furthermore, the outcomes also project a retraction of the area with tropical savanna with dry winter (Aw) around 1.3% under SSP5. Conversely, the tropical savanna with dry summer regions (As) is predicted to increase to a maximum of about 2.2% under SSP2. Finally, it is worth noting that the major predicted increase will be for the semi-arid hot (BSh) steppe-like climate type, about 10% under SSP5 and 9.3% under SSP2. Overall, the outcomes until 2070 and under both SSPs all predict an increase in regions under drier or arid conditions.
3.2. Water Surface Changes in the Historical Period (1985‒2022)
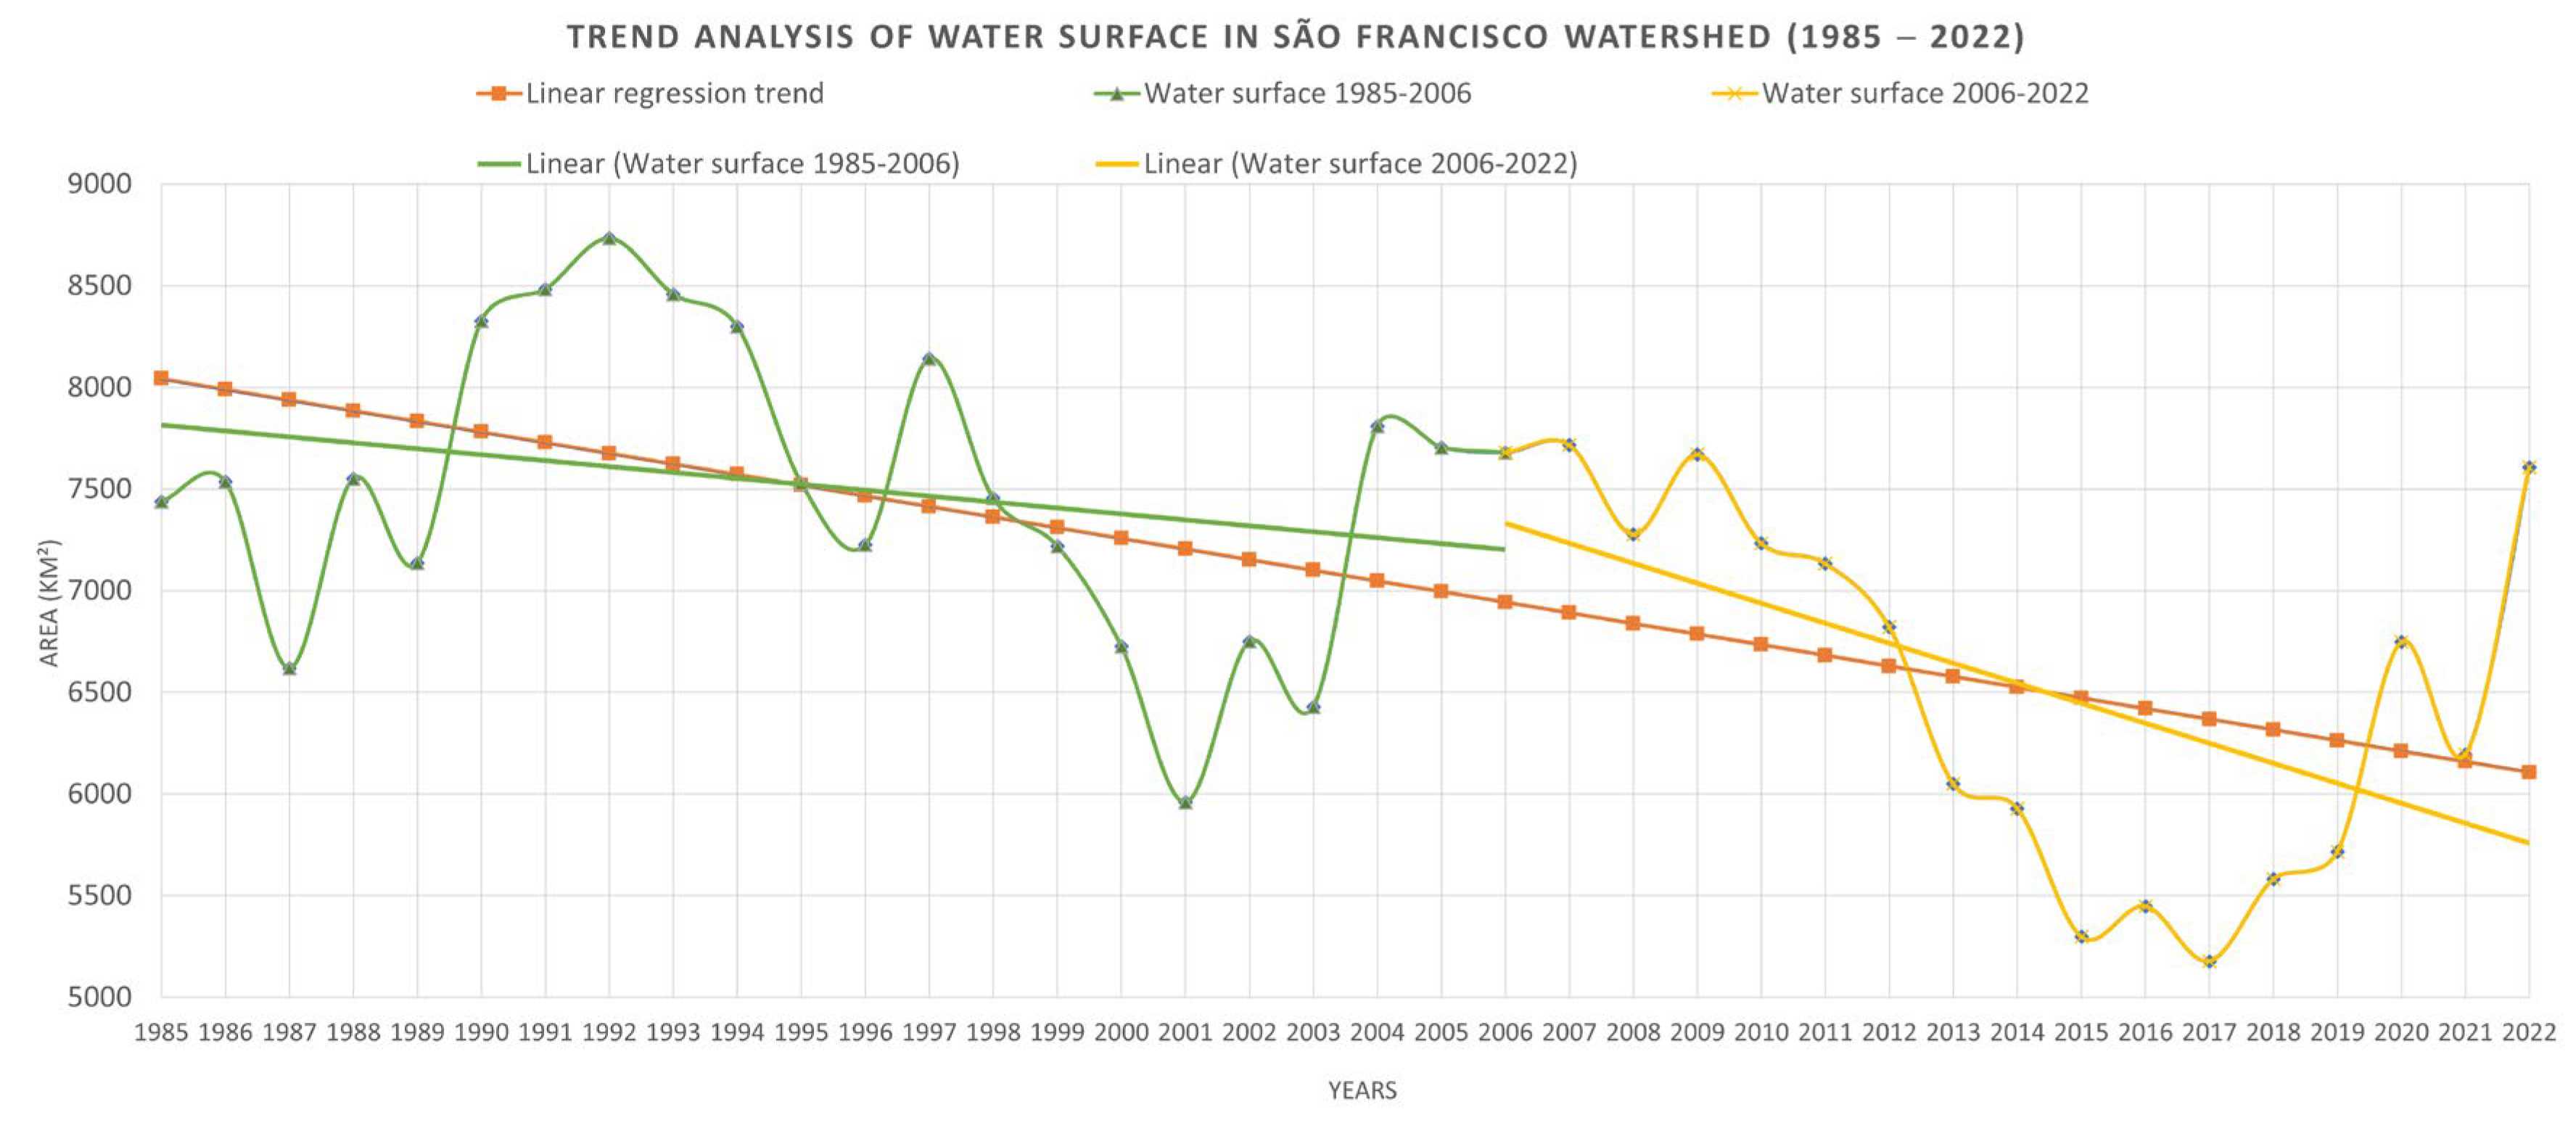
The water surface changes between 1985 and 2022 were analyzed (
Figure 6). Results show a strong variation for the São Francisco River basin in which the highest values are depicted between 1990 and 1994 (a maximum area comprised between 8,000 and 9,000 km
2) with a total maximum of 8,732.62 km
2 reached in 1992 (
Table 2). This was followed by a clear retraction from 2013 to 2019 (a minimum area comprised between 5,000 and 6,000 km
2) with a total minimum of 5,177.22 km
2 observed in 2017. Overall, for this period the mean total water surface area was about 7,073.7 km
2 with an overall statistically significant decreasing trend (at a 5% significance level, α) of around 52 km
2 per year (
Table 2).
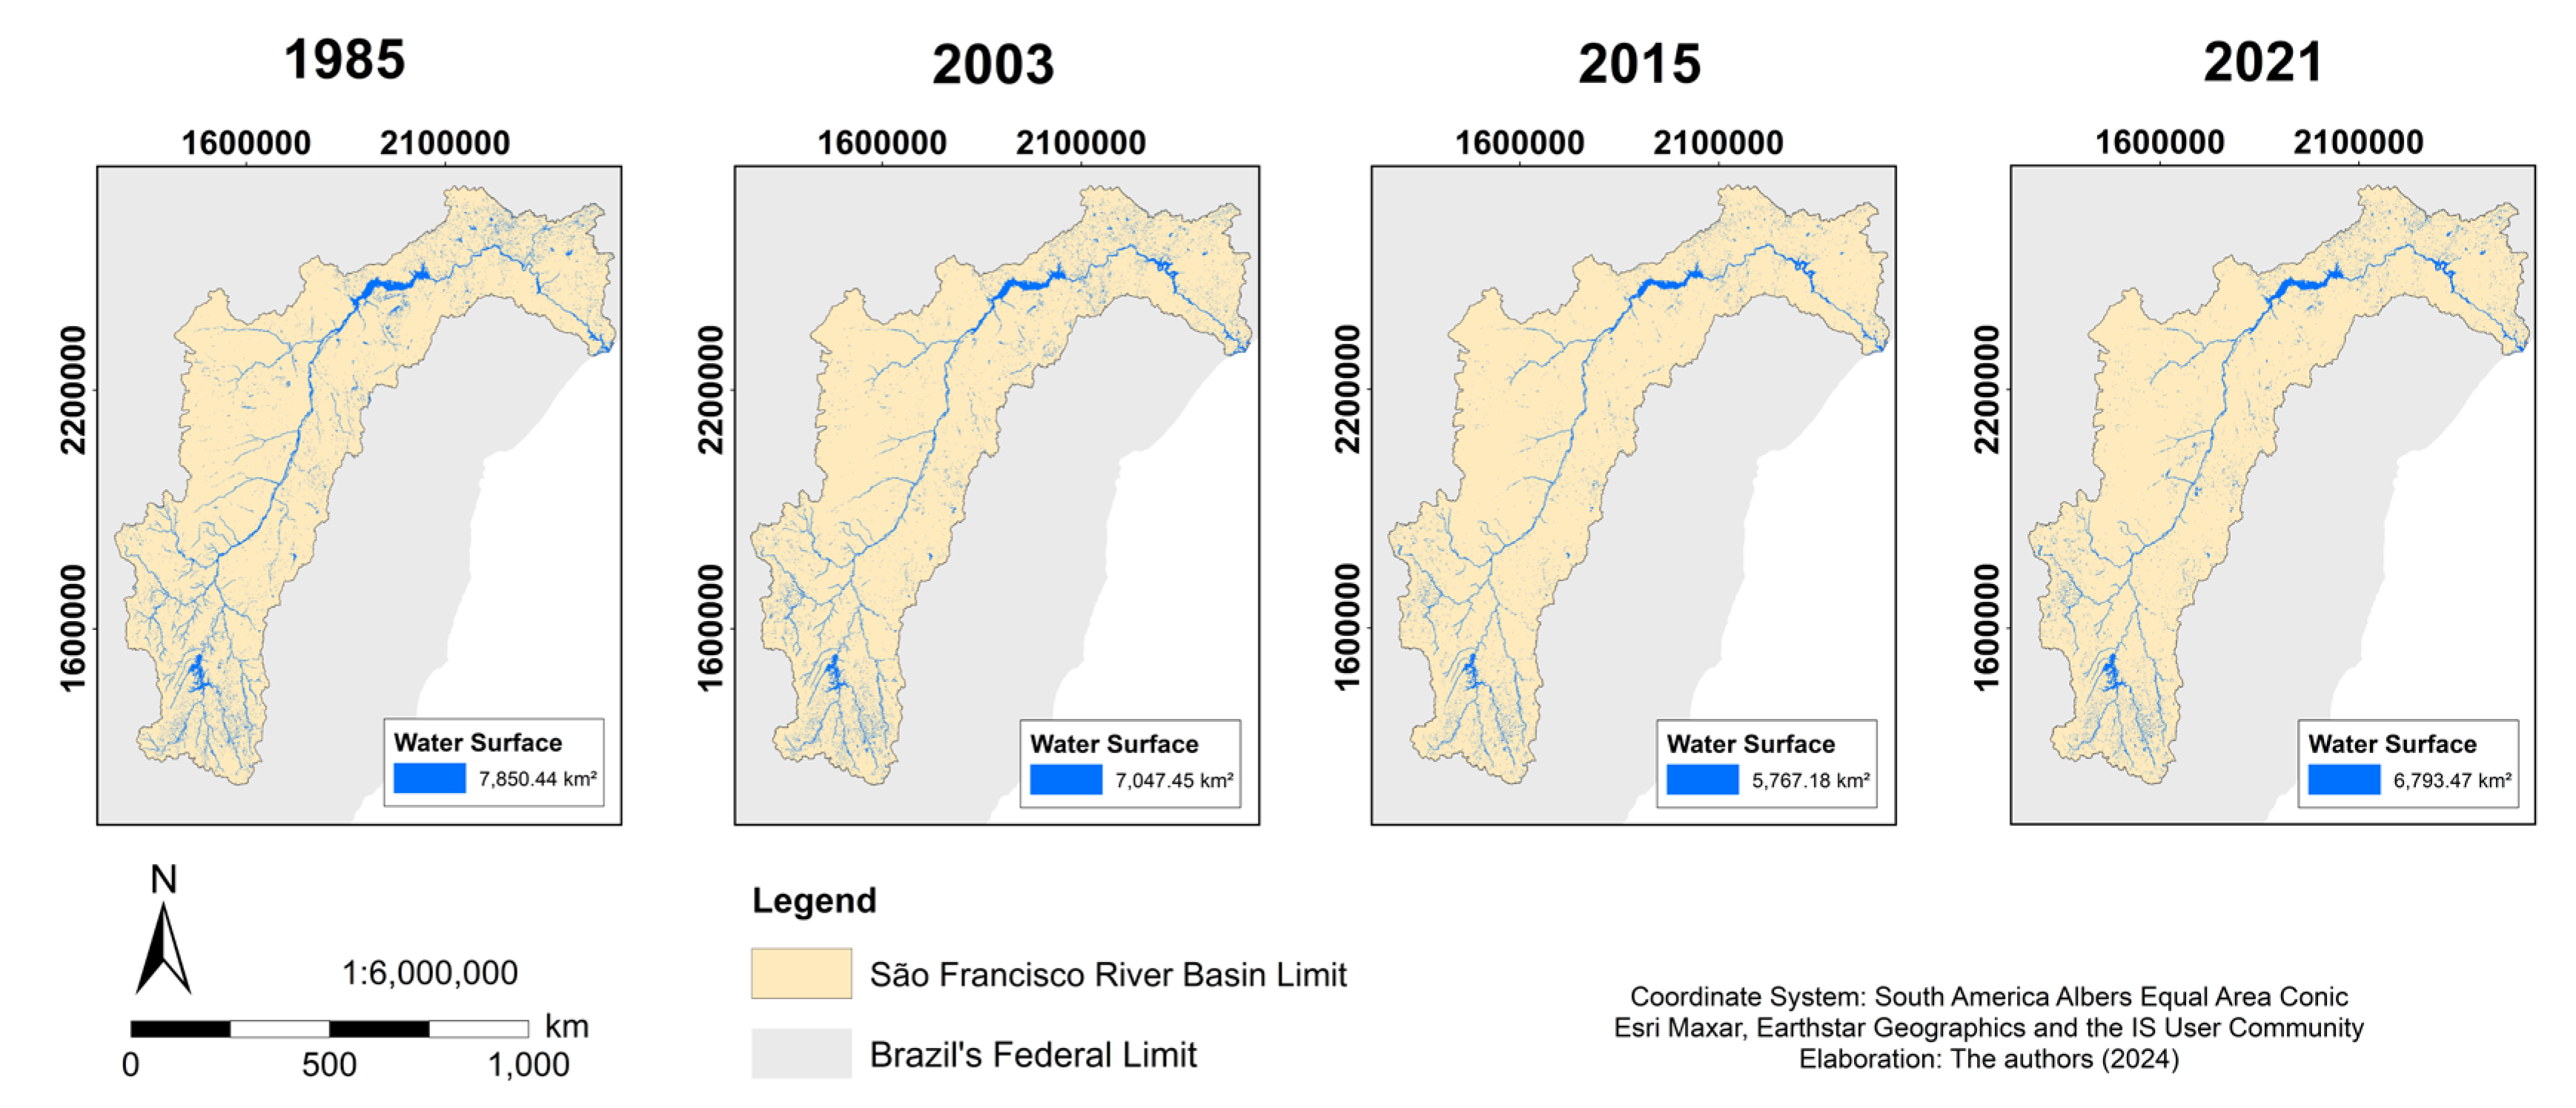
To assess the spatial distribution change over the water surface within the S. Francisco watershed (
Figure 7) four years were chosen between 1985 and 2022. These years were chosen for different intensities of La Niña and El Niño years. Namely, 1985 (Weak La Niña), 2003 (Moderate El Niño), 2015 (Very Strong El Niño), 2021 (Moderate La Niña). Results show for these years a maximum value of around 7,850.44 km
2 for 1985; whilst the minimum value was about 5,767.18 km
2 for 2015 in which a Very Strong El Niño occurred. From the spatial viewpoint, major changes are depicted between 1985 and the remaining years mainly towards the Lower physiographic region (
Figure 1 and
Figure 7) of the watershed. In this portion of the river, there are several dams the Sobradinho, the Itaparica, the Paulo Afonso, and the Xingó. It is worth noting that during the study period, several human interventions were and are still undertaken. Namely, the so-called Transposition Project of S. Francisco River devises four axes (North, East, South, and West) to divert water from the river to human, agricultural, livestock consumption, and hydroelectric production to other states. In this region water from the São Francisco River, close to Cabrobó (PE), is captured by the North Axis with 270 km of canals and sent to the interior of the states of Pernambuco, Rio Grande do Norte, Ceará, and Paraíba. Conversely, the East Axis has water withdrawal from the Itaparica Dam Lake (between Pernambuco and Bahia), in the Floresta (PE) municipality, all the way to the Paraíba River. Water is transported to a portion of the hinterland and the Agreste of Pernambuco and Paraíba via 217 km of canals. Less than 100 km separates the transposition’s two original pullout places. On February 9, 2022, the Agreste branch [
38] and the North and East axes of the Original São Francisco River Integration Project came to an end, and the Federal Government finished portions of the São Francisco River transposition, which was already 92.5% ready from prior years [
39]. The following years will determine if these interventions are going to promote an increase or decrease in the water surface, and therefore in water availability.
Though this intervention is perceived from the spatial viewpoint, results show that from 2006 (the beginning of the project) the mean yearly areas (in km
2) of water surface have decreased, nonetheless a higher value can be observed for 2022. Therefore, the study period was divided into two periods before 2006 and after 2006 (comprising the start of the ongoing interventions), and a statistical analysis was performed (
Table 2). Results show that between 1985–2006 no statistically significant trends were observed (at a 5% significance level), whilst between 2006 and 2022 a moderate statistically significant decrease trend of about 98 km
2 for each year was observed (
Table 2).
3.3. Land Use and Cover Change in the Historical Period (1985‒2022)
The land use changes between 1985 and 2022 were analyzed (
Figure 8) and the statistically significant trends by using a linear regression model (5% significance level, α) were also addressed. Five classes were analyzed, namely, forests, shrublands, cropland(ranching), build-up, and permanent water bodies.
Figure 8 shows a gradual statistically significant decrease in the percentage of shrubland areas (about 11.8%), whilst a statistically significant increase of about 12% is depicted for cropland(ranching) areas (
Table 3). Overall, no major statistically significant changes were found for the remaining classes for this period.
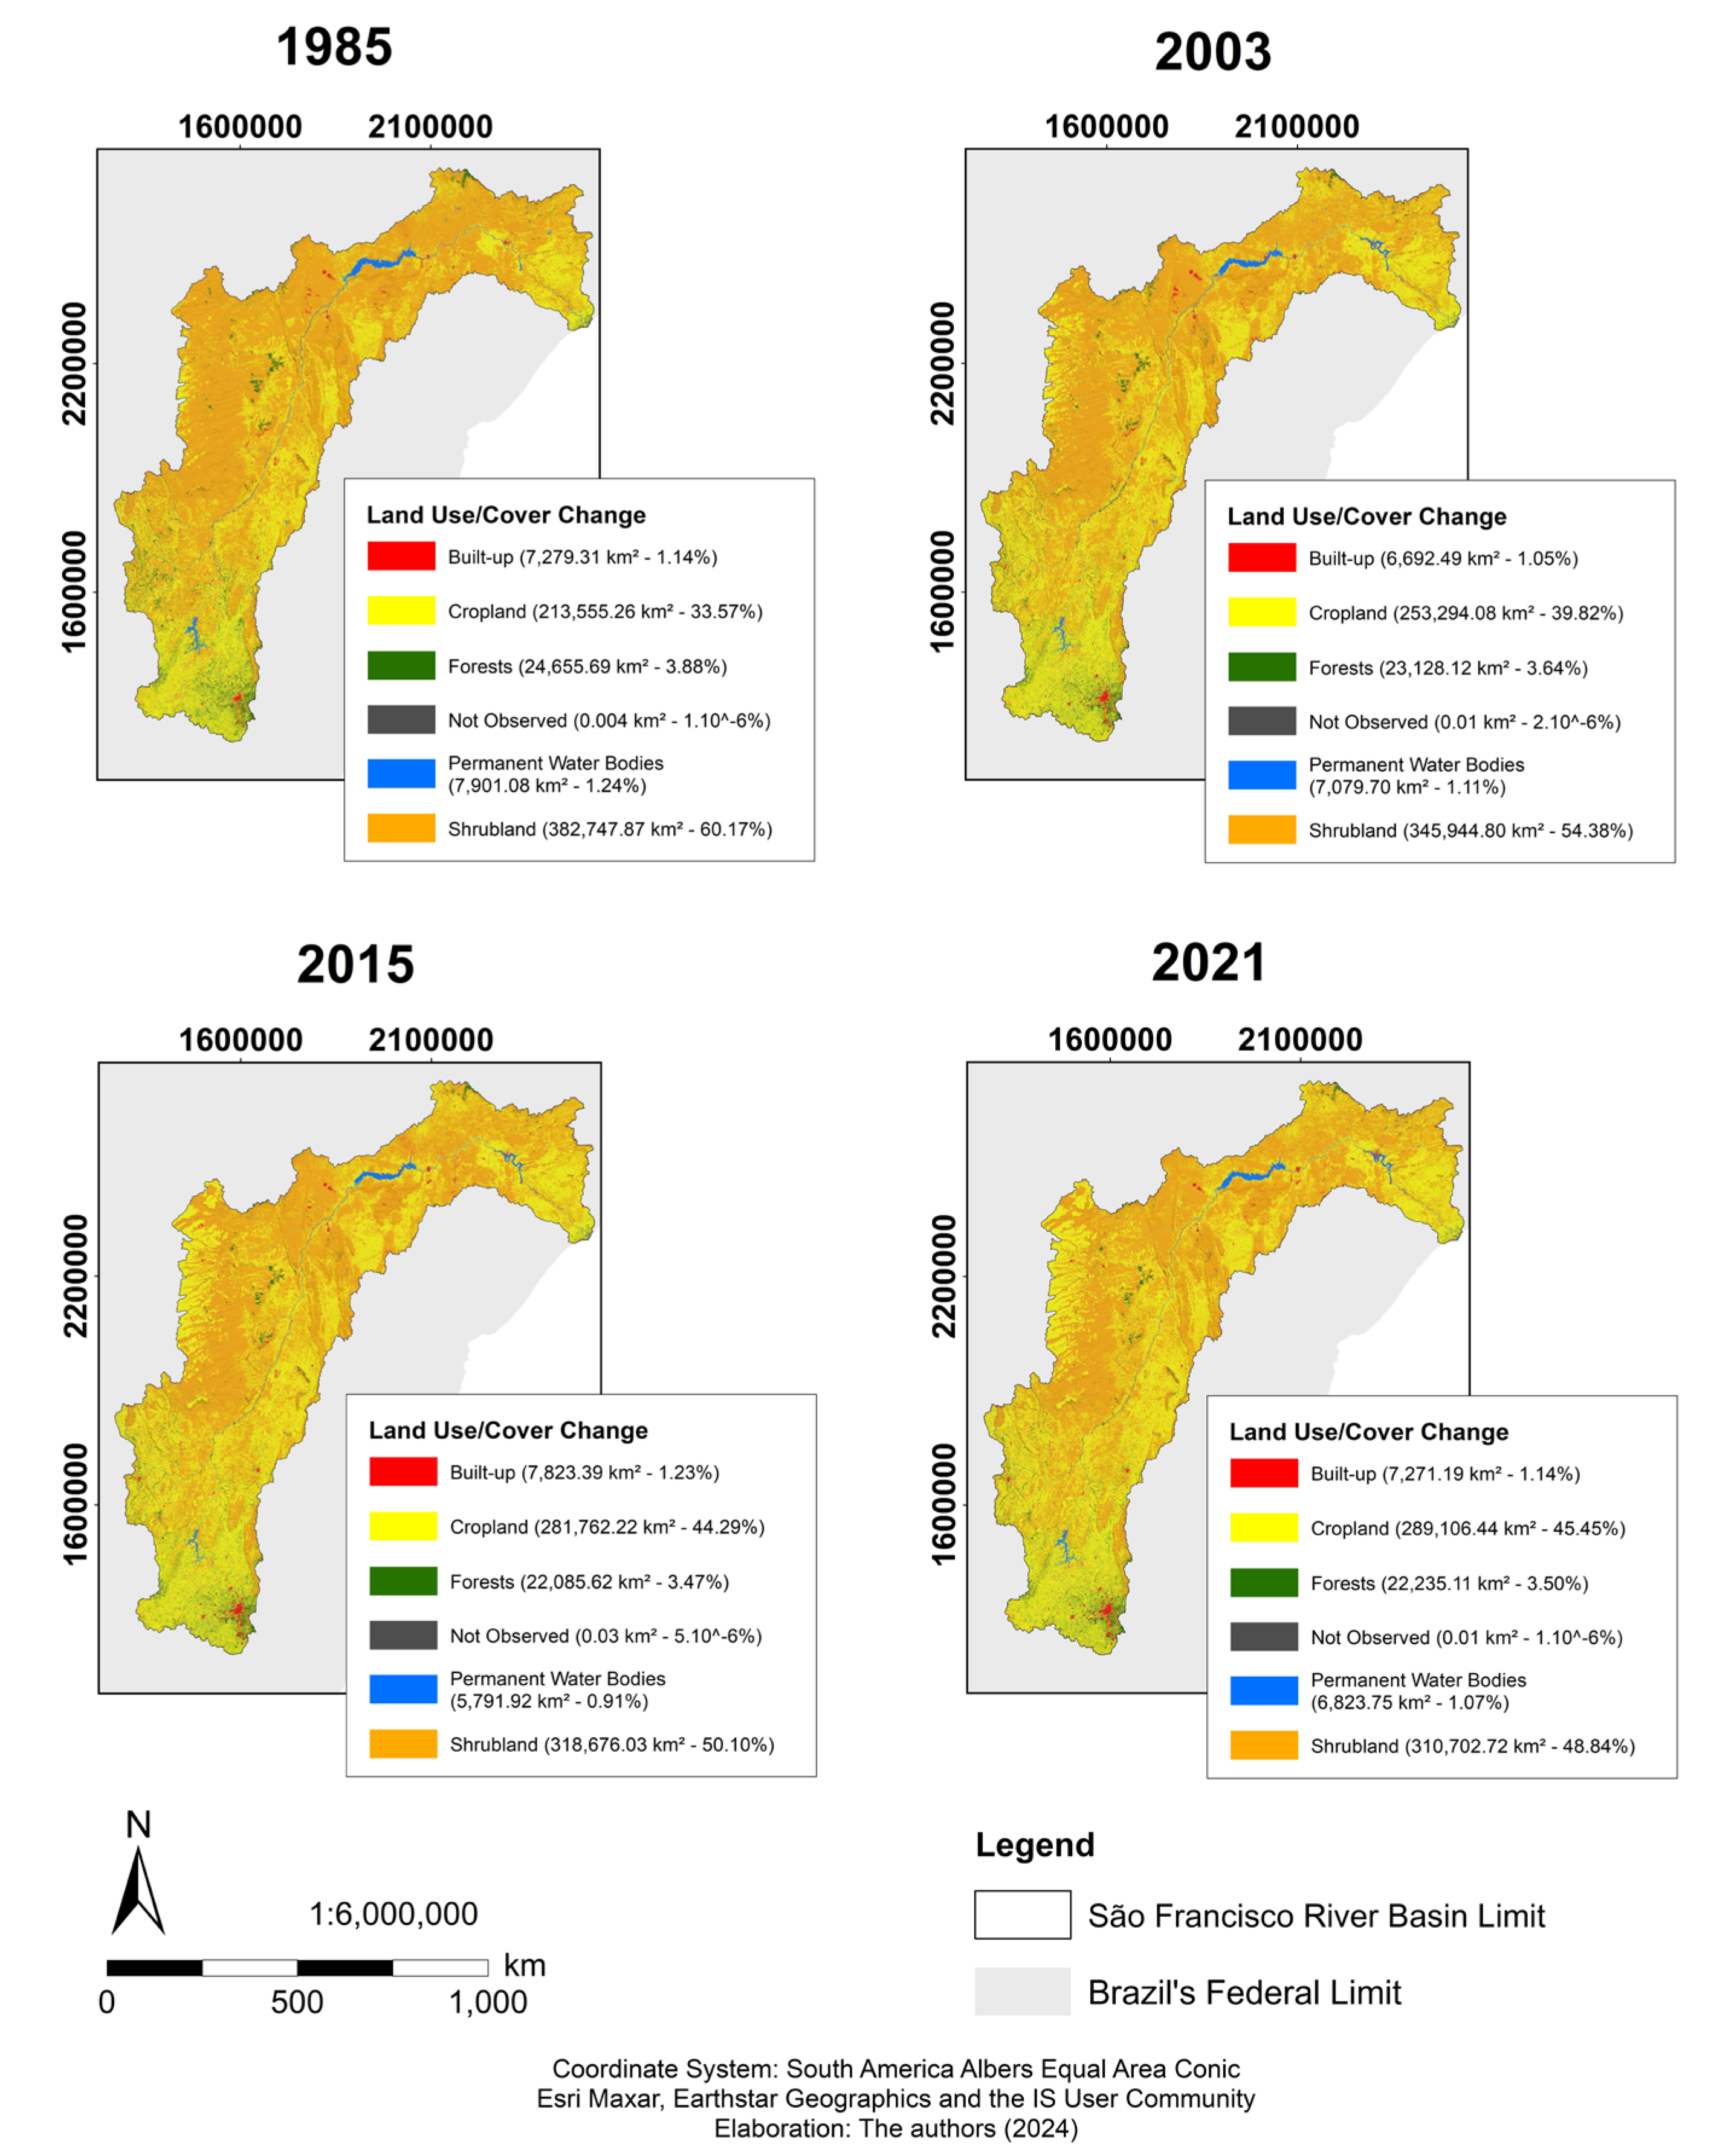
Like for the water surface to assess the spatial distribution of land use/cover change within the S. Francisco watershed (
Figure 9) four years were chosen between 1985 and 2022. These years were the ones previously selected for different intensities of La Niña and El Niño years. As aforementioned, 1985 (Weak La Niña), 2003 (Moderate El Niño), 2015 (Very Strong El Niño), 2021 (Moderate La Niña). Results show for these years only slight variations for forests (around 3.5%), build-up (around 1.1%), and permanent water bodies (around 1%) classes. Nevertheless, it is worth mentioning that the build-up and forests are located mainly in the Upper physiographic region. The results related to the forest classification are in clear accordance with the Biomes shown in
Figure 1 which shows Atlantic Forest in this area.
As expected, increasingly higher values were depicted for cropland/ranching from 33.57%, 39.82%, and 44.29% to 45.45%, respectively. With areas ranging from a minimum of 213,555.26 km
2 (1985) to a maximum of 289,106.44 km
2 (2021) of the total river basin. From the spatial viewpoint, major changes are depicted between 1985 and the remaining years mainly towards the Lower physiographic region (
Figure 1 and
Figure 9) of this watershed. Major cropland/ranching areas appeared in the vicinity of several dams the Sobradinho, the Itaparica, the Paulo Afonso, and the Xingó. Conversely, decreasingly lower values of shrublands are found (60.17%, 54.38%, 50.10%, and 48.84%) with areas ranging from a maximum of 382,747.87 km
2 (1985) to a minimum of 310,702.72 km
2 (2021) of the total watershed (
Figure 9) having in mind these four years. Overall, the results show a clear change in land use/cover mainly in the Sub-Middle and Lower physiographic regions, denoting changes from shrublands to cropland/ranching. These changes can also infer a clear shift in the related biomes, such as the Caatinga and the Atlantic Forest (from the source to the mouth, respectively).
Figure 9 shows the series of maps that illustrate the land use and cover changes in the São Francisco River basin over a span of more than three decades, from 1985 to 2021. The data highlights significant shifts in various land cover categories, including built-up areas, cropland, forests, shrubland, permanent water bodies, and areas not observed.
The extent of built-up areas has shown slight fluctuations over the years. From 1.14% in 1985, it decreased to 1.05% in 2003, increased to 1.23% in 2015, and then slightly decreased to 1.14% again in 2021. This trend indicates a relatively stable but slowly growing urbanization pattern in the basin.
There has been a significant increase in cropland, from 33.57% in 1985 to 39.82% in 2003, further increasing to 44.29% in 2015, and reaching 45.45% in 2021. This reflects an intensification of agricultural activities, likely driven by economic demands and food security needs. The forest areas have seen a decrease from 3.88% in 1985 to 3.50% in 2021, indicating ongoing deforestation. This reduction is a concern for biodiversity, climate regulation, and ecosystem services.
Shrubland, the most extensive land cover type, has decreased from 60.17% in 1985 to 48.84% in 2021. This significant decline is likely due to the expansion of cropland and other land uses. The extent of permanent water bodies has remained relatively stable, with minor fluctuations around 1.24% in 1985 and 1.07% in 2021. Areas not observed have remained consistently low, indicating minimal changes in the categories that were not observed.
3.4. Socioeconomic Evaluation of the Study Area
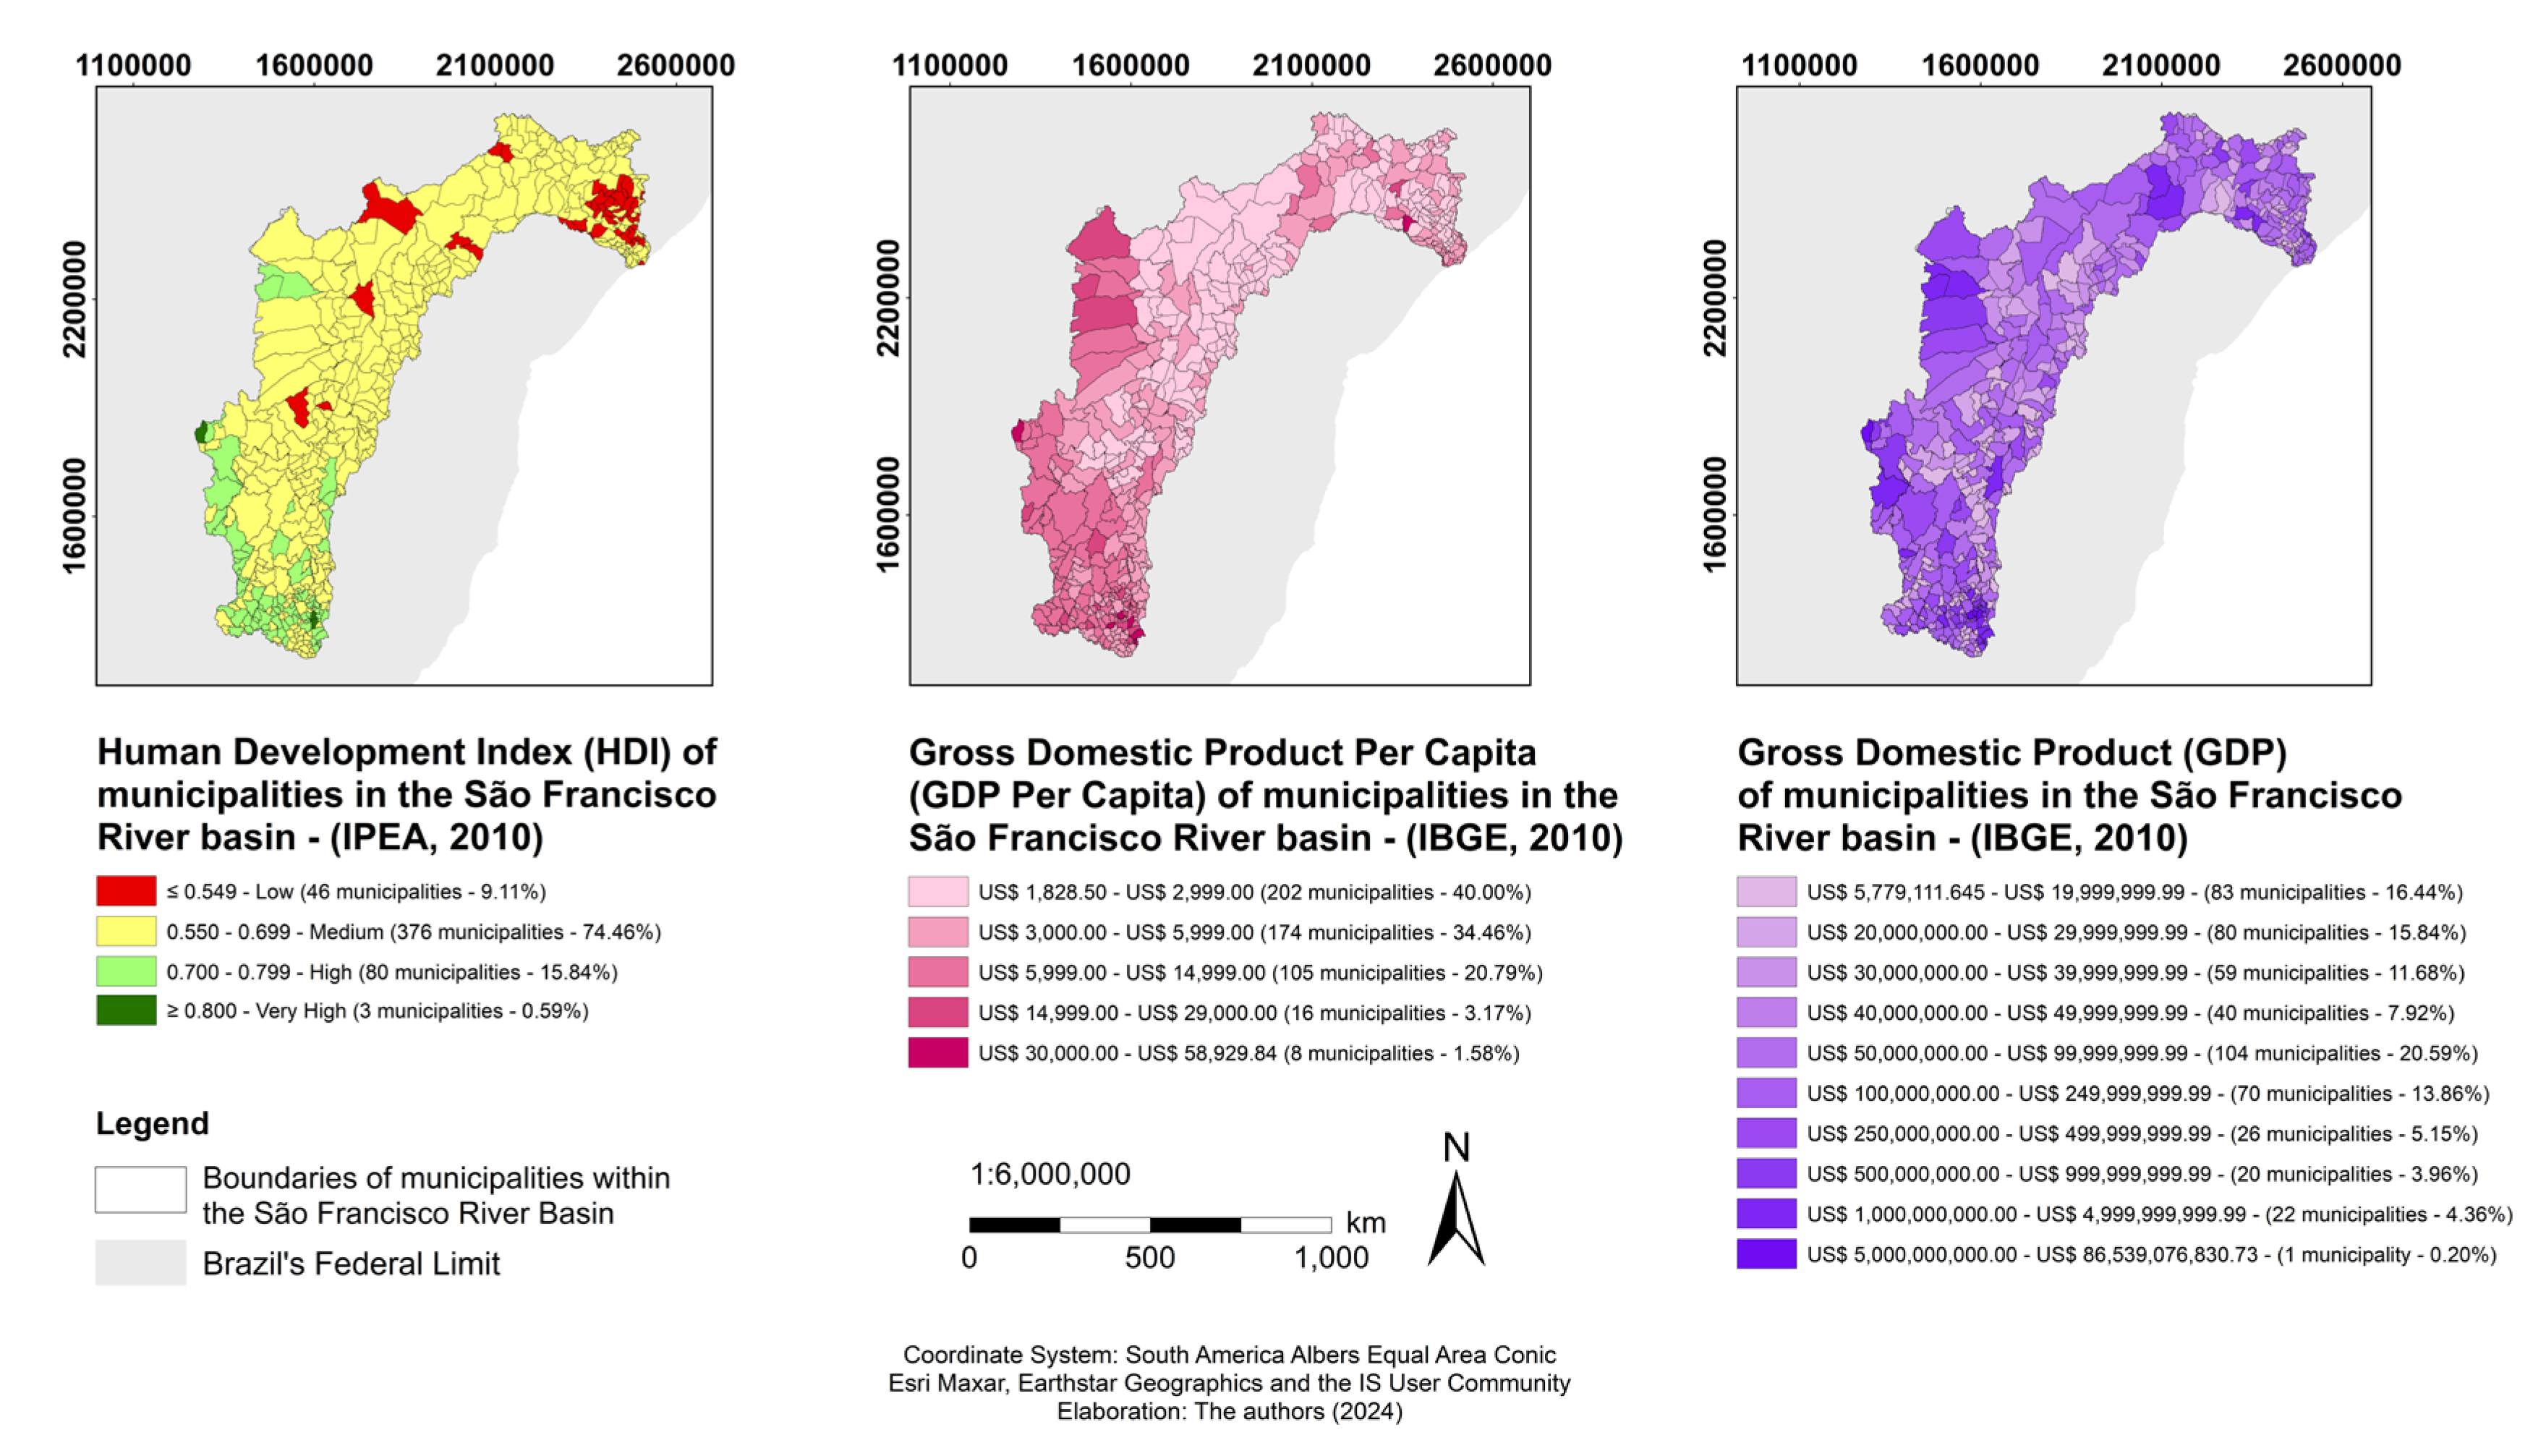
Figure 10 reveals a significant disparity in socioeconomic indicators of the municipalities in the São Francisco River basin, as evidenced by the 2010 maps. The analysis of the Human Development Index (HDI) shows that most municipalities (74.46%) have a medium human development level (0.550 - 0.699). In contrast, only 0.59% of municipalities achieve a very high human development level (≥ 0.800), while 9.11% are in the low human development range (≤ 0.549). These data indicate a significant disparity in human development within the basin, suggesting the need for public policies aimed at balancing these inequalities.
Regarding the Gross Domestic Product (GDP) per capita, the maps show that a large majority of municipalities (74.52%) have a GDP per capita below US$ 6,000.00. Specifically, 40.06% of municipalities are in the range of US$ 1,828.50 to US$ 2,999.00, and 34.46% are between US$ 3,000.00 and US$ 5,999.00. Only a small proportion (1.58%) of municipalities have a GDP per capita above US$ 30,000.00. These numbers point to a modest economic level in most areas of the basin, potentially reflecting limitations in investment in infrastructure and essential social services.
The distribution of the total GDP of municipalities also shows significant diversity. Some municipalities have significantly higher total GDPs, suggesting a concentration of economic activities in specific areas. The majority of municipalities (16.44%) have a total GDP in the range of US$ 5,779,111.645 to US$ 19,999,999.99, while only one municipality (0.20%) has an exceptionally high total GDP, above US$ 5 billion. This heterogeneous distribution highlights the existence of economic hubs within the basin, while many areas remain economically underdeveloped.
It is worth mentioning that the municipalities with the lowest HDI index are located near the mouth of the S. Francisco River (Lower physiographic region,
Figure 1), whereas the ones with the highest HDI index near the source (Upper physiographic region), except two in the southernmost part of the Middle physiographic zones. Even though located in the Middle portion of the river basin, they are further south near the boundaries of this watershed.
This index is going to be cross-referenced with demographic data retrieved from the 2010 Census.
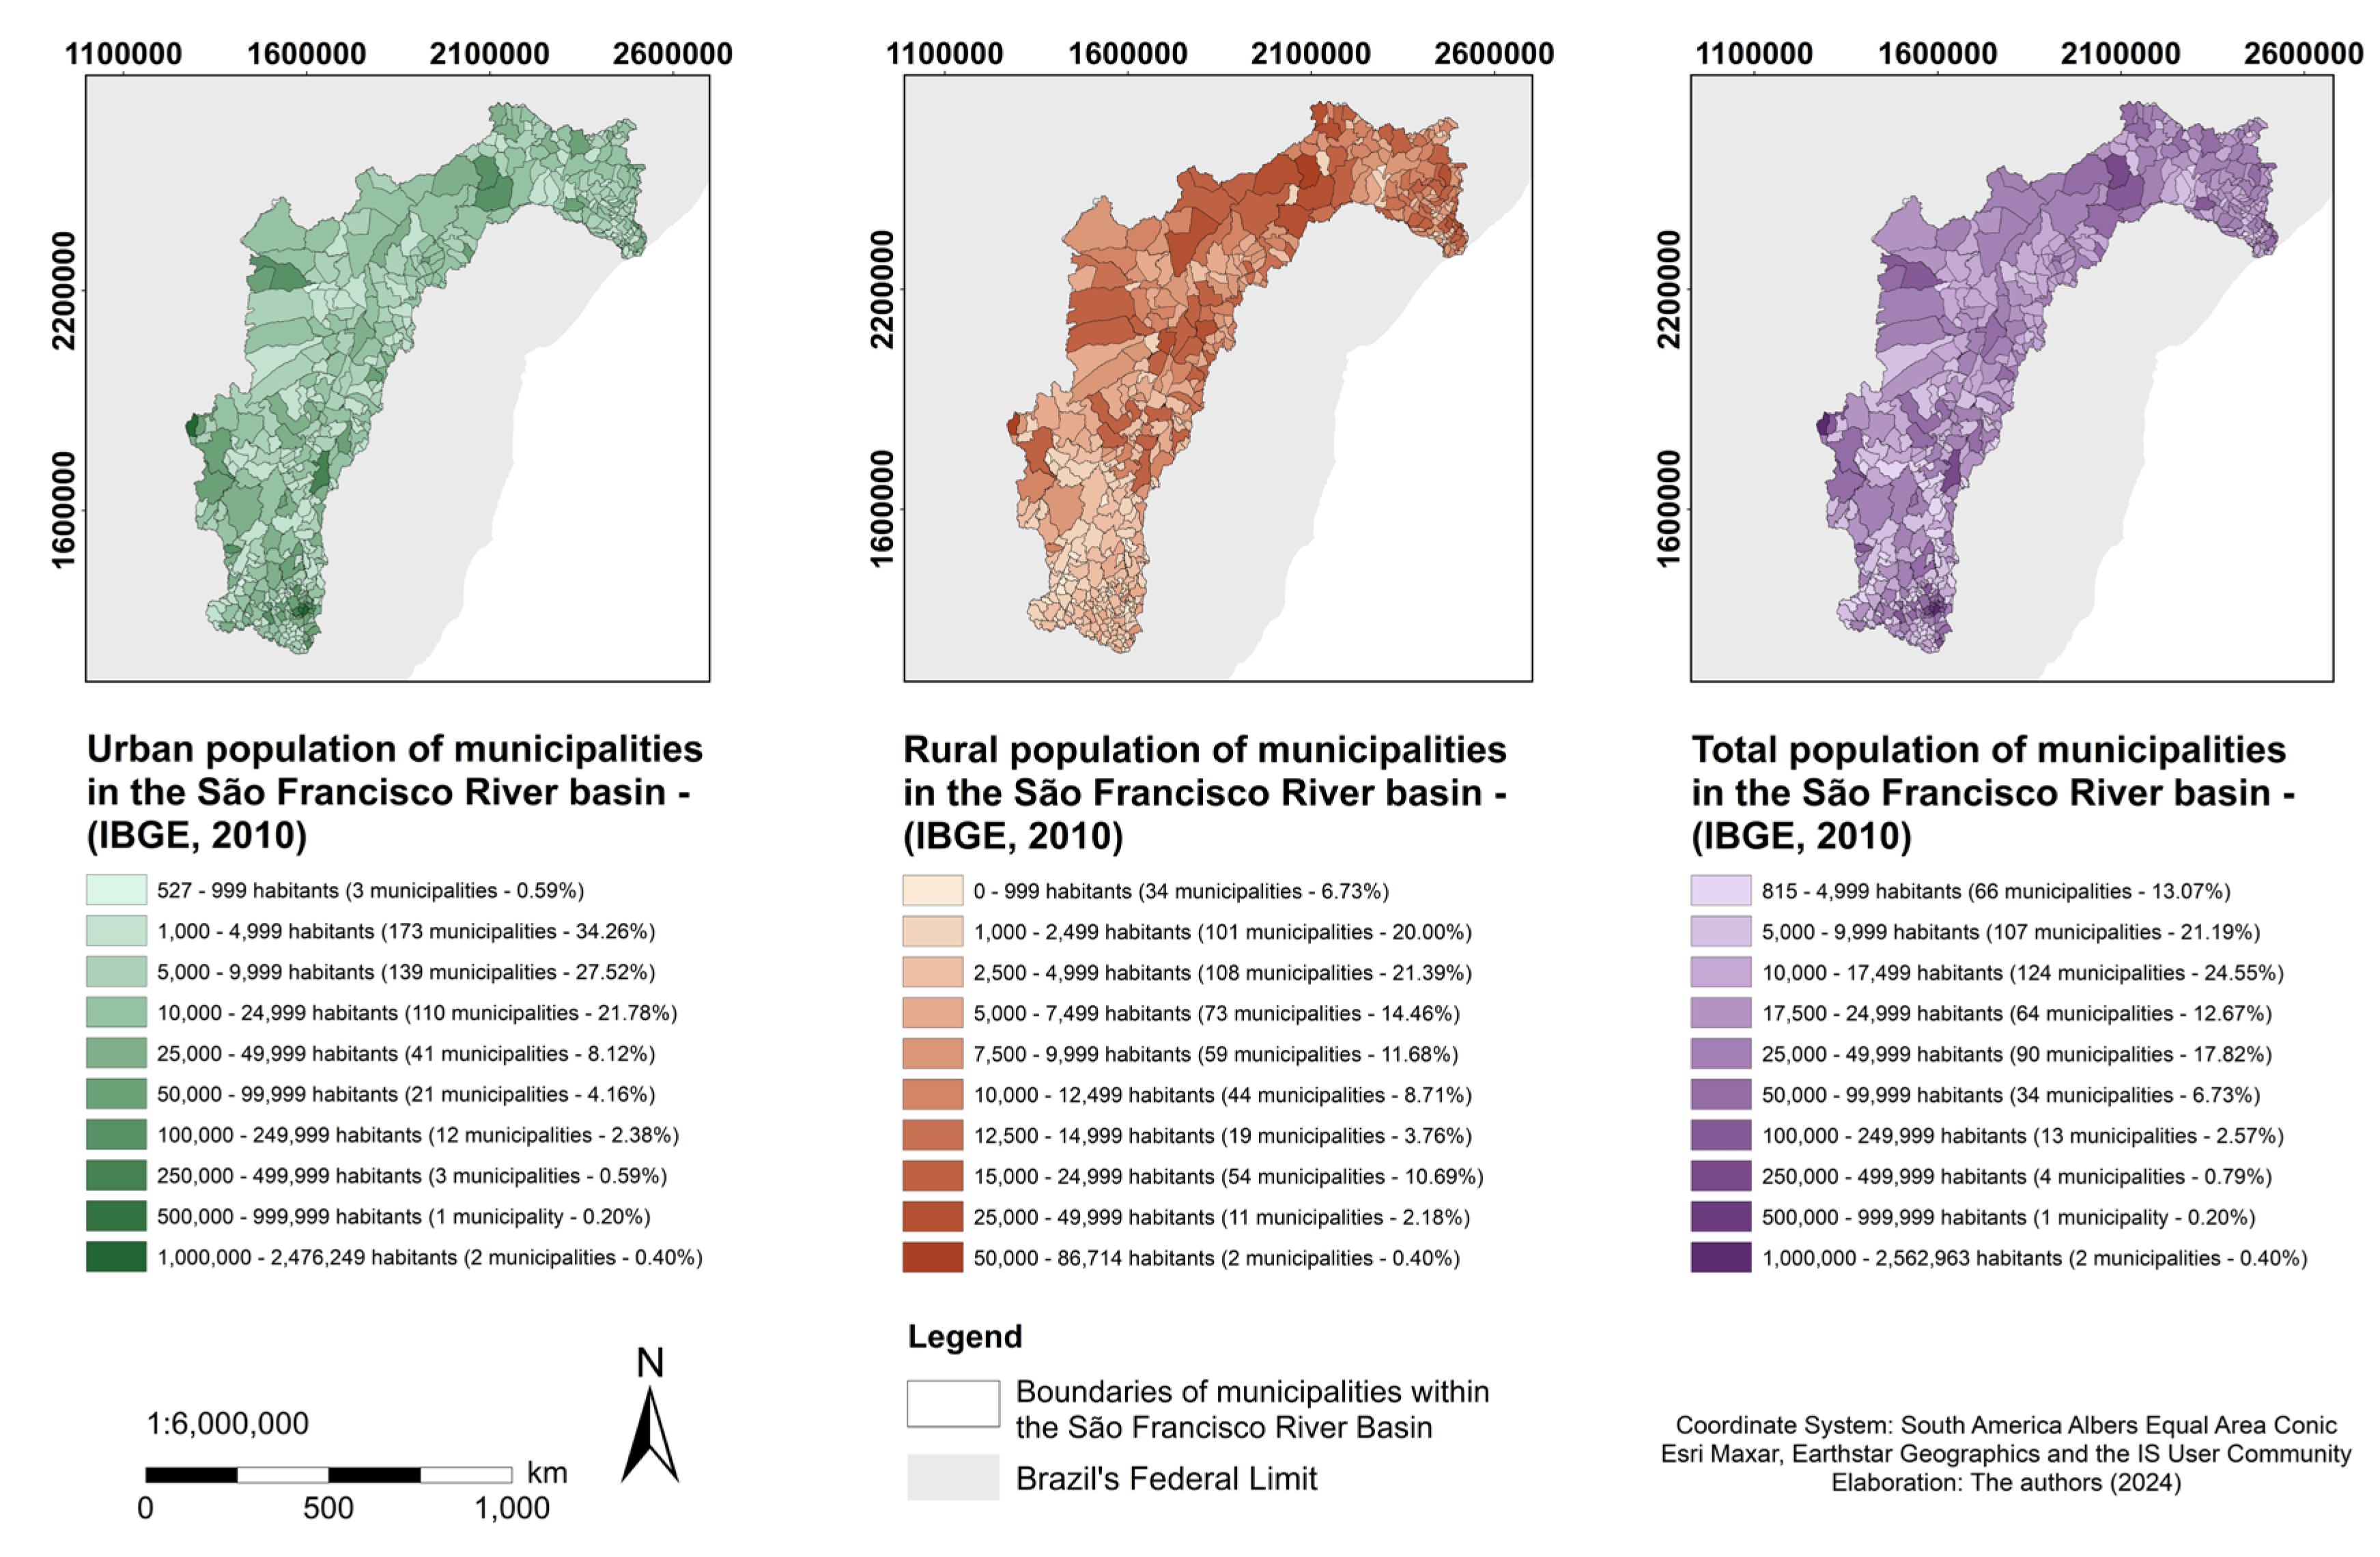
Figure 11 provides a detailed view of the population distribution in the municipalities of the São Francisco River basin in 2010, divided into urban, rural, and total populations. Analyzing this demographic data is crucial for understanding the social dynamics of the basin and its relationship with environmental and climatic aspects.
The first map shows the urban population of the municipalities. Most municipalities (34.26%) have between 1,000 and 4,999 urban inhabitants, followed by 27.52% with an urban population between 5,000 and 9,999 inhabitants. In contrast, only 0.40% of municipalities have urban populations exceeding 1,000,000 inhabitants, indicating that large urban centers are rare in the basin. The distribution shows a predominance of small and medium-sized cities, reflecting a relatively dispersed urban development.
The second map illustrates the rural population. Notably, 21.39% of municipalities have between 2,500 and 4,999 rural inhabitants, and 20.00% have between 1,000 and 2,499 rural inhabitants. Municipalities with large rural populations (>50,000 inhabitants) are extremely rare (0.40%). This data suggests that the basin has a considerable rural population, but it is widely distributed in small communities. This can have significant implications for natural resource management and agricultural policies.
The third map shows the total population of the municipalities. Most municipalities (24.55%) have a total population between 10,000 and 17,499 inhabitants, while 21.19% have between 5,000 and 9,999 inhabitants. Large population concentrations (>1,000,000 inhabitants) are rare (0.40%). This distribution indicates that the basin is primarily composed of small and medium-sized municipalities, which may influence infrastructure, public services, and the capacity to respond to extreme weather events.
The first set of maps highlights the socioeconomic disparities within the basin, with significant variations in the Human Development Index (HDI), Gross Domestic Product (GDP) per capita, and total GDP of municipalities. The HDI map shows that most municipalities fall within the medium development range, while only a small fraction achieves high or very high development levels. This socioeconomic context is crucial for interpreting the population distribution shown in the second set of maps.
The second set of maps provides detailed demographic data, showing the distribution of urban, rural, and total populations across the basin. The predominance of small and medium-sized municipalities, with dispersed rural populations, aligns with the medium HDI and lower GDP per capita observed in the first set of maps. This suggests that socioeconomic development is constrained by demographic factors, where smaller populations may limit economic activities and access to services.
Results indicate that the top three municipalities in terms of demographics also boast the highest HDI values, despite their locations in different physiographic regions within the study area—one in the Upper and the other in the Middle. Notably, these municipalities, Brasília (the capital of the Federal District and Brazil, with an HDI of 0.824) and Belo Horizonte (the capital of the state of Minas Gerais, with an HDI of 0.810), have predominantly urban populations ranging between 1,000,000 and 2,000,000. Nova Lima, another municipality in the metropolitan area of Belo Horizonte, ranks second in HDI, surpassing even Belo Horizonte itself, with 0.813 of HDI. Additionally, a discernible pattern emerges when examining demographic data by rural and urban populations. The lower demographic classes tend to concentrate in the southern region of the S. Francisco River basin, encompassing its Upper and part of its Middle physiographic zones. Conversely, the higher classes are predominantly situated in the northernmost areas, particularly within the Sub-middle segment of the river basin (see
Figure 10 and
Figure 11).
4. Discussion
A nation’s perspective and response to climate change are influenced by its political, cultural, and scientific contexts as well as by the unique features of its changing climate and the perceived and real effects of the phenomenon in the future. The climate of a region has a profound influence on water management and resources, mostly in the primary sector e.g., agriculture, livestock, and agroforestry systems. Climate strongly influences not only the distribution and abundance of species on Earth but also the distribution of ecosystem types. Consequently, climate impacts not only the environment and agriculture activities but also human-related activities (for example, water supply, availability, and quality, energy generation, tourism, and fishing) therefore the assessment of both distribution and evolution is considered highly relevant.
The scope of the present study is focused on analyzing the projected changes in the spatial distribution of the Köppen-Geigen climate classification. Aiming at determining the climatic evolution in the S. Francisco River basin, three periods (1970−2000, 1981−2022) in the past and 2041–2060 in the near future are investigated from an ensemble of GCMs under two SSPs, SSP2 and SSP5. Although [
19] had produced a KG climate classification map for Brazil, this study uses a newly state-of-the-art dataset with a high resolution (10-minute grid) and provides projections for 2041–2060 under SSP2 and SSP5, thus taking a step forward concerning this previous work.
The hydrological cycle is driven by the climate, thus changes in one will inevitably affect the other [
40]. The scientific community has increasingly come to understand the significance of climate change’s effects on water supplies and the water cycle because of extreme events like droughts, floods, and heat waves. Future freshwater resource availability, water supply, and resource quality for human use will all be impacted by climate change [
41,
42,
43]. A few of the principal reservoirs on the São Francisco River are Três Marias in Minas Gerais, Sobradinho in Paulo Afonso, and Itaparica in Bahia and Xingó, which are situated between the states of Alagoas and Sergipe, for managing the river’s flow and/or producing hydroelectric power. The São Francisco River watershed has seen unfavorable hydrometeorological conditions since 2013, including below-average precipitation and flows, which has had an impact on the reservoirs’ storage levels. In the future, due to the outcomes projected in this research, this impact may have a greater effect on this region.
The observed land use and cover changes in the São Francisco River basin reflect broader socio-economic and environmental dynamics at play in the region. The substantial increase in cropland highlights the growing agricultural activities in the basin, driven by both national and global food demands. According to [
44], such expansions often lead to the conversion of natural habitats into agricultural lands, resulting in biodiversity loss and altered ecosystem functions. The decrease in forested areas and shrublands corroborates this tendency, posing risks to soil health, water quality, and carbon sequestration capabilities [
45].
The gradual increase in built-up areas, although less pronounced than agricultural expansion, points to ongoing urbanization. Urban growth can lead to increased surface runoff and reduced groundwater recharge, exacerbating flood risks and water scarcity issues, especially in a river basin context [
46]. The relatively stable extent of permanent water bodies suggests that, despite significant land cover changes, major water bodies have not been extensively altered. However, the qualitative state of these water resources could still be impacted by surrounding land use changes. For instance, increased cropland can lead to higher nutrient runoff into rivers, causing eutrophication and other water quality issues [
47].
The land use changes observed have direct implications for the basin’s climate resilience. Deforestation and reduction in shrublands reduce the natural carbon sink capacity, contributing to higher atmospheric CO
2 levels and enhanced greenhouse effects [
48]. Moreover, changes in land cover can affect local climate patterns, potentially altering precipitation and temperature regimes, which are critical for both agricultural productivity and ecosystem stability.
The São Francisco River basin’s socioeconomic reality exhibits stark differences between states, between regions, between urban and rural areas, and even between population groups, which largely reproduces the inequality that currently exists in Brazilian society. Social indicators such as the infant mortality rate (which varies from 25.66% in Minas Gerais to 64.38% in Alagoas), the Human Development Index (HDI) (which varies from 0.823 in the Upper São Francisco, where the Metropolitan Region of Belo Horizonte is located, to 0.538 in the other sub-basins), and GDP per capita (which varies from R
$5,239 in Minas Gerais to R
$2,275 in Alagoas) are some of the key social indicators that were identified in the Ten-Year Plan for Water Resources of the Basin [
49]. The Upper São Francisco is home to the highest population concentration, with an estimated population of about 15 million. There are striking differences in the demographic profile between areas with high wealth and density of people and others with low income and density of inhabitants. There are records of significant drought episodes in the semi-arid region that make up around 54% of the river basin’s total area. However, the natural diversity is striking, spanning four biomes: the river’s estuary habitat, the Caatinga, the Cerrado, and isolated areas of the Atlantic Forest. The KG climate classification system predicted changes in the future show that these ecosystems might endure severe changes due to the disappearance of the Mediterranean-like climate types, namely, the hot-summer (Csa) and warm-summer (Csb) Mediterranean climates. This projected disappearance will be followed by a striking increase in the semi-arid hot (BSh) steppe-like climate, mainly under SSP5.
Regarding the economy, some regions are more heavily considered than others due to the existence of industries and agro-industries. These include the Upper, Middle, and Sub-Middle regions; these include the extractive industrial zones of Minas Gerais, as well as the agro-industrial centers of grain and fruit growing in the North and West of Bahia and the South of Pernambuco. Although there has been a notable increase in aquaculture, tourism, and leisure, the Lower Lands’ riverine socio-economy is still heavily reliant on traditional fishing and farming. The aforementioned predicted changes in KG will mainly be localized in the source and mouth of the S. Francisco River basin, increasing the stress over the natural resources and population, mainly the rural. Particularly in these increasingly semi-arid areas, the rising demand for irrigation water may result in reduced food security and increasing susceptibility of impoverished rural farmers [
50]. The nation’s hydroelectric power production may be impacted by modifications to the basins’ flow patterns [
51] even though the transposition plan is undertaken.
There has been a call for greater attention to be paid to understanding how local climate change policy relates to the day-to-day operations of local governance due to increased recognition of the degree to which these governments’ efforts to implement climate change policies are embedded within specific local environmental, political, cultural, and decision-making contexts [
52].
5. Conclusions
The Köppen-Geiger (KG) climate classification system is analyzed, and climate change impacts are inferred for this watershed located in central-eastern Brazil For this entire region, one of the most important water supplies is the São Francisco River, one of Brazil’s largest. With a surface area of 634,978.27 km2, or over 8% of Brazil’s entire land area, the basin extends almost 2,792.63 km. The basin provides water for almost all uses, including irrigation, agriculture, hydropower, transportation, and domestic and commercial supply. The research’s study area will be this because of its relevance and impact on its future sustainability.
The findings indicate that under both SSPs, the Mediterranean-like climatic types—hot summer (Csa) and warm summer (Csb)—will vanish by 2070. It is projected that this region will only have three of the five climatic types depicted in the historical period. Additionally, the results indicate that under SSP5, the area of tropical savanna with dry winter (Aw) would recede by about 1.3%. On the other hand, under SSP2, it is expected that the tropical savanna with dry summer regions (As) will grow to a maximum of 2.2%. Lastly, it is important to remember that the semi-arid hot (BSh) steppe-like climate type is expected to see the most growth, estimated to be over 10% under SSP5 and 9.3% under SSP2. In general, the results indicate a rise in locations within the S. Francisco River basin with drier or arid conditions through 2070 and under both SSPs.
This change in climate types is followed by a projected increase in future temperatures (from 4 to 5°C) and a decrease in precipitation (up to 650 mm depending on the SSPs). The Source (Upper and the southernmost Middle physiographic regions of the basin) and the mouth (the northernmost part of the Sub-middle region and Lower physiographic regions of the basin) of the São Francisco watershed are estimated to endure the major impacts of this climate change. Particularly, the projected increases in mean air temperatures and decrease in total precipitation point out major detrimental effects on the Sub-middle and Lower physiographic regions, already the most affected by aridity conditions. A change in the seasonal cycle is also predicted by monthly mean values assessed by the ombrothermic graphic results.
Future freshwater resource availability, water supply, and resource quality for human use will all be predicted to be impacted due to the location of the areas identified to become more vulnerable to the changes in climate. Indeed, almost all forms of water consumption are served by the basin, including irrigation, fishing, hydropower, and transportation in addition to home and industrial supply. Eleven percent of Brazil’s total irrigated area, or more than 330,000 hectares, is used for intensive agriculture. With a capacity of over 10,500 MW, the hydroelectric power currently produced can easily in the future impact the supply of the millions of people living in the basin. Consequences on ecosystems, agriculture, and the socioeconomic reality of the São Francisco River basin might deepen the current contrasts between regions, urban and rural areas, and even between population groups, thus translating to a larger extent, the inequality that still characterizes Brazilian society. Indeed, results show that the municipalities currently with the lowest HDI index (HDI<0.5) are found in the Lower physiographic region, while the municipalities with the highest HDI index (HDI>0.8) are found near the Upper Physiographic Region (
Figure 1), except for two municipalities in the southernmost region of the Middle physiographic zones. These are precisely the predicted areas identified in this research to endure the major impacts of climate change.
Overall, a progressive approach to adaptative governance may be the answer to the sustainability of this river basin. In this case, the engagement of farmers and local communities, as well as the enhancement of stakeholder perspectives on the development of adaptation strategies, are crucial. Public perceptions play a significant role in how people see their responsibilities to address climate change. Those who can act as agents of problem resolution themselves do not recognize the difference between verbal worry and behavior. Ultimately, it is critical that routes to a shared objective—adapting to and mitigating the predictable impacts of climate change in the S. Francisco River basin—are established through interdisciplinary and integrated research involving stakeholders, the local population, and decision-makers.
The maps of land use and cover change in the São Francisco River basin from 1985 to 2021 provide valuable insights into the region’s socioeconomic and environmental dynamics. The increasing trend in agricultural land highlights the need for sustainable agricultural practices to balance economic needs with environmental conservation. The relatively stable urban growth points to moderate urbanization pressures, but planning is essential to mitigate potential environmental impacts.
For future projections and policymaking, it is crucial to integrate these land use trends with climate models to anticipate and manage the impacts of climate change on the basin’s hydrology, biodiversity, and human populations. Sustainable land management practices, reforestation initiatives, and effective water resource management are vital strategies to enhance the resilience of the São Francisco River basin in the face of ongoing environmental changes.
The demographic maps of the São Francisco River basin offer valuable insights into population distribution and its impacts on climate resilience and sustainable development. Integrating these data into climate-environmental analyses allows for more effective strategies to address future challenges.
Municipalities with medium HDI and low GDP per capita face substantial challenges in human and economic development. These inequalities, due to unequal resource access and inadequate infrastructure, could make these areas particularly vulnerable to extreme weather events.
To promote balanced and resilient development, public policies must reduce socioeconomic inequalities. Investments in basic infrastructure and social services are crucial in low-HDI areas to improve quality of life and foster sustainable development. Training and education programs are vital for enhancing workforce qualifications and economic opportunities.
Encouraging sustainable economic activities that address regional environmental challenges is also crucial. Policies promoting sustainable agriculture, proper water resource management, and renewable energy investments can significantly enhance the basin’s economic and environmental resilience. Integrating these strategies into long-term development plans will help ensure all municipalities can thrive amid future climatic and socioeconomic challenges.
Author Contributions
Cristina Maria Mendes Andrade: Funding Acquisition, Project administration, Supervision, Conceptualization, Data curation, Formal analysis, Methodology, Software, Validation, Visualization, and Writing. Irving Rodrigues de Souza: Conceptualization, Data curation, Formal analysis, Methodology, Software, Validation, Visualization, and Writing. Luiz Tadeu da Silva: Conceptualization, Data curation, Formal analysis, Methodology, Validation, Visualization, and Writing.
Funding
This research was funded by National Funds by FCT ‒ Portuguese Foundation for Science and Technology, under the project UIDB/04033/2020.
Institutional Review Board Statement
Not applicable.
Informed Consent Statement
Not applicable.
Data Availability Statement
Not applicable.
Acknowledgments
The authors are greatly thankful to Technological Research Institute of Tomar - Laboratory of Applied Research in Natural Hazards (NHRC.IPT - Portugal) for supporting this research and the National Funds by FCT - Portuguese Foundation for Science and Technology, under the project UIDB/04033/2020.
Conflicts of Interest
The authors declare no conflict of interest.
Figure A1.
Boundaries of the states of Brazil and the Federal District within the S. Francisco River Basin (Data retrieved from [
53]).
Figure A1.
Boundaries of the states of Brazil and the Federal District within the S. Francisco River Basin (Data retrieved from [
53]).
Table A1.
Oceanic Niño Index (ONI) from 1984 to 2023 (in which Weak (W), Moderate (M), Strong (S), and Very Strong (VS)) for a minimum of three consecutive, overlapping three-month periods (adapted from [
53]).
Table A1.
Oceanic Niño Index (ONI) from 1984 to 2023 (in which Weak (W), Moderate (M), Strong (S), and Very Strong (VS)) for a minimum of three consecutive, overlapping three-month periods (adapted from [
53]).
| ENSO |
1984–1985 |
1985–1986 |
1986–1987 |
1987–1988 |
1988–1989 |
1989–1990 |
1990–1991 |
1991–1992 |
| EL Niño |
|
|
M |
S |
|
|
|
S |
| La Niña |
W |
|
|
|
S |
|
|
|
| |
1992–1993 |
1993–1994 |
1994–1995 |
1995–1996 |
1996–1997 |
1997–1998 |
1998–1999 |
1999–2000 |
| EL Niño |
|
|
M |
|
|
VS |
|
|
| La Niña |
|
|
|
M |
|
|
S |
S |
| |
2000–2001 |
2001–2002 |
2002–2003 |
2003–2004 |
2004–2005 |
2005–2006 |
2006–2007 |
2007–2008 |
| EL Niño |
|
|
M |
|
W |
|
W |
|
| La Niña |
W |
|
|
|
|
W |
|
S |
| |
2008–2009 |
2009–2010 |
2010–2011 |
2011–2012 |
2012–2013 |
2013–2014 |
2014–2015 |
2015–2016 |
| EL Niño |
|
M |
|
|
|
|
W |
VS |
| La Niña |
W |
|
S |
M |
|
|
|
|
| |
2016–2017 |
2017–2018 |
2018–2019 |
2019–2020 |
2020–2021 |
2021–2022 |
2022–2023 |
|
| EL Niño |
|
|
W |
|
|
|
|
|
| La Niña |
W |
W |
|
|
M |
M |
W |
|
Figure A2.
Climograph plotted at monthly intervals for (a) 1970‒2000, and 2041‒2060 under (b) SSP2 and (c) SSP5 for the S. Francisco River basin.
Figure A2.
Climograph plotted at monthly intervals for (a) 1970‒2000, and 2041‒2060 under (b) SSP2 and (c) SSP5 for the S. Francisco River basin.
Figure A3.
Differences between 2041‒2060 under SSP2 (a, c) and SSP5 (b, d), and 1970‒2000 for mean total precipitation (in mm) (upper row) and mean air temperatures (in °C) (lower row) for the S. Francisco River basin.
Figure A3.
Differences between 2041‒2060 under SSP2 (a, c) and SSP5 (b, d), and 1970‒2000 for mean total precipitation (in mm) (upper row) and mean air temperatures (in °C) (lower row) for the S. Francisco River basin.
References
- IPCC. Climate Change 2022: Impacts, Adaptation and Vulnerability. Contribution of Working Group II to the Sixth Assessment Report of the Intergovernmental Panel on Climate Change; Pörtner, H.-O., Roberts, D.C., Tignor, M., Poloczanska, E.S., Mintenbeck, K., Alegría, A., Craig, M., Langsdorf, S., Löschke, S., Möller, V., et al., Eds.; Cambridge University Press: Cambridge, UK; New York, NY, USA, 2022; p. 3056. [Google Scholar]
- de Macedo, M.B.; Lago, C.A.F.D.; Mendiondo, E.M.; Giacomoni, M.H. Bioretention performance under different rainfall regimes in subtropical conditions: A case study in São Carlos, Brazil. J. Environ. Manag. 2019, 248, 109266. [Google Scholar] [CrossRef] [PubMed]
- Banjara, M.; Bhusal, A.; Ghimire, A.B.; Kalra, A. Impact of Land Use and Land Cover Change on Hydrological Processes in Urban Watersheds: Analysis and Forecasting for Flood Risk Management. Geosciences 2024, 14, 40. [Google Scholar] [CrossRef]
- Kumar, S.; Guntu, R.K.; Agarwal, A.; Villuri, V.G.K.; Pasupuleti, S.; Kaushal, D.R.; Gosian, A.K.; Bronstert, A. Multi-objective optimization for stormwater management by green-roofs and infiltration trenches to reduce urban flooding in central Delhi. J. Hydrol. 2022, 606, 127455. [Google Scholar] [CrossRef]
- Konapala, G.; Mishra, A.K.; Wada, Y.; Mann, M.E. Climate Change Will Affect Global Water Availability through Compounding Changes in Seasonal Precipitation and Evaporation. Nat. Commun. 2020, 11, 3044. [Google Scholar] [CrossRef] [PubMed]
- Mahmoud, S.H.; Gan, T.Y. Urbanization and climate change implications in flood risk management: Developing an efficient decision support system for flood susceptibility mapping. Sci. Total Environ. 2018, 636, 152–167. [Google Scholar] [CrossRef] [PubMed]
- Brazil—80 Killed in Floods and Landslides in North East—FloodList. Available online: https://floodlist.com/america/brazil-floods-update-pernambuco-alagoas-may-2022 (accessed on 2 December 2023).
- Sietsma, A.J.; Ford, J.D.; Minx, J.C. The next generation of machine learning for tracking adaptation texts. Nat. Clim. Chang. 2023, 14, 31–39. [Google Scholar] [CrossRef]
- Warziniack, T.; Arabi, M.; Brown, T.C.; Froemke, P.; Ghosh, R.; Rasmussen, S.; Swartzentruber, R. Projections of Freshwater Use in the United States Under Climate Change. Earths Future 2022, 10, e2021EF002222. [Google Scholar] [CrossRef]
- Tercini, J.R.B.; Perez, R.F.; Schardong, A.; Garcia, J.I.B. Potential Impact of Climate Change Analysis on the Management of Water Resources under Stressed Quantity and Quality Scenarios. Water 2021, 13, 2984. [Google Scholar] [CrossRef]
- Bassett, E.; Shandas, V. Innovation and Climate Action Planning: Perspectives from Municipal Plans. J. Am. Plan. Assoc. 2010, 76, 435–450. [Google Scholar] [CrossRef]
- Pereira, D.S.P.; Formiga-Johsson, R.M. Descentralização da gestão de recursos hídricos em bacias nacionais no Brasil. Revista de Gestão de Águas da América Latina, 2005; 2. [Google Scholar] [CrossRef]
- Silveira, C.S.; de Souza Filho, F.A.; Martins, E.S.P.R.; Oliveira, J.L.; Costa, A.C.; Nobrega, M.T.; de Souza, S.A.; Silva, R.F.V. Mudanças climáticas na bacia do rio São Francisco: Uma análise para precipitação e temperatura. Revista Brasileira de Recursos Hídricos, 2016, Vol. 21, n. 2, 416–428. [CrossRef]
- Köppen, W. Die Wärmezonen der Erde, nach der Dauer der heissen, gemässigten und kalten Zeit und nach der Wirkung der Wärme auf die organische Welt betrachtet. [Translated by Volken, E.; Brönnimann, S.]. Meteorologische Zeitschrift (published 2011). 1884, 20 (3): 351–360. [CrossRef]
- Köppen, W. Klassification der Klimate nach Temperatur, Niederschlag and Jahreslauf. Petermanns Geographische Mitteilungen. 1918, 64:193–203, 243–248.
- Köppen, W. Grundiss der Klimakunde. 2nd Ed. Walter de Gruyter & Co, Berlin, Germany, 1931.
- Köppen, W. Das geographische System der Klimate. Handbuch der Klimatologie. Vol. 1. Berlin: Borntraeger, 1936.
- Köppen, W.; Geiger, R. Handbuch der Klimatologie, Berlin: Gebrüder Bornträger, 1930.
- Alvares, C.A.; Stape, J.L.; Sentelhas, P.C.; de Moraes Gonçalves, J.L.; Sparovek, G. Köppen’s climate classification map for Brazil. Meteorol. Z. 2013, 22, 711–728. [Google Scholar] [CrossRef] [PubMed]
- Jurca, J. (2005) Classificações climáticas: variações temporo-espaciais e suas aplicações nos livros didáticos e como subsídio ao zoneamento agroclimático. Dissertation. – Univ. Estadual Paulista, Faculdade de Ciências e Tecnologia, Presidente Prudente, Brasil, 100 pp.
- Rolim, G.S.; Camargo, M.P.B.; Lania, D.G.; Moraes, J.F.L. Classificação climática de Köppen e de Thornthwaite e sua aplicabilidade na determinação de zonas agroclimáticas para o estado de São Paulo. – Bragantia, 2007, 4, 711–720.
- de Gonçalves, J.L.M.; Alvares, C.A.; Higa, A.R.; Silva, L.D.; Alfenas, A.C.; Stahl, J.; Ferraz, S.F.B.; Lima, W.P.; Brancalion, P.H.S.; Hubner, A.; Bouillet, J.P.D.; Laclau, J.P.; Nouvellon, Y.; Epron, D. Integrating genetic and silvicultural strategies to minimize abiotic and biotic constraints in Brazilian eucalypt plantations. Forest. Ecol. Manage. 2013, 301, 6–27. [Google Scholar] [CrossRef]
- Andrade, C.; Contente, J. Köppen’s climate classification projections for the Iberian Peninsula. Climate Research, 7: 81. [CrossRef]
- Kottek, M.J.; Grieser, C.; Beck, B.; Rudolf, R.F. World map of the Köppen–Geiger climate classification updated. Meteorol Z, 2006, 15:259–63. [CrossRef]
- Peel, M.C.; Finlayson, B.L.; McMahon, T.A. Updated world map of the Köppen–Geiger climate classification. Hydrol. Earth Syst. Sci. 1633. [Google Scholar] [CrossRef]
- Beck, H.; Zimmermann, N.; McVicar, T.; Vergopolan, N.; Berg, A.; Wood, E. Present and future Köppen-Geiger climate classification maps at 1-km resolution. Science Data, 1: 5, 1802. [Google Scholar] [CrossRef]
- Fick, S.E.; Hijmans, R.J. WorldClim 2: new 1km spatial resolution climate surfaces for global land areas. Int. J. Climatol. 2017, 37(12), 4302–4315. [Google Scholar] [CrossRef]
- et al. (2019): CCCma CanESM5 model output prepared for CMIP6 ScenarioMIP. Version 20190429. Earth System Grid Federation. [CrossRef]
- Geiger, R.F. Klassifikation der Klimate nach W. Köppen. Landolt-Börnstein – Zahlenwerte und Funktionen aus Physik, Chemie, Astronomie, Geophysik und Technik, alte Serie. Berlin: Springer. 1954, Vol. 3:603–607.
- Trewartha, G.T. An introduction to climate. McGraw-Hill, New York, NY, 1968.
- Trewartha, G.T.; Horn, LH. Introduction to climate, 5th ed. McGraw Hill, New York, NY, 1980.
- IBGE 2010 (Instituto Brasileiro de Geografia e Estatística) data available online on https://www.ibge.gov.br/estatisticas/downloads-estatisticas.html (accessed on 12 April 2024).
-
IPEA 2010 (Instituto de Pesquisa Econômica Aplicada) data available online on https://portalantigo.ipea.gov.br/agencia/index.php?option=com_content&view=article&id=19153&Itemid=1 (accessed on 12 April 2024).
- Available online on El Nino and La Nina Years: NOAA Physical Sciences Laboratory accessed on 03 January 2024.
- Available online on https://origin.cpc.ncep.noaa.gov/products/analysis_monitoring/ensostuff/ONI_v5.php (accessed on 03 January 2024).
- Available online on El Niño and La Niña Years and Intensities (ggweather.com) accessed on 03 January 2024.
- Available online on https://hdr.undp.org/data-center/human-development-index#/indicies/HDI accessed on 3 January 2024.
- Available online on https://www.gov.br/mdr/pt-br/assuntos/seguranca-hidrica/projeto-sao-francisco/ramal-do-agreste; Ministério do Desenvolvimento Regional.( accessed on 03 January 2024).
- Available online on https://www.gov.br/mdr/pt-br/assuntos/seguranca-hidrica/projeto-sao-francisco/ Ministério do Desenvolvimento Regional. (accessed on 03 January 2024).
- Crosbie, R.S.; McCallum, J.L.; Walker, G.R.; Chiew, F.H.S. Modelling climate-change impacts on groundwater recharge in the Murray-Darling Basin, Australia. Hydrogeol. J. 2010, 18, 1639–1656. [Google Scholar] [CrossRef]
- Delpla, I.; Jung, A.V.; Baures, E.; Clement, M.; Thomas, O. Impacts of climate change on surface water quality in relation to drinking water production. Environ. Int. 2009, 35, 1225–1233. [Google Scholar] [CrossRef] [PubMed]
- Huijgevoort, M.H.J.V.; Voortman, B.R.; Rijpkema, S.; Nijhuis, K.H.S.; Witte, J.P.M. Influence of Climate and Land Use Change on the Groundwater System of the Veluwe, The Netherlands: A Historical and Future Perspective. Water 2020, 12, 2866. [Google Scholar] [CrossRef]
- Li, X.; Zhang, L.; O’Connor, P.J.; Yan, J.; Wang, B.; Liu, D.L.; Wang, P.; Wang, Z.; Wan, L.; Li, Y. Ecosystem Services under Climate Change Impact Water Infrastructure in a Highly Forested Basin. Water 2020, 12, 2825. [Google Scholar] [CrossRef]
- Pereira, H.M.; Navarro, L.M.; Martins, I.S. Global biodiversity change: The bad, the good, and the unknown. Annual Review of Environment and Resources 2018, 43, 25–50. [Google Scholar] [CrossRef]
- FAO. (2016). State of the World’s Forests 2016. Food and Agriculture Organization of the United Nations.
- Seto, K.C.; Güneralp, B.; Hutyra, L.R. Global forecasts of urban expansion to 2030 and direct impacts on biodiversity and carbon pools. Proceedings of the National Academy of Sciences 2011, 109(40), 16083−16088. [CrossRef]
- Carpenter, S.R.; Caraco, N.F.; Correll, D.L.; Howarth, R.W.; Sharpley, A.N.; Smith, V.H. Nonpoint pollution of surface waters with phosphorus and nitrogen. Ecological Applications 1998, 8(3), 559–568. [Google Scholar] [CrossRef]
- IPCC. (2019). Climate Change and Land: An IPCC Special Report on Climate Change, Desertification, Land Degradation, Sustainable Land Management, Food Security, and Greenhouse Gas Fluxes in Terrestrial Ecosystems.
- Available online on https://cbhsaofrancisco.org.br/a-bacia/ accessed on 03 January 2024.
- PBMC. Sumário Executivo do Volume 1 - Base Científica das Mudanças Climáticas. Contribuição do Grupo de Trabalho 1 para o 1o Relatório de Avaliação Nacional do Painel Brasileiro de Mudanças Climáticas. Brasil, Volume Especial para a Rio+20, 34p, 2012.
- Silveira, C.S.; Souza Filho, F.A.; Lopes, J.E.G.; Barbosa, P.S.F.; Tiezzi, R.O. Análise das projeções de vazões nas bacias do setor elétrico brasileiro usando dados do IPCC-AR4 para o século XXI. Revista Brasileira de Recursos Hídricos, 19. [CrossRef]
- Broto, V.C.; Westman, L.K. Ten years after Copenhagen: Reimagining climate change governance in urban areas. WIREs Clim. Chang. 2020, 11, e643. [Google Scholar] [CrossRef] [PubMed]
- IBGE 2022 (Instituto Brasileiro de Geografia e Estatística) data available online on https://www.geoaplicada.com/dados/limites-dos-estados-do-brasil/ (accessed on 12 December 2023).
Figure 1.
S. Francisco River basin location in Brazil with its physiographic regions and related biomes.
Figure 1.
S. Francisco River basin location in Brazil with its physiographic regions and related biomes.
Figure 2.
Total mean annual precipitation (RR, in mm) for (a) 1970‒2000, and 2041‒2060 under (b) SSP2 and (c) SSP5 for the S. Francisco River basin.
Figure 2.
Total mean annual precipitation (RR, in mm) for (a) 1970‒2000, and 2041‒2060 under (b) SSP2 and (c) SSP5 for the S. Francisco River basin.
Figure 3.
Mean annual air temperature (TG, in °C) for (a) 1970‒2000, and 2041‒2060 under (b) SSP2 and (c) SSP5 for the S. Francisco River basin.
Figure 3.
Mean annual air temperature (TG, in °C) for (a) 1970‒2000, and 2041‒2060 under (b) SSP2 and (c) SSP5 for the S. Francisco River basin.
Figure 4.
Köppen-Geiger (KG) climate classification System for (a) 1970‒2000, and 2041‒2060 under (b) SSP2 and (c) SSP5 for the S. Francisco River basin.
Figure 4.
Köppen-Geiger (KG) climate classification System for (a) 1970‒2000, and 2041‒2060 under (b) SSP2 and (c) SSP5 for the S. Francisco River basin.
Figure 5.
Köppen-Geiger (KG) climate type percentages for (a) 1970‒2000, and 2041‒2060 under (b) SSP2 and (c) SSP5 within the S. Francisco River basin.
Figure 5.
Köppen-Geiger (KG) climate type percentages for (a) 1970‒2000, and 2041‒2060 under (b) SSP2 and (c) SSP5 within the S. Francisco River basin.
Figure 6.
Water surface (in km2) within the S. Francisco River basin for 1985–2022. The linear regression trend line for 1985–2022 is also shown (orange).
Figure 6.
Water surface (in km2) within the S. Francisco River basin for 1985–2022. The linear regression trend line for 1985–2022 is also shown (orange).
Figure 7.
Water surface (in km2) changes within the S. Francisco River basin for 1985, 2003, 2015, and 2021.
Figure 7.
Water surface (in km2) changes within the S. Francisco River basin for 1985, 2003, 2015, and 2021.
Figure 8.
Percentage of land use within the S. Francisco River basin for 1985–2022 for five classes (forests, shrublands, cropland(ranching), build-up, and permanent water bodies).
Figure 8.
Percentage of land use within the S. Francisco River basin for 1985–2022 for five classes (forests, shrublands, cropland(ranching), build-up, and permanent water bodies).
Figure 9.
Land use/cover change (in km2 and %) within the S. Francisco River basin for 1985, 2003, 2015, and 2021 for five classes (build-up, cropland (ranching), forests, permanent water bodies, and shrublands).
Figure 9.
Land use/cover change (in km2 and %) within the S. Francisco River basin for 1985, 2003, 2015, and 2021 for five classes (build-up, cropland (ranching), forests, permanent water bodies, and shrublands).
Figure 10.
Human Development Index (HDI) within the S. Francisco River basin (for the 505 municipalities), Gross Domestic Product Per Capita (GDP Per Capita), and GDP.
Figure 10.
Human Development Index (HDI) within the S. Francisco River basin (for the 505 municipalities), Gross Domestic Product Per Capita (GDP Per Capita), and GDP.
Figure 11.
Total population by municipality within the S. Francisco River basin (for the 505 municipalities) and related percentage of the total territory.
Figure 11.
Total population by municipality within the S. Francisco River basin (for the 505 municipalities) and related percentage of the total territory.
Table 1.
This is a table. Tables should be placed in the main text near the first time they are cited.
Table 1.
This is a table. Tables should be placed in the main text near the first time they are cited.
| Letter |
Major climate type |
|
Full description |
| A |
Tropical |
Af
Am
Aw
As |
Tropical rainforest
Tropical monsoon
Tropical savanna with dry winter
Tropical savanna with dry summer |
| B |
Dry |
BWh
BWk
BSh
BSk |
Arid hot (Desert)
Arid cold (Desert)
Semi-arid hot (Steppe)
Semi-arid cold (Steppe) |
| C |
Temperate |
Cfa
Cfb
Cfc
Cwa
Cwb
Cwc
Csa
Csb
Csc |
Humid subtropical
Temperate oceanic
Subpolar oceanic
Monsoon-influenced humid subtropical
Subtropical highland climate or monsoon-influenced temperate oceanic
Cold subtropical highland climate or monsoon-influenced subpolar oceanic climate
Hot-summer Mediterranean climate
Warm-summer Mediterranean climate
Cold-summer Mediterranean climate |
| D |
Continental |
Dfa
Dfb
Dfc
Dfd
Dwa
Dwb
Dwc
Dwd
Dsa
Dsb
Dsc
Dsd |
Hot-summer humid continental
Warm-summer humid continental climate
Subarctic climate
Extremely cold subarctic
Monsoon-influenced hot-summer humid continental
Monsoon-influenced warm-summer humid continental
Monsoon-influenced subarctic climate
Monsoon-influenced extremely cold subarctic
Mediterranean-influenced hot-summer humid continental
Mediterranean-influenced warm-summer humid continental climate
Mediterranean-influenced subarctic climate
Mediterranean-influenced extremely cold subarctic climate |
| E |
Polar |
ET
EF |
Tundra
Icecap |
Table 2.
Statistical analysis related to the Water surface (in km2) within the S. Francisco watershed for 1985–2022, 1985–2006, and 2006–2022 (at a significance level of 5%).
Table 2.
Statistical analysis related to the Water surface (in km2) within the S. Francisco watershed for 1985–2022, 1985–2006, and 2006–2022 (at a significance level of 5%).
Water surface
Linear regression model |
Determination coefficient, R2
|
Adjusted R2
|
Min
year |
Mean
|
Max
year |
| y=‒52.175x+111,606.2* |
0.376 |
0.358 |
5,177.22 |
7,073.7 |
8,732.62 |
| 1985–2022 |
|
|
2017 |
|
1992 |
| y=‒29.121x+65,621.02** |
0.07 |
0.02 |
5,959.24 |
7,509.37 |
8,732.62 |
| 1985–2006 |
|
|
2001 |
|
1992 |
| y=‒98.433x+204,790.1*** |
0.292 |
0.245 |
5,177.22 |
6,545,57 |
7,716.46 |
| 2006–2022 |
|
|
2017 |
|
2007 |
Table 3.
Statistical analysis related to the Land use within the S. Francisco watershed for 1985–2022 for the Shrublands and Cropland(ranching) classes (at a significance level of 5%).
Table 3.
Statistical analysis related to the Land use within the S. Francisco watershed for 1985–2022 for the Shrublands and Cropland(ranching) classes (at a significance level of 5%).
Land Use
Linear regression model |
Determination coefficient, R2
|
Adjusted R2
|
Min
year |
Mean
|
Max
year |
| Shrublands |
0.991 |
0.991 |
48.48 |
54.10 |
60.29 |
y=‒0.3167x+688.67*
|
|
|
2022 |
|
1986 |
| Cropland(ranching) |
0.990 |
0.990 |
33.57 |
40.03 |
45.62 |
| y=0.3258x‒612.66** |
|
|
1985 |
|
2022 |
|
Disclaimer/Publisher’s Note: The statements, opinions and data contained in all publications are solely those of the individual author(s) and contributor(s) and not of MDPI and/or the editor(s). MDPI and/or the editor(s) disclaim responsibility for any injury to people or property resulting from any ideas, methods, instructions or products referred to in the content. |
© 2024 by the authors. Licensee MDPI, Basel, Switzerland. This article is an open access article distributed under the terms and conditions of the Creative Commons Attribution (CC BY) license (http://creativecommons.org/licenses/by/4.0/).
