
Submitted:
24 May 2024
Posted:
24 May 2024
You are already at the latest version
Abstract
Weather-related risks in aviation are one of the main causes of accidents worldwide. This article aims to analyze aviation risks resulting from adverse weather conditions, using the case study of the Pucallpa accident that occurred on August 23, 2005, in eastern Peru. In this analysis, we have determined the relationship between meteorological information and aviation risks, presented a matrix of risks associated with the most predominant meteorological variables at Pucallpa airport, and drawn up three maps of meteorological risks indicating the month of the year in which their incidence is most relevant. Finally, we conclude that it is essential to emphasize the importance of considering the prevailing weather conditions at Pucallpa airport to help mitigate the potential risks that may occur during different phases of the flight.
Keywords:
Aviation
; risks
; meteorological information
; meteorological sensors
; meteorological variables
; meteorological reports
1. Introduction
Since the beginning of aviation, there have been risks associated with aircraft infrastructure, runway layouts, weather conditions, among others. However, over time, these risks have been significantly mitigated, allowing for the development of aviation as a fast, safe, and reliable means of transportation. One of the significant risks that persist over the years is the potential impact of meteorological phenomena. That is why each aerodrome and airport has a service that provides meteorological information. This information is collected by electronic and/or mechanical sensors installed on the runway, which constitute the Automatic Meteorological Stations. According to Quiñones [1], the Information and Communication Technologies (ICT) currently have relevant advances to obtain, process and distribute weather-related data, while monitoring environmental variables, among others.
Méndez [2] provides insights into the connection between Meteorology and Aeronautics, as well as their relationship with Aviation, which involves the controlled movement of aircraft. The author emphasizes the importance of avoiding the misinterpretation of “adverse meteorological conditions” and instead refers them as “adverse weather conditions” to avoid making premature judgment. Meteorology and aeronautics constitute an essential partnership, whose connection is the atmosphere. The development of aviation is closely tied to the progress of aeronautics.
Peru is a vast country with diverse geographic features, including mountains, rainforests, and coastal areas, making air travel an essential mode of transportation for people and goods. The advancements in aviation technology, including aircraft design and aviation assistance systems, have facilitated the opening of new air routes both domestically and internationally. Combined with the revival of the tourism sector in Peru in 2022, this creates an ideal scenario for the country’s economic development. Moreover, the demand for air travel to, from and within Latin America and the Caribbean is expected to double in the next 20 years (Wiltshire & Jaimurzina, 2017, p.4) [3].
The personnel of the aeronautical weather stations at national level use the information coming from the meteorological sensors and issue the aeronautical report called NOTAM (Notice To Airmen), which is transmitted through specialized communication channels to all national and international aeronautical weather stations, air operators (commercial, private and cargo airlines) and air traffic control personnel. In Peru, one of the aviation assistance systems is the Automatic Meteorological Systems, which are installed in 32 aerodromes nationwide and are administered by the Peruvian Corporation of Civil Aviation (In Spanish: Corporacion Peruana de Aviacion Civil S.A; CORPAC S.A.).
The recent Automatic Meteorological Systems of the CORPAC S.A. was upgraded in 2016, with technical characteristics of automatic data collection via radio link, electrical autonomy through solar panels and high-capacity batteries. The meteorological sensors have better resolution and accuracy than the previous version. These qualities provide availability of meteorological information and are of great value to meteorological specialists in collecting and sending reports from each station at the national level. Figure 1 shows the aeronautical-use meteorological stations nationwide, which are managed by the CORPAC S.A.
The National Service of Meteorology and Hydrology of Peru (In Spanish: Servicio Nacional de Meteorología e Hidrología del Perú; SENAMHI) has classified 38 climate types throughout the national territory. As a result, each geographical area in Peru has a predominant climate, which causes meteorological phenomena that may affect the development of civil aviation due to their effects.
The objective of this article is to analyze aviation risks due to adverse weather conditions, using the case study of the Pucallpa accident that occurred in eastern Peru on August 23, 2005. We investigate the most predominant meteorological variables using a risk matrix, and creates a meteorological risk map for Pucallpa airport.
2. Methodology
To analyze the risks and the relationship between meteorological information, a two-stage analysis was conducted on a plane crash that occurred on August 23, 2005, in the city of Pucallpa. The first stage involved a thorough investigation of the predominant meteorological variables. The second stage involved describing the meteorological conditions that, along with a series of events and decisions, contributed to the accident.
2.1. First Stage
In this stage, we examined the predominant meteorological variables in the city of Pucallpa, which can pose risk to aviation during takeoff, landing, or flight. Pucallpa is situated in the Department of Ucayali, serving as the capital of the Province of Coronel Portillo. It occupies an area of approximately 37,985.00 km2.
Melgarejo [5] notes that the regional climate in the study area is not uniform, with a predominance of a humid warm climate with abundant precipitations. Exceptions to this are found in the summits and flanks of the Blue Mountain Range and the mountain range of El Sira. In these areas, daytime temperatures are high, but temperatures drop at night. There is also intense cloudiness in the high slopes and summits of these mountainous reliefs. The region experiences intense rainfall from December to March during the austral summer season, whereas the rest of the year sees little rainfall. Cloudiness is also high during the winter, whereas the sky remains clear during the rainy season in summer.
A particular phenomenon in the region’s climate is the so-called “San Juan Colds” or “Friasos” in Spanish, which means sudden drops in temperature that last from one to four days. These drops in temperature are related to air masses known as “perturbations” that detach from the Antarctic front and penetrate the South American continent via the depression of the Rio de la Plata, continuing through the depression of the Parana and enter the study area by Madre de Dios. It continues northwards towards the equatorial low-pressure zone.
2.2. Second Stage
In this stage, we will describe the meteorological conditions that, together with a series of events and decisions, led to the accident. At the end, it will be possible to infer that there is a relationship between aviation risks and meteorological information at the accident site.
2.2.1. Flight Background.
According to the Commission for the Investigation of Aviation Accidents - CIAA, 2006 [6] it mentions the following:
On August 23, 2005, at 19:24 (UTC, hereafter), the TANS Peru flight ELV204 took off. At 19:41, it reached its cruise level. At 19:52, it proceeded to start its descent towards Pucallpa airport. At 20:08:03, the autopilot was disconnected, and the aircraft left the minimum authorized altitude. At 20:08:57, it crashed onto the ground. (p.7)
The aircraft crashed into trees in a swampy area, leaving a trail that is depicted in Figure 2. Figure 3 shows part of the fuselage of the aircraft, the final location can be identified at position 2 in Figure 2. Investigations did not detect any evidence of mechanical malfunctions, system failures prior to crash, or other malfunctions that could have caused the accident.
2.2.2. Meteorological Conditions
According to the Commission of Investigation of Aviation Accidents - CIAA 2006 [6], the following information was reported regarding the meteorological conditions at Pucallpa airport on August 23, 2005, based on the meterological report (METAR) and special report (SPECI).
At 19:00, the METAR showed that the wind direction was 10 degrees, with reference to the north, with a wind speed of 5 knots, visibility was 10 kilometers with some fractional clouds at 600 meters, and the air temperature was 34°C with a dew temperature of 26°C. The pressure QNH 1010 hPa. At 20:00, the METAR showed the same conditions as the previous one, indicating that the meteorological conditions were maintained. However, at 20:10, a SPECI report described a sudden change in the meteorological conditions, showing visibility from 2000 meters with cloudy sky, to 390 meters with a Charlie bravo or cumulonimbus indicating clouds in vertical development. These clouds are formed by a column of warm and humid air that rises in the form of rotating spiral. At 21:00, a METAR report was issued, indicating visibility of 3000 meters with thunderstorm, light rain, cloudy skies at 420 meters, Charlie bravo or cumulonimbus at 510 meters, and fractional clouds at 3000 meters, The precipitation volume was recorded at 1 millimeter. Another SPECI report was issued at 21:17, describing the change in the meteorological conditions, indicating the visibility at 8000 meters with a light rainstorm, cloudy skies at 450 meters, a Charlie bravo at 600 meters, and fractional clouds at 3000 meters. Figure 4 shows the weather conditions on the day of the accident, with a cold front (storm) observed near the city of Pucallpa. Figure 5 displays a heat map captured at 20:45 UTC on August 23, 2005, by the GOES 12 satellite with a resolution of 1 kilometer.
2.2.3. Flight Operations
According to the Commission of Investigation of Aviation Accidents - CIAA 2006 [6] mentions the following:
At 20:08:03, the pilot disengaged the autopilot while maintaining altitude.
At 20:08:13, the aircraft was six miles away from the Pucallpa Very high frequency Omni-directional Range (VOR) and at a height of 457.2 meters above sea level (SNM), equivalent to 300.84 meters above the ground, making a visual landing possible as required by the NOTAM of July 31, 2005.
At 20:08:23, the aircraft descended to 300.84 meters above the ground, leaving the minimum authorized altitude, and reaching this height in just 34 seconds. The rate of descent was greater than 518.16 meters per minute, given the weather conditions indicating heavy hail precipitation. The aircraft impacted on trees at 20:08:51, and then hit the ground at 20:08:57. Despite being authorized to make a visual descent, the aircraft encountered a meteorological phenomenon that resulted in loss of situational awareness, making it unable to maintain vertical or horizontal visibility. The aircraft hit vegetation and trees, which cushioned the final impact, due to a failure to maintain a safe vertical separation in an unusual weather environment for the area.
The review of the cockpit voice recorder (CVR) indicated incomplete checklists, specifically the Descent Checklist and Approach Checklist, due to the inability to focus on them in adverse weather conditions. No detailed or generic briefing was conducted for the descent and approach. (p.22)
2.2.4. Operational Procedures
According to the Commission for the Investigation of Aviation Accidents - CIAA [6] describes the following:
The technical crew of Flight ELV204 was aware of the meteorological phenomenon in the vicinity of Pucallpa prior to the flight. Additionally, the Dispatch Release sheet of Flight ELV204 of August 23, 2005, showed that the crew had received information related to meteorological reports, NOTAM, and forecasts. Initially, everything was normal until 18 minutes after takeoff (19:41:36) when they reach the assigned cruise level of 33,000 feet above sea level, as per ATC authorization.
At 19:52, the crew detected rain on the radar and was informed about the bad weather by the Pucallpa tower. The tower informed them about the presence of cumulus clouds to the south quadrant of the station, estimated visibility to the south of one and a half kilometers, with a dust storm. However, they did not take preventive measures, considering that the pilot in command was also a flight instructor.
At 20:04:54, the crew was aware of the adverse conditions in which they were flying, and the instructor pilot instructed the trainee pilot to stay below the cumulus cloud, contravening the General Operations Manual, since the general policy is NOT to operate through developed thunderstorms, nor fly below the base of the storm, but to circumnavigate or fly over them if possible. These types of storms should be avoided at least 20 nautical miles away (p. 26).
3. Results
The final report concludes that certain rules and guidelines were not adhered to, as specified in the General Operations Manual. For instance, it is stated that “If the cloud base is below 3,000 feet, DO NOT plan to fly under a cold front or pre-frontal thunderstorms”. Moreover, in terms of flight conditions, it mentions that “If it is necessary to fly through thunderstorms on instruments, DO NOT fly below 4,000 feet above the ground”. Additionally, the manual highlights that “Flying through intense thunderstorms along a cold front should NEVER be attempted”. Furthermore, with respect to landing conditions, it is stated that "DO NOT take off, initiate an approach or landing in adverse weather conditions, at a departure or arrival aerodrome" [6].
The decisions made by the pilots, added to the adverse weather conditions, have resulted in an accident where visibility was lost upon entering the storm. The severe hailstorm caused the opacification of the front windows of the aircraft, resulting in the crew losing their spatial and temporal orientation. It is important to note that they were making a visual descent, meaning they are not relying on the aircraft's navigation instruments.
METARs are issued every hour, but in case of changing weather conditions, a SPECI is issued to inform the aircraft of the rapidly changing conditions, allowing them to make the best decision to execute flight phases safely. To analyze the main risks caused by meteorological variables at Pucallpa airport, a Severity and Probability Risk Matrix (SPRM) has been developed (Table 1). In addition, we determine the weight of the risk level based on severity and probability (Table 2).
According to the Meteorology Section on the CORPAC S.A., website [4] and their climatological summaries from 2006 to 2011, a risk matrix has been developed in Table 3 that relates to the main meteorological variables that are most predominant at Pucallpa airport. By utilizing this information and taking the case study, three significant variables have been selected to analyze the risk in aviation: average wind speed, wind direction, and precipitation. A risk analysis has been conducted using the matrices described above to evaluate the risks associated with the main meteorological variables for aircraft at Pucallpa airport (Table 4).
Based on the previously analyzed information, three maps have been created that illustrate the main risks associated with the main meteorological variables that can affect aircraft during the flight phases at Pucallpa airport. These maps provide valuable insights into the potential risks to aviation in the area.
Figure 6.
Average Wind Speed Irrigation Map.
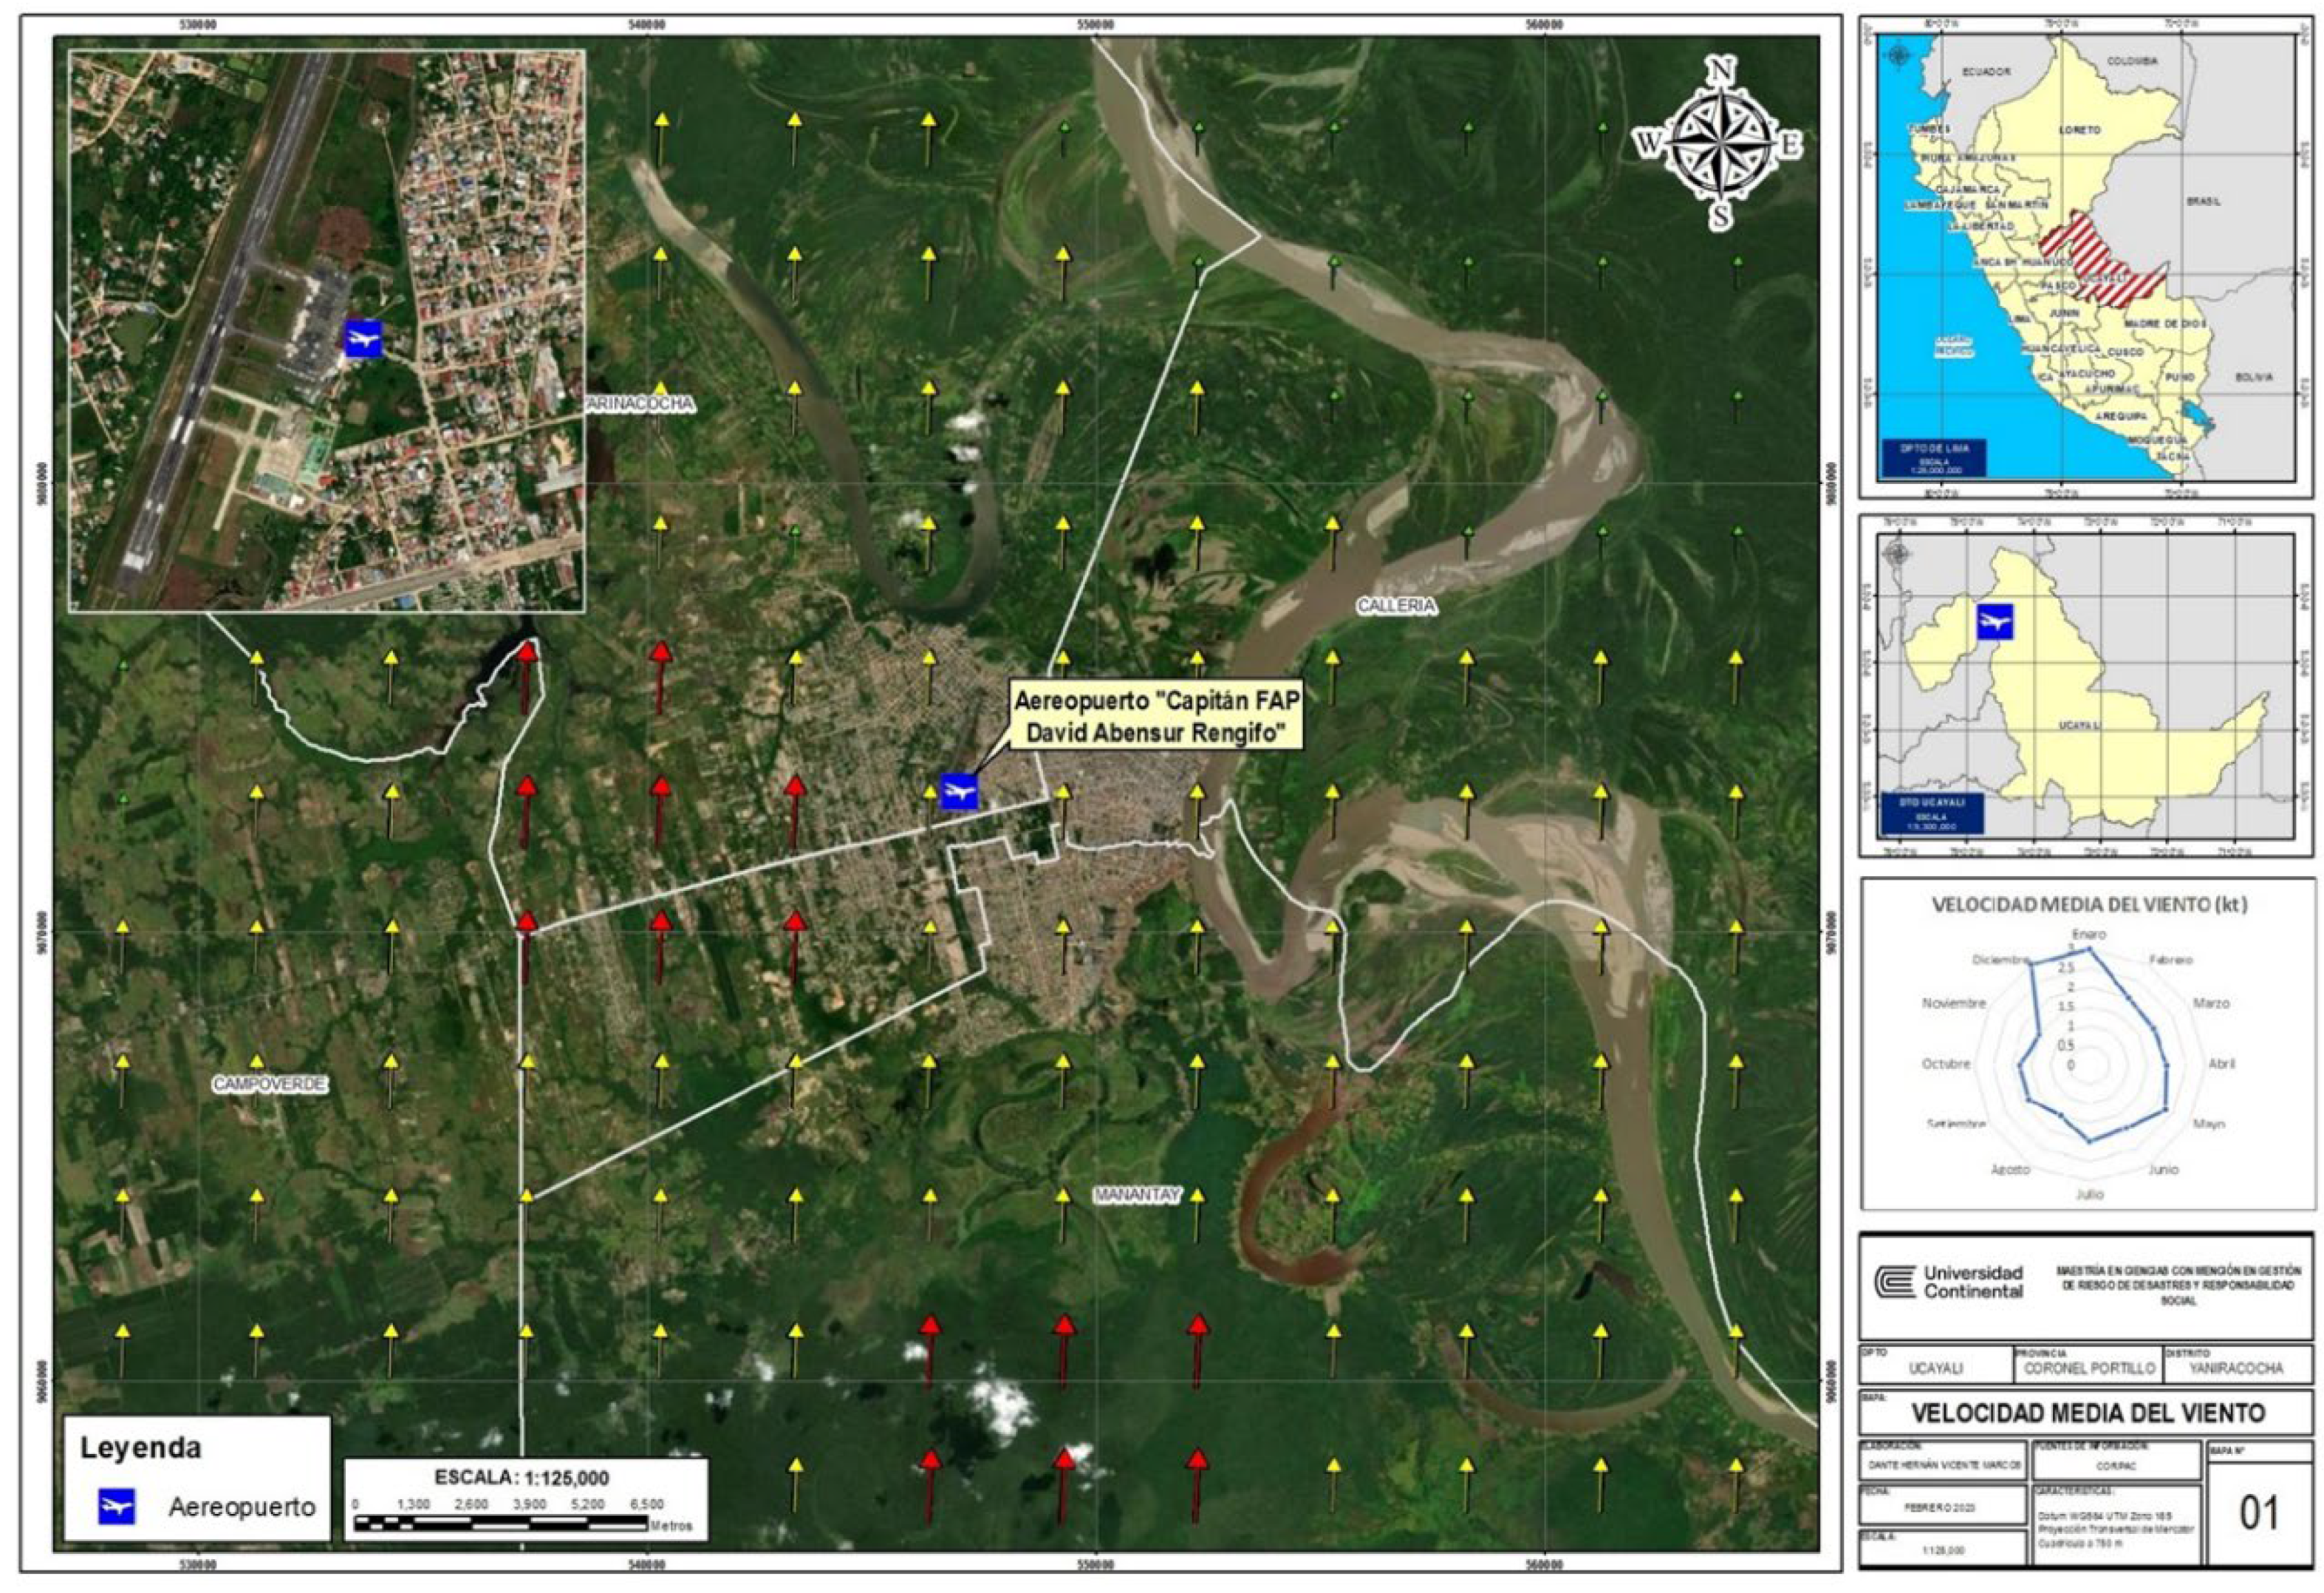
Figure 7.
Risk map by wind direction.
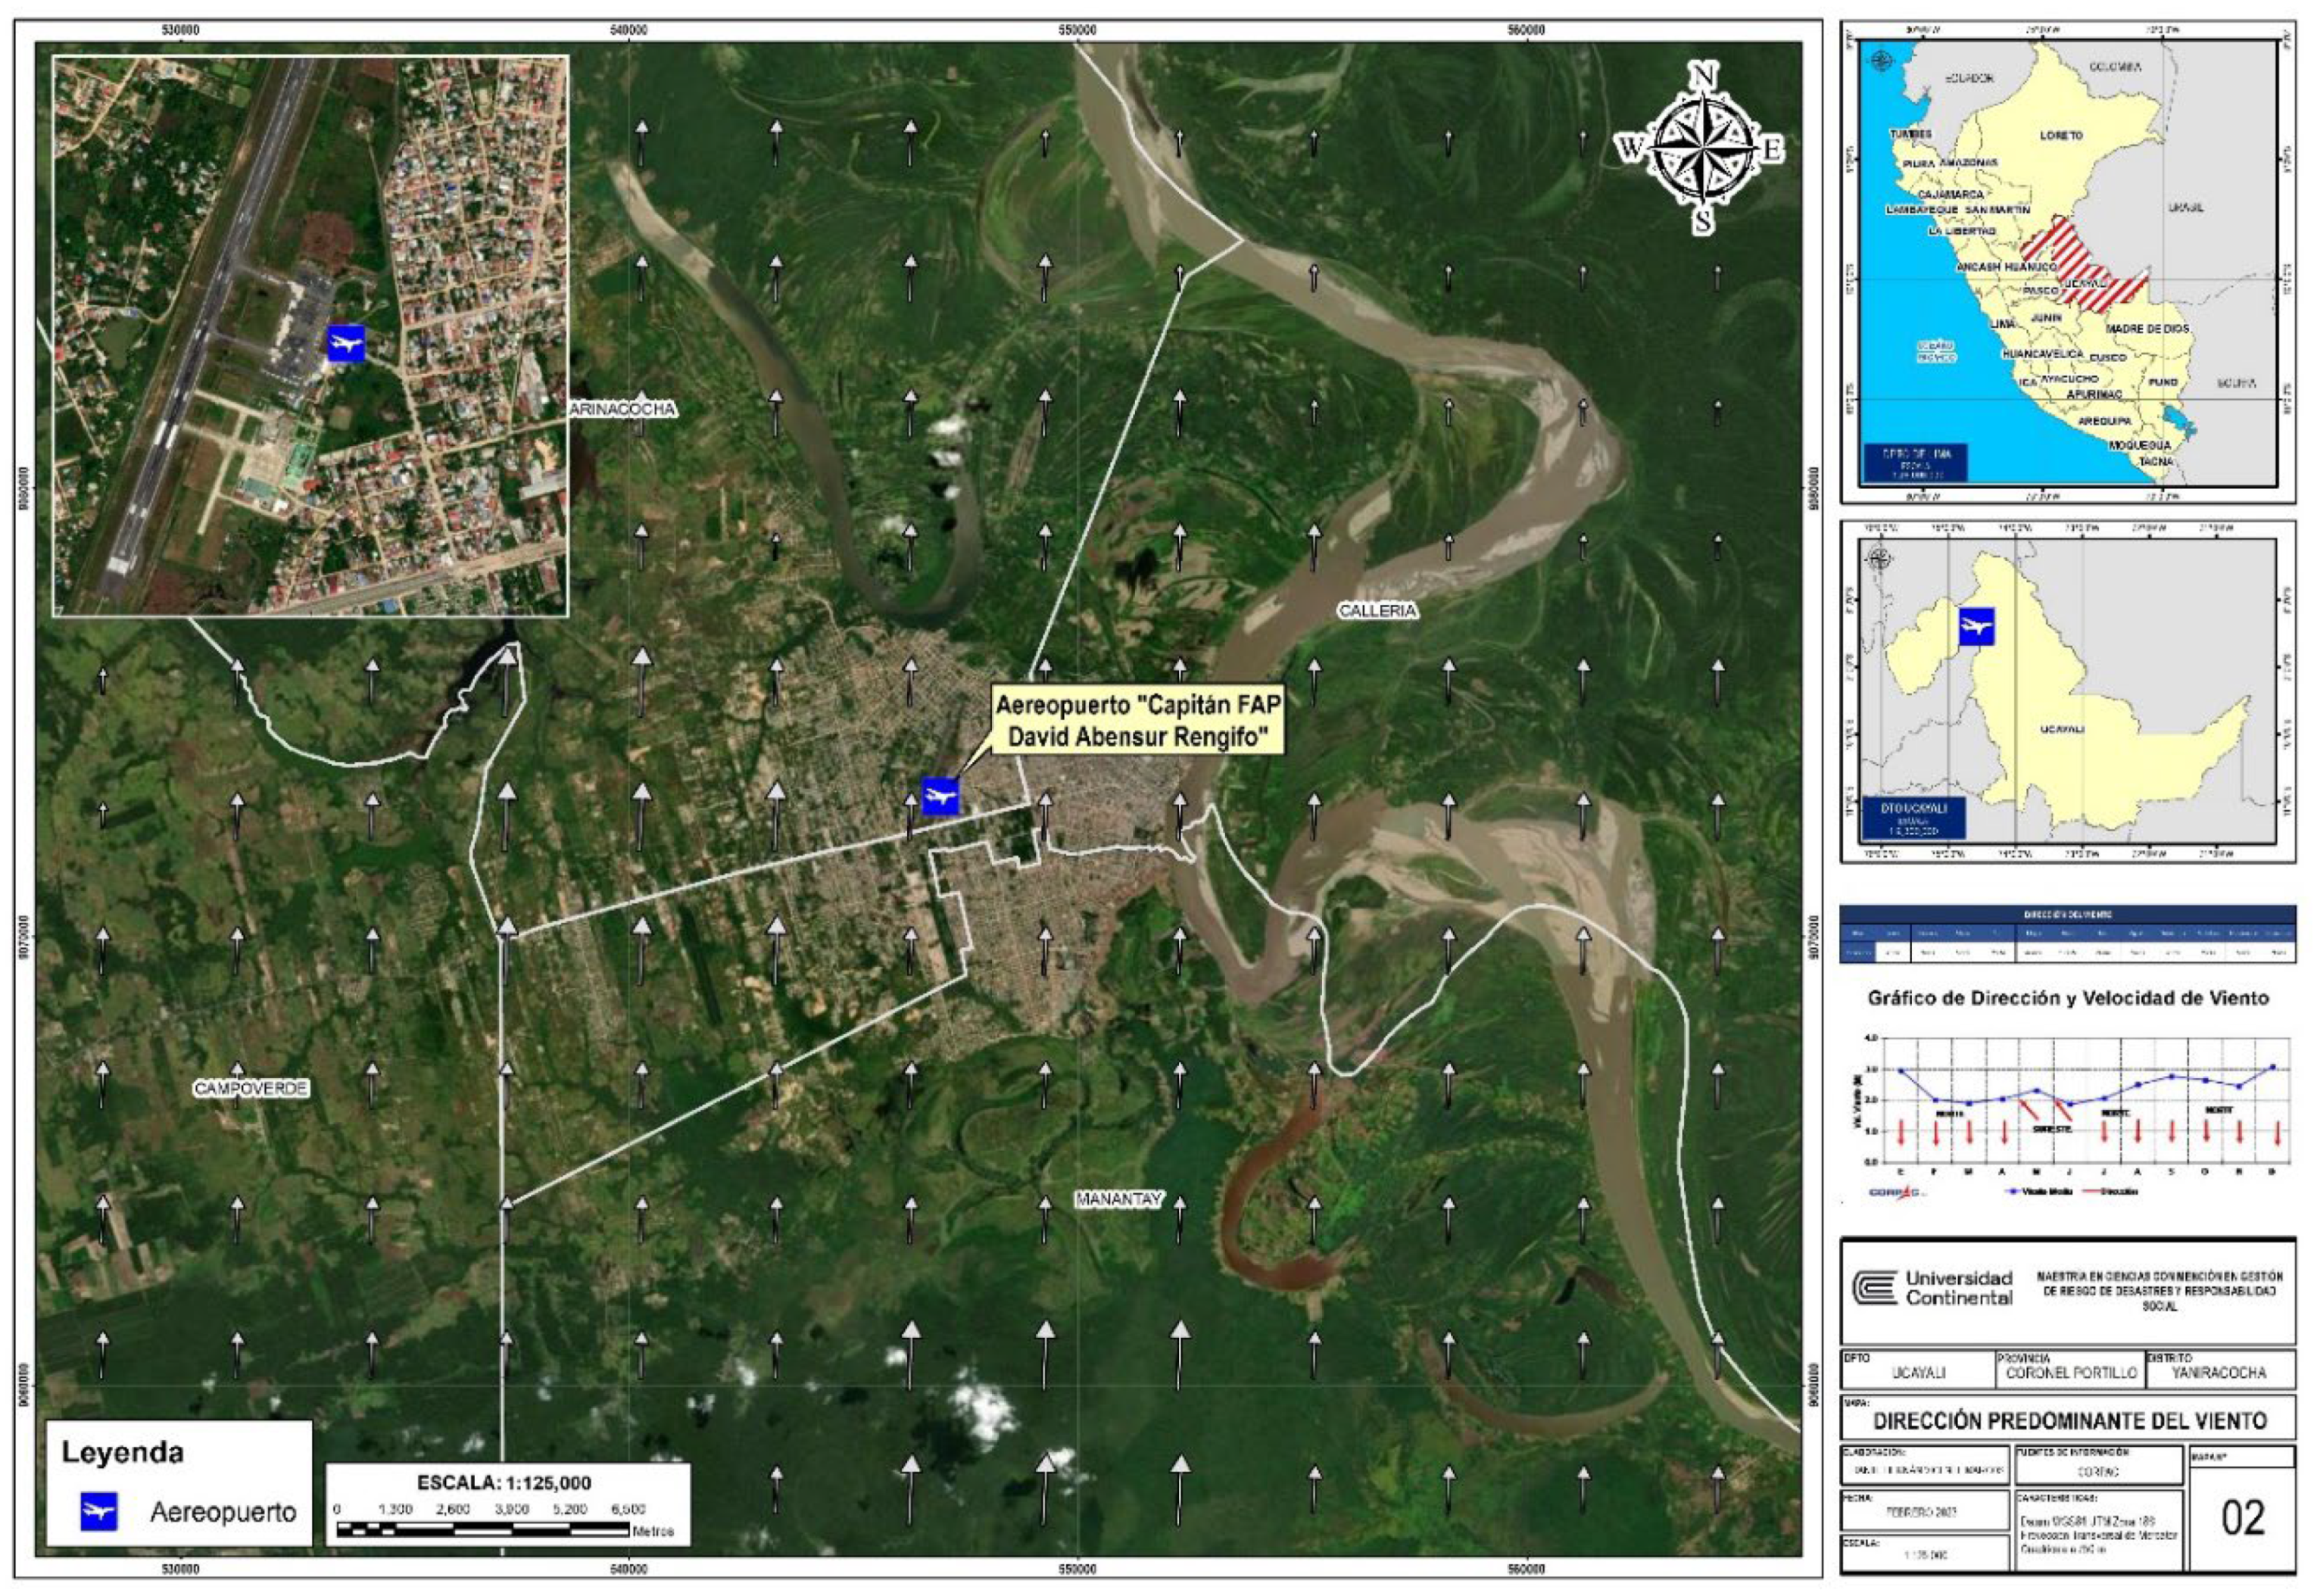
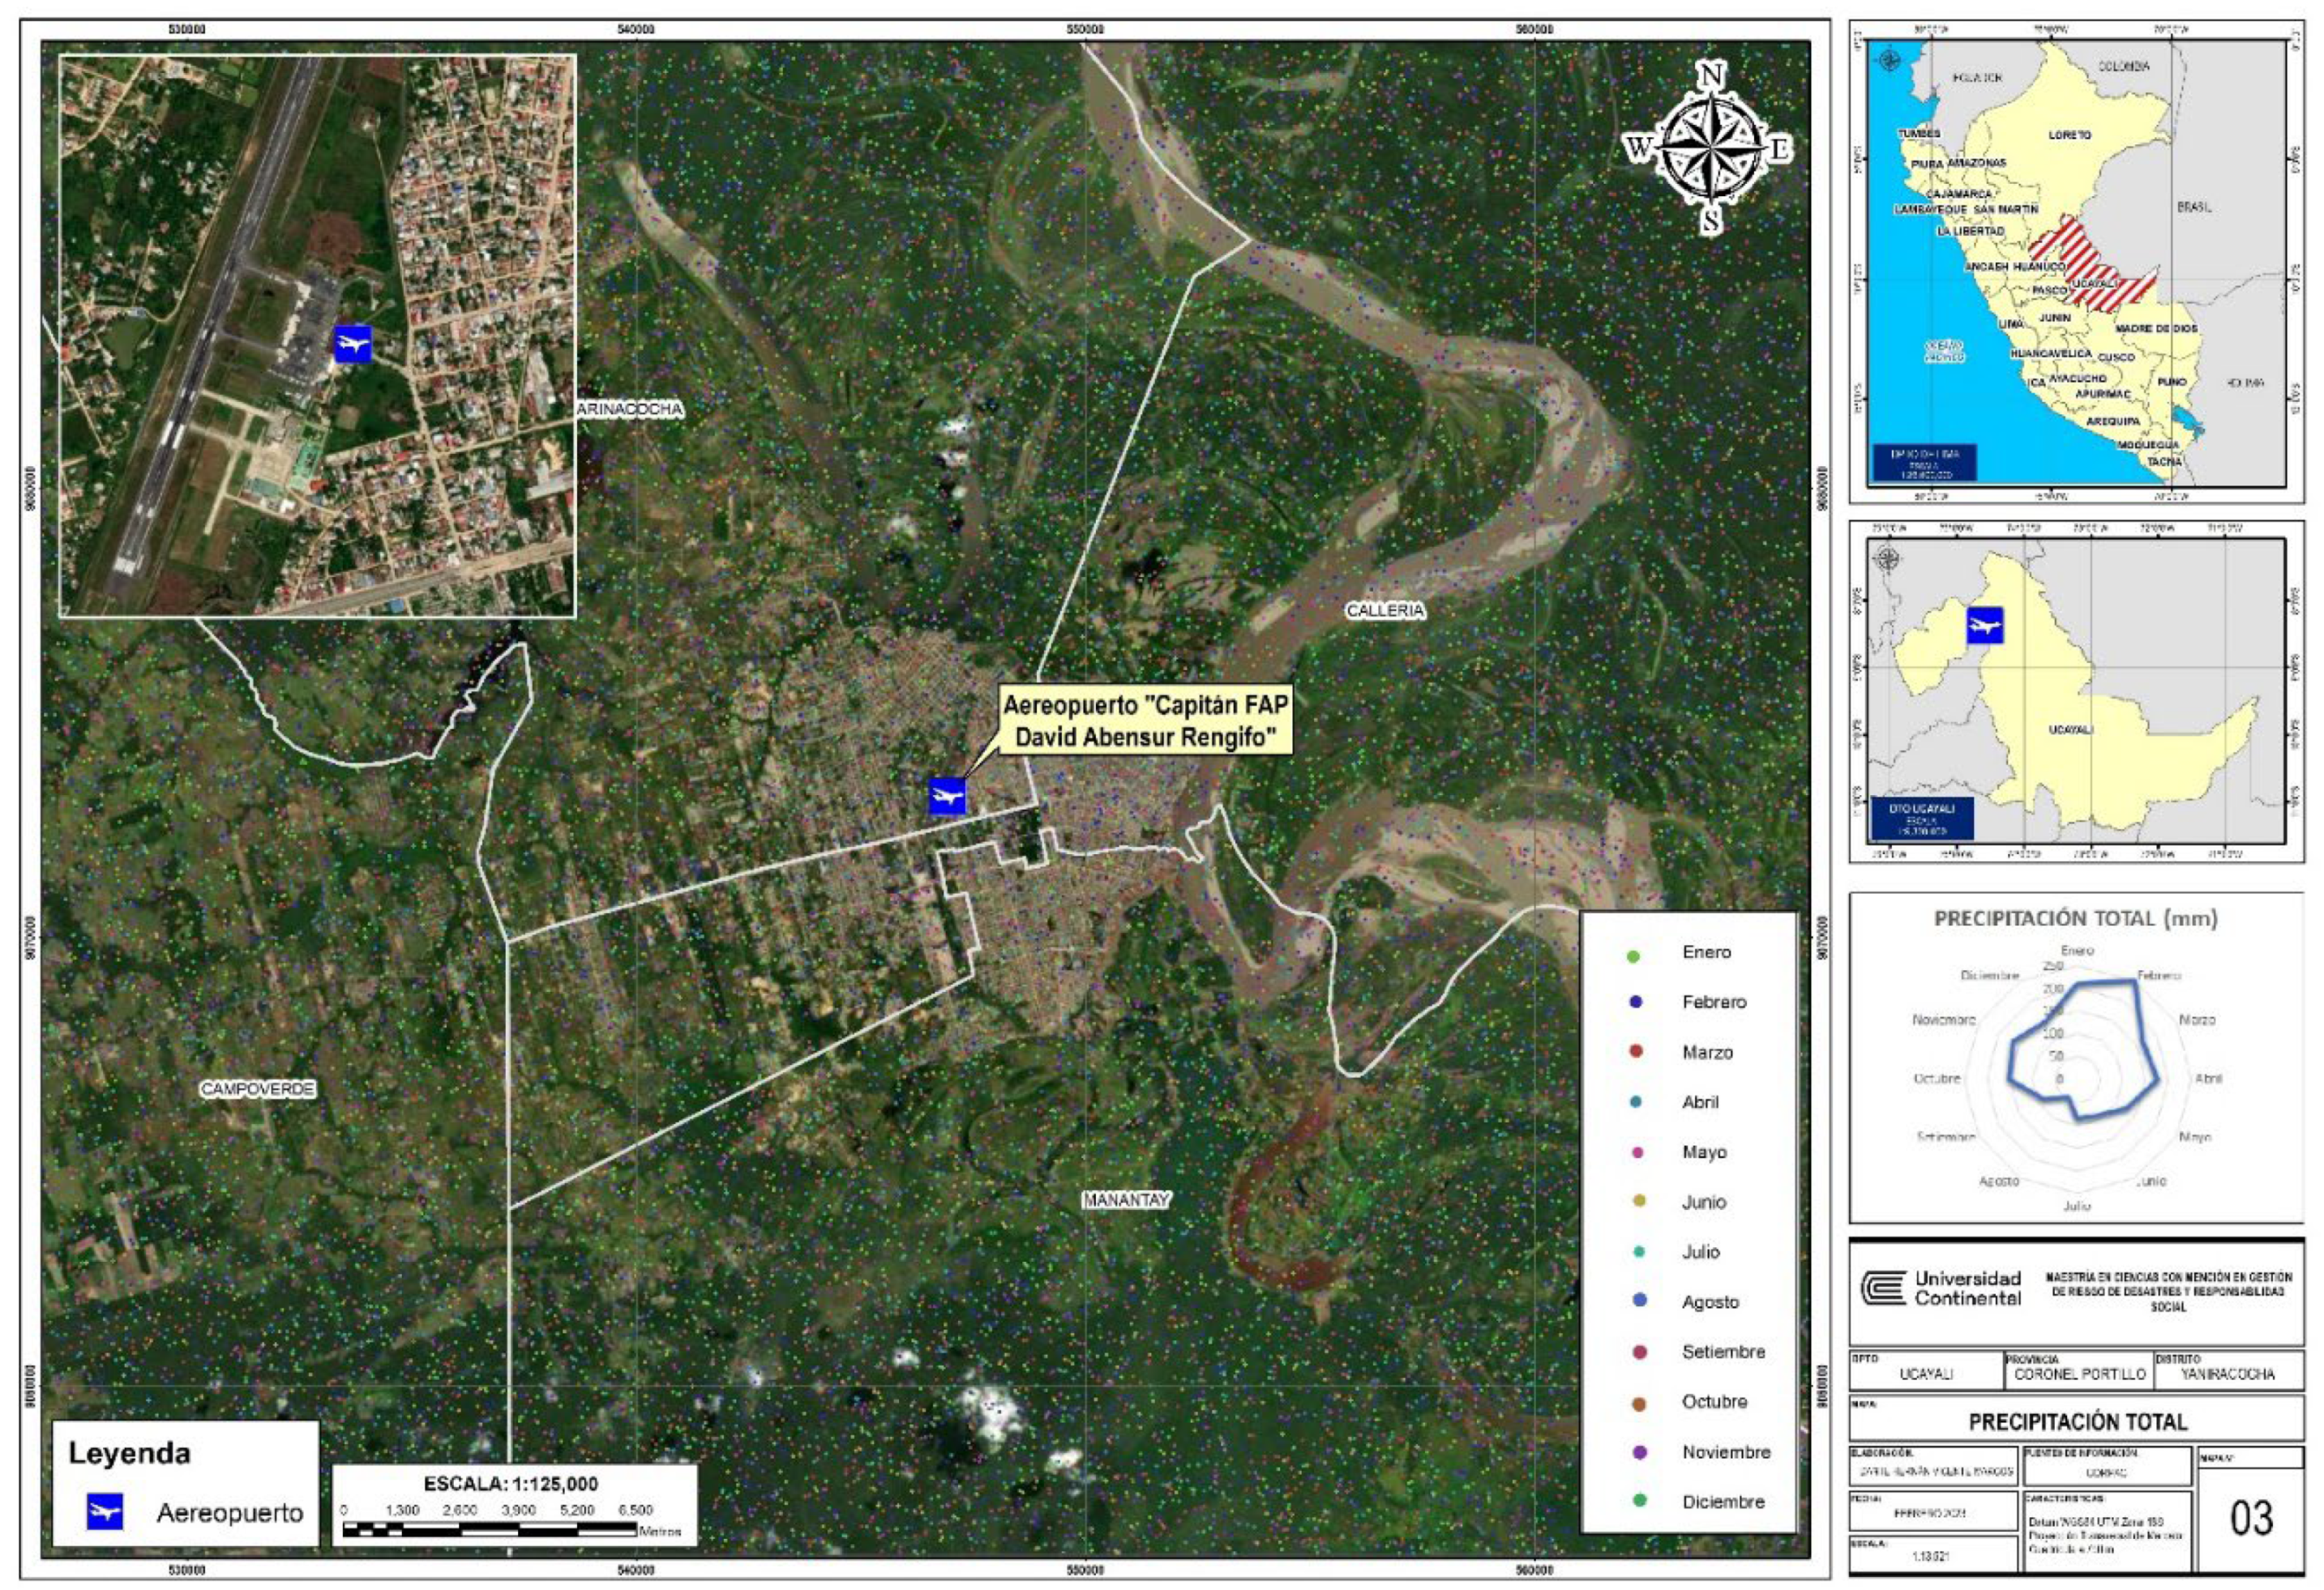
Figure 8.
Precipitation Risk Map.
4. Discussion
The adverse weather conditions present at the Pucallpa airport on August 23, 2005, including high levels of precipitation, variable winds, wind shear, crosswinds, and tailwinds, all played a role in the accident. However, extreme weather events are becoming more frequent, occurring within the same geographical area and causing constant changes in meteorological phenomena. Therefore, local, regional and central authorities should prioritize prevention and ongoing monitoring efforts. The case study highlights the importance of understanding the influence of meteorological variables in the vicinity of Pucallpa airport, especially given its location in a tropical zone where weather changes can be unpredictable without regular monitoring and compliance with aeronautical regulations.
Moreover, the meteorological information monitoring system is closely aligned with the Sustainable Development Goals N°13 Climate Action. Air service management entities have a critical role in supporting the efforts to mitigate the effects of climate change. By analyzing the relevant meteorological variables, this case study has facilitated the creation of three risk maps that can be used to improve the safety measures at Pucallpa airport.
In the future, it will be important to continue to update and refine the risk maps that have been developed, incorporating new data and information as it becomes available. This will help to ensure that aviation authorities and stakeholders have the most up-to-date information on the risks associated with weather systems in the area. Another important area for future work will be to identify and implement measures to mitigate the risks associated with extreme weather events. This could involve the development of new infrastructure and facilities, the adoption of new technologies and systems, and the implementation of new procedures and protocols for aviation operations in the area.
5. Conclusions
The case study of the Pucallpa accident that occurred on August 23, 2005, highlights the importance of meteorological information in ensuring the safe flight operations. Neglecting or disregarding reports issued by the aeronautical meteorological stations can lead to risks that may eventually result in accidents. Given Peru’s varied climates, it is crucial to consider the unique and rapidly changing meteorological phenomena at each airport, as exemplified in the case study of Pucallpa and the entire department of Amazonas, characterized by predominantly warm and temperate rainy climates with high humidity levels throughout the year [7].
Based on the foregoing analysis, it is evident that there is a relationship between meteorological information and the aviation risks caused by adverse weather conditions. Understanding the trends of meteorological variables at Pucallpa Airport helps us demonstrate the importance of meteorological information in flight operations and mitigating the risk of accidents. The elaboration of risk maps showing the trends of meteorological variables during different months of the year can provide reference information for aviation, thus helping to prevent tragic accidents.
In conclusion, the case study underscores the indispensable role of meteorological information in ensuring safe aviation operations, especially in the face of adverse weather conditions. As such, it is crucial for aviation authorities and stakeholders to recognize the importance of constant monitoring and prevention measures to mitigate potential risks.
References
- Quiñones Cuenca M, González Jaramillo V, Torres R, Jumbo M. Sistema De Monitoreo de Variables Medioambientales Usando Una Red de Sensores Inalámbricos y Plataformas de Internet de las cosas. Enfoque UTE. 2017; p. 330.
- Méndez, A. Meteorología Aeronáutica: Un marco de estudio esencial para comprender el impacto del tiempo en la aviación. Aplicaciones Meteorológicas. 2018; p. 289–292. [CrossRef]
- Wiltshire j, Jaimurzina A. Transporte aéreo como motor del desarrollo sostenible en América Latina y el Caribe: retos y propuestas de política. [Online].; 2017. Disponible en: https://repositorio.cepal.org/bitstream/handle/11362/43411/1/S1800006_es.pdf.
- CORPAC, S.A. Tablas y resúmenes climatológicos de aeródromos. [Online]; 2022. Disponible en: http://portal2.corpac.gob.pe/app/Meteorologia/TRClimatologicas/Tablas.html.
- Melgarejo SAM. ESTRATEGIA DE DESARROLLO Y MEJORAMIENTO DEL AEROPUERTO INTERNACIONAL DAVID ARMANDO ABENSUR RENGIFO - PUCALLPA.
- CORPAC. IAA CDIDADA. INFORME FINAL CIAA-ACCID-008-2005.
- Castro A, Dávila C, Laura W, Cubas Saucedo F, Ávalos G, López C, et al. Climas del Perú: mapa de clasificación climática nacional. LIMA: Servicio Nacional de Meteorología e Hidrología - (SENAMHI), LIMA.
Figure 1.
Aeronautical meteorological stations at national level in Peru [4]. There are 32 aerodromes marked by dark red dots.
Figure 1.
Aeronautical meteorological stations at national level in Peru [4]. There are 32 aerodromes marked by dark red dots.
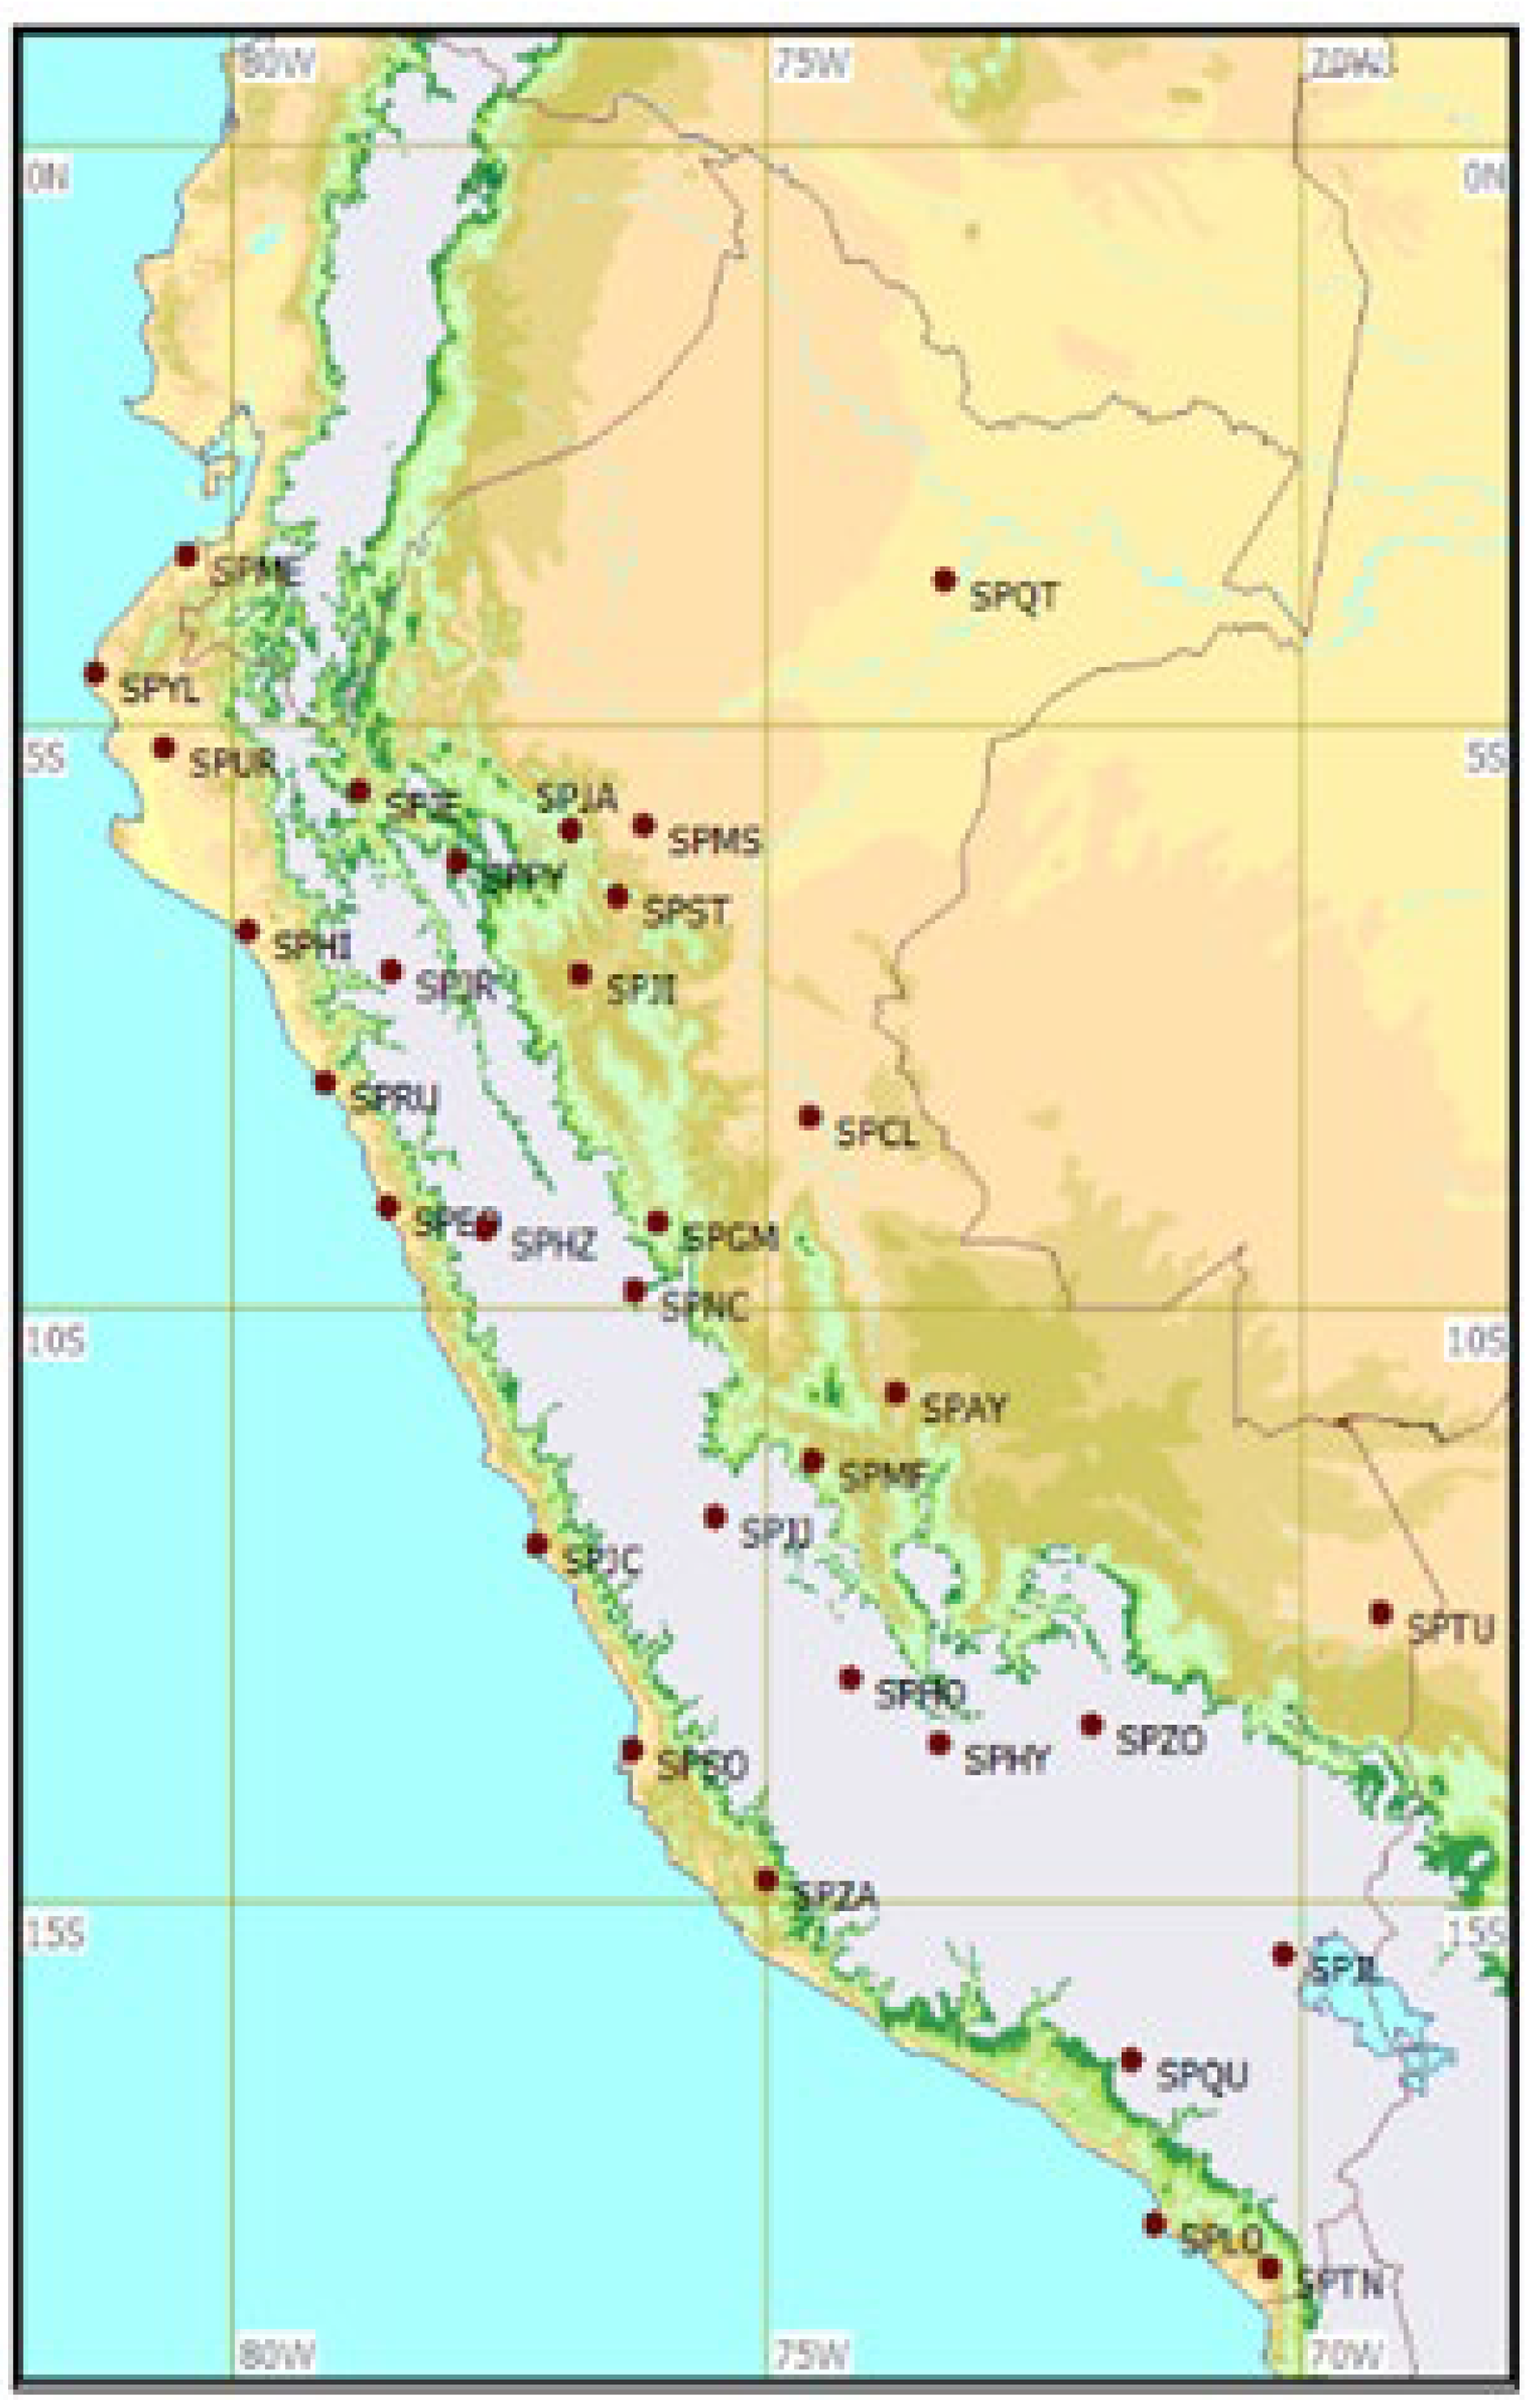
Figure 2.
Aircraft impact location - A.A.H.H. La Florida - Pucallpa [6]. The impact path is highlighted in red, while the beginning of contact with the trees is indicated with a yellow indicator (1) and the point of impact of the front part of the fuselage with another yellow indicator (2). The final position of the wreckage of the aircraft and the location of the fire are indicated by a third yellow indicator (3).
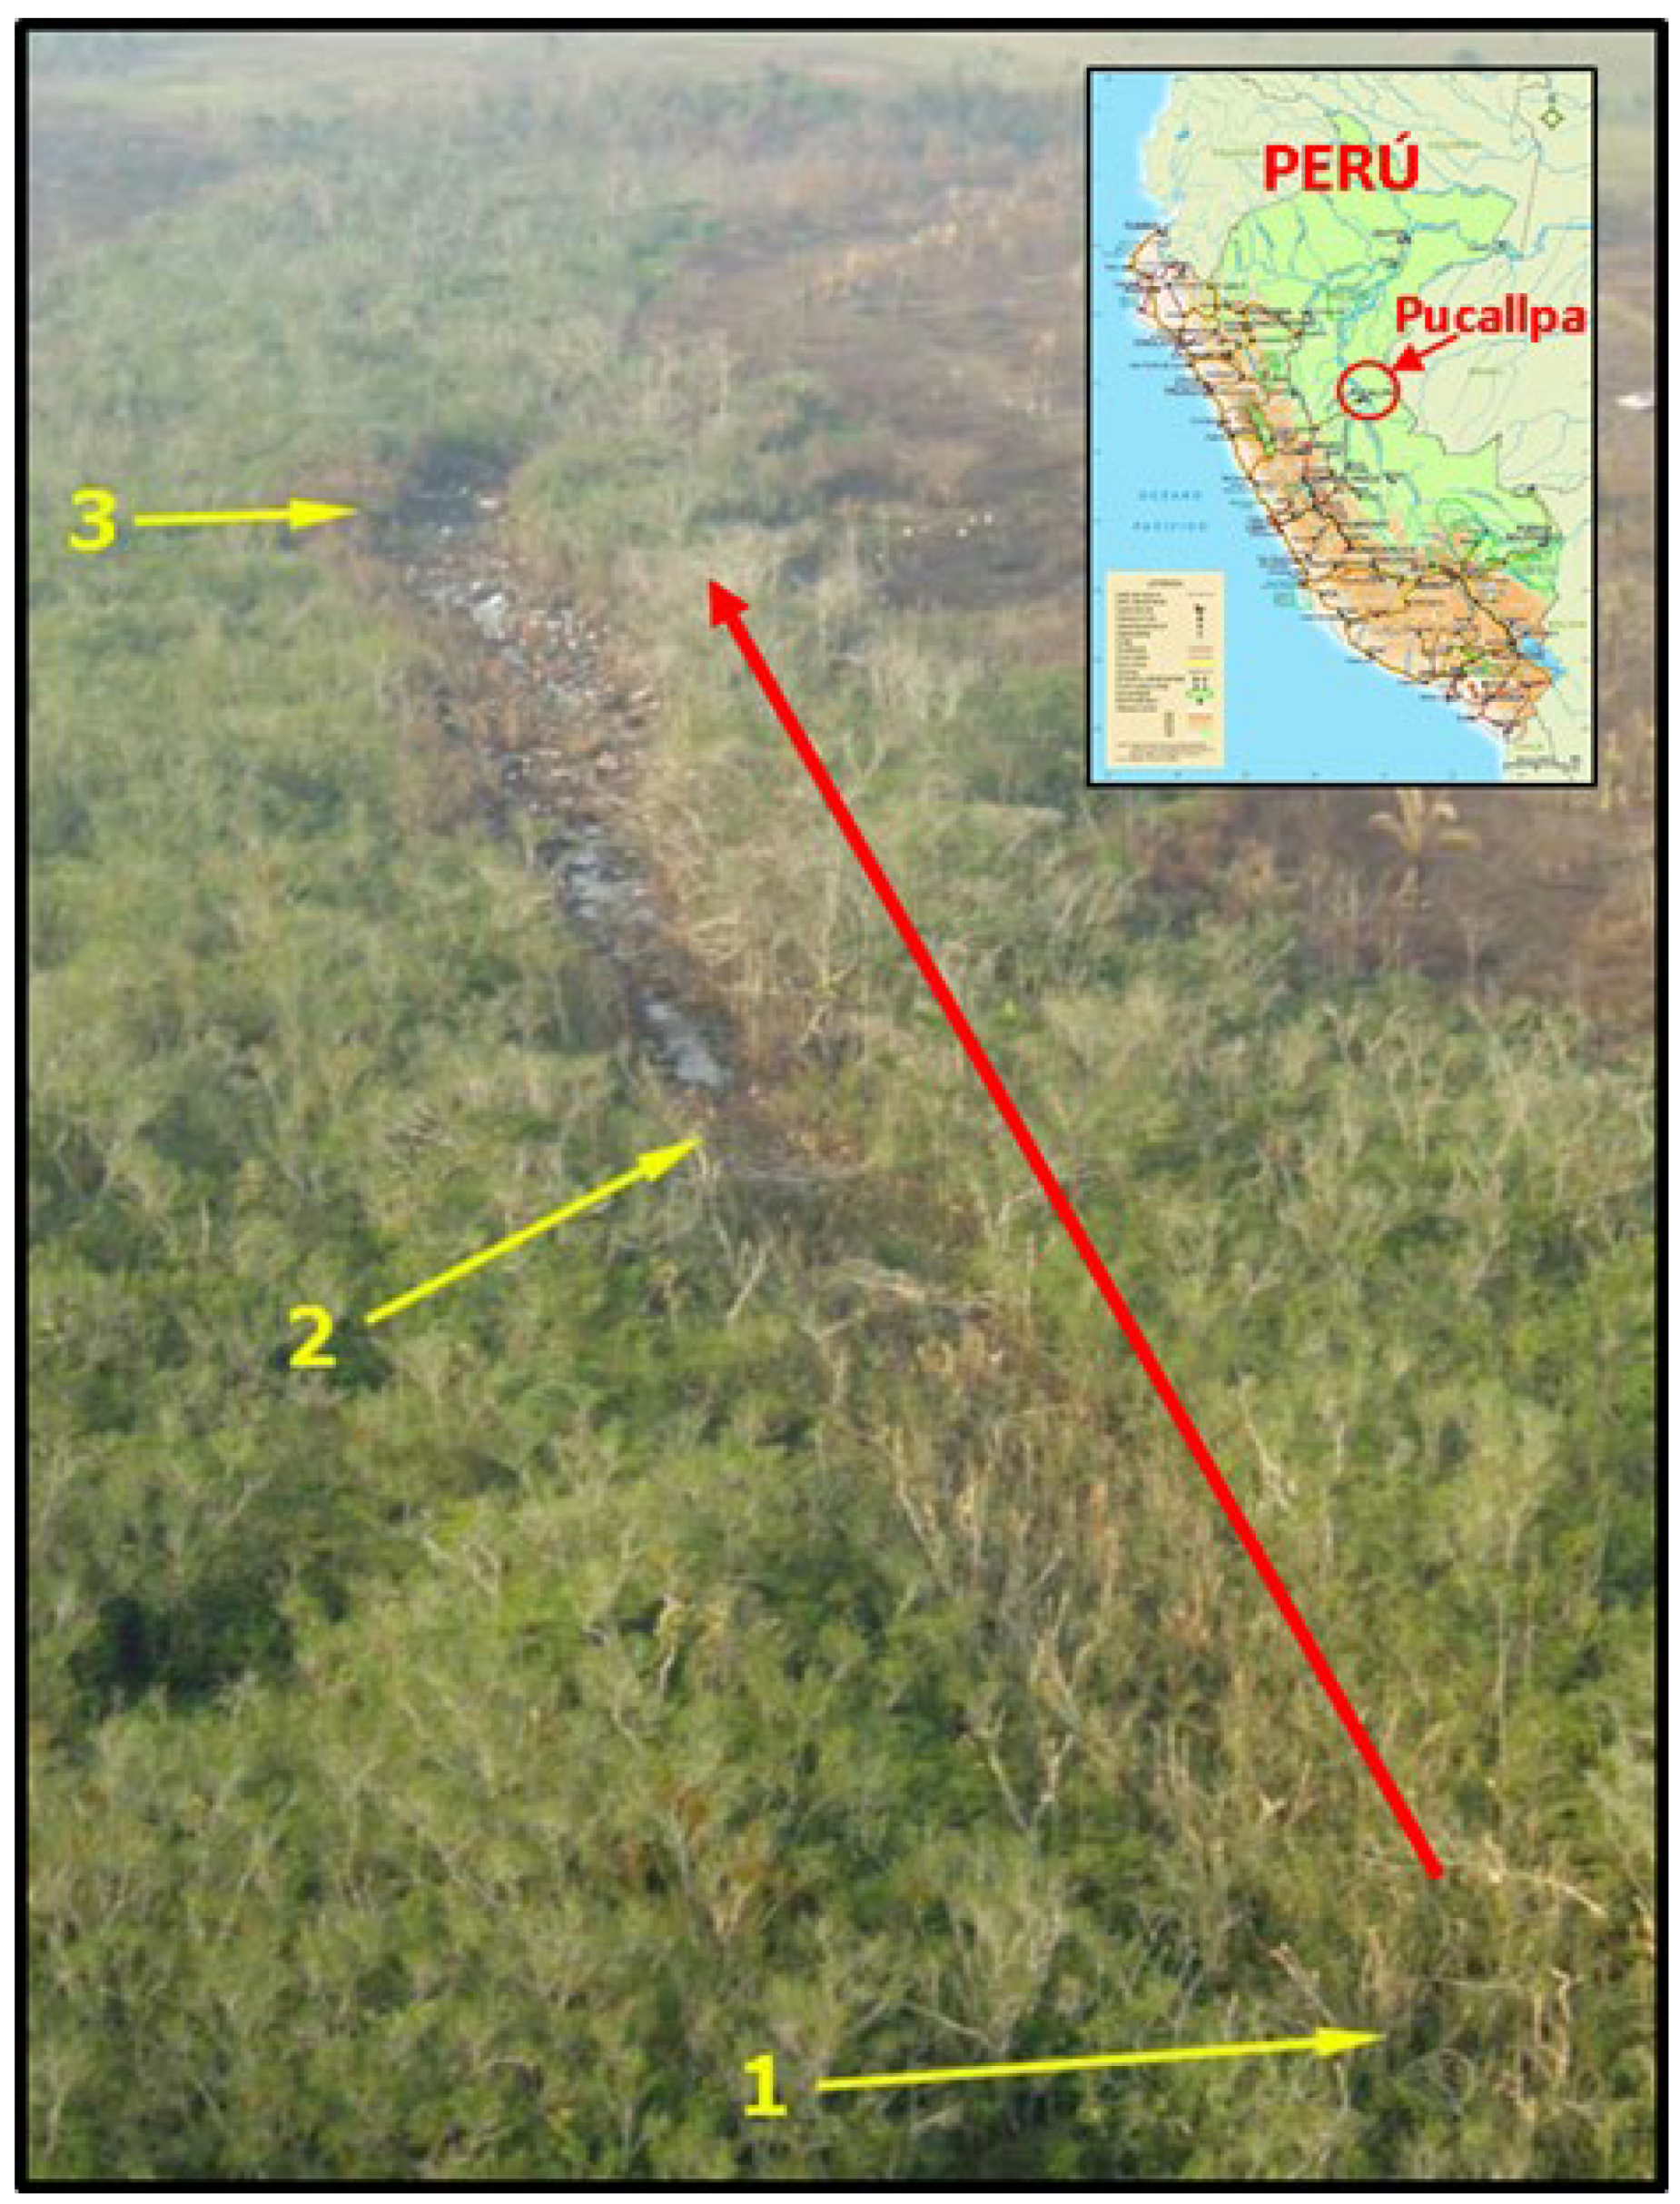
Figure 3.
Fuselage of the aircraft TANS Peru - August 23, 2005.
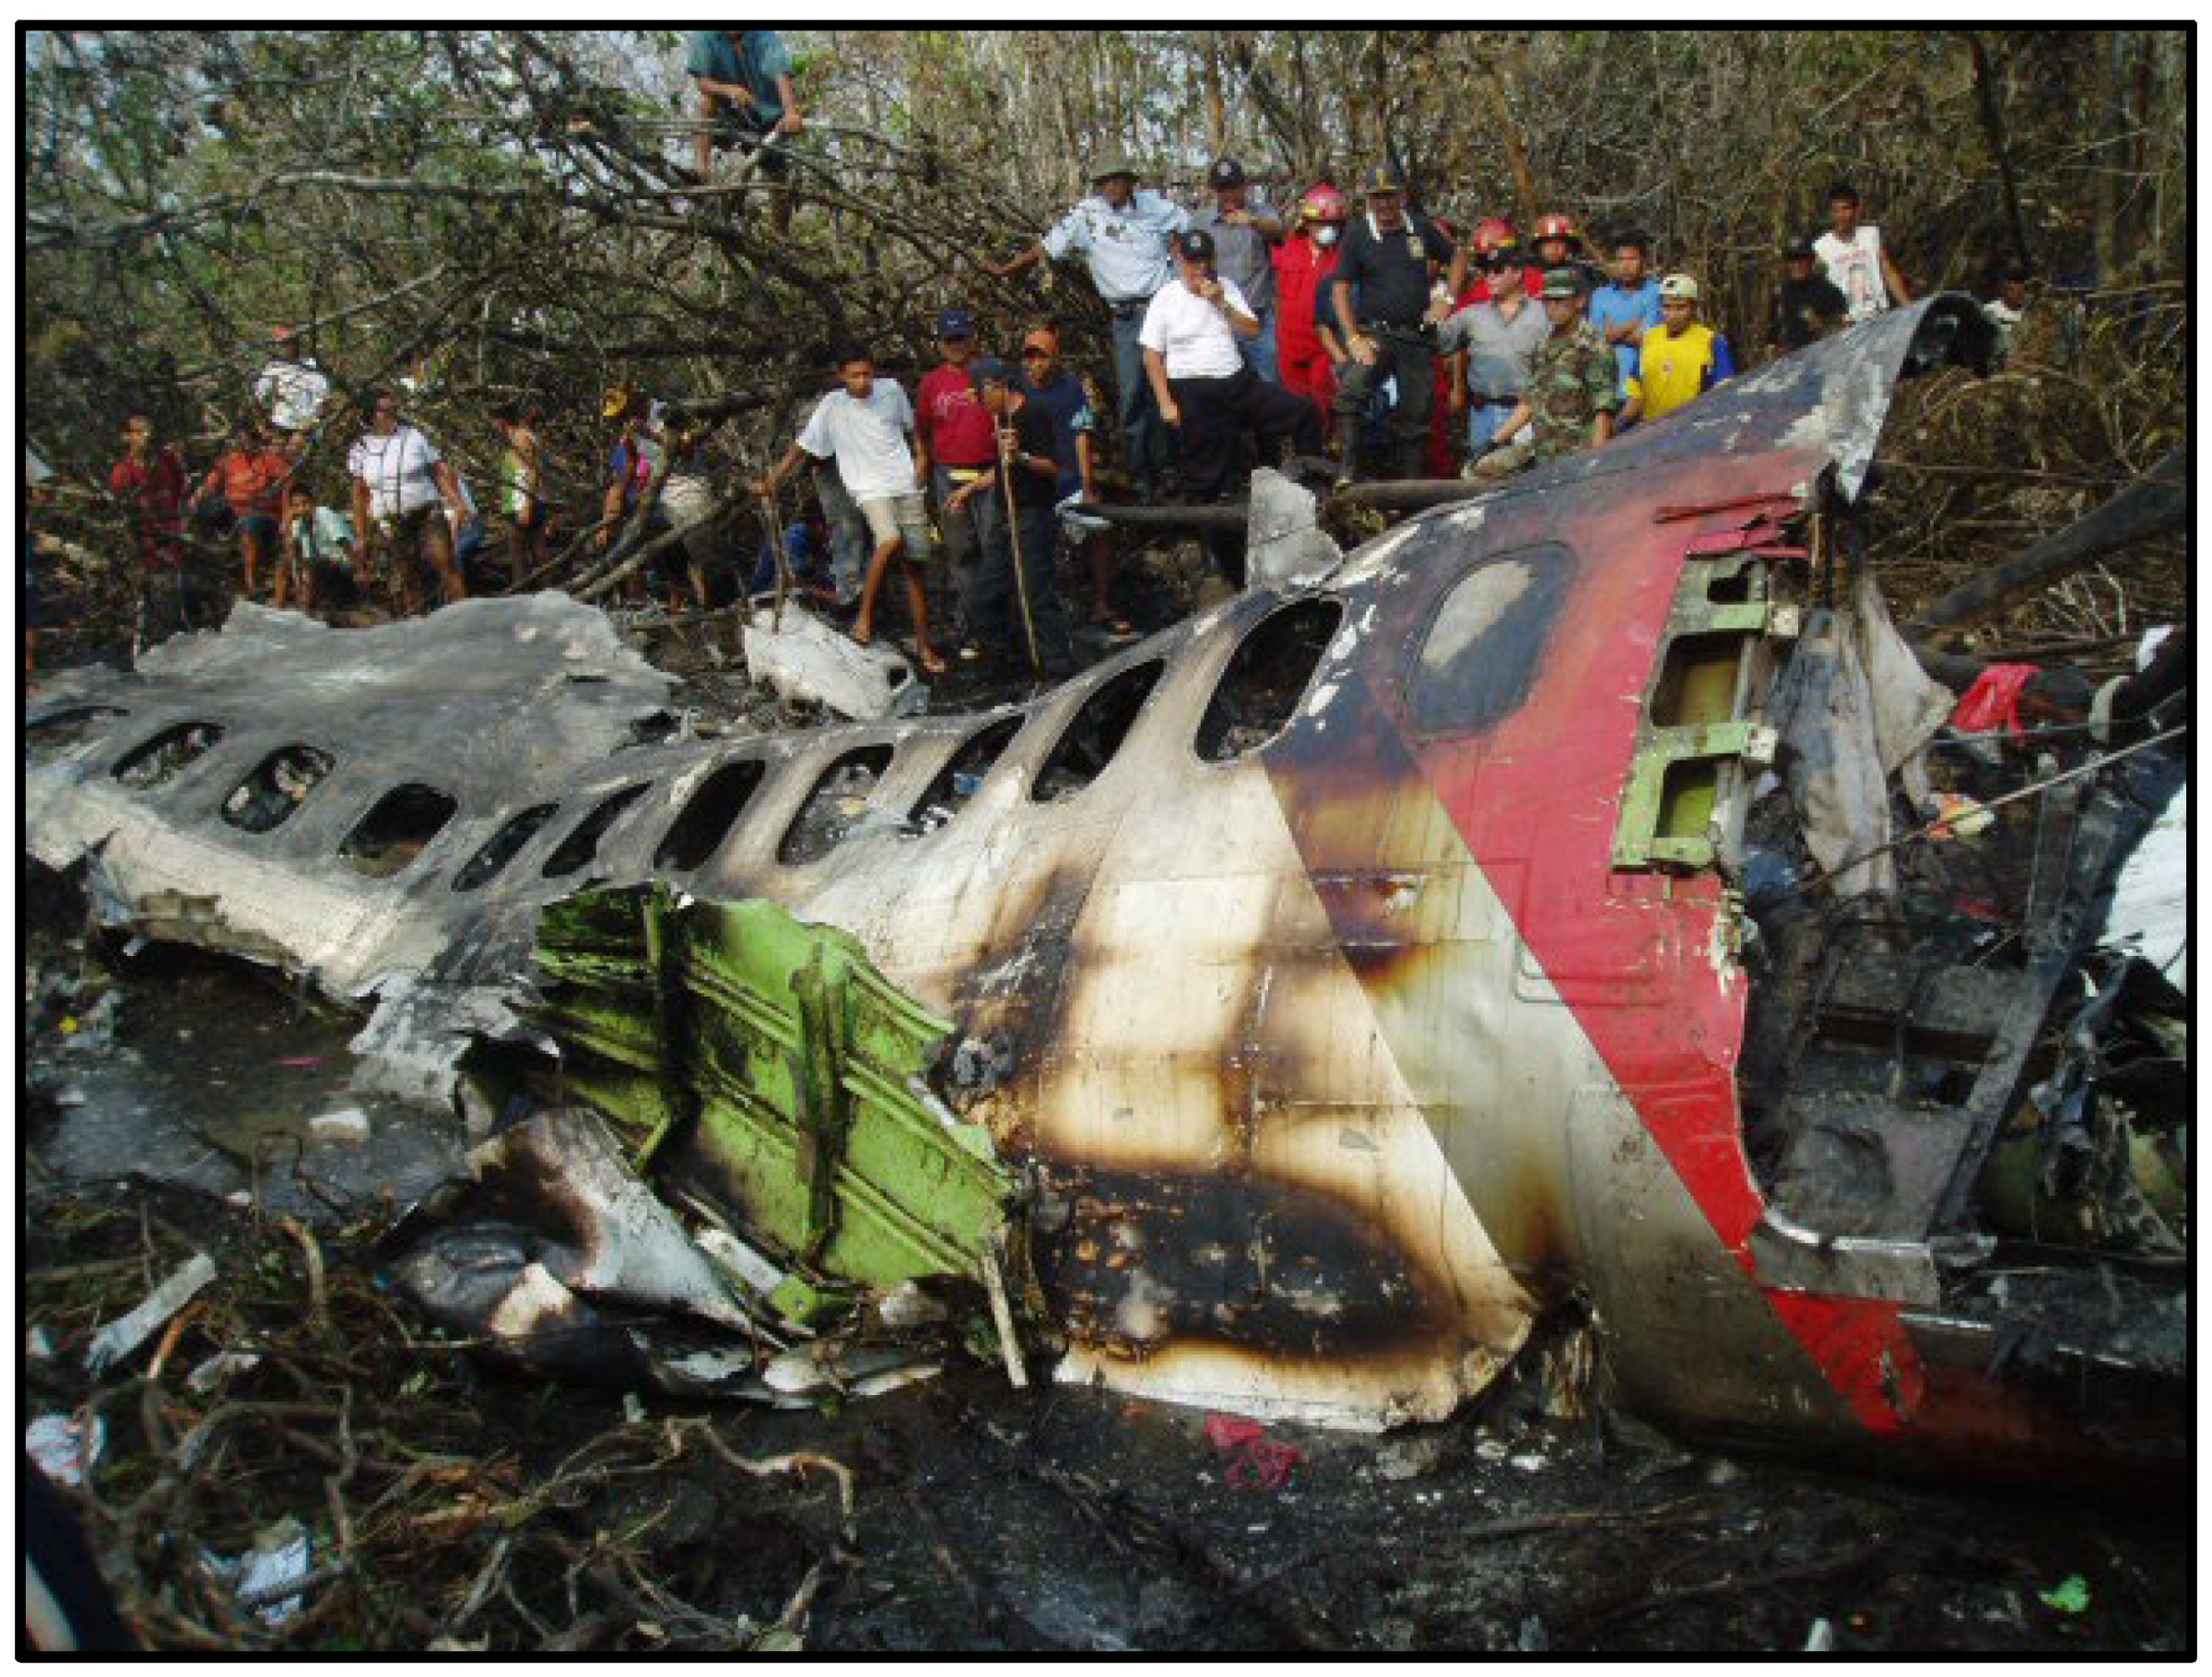
Figure 4.
Cold front over the city of Pucallpa (SPCL) on 08/23/2005 [6]. The image was captured by the GOES 12 satellite with 1 kilometer resolution at 15:45 local time (20:45 UTC) on August 23, 2005.
Figure 4.
Cold front over the city of Pucallpa (SPCL) on 08/23/2005 [6]. The image was captured by the GOES 12 satellite with 1 kilometer resolution at 15:45 local time (20:45 UTC) on August 23, 2005.
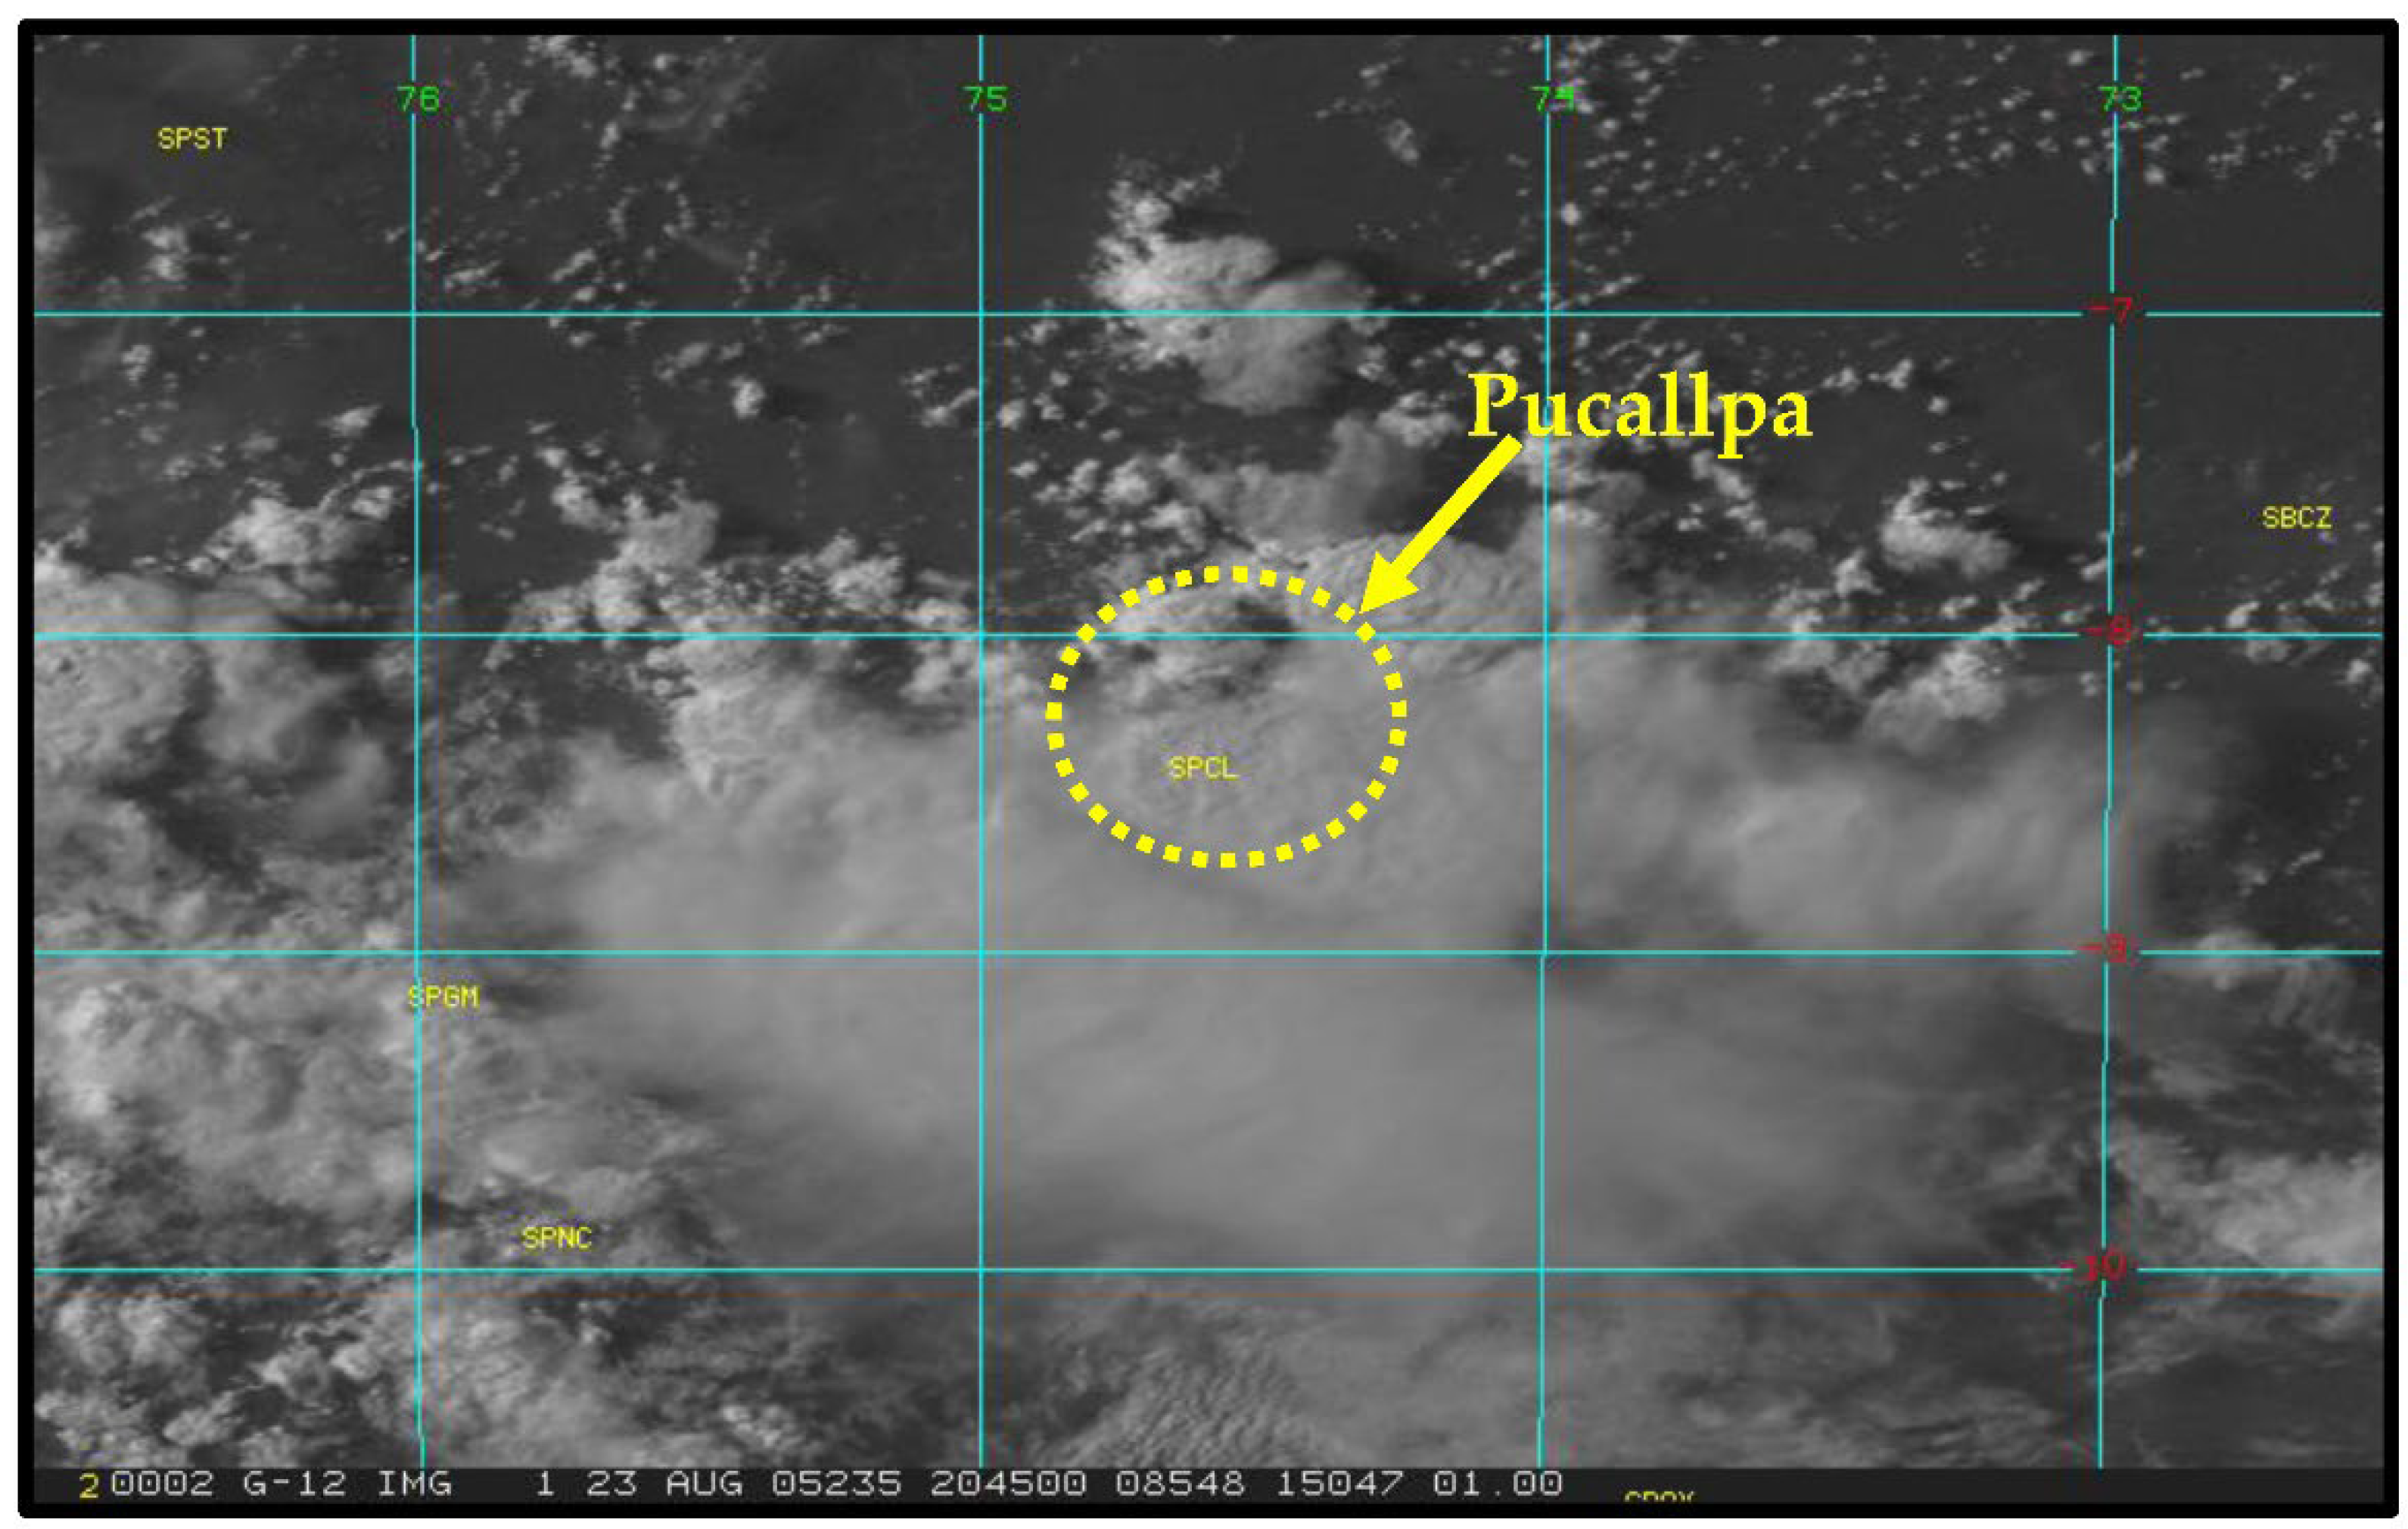
Figure 5.
Heat map over the city of Pucallpa (SPCL) on 08/23/2005 [6]. The magenta color depicts the lowest temperature of -63.15°C at the core of the storm.
Figure 5.
Heat map over the city of Pucallpa (SPCL) on 08/23/2005 [6]. The magenta color depicts the lowest temperature of -63.15°C at the core of the storm.
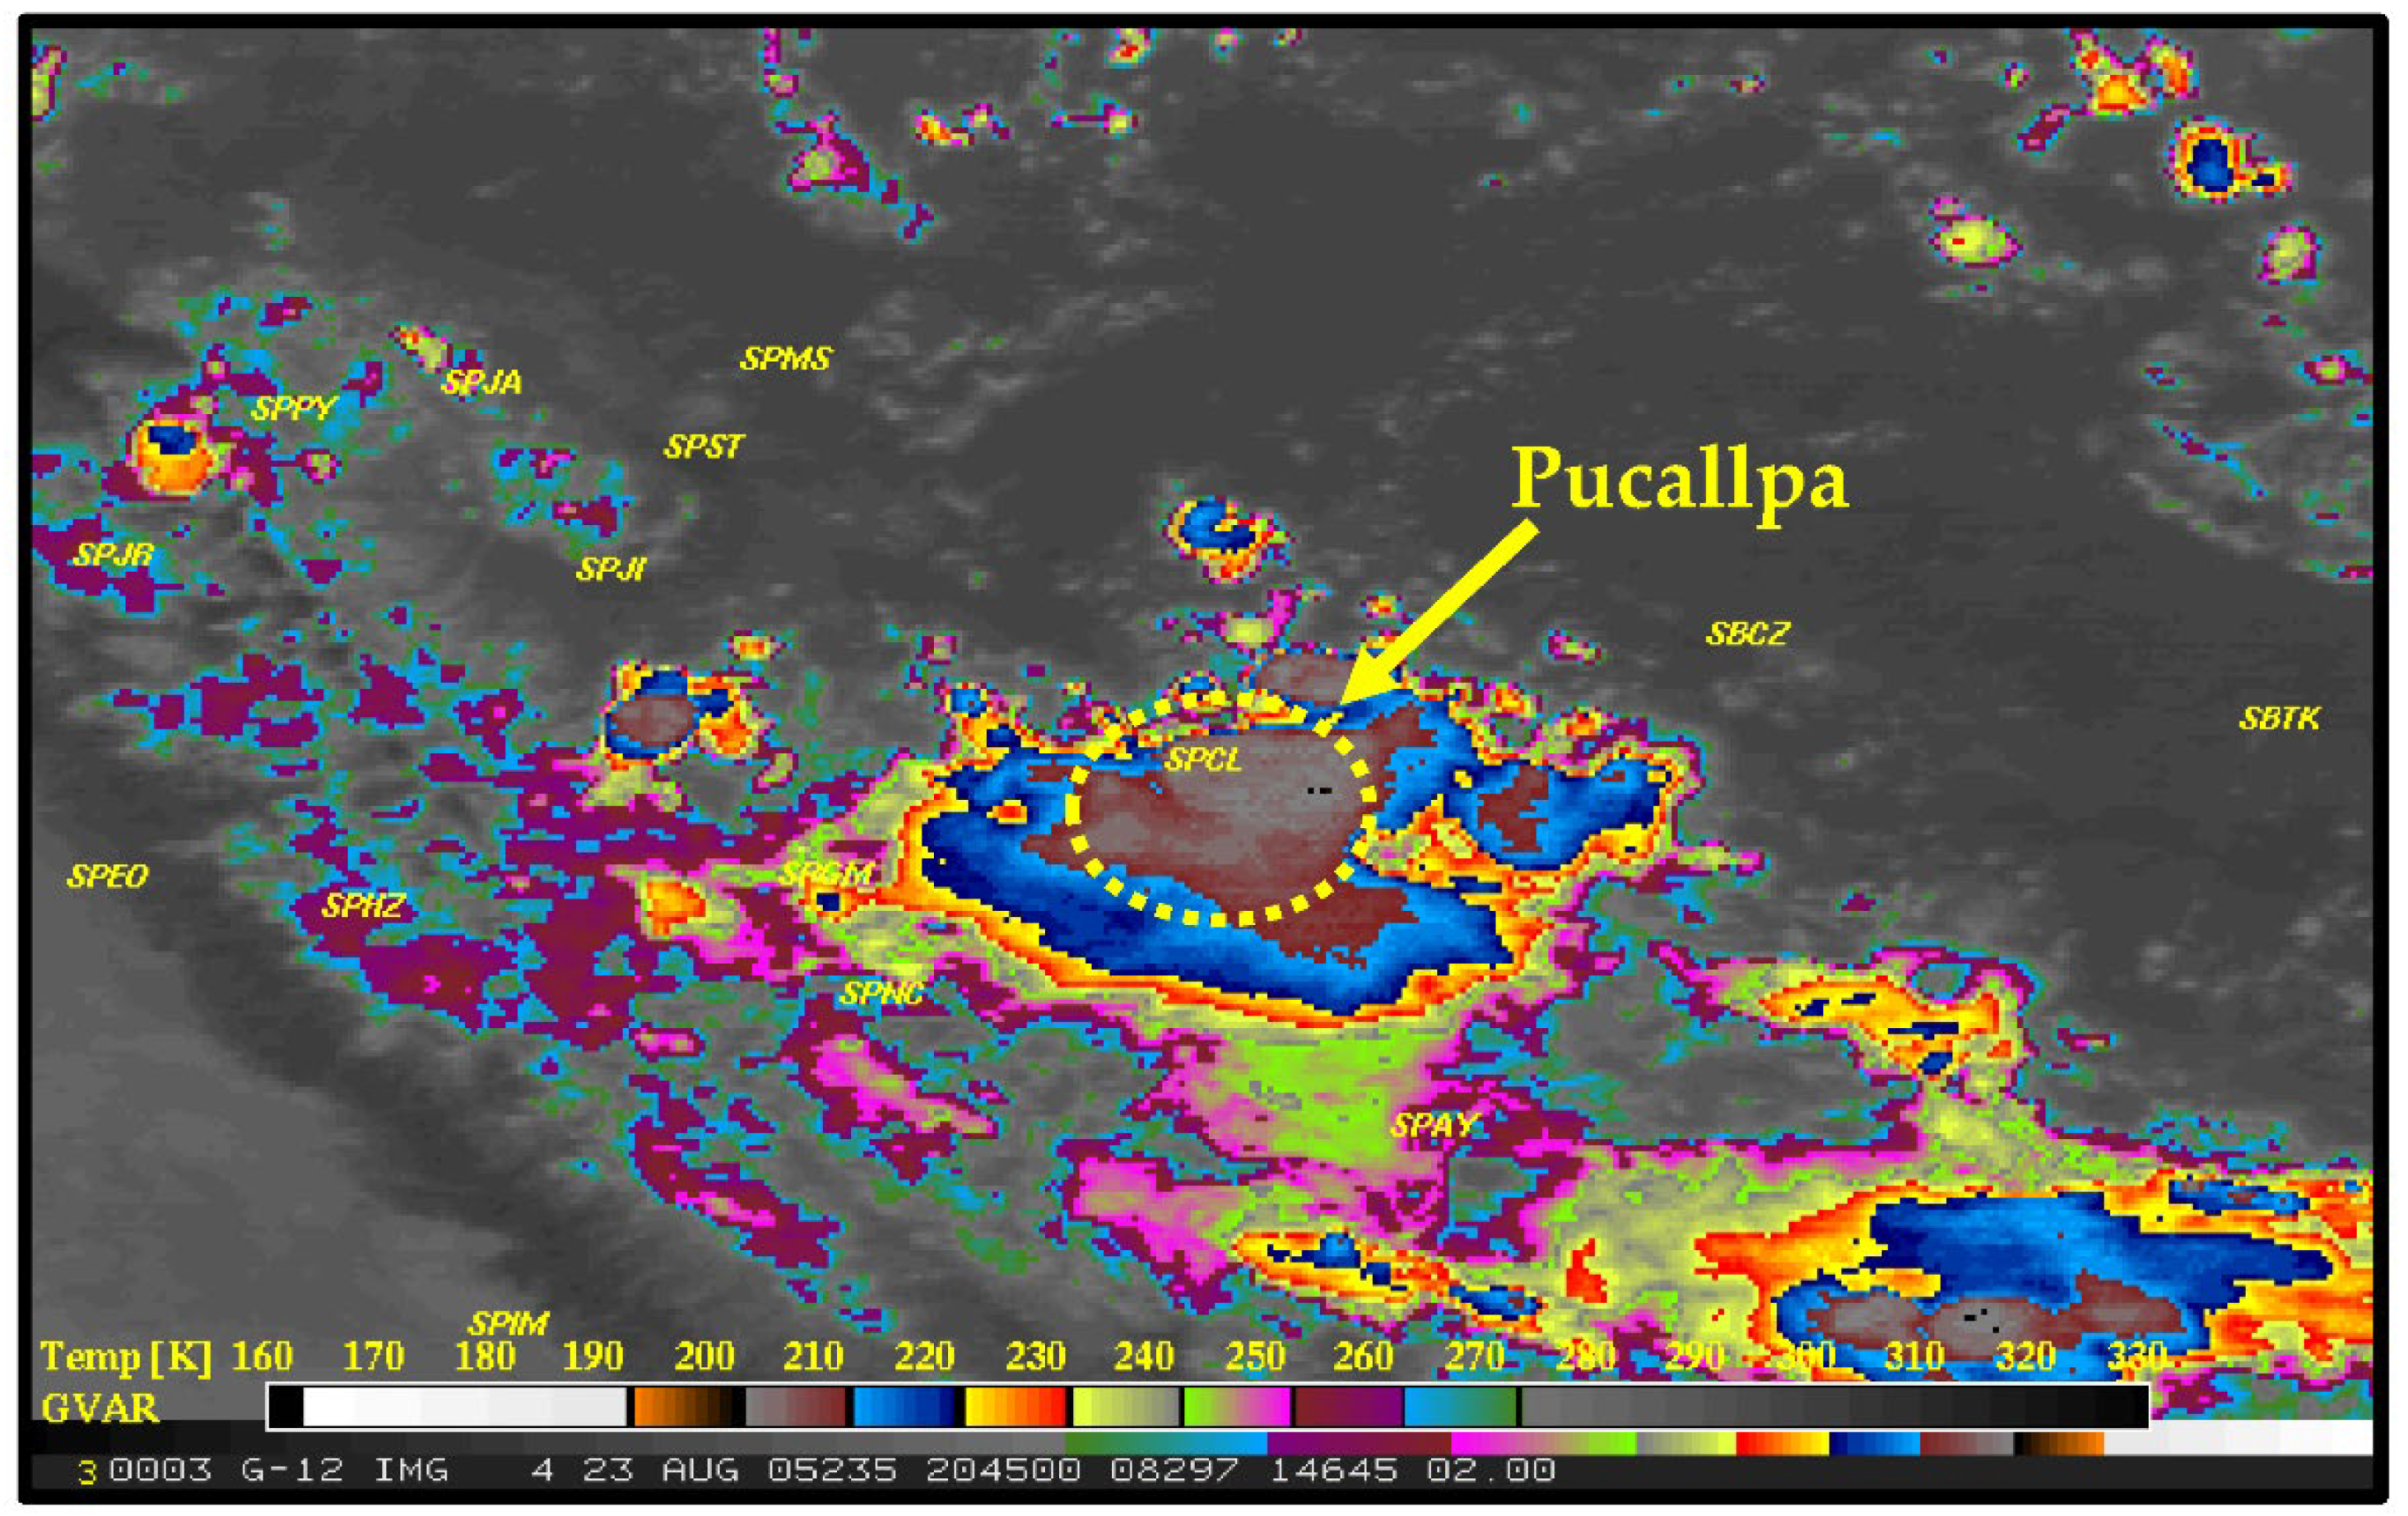

Table 1.
Severity and Probability Risk Matrix for meteorological variables at Pucallpa Airport.
|
Severity |
Probability | |||||
|---|---|---|---|---|---|---|
| Improbable | Possible | Ocassional | Likely | Constant | ||
| 1 | 2 | 3 | 4 | 5 | ||
| Negligible | 1 | 2 | 4 | 6 | 8 | 10 |
| Minor | 2 | 4 | 8 | 12 | 16 | 20 |
| Moderate | 3 | 6 | 12 | 18 | 24 | 30 |
| Critical | 4 | 8 | 16 | 24 | 32 | 40 |
| Catastrophic | 5 | 10 | 20 | 30 | 40 | 50 |
Table 2.
Weighting of scores for the Risk level.
| Score | Level of risk |
|---|---|
| 2 a 8 | Acceptable risk |
| h10 a 18 | Tolerable risk |
| 20 a 24 | High risk |
| 30 a 50 | Critical risk |
Table 3.
Risk Level Matrix for the main meteorological variables at Pucallpa Airport.
| Meteorological variable | Risk | Severity | Probability | Risk of level |
|---|---|---|---|---|
| Precipitation | 1 | Moderate | Moderate | High risk |
| Wind speed | 2 | Critical | Occasional | High risk |
| Wind direction | 3 | Moderate | Moderate | High risk |
| Air temperature | 4 | Moderate | Occasional | Tolerable risk |
| Pressure atmospheric | 5 | Moderate | Occasional | Tolerable risk |
Table 4.
Main meteorological variables that may pose risks to aircraft at Pucallpa airport.
| Meteorological variable | Months of the year in which prevail | Asscociated risk |
|---|---|---|
| Average wind speed | During the months of August/September/October/November/December/January, an average wind speed of between 2.5 to 3 KT (knots) is recorded, whereas from February to July, an average wind speed of less than 2.5 KT down to 1.9 KT is recorded. *The maximum recorded speed between the years 2006 and 2011 was 28 KT (knots) in September, while in March it was recorded as 15 KT (knots). |
The effects of wind can occur in different stages of flight, but the risk is greater during the landing process, as it can create instability in the airplane and cause it to crash to the ground. |
| Wind direction | From January to April and from July to December, the predominant wind direction is from North to South, whereas in May and June it is from the Southwest. *These wind directions are predominant, but it is not ruled out that at certain times the direction may change for a certain period of time. |
The so-called crosswinds and tailwinds, the former of which can cause instability in the aircraft and the tailwind can cause the aircraft to lose lift, both pose a significant risk to the takeoff or landing of airplanes. |
| Precipitación | January/February/March/April *In lower intensity in the months of June/July/August/September. |
During takeoff and/or landing, a runway (pavement) with a height difference of more than 3mm represents a risk because the pilot may lose control of the aircraft and leave the limits of the runway. |
Disclaimer/Publisher’s Note: The statements, opinions and data contained in all publications are solely those of the individual author(s) and contributor(s) and not of MDPI and/or the editor(s). MDPI and/or the editor(s) disclaim responsibility for any injury to people or property resulting from any ideas, methods, instructions or products referred to in the content. |
© 2024 by the authors. Licensee MDPI, Basel, Switzerland. This article is an open access article distributed under the terms and conditions of the Creative Commons Attribution (CC BY) license (http://creativecommons.org/licenses/by/4.0/).
Copyright: This open access article is published under a Creative Commons CC BY 4.0 license, which permit the free download, distribution, and reuse, provided that the author and preprint are cited in any reuse.


