1. Introduction
The Internet of Things (IoT) has been powered by the growth of smart systems and WSN technologies. In fact, sensing devices are considered part of the core components of IoT [
1]. Several examples of WSN-based IoT applications can be listed. One of them is the IoT-based sensor infrastructure that is used in precision agriculture applications, where wireless agriculture sensors are dispersed across the agriculture field to sense moisture, temperature, and humidity in the soil [
2]. Moreover, in environmental applications, IoT is largely dependent on WSNs, where sensors continuously monitor the environment in IoT WSNs and alert the base station immediately if any event is detected, even if there is an emergency alert [
3]. Also, in the industry application called Industrial Internet of Things (IIoT), the focus is on network automation processes through proper communication and data collection between sensors, actuators, and processing units [
4].
On the other hand, because energy is a limited resource in sensor nodes, there are many research efforts to find solutions that contribute to optimizing energy consumption and using it more efficiently [
5]. In that sense, there are different approaches focused on assessing diverse communication protocols, routing methods, Medium Access Control (MAC) solutions, and aggregation schemes [
6,
7], and [
8] with the objective of extending the network lifetime.
Considering that energy consumption is a key factor, it is important to model and analyze energy behavior, which contributes to a better understanding, management, and design of sensor networks. To this end, several models have been developed to analyze energy consumption in WSN networks with IoT applications. For example, in [
9], a very complete deterministic model is carried out where a simple MAC is considered, focusing more on the consumption of the PHY layer and considering operating modes or classes.
In [
10], the authors present a model with a stochastic component, where they model energy consumption as a random variable with their respective probability distribution function (PDF) and maximum and minimum limits of expected energy values. Physical layer issues are the main ones taken into account in the model, but there is also a part of the MAC that is relatively simple. In [
11], they do stochastic modeling, where they modify topologies and perform analyses and simulations for validation. They consider random variables and their corresponding probability distribution of communication jumps between nodes, distances, and the number of nodes in the network. But the approach is physical and routing (without specifying any protocol) and does not take into account media access protocols.
There are approaches where they model and analyze energy consumption [
12] and try to predict such consumption [
13] based on Markov process tools. They consider consumption in various states and during transitions, not taking into account the MAC or incorporating it very basically into the model. In [
14], they mention that they incorporate the duty cycle mechanism into the model. They consider sleep and active modes as principal phases and two more intermediate phases in their energy calculation. They use joint probability to model the number of data packets and a multidimensional Markov process to model sensor phases. No medium access protocol or any synchronization algorithm is observed to be incorporated.
The inclusion of a robust medium access procedure is important in modeling, as the nature of the shared medium leads to conflict processes that can cause collisions to a greater or lesser extent depending on traffic conditions and node density [
15]. Of all the models mentioned above, they have in common that the considerations of the MAC layer are very basic, where conflict situations or measures against possible collisions are not considered. This mentioned would definitely have an impact on energy consumption. In the previous models, there are no scenarios where there is heterogeneity that gives way to priority assignments. Another feature of these models is that the operating states of the sensor node were established to analyze its energy consumption, but without considering that these states would be affected by other active nodes around. The nature of the scenario where nodes coexist and share the medium involves a certain degree of dependence among nodes, consequently affecting the energy they could consume. Moreover, if we consider heterogeneous environments where there is more than one type of sensor in the network, in the calculation of energy consumption, the complications that may arise from this type of coexistence in the different phases or states should be considered. Even scenarios where there is a priority allocation option and the incorporation of a packet aggregation scheme.
From other related works focused on the study of energy consumption in WSNs that use similar modeling tools, we have found [
16], where a stochastic analysis of energy consumption is carried out. Even a Markov chain is built, but without considering heterogeneous scenarios or any APT scheme. On the other hand, very few jobs have been found for the development of analytical models for WSN evaluation with packet aggregation schemes (APT). However, in [
17], an energy analysis of a WSN is carried out considering APT and deriving Markov models, but focused on a routing perspective and without considering any specific layer MAC protocol. Other studies include the energy analysis of the WSN with a duty-cycle (DC) MAC, considering APT, and even some degree of heterogeneity in the nodes [
18,
19], but these studies have been accomplished mainly by simulations or by testing with laboratory prototypes.
In [
20], the authors have developed DTMC models to evaluate performance parameters for a WSN with MAC operating with DC, including energy consumption and considering the APT scheme. However, this study does not consider heterogeneous scenarios or any priority assignment.
Furthermore, although the energy analysis considers different node operation cycles and operation modes, the present study is more direct with the resulting stationary probability distribution, which is used in the expressions to determine energy consumption. In [
21], with the introduction of the Priority Sink Access MAC Protocol(PSA-MAC) model, we have proven this new approach to the determination of energy that allows for more accurate results with a more systematic method of calculation. Additionally, the performance of a heterogeneous network using a DC MAC protocol has been evaluated. In these models, the established transmission scheme is one packet per cycle (SPT).
In [
22] we have enhanced the model in order to support the APT scheme, including the energy approach used in [
21]; nevertheless, in all these models, only the energy consumption during the data transmission period of the transmission cycle is considered.
For that reason, in [
23], we derived exhaustive expressions to determine the energy consumption of the sensor nodes during the full transmission cycle, including the data transmission period, the synchronization and sleep periods. Moreover, the awake and sleep operation modes of nodes were contemplated. However, the model does not support heterogeneous scenarios that include different classes of nodes conforming to the network. On the other hand, the incorporation of an aggregated transmission scheme was not contemplated.
A contribution of this work is the analytical modeling and comprehensive assessment of power consumption performance for a WSN whose MAC operates with the DC mechanism in scenarios where the nodes have different loads, access priorities, and APT and SPT transmission capabilities. The model is based on two two-dimensional Markov discrete time chains (2D-DTMC), whose solution in terms of stationary probability distribution is used with comprehensive expression for determining the energy consumption of nodes, considering all the above-mentioned scenarios but also considering the heterogeneous scenarios and the issues involved in the coexistence of different nodes.
For the determination of energy consumption expressions, we have considered awake operating cycles, whose aim is for nodes to listen to the transmission of possible SYNC packets from neighboring nodes and, thus, to be updated in their synchronization calendar. The activity of the reference node of each class and the other neighboring nodes is taken into account (from the same or different classes). This generates different combinations for each class of nodes, which we call types, and for each one, an expression is generated for the energy calculation. Similarly, expressions are established to determine the energy consumption (for each type of node) in the so-called normal cycles, in which, to save energy, nodes are disabled and enter sleep mode for the rest of the transmission cycle after a successful or failed transmission.
For the total energy consumption calculation, the energy consumption during the awake cycles and the energy consumption during the normal cycles are added to the energy used during the synchronization period at the beginning of the transmission cycle and the energy consumption during the data transmission period. The node activity during the synchronization period is necessary for nodes to create the transmission schedule at the beginning of the transmission cycle. The activity of nodes during the data transmission period includes the CSMA/CA contention mechanism and the RTS/CTS/FRAME/ACK interchange packets.
The remainder of the article is organized as follows: In
Section 2, the heterogeneous and APT transmission model and scenarios are resumed. The analysis to obtain the energy performance is developed in
Section 3. The results and their discussion are set out in
Section 4. Finally, the conclusions are presented in
Section 5.
2. Heterogeneous and APT Transmission Model and Scenarios
Before specifying the procedure for determining the energy consumption, it is necessary to review some aspects in relation to the WSN scenario, the transmission procedure, the transmission cycle and operation modes of the nodes. The heterogeneous model is resumed from [
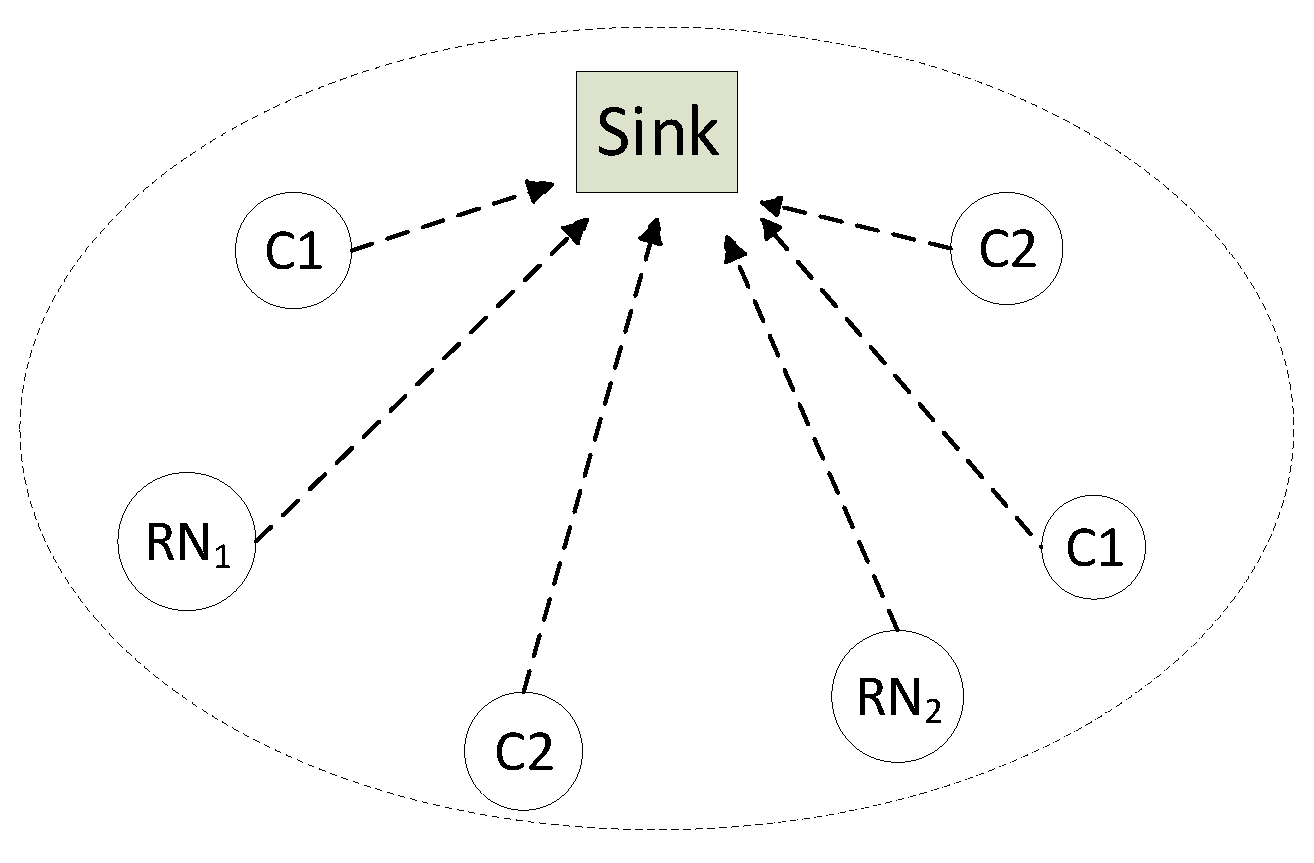
21], where two classes of nodes coexist in the WSN, as shown in
Figure 1, and where there will be a pair of reference nodes, one for each of the classes considered (RN1 and RN2).
class 1 nodes are given priority in medium access, as explained in detail in [
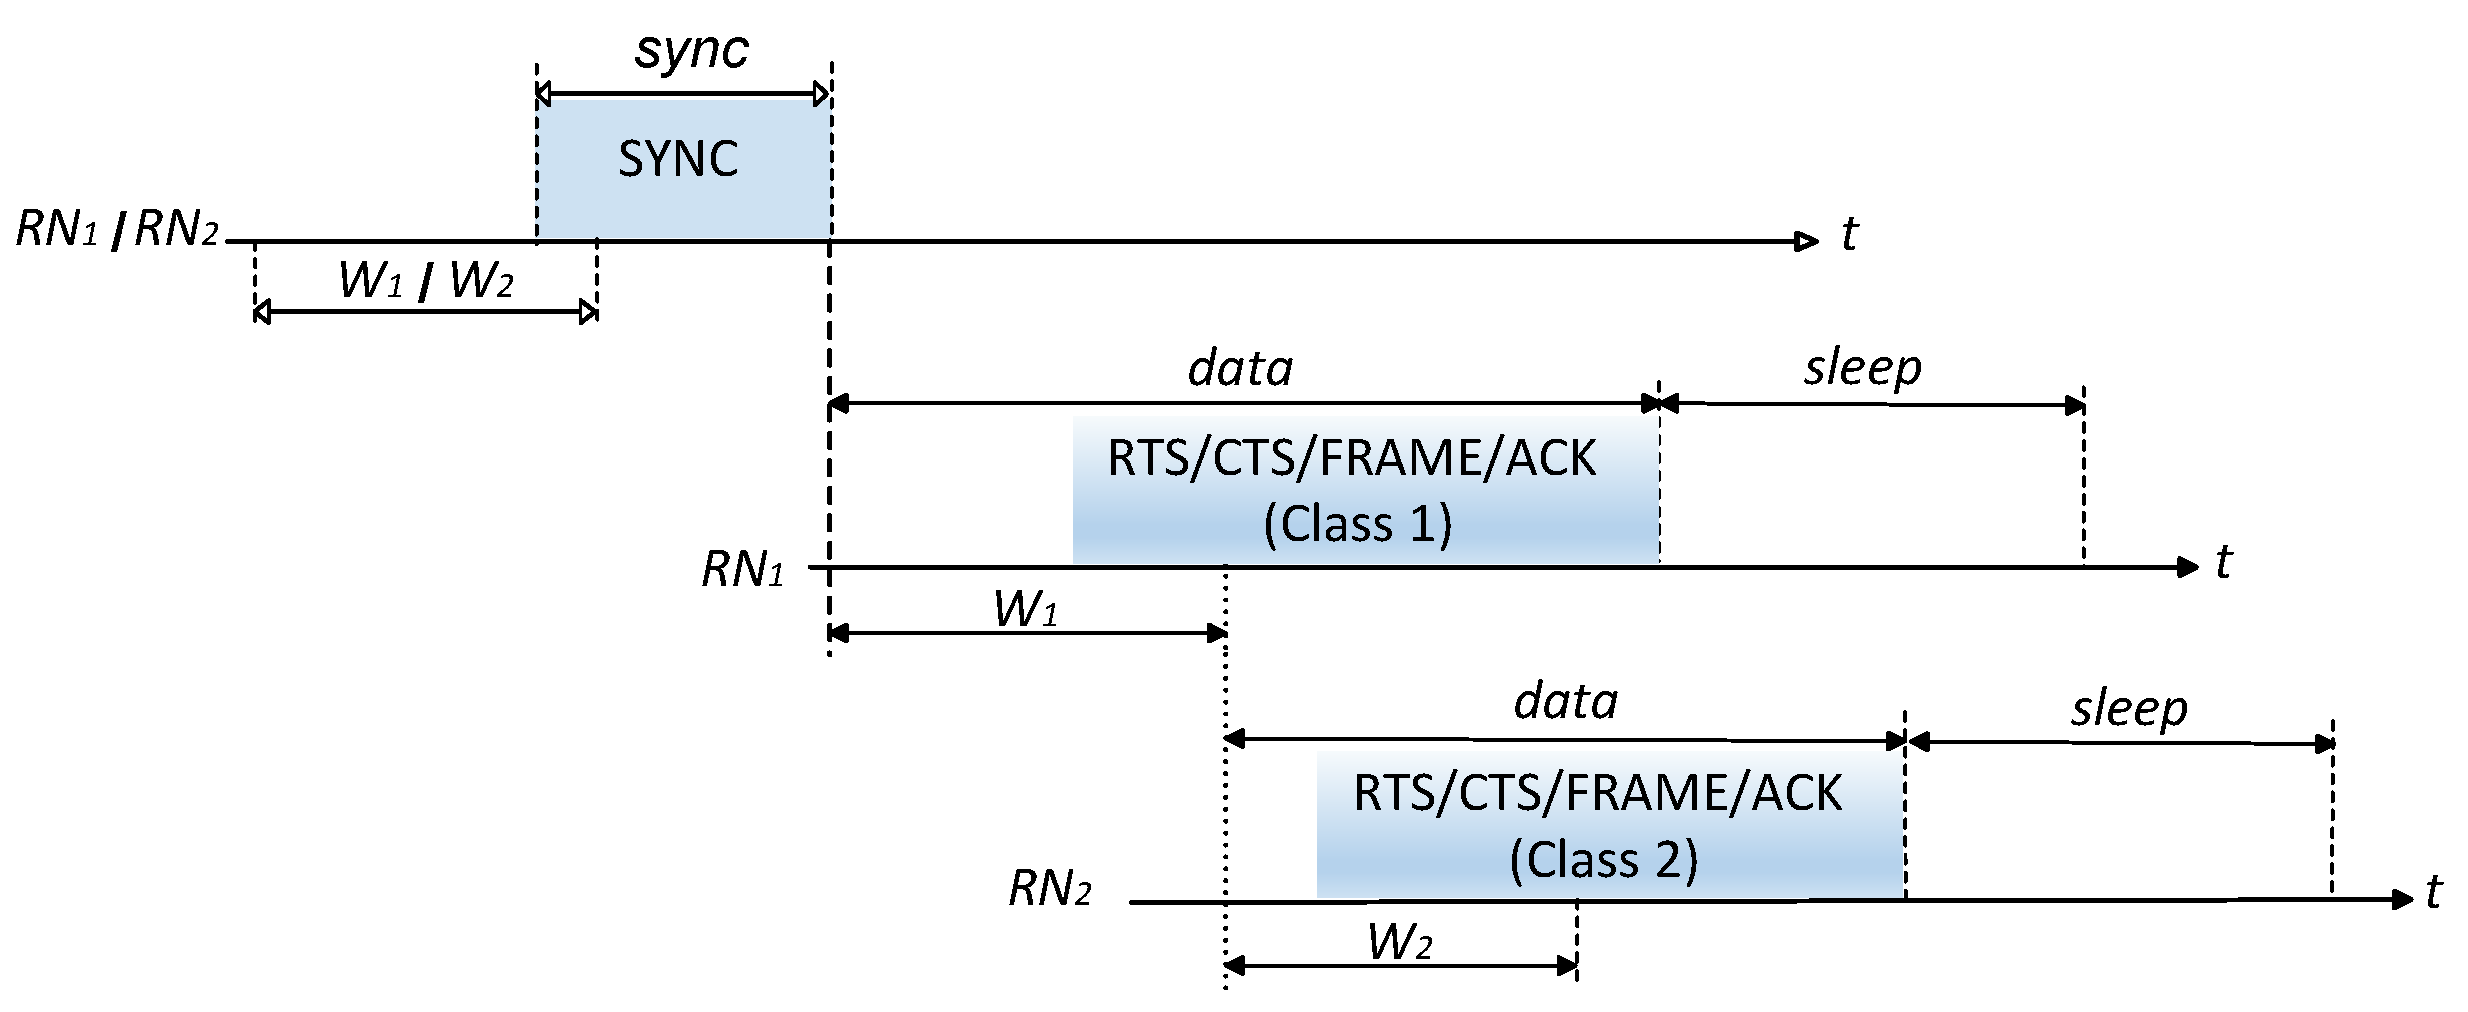
21], and according to the transmission process that can be seen in
Figure 2. The transmission process is structured in cycles, which are composed of the
active and
sleep periods; furthermore, the
active period is subdivided into the
sync and
data periods. In
Figure 2, you can also observe the different periods that constitute the cycle, showing the scheme of a transmission where the two types of nodes of the WSN are considered. With respect to [
21], the synchronization period is now included, and now is possible to send mode than one packet embedded in frames.
Consequently, in this model, the energy consumption contribution of the
sync period procedure is considered. In addition, the energy contribution during the data period, used by the nodes to transmit the DATA packets, is contemplated. Moreover, nodes have the ability to transmit both in SPT and with APT. On the other hand, the transmission procedure involves the exchange of control packets (RTS, CTS, and ACK), which is illustrated in
Figure 2.
On the other hand, the contribution during the sleep period is also taken into account. During this period, nodes fall asleep to save energy or wake up to listen to SYNC packets that have been transmitted, according to the corresponding cycles of
normal operation or
awake, respectively. It should be noted that during the sleep period there are two possible cycles of operation: the normal cycles that occur most frequently, in which the nodes are put to rest (also called sleep mode), and the
awake cycles, which occur less often, in which the nodes remain awake and serve to maintain synchronization between nodes (also called awake mode). Finally, the modeling of the system and its solution is carried out in the same way as in [
22]. Furthermore, in this model, the nodes can perform the aggregation of packets according to the packets they have in their queues. It is important to note that the packet aggregation capability applies to each class of nodes, regardless of their priority. The model considers both coupled Markov chains and their solution in terms of stationary probability distribution and is used by the expressions to evaluate the energy performance in a more precise and systematic way.
3. Energy Consumption
The entire transmission process occurs during a cycle that consists of an active period and a sleep period. The active period is subdivided into the sync and data periods. In this section, we derive expressions to determine the average energy consumed by the RN per cycle, considering the different periods and contributions.
3.1. Average Energy Consumption in the Sync Period
It should be noted that for the purpose of synchronization, the nodes consume energy due to the transmission and reception of SYNC packets during the sync period of the transmission cycle. The equations
1 and
2 allow to determine the energy consumption of
and
during that period (
):
where
is the duration of the
sync period,
W is the size of the contention window,
is the transmission duration for a
SYNC packet, and
is the one-way propagation delay.
In addition, and are the power levels of reception and transmission, respectively. The parameter indicates the cycle periodicity of the transmission of SYNC packets. Suppose the RN, of the corresponding class, transmits one SYNC packet every cycles and may receive one packet per cycle in the remaining cycles ().
3.2. Average Energy Consumption in the Data Period
The entire process required for the transmission of the DATA packets, which takes place in the data period, involves an energy consumption, which is determined by the expressions (
3), (
4) and (
5). In this section, the analytical process for determining the energy consumed by the reference nodes,
and
, is shown in the
data period of the transmission cycle. It should be remembered that only the energy consumed by the radio frequency transceiver is studied; therefore, the energy consumption due to events related to specific detection or monitoring tasks, depending on the application of the sensor node, is not included in the calculation. The average energy consumed by the
RN of the corresponding class during the
data period of a cycle is generally the sum of the energy consumed when the node successfully transmits its frame (
), and the energy used by the node when it fails to transmit because it encounters a collision (
).
The consumption due to a successful transmission,
, for class 1 nodes is obtained by the expression (
4).
where
, and
are the transmission times of the corresponding packets. The factor
is defined as the number of packets added to the transmission when the node is in state
i. The factor
is the stationary probability distribution; therefore,
is the corresponding to class 1. The energy consumption due to collision (
) for class 1 nodes is obtained by the expression (
5).
For class 2 nodes, the energy consumption due to success transmissions (
) and collision transmissions (
) is calculated in the same way. In this case, the stationary probability distribution corresponding to the class 2 node (
) is used in calculations. In addition, the multiplication should be considered by the factor
, which is the probability that there are no active classes 1 nodes in a cycle (fractions of cycles in which classes 1 nodes are inactive) [
21].
3.3. Average Energy Consumption During Awake Cycles
It should be noted that awake cycles are those in which the nodes, during the sleep period, must remain awake, even if they have completed their transmission process, or must wake up if they were not awake. When a node is in awake mode, it wakes up at the beginning of the awake cycles and remains awake until the cycle ends. When the node hears the start of a successful transmission, it reads the , calculates the time the channel remains occupied, and moves to sleep mode. When the broadcast ends, it returns to the awake state. The aim of the above is for the nodes to listen to the transmission of the possible SYNC packets of the neighboring nodes; thus, to be updated in their synchronization schedule. We refer to these cycles as awake cycles. It is desired to calculate the energy consumed by node and by cycle of each class in the awake cycles. It is supposed that in these cycles, the node activates the awake mode at the beginning of the cycle (after the sync period, which is the same for both classes). Note that for cycles in which class 1 nodes collide, Class 2 nodes are considered to detect activity and not participate in the channel access contention.
3.4. Awake Consumption Scenario for class 1 Nodes
For class 1 nodes, in particular , the following types of cycles are considered:
Cycle 1A: is ACTIVE : class 1 nodes access the channel in the same cycle than is in awake. Access to the channel can be from the same or from other class 1 nodes. In the first case, the performs channel detection or channel sensing, and the following cases can occur: (a) the performs a transmission successfully; (b) the collides; (c) another node performs the transmission with success; (d) other nodes collide.
Cycle 1B: is INACTIVE . class 1 nodes access the channel in the same cycle that RN1 is awake. Access to the channel can only come from other class 1 nodes. The listens to the channel to decode the RTS and determine the duration of the frame. The following cases may occur: (a) another node performs a transmission successfully; (b) other nodes collide.
Cycle 1C: and the rest of the class 1 nodes are INACTIVE . There are class 2 nodes active that access the channel in the same cycle that is awake. The listens to the channel to decode the RTS and determine the duration of the frame. The following cases may occur: (a) a class 2 node performs a successful transmission; (b) several class 2 nodes collide.
Cycle 1D: and the rest of class 1 and Class 2 nodes are INACTIVE, in the same cycle that is awake, .
3.5. Energy Consumed in Awake by RN1
The following are the expressions used in the calculation of the energy according to the scenarios corresponding to the cycles mentioned in the previous subsection.
3.5.1. Energy Consumption in Cycles of Type 1A
The energy consumption in cycles of type 1A is obtained from the sum of the expressions (
7), (
8), and (
9). With the addition of the results of the above expressions, we obtain the energy consumption in cycle 1A, as observed in expression (
6).
where
,
and
, are the terms of energy consumption when the
RN successfully transmits, transmits with failure (collision), and overhears transmissions from another node, respectively. During a successful transmission, the consumption of
is given by the expression (
7).
where
T is the duration of the cycle. When collisions occur, the energy
is obtained with the expression (
8).
The power consumption due to
overhearing,
, is determined by the expression (
9).
It is assumed that
is the probability that other nodes will collide their packets in cycles where
is active.
defines the probability that one of the
k nodes, other than
, will gain access to the channel but transmit with collision when
is active.
is the power level in sleep mode. During consumption due to
overhearing, it is necessary to know how long the
will be in
sleep mode while the transmission of another node occurs. Upon completion of such transmission, the
will return to the
awake state. Therefore, it is important to estimate the duration of the transmission, whose duration depends on the size or number of packets aggregated. The parameter
is the average package size of the frame that the
, or any other node of the same class, would transmit conditioned to the
contends with other
k nodes in the same cycle, and is determined by the following expressions (
11):
if only one package is sent per plot (SPT transmission mode).
3.5.2. Energy Consumption in Cycles of Type 1B
The energy consumption in cycles of type 1B is obtained by the expression (
12).
where
, defines the probability that one of the
k nodes, other than
, wins access to the channel but transmits with collision when RN1 is inactive.
3.5.3. Energy Consumption in Cycles of Type 1C
The energy consumption in cycles of type 1C is obtained with the expression (
14). The
is
awake from the beginning of the cycle; it goes to sleep when it hears the transmission of a class 2 node and wakes up again at the end of this cycle.
Each of the terms in the above expression indicates the energy consumption according to the possible events that may occur. The first term expresses the energy consumed when one of the active nodes (the and other k) successfully transmits; the second term defines energy consumption when a k active node other than the has successfully transmitted in a cycle with the inactive; the third and fourth terms indicate consumption when two or more of the k nodes, different from the , gain access to the channel but transmit with collision when the is active or inactive, respectively.
Note that the stationary probability distribution used is
, so the average frame size,
, is calculated as indicated in the expression (
15).
where
. Note that if
, only one packet per frame is sent (SPT transmission mode). The probabilities of failure in transmission
and
are calculated using the expressions (
10) and (
13), respectively, but taking into account the contention window parameter for the class 2 nodes (
).
3.5.4. Energy Consumption in Cycles of Type 1D
The energy consumption in cycles of type 1D is obtained with the expression (
16). In this cycle, energy consumption is accounted for when there is no activity at the nodes.
3.5.5. Consumption in the Awake State for RN1
The final value of energy consumed is given by the expression (
17), which consists of the sum of the different energy consumptions in the cycles considered above.
Note that is multiplied by the factor, which defines the fraction of cycles where class 1 nodes are inactive. Remember that the transmissions in this cycle are due to Class 2 nodes; therefore, class 1 nodes will be inactive during this transmission process.
3.6. Awake Consumption Scenario for Class 2 Nodes
For class 2 nodes, in particular for , the following cycles are considered:
Cycle 2A: class 1 nodes are INACTIVE , but and other Class 2 nodes are active : Class 2 nodes access the channel in the same cycle as is awake. Access to the channel can be from the same or from other Class 2 nodes. In the first case, the performs channel detection or channel sensing, and the cases that may occur are: (a) the performs a transmission successfully; (b) the collides; (c) another class 2 node performs the transmission with success; (d) other class 2 nodes collide.
Cycle 2B: class 1 nodes are INACTIVE; is also inactive, but other Class 2 nodes are active. Class 2 nodes access the channel in the same cycle that is awake. Access to the channel can only be performed by other Class 2 nodes. The listens to the channel to decode the RTS and determine the duration of the frame. The following cases may occur: (a) another Class 2 node performs transmission successfully; (b) other Class 2 nodes collide.
Cycle 2C: class 1 nodes are ACTIVE . The listens to the channel to decode the RTS and determine the duration of the frame. The following cases may occur: (a) a class 1 node performs a transmission successfully; (b) several class 1 nodes collide.
Cycle 2D: and the rest of the class 1 and Class 2 nodes are INACTIVE; in the same cycle that is awake, . In one of these cycles, and could coincide in the awake state.
3.7. Energy Consumed in Awake by RN2
The expressions used in the calculation of energy according to the scenarios for the cycles mentioned in the previous paragraph are set out below.
3.7.1. Energy Consumption in Cycles of Type 2A
The energy consumption in cycles of type 2A is obtained from the sum of the expressions (
19), (
20) and (
21). The addition of the results of the previous expressions throws us into energy consumption, as observed in the expression (
18).
where
,
and
, are the terms of energy consumption when the
RN successfully transmits, transmits with failure, and listens to transmissions from another node (overhearing), respectively. During a successful transmission, the
consumption is given by the expression (
19).
When collisions occur, the energy
is obtained with the expression (
20).
The energy consumption due to
overhearing,
, is determined by the expression (
21).
It is assumed that
is the probability that other nodes will collide their packets in cycles where
is active.
defines the probability that one of the
k nodes, other than
, will gain access to the channel but transmit with collision when
is active.
is the power level in sleep mode. As mentioned earlier, during
overhearing consumption, it is necessary to know how long the node will be in
sleep mode, listening to the transmission from another node, and waiting for such transmission to conclude in order to be able to wake up during the rest of the cycle. Therefore, it is important to estimate the duration of the frame transmission, whose duration depends on the size or number of packets aggregated. The parameter
is the average packet size of the frame that the
, or any other node of the same class, would transmit, conditioned on it contending with other
k nodes in the same cycle, and is determined by the expressions of (
15). It should be remembered that with
, only one packet per frame is sent (SPT transmission mode).
3.7.2. Energy Consumption in Cycles of Type 2B
The energy consumption in cycles of type 2B is obtained with the expression (
22).
defines the probability that one of the k nodes, other than , will gain access to the channel but transmit with collision when is inactive.
3.7.3. Energy Consumption in Cycles of Type 2C
The energy consumption in cycles of type 2C is obtained with the expression (
23). The
is
awake from the beginning of the cycle, turns to
sleep mode when it hears the transmission of a class 1 node, and wakes up again at the end of the transmission.
Each of the terms in the above expression indicates the energy consumption according to the possible events that may occur. The first term expresses the energy consumed when one of the active nodes (the and other k) successfully transmits; the second term defines energy consumption when a k active node other than the has successfully transmitted, in a cycle with the inactive; the third and fourth terms indicate consumption when one k node, other than the , gains access to the channel but transmits with collision when the is active or inactive, respectively.
Note that the stationary probability distribution used is
, so the average size of the frame,
, is determined by the expression (
11). The probability of failure in transmission
and
(expressions (
10) and (
13), respectively), are calculated considering
.
3.7.4. Energy Consumption in 2D Cycles
The energy consumption in cycles of type 2D is obtained with the expression (
24). In this cycle, energy consumption is accounted for when there is no activity at the nodes.
3.7.5. Consumption in the Awake State for RN2
The final value of energy consumed is given by the expression (
25), where it is observed that it consists of the sum of the different energy consumptions in the cycles considered.
Note that and are multiplied by the factor, which defines the fraction of cycles where class 1 nodes are inactive. Remember that the transmissions in these cycles are due to Class 2 nodes; therefore, class 1 nodes are inactive during this transmission process.
3.8. Average Energy Consumption During Normal Cycles
Usually, to save energy, the nodes are disabled and enter the
sleep mode during the rest of the transmission cycle, after a successful or failed transmission. These types of cycles are called
normal cycles. The following expressions are used to determine the energy consumption of the
RN during these
normal cycles. Furthermore, in this calculation, the energy consumption due to
overhearing during the
data period is included.
where
,
and
are the terms of energy consumption when the
RN successfully transmits, transmits with failure (collision), and incurs in (
(overhearing)), respectively.
3.8.1. For class 1 Nodes
When successfully transmitted,
consumption for class 1 nodes is determined by the expression (
27).
When a failed transmission occurs, the
consumption for class 1 nodes is given by the expression (
28).
The consumption due to
overhearing (
) for class 1 nodes is obtained with the following expressions (
29):
The RN goes to sleep mode when it is inactive, . Note that in only the energy consumed in addition to and is considered in normal cycles.
3.8.2. For Class 2 Nodes
For class 2 nodes, the power consumption due to successful transmissions (), transmissions with collision (), and the consumption by overhearing () is calculated in the same way, but the stationary probability distribution corresponding to class 2 nodes is used in the calculations (). In addition, the multiplication by the factor should be considered, which is the stationary probability distribution that there are no active class 1 nodes in a cycle (a fraction of cycles in which class 1 nodes are inactive).
When the frame is successfully transmitted,
consumption for class 2 nodes is determined by the expression (
30).
When a failed transmission occurs, the consumption
, for class 2 nodes is given by the expression (
31).
The consumption per
overhearing (
) for class 2 nodes is obtained with the expressions of (
32).
The RN goes to sleep mode when it is inactive, . Note that in only the energy consumed in addition to and is considered in normal cycles.
3.9. Average Total Energy Consumption
To calculate the average total energy, the energy consumption contributions from the previously considered periods are added and determined by the equation
33.
In the previous expression,
is determined in accordance with subsection 3.1.
consumption is calculated as shown in subsection 3.2. To determine the last term of
33, which refers to consumption during the sleep period (
), the following expression is used (
34):
Remember that in the
sleep period, a node can go to a
sleep to save energy, but it may also not sleep and stay awake or wake up to receive SYNC packages and maintain synchronization with its neighboring nodes. Note that
is the variable that determines the fraction of cycles in which the node will sleep or remain awake. Finally, the sum of energy expenditure due to the activities mentioned in that period is what reflects the expression (
34).
Figure 1.
Heterogeneous WSN with two classes of nodes. class 1 (C1) nodes have channel access priority over Class 2 nodes (C2). A reference node (RN) is defined for each class.
Figure 1.
Heterogeneous WSN with two classes of nodes. class 1 (C1) nodes have channel access priority over Class 2 nodes (C2). A reference node (RN) is defined for each class.
Figure 2.
Transmission process in a transmission cycle for a heterogeneous WSN with two classes of nodes.
Figure 2.
Transmission process in a transmission cycle for a heterogeneous WSN with two classes of nodes.
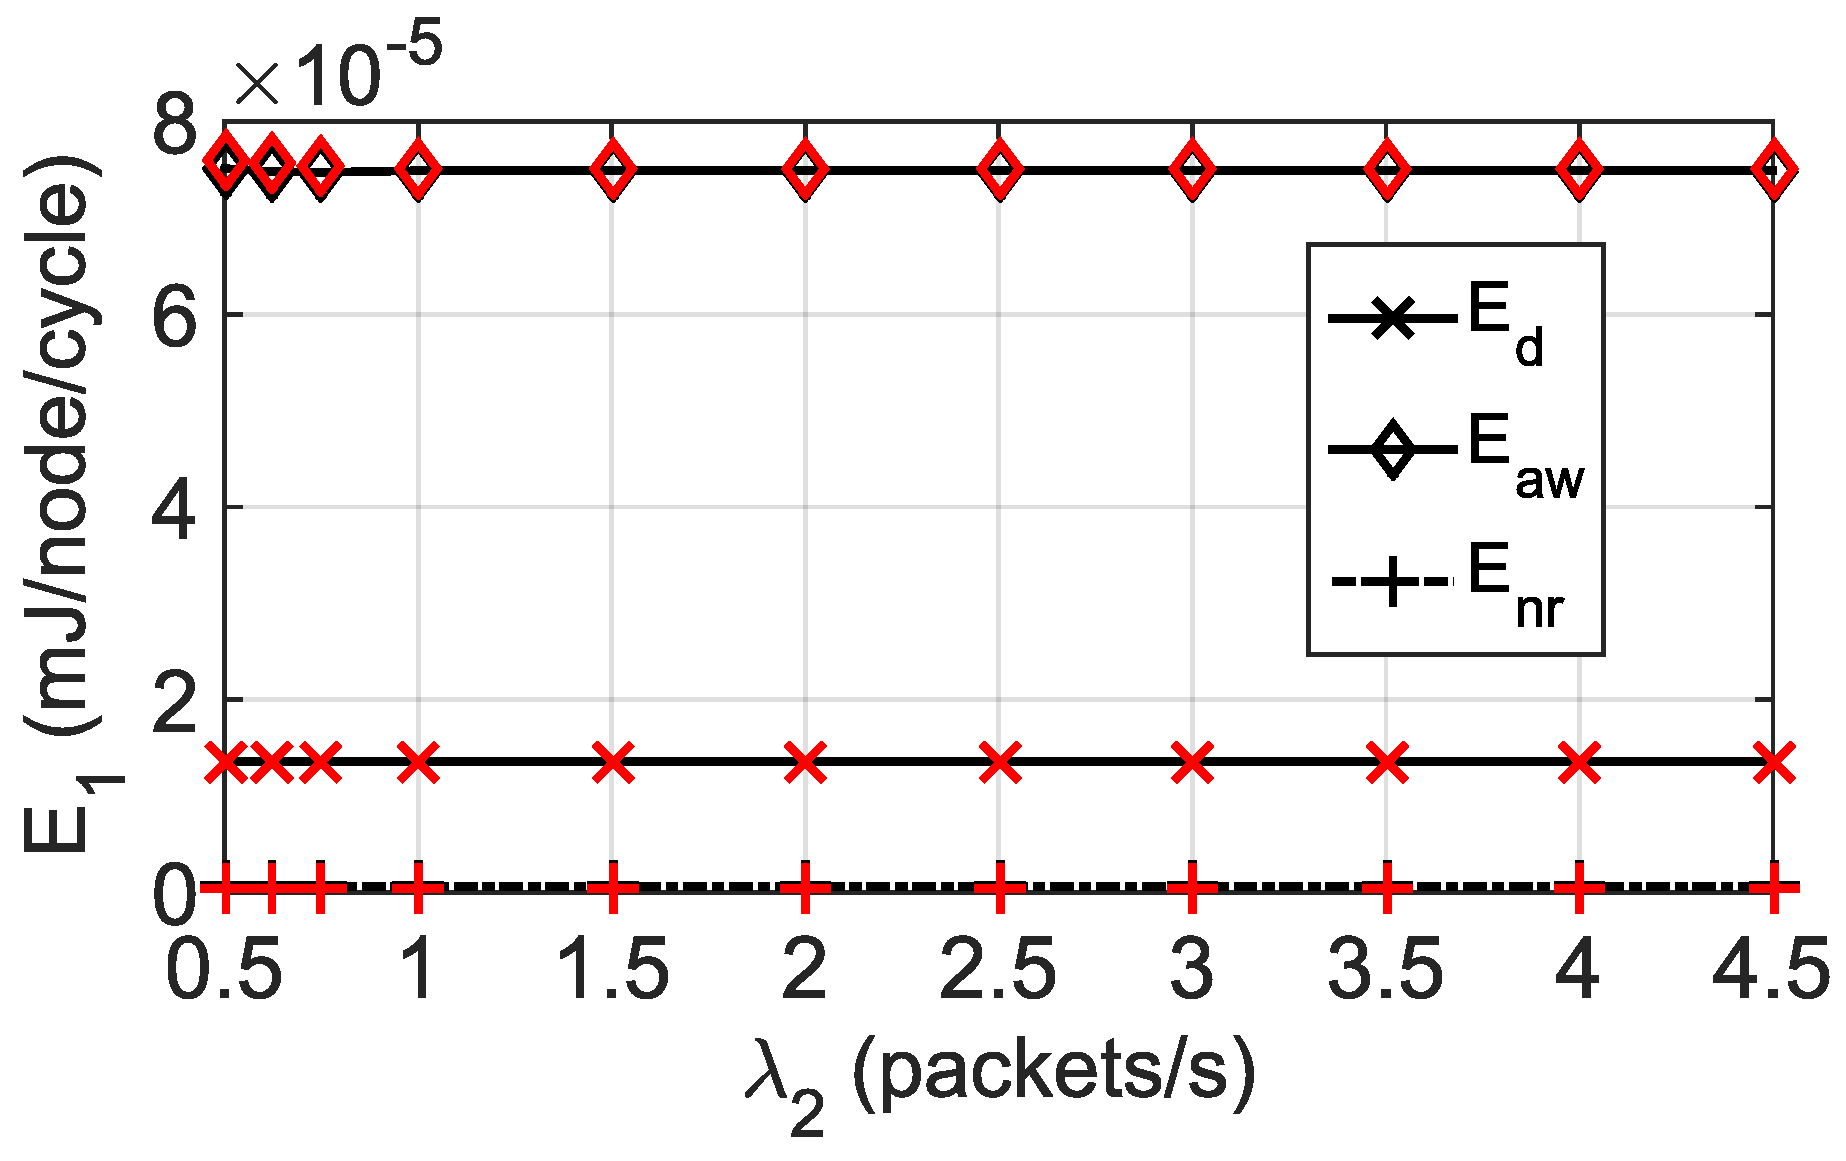
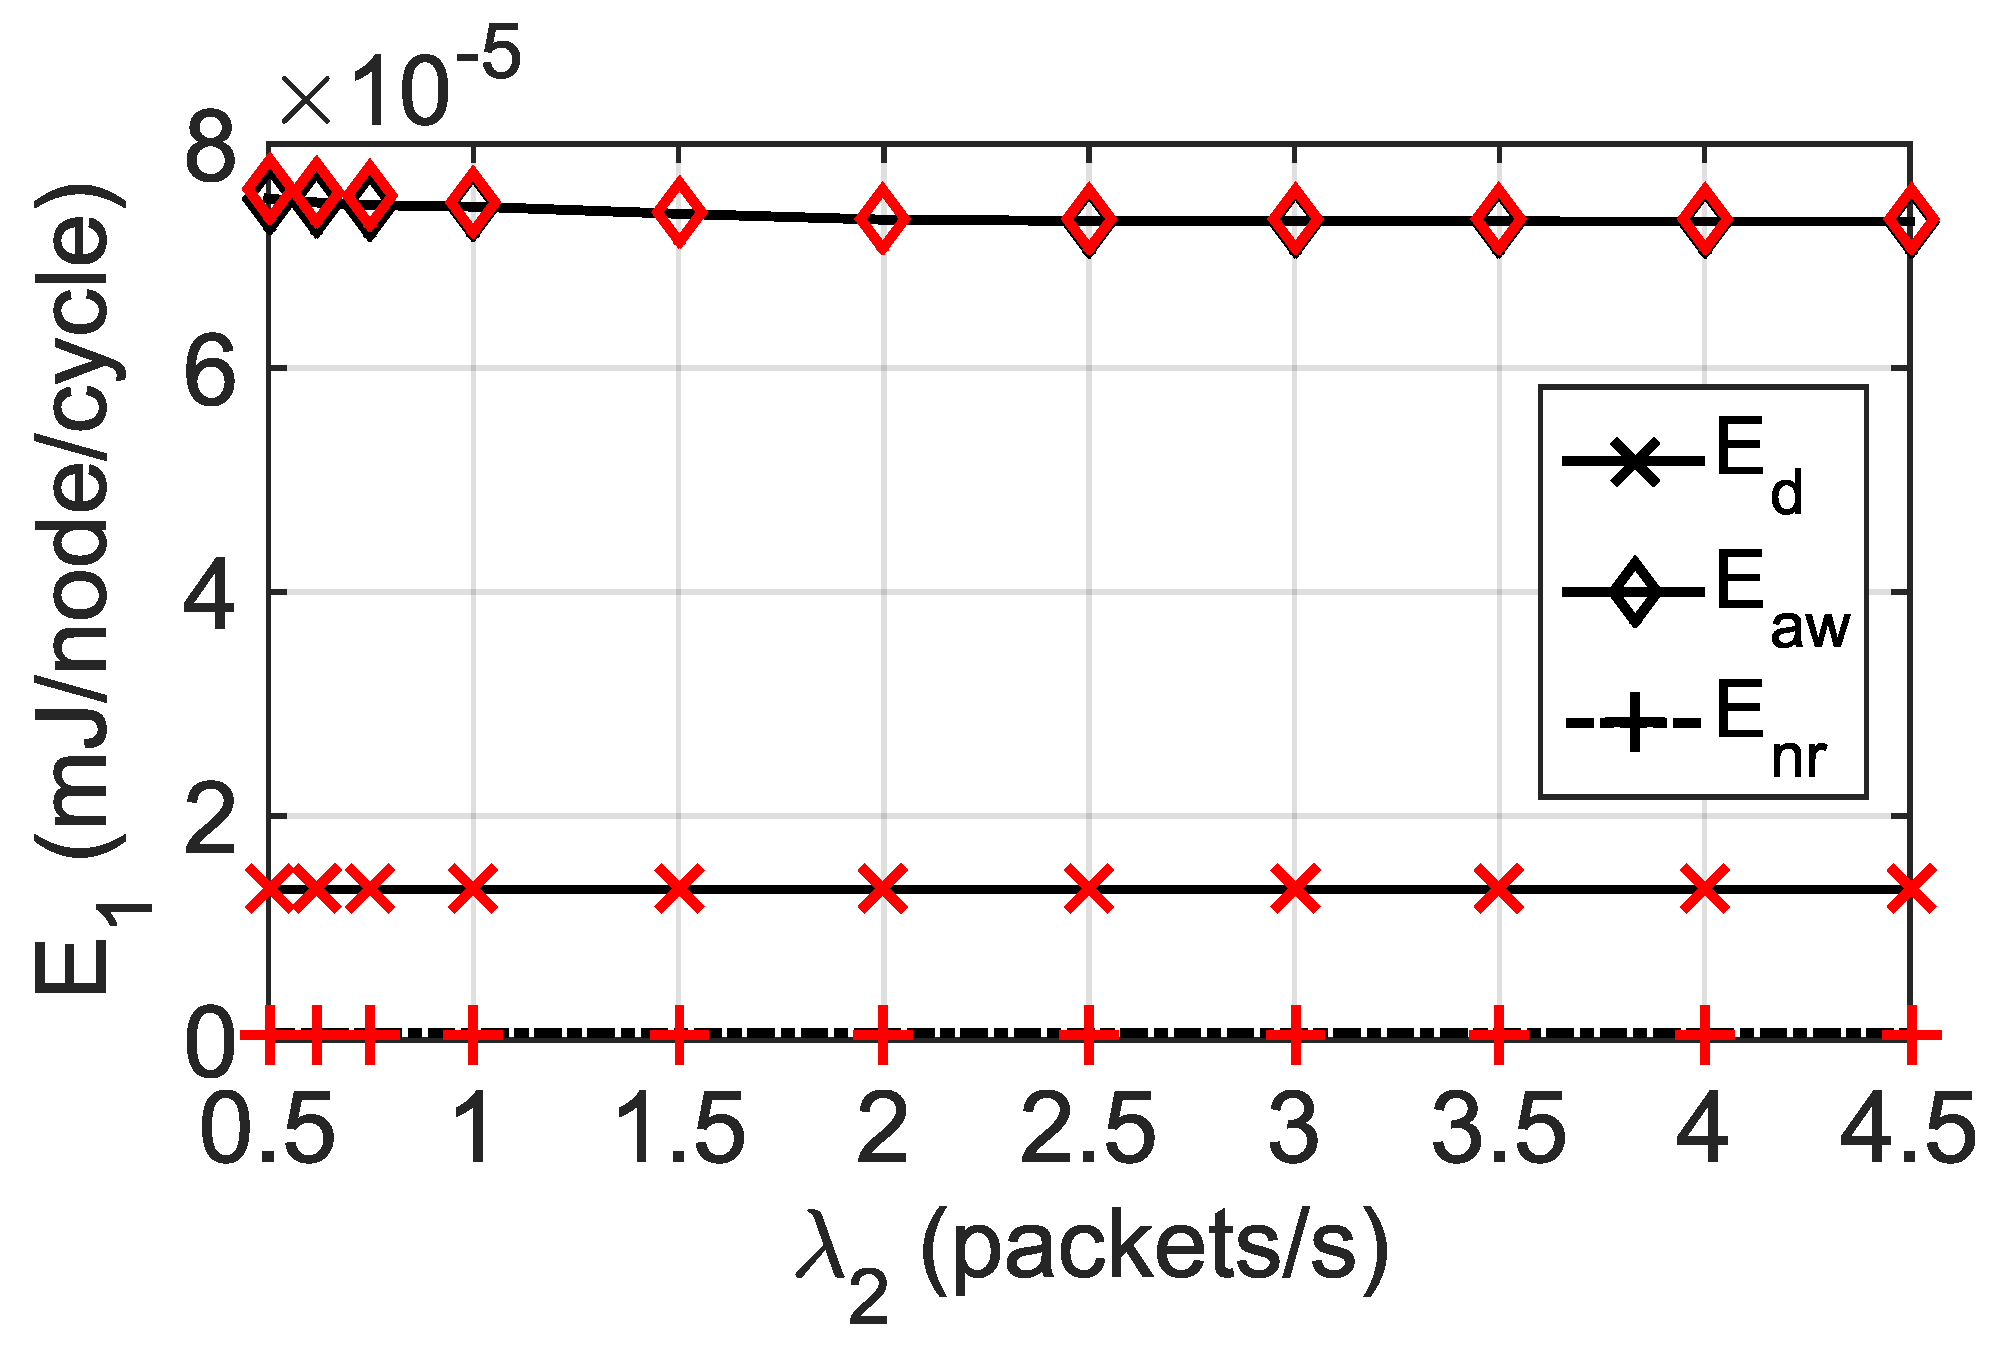
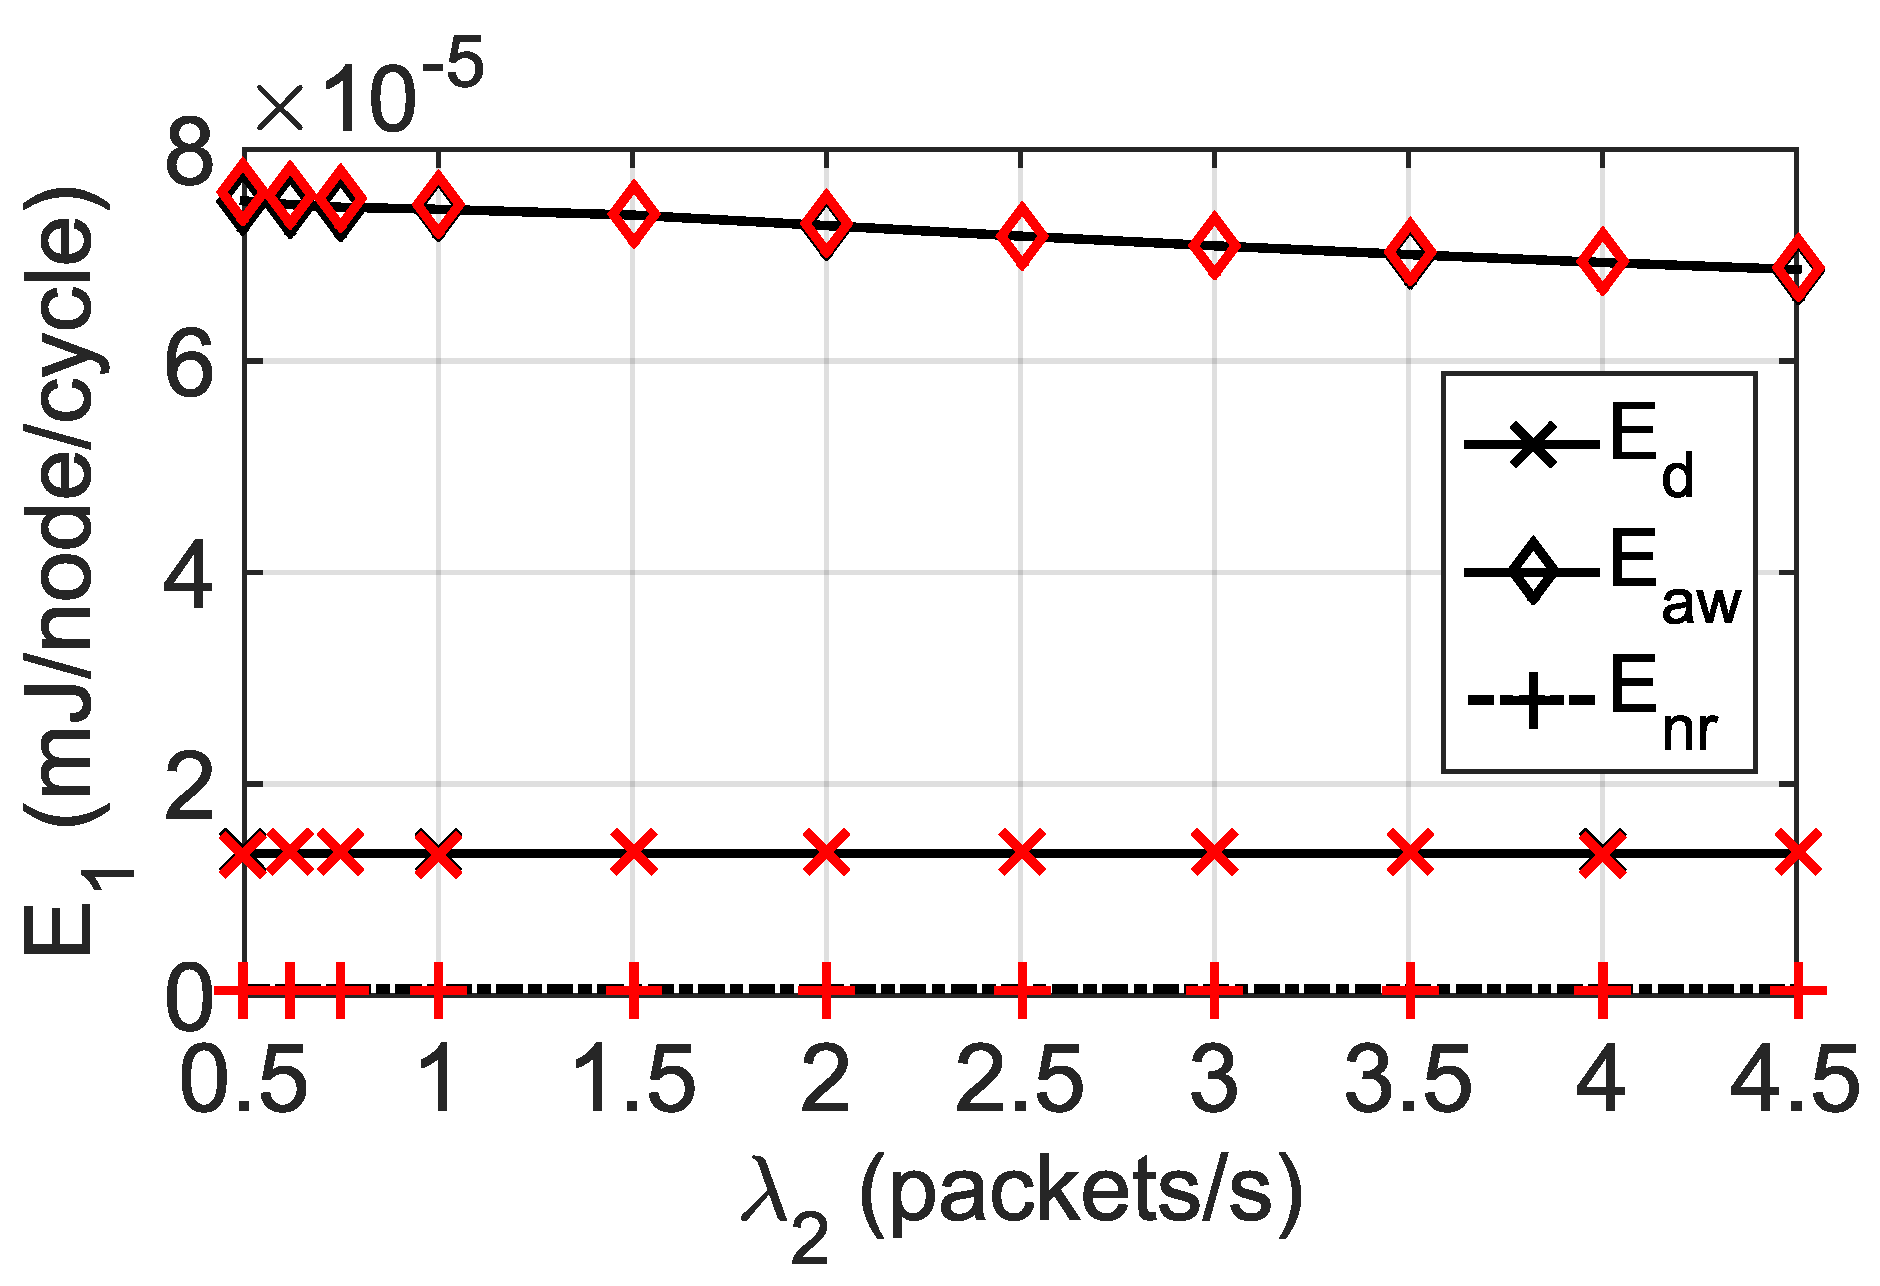
Figure 3.
Components of energy consumption for class 1, during the data period, and the awake and normal cycles. Transmission mode: SPT (both classes) and .
Figure 3.
Components of energy consumption for class 1, during the data period, and the awake and normal cycles. Transmission mode: SPT (both classes) and .
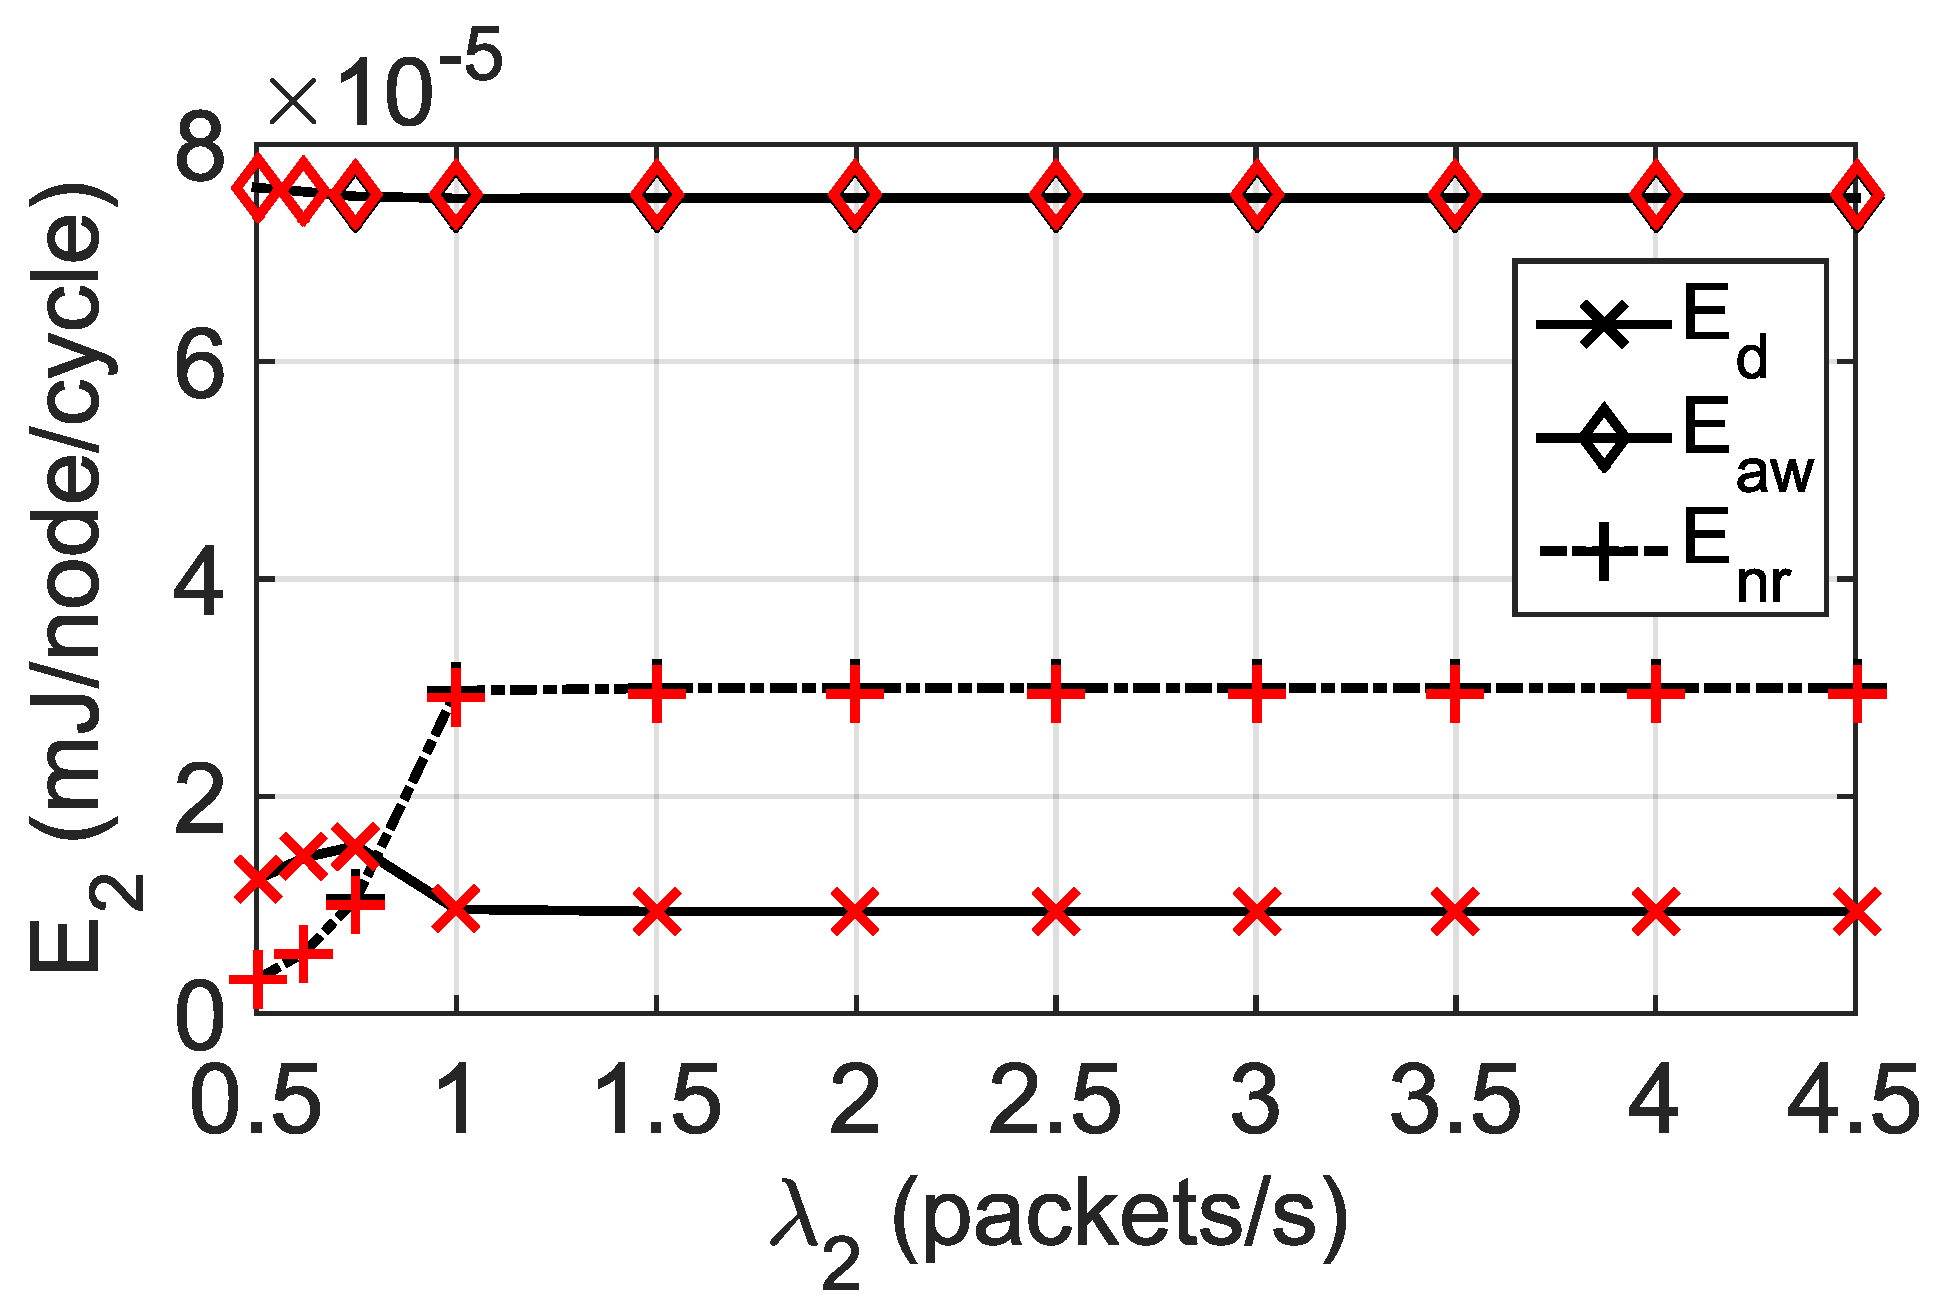
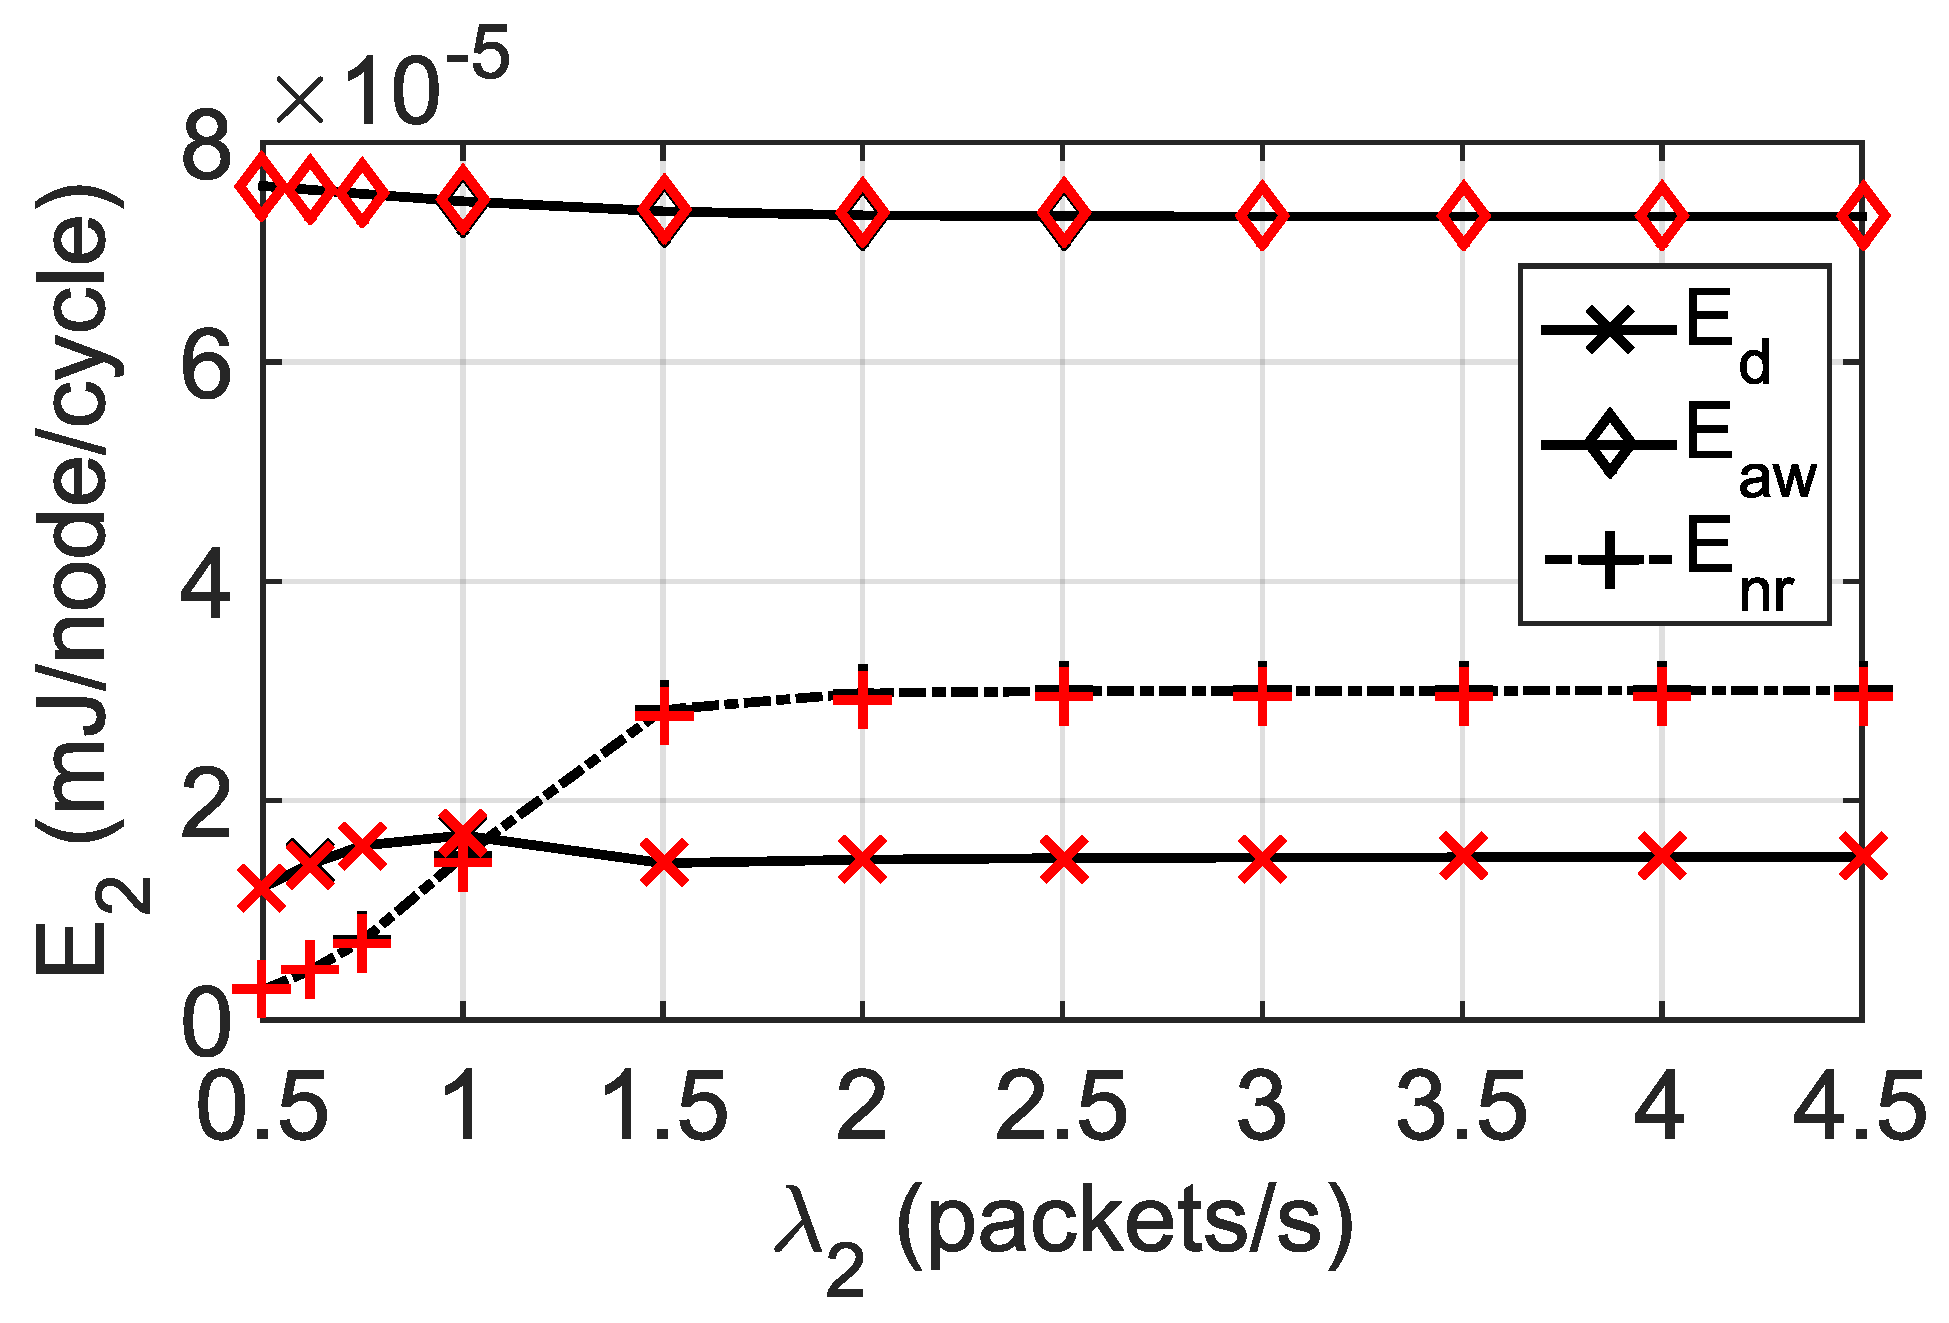
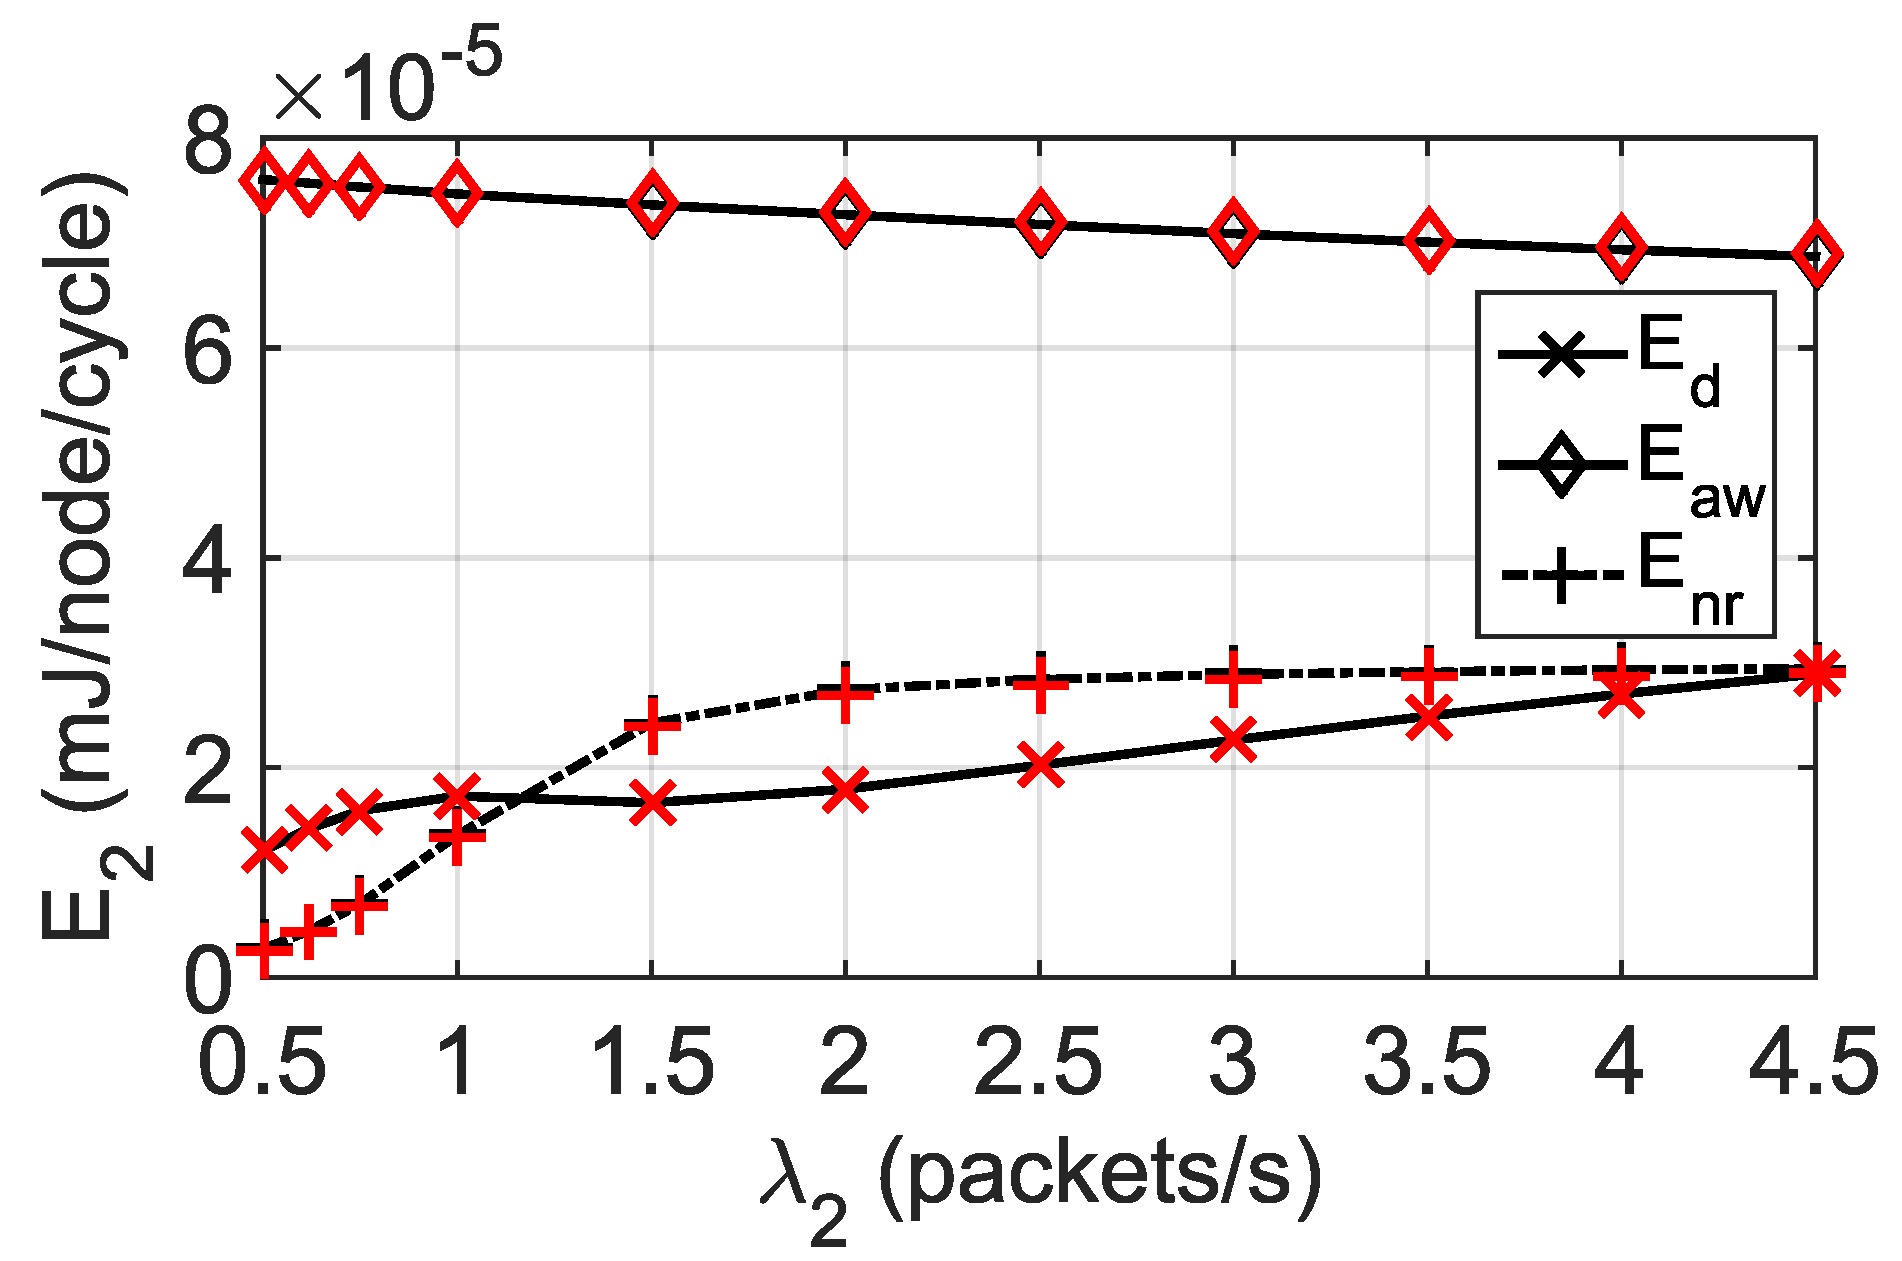
Figure 4.
Components of energy consumption for class 2, during the data period, and the awake and normal cycles. Transmission mode: SPT (both classes) and .
Figure 4.
Components of energy consumption for class 2, during the data period, and the awake and normal cycles. Transmission mode: SPT (both classes) and .
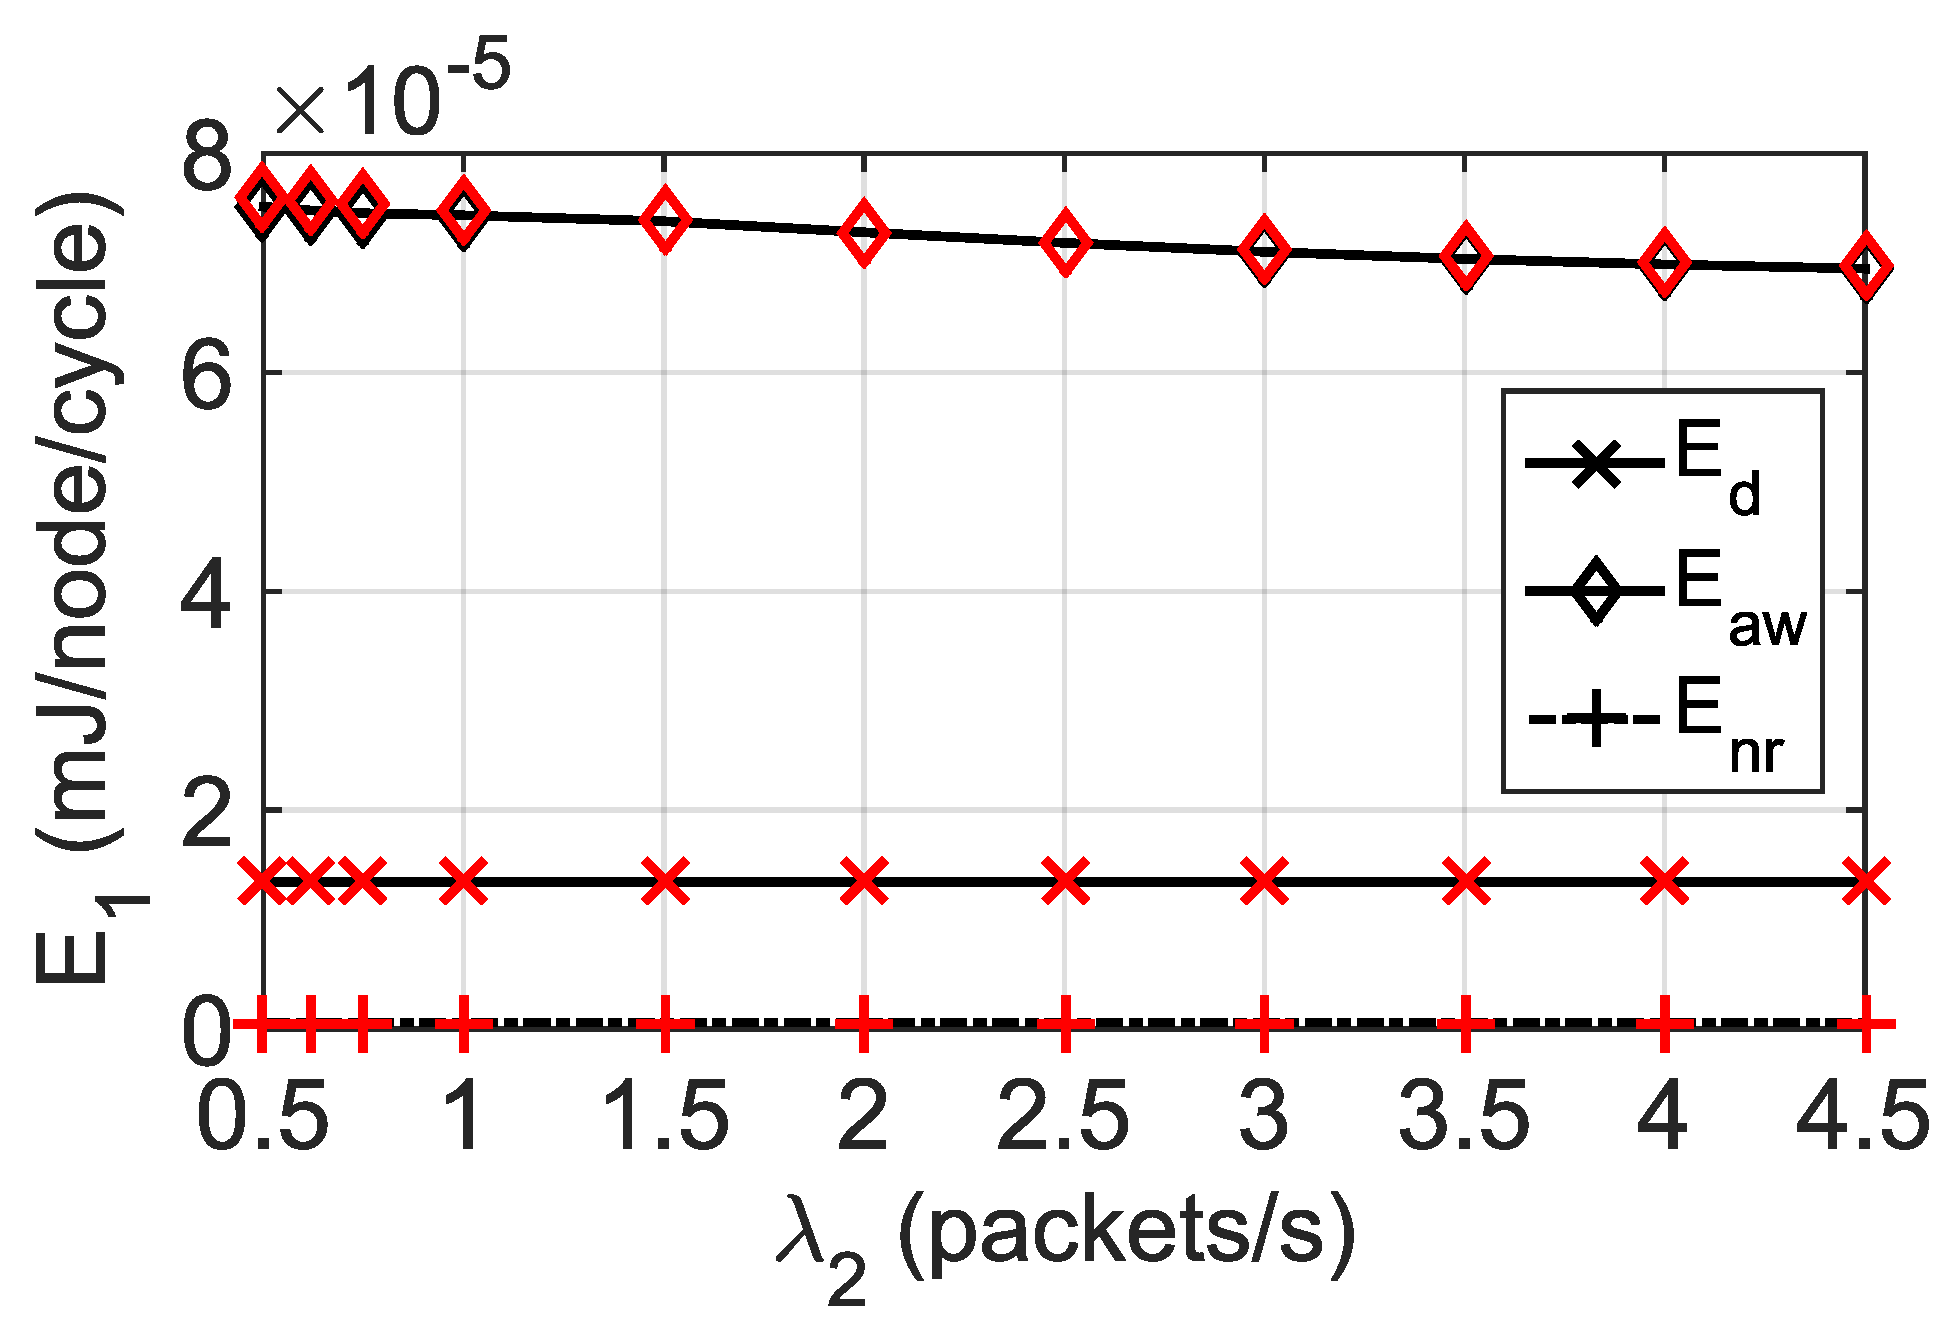
Figure 5.
Components of energy consumption for class 1, during the data period, and the awake and normal cycles. APT transmission mode () and
Figure 5.
Components of energy consumption for class 1, during the data period, and the awake and normal cycles. APT transmission mode () and
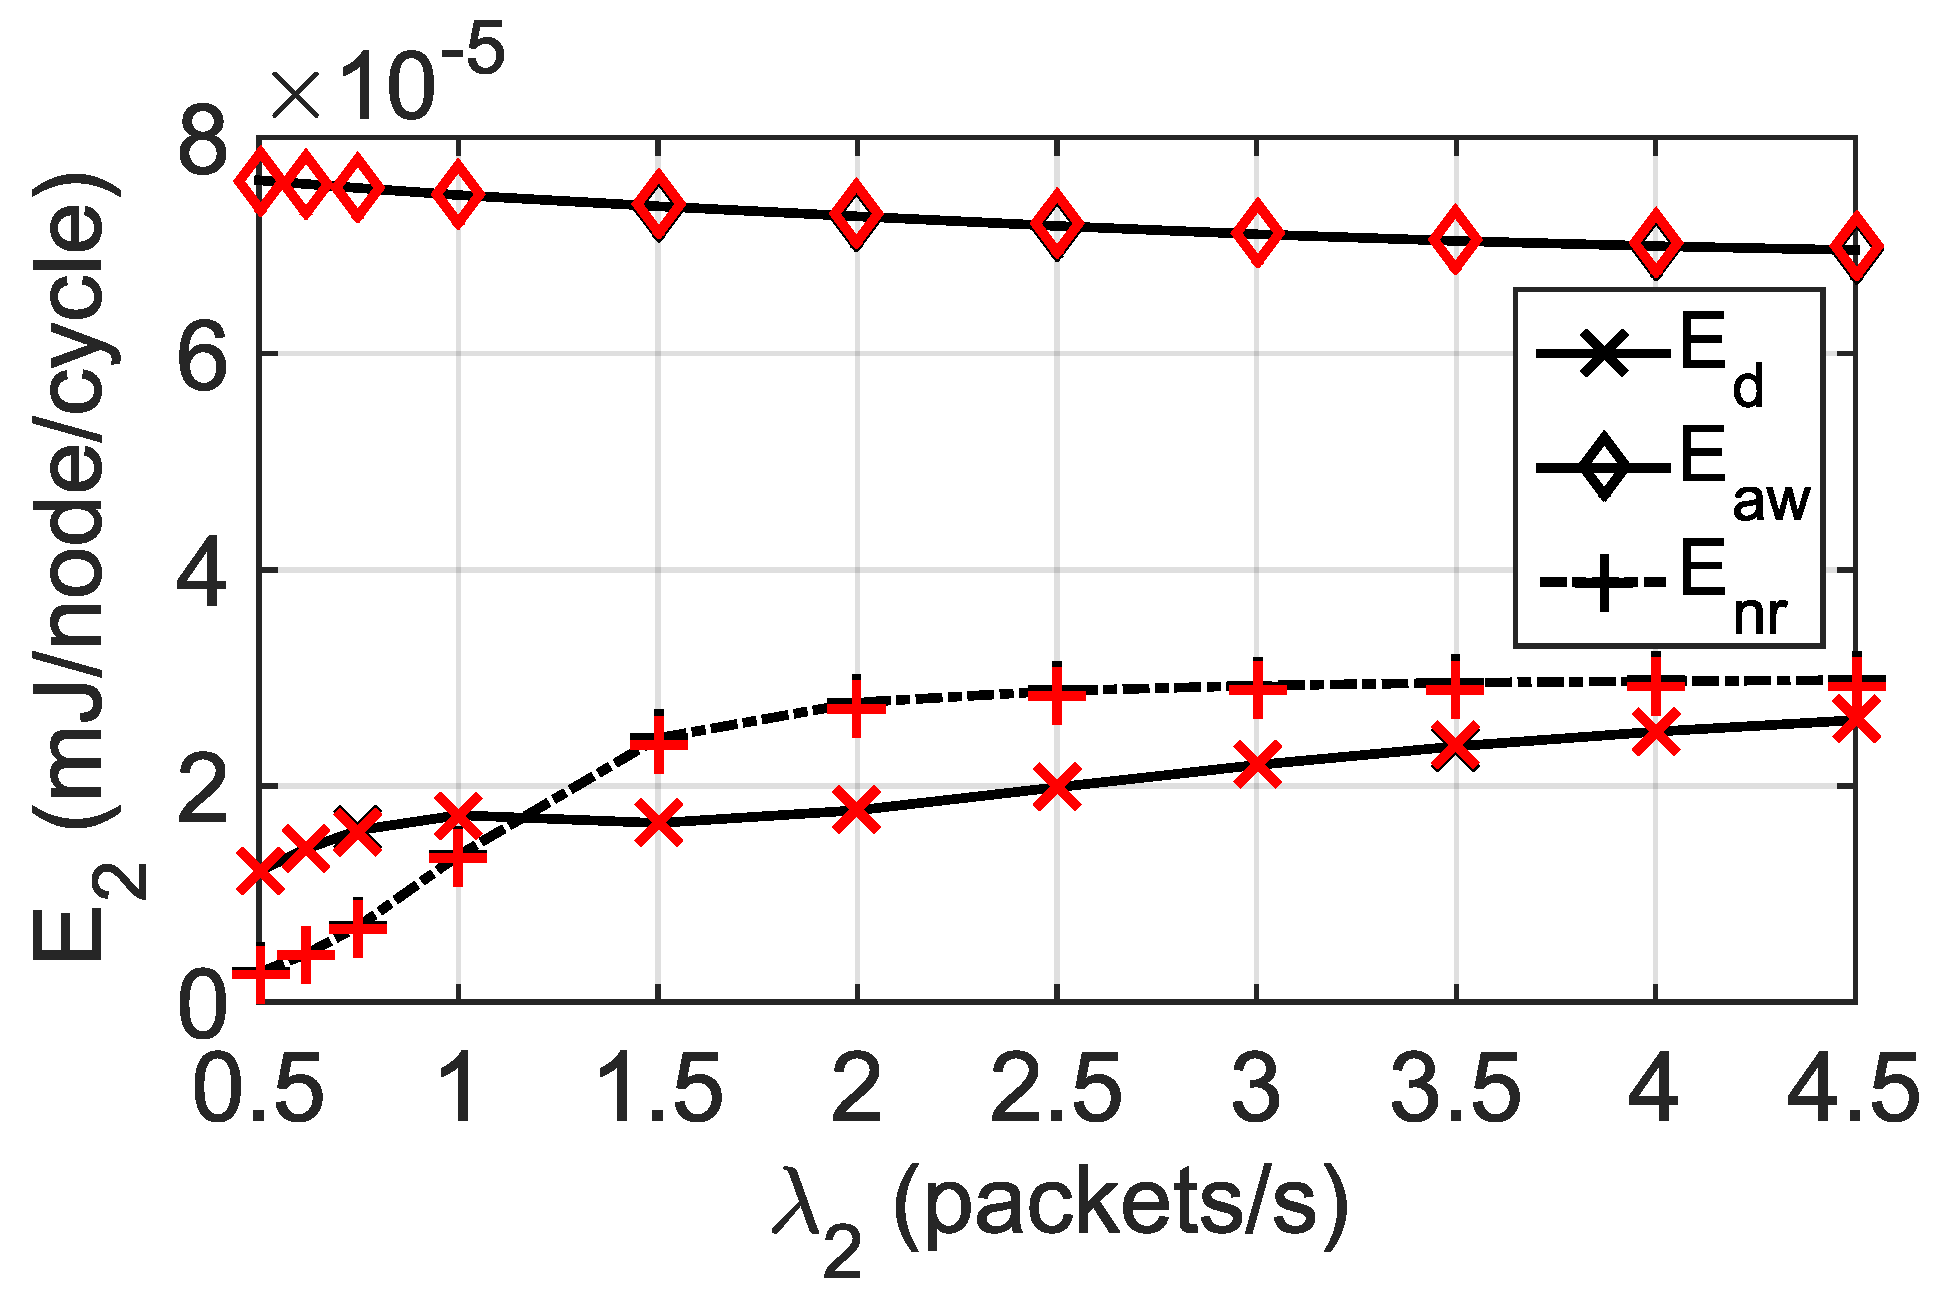
Figure 6.
Components of energy consumption for class 2, during the data period, and the awake and normal cycles. APT transmission mode () and .
Figure 6.
Components of energy consumption for class 2, during the data period, and the awake and normal cycles. APT transmission mode () and .
Figure 7.
Components of energy consumption for class 1, during the data period, and the awake and normal cycles. APT transmission mode () and .
Figure 7.
Components of energy consumption for class 1, during the data period, and the awake and normal cycles. APT transmission mode () and .
Figure 8.
Components of energy consumption for class 2, during the data period, and the awake and normal cycles. APT transmission mode () and .
Figure 8.
Components of energy consumption for class 2, during the data period, and the awake and normal cycles. APT transmission mode () and .
Figure 9.
Components of energy consumption for class 1, during the data period, and the awake and normal cycles. APT transmission mode () and .
Figure 9.
Components of energy consumption for class 1, during the data period, and the awake and normal cycles. APT transmission mode () and .
Figure 10.
Components of energy consumption, for class 2, during the data period, and the awake and normal cycles. APT transmission mode () and .
Figure 10.
Components of energy consumption, for class 2, during the data period, and the awake and normal cycles. APT transmission mode () and .
Table 1.
Parameter configuration [
24].
Table 1.
Parameter configuration [
24].
| Cycle time (T) |
60 ms |
Propagation delay () |
0.1 s |
|
, , and
|
0.18 ms |
Slot time () |
0.1 ms |
|
1.716 ms |
Contention window (W) |
128 slots |
| DATA packet size (S) |
50 bytes |
Queue size (Q) |
10 packets |
| SYNC packet Tx period () |
20 cycles |
Awake period () |
80 supercycles |
| Transmission power () |
52 mW |
Reception power () |
59 mW |
| Sleep power consumption () |
|
| Maximum frame size |
packtes |
| Nodes number |
Packets arrival rate (packets/s) |
|
,
|
,
|
