1. Introduction
A healthy aging society is the dream of any sensible human being. This research aims at providing an insight to what could be the important factors in achieving this aim. Our study focused on the National Poll on Healthy Aging(NPHA) dataset which was created to gather insights on the health, healthcare, and health policy issues affecting Americans aged 50 and older. By focusing on the perspectives of older adults and their caregivers, the University of Michigan aimed to inform the public, healthcare providers, policymakers, and advocates about the various aspects of aging. This includes topics like health insurance, household composition, sleep issues, dental care, prescription medications, and caregiving, thereby providing a comprehensive understanding of the health-related needs and concerns of the older population. The target variable in the study was Number_of_Doctors_Visited. In this work we aim to apply clustering algorithms and optimize them by applying genetic algorithms to find the most relevant set of features for most accurate prediction. To this end, we frame some questions and by obtaining responses to the subsequent research questions, this paper aims to develop future clustering models that exhibit superior accuracy and efficiency. Moreover, these research questions offer corroborating evidence for the results of our empirical investigation.
RQ1: What is the efficacy of a genetic algorithm in the process of feature selection for enhancing clustering performance?
RQ2: Which clustering algorithm is most effective when applied to the selected NPHA dataset?
RQ3: Does the iterative process of selection, crossover, and mutation in a genetic algorithm have the potential to enhance clustering performance across numerous generations?
The major contributions in this study are outlined below:
The impact of the feature selection technique (FST) on the NPHA dataset is comprehensively evaluated.
By simulating the principles of natural evolution, the genetic algorithm utilized in this study optimizes feature selection for clustering. As a result, the clustering performance is improved by identifying the most relevant subset of features from the dataset.
To improve clustering with an increased performance metric, models that integrate the Genetic Algorithm and Clustering Algorithms are proposed.
In order to empirically verify the findings, GA was combined with a number of clustering algorithms, including KMeans++, DBSCAN, BIRCH, and Agglomerative.
The abstract view of our proposed methodology is presented in
Figure 1.
Machine learning techniques have played an important role in healthcare applications, and several researchers have pursued this area [1–5], proposing the detection of Covid 19 disease through Chest x ray images, or for image based disease prediction and diabetes retinopathy detection. In [6] Jha et al propose another machine learning approach as a step towards better health for society. Machine learning classifiers have also been applied by other researchers in solving health care problems [7,8]. Similarly, we see several researchers experimenting with the clustering algorithms [10–14], applying it on distributed systems [15], or optimizing it [16]. Variants such as KMeans++ have also been active areas of research [17]. Clustering for mixed types of data [18], techniques for clustering algorithm selction [19], feature selection techniques [20,21], application of KMeans algorithm for customer segmentation [22], and improvisations using genetic algorithms or other techniques [23–30] are some other examples of continued interest of the research community towards this topic.
The organization of rest of the paper is as follows: section 2 presents the methods used in the study, while sections 3 and 4 present the experimentation part and the analysis of experimental results. The Discussion and Conclusion are given in section 5 and 6 respectively.
2. Materials and Methods
2.1 Selecting features using Genetic Algorithm
Feature selection is a procedure in machine learning and data mining that involves choosing a smaller collection of pertinent features or variables from a larger set of features in a dataset.
The objective of feature selection is to enhance the performance of machine learning models by decreasing the number of features, thereby mitigating over fitting, reducing computing complexity, and enhancing model interpretability. Feature selection encompasses several strategies, such as filter methods, wrapper methods, and embedding methods. Filter methods are used to choose features based on their statistical characteristics, such as their correlation with the target variable or their information gain. Wrapper approaches employ a dedicated machine learning algorithm to assess the significance of features by training and assessing the model using various subsets of features. Embedded approaches integrate feature selection into the model training process by utilizing regularization techniques such as Lasso and Ridge regression. Genetic algorithms are a form of optimization method that can be employed to pick features. Genetic algorithms involve the evolution of a population of potential feature subsets across numerous generations by genetic operations such as selection, crossover, and mutation. The fitness of each subset of features is assessed using a fitness function, which usually quantifies the performance of the model when using that subset of features. Genetic algorithms can systematically seek for an ideal subset of attributes that maximizes the performance of a model by iteratively evolving the population.
2.2. Genetic Algorithm
A Genetic Algorithm (GA) is an optimization technique that draws inspiration from the natural selection process. It is utilized to determine the most ideal solutions for situations that need identifying the finest combination of factors or attributes. The algorithm employs the principle of natural selection to iteratively generate increasingly optimal approximations to a solution. Each generation of the Genetic algorithm produces a fresh set of approximations. The technique involves selecting individuals based on their level of fitness in the problem domain and applying operators derived from natural genetics. This strategy leads to the development of a population of individuals that are more well-suited to the environment than the individual from which they originated. It bears resemblance to the process of natural adaptation.
The genetic algorithm is a naturally occurring heuristic algorithm. It is utilized to ascertain the precise and suitable resolution.
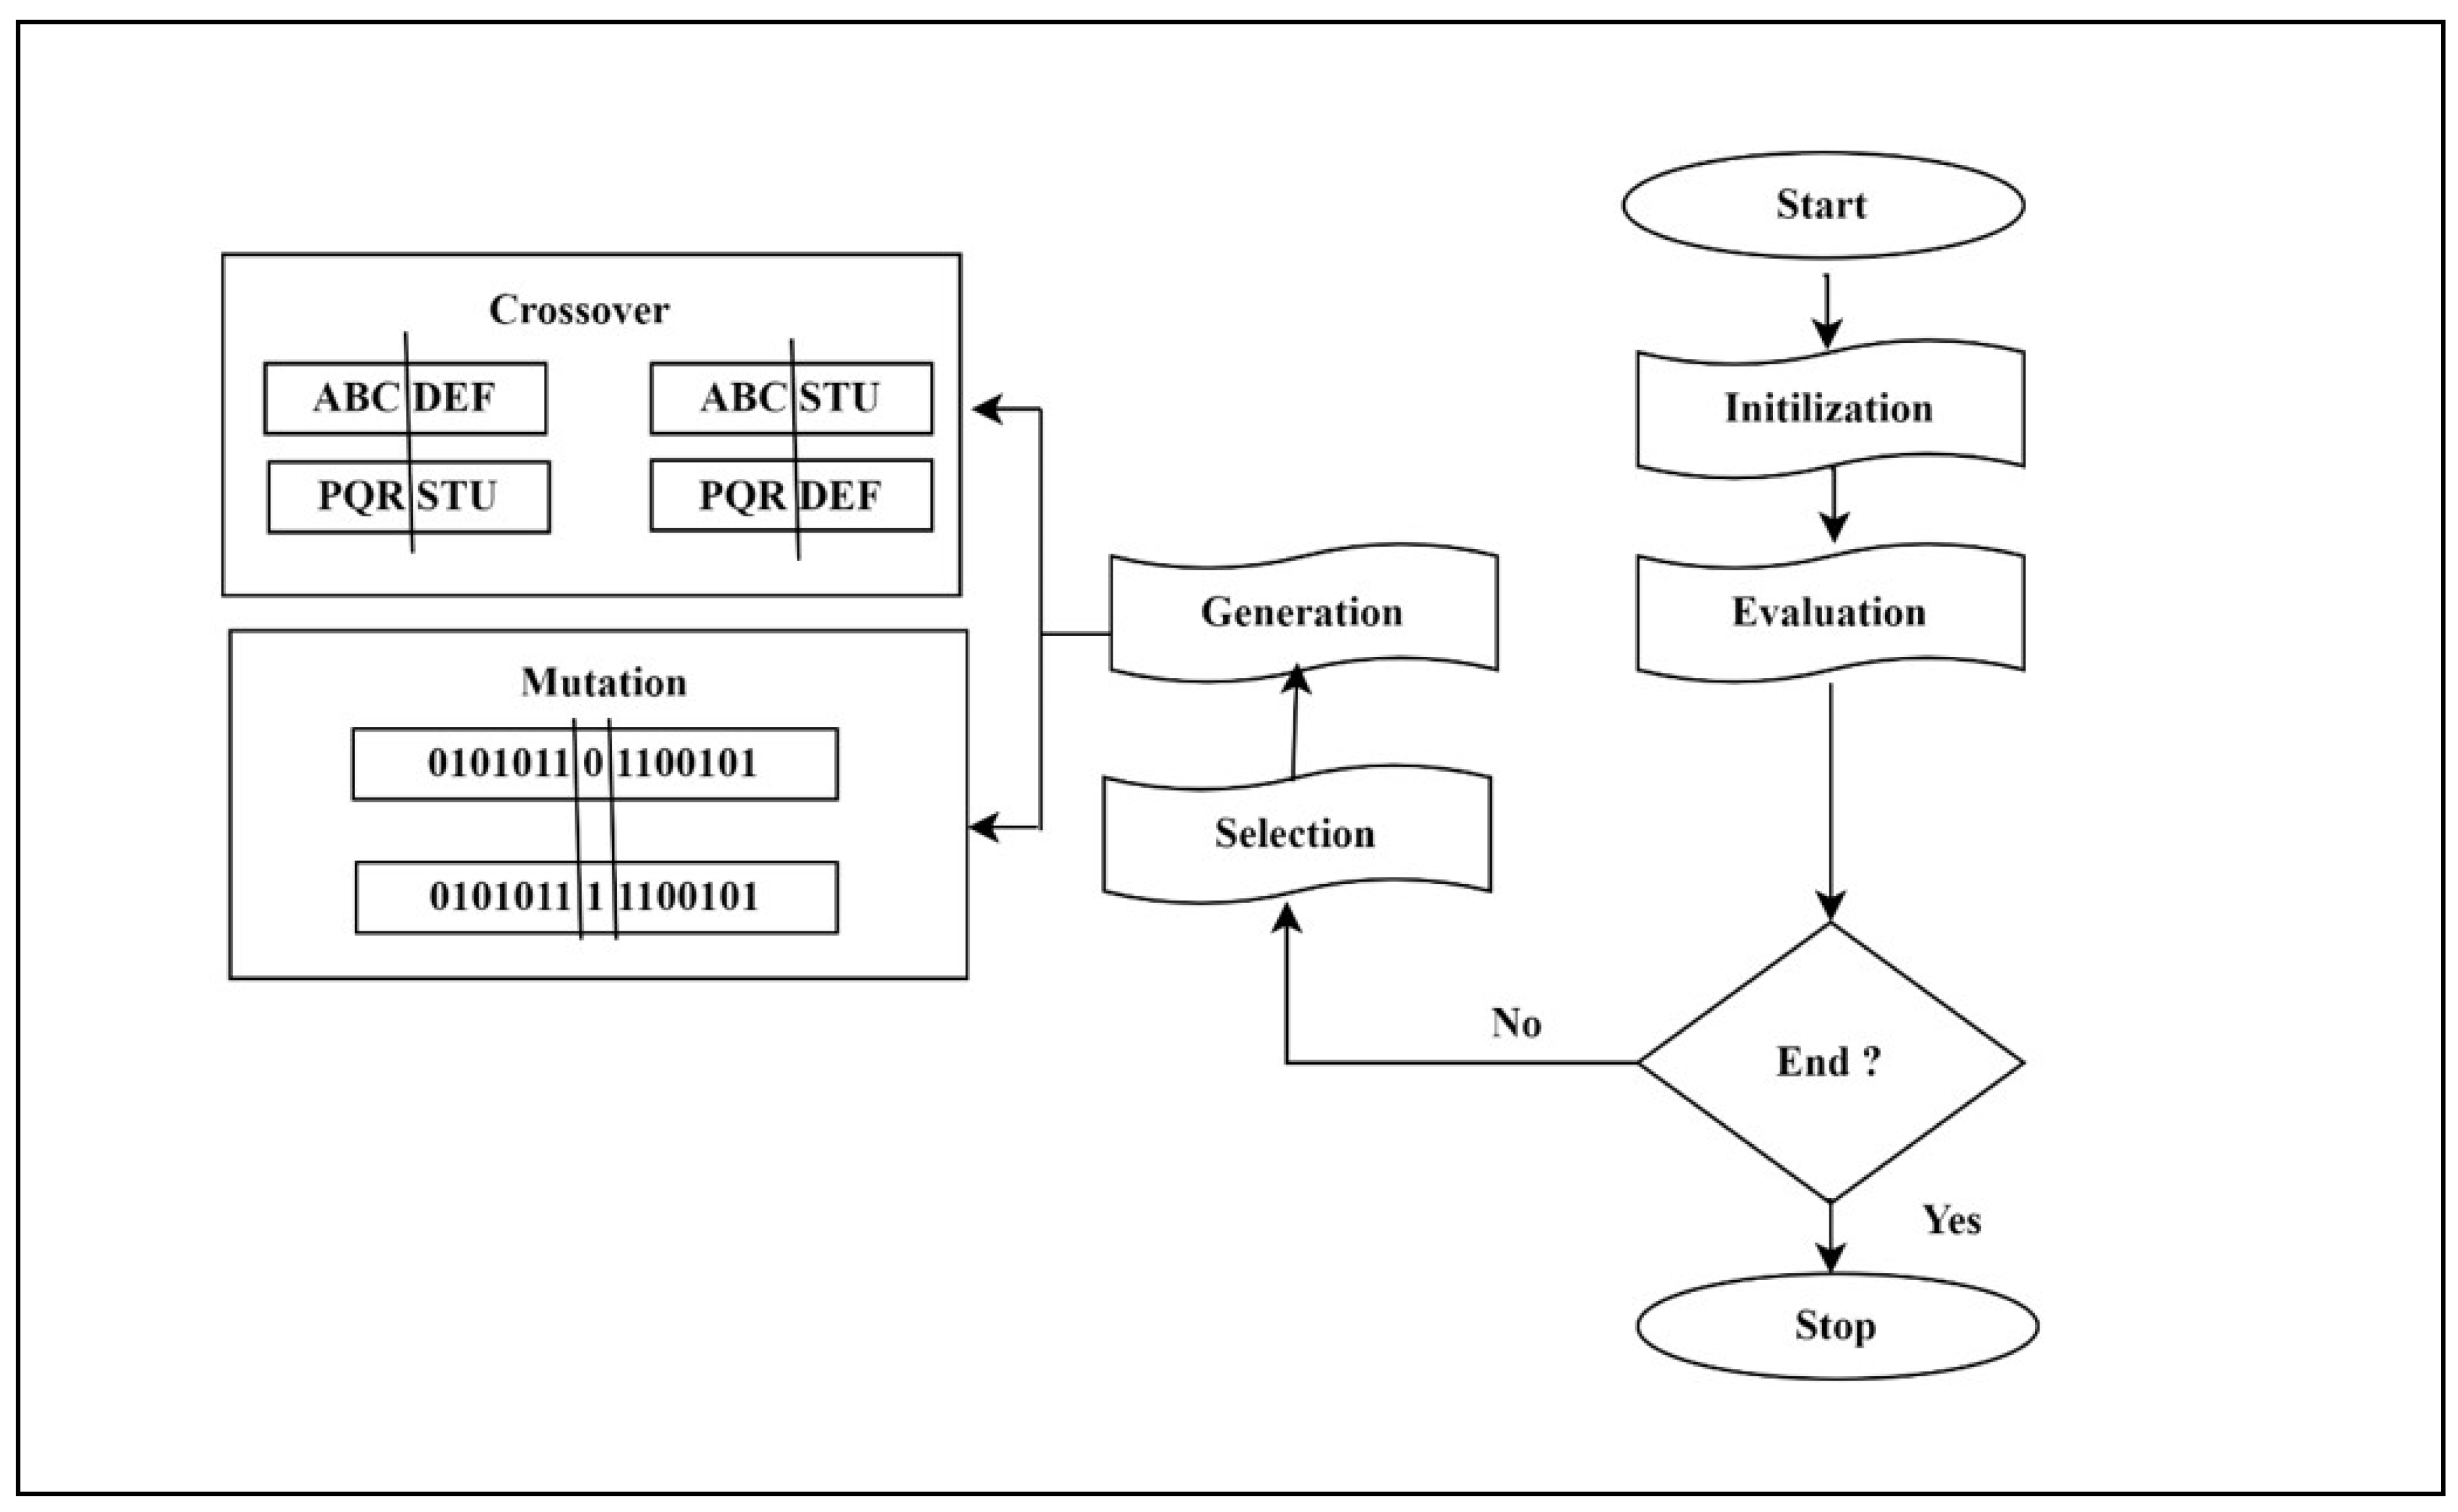
Initialization: The method commences by generating an initial population of potential solutions (individuals) to the problem. Each person is depicted as a sequence of values, which may be binary, integer, or real, depending on the specific issue.
Selection: The algorithm chooses people from the population based on their fitness, which is a metric of how effectively an individual solves the task. Individuals possessing greater levels of physical prowess are more inclined to be chosen for the subsequent generation.
Crossover: The chosen people are placed together, and a crossover operation is performed to generate new progeny. The crossover procedure involves selecting a random point in the string representation of the people, and exchanging the values beyond that point between the parents to generate two new children.
Mutation: Following the crossover process, a mutation operation is implemented to induce minor random alterations in the offspring's strings. This facilitates the introduction of novel genetic material into the population and hinders the algorithm from rapidly converging towards a suboptimal answer.
Replacement: The act of replacing individuals in the present population with offspring, according to a predetermined replacement plan. This guarantees that the population size remains consistent across successive generations.
Termination: The algorithm persists in executing the selection, crossover, mutation, and replacement phases until a specified termination condition is satisfied. This condition may consist of a maximum number of generations, a suitable fitness level, or a predefined time restriction. The fundamental operational premise of a genetic algorithm encompasses the subsequent stages is shown in
Figure 2.
Genetic algorithms are commonly employed in optimization situations where conventional approaches may be unfeasible or inefficient, particularly in intricate optimization terrains with numerous local optima.
2.3. Clustering /Cluster Analysis
Cluster analysis, often known as clustering, is a machine learning technique that involves grouping data points with similar characteristics into clusters. Clustering aims to divide a dataset into distinct groups, where the data points within each group, or cluster, exhibit greater similarity to one another compared to those in different groups. Clustering is an unsupervised learning method where the algorithm identifies patterns and structures in the data without receiving explicit instructions on grouping the data.
This study thoroughly examines the K-means ++, DBSCAN, Birch, and Agglomerative clustering methods and the effect of genetic optimization on them.
2.4. Clustering Algorithms
Clustering algorithms aim to partition a given dataset into distinct groups, or clusters, based on the degree of similarity between data elements within the same cluster and those in other clusters. The following is a concise overview of the clustering algorithms that were implemented in this study:
2.4.1 KMeans /KMeans ++
KMeans++ is a centroid-based clustering algorithm designed to partition a dataset into clusters, ensuring that each data point is assigned to the cluster with the closest centroid. K-means++ is a modified version of the K-means method that enhances the initial selection of cluster centroids. In the normal K-means algorithm, the initial centroids are often selected randomly from the dataset. However, this random selection can result in clustering outcomes that are not ideal. K-means++ resolves this problem by employing a more sophisticated initialization technique. The process begins by randomly selecting a single initial centroid from the available data points. Successive centroids are thereafter selected based on a probability that is directly proportionate to the squared distance from the nearest centroid that already exists. This guarantees that the initial centroids are evenly distributed and enhances the likelihood of discovering improved final centroids.
After the centroids are initialized, the next steps of the K-means algorithm follow the normal procedure. Data points are allocated to the centroid that is closest to them, and the centroids are updated by calculating the mean of the points in each cluster. This process continues until the centroids reach stable positions and the cluster assignments remain mostly unchanged.
2.4.2. Density-Based Spatial Clustering of Applications with Noise (DBSCAN)
Density-Based Spatial Clustering of Applications with Noise (DBSCAN) is a clustering algorithm that groups data points together based on their density in the feature space. Density-based clustering algorithms, in contrast to centroid-based clustering algorithms such as K-means/Kmeans++, form clusters based on areas of high density that are separated by areas of low density. The DBSCAN algorithm initiates by randomly selecting a data point from the dataset. A point is defined as a core point if it has a minimum number of other points (MinPts) within a specified radius (ε). Points that fall within the ε-radius of a core point, including the core point itself, are said to be density-reachable from that core point.
The process proceeds by iteratively include all points that can be reached from the core point and have sufficient density, thus expanding the cluster. This process continues until the cluster can no longer accommodate any additional points. Border points are classified as points that are not core points themselves but are located inside the ε-radius of a core point. These points are included in the cluster; however, they are not classified as core points. Points that do not fall into the category of core points or border points are categorized as noise points and do not belong to any cluster. DBSCAN is highly efficient at detecting clusters with diverse shapes and is resistant to interference caused by noise.
2.4.3. Balanced Iterative Reducing and Clustering utilizing Hierarchies
Balanced Iterative Reducing and Clustering utilizing Hierarchies (BIRCH) is a hierarchical clustering algorithm that constructs a cluster tree. Each node in the tree corresponds to a cluster of data points. The tree can be represented as a dendrogram, with the root being the cluster that includes all data points, and the leaves being the individual data points.
This algorithm initially condenses the data into a hierarchical structure known as the Clustering Feature Tree (CF Tree). This tree is constructed using a collection of clustering characteristics that condense the data points. The CF Tree is utilized to effectively partition the data points into subclusters in a hierarchical fashion.
2.4.4. Agglomerative
Agglomerative clustering is also a hierarchical clustering method that repeatedly combines the nearest pairs of clusters to create a hierarchy of clusters. The process begins by considering each data point as an individual cluster and then calculates the distance or similarity between every pair of clusters. The algorithm subsequently combines the two clusters that are closest to each other, forming a unified cluster, and adjusts the distance matrix accordingly to represent the updated clustering structure. This procedure is iterated until there is only one cluster left, or until a predetermined condition for stopping is satisfied. The outcome is a dendrogram, in which the terminal nodes symbolize the individual data points, while the internal nodes symbolize groups at various levels of the hierarchy. Agglomerative clustering is a method that does not necessitate the pre-specification of the number of clusters. It can identify clusters of different forms and sizes within the data.
3. WorkFlow
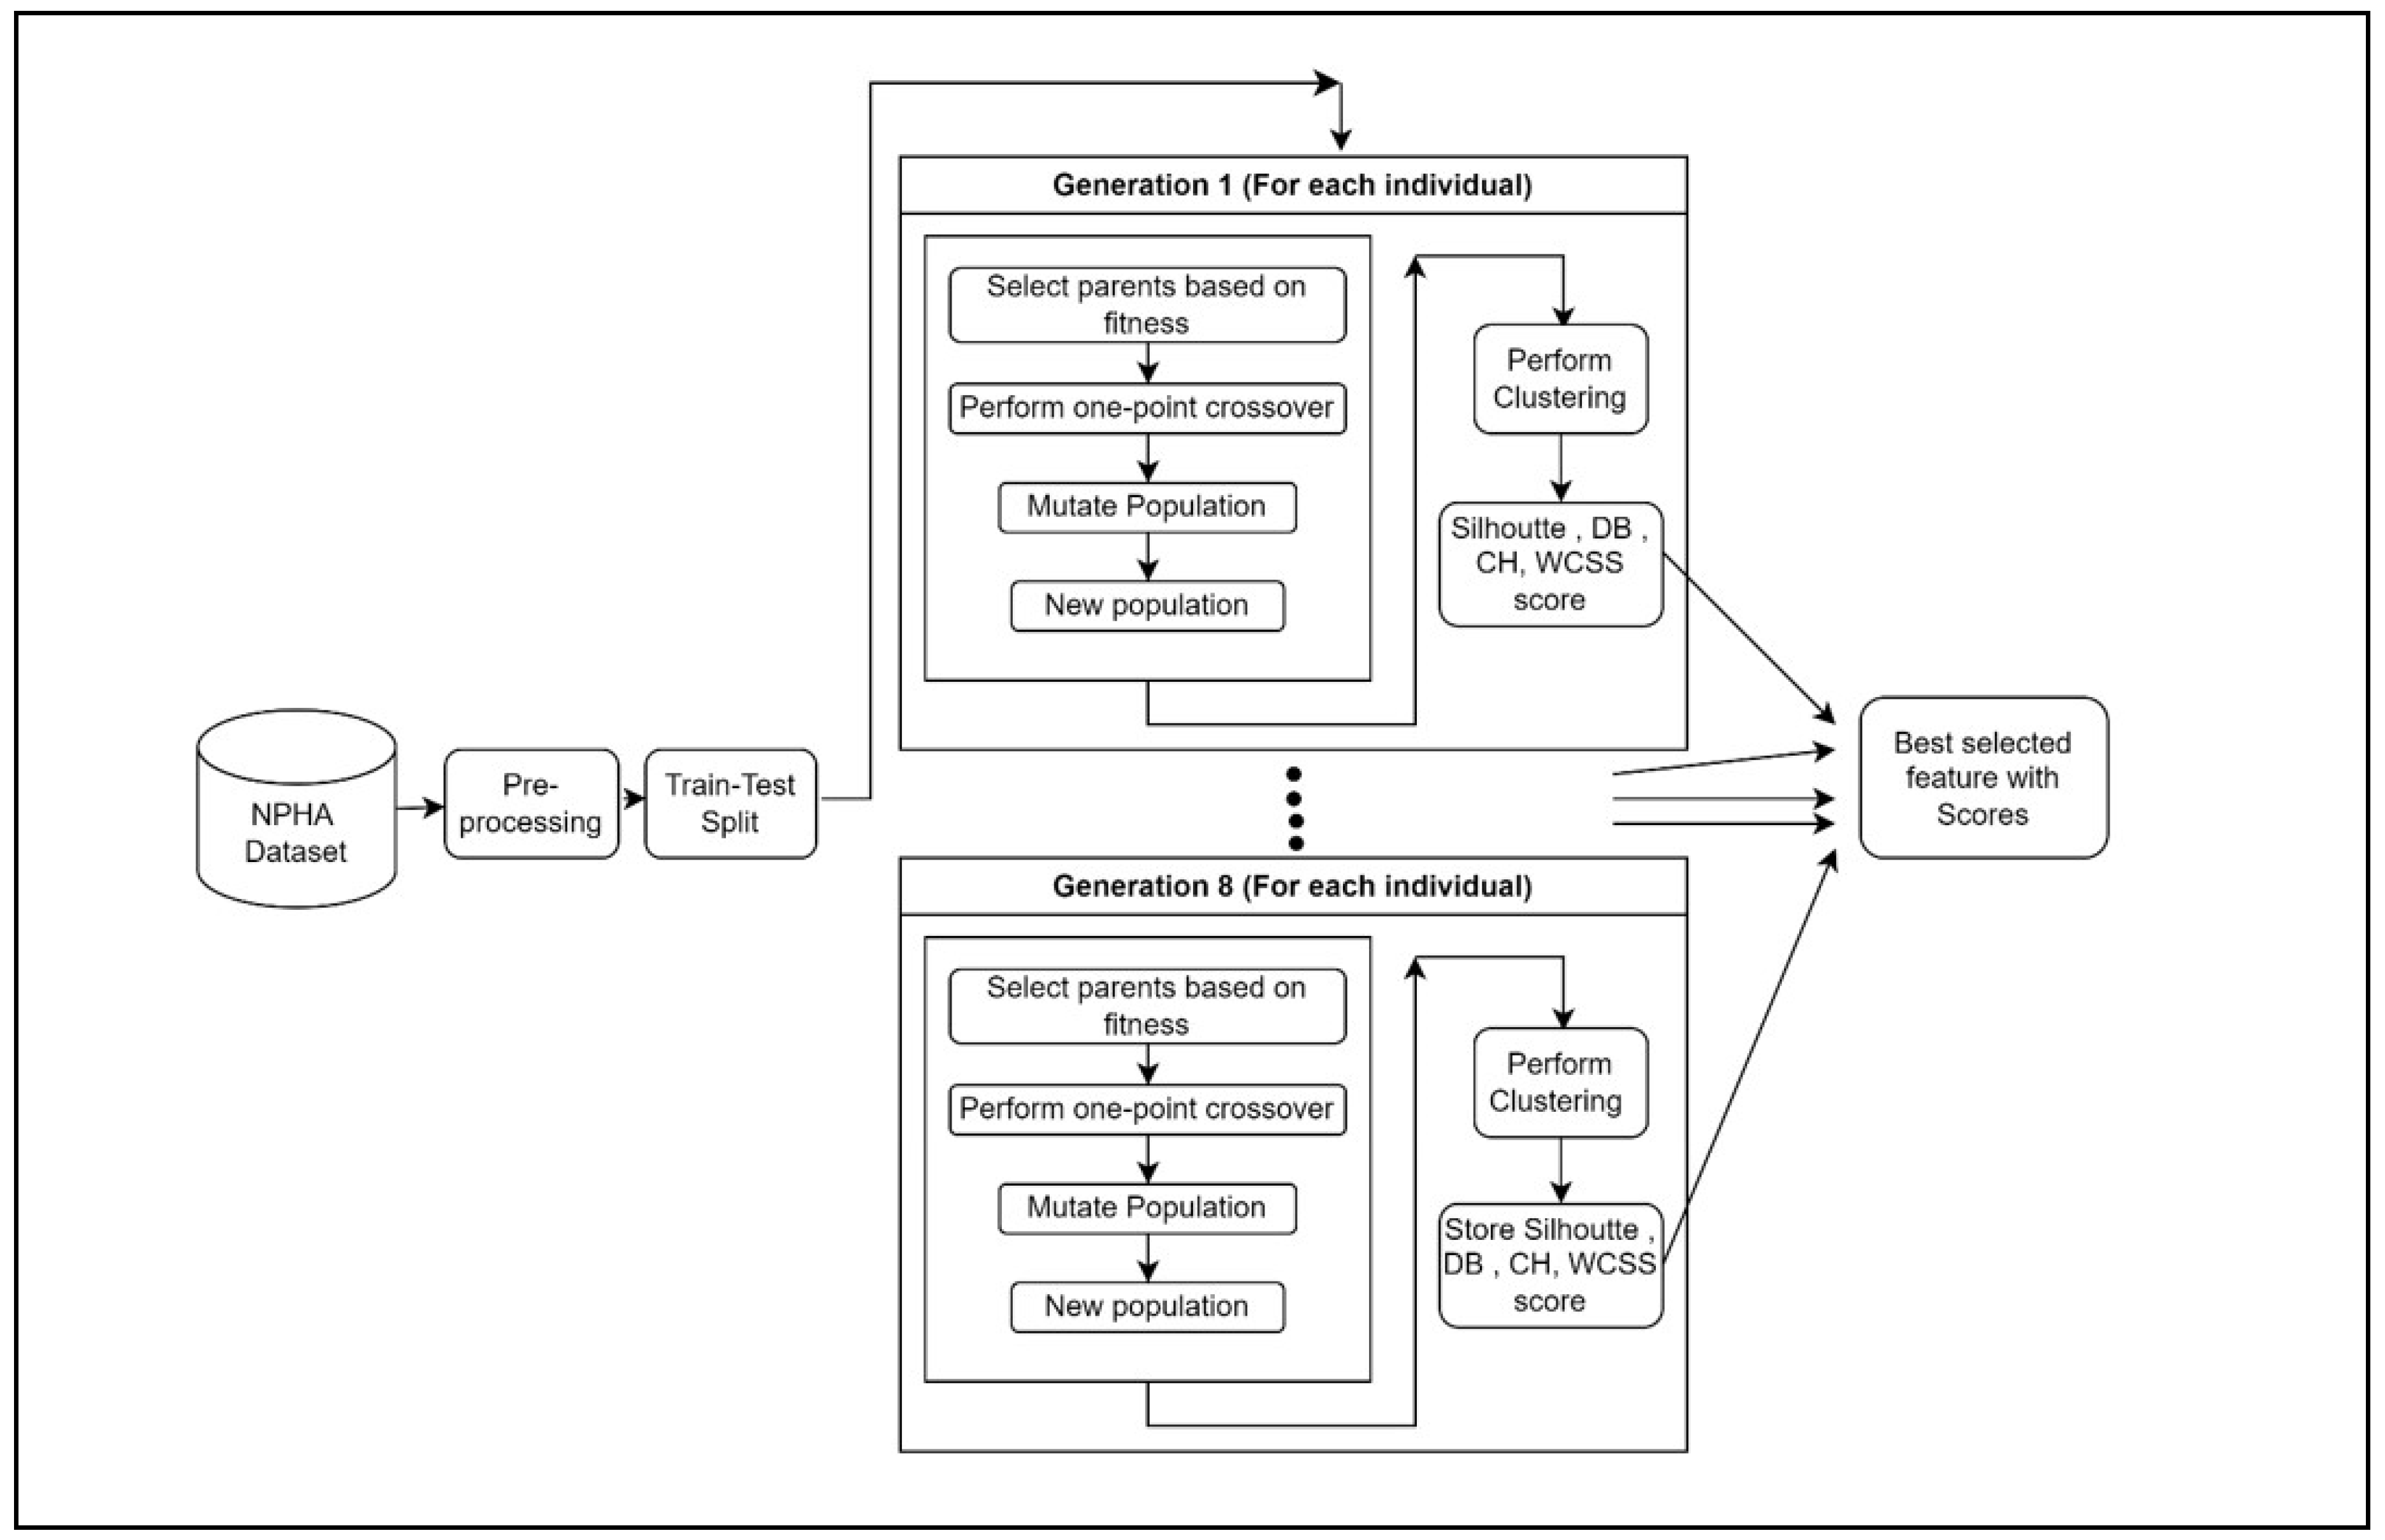
The complete workflow presented in
Figure 3, involves multiple essential steps that strive to discover the most effective subset of features for optimal clustering performance. The process commences with the importation of essential libraries and the dataset. Afterwards, the dataset is divided into training and testing sets to make it easier to evaluate the model.
Next, create an initial population of individuals, with each individual representing a potential subset of traits. The evaluation of these subsets is conducted using a range of clustering performance criteria, such as silhouette score, Calinski-Harabasz score, Davies-Bouldin score, and Within-Cluster Sum of Squares (WCSS). The performance measurements of each individual are recorded for the purpose of reference, facilitating the comparison and selection of the subset that performs the best.
The process of iterating over generations is used to improve the population of feature subsets. This iteration continues until the stated maximum iteration count is reached, which in this case is 8. During each iteration, parents are chosen depending on their fitness, which is determined by their clustering performance. Subsequently, the population undergoes one-point crossover to produce offspring, which is subsequently followed by mutation to introduce diversity.
Following each iteration, the newly generated population is evaluated, and the highest level of accuracy is subsequently updated. The iterative technique enables to systematically investigate various feature subsets and improve them over successive generations. Upon reaching the maximum number of repetitions, the characteristics of the most successful individual are extracted, and its corresponding measurements are displayed for evaluation.
4. Results
In this research work various metrics are used to evaluate the performance of clustering algorithms. A brief explanation of each metric and its relevance is summarized below.
4.1. Performance Evaluation Parameters
The Silhouette score is a metric that measures the degree of similarity between an object and its own cluster, relative to other clusters. The range of values is from -1 to 1. A high value implies that the object is well-suited to its own cluster and not well-suited to surrounding clusters. It is a valuable measure for evaluating the accuracy of clustering when the actual labels are unknown.
The Calinski-Harabasz score, sometimes referred to as the Variance Ratio Criterion, quantifies the ratio between the total dispersion among different clusters and the dispersion inside each individual cluster. A higher score signifies more distinct and well-defined clusters. This score is valuable for assessing the degree of compactness and distinctiveness of clusters. Greater scores suggest that the clusters exhibit high density and significant separation, which is advantageous for achieving effective clustering.
The Davies-Bouldin score quantifies the mean resemblance between each cluster and its most resembling cluster, with resemblance being determined by the ratio of distances within a cluster to distances between clusters. Lower scores are indicative of superior clustering. This score is used to evaluate the degree of compactness and separation of clusters. A lower Davies-Bouldin score indicates that the clusters are highly segregated and clearly distinguishable from one another.
The Within-Cluster Sum of Squares (WCSS) is a measure that estimates the sum of squared distances between each data point and the centroid of the cluster it belongs to. It quantifies the level of density in clusters. Smaller WCSS values imply that the data points are near their centroids, indicating that the clusters are tightly packed and distinct from each other.
Essentially, these metrics offer varying viewpoints on the excellence of clustering. A clustering algorithm that achieves a high silhouette score, high Calinski-Harabasz score, low Davies-Bouldin score, and low WCSS is considered to have superior clustering results, showing that the clusters are well-defined, compact, and isolated.
4.2. Dataset
The dataset utilized in this study is a subset of the National Poll on Healthy Ageing (NPHA) dataset that has been refined to construct and verify machine learning algorithms for forecasting the annual count of doctors visited by the respondents in a survey. The collection consists of records that correspond to elderly individuals who responded in the NPHA survey. The purpose of creating the National Poll on Healthy Ageing dataset was to collect information and understanding about the health, healthcare, and health policy concerns that impact individuals in the United States who are 50 years old and above. Every row in the dataset corresponds to an individual who is in the survey. There are a total of 14 health and sleep-related features available for inclusion in the prediction task, and a total of 714 instances.
Table 1 presents the dataset and features description. In our study the dataset from kaggle [31] has been utilized.
4.3. Implementation Details
The proposed genetic algorithm with cluster modeling harnesses the power of Python 3.11.9 within the Anaconda environment, leveraging its rich ecosystem of libraries for data manipulation, machine learning, and visualization. Experiments were conducted on a system equipped with a 64-bit operating system and 8 GB of RAM, ensuring the algorithm's performance and scalability. At the core of the implementation lie essential Python libraries, starting with Pandas, which facilitates structured data handling, including tasks like CSV file reading, missing value management, and data frame manipulation. Complementing Pandas is NumPy, providing efficient numerical array operations essential for various machine learning computations.
The scikit-learn library, often referred to as sklearn, is pivotal for machine learning tasks, offering a diverse range of algorithms and utilities. Among its functionalities, k-means clustering for unsupervised learning and metrics such as silhouette score, Calinski-Harabasz score, and Davies-Bouldin score for assessing clustering performance stand out. Lastly, Matplotlib is employed for visualization, enabling the generation of informative plots to track clustering performance metrics across multiple generations of feature selection. Together, these libraries form a robust ecosystem for comprehensive exploration and analysis of clustering algorithms and feature selection strategies.
The Genetic algorithm operates on a population of 8 instances, iterating through a maximum of 8 generations. In each generation, 40% of the population, considered the elite, is preserved without mutation, while 20% of the genes in the remaining population are subject to mutation. GA with same setting is applied to all the mentioned clustering algorithms, out of which GA with KMeans ++ clustering outperformed.
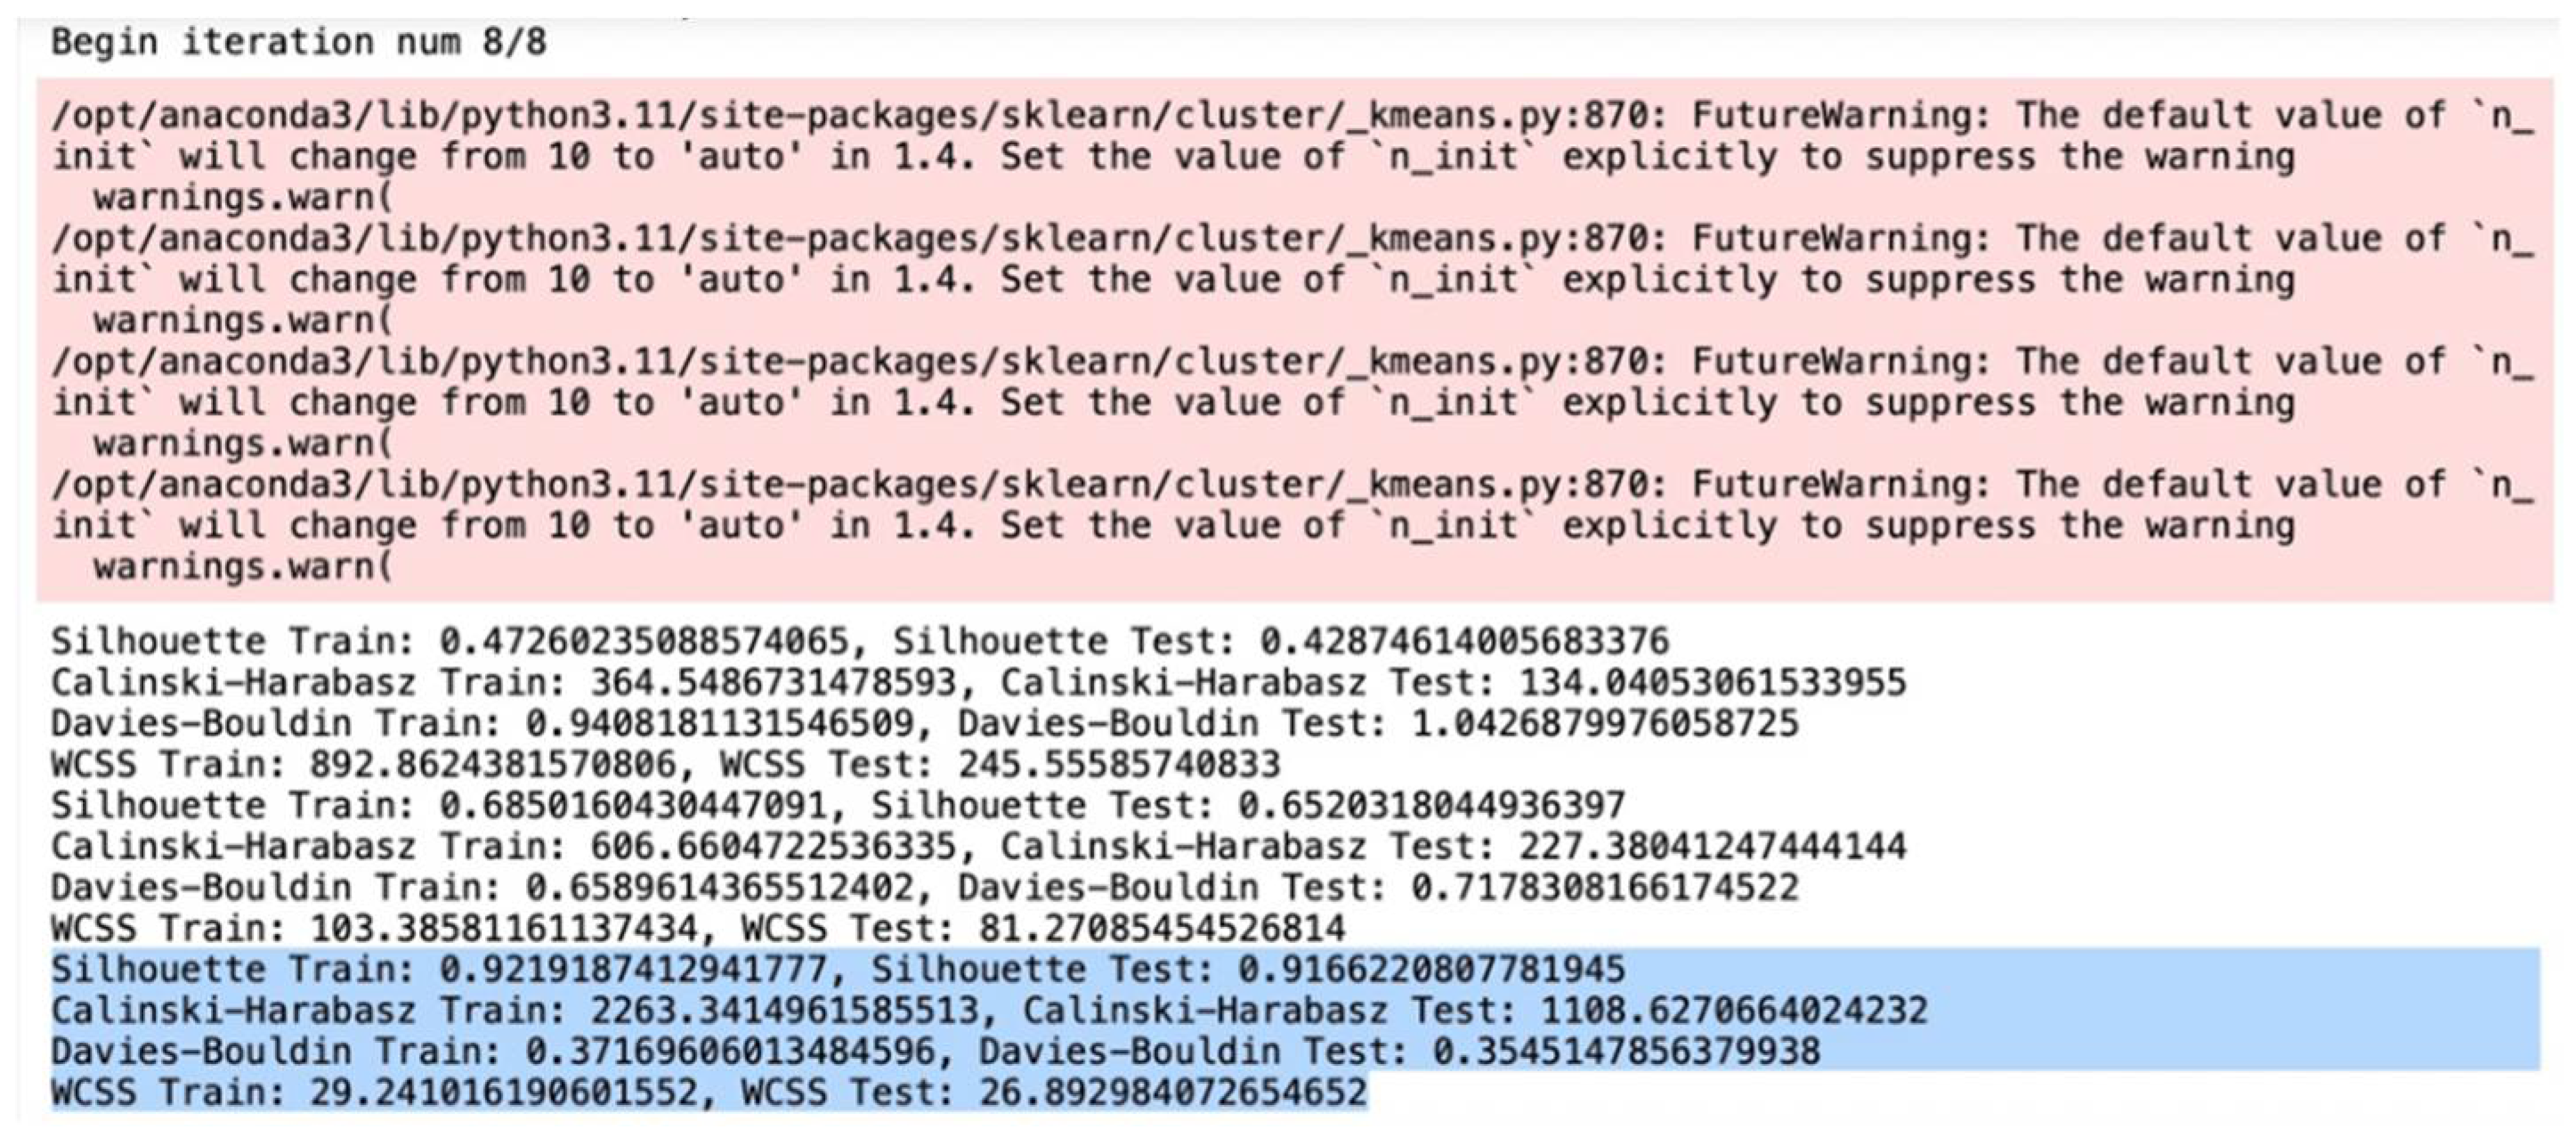
In the Appendix,
Figure A1 and
Figure A2 show the highest score achieved at the 8th generation, as well as the selected features and score of the GA-KMeans ++ clustering.
Figure A2 presents the graphs that represent the scores of GA-KMeans ++ clustering for all 8 generations. Furthermore,
Table A1 displays the highest score achieved by the GA-KMeans++ algorithm across all 8 generations.
4.4. Analysis
The
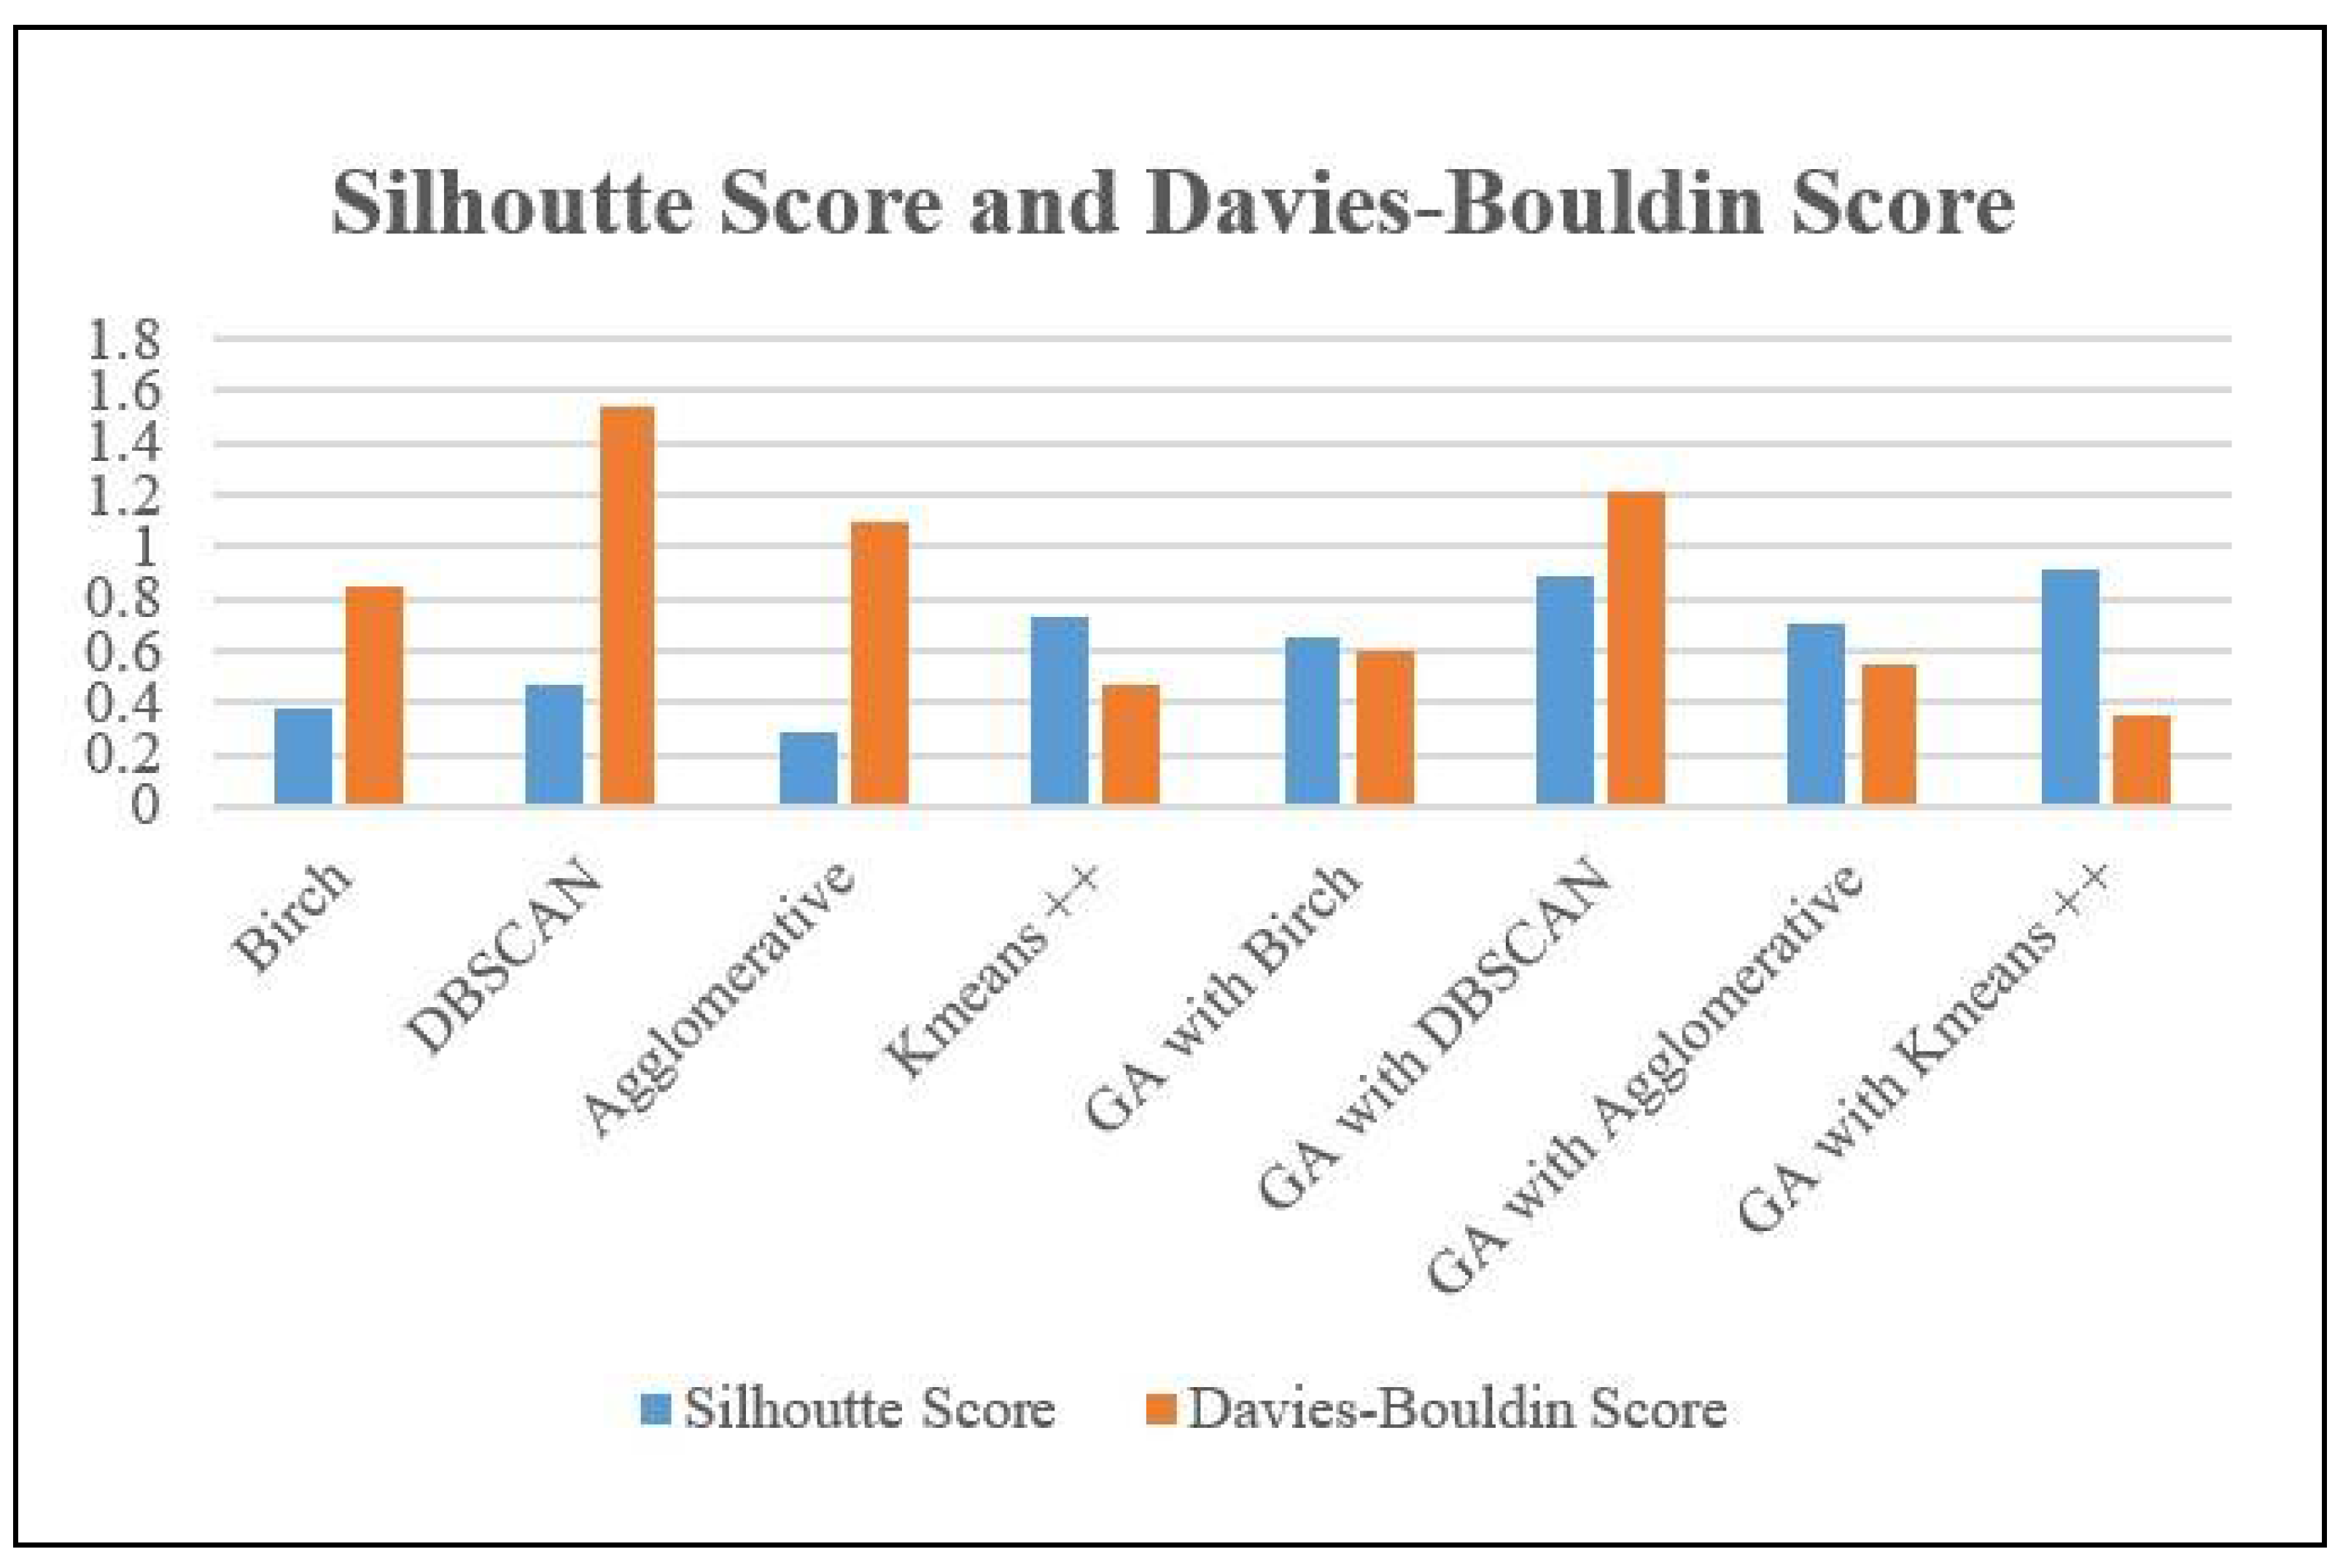
Table 2 displays the Silhouette Scores for several clustering methods and their corresponding versions augmented with a genetic algorithm (GA). Birch, DBSCAN, and Agglomerative clustering demonstrate scores of 0.3816, 0.4653, and 0.2867 respectively, demonstrating different levels of cluster overlap and separation. Kmeans++ attains the maximum score of 0.7284, indicating the presence of distinct clusters. When GA is used for feature selection, enhancements are observed in all algorithms. The Genetic Algorithm (GA) combined with the Density-Based Spatial Clustering of Applications with Noise (DBSCAN) algorithm produces the greatest Silhouette Score of 0.8844, suggesting a substantial improvement in cluster separation. The Genetic Algorithm (GA) combined with Kmeans++ also demonstrates significant enhancement with a score of 0.9166, emphasizing the efficacy of feature selection in improving clustering performance.
Furthermore, the evaluation of each clustering technique and its equivalent GA-enhanced variant is conducted using the Davies-Bouldin Score. The Birch, DBSCAN, and Agglomerative clustering algorithms get scores of 0.8433, 1.544, and 1.0995 respectively. These values indicate different levels of similarity among clusters, with larger scores suggesting worse quality clustering.
Kmeans++ achieves the lowest Davies-Bouldin Score of 0.474, indicating superior clustering performance compared to the other algorithms. When GA is used for feature selection, enhancements are observed in all algorithms. The Genetic Algorithm (GA) combined with the Kmeans++ algorithm obtains the lowest Davies-Bouldin Score of 0.35451, which indicates a substantial improvement in cluster similarity and the presence of well-defined clusters.
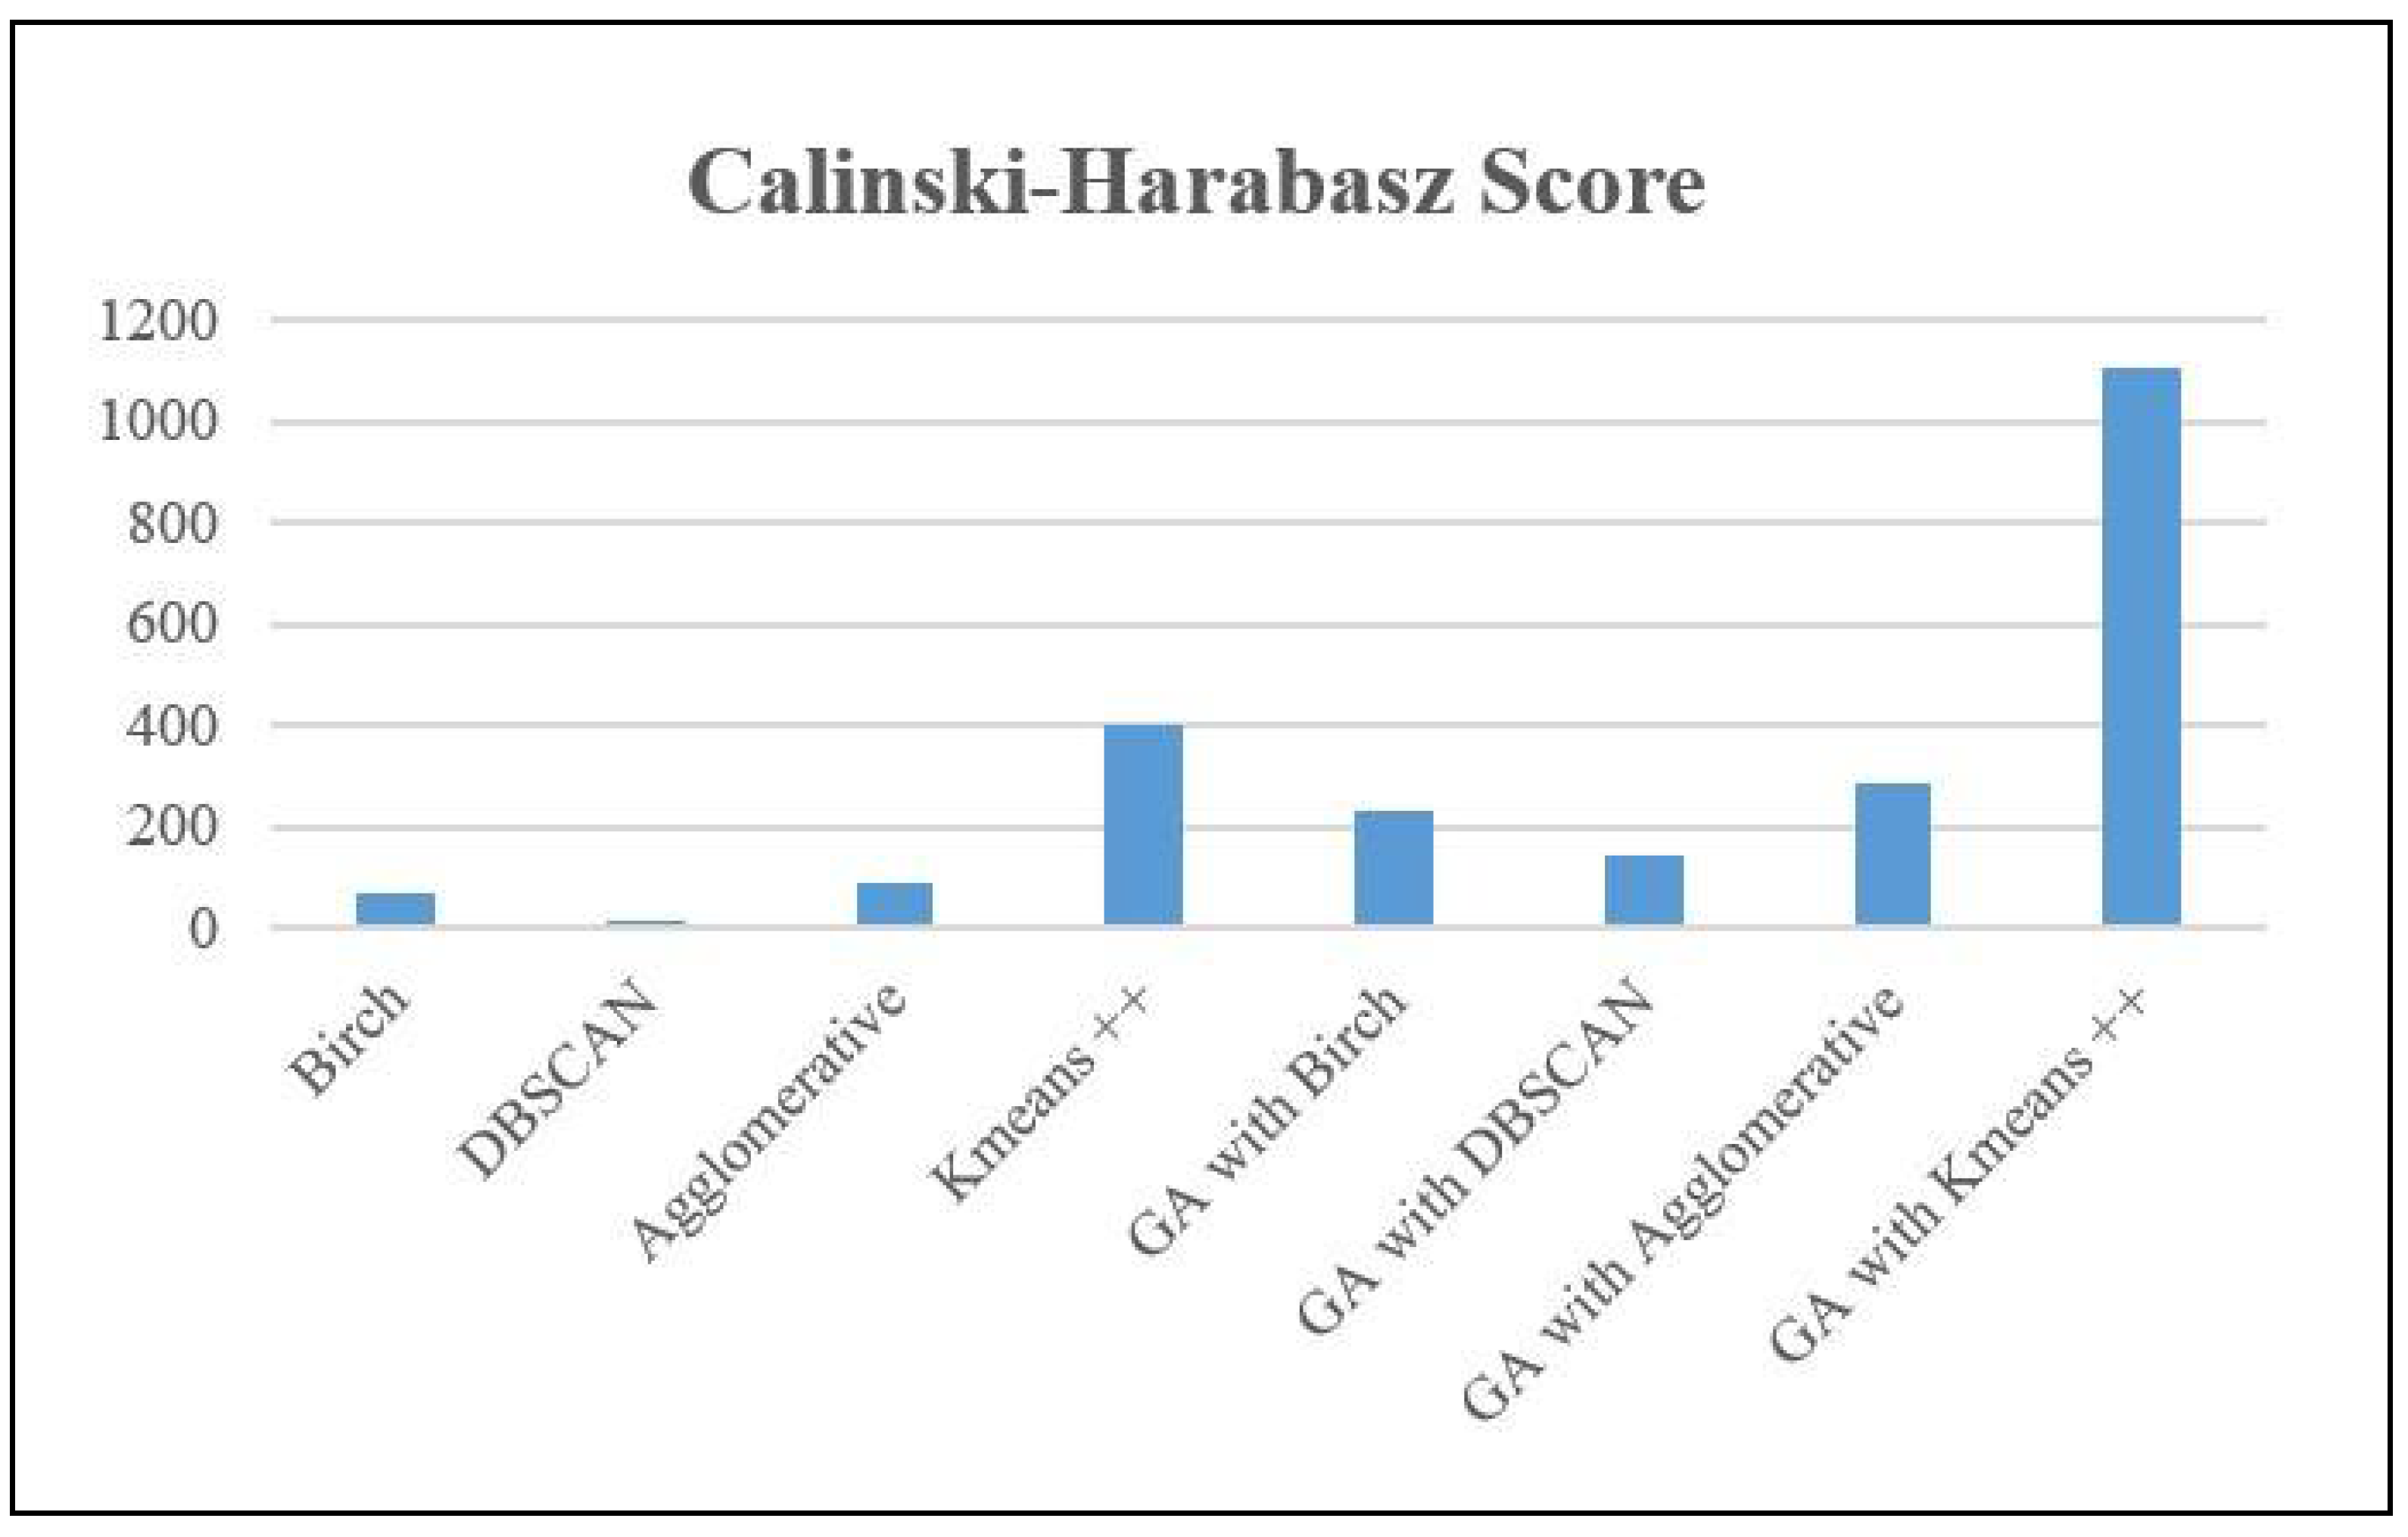
Similarly, the Calinski-Harabasz (CH) Score evaluates the quality of clustering by quantifying the ratio of dispersion between clusters to dispersion within clusters. This ratio indicates the extent to which clusters are distinct from each other in a dataset. Greater scores indicate clusters that are more distinct and tightly packed. Birch achieved a score of 68.67, indicating a moderate level of cluster separation but lower clarity compared to algorithms with higher scores. The DBSCAN algorithm achieved a score of 14.78, which suggests inadequate separation between clusters and the possibility of clusters overlapping. The agglomerative clustering algorithm achieved a score of 90.7, indicating enhanced but not yet perfect separation of clusters. Kmeans++ had superior performance compared to other methods, achieving a score of 397.46, which suggests the presence of distinct and closely-packed clusters.
When utilized in conjunction with a genetic algorithm (GA) for the purpose of feature selection, all methods exhibited better CH Scores, which signifies improved cluster separation and density. The GA with Kmeans++ algorithm achieved the best score of 1108.62, indicating that the GA greatly enhanced clustering performance, leading to denser and more distinct clusters compared to other models.
Based on a range of evaluation indicators, the
Table 2 analyses the effectiveness of several algorithms on the NPHA dataset.
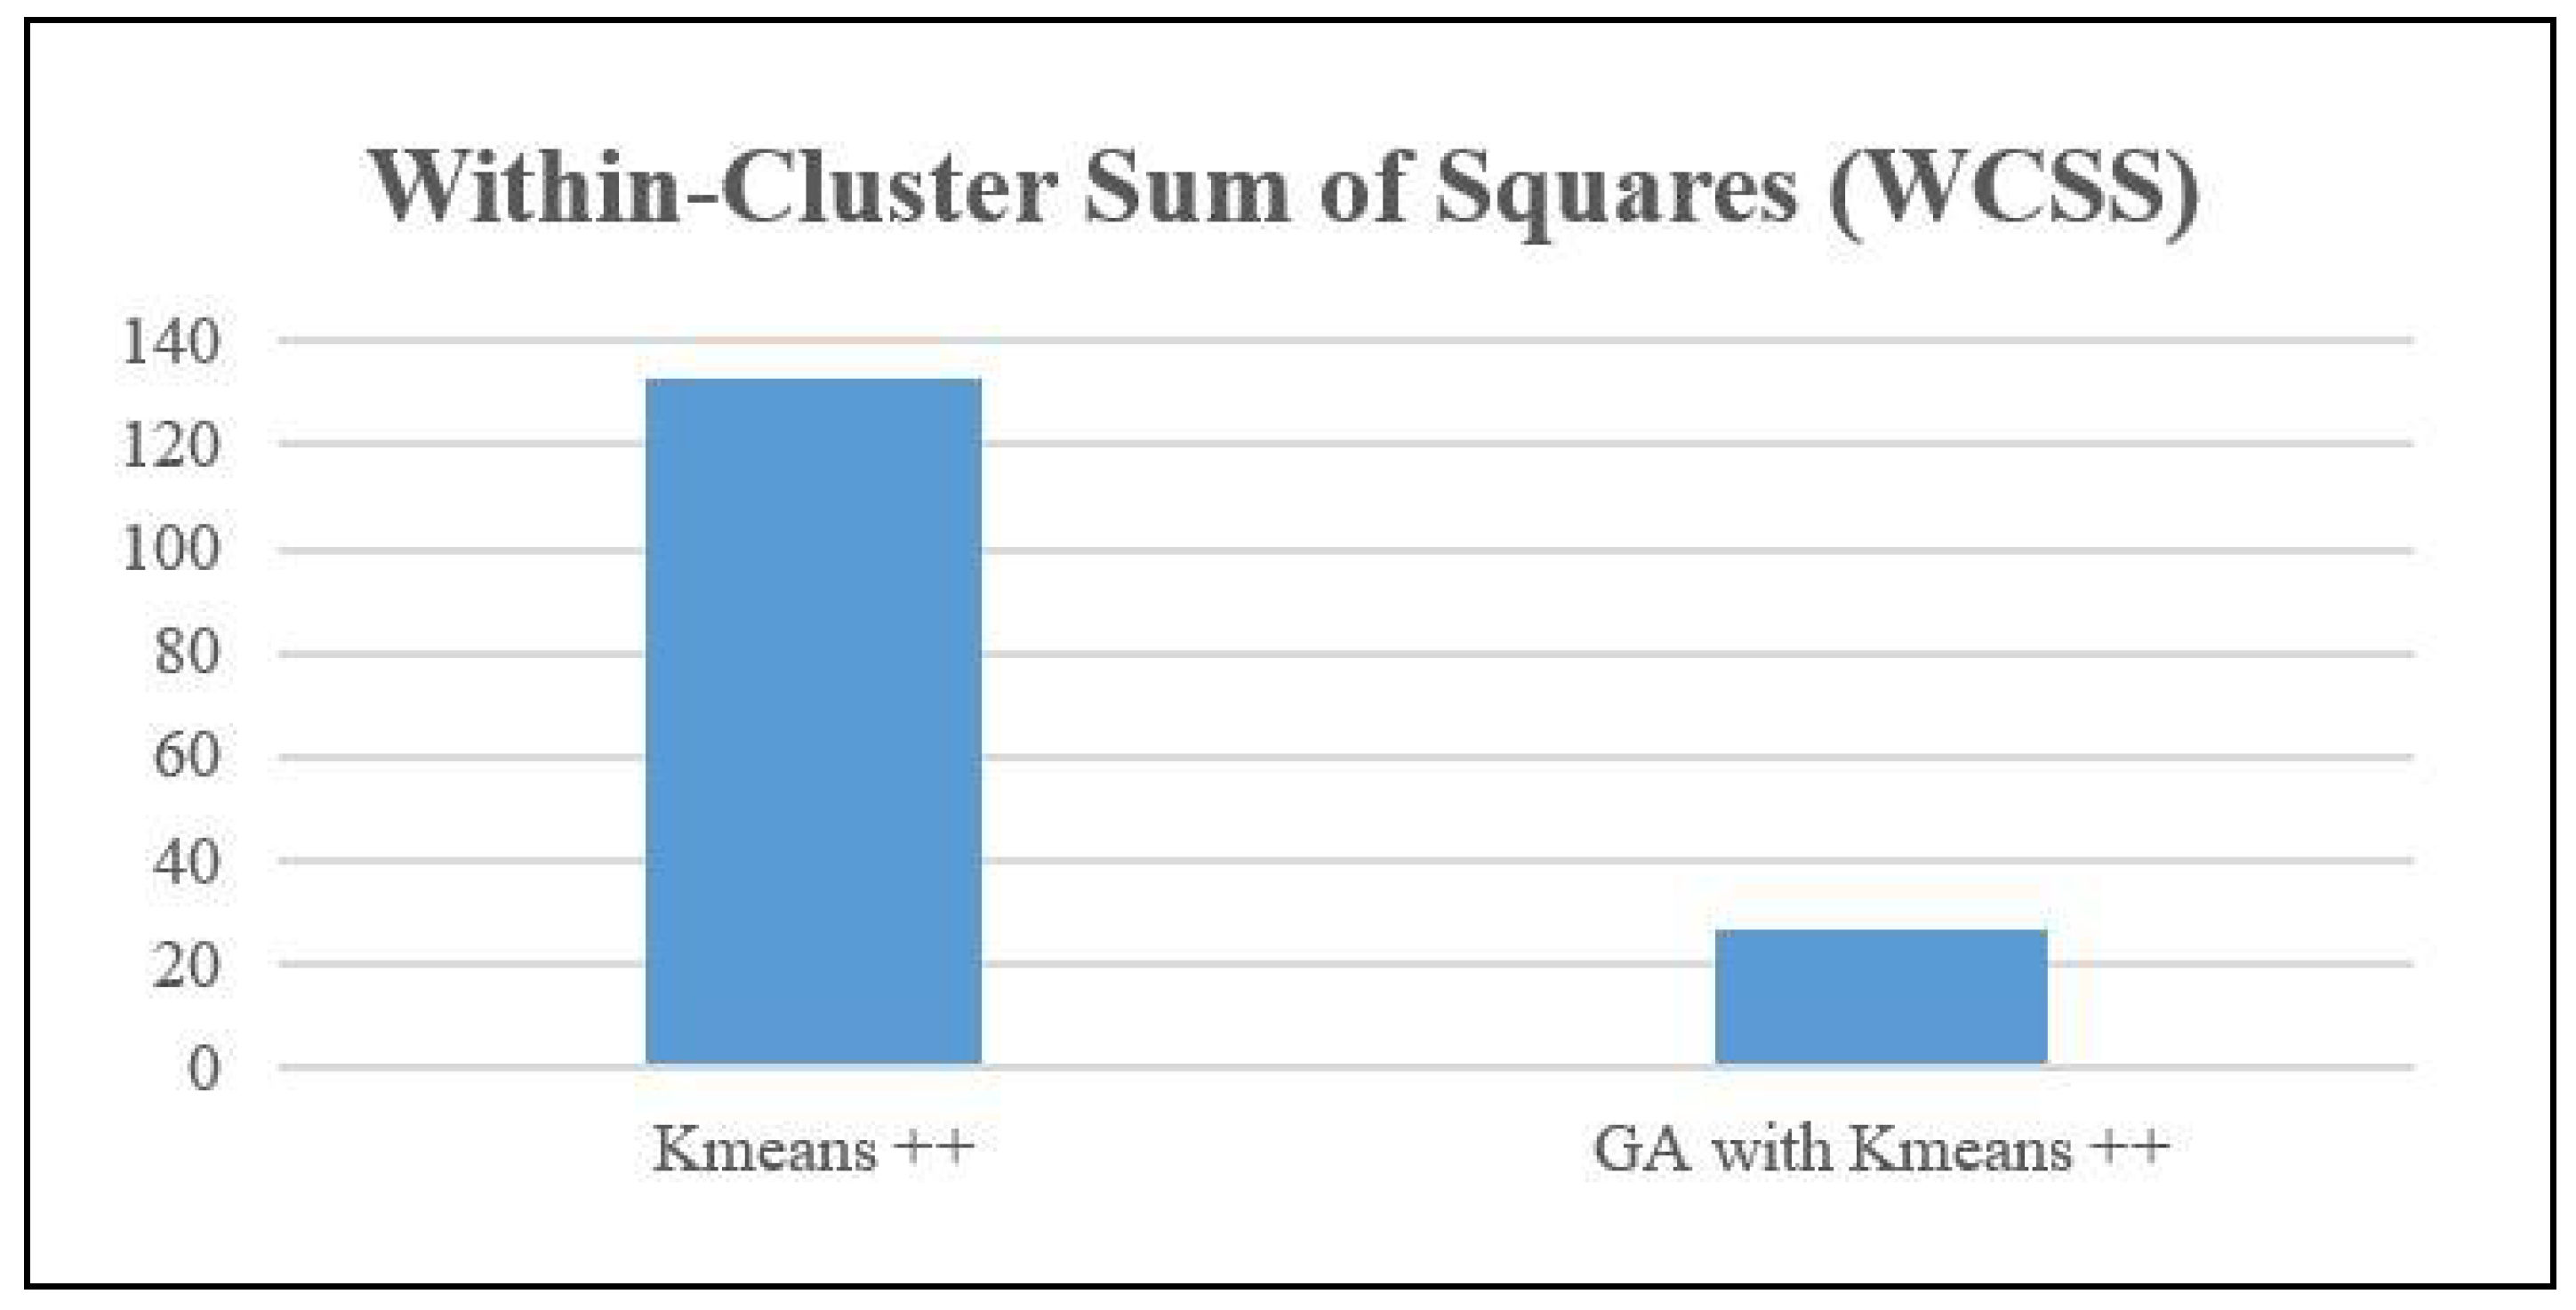
Also, the WCSS measure was computed for both the Means++ algorithm and the Genetic Algorithm with KMeans. The measure quantifies the degree of compactness shown by clusters. The metric calculates the total of the squared distances between every data point and the centroid of its corresponding cluster. A decrease in WCSS signifies that the data points are in closer proximity to their respective centroids, indicating the presence of more tightly-knit clusters.
Based on the data presented in
Figure 6, Kmeans++ obtained a within-cluster sum of squares (WCSS) value of 132.85. However, when the genetic algorithm (GA) was combined with Kmeans++, the clustering performance was greatly enhanced, resulting in a much lower WCSS value of 26.89. This reduction indicates that the genetic algorithm (GA) for feature selection improved Kmeans++ by producing more tightly packed and compact clusters. The reduced within-cluster sum of squares (WCSS) indicates that the clusters generated by the genetic algorithm (GA) with Kmeans++ have data points that are in closer proximity to their respective centroids. This signifies an enhanced quality of clustering and maybe a more distinct separation between the clusters.
Based on these metrics, K-Means++ demonstrates superior performance compared to other clustering algorithms in terms of clustering quality, resulting in more distinct, concise, and distinct clusters.
5. Discussion
5.1. GA-KMeans ++ Vs Other GA Based Clustering Algorithms
GA with KMeans++, employs KMeans++ initialization to facilitate the identification of superior solutions by selecting centroids that are balanced and uniformly dispersed. This results in accelerated convergence. Other Genetic Algorithm-based Clustering, suboptimal initialization strategies are implemented, leading to sluggish convergence and challenges in locating optimal solutions.
KMeans++ and GA, genetic operations such as selection, crossover, and mutation are employed to improve the centroids obtained via KMeans++. This results in enhanced cluster assignments and an overall improvement in the quality of clustering. In alternative clustering methods, that rely on genetic algorithms may encounter difficulties in effectively traversing the search space or optimizing cluster assignments, which could result in less-than-ideal clustering outcomes.
GA utilizing KMeans++, attains exceptional clustering performance metrics, including the Silhouette Score, Davies-Bouldin Score, and Calinski-Harabasz Score, which signify improved inter-cluster separation and optimized separation and compactness of clusters, respectively. Alternatives to Genetic Algorithm-based Clustering, potentially lower clustering performance metric attainment indicates less effective or less well-separated clustering outcomes.
In comparison to alternative clustering algorithms that rely on genetic algorithms, the GA with KMeans++ method sets itself apart through the provision of a more resilient initialization strategy, a more efficient exploration of the search space, and superior metrics for clustering performance. Due to these benefits, it is a more desirable alternative for clustering tasks in comparison to alternative clustering approaches based on genetic algorithms.
5.2. KMeans ++ Vs GA-KMeans ++
The main differences between KMeans++ and GA-KMeans++ are their starting procedures. KMeans++ uses smart initialization to choose centroids far apart, improving convergence but perhaps resulting in poor solutions. GA with KMeans++ uses the initialization approach to balance and evenly distribute centroids, which speeds convergence and improves clustering. GA with KMeans++ relies on genetic algorithms to improve centroids through selection, crossover, and mutation. Better cluster assignments and clustering quality result from this method. In contrast, KMeans++ does not use genetic processes, which may decrease convergence and reduce clustering performance.
GA using KMeans++'s evaluation metrics demonstrate its benefits. It has excellent Silhouette Score, Davies-Bouldin Score, and Calinski-Harabasz Score, showing enhanced inter-cluster separation and cluster compactness. KMeans++ performs worse in these metrics, implying poorer clustering. GA with KMeans++ has better clustering performance, resilient initialization, and efficient search space exploration. It outperforms KMeans++ and other genetic algorithm-based clustering methods due to these advantages.
5.3. Features Selected by Best Performing Algorithms
From
Table 2 it is seen that GA with KMeans++ is the best performing algorithm. The features selected by this algorithm are “
Age” and “
Employment”. Next to this, KMeans++ performs second best on Davies-Bouldin Score and Calinski-Harabasz score. The features selected by this algorithm are “
Age”, “
Stress keeps patient from Sleeping”, “
Pain keeps patient from Sleeping” and “
Race”.
6. Conclusions
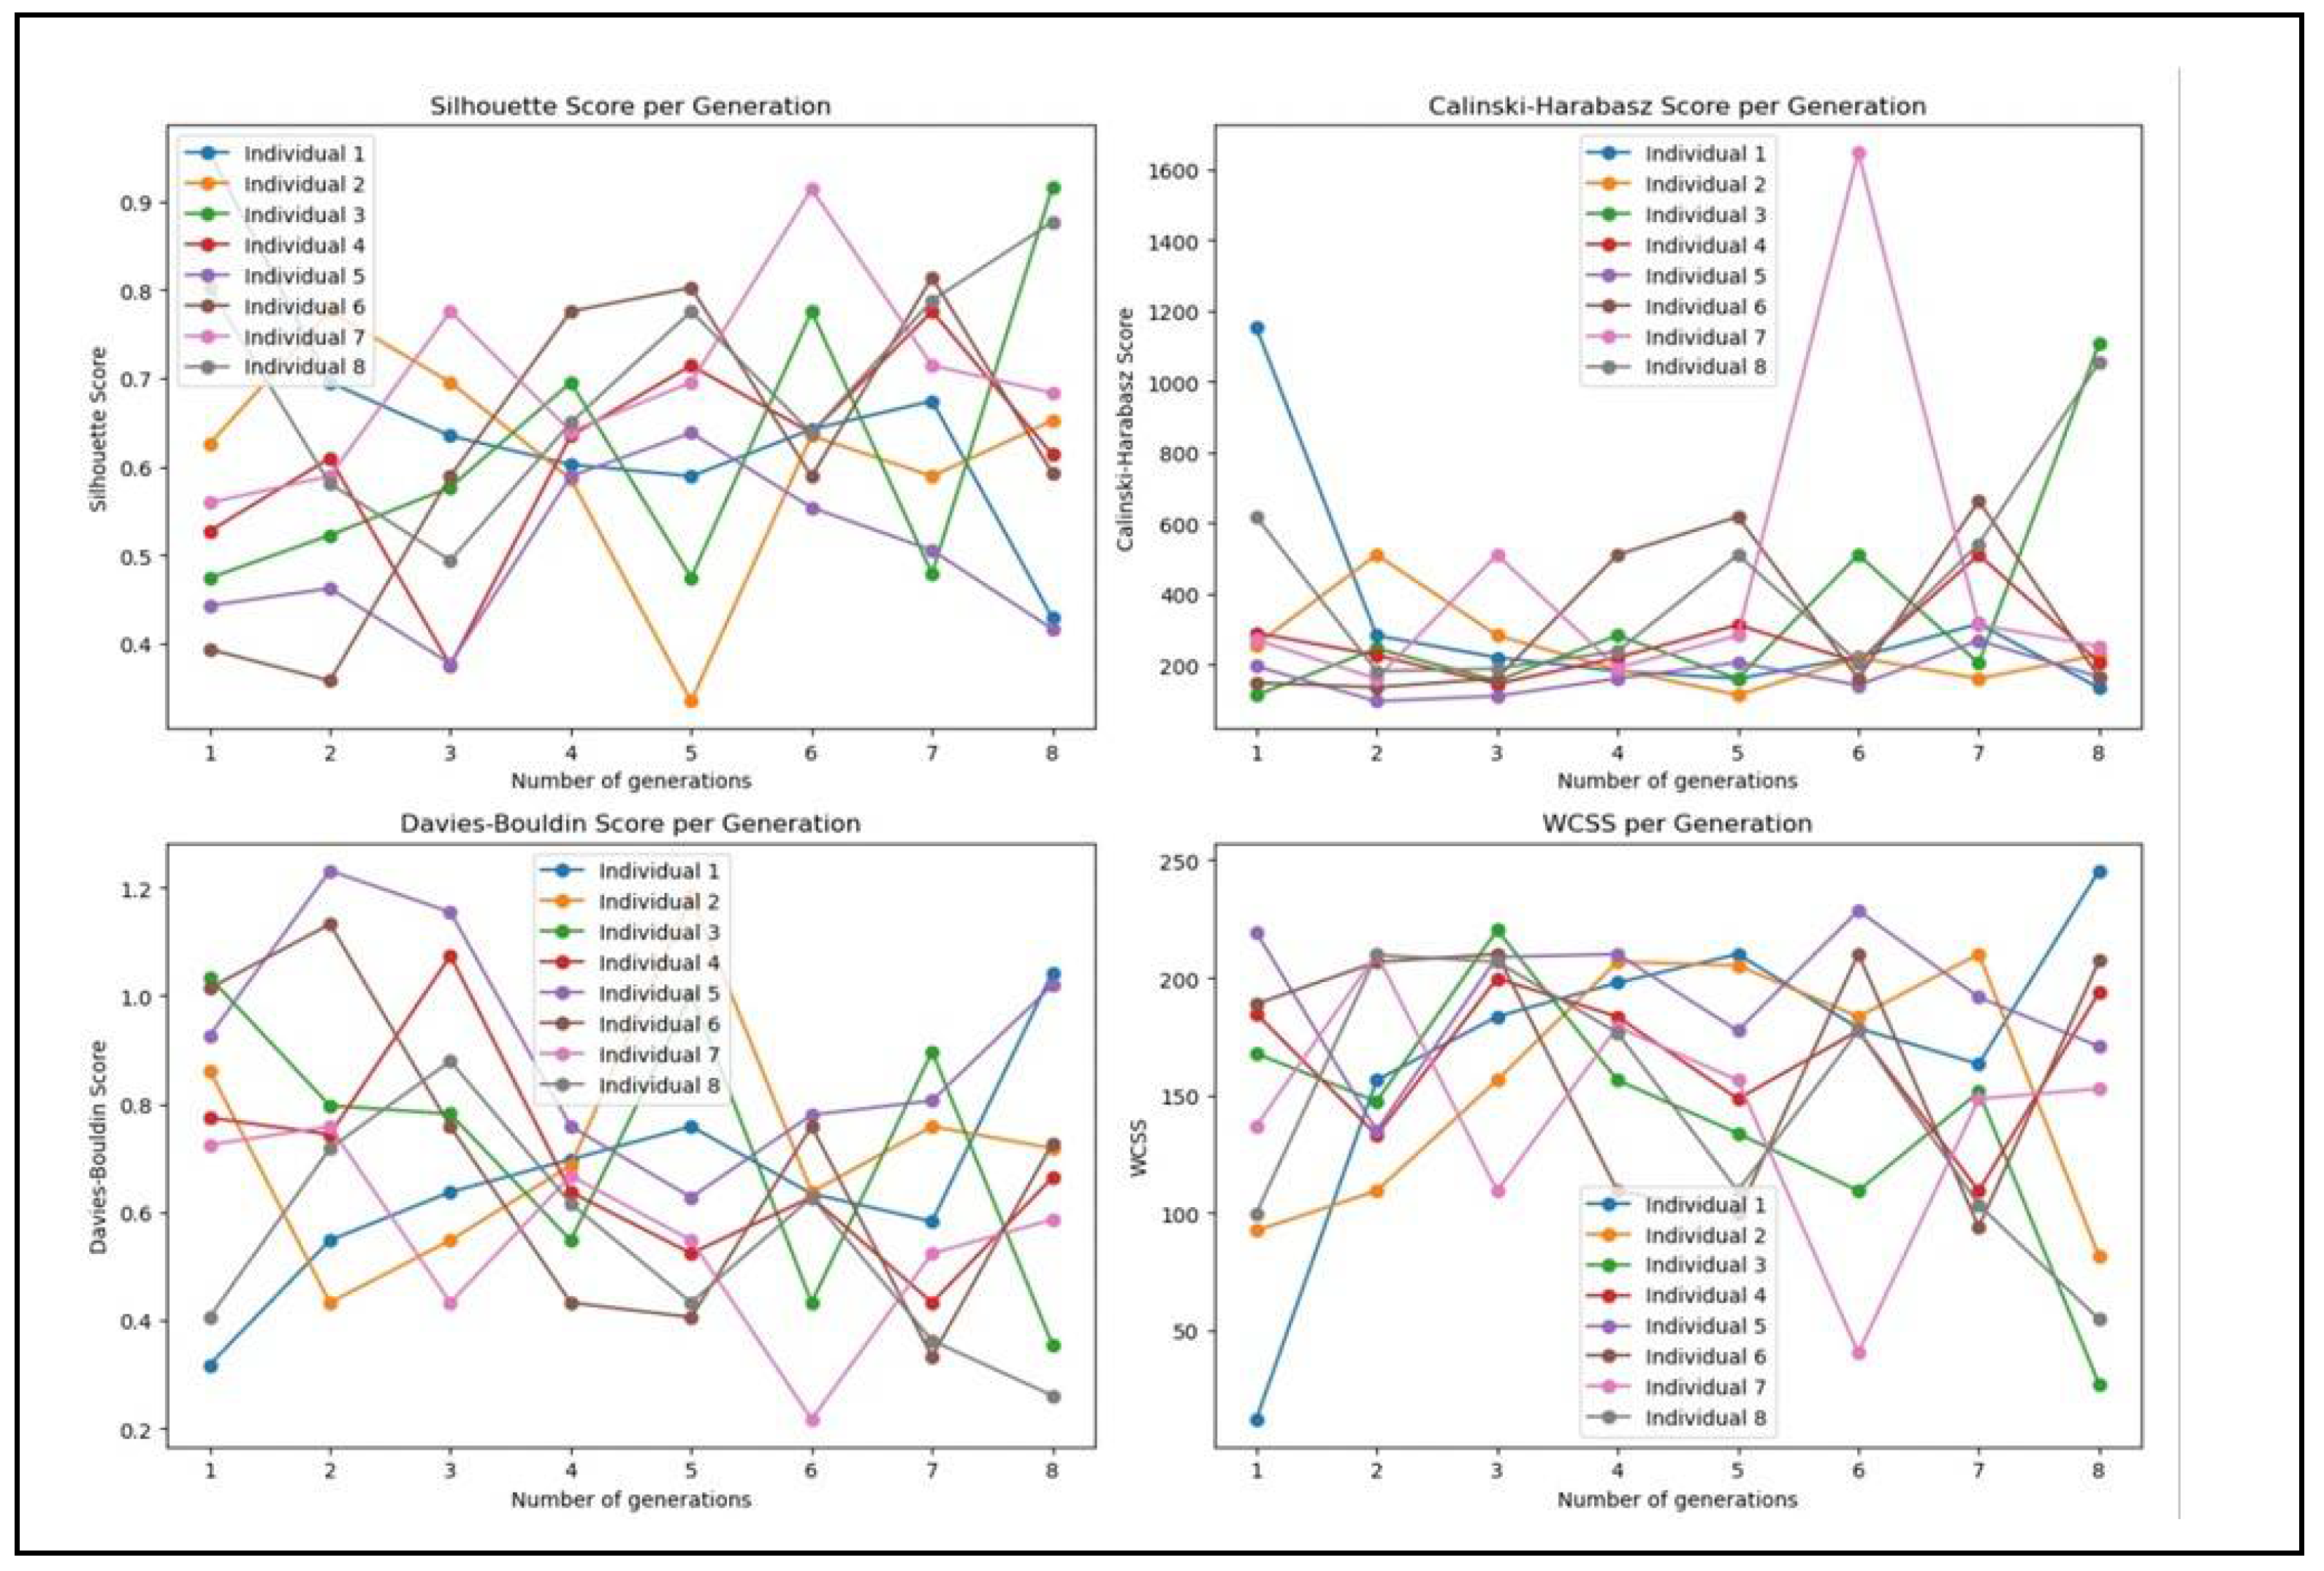
As a result of our experiments it is found that GA utilizing KMeans++, attains exceptional clustering performance metrics, including the Silhouette Score, Davies-Bouldin Score, and Calinski-Harabasz Score. This is an indicator that improved inter-cluster separation and optimized separation and compactness of clusters, is attained. This answers the RQ1 and proves the efficacy of GA in enhancing clustering performance. The answer to RQ2 is that GA with KMeans++ is most effective when applied to NPHA dataset. Finally, the graphs in
Figure 7 are the answer to RQ3.
It can be seen from
Figure 7 that the iterative processes of GA indeed have the potential to enhance clustering performance across numerous generations. Finally we would like to end our discussion with two open questions:
Q1: When genetic algorithms are used to select features, which clustering performance metric is most indicative of successful clustering outcomes, thus indicating the best parameters for healthy aging?
Q2: How does the feature selection technique contribute to enhancing performance parameters?
These we would like to take up as part of our ongoing work with more optimization techniques and further evaluation of clusters for successful clustering outcomes.
We believe that studies of the kind presented in this research can play a vital role in predictive healthcare analytics, and intend to continue our pursuit in this direction.
Author Contributions
Conceptualization, V.B. and A. P.; methodology, M. G.; software, M. G. and S. K.; validation, V. B.; A. P. and S. K.; formal analysis, V. B.; investigation, S. K.; resources, K. K. and M. G.; data curation, M. G.; writing—original draft preparation, K. K.; writing—review and editing, V. B.; A. P. and M. G.; visualization, S. K.; supervision, V. B.; project administration, M. G.. All authors have read and agreed to the published version of the manuscript.
Funding
This research received no external funding
Data Availability Statement
Available at Kaggle.com
Conflicts of Interest
The authors declare no conflicts of interest.
Figure A1.
Snippet displaying best score obtained at 8 generation for GA-KMeans ++ clustering.
Figure A1.
Snippet displaying best score obtained at 8 generation for GA-KMeans ++ clustering.
Figure A2.
Snippet of selected features and score of GA-KMeans ++ clustering.
Figure A2.
Snippet of selected features and score of GA-KMeans ++ clustering.
Table A1.
Best Score for KMeans ++ for 8 generations.
Table A1.
Best Score for KMeans ++ for 8 generations.
| Generations |
Silhouette Score |
Calinski-Harabasz Score |
Davies-Bouldin Score |
| 1 |
0.548247203311971 |
248.77568949138 |
0.786258940306788 |
| 2 |
0.731523855693821 |
288.905157972548 |
0.647245020588084 |
| 3 |
0.889043941142484 |
815.375939811214 |
0.517261849266876 |
| 4 |
0.700623714255857 |
355.963046132945 |
0.51808134263016 |
| 5 |
0.676145002974023 |
277.21061465924 |
0.768662005029266 |
| 6 |
0.532169727001773 |
286.523711996311 |
0.764614500356365 |
| 7 |
0.701599126939112 |
312.072096751344 |
0.628716460051172 |
| 8 |
0.916622080778195 |
1108.62706640242 |
0.354514785637994 |
References
- Vandana Bhattacharjee, Ankita Priya, Nandini Kumari and Shamama Anwar (2023) “DeepCOVNet Model for COVID?19 Detection Using ChestX?Ray Images”, Wireless Personal Communication, [SCIE, IF: 2.017]. [CrossRef]
- Foo,A.; Hsu, W.; Li Lee,M.;S.W. Tan, G. DP-GAT: A Framework for Image-based Disease Progression Prediction, in 28th ACM SIGKDD Conference on Knowledge Discovery and Data Mining, August 2022.
- Nandy,J.; Hsu,W.;Li Lee. M.An Incremental Feature Extraction Framework for Referable Diabetic Retinopathy Detection, in IEEE 28th International Conference on Tools with Artificial Inteligience (ICTAI), San Jose, CA, USA, November 2016.
- Mishra A.; Jha R.; Bhattacharjee V. (2023), SSCLNet: A Self-Supervised Contrastive Loss-Based Pre-Trained Network for Brain MRI Classification, IEEE ACCESS, Digital Object Identifier. [CrossRef]
- Kumari N.; Anwar S.; Bhattacharjee V.; Sahana S. K. (2023), “Visually evoked brain signals guided image regeneration using GAN variants.”, Multimedia and Tools Application: An International Journal, Springer, ISSN: Print ISSN1380-7501, Online ISSN1573-7721, [SCIE, IF: 2.577]. [CrossRef]
- Jha R.; Bhattacharjee V.; Mustafi A. (2021) “Increasing the Prediction Accuracy for Thyroid Disease: A Step Towards Better Health for Society”, Wireless Personal Communications, August 2021 [SCIE Indexed IF 2.017]. [CrossRef]
- Bhattacharjee,V.; Priya,A.; and Prasad,U. Evaluating the Performance of Machine Learning Models for Diabetes Prediction with Feature Selection and Missing Values Handling. International Journal of Microsystems and IoT, Vol. 1, Issue 1, 26 June 2023. [CrossRef]
- Singh,S.; Aditi Sneh,A.; Bhattacharjee,V. A Detailed Analysis of Applying the K Nearest Neighbour Algorithm for Detection of Breast Cancer, International Journal of Theoretical & Applied Sciences,2021 13(1) pp 73-78.
- Ahmed, M.; Seraj, R.; Islam, S.M.S. The k-means algorithm: A comprehensive survey and performance evaluation. Electronics 2020, 9, 1295. [CrossRef]
- Jahwar, A.F.; Abdulazeez, A.M. Meta-heuristic algorithms for K-means clustering: A review. PalArch’s J. Archaeol. Egypt/Egyptol. 2020, 17, 12002–12020. [CrossRef]
- Huang, J. Design of Tourism Data Clustering Analysis Model Based on K-Means Clustering Algorithm. In International Conference on Multi-Modal Information Analytics; Springer: Cham, Switzerland, 2022; pp. 373–380.
- Yuan, C.; Yang, H. Research on K-value selection method of K-means clustering algorithm. J 2019, 2, 226–235. [CrossRef]
- Ikotun, A.M.; Ezugwu, A.E.; Abualigah, L.; Abuhaija, B.; Heming, J. K-means clustering algorithms: A comprehensive review, variants analysis, and advances in the era of big data. Inf. Sci. 2023, 622, 178–210. [CrossRef]
- Yang, Z.; Jiang, F.; Yu, X.; Du, J. Initial Seeds Selection for K-means Clustering Based on Outlier Detection. In Proceedings of the 2022 5th International Conference on Software Engineering and Information Management (ICSIM), Yokohama, Japan, 21–23 January 2022; pp. 138–143. [CrossRef]
- Han, M. Research on optimization of K-means Algorithm Based on Spark. In Proceedings of the 2023 IEEE 6th Information Technology, Networking, Electronic and Automation Control Conference (ITNEC), Chongqing, China, 24–26 February 2023; pp. 1829–1836.
- K., L. P. ., Suryanarayana, G. ., Swapna, N. ., Bhaskar, T. ., & Kiran, A. Optimizing K-Means Clustering using the Artificial Firefly Algorithm. International Journal of Intelligent Systems and Applications in Engineering, 11(9s), 2023;pp461–468.
- Bahmani, B.; Moseley, B.; Vattani, A.; Kumar, R.; Vassilvitskii, S. Scalable k-means++. arXiv 2012, arXiv:1203.6402.
- Dinh,D.; Huynh,V.; Sriboonchitta,S. Clustering mixed numerical and categorical data with missing values, Information Sciences, Volume 571, 2021,pp. 418-442. [CrossRef]
- S, Crase .; SN, Thennadil. An analysis framework for clustering algorithm selection with applicationstospectroscopy.PLoSONE17(3):e0266369. [CrossRef]
- Z, Wanwan.; J, Mingzhe. Improving the Performance of Feature Selection Methods with Low-Sample-Size Data, The Computer Journal, Volume 66, Issue 7 2023, pp 1664–1686. [CrossRef]
- Pullissery,Y.H.; Starkey,A. Application of Feature Selection Methods for Improving Classifcation Accuracy and Run-Time: A Comparison of Performance on Real-World Datasets 2nd International Conference on Applied Artificial Intelligence and Computing (ICAAIC), Salem, India, 2023, pp. 687-694. [CrossRef]
- Tabianan, K.; Velu, S.; Ravi, V. K-means clustering approach for intelligent customer segmentation using customer purchase behavior data. Sustainability 2022, 14, 7243. [CrossRef]
- Ghezelbash, R.; Maghsoudi, A.; Shamekhi, M.; Pradhan, B.; Daviran, M. Genetic algorithm to optimize the SVM and K-means algorithms for mapping of mineral prospectivity. Neural Comput. Appl. 2023, 35, 719–733. [CrossRef]
- El-Shorbagy,M.A.;Ayoub,A.Y.;Mousa,A.A.; Eldesoky,I. An enhanced genetic algorithm with new mutation for cluster analysis” Computational Statistics.2019,34:1355–1392. [CrossRef]
- Albadr,M.A.;Tiun,S.; Ayob,M.; AL-Dhief,F.Genetic Algorithm Based on Natural Selection Theory for Optimization Problems Symmetry 2020, 12(11), 1758. [CrossRef]
- Zubair, M.; Iqbal, M.A.; Shil, A.; Chowdhury, M.; Moni, M.A.; Sarker, I.H. An improved K-means clustering algorithm towards an efficient data-driven modeling. Ann. Data Sci. 2022, 9, 1–20. [CrossRef]
- Al Shaqsi, J.; Wang, W. Robust Clustering Ensemble Algorithm. SSRN Electron. J. 2022.
- Yu, H.; Wen, G.; Gan, J.; Zheng, W.; Lei, C. Self-paced learning for k-means clustering algorithm. Pattern Recognit. Lett. 2018. [CrossRef]
- Sajidha, S.; Desikan, K.; Chodnekar, S.P. Initial seed selection for mixed data using modified k-means clustering algorithm. Arab. J. Sci. Eng. 2020, 45, 2685–2703. [CrossRef]
- Hua,C.;Li, F.;Zhang,C.;Yang,J.;Wu,W. A Genetic XK-Means Algorithm with EmptyClusterReassignmentSymmetry 2019, 11(6), 744. [CrossRef]
-
www.kaggle.com.
|
Disclaimer/Publisher’s Note: The statements, opinions and data contained in all publications are solely those of the individual author(s) and contributor(s) and not of MDPI and/or the editor(s). MDPI and/or the editor(s) disclaim responsibility for any injury to people or property resulting from any ideas, methods, instructions or products referred to in the content. |
© 2024 by the authors. Licensee MDPI, Basel, Switzerland. This article is an open access article distributed under the terms and conditions of the Creative Commons Attribution (CC BY) license (http://creativecommons.org/licenses/by/4.0/).
