Submitted:
24 May 2024
Posted:
27 May 2024
You are already at the latest version
Abstract
Keywords:
1. Introduction
2. Conventional Pulsating High Frequency Voltage Injection
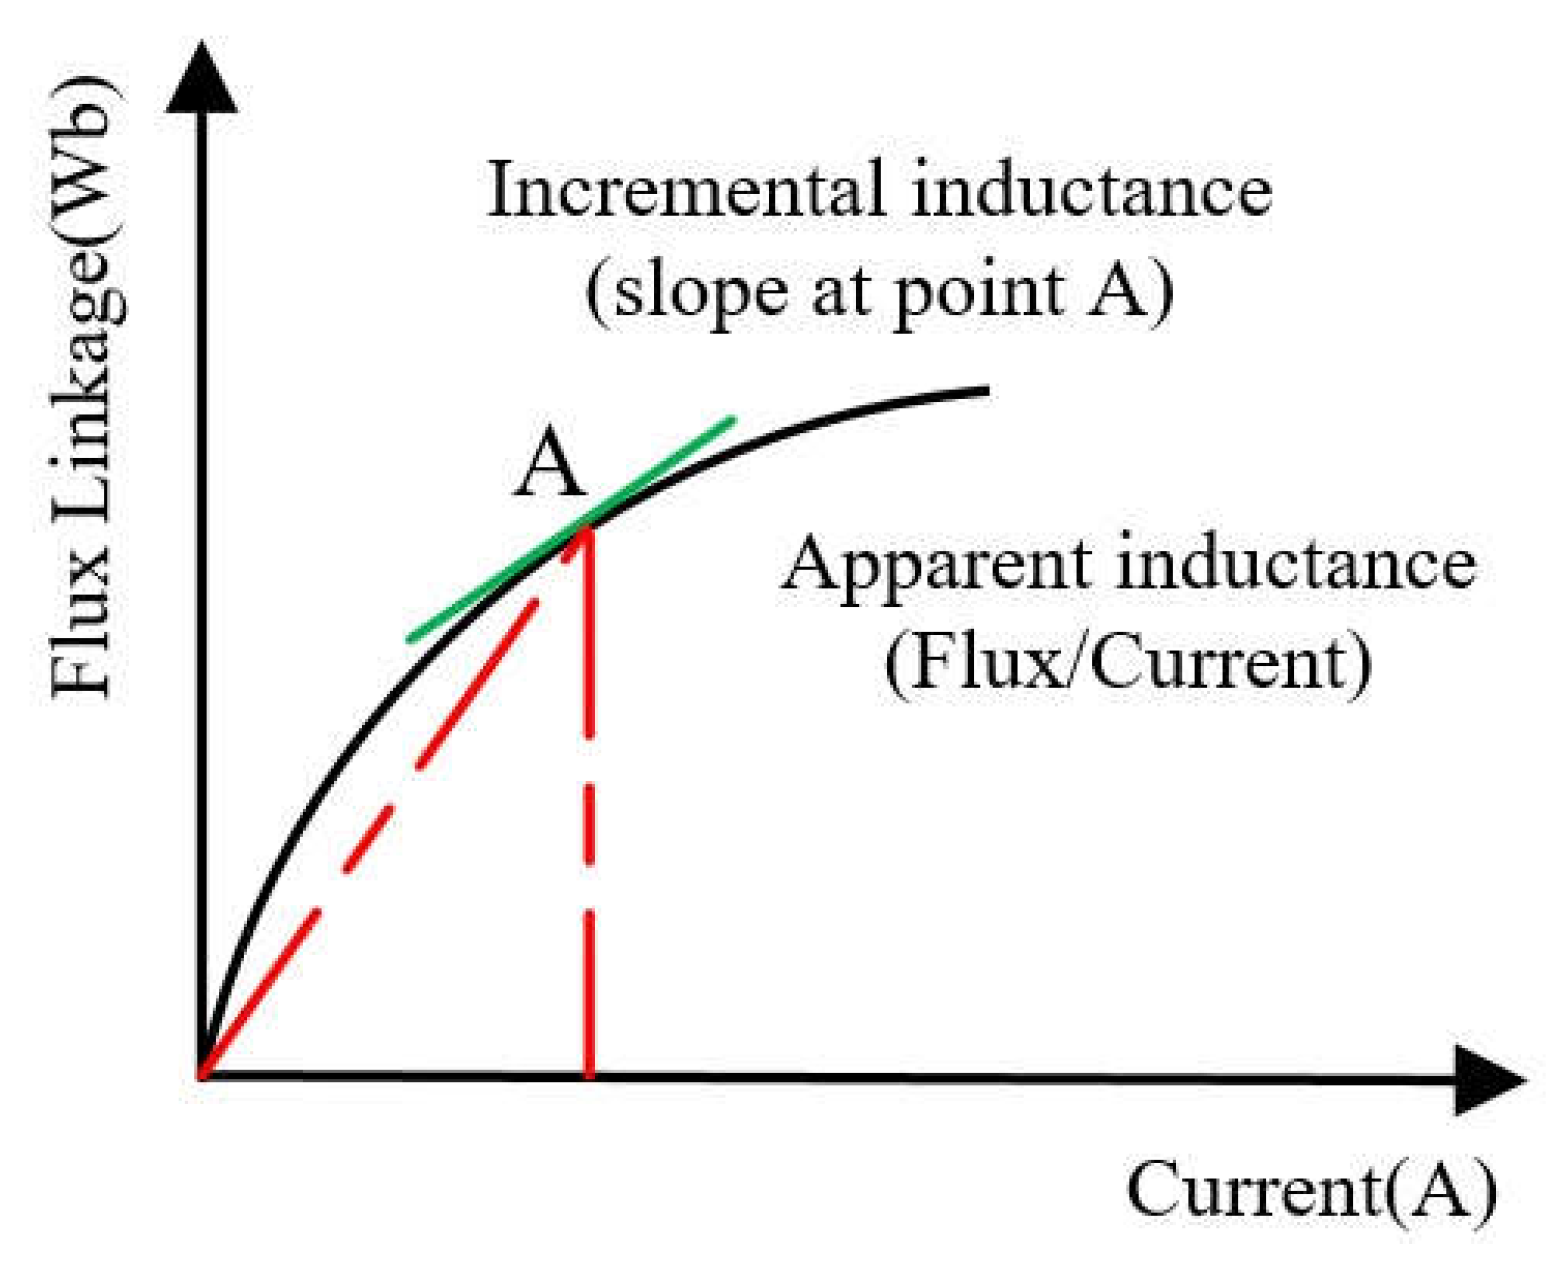
2.1. Incremental Inductance and Apparent Inductance
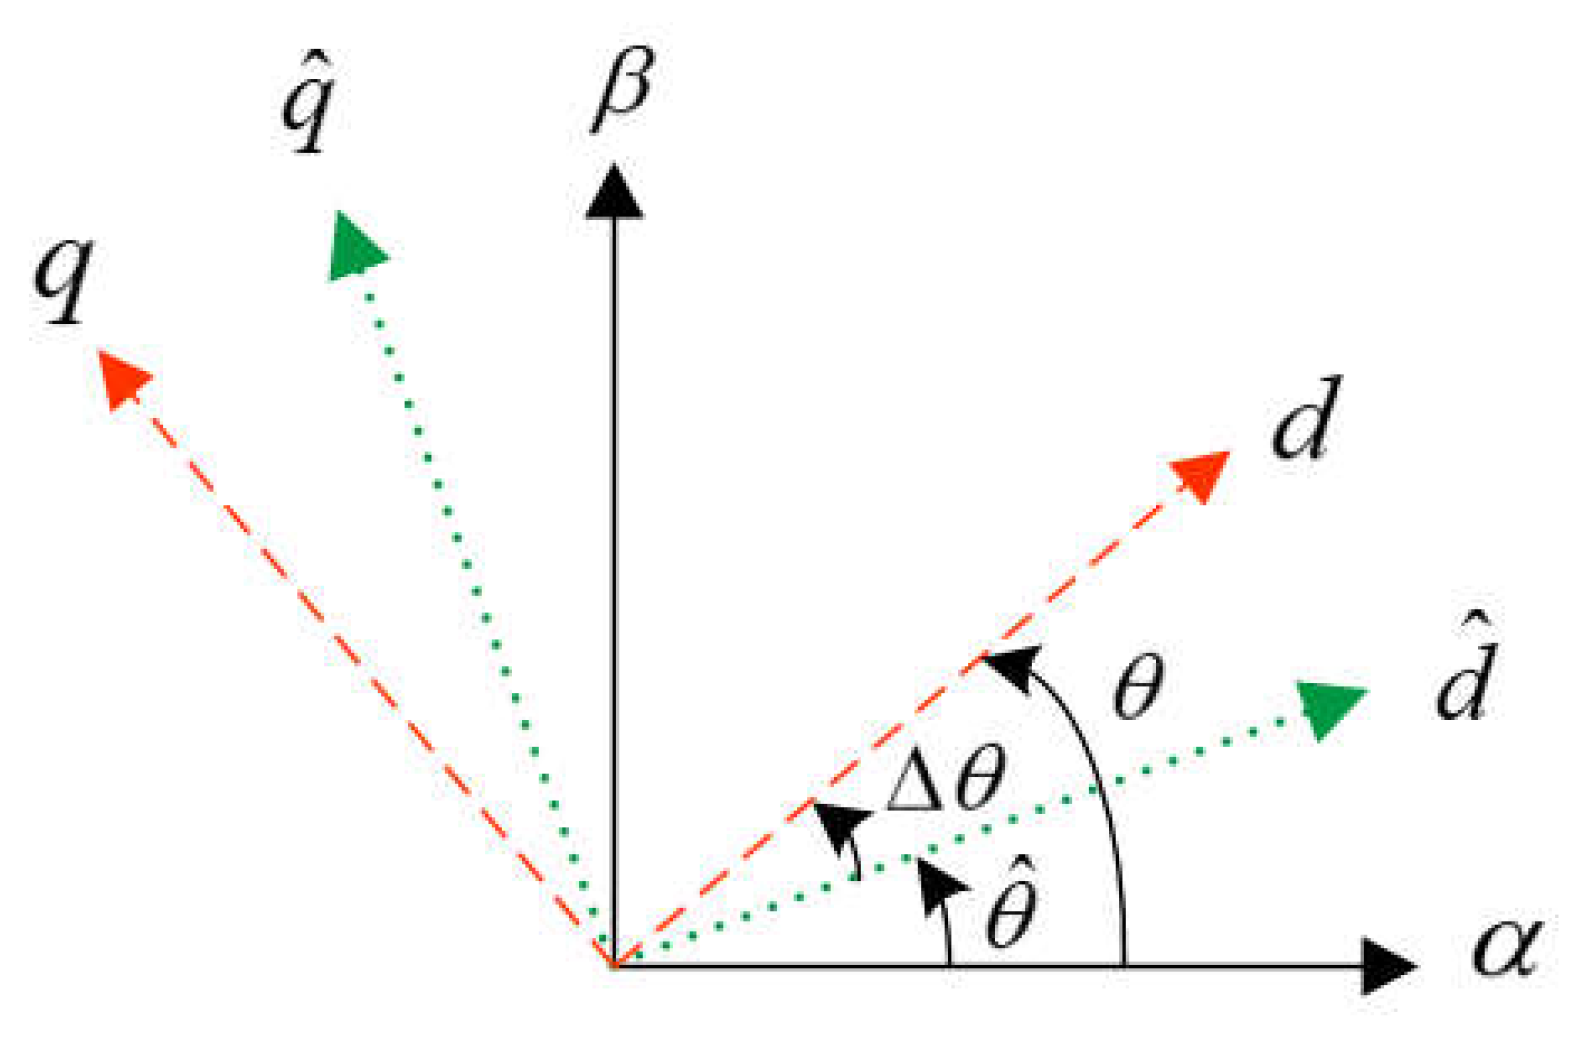
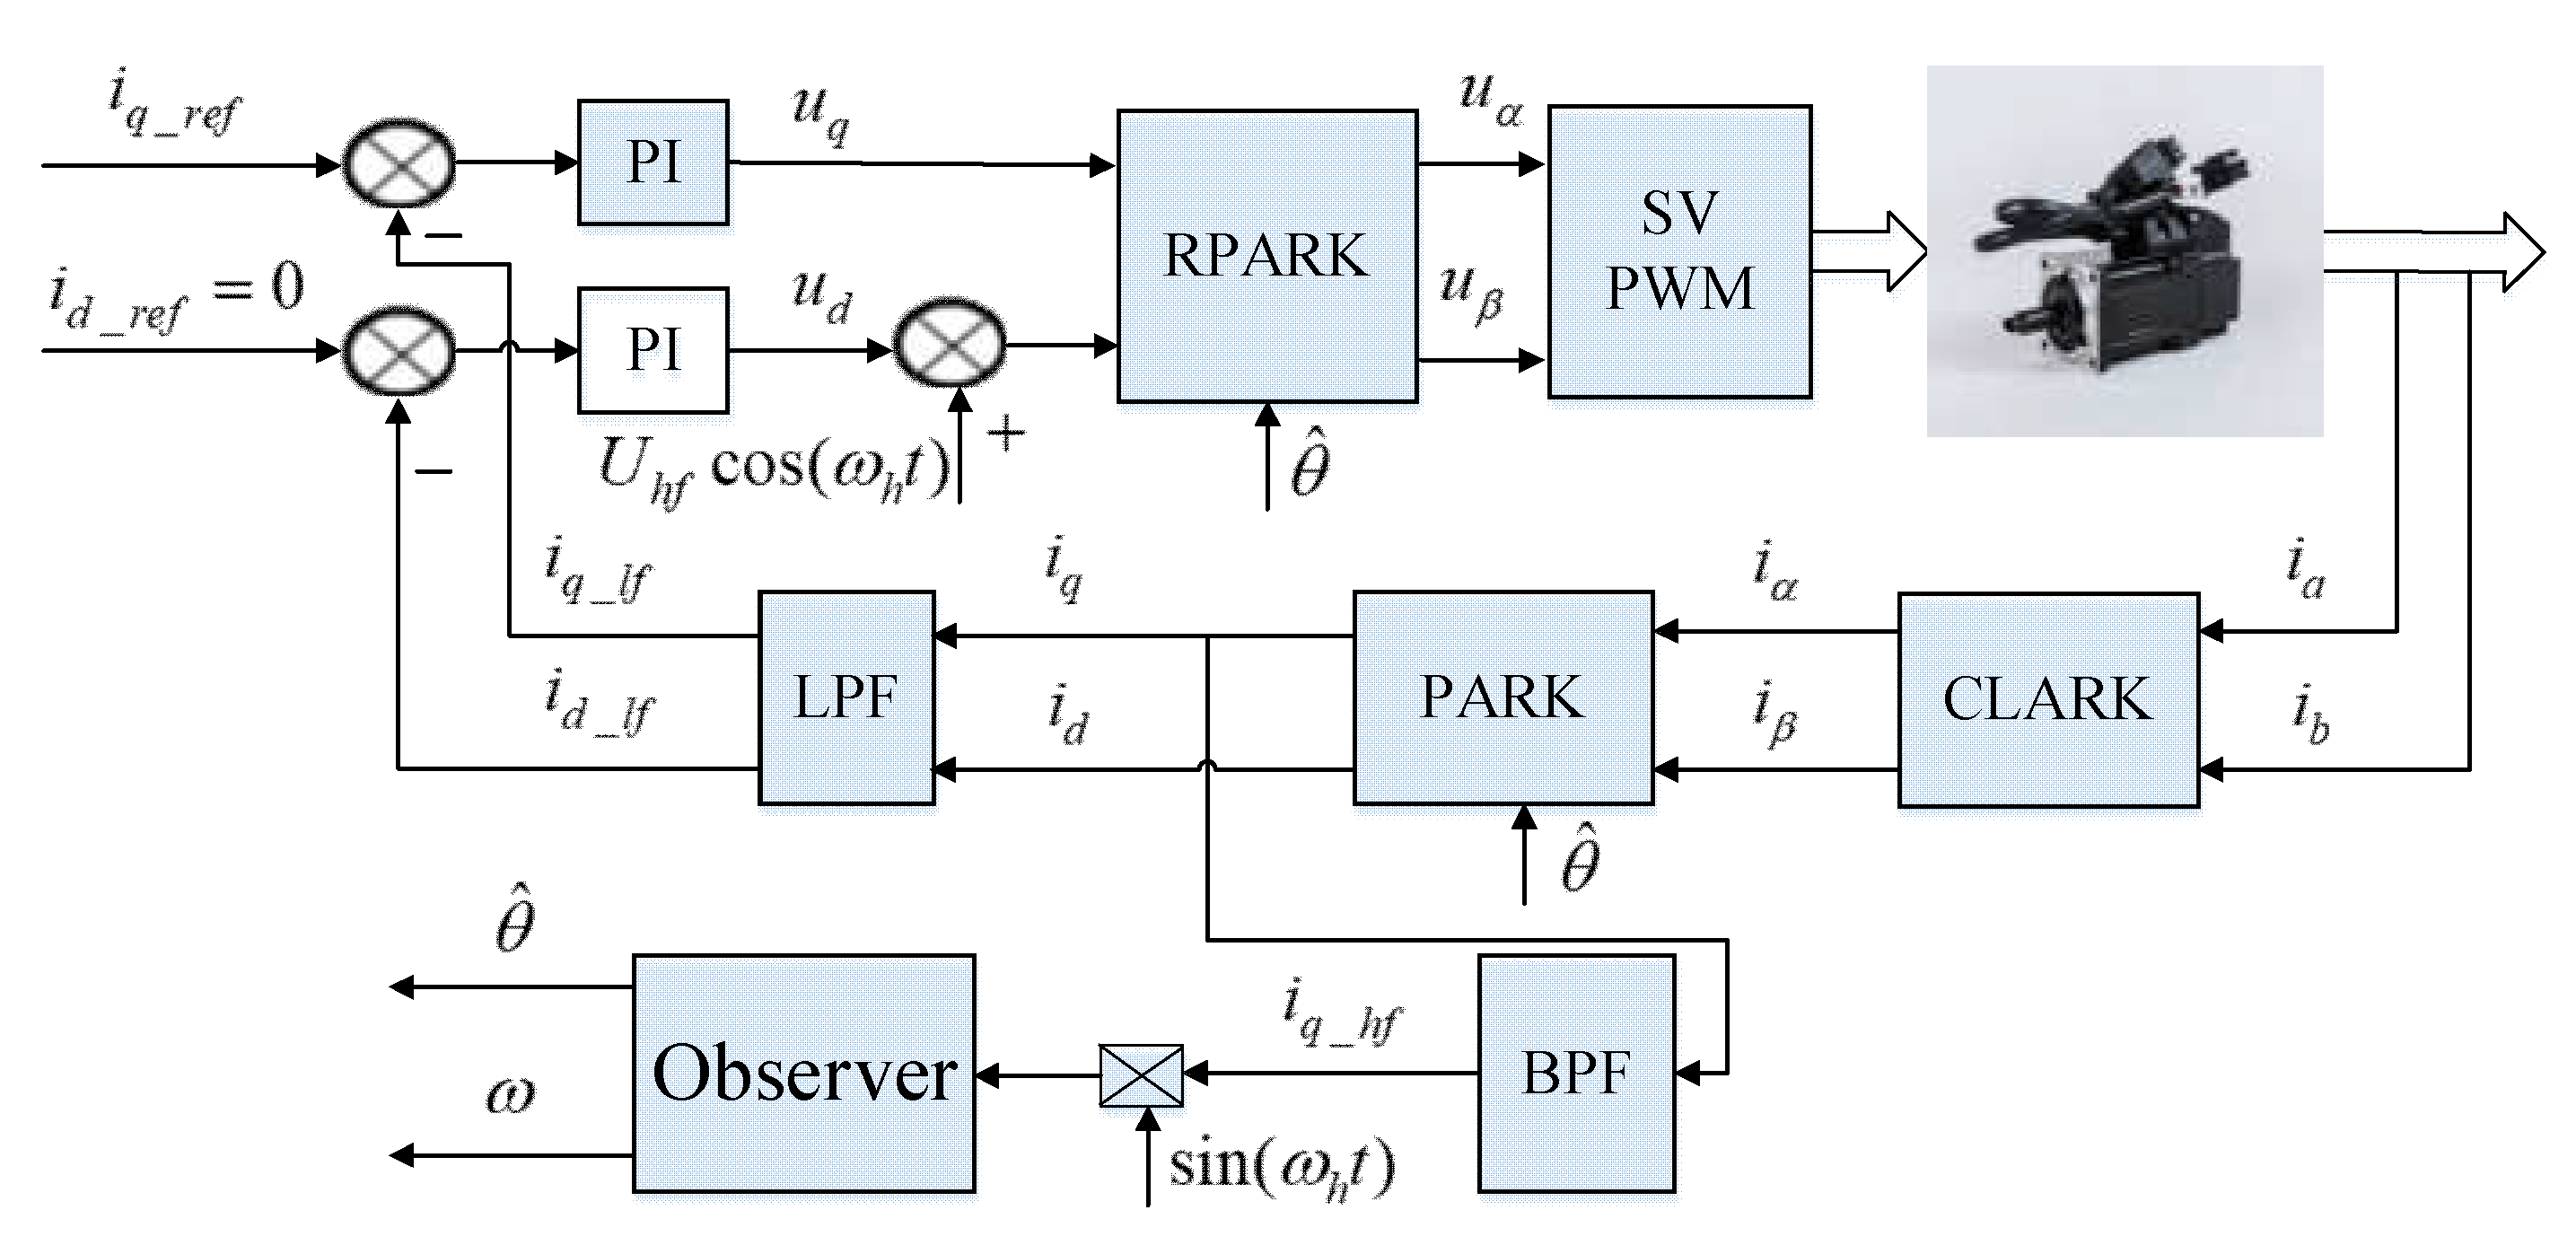
2.2. Conventional Pulsating High Frequency Voltage Injeciton Method
2.3. Issues of the Conventional Pulsating High Frequency Voltage Injeciton Method
- Saliency ratio is weak and it decreases with the increasing of load. There is no structure saliency for SPMSM, the saturation saliency is weak even HF voltage is injected. Saliency ratio may less than 1 when the motor is operating at heavy load status.
- Accuracy of position estimation is degraded due to the cross-coupling effect. Lots of research are carried out to compensate the estimation error due to cross-coupling effect. However, cross-coupling inductance is small and it varies with the increasing of load, the identification of cross-coupling inductance is not easy.
3. The Proposed Sensorless Capability Expansion Method
3.1. Inductance Parameter Identification
3.1.1. Incremental Inductance Identification
3.1.2. Apparent Inductance Identification
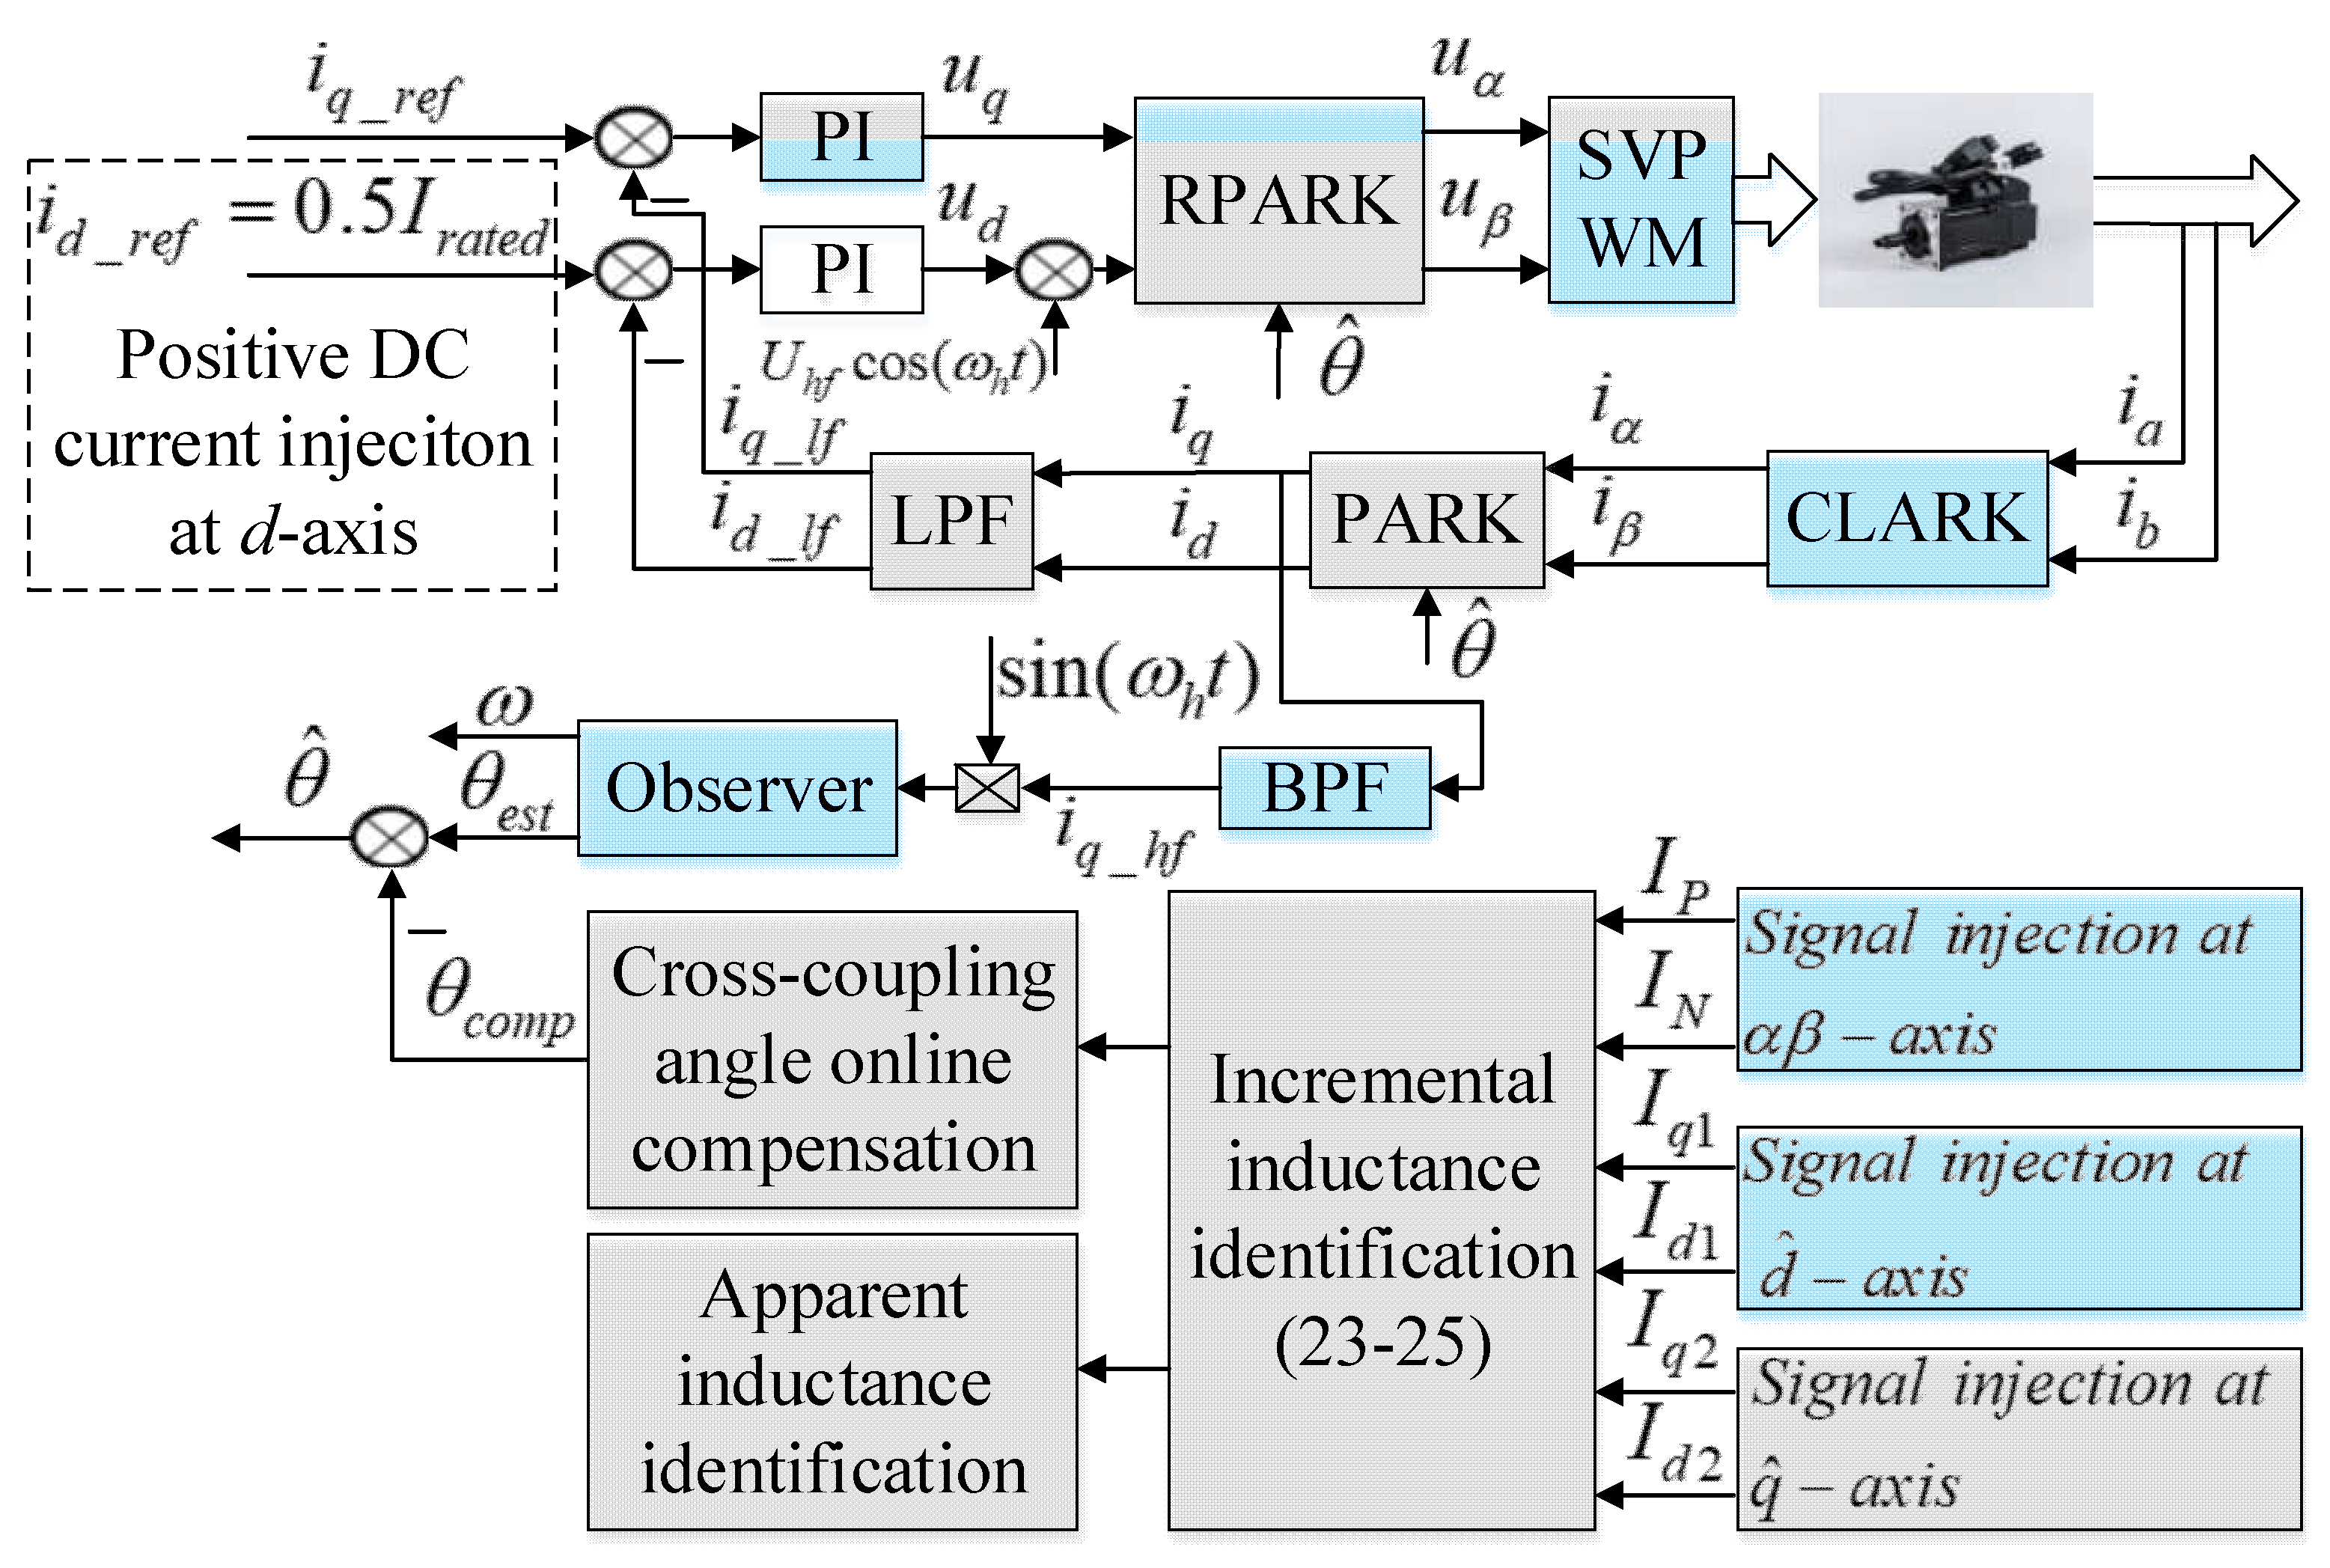
3.2. Sensorless Capability Expansion
4. Experimental Verification
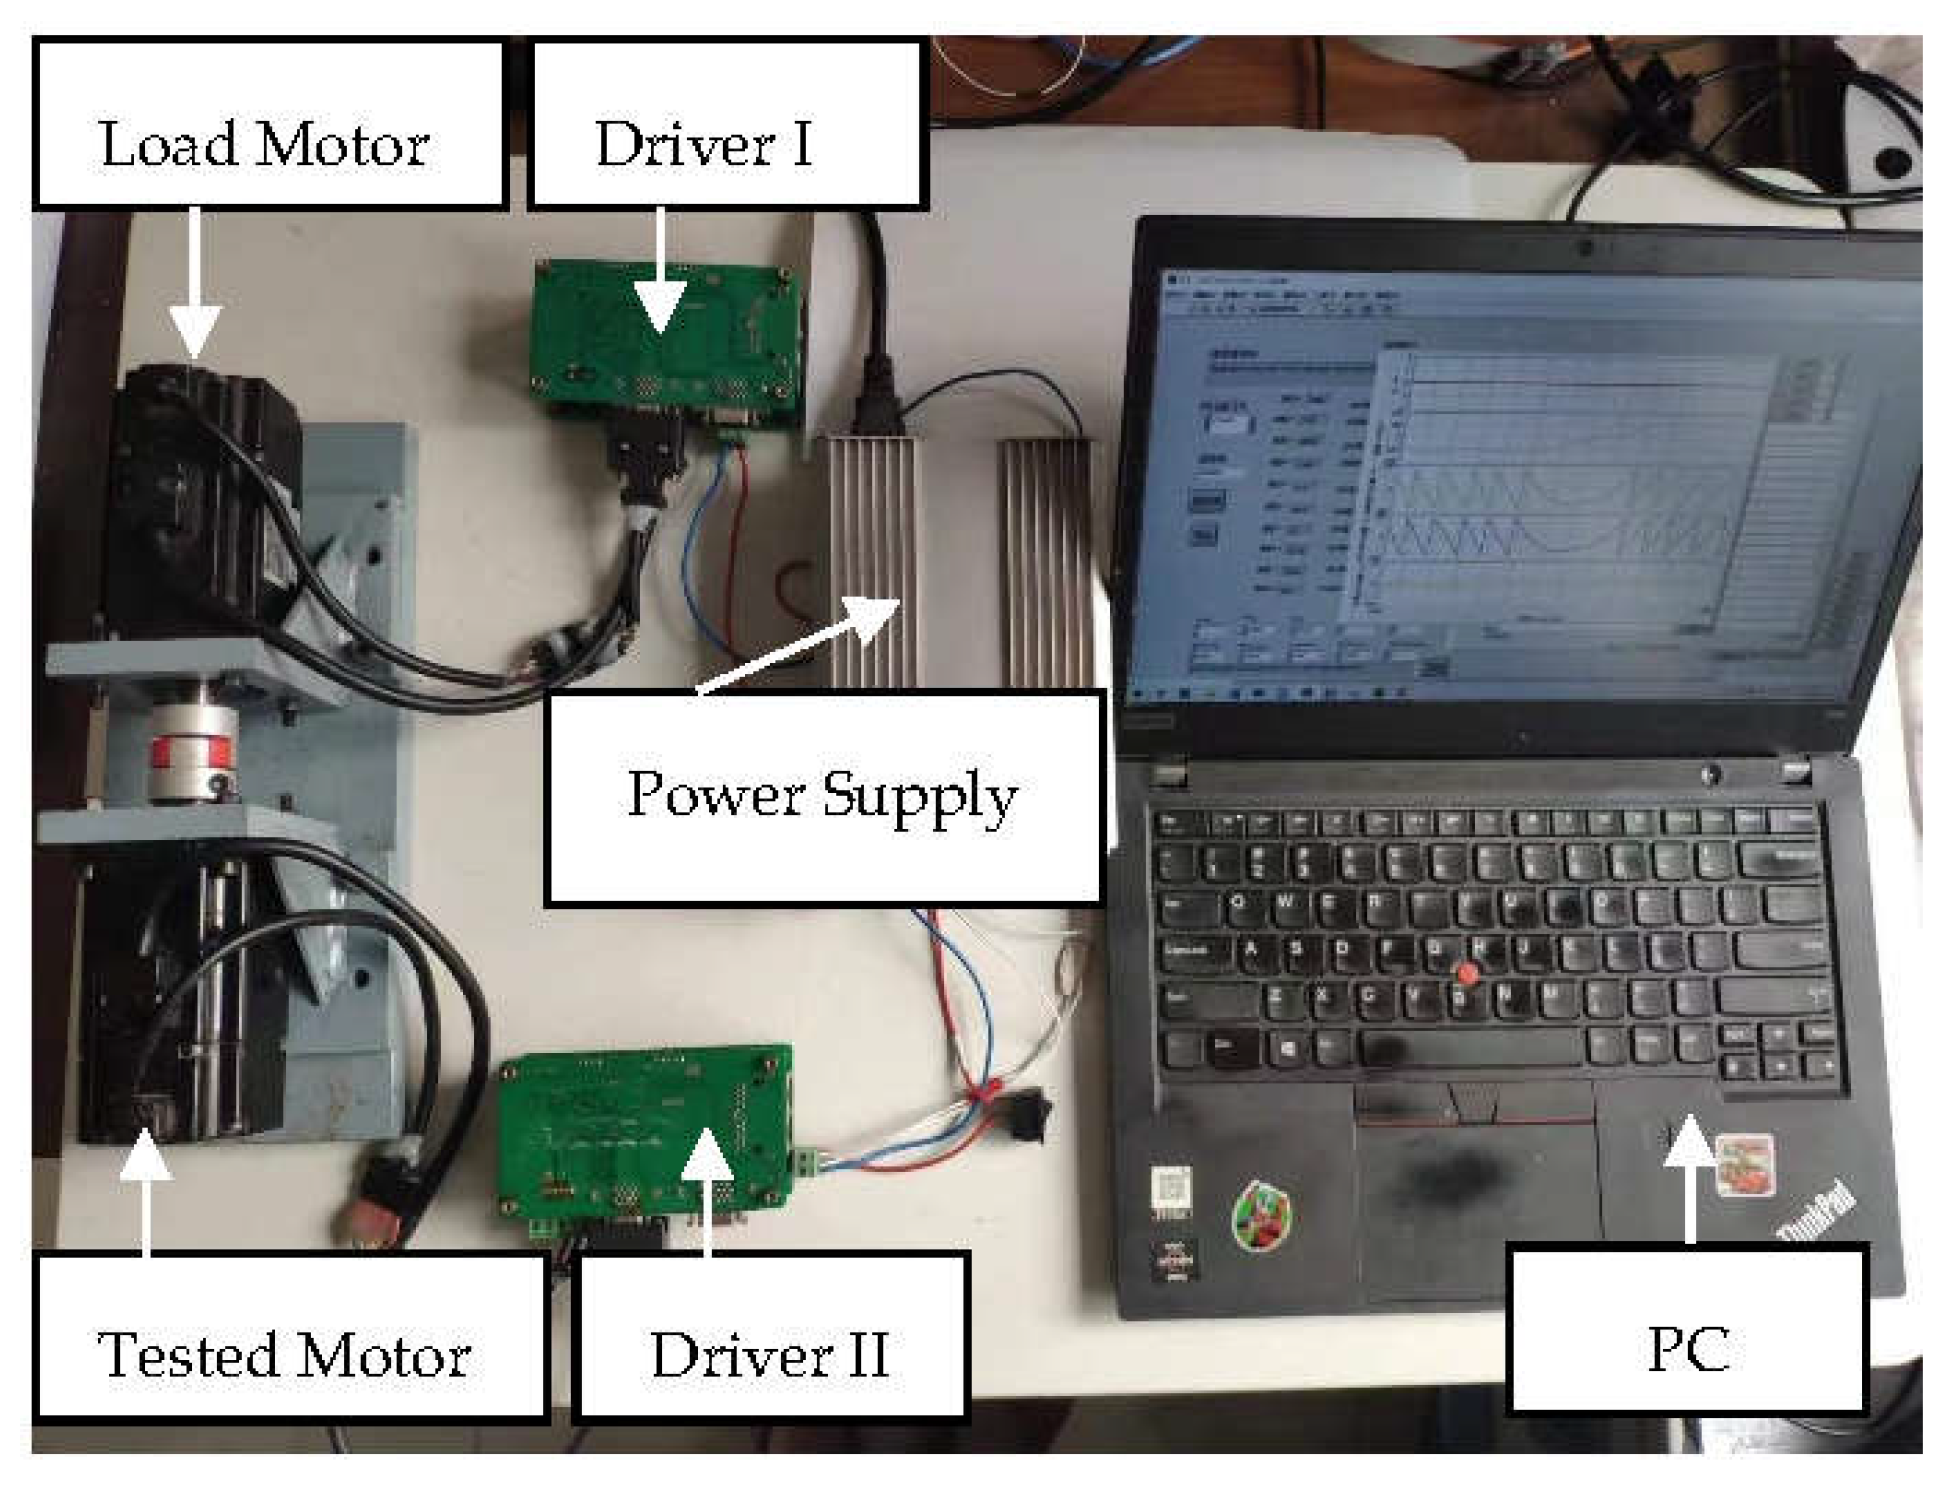
4.1. Experimental Platform
4.2. Inductance Papameters Indetification
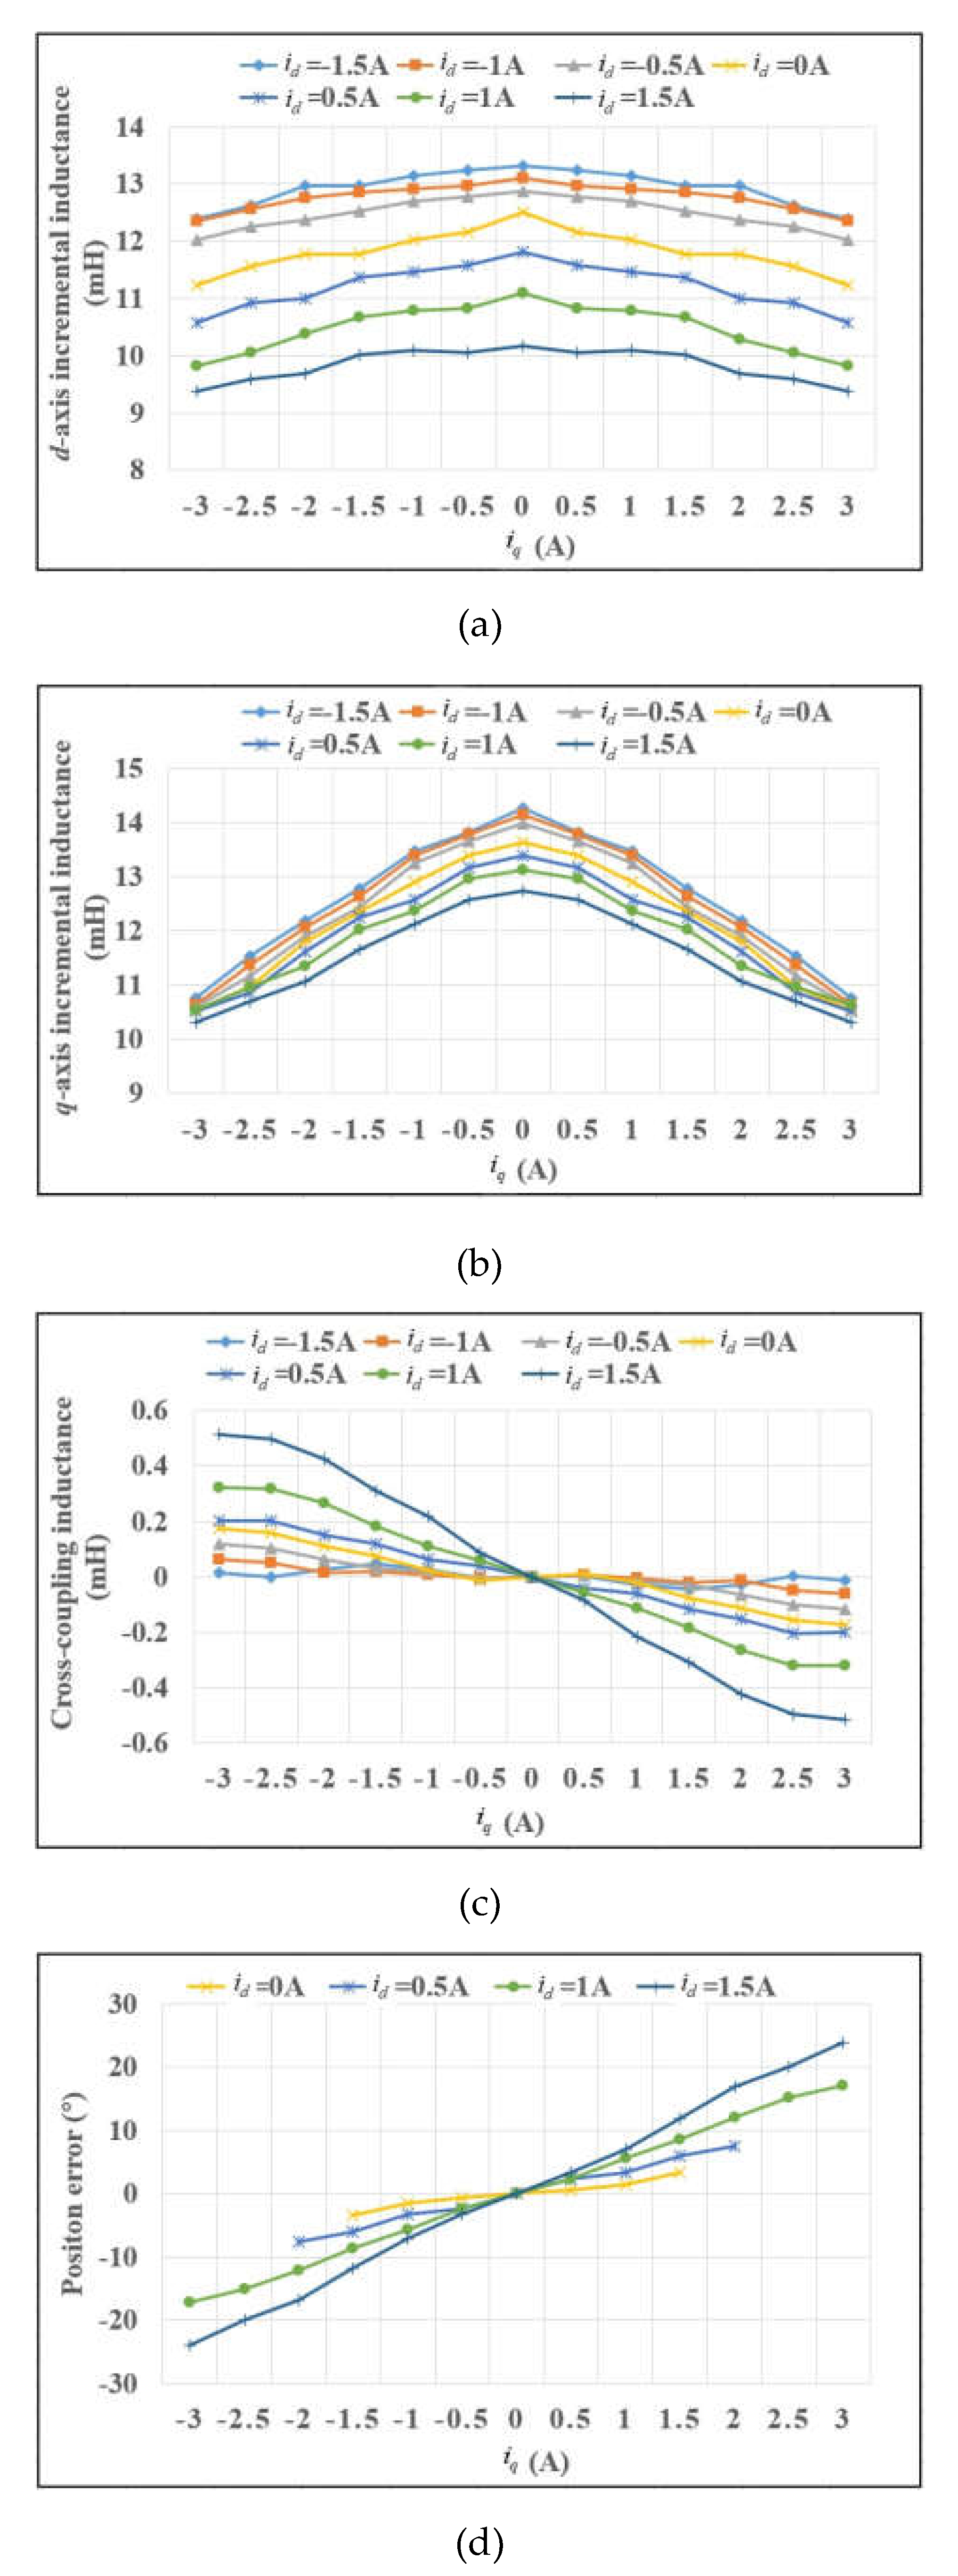
4.2.1. Incremental Inductance Identification
4.2.2. Apparent Inductance Identification
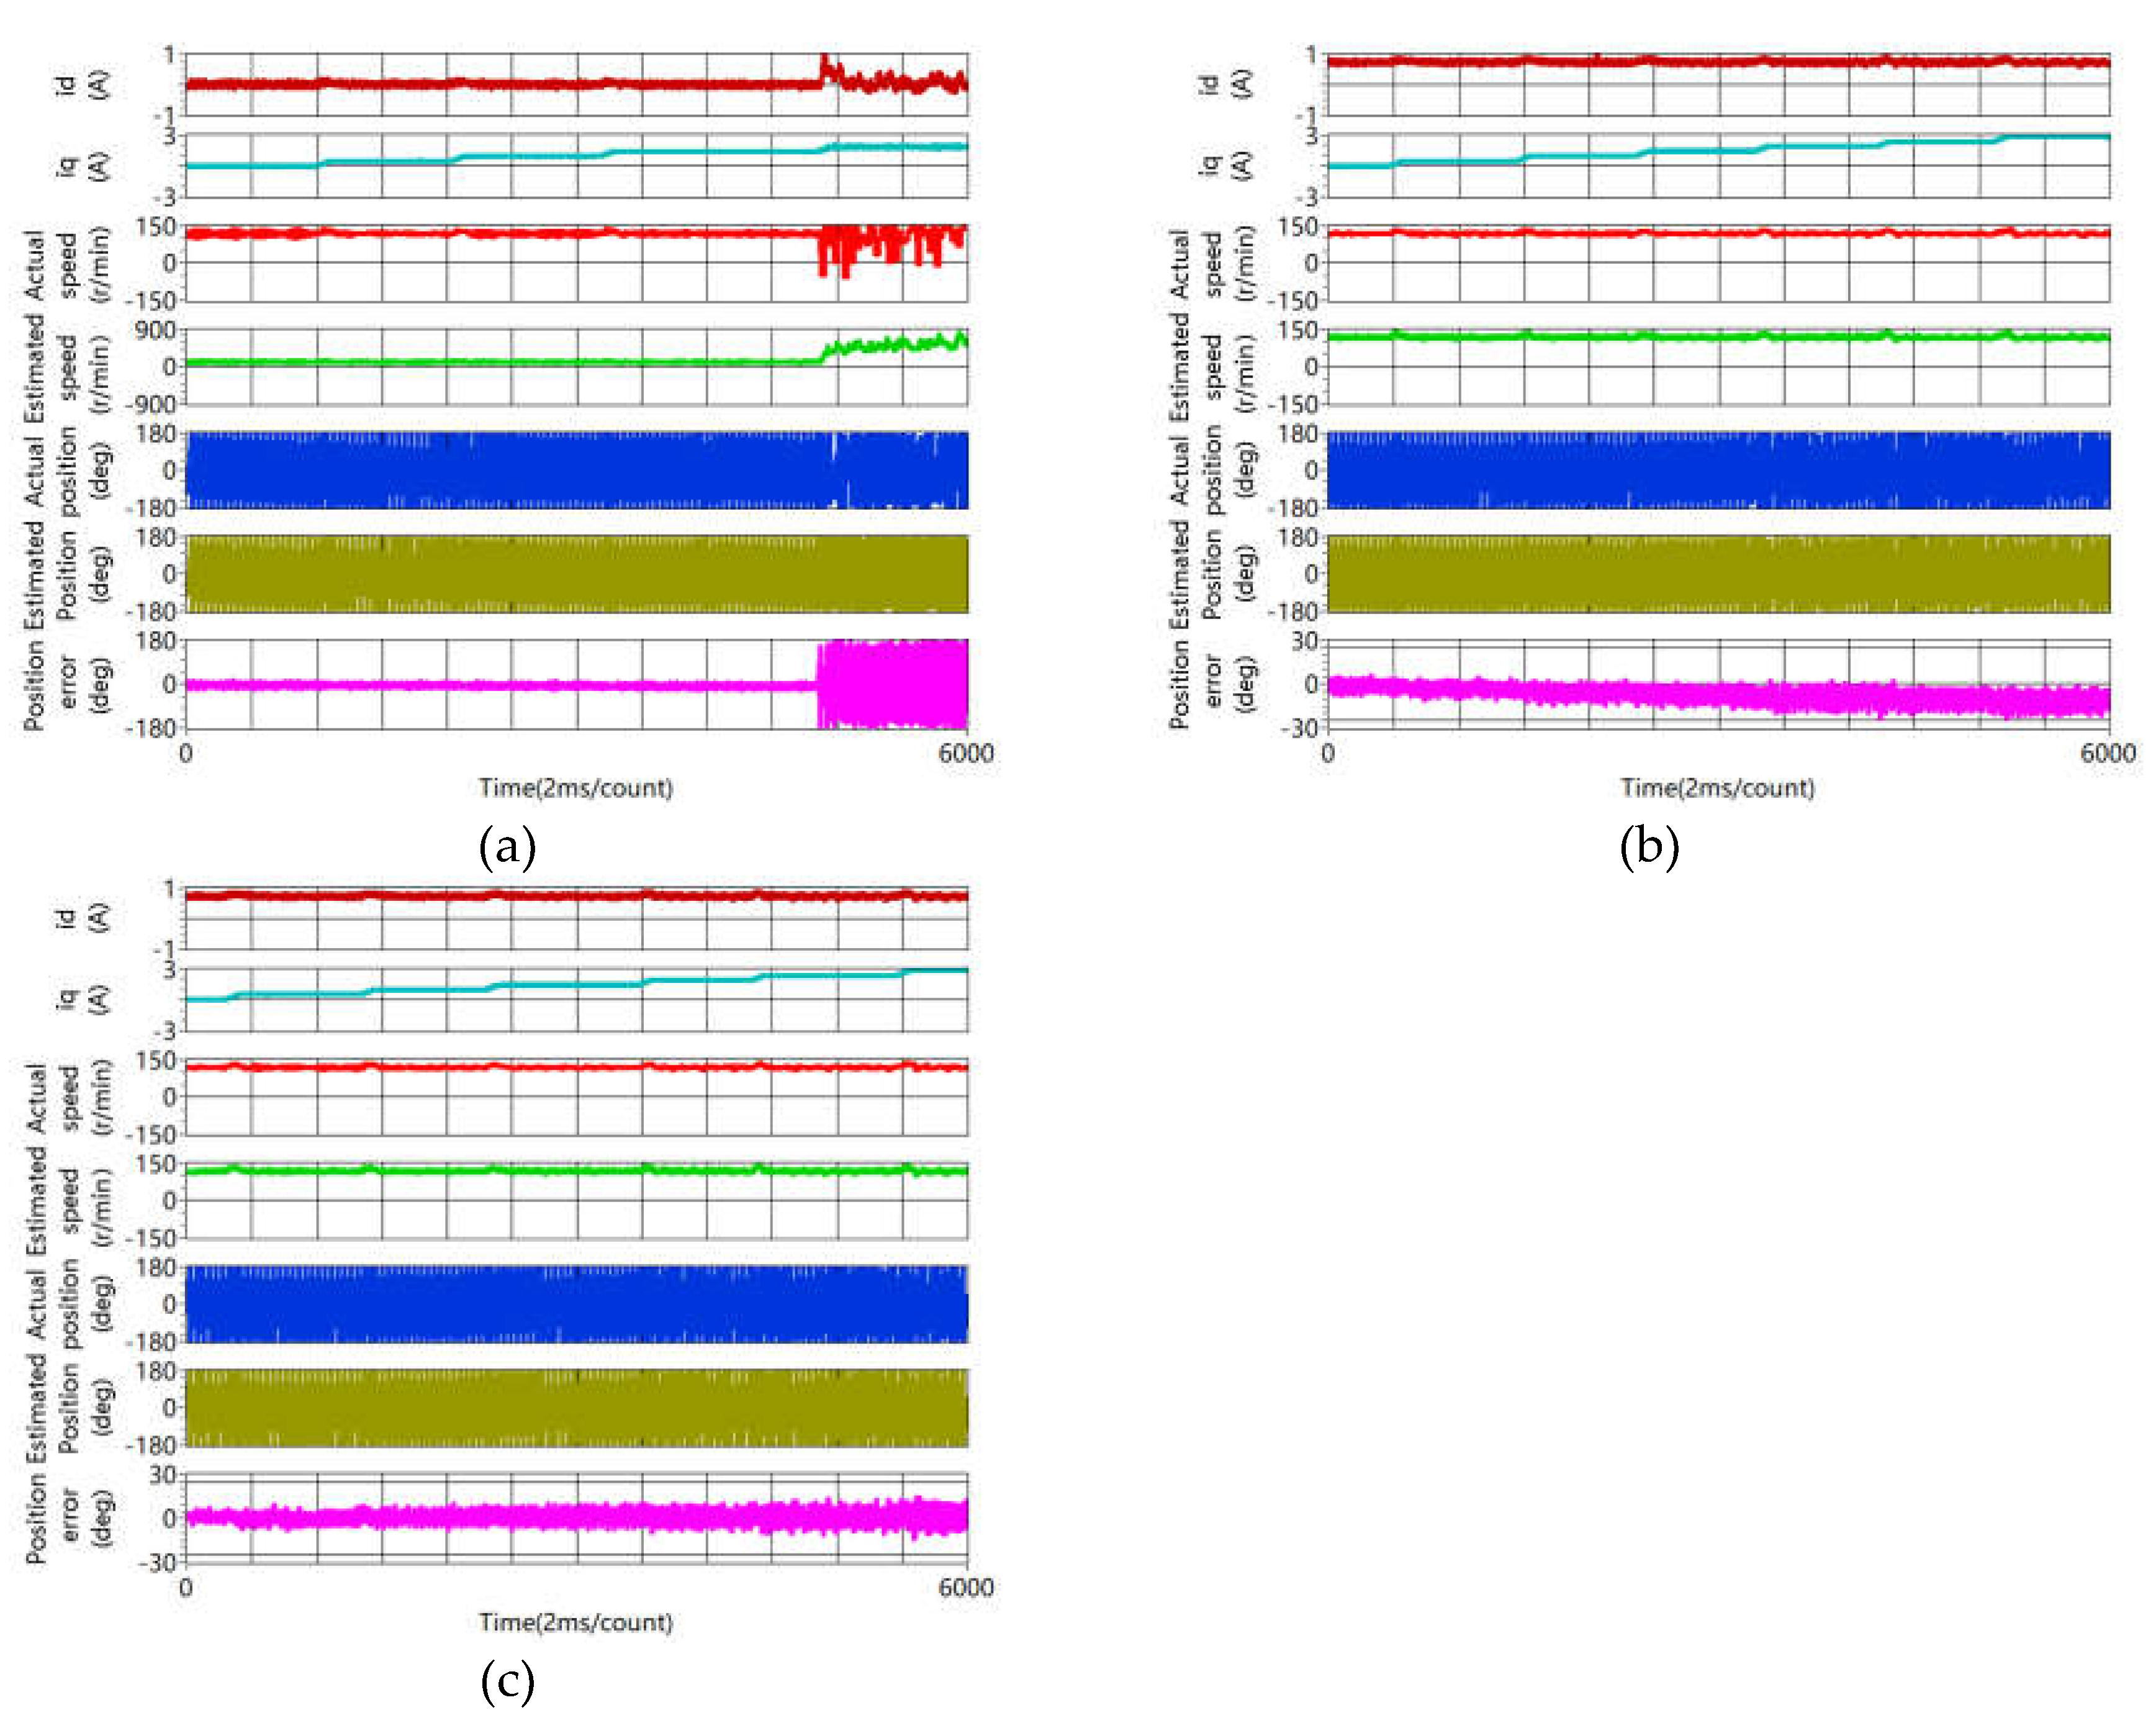
4.3. Sensorless Capability Expansion Performance
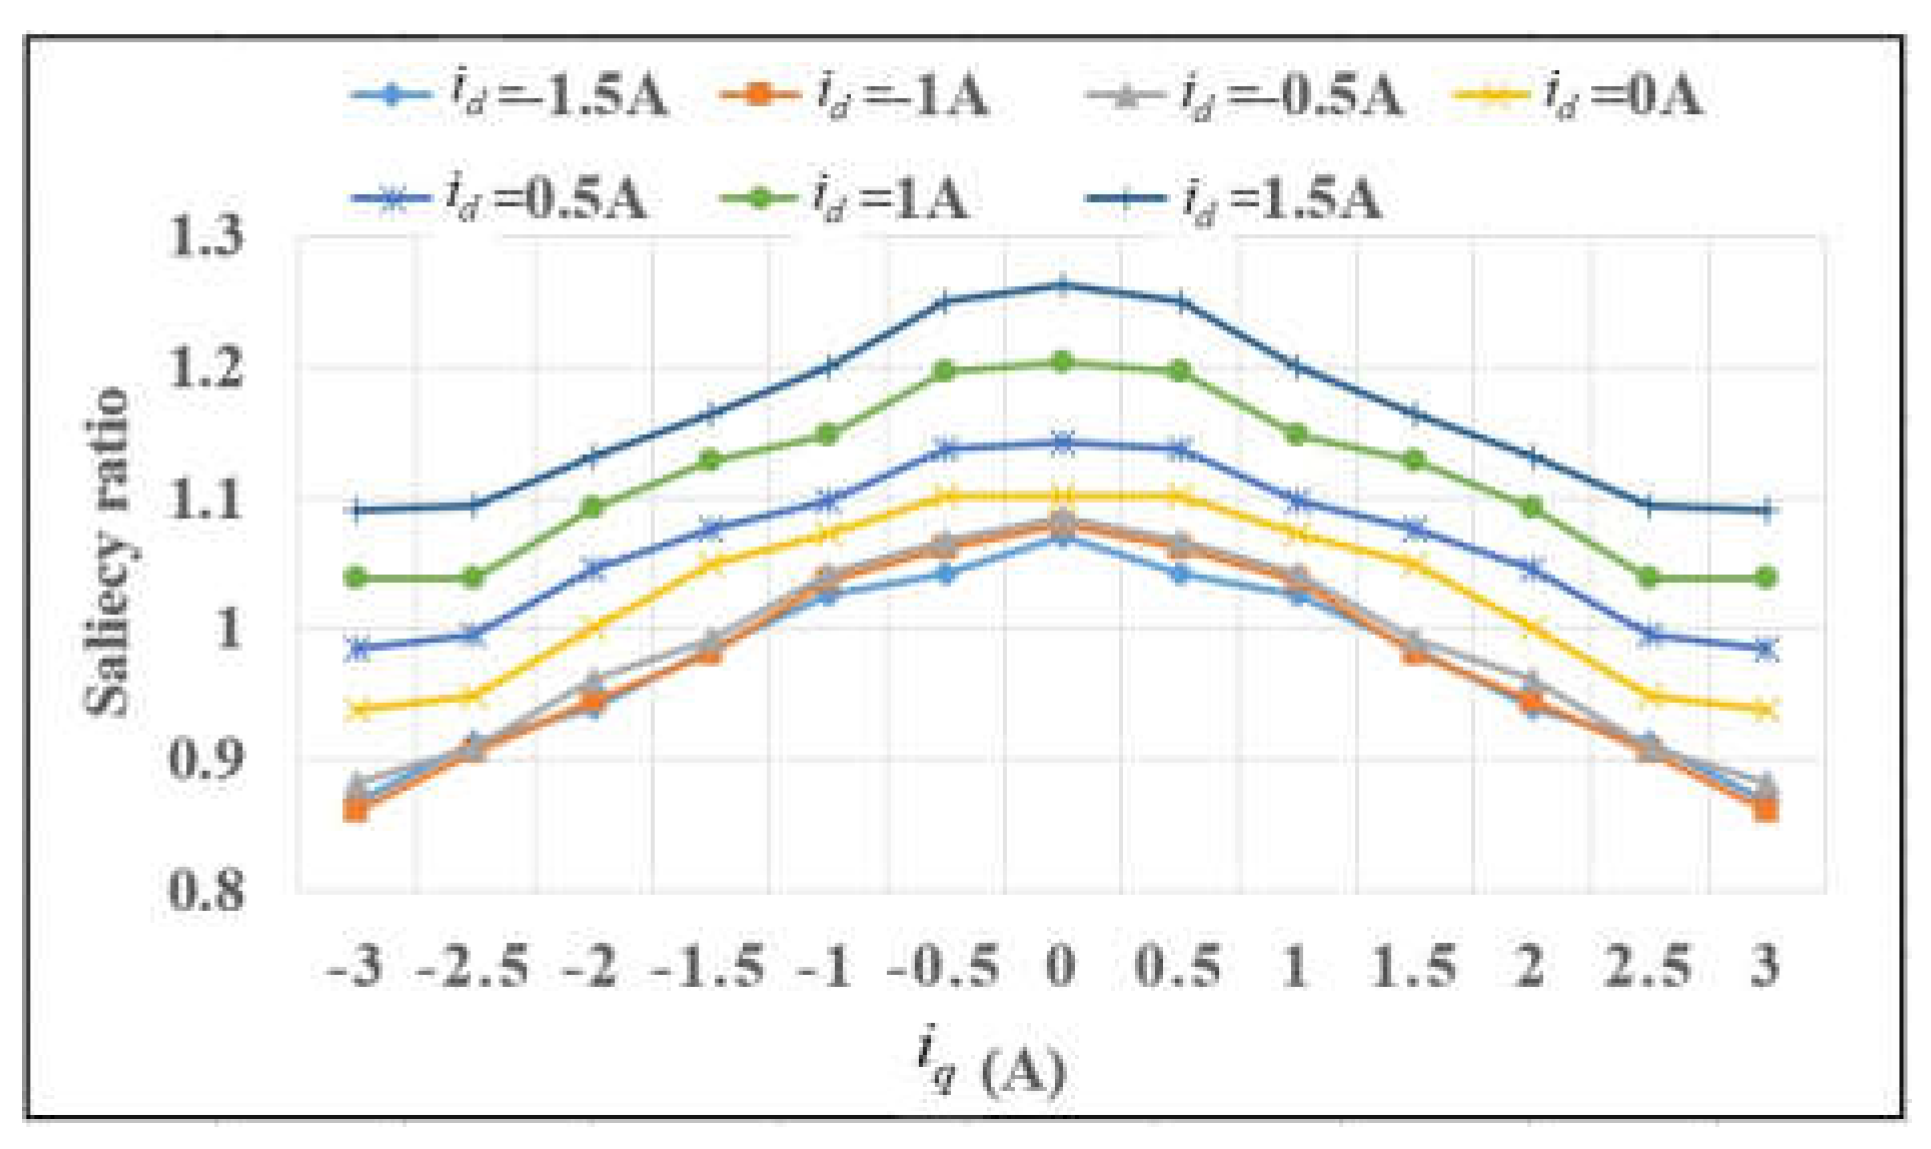
4.3.1. Saliency Ratio Improvement
- Saliency ratio decreases as increases. This is because is more sensitive than to the variation of . Saliency ratio is less than 1 at severe cases.
- Saliency ratio can be enhanced when positive DC current is injected into d-axis. Take (130% rated current) as example, using the conventionalor method, Saliency ratio is less than 1, it can be predicted that the HF voltage injection method would fail at these situations. On the contrary, saliency ratio gradually increases with the positive value of . Saliency ratio reaches 1.13 when .
4.3.3. Accuracy of Rotor Position Estimation Improvement
5. Conclusions
- Incremental inductances are identified by three steps combining the rotating high frequency voltage injection and pulsating high frequency voltage injection. Then, polynomial curve fitting algorithm is proposed for apparent inductances identification.
- Saliency ratio is enhanced by injecting positive DC current into d-axis. Comparing with the conventional or method, the saturation level at d-axis is enhanced and saliency ratio is improved obviously.
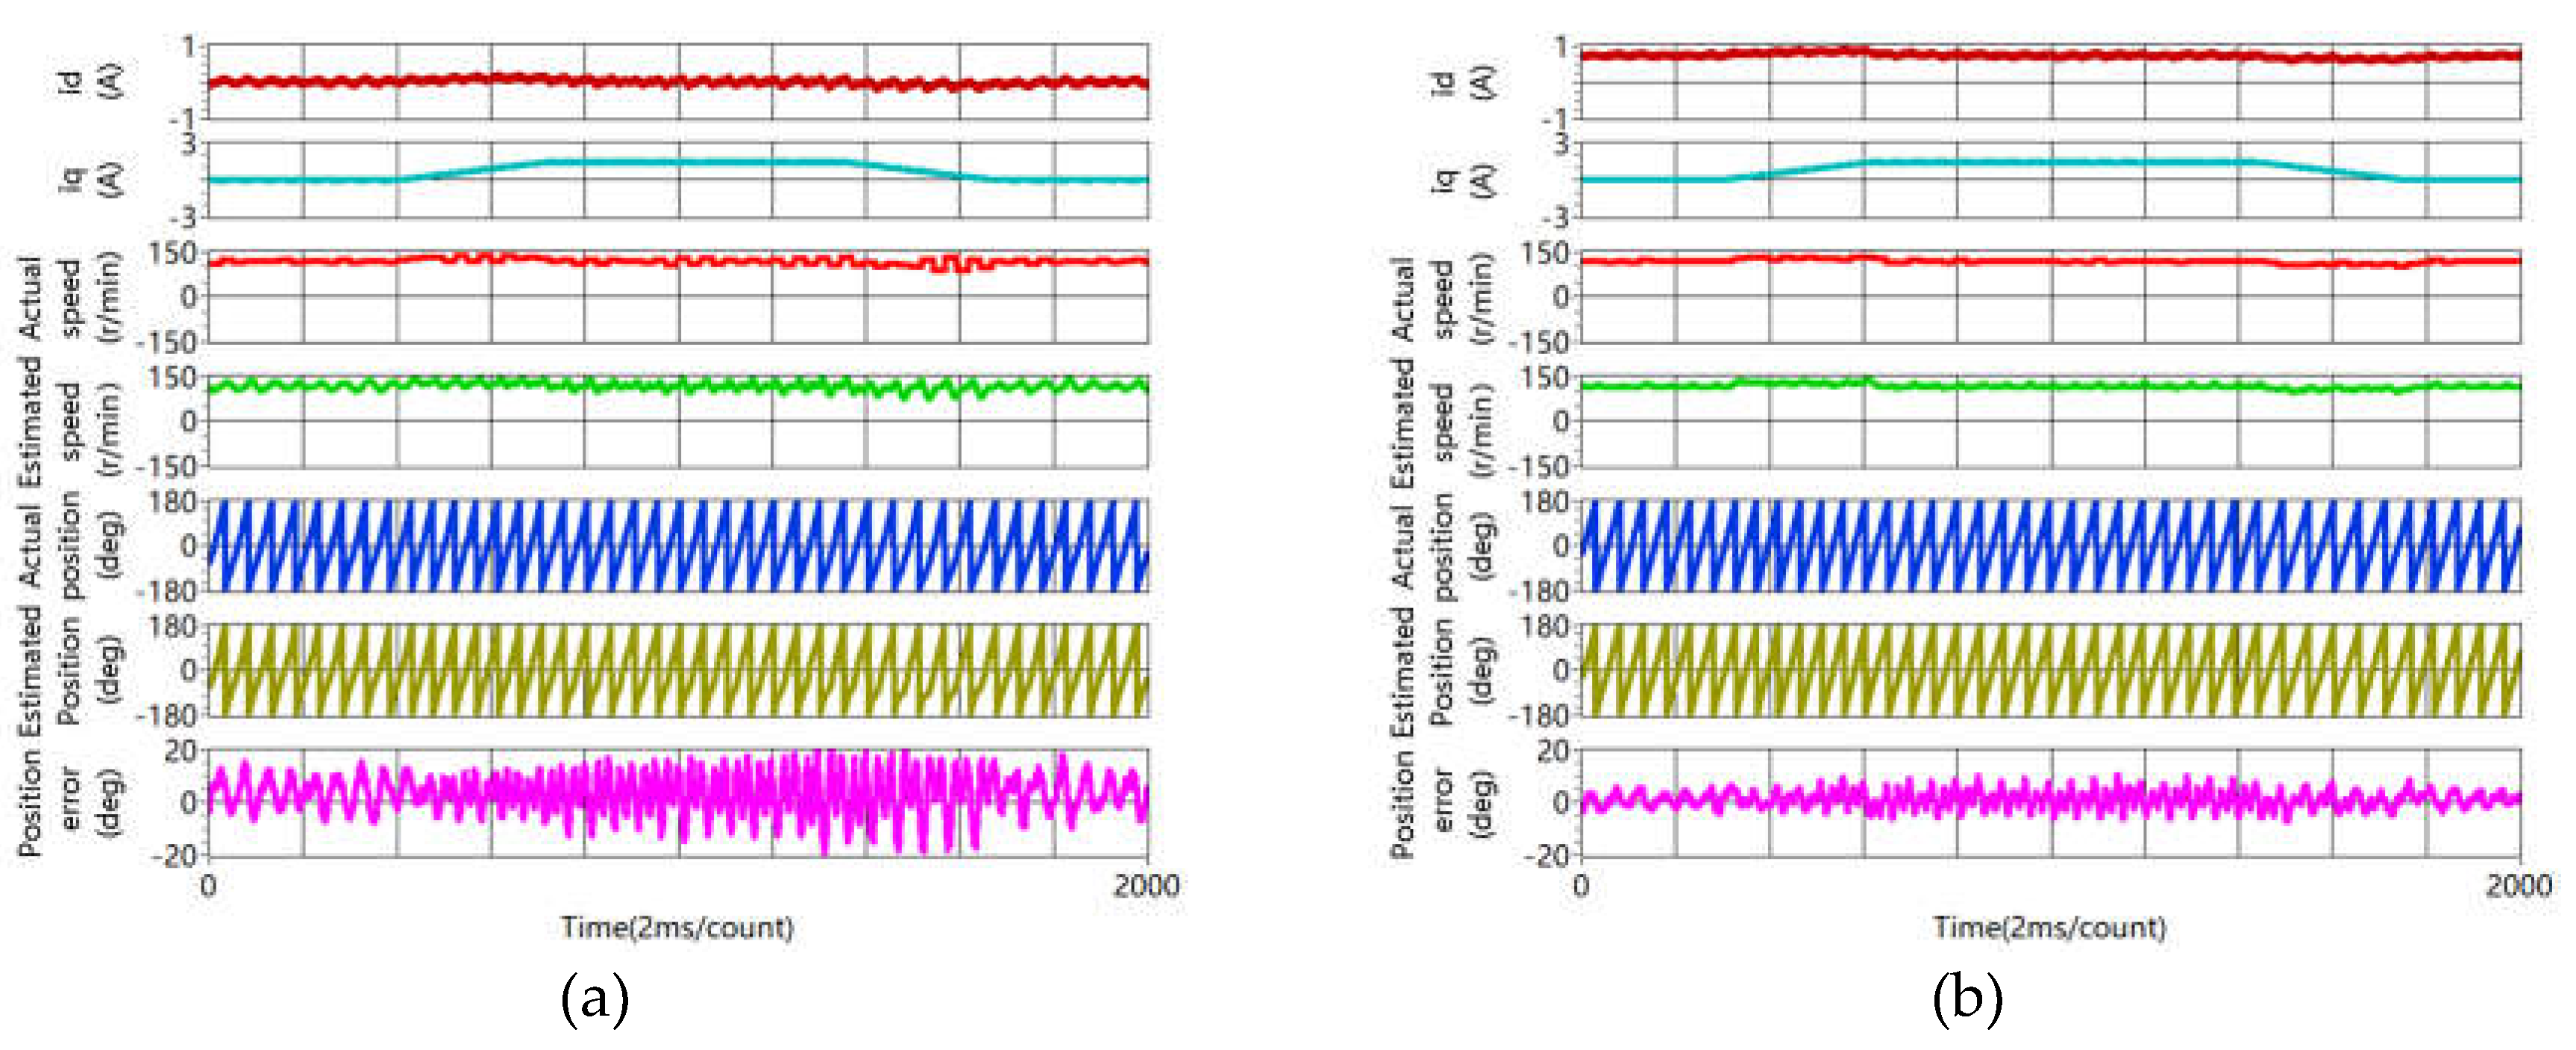
- Convergence region of pulsating high frequency voltage injection method is expanded at heavy load status. Using the conventional method, the sensorless control method fails at 120% rated current. On the contrary, using the proposed method, the rotor position estimation works well at 200% rated current.
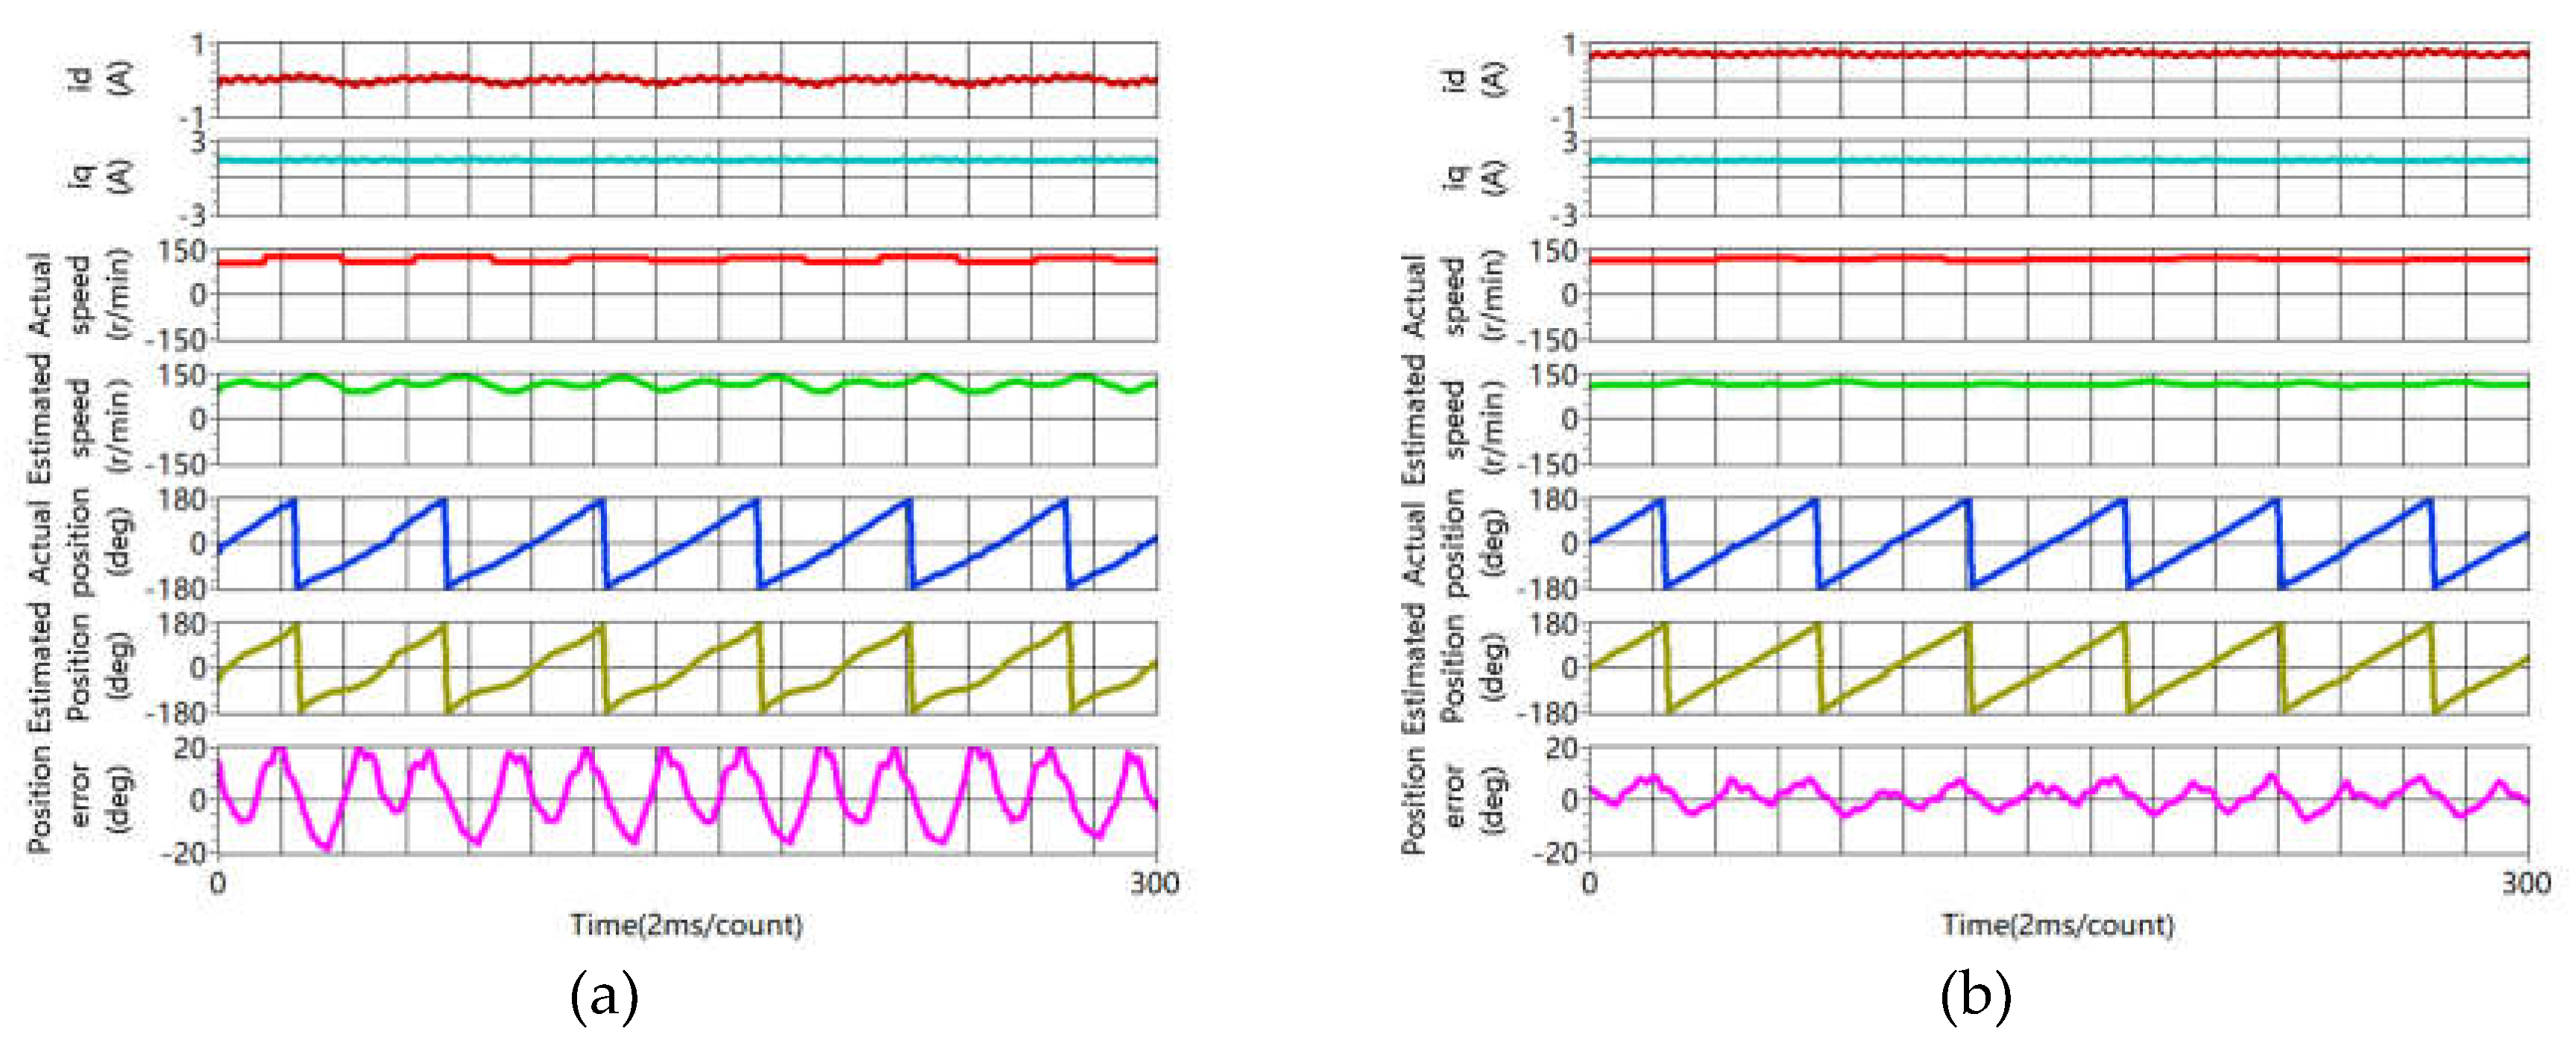
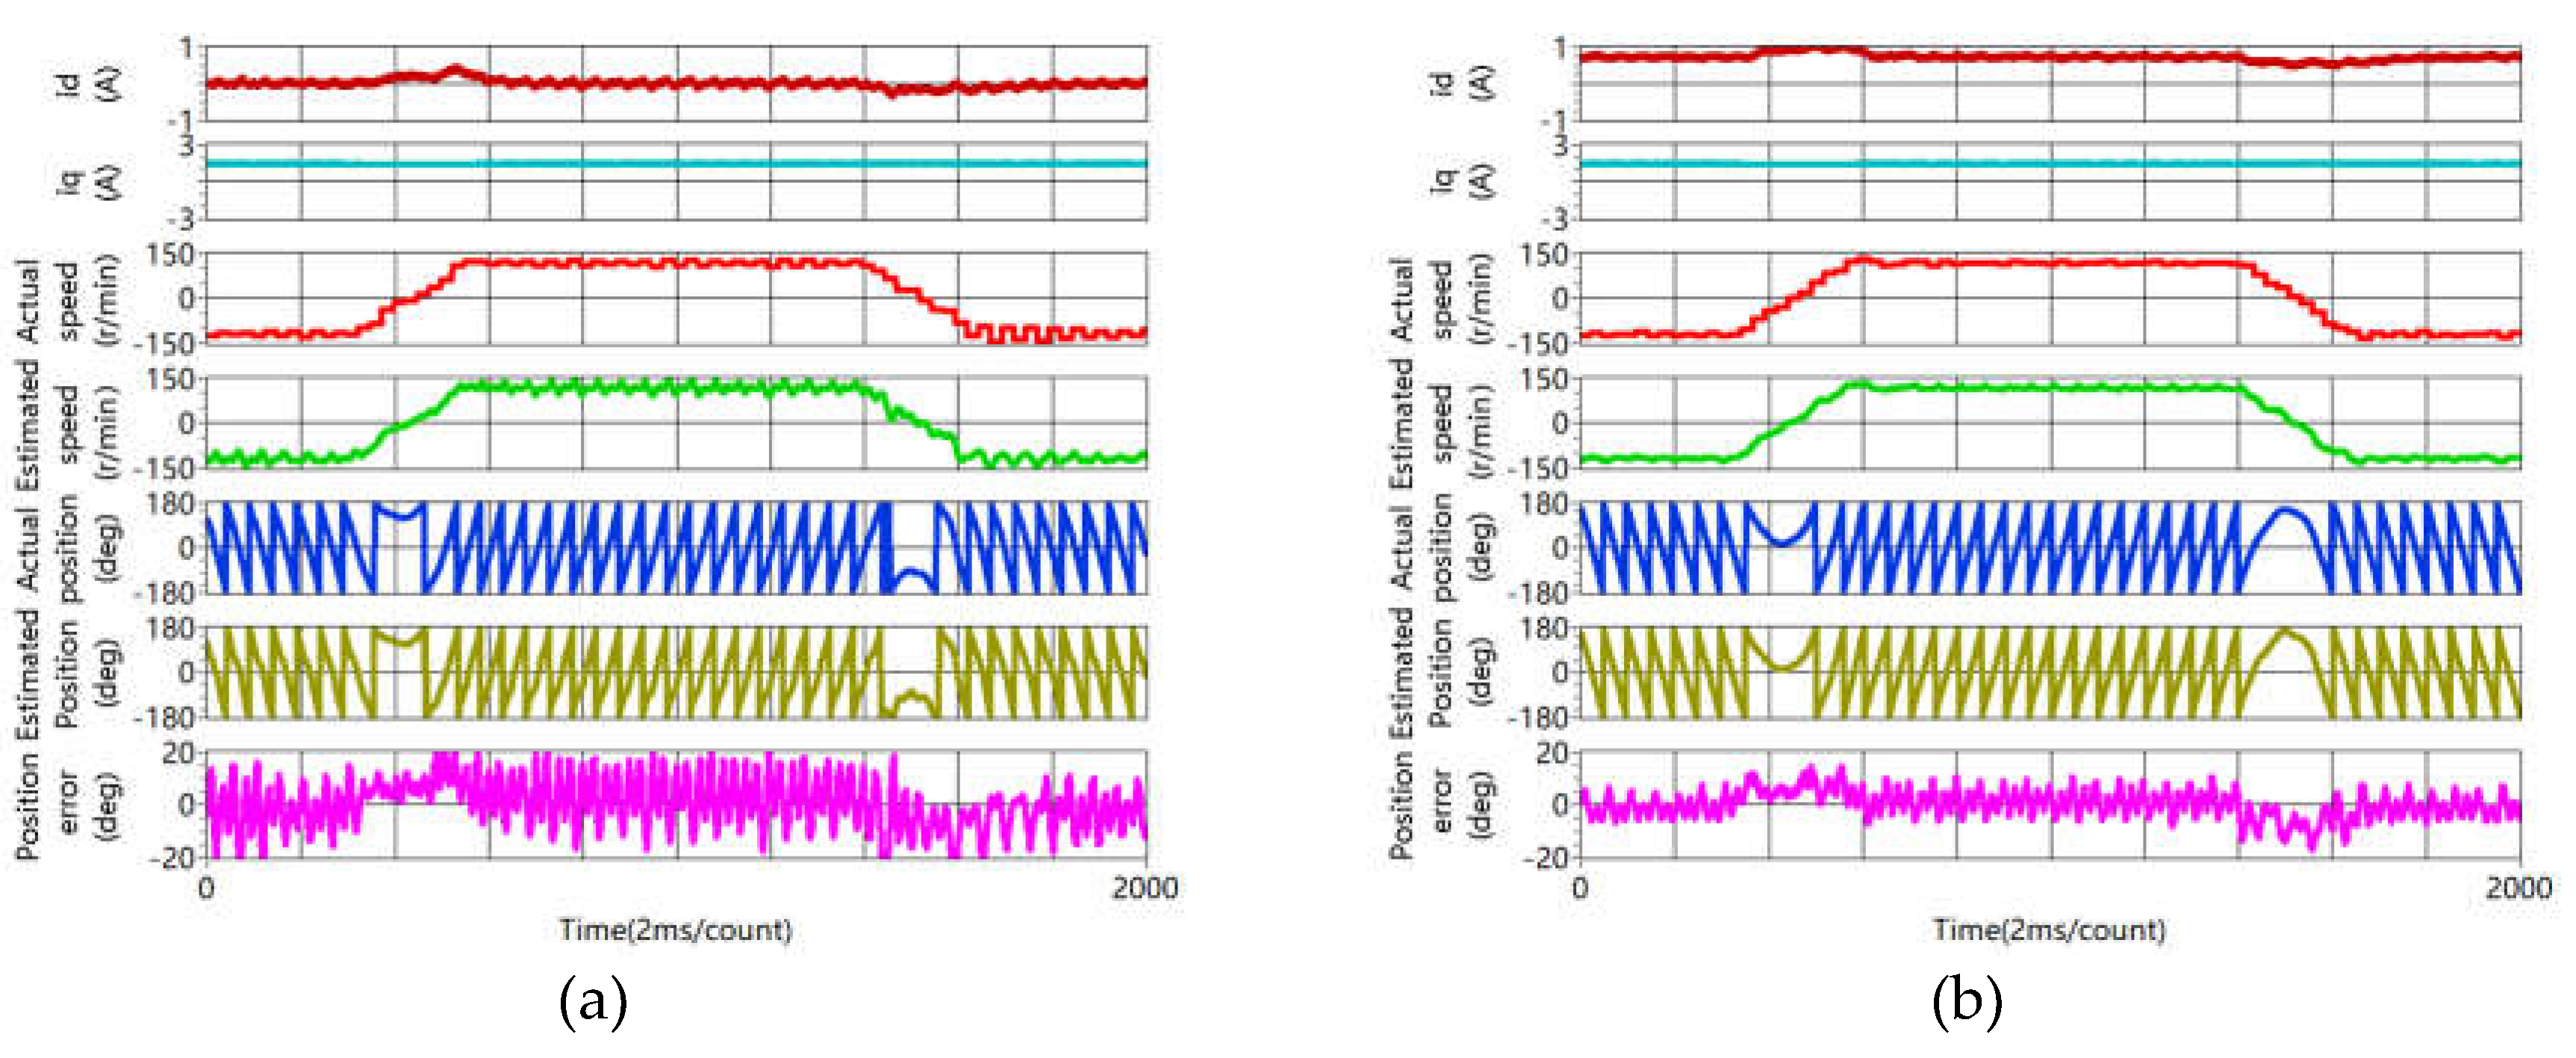
- Experiment results show that accuracy of rotor position estimation is improved obviously at steady and during the dynamic process.
Author Contributions
Funding
Data Availability Statement
Conflicts of Interest
References
- Berto, M.; Alberti, L.; Manzolini, V.; Bolognani, S. Computation of Self-Sensing Capabilities of Synchronous Machines for Rotating High Frequency Voltage Injection Sensorless Control. IEEE Trans. Ind. Electron. 2022, 69, 3324–3333. [Google Scholar] [CrossRef]
- Lee, Y.; Sul, S.-K. Model-Based Sensorless Control of an IPMSM With Enhanced Robustness Against Load Disturbances Based on Position and Speed Estimator Using a Speed Error. IEEE Trans. Ind. Appl. 2018, 54, 1448–1459. [Google Scholar] [CrossRef]
- Naderian, M.; Markadeh, G.A.; Karimi-Ghartemani, M.; Mojiri, M. Improved Sensorless Control Strategy for IPMSM Using an ePLL Approach With High-Frequency Injection. IEEE Trans. Ind. Electron. 2024, 71, 2231–2241. [Google Scholar] [CrossRef]
- Ortombina, L.; Berto, M.; Alberti, L. Sensorless Drive for Salient Synchronous Motors Based on Direct Fitting of Elliptical-Shape High-Frequency Currents. IEEE Trans. Ind. Electron. 2023, 70, 3394–3403. [Google Scholar] [CrossRef]
- Zhang, Y.; Yin, Z.; Liu, J.; Zhang, R.; Sun, X. IPMSM Sensorless Control Using High-Frequency Voltage Injection Method With Random Switching Frequency for Audible Noise Improvement. IEEE Trans. Ind. Electron. 2020, 67, 6019–6030. [Google Scholar] [CrossRef]
- Ji-Hoon Jang, S. -K. Sul, Jung-Ik Ha, K. Ide and M. Sawamura. Sensorless drive of surface-mounted permanent-magnet motor by high-frequency signal injection based on magnetic saliency. IEEE Trans. Ind. Appl. 2003, 39, 1031–1039. [Google Scholar]
- Berto, M.; Alberti, L.; Bolognani, S. Measurement of the Self-Sensing Capability of Synchronous Machines for High Frequency Signal Injection Sensorless Drives. IEEE Trans. Ind. Appl. 2023, 59, 3381–3389. [Google Scholar] [CrossRef]
- Manzolini, V.; Bolognani, S. On the Rotor Position Self-Sensing Capability of Reluctance and IPM Synchronous Motors. IEEE Trans. Ind. Appl. 2020, 56, 3755–3766. [Google Scholar] [CrossRef]
- T. Frenzke. Impacts of cross-saturation on sensorless control of surface permanent magnet synchronous motors. In Proceeding of the 2005 European Conference on Power Electronics and Applications. Dresden, Germany, 11--14 September 2005. 14 September 2005.
- Lin, T.C.; Zhu, Z.Q. Sensorless Operation Capability of Surface-Mounted Permanent-Magnet Machine Based on High-Frequency Signal Injection Methods. IEEE Trans. Ind. Appl. 2014, 51, 2161–2171. [Google Scholar] [CrossRef]
- Kano, Y.; Matsui, N. Rotor Geometry Design of Saliency-Based Sensorless Controlled Distributed-Winding IPMSM for Hybrid Electric Vehicles. IEEE Trans. Ind. Appl. 2018, 54, 2336–2348. [Google Scholar] [CrossRef]
- Millinger, J.; Bacco, G.; Manzolini, V.; Wallmark, O.; Bianchi, N. Design and Evaluation of a Short-Circuit Rotor-Ring for Enhanced Self-Sensing Capability in a Slotless PM Motor. IEEE Trans. Ind. Electron. 2020, 67, 3462–3471. [Google Scholar] [CrossRef]
- Ponomarev, P.; Petrov, I.; Pyrhonen, J. Influence of Travelling Current Linkage Harmonics on Inductance Variation, Torque Ripple and Sensorless Capability of Tooth-Coil Permanent-Magnet Synchronous Machines. IEEE Trans. Magn. 2014, 50, 1–8. [Google Scholar] [CrossRef]
- Y. -C. Kwon, J. Lee and S. -K. Sul. Extending Operational Limit of IPMSM in Signal-Injection Sensorless Control by Manipulation of Convergence Point. IEEE Trans. Ind. Appl. 2019, 55, 1574–1586.
- J. Lee, Y. -C. Kwon and S. -K. Sul. Signal-Injection Sensorless Control With Tilted Current Reference for Heavily Saturated IPMSMs. IEEE Trans. Power Electron. 2020, 35, 12100–12109.
- Wang, H.; Lu, K.; Wang, D.; Blaabjerg, F. Simple and Effective Online Position Error Compensation Method for Sensorless SPMSM Drives. IEEE Trans. Ind. Appl. 2020, 56, 1475–1484. [Google Scholar] [CrossRef]
- M. S. Rafaq and J. -W. Jung. A Comprehensive Review of State-of-the-Art Parameter Estimation Techniques for Permanent Magnet Synchronous Motors in Wide Speed Range. IEEE Trans. Ind. Electron. 2020, 16, 4747–4758.
- Li, Y.; Zhu, Z.Q.; Howe, D.; Bingham, C.M.; Stone, D.A. Improved Rotor-Position Estimation by Signal Injection in Brushless AC Motors, Accounting for Cross-Coupling Magnetic Saturation. IEEE Trans. Ind. Appl. 2009, 45, 1843–1850. [Google Scholar] [CrossRef]
- Mingardi, D.; Morandin, M.; Bolognani, S.; Bianchi, N. On the Proprieties of the Differential Cross-Saturation Inductance in Synchronous Machines. IEEE Trans. Ind. Appl. 2017, 53, 991–1000. [Google Scholar] [CrossRef]
- Pellegrino, G.; Boazzo, B.; Jahns, T.M. Magnetic Model Self-Identification for PM Synchronous Machine Drives. IEEE Trans. Ind. Appl. 2015, 51, 2246–2254. [Google Scholar] [CrossRef]
- Stumberger, B.; Dolinar, D.; Hamler, A.; Trlep, M. Evaluation of saturation and cross-magnetization effects in interior permanent-magnet synchronous motor. IEEE Trans. Ind. Appl. 2003, 39, 1264–1271. [Google Scholar] [CrossRef]
- Wu, C.; Zhao, Y.; Sun, M. Enhancing Low-Speed Sensorless Control of PMSM. Using Phase Voltage Measurements and Online Multiple Parameter Identification. IEEE Trans. Power Electron. 2020, 35, 10700–10710. [Google Scholar] [CrossRef]
- Wang, Q.; Zhao, N.; Wang, G.; Zhao, S.; Chen, Z.; Zhang, G.; Xu, D. An Offline Parameter Self-Learning Method Considering Inverter Nonlinearity With Zero-Axis Voltage. IEEE Trans. Power Electron. 2021, 36, 14098–14109. [Google Scholar] [CrossRef]
- Xu, W.; Lorenz, R.D. High-Frequency Injection-Based Stator Flux Linkage and Torque Estimation for DB-DTFC Implementation on IPMSMs Considering Cross-Saturation Effects. IEEE Trans. Ind. Appl. 2014, 50, 3805–3815. [Google Scholar] [CrossRef]
- Shuang, B.; Zhu, Z.-Q. A Novel Method for Estimating the High Frequency Incremental DQ-Axis and Cross-Coupling Inductances in Interior Permanent Magnet Synchronous Machines. IEEE Trans. Ind. Appl. 2021, 57, 4913–4923. [Google Scholar] [CrossRef]
- Shuang, B.; Zhu, Z.Q.; Wu, X. Improved Cross-coupling Effect Compensation Method for Sensorless Control of IPMSM With High Frequency Voltage Injection. IEEE Trans. Energy Convers. 2022, 37, 347–358. [Google Scholar] [CrossRef]
- M. Seilmeier and B. Piepenbreier. Identification of steady-state inductances of PMSM using polynomial representations of the flux surfaces. In Proceeding of IECON 2013 - 39th Annual Conference of the IEEE Industrial Electronics Society, Vienna, Austria, 10-13 Novenber 2013.
- Feng, G.; Lai, C.; Han, Y.; Kar, N. Fast Maximum Torque per Ampere (MTPA) Angle Detection for Interior PMSMs using Online Polynomial Curve Fitting. IEEE Trans. Power Electron. 2022, 37, 2045–2056. [Google Scholar] [CrossRef]



| Item | Value | Item | Value |
|---|---|---|---|
| Rated voltage Rated current Rated power Rated torque |
110 V | Pole pairs | 5 |
| 1.5 A | Phase resistance | 2.8 Ω | |
| 200 W 0.64 Nm |
d-axis inductance d-axis inductance |
13 mH 13 mH |
Disclaimer/Publisher’s Note: The statements, opinions and data contained in all publications are solely those of the individual author(s) and contributor(s) and not of MDPI and/or the editor(s). MDPI and/or the editor(s) disclaim responsibility for any injury to people or property resulting from any ideas, methods, instructions or products referred to in the content. |
© 2024 by the authors. Licensee MDPI, Basel, Switzerland. This article is an open access article distributed under the terms and conditions of the Creative Commons Attribution (CC BY) license (http://creativecommons.org/licenses/by/4.0/).


