1. Introduction
Mechanical vibrations are a common source of potential problems in structures and systems, such as fatigue, failures, noise, loosening of mechanical components. They can also cause issues in sensitive devices and such as electronic systems and components, transport of delicate goods such as food, medicines, etc. Mechanical vibrations can come from a variety of sources such as engines, either internal combustion or electrical motors, external sources such as aerodynamic loads and road (pavement) irregularities, shocks, drops, etc. In the case of autonomous air vehicles such vibrations are generated primarily by the electric motors used, the structural dynamics of the propellers and frames, in particular when there might be imbalances in the blades or manufacturing uncertainties, and the aerodynamic forces such as gusts and turbulences. Amongst other negative effects caused by these vibrations, they can cause the electronic systems sensors such as accelerometers, gyroscopes, and GPS to malfunction, leading to errors in state estimation and possible loss of control [
1]. In the case of imaging devices such as cameras and other sensors, vibrations can affect the quality of the produced images, and as a result, vibration isolation systems for cameras have been proposed and developed, to stabilize the cameras without affecting the image quality when vibrations are present [
2]. In addition, such vibrations can damage transported goods, which is a rapidly developing application for these unmanned systems, for example the transport of medicines or blood to remote areas, that can be affected by the vibrations generated during the transport, as well as the shocks during landing, thus making it imperative to ensure that no damage will occur due to these effects [3-5].
Due to the limited size and weight of unmanned air vehicles, they often lack the redundant safety systems of larger aircrafts. In addition, there is a lack of regulations for assessing the consequences of mechanical vibrations in these systems. As a result, the effect of mechanical vibrations is often neglected, and there are limited studies on their negative effects. Moreover, there is also a lack on studies on the effect of vibrations on packaged goods and their transport using UAVs. Several authors have proposed methodologies for developing vibration profiles and characteristics for subsequent test and simulations using data acquisition systems for this purpose [
6]. These vibrations are often random in nature due to the external disturbances [
7]. Mechanical vibrations due to unbalances in blade propellers found in multirotor UAVs have been considered by Rakowski and Szulim [
8]. The authors presented an analytical approach to assess this problem, studying a simplified mathematical model of two rotors with two blades each one, finding that by considering a permanent angle of phase shift between the two rotors led to almost a complete suppression of vibration in the three axes of motion. On the other hand, although vibrations from motors can be controlled and isolated, there is still the problem of external aerodynamic loads. Isolators have been proposed to suppress and reduce the effects of mechanical vibrations. Kalita, et al [
9] presented a comprehensive analysis of different vibration isolators used un UAVs systems and considered the implementation of smart materials for isolation purposes, such as shape memory alloys.
Mechanical vibrations, either from the motors or the external disturbances, can also affect the structural stability of the frame, leading to potential resonances when the forcing frequencies equal the natural frequencies of the frame. Thus, it is important to perform modal analysis, either by Finite Element simulations during phase design, and by experimental methods such as hammer and shaker testing [10-11]. Once the main natural frequencies and mode shapes are known, structural modifications and optimization can be performed to ensure that no resonances will occur during operation. In addition, control systems have also been used to mitigate the effects of vibrations. Wang, et al proposed a control strategy to suppress structural vibrations of the frame of a UAV, ensuring the stability and tracking performance of the system [
12].
This work presents the analysis of the structural and motor vibrations of an experimental quadrotor. During a stable flight maneuver of the quadrotor, it was observed that it began to slide laterally apparently without any external alteration of the environment, or the signal given by the autonomous control system. Disregarding programming errors, manufacturing defects, or structural integrity issues, it was suspected the existence of large structural vibrations occurring close to the natural frequencies either of the frame or the propellers, that could be excited by the motor rotational speed, generating resonant vibrations during operation [
8] [
11] [
13]. As a result, a structural dynamics analysis of the quadrotor's frame was performed, obtaining the Frequency Response Function (FRF) [
14] using the impact hammer technique on the frame and propellers. This would allow for the identification of resonance frequencies and possible inference if any of the arms or propellers have significant flexibility and vibration amplitude within the operational frequency range [
10], which would impact the angles measured by the autonomous control system thus resulting in a lack of control in lateral stability.
2. Method of Modal Analysis
Modal analysis is widely used in the design stage of aeronautical and aerospace components and vehicles, to find the dynamic behavior and avoid dangerous oscillations during normal operation. It is performed by different theoretical and experimental procedures with the objective to find the natural frequencies, mode shapes, and damping of a certain structure, and allows to perform structural modifications if needed to avoid resonances or other dangerous phenomena. As a common practice, theoretical modal analysis performed in finite element software is validated and updated with experimental measurements, producing a more reliable mathematical model. There are two main experimental approaches to modal analysis with the common objective of exciting the structure in a broad frequency range of interest and measure its response in different points, to estimate the frequency response function (FRF), which is one of the main tools used for characterizing modal behavior in a structure. The first approach is shaker testing, where the excitation is applied by an electrodynamic actuator, or shaker, which is connected to a fixed point in the structure and applies a broadband excitation, i.e. frequency sweep or random vibration. Then the frequency is measured in different points using vibration sensors (accelerometers, laser vibrometers, etc.). The second approach is hammer testing, where a instrumented modal hammer (force sensor) is used to apply short duration impacts to different points in the structure, and then, using a sensor fixed in a point of the structure, the FRF is estimated. Flutter prediction is one of the main applications of modal analysis in the aerospace industry. Aircrafts and components are subjected to dangerous vibrations during maneuvers; thus, control strategies are needed. Modal analysis has also been applied to predict and assess damage in structures [
15].
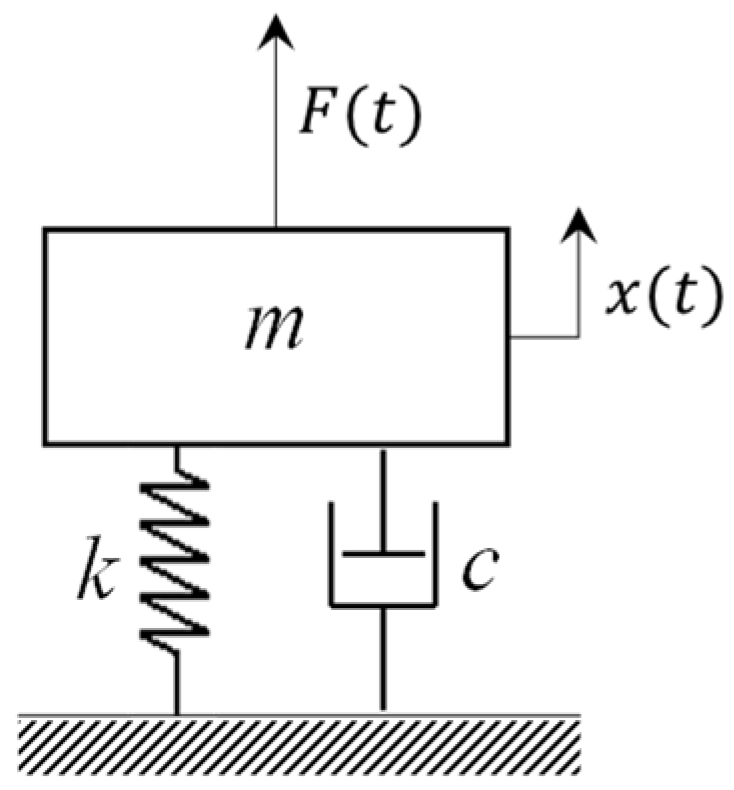
The fundamental of modal analysis assumes a single degree of freedom system (SDOF) as depicted in
Figure 1.
The equation of motion of the system is described by:
where:
: Displacement response.
: Velocity response.
: Acceleration response.
: Viscous damping ratio.
: Undamped natural frequency.
: Excitation force.
The frequency response function for this system is a complex function that can be written as:
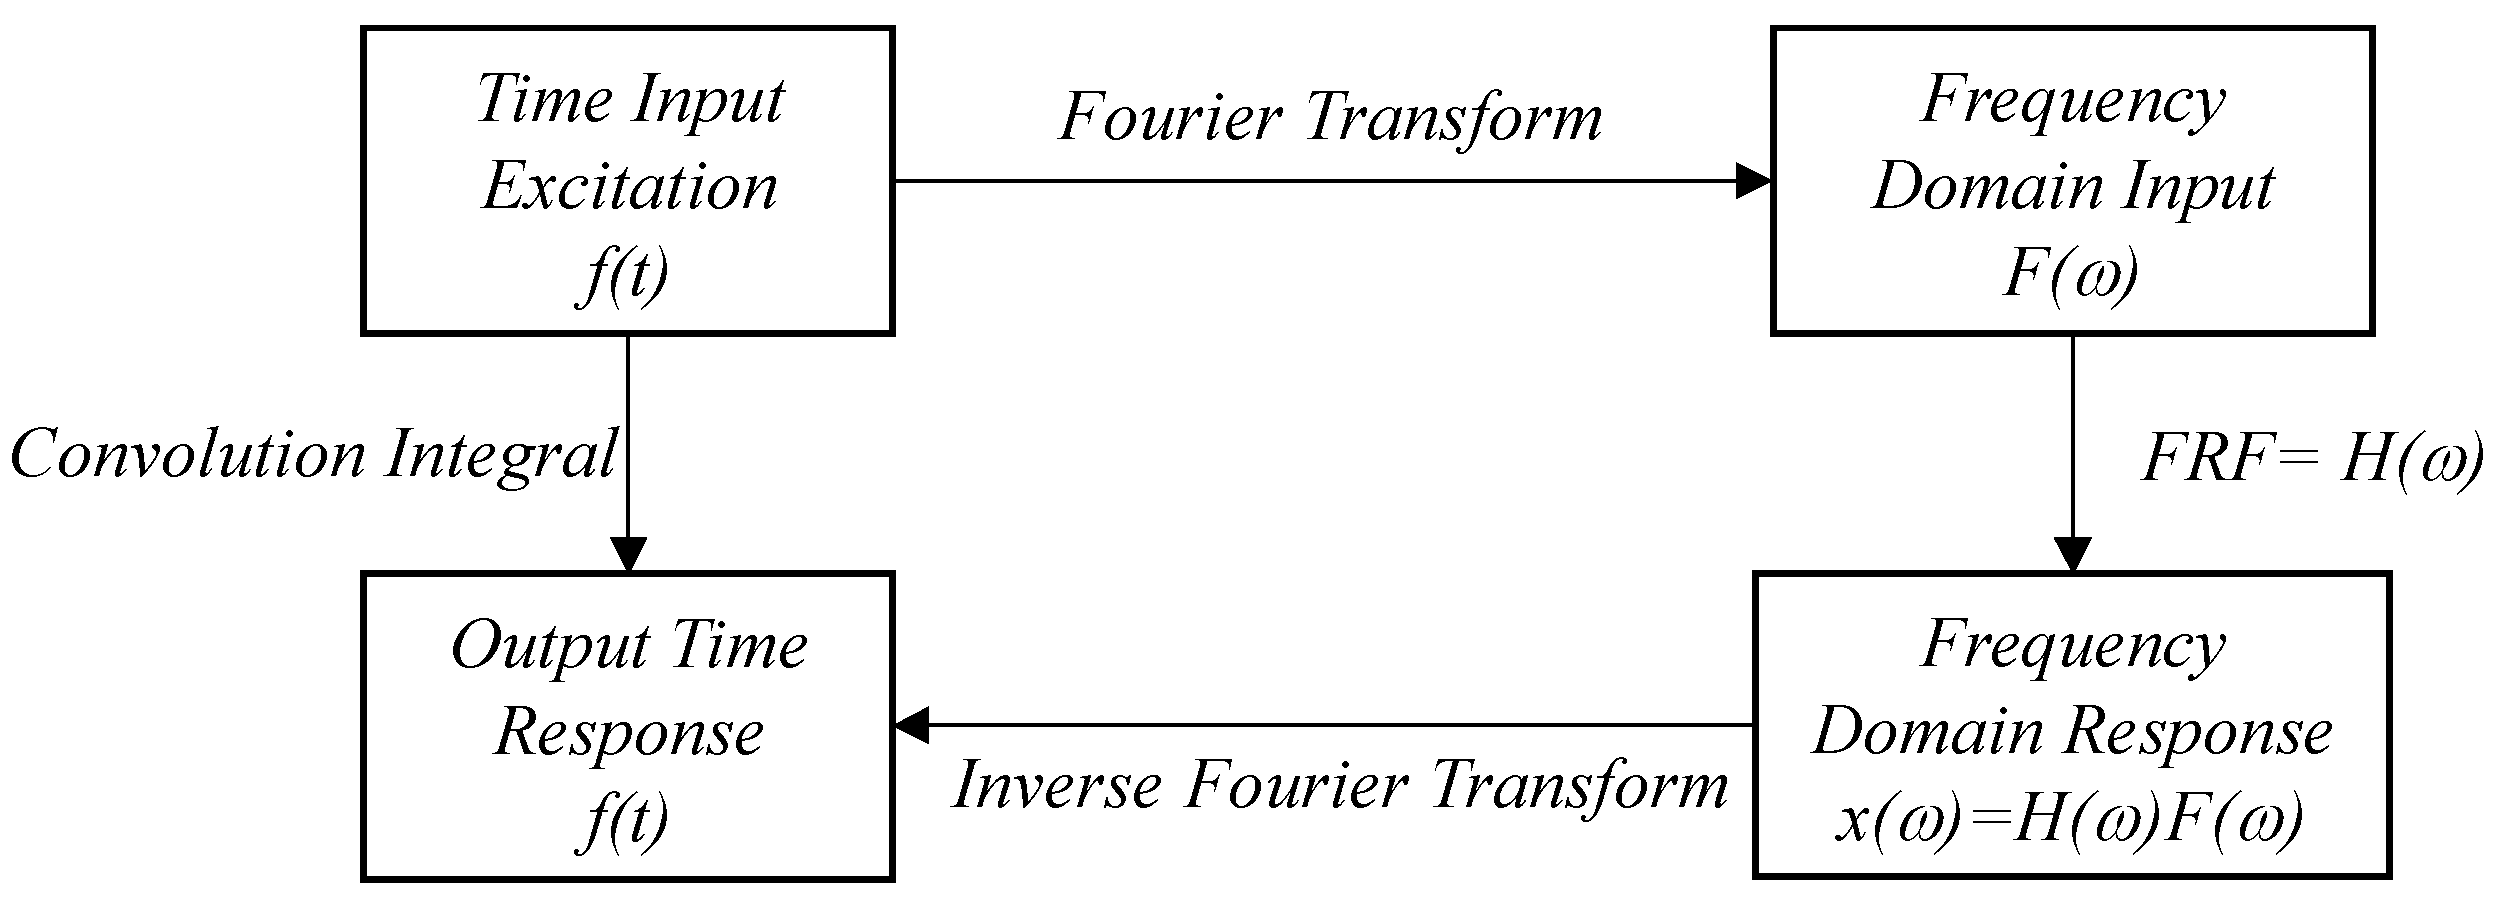
Once the FRF is known, the response of the system at any frequency for any input can be found, assuming linear properties. The process of finding the response in the time domain is performed by convolution of the impulse response function and the forcing input, while in the frequency domain is given by multiplying the input by the FRF.
Figure 2 shows the concept of spectral analysis using frequency response functions.
The FRF is a very important tool because experimentally it is relatively simple to obtain the Fast Fourier Transform or FFT of the vibration response (amplitude) and the controlled and measured dynamic excitation (Sinusoidal, Random, or Impulsive). In this way, it is possible to identify resonance frequencies, damping, and modal shapes. Although it is a simple approach, many light structures with low damping can be analyzed this way where the complex FRF with several resonances is decomposed and each resonance is analyzed individually as a SDOF model.
3. Experimental Setup
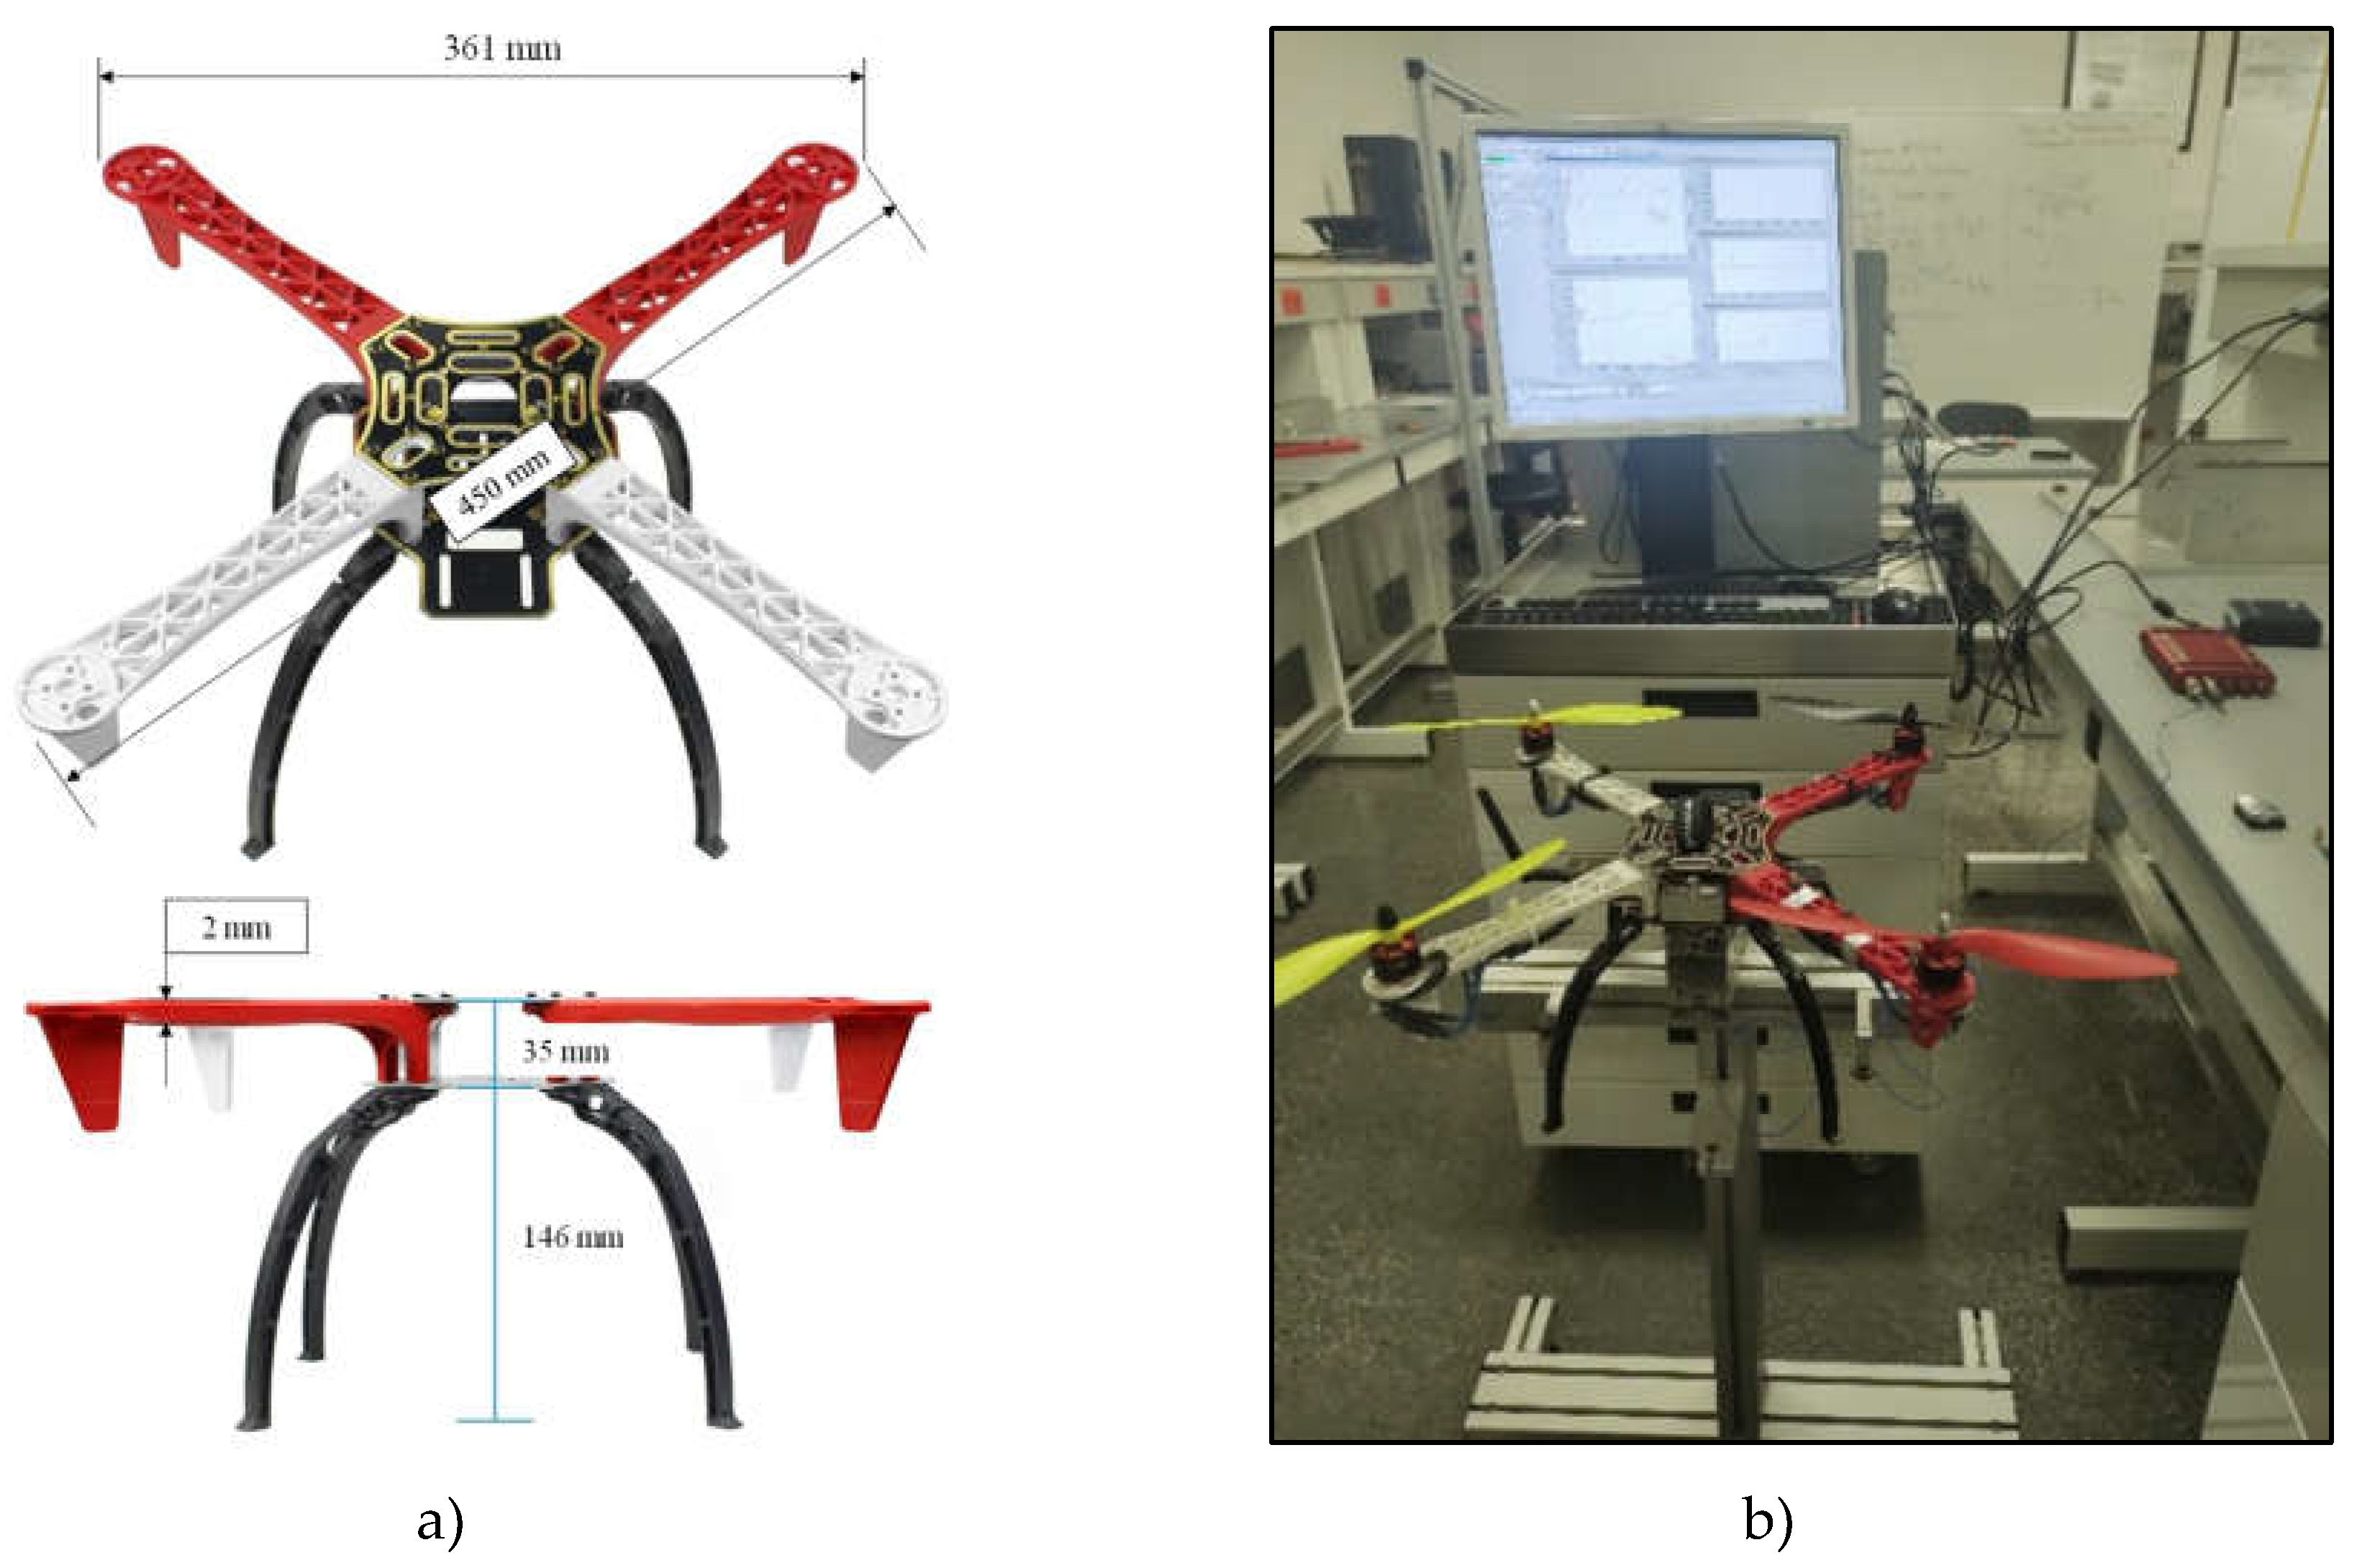
The experimental measurements were developed out in the Structural Dynamics Laboratory of the Aeronautical Engineering, Research, and Innovation Center (CIIIA). The quadrotor structure has a mass of 331 grams, the length of the arms between the motor center of rotation is 450 mm, and is mounted with a landing gear measuring 361 x 361 x 191 mm (length, width, and height respectively), as shown in
Figure 3.a. The complete frame is made of Nylon. The experimental measurement was performed under static conditions, with the quadrotor turned off, secured to a rigid bench for structural testing, and with a considerably greater weight than the quadrotor's to avoid lack of stiffness in the base that could induce structural vibrations from the support, as shown in
Figure 3.b.
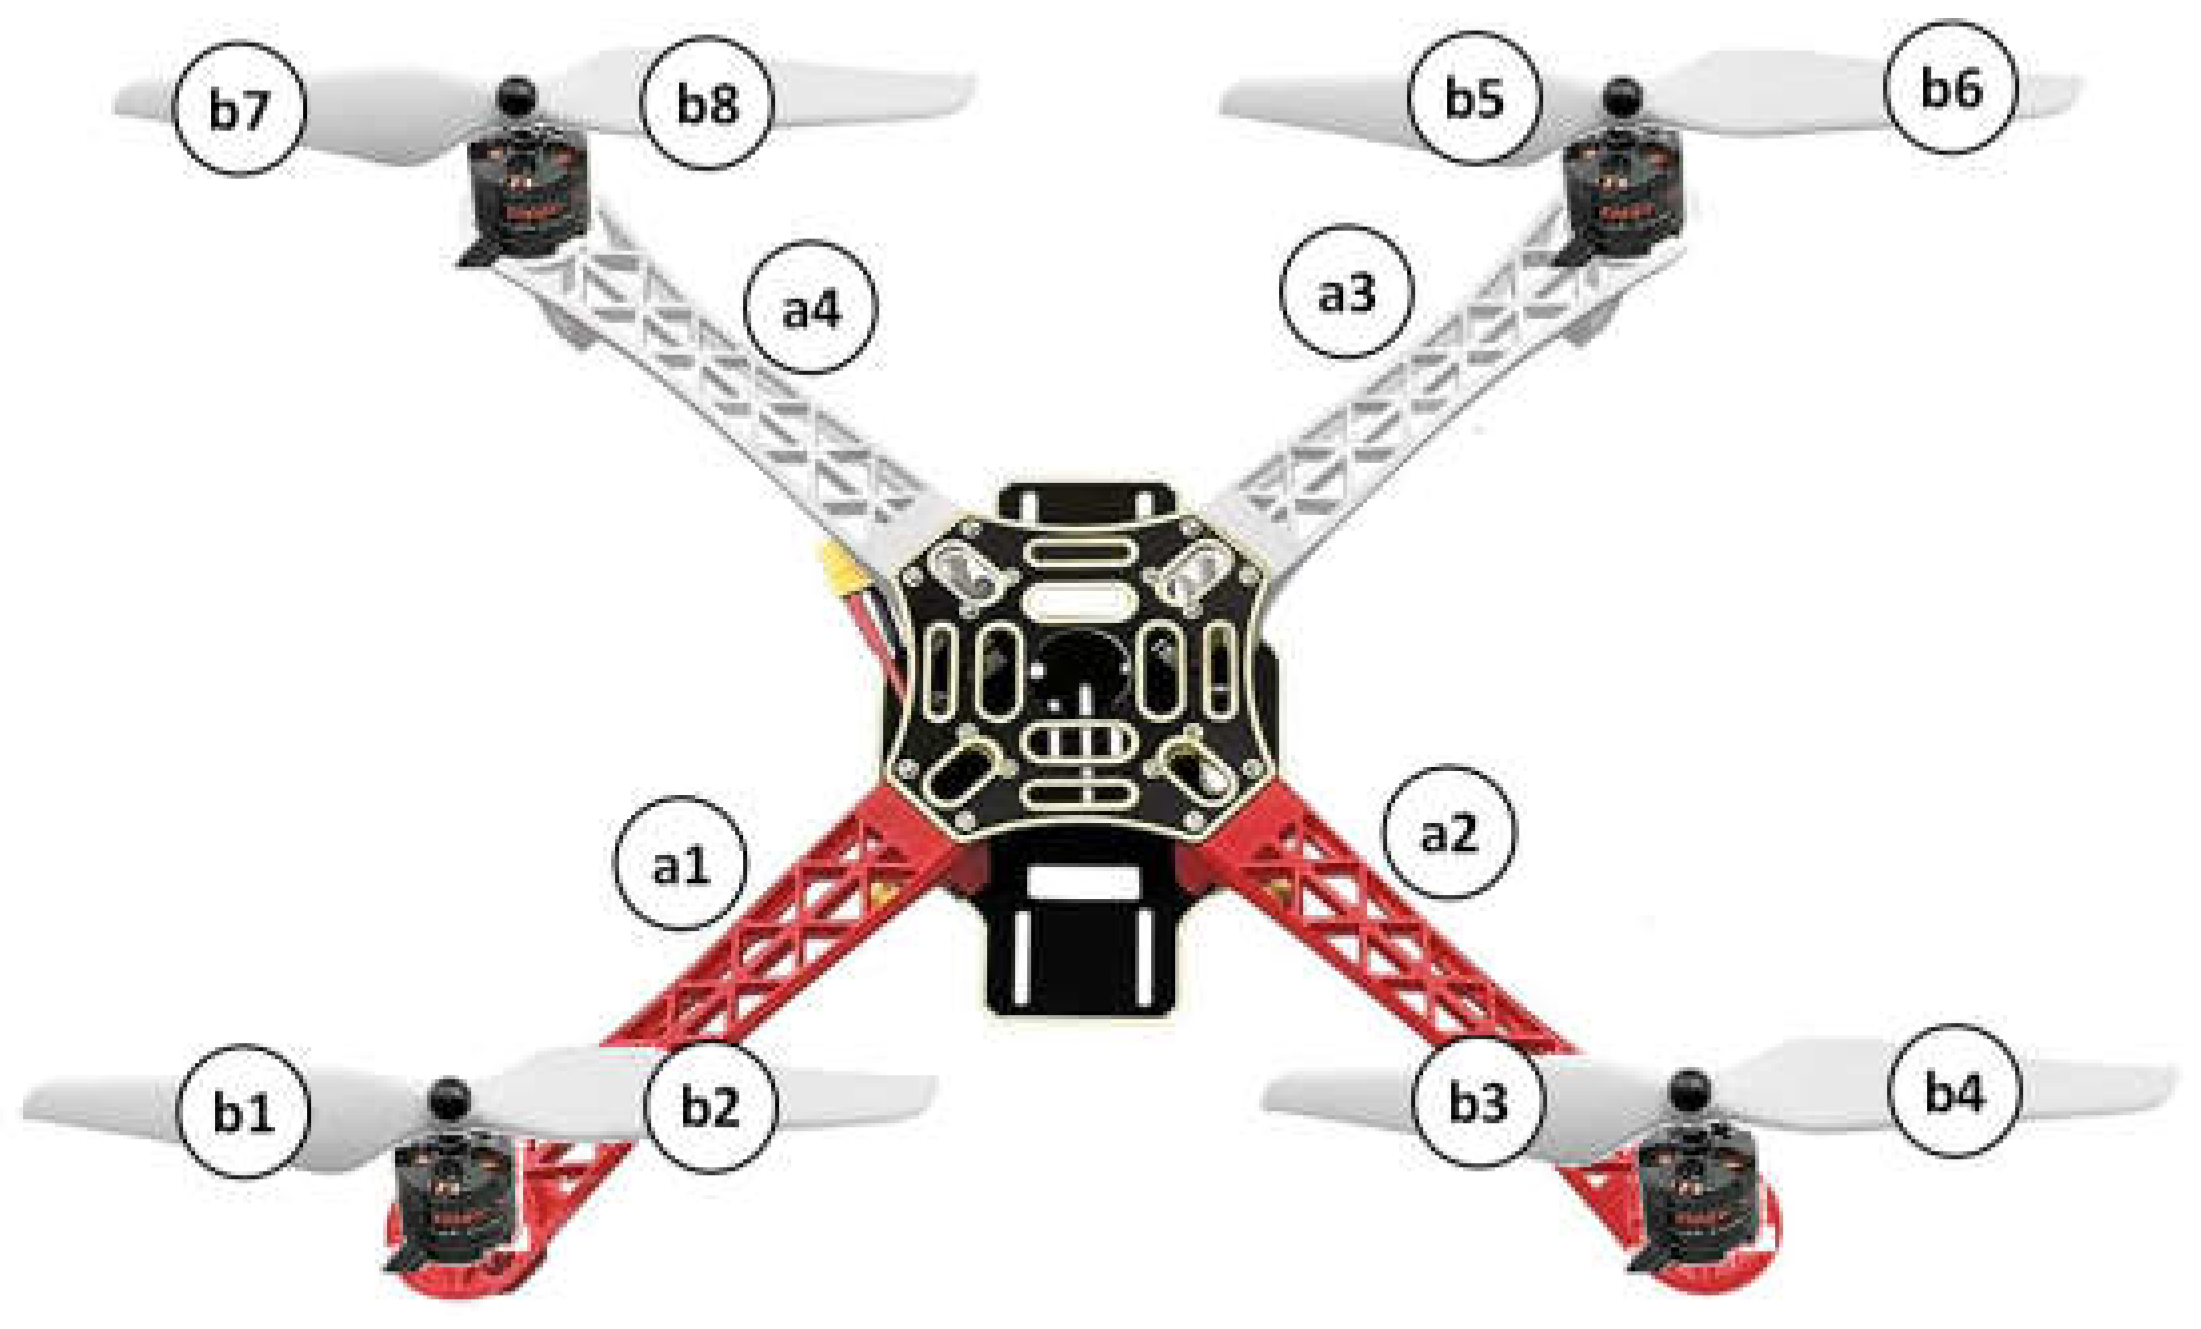
In the case of the helices, were characterized in pairs of blades. The quadrotor has 4 helices and 8 blades. To facilitate the identification, helices were numbered as is shown at
Figure 4.
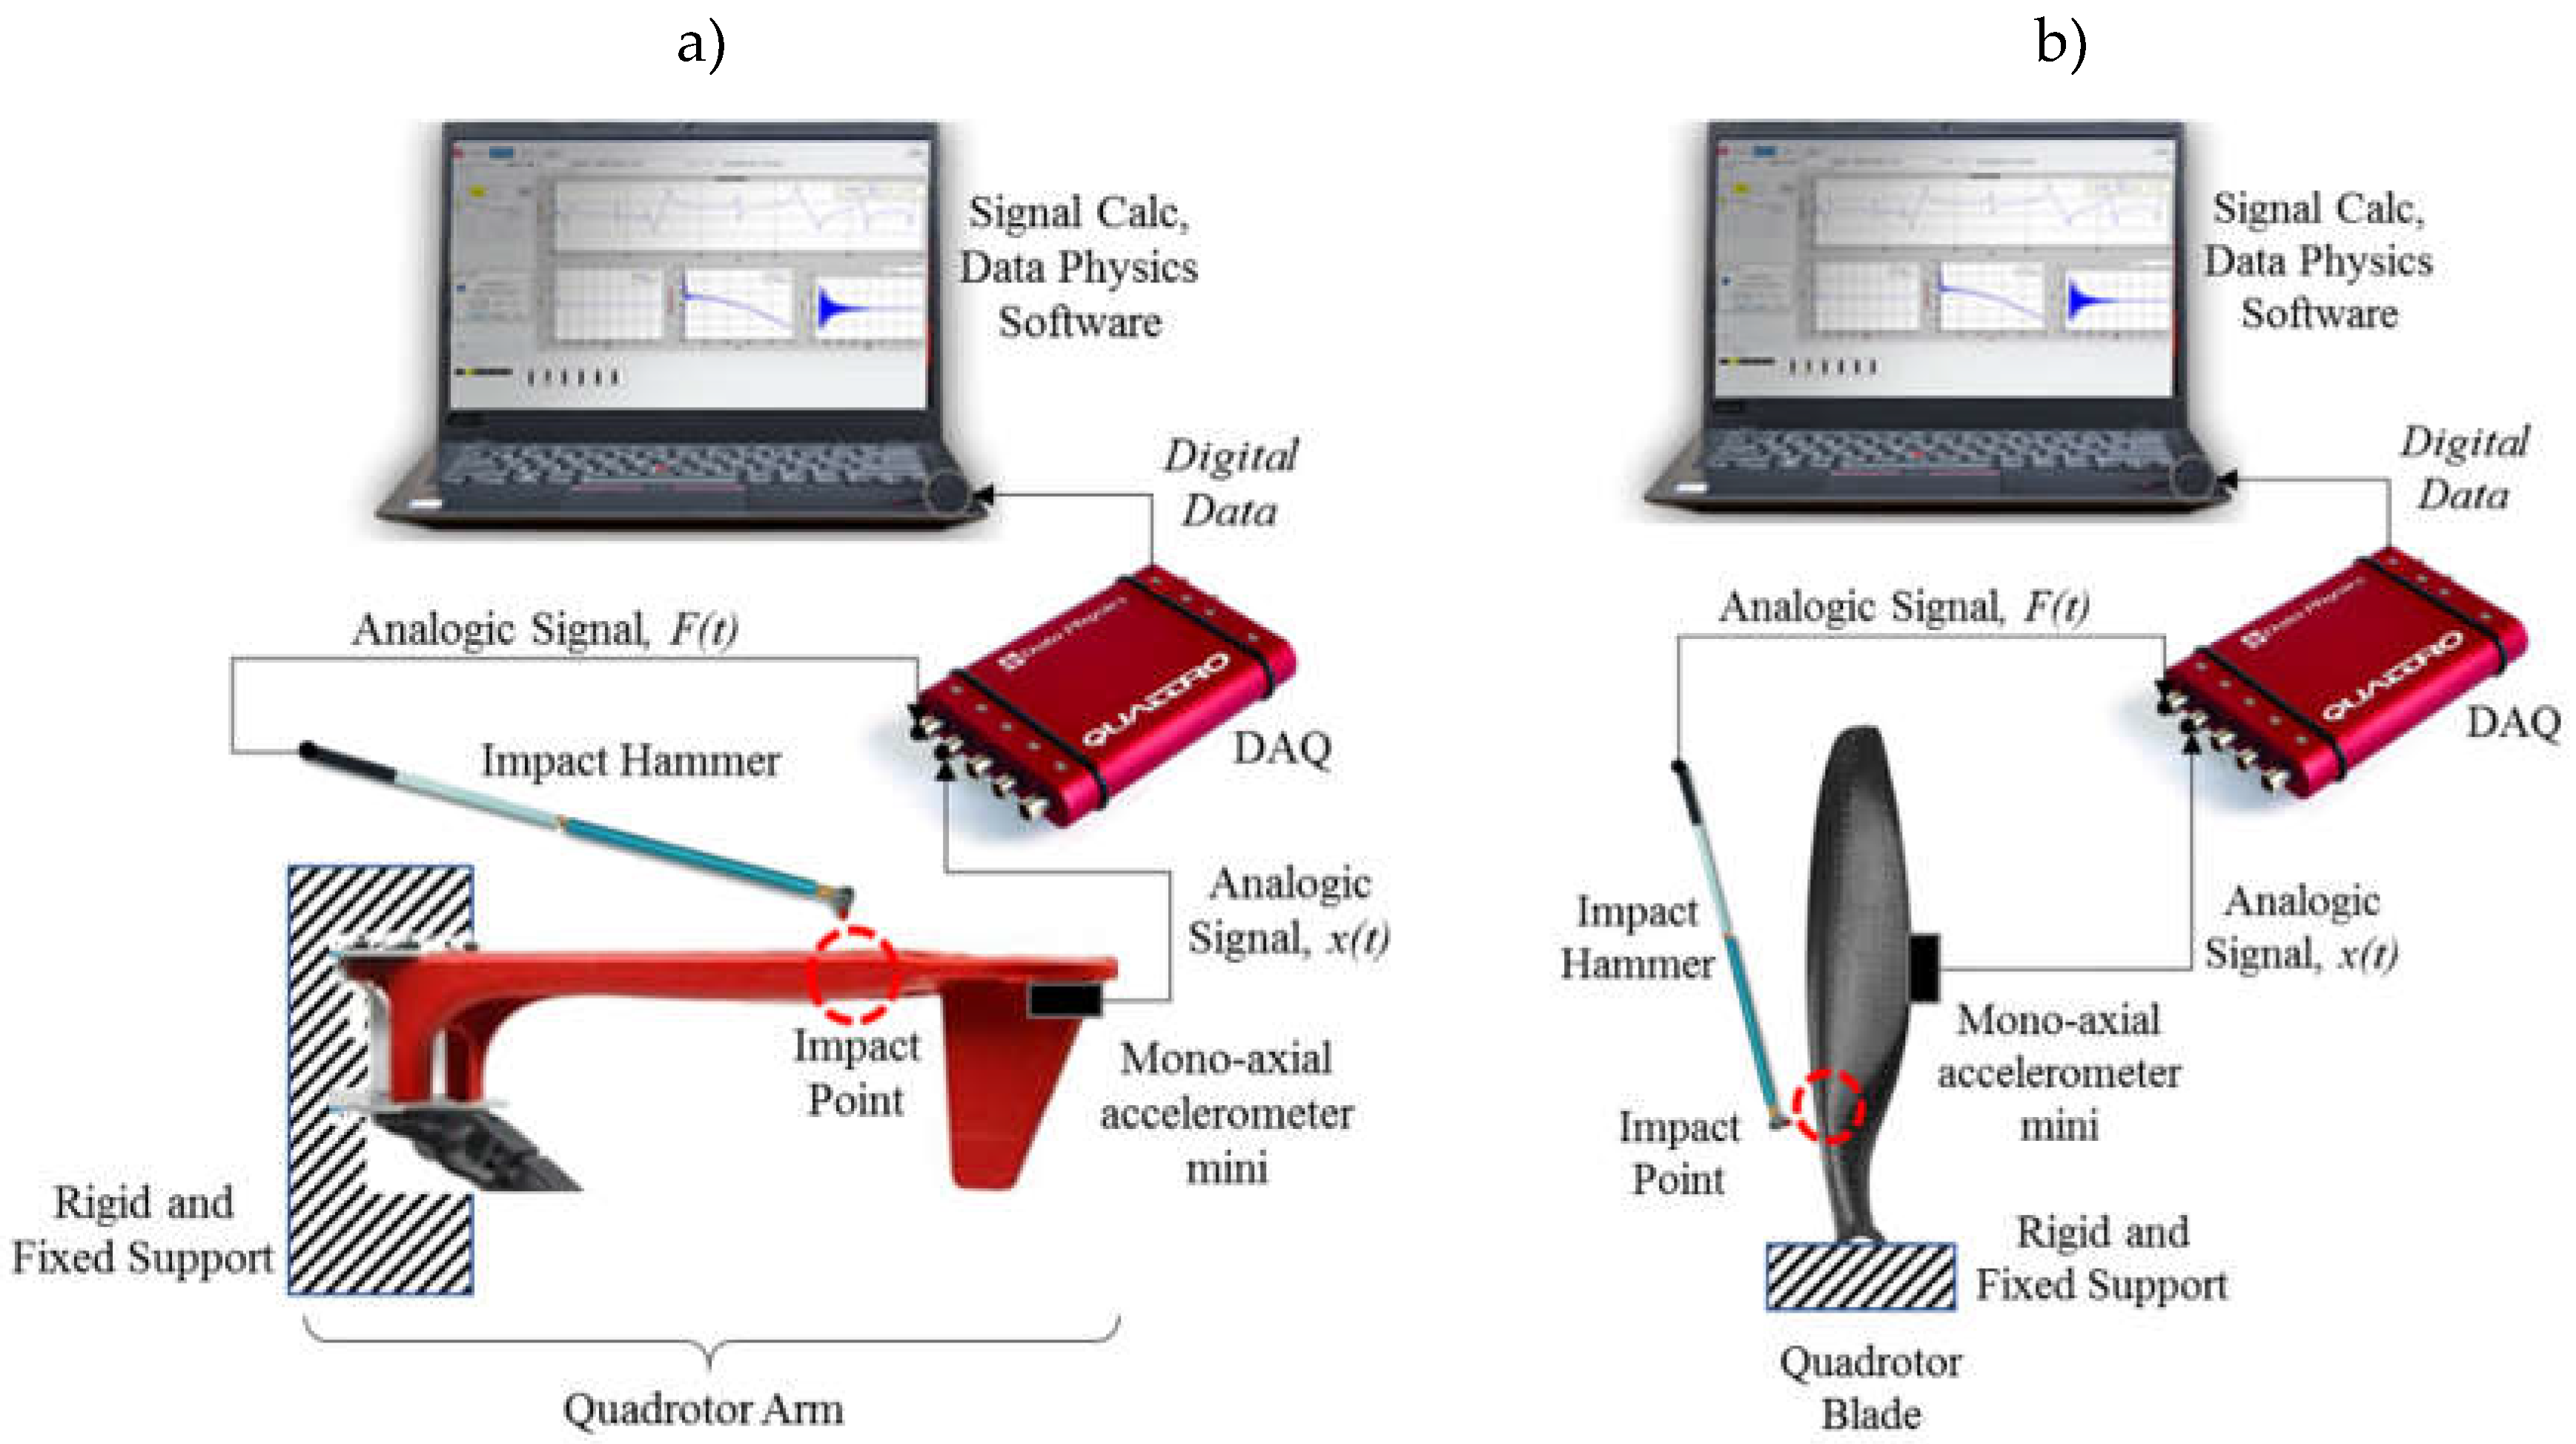
For the FRF measurements, was installed at the free end of each arm a 0.5-gram PCB piezotronics mini accelerometer, model 352C22, and impulse or impact-type excitation was applied using a PCB piezotronics impact hammer, Model 086E80 [
16].
Using a QUATTRO dynamic signal analyzer from Data Physics, a 4-channel FFT measurement was obtained for both the vibration acceleration response and the excitation force. The Signal Calc software from Data Physics was used to measure the FRF or H(ω).
For analysis and post-processing purposes, the data was exported to MATLAB. It was necessary to perform the experimental setup separately for the arms and for the propellers, as shown in
Figure 5a and b.
4. Results
4.1. Arms Resonance Results
FRF magnitude and phase plot are shown for all the complete frequency range in
Figure 6 for each arm. To better visualization, next section shows a zoom for specific low frequency scale. Frequency range was limited from 0 Hz to 1000 Hz to be able to find the main resonances of the structures.
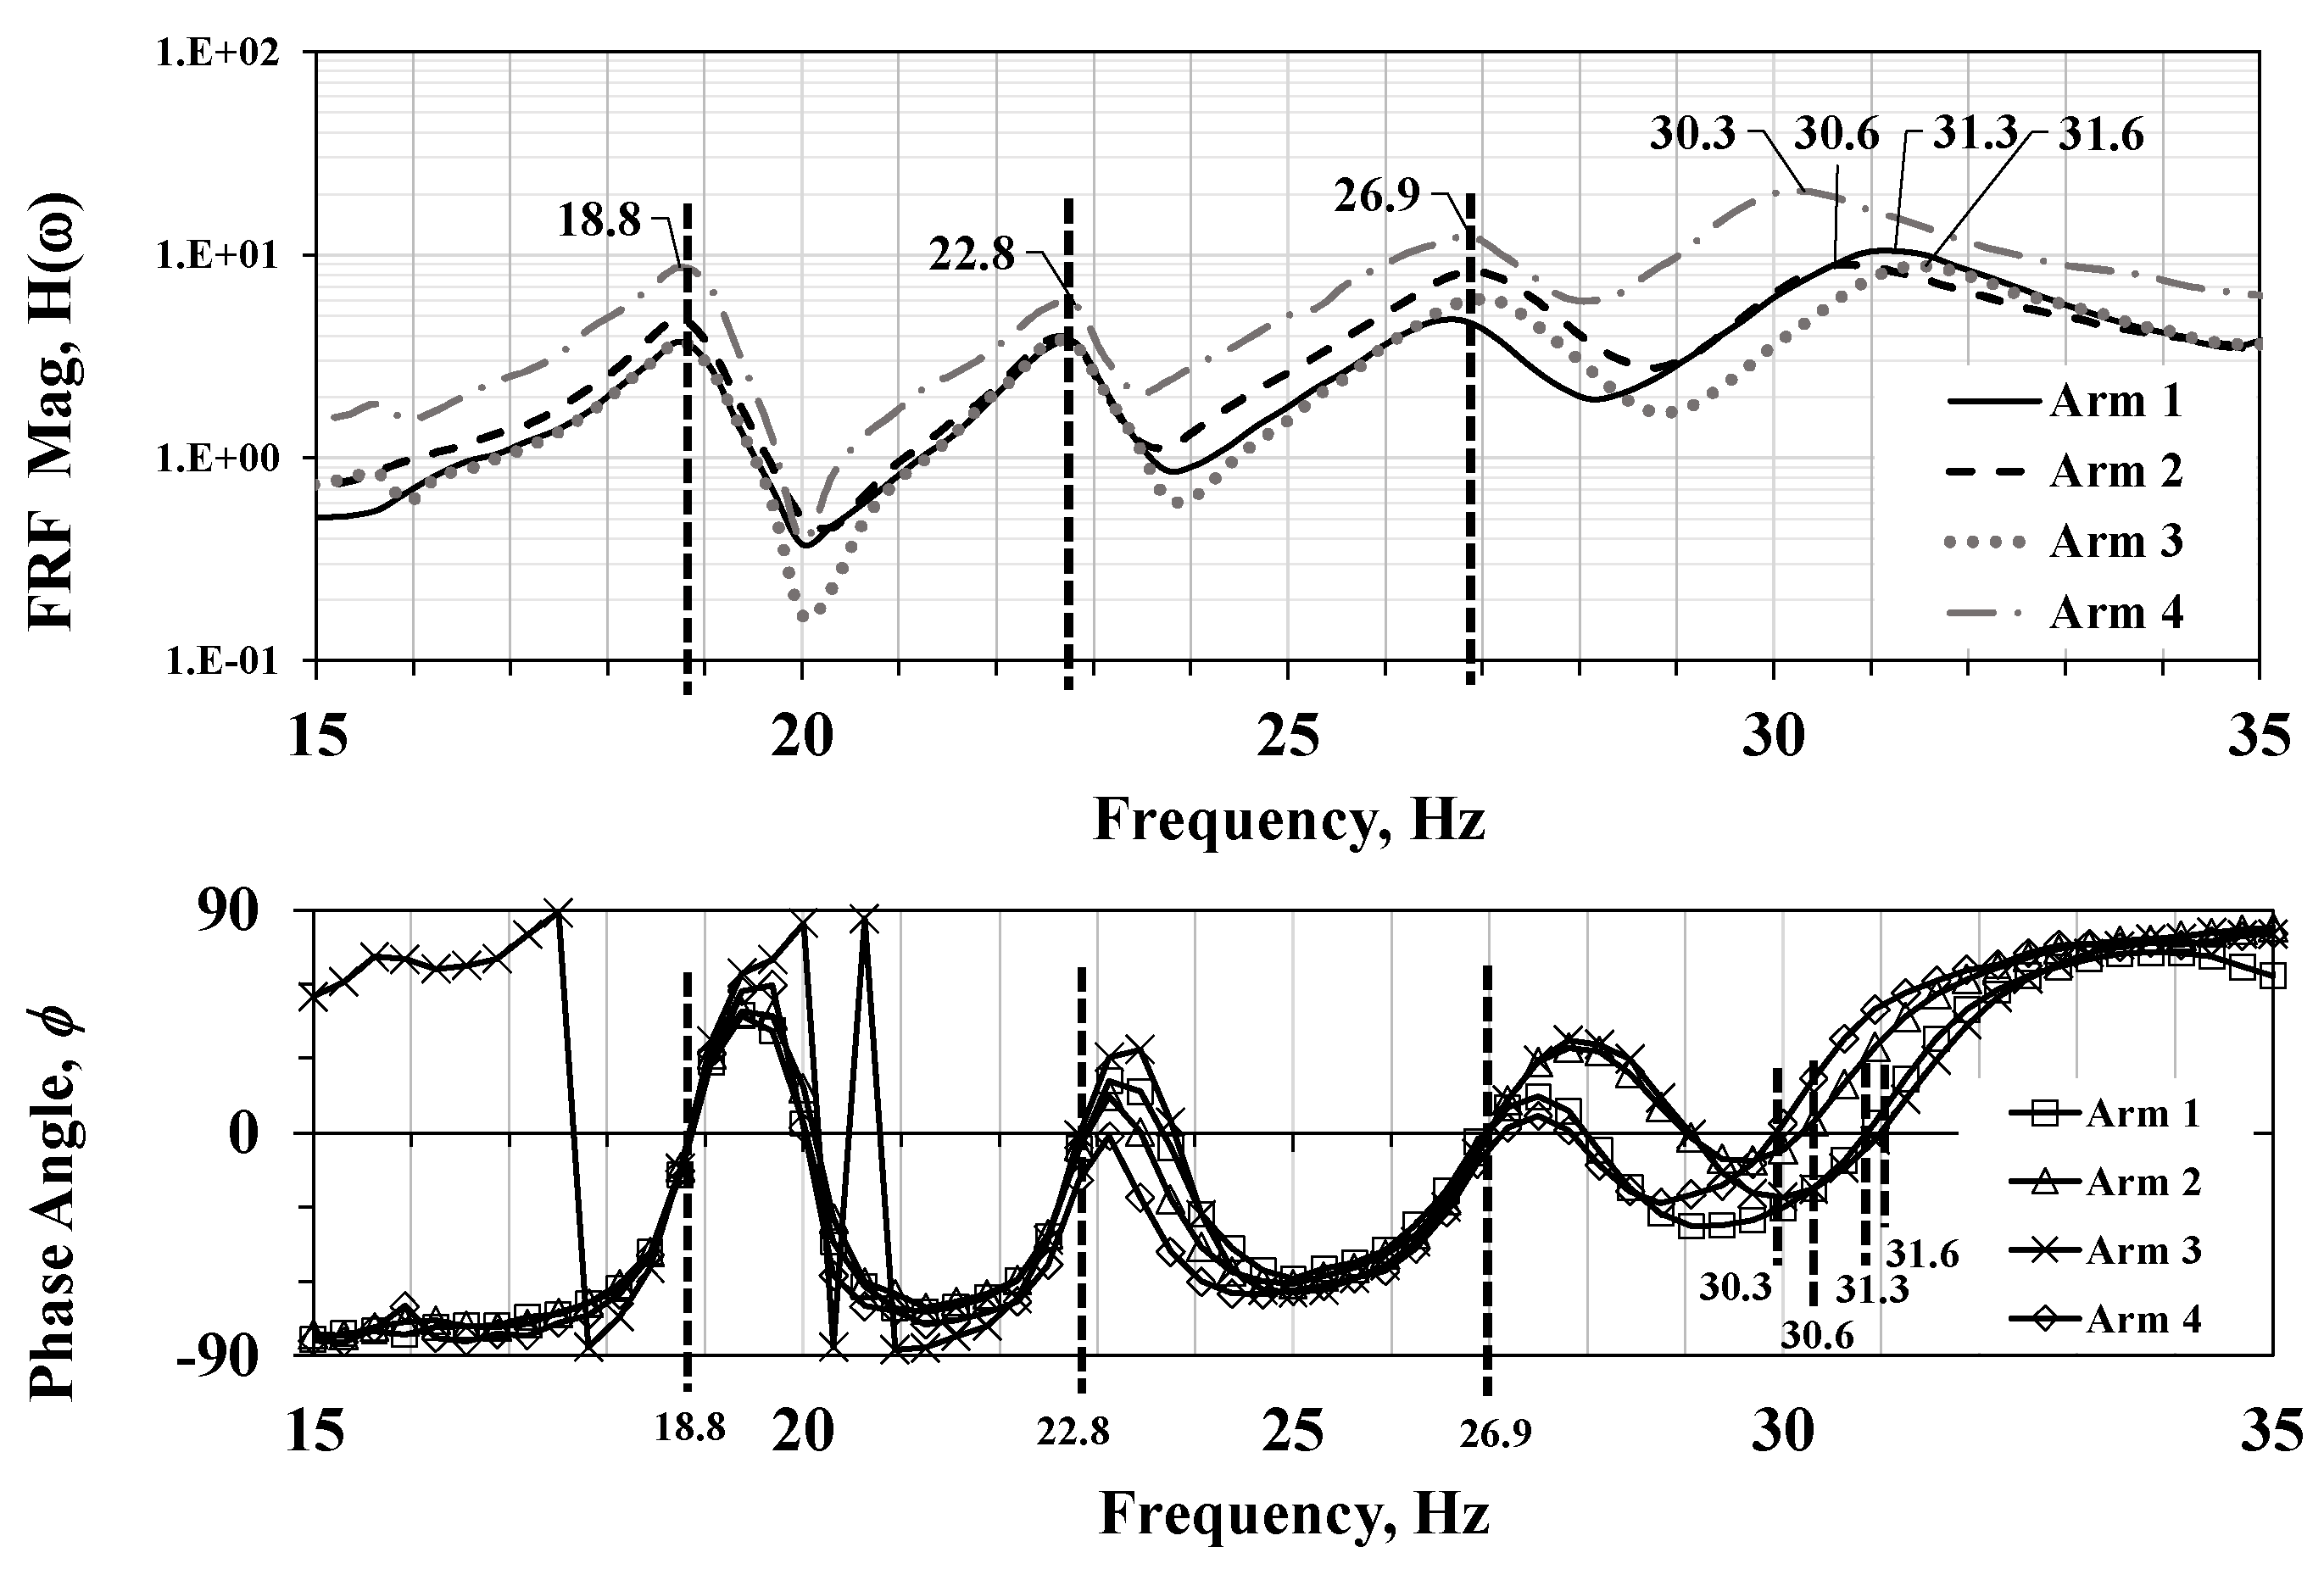
Exploring low frequency range for the arms between 15 and 35 Hz, were found 4 peaks for each arm, as is shown in
Figure 7. The change in the phase angle is used to identify resonance frequency peaks. A resonance frequency appears when there is a frequency peak and at the same frequency at the angle at the phase plot is cero. Another observation at these frequency resonances is that they possess high damping, that is way they are flattened.
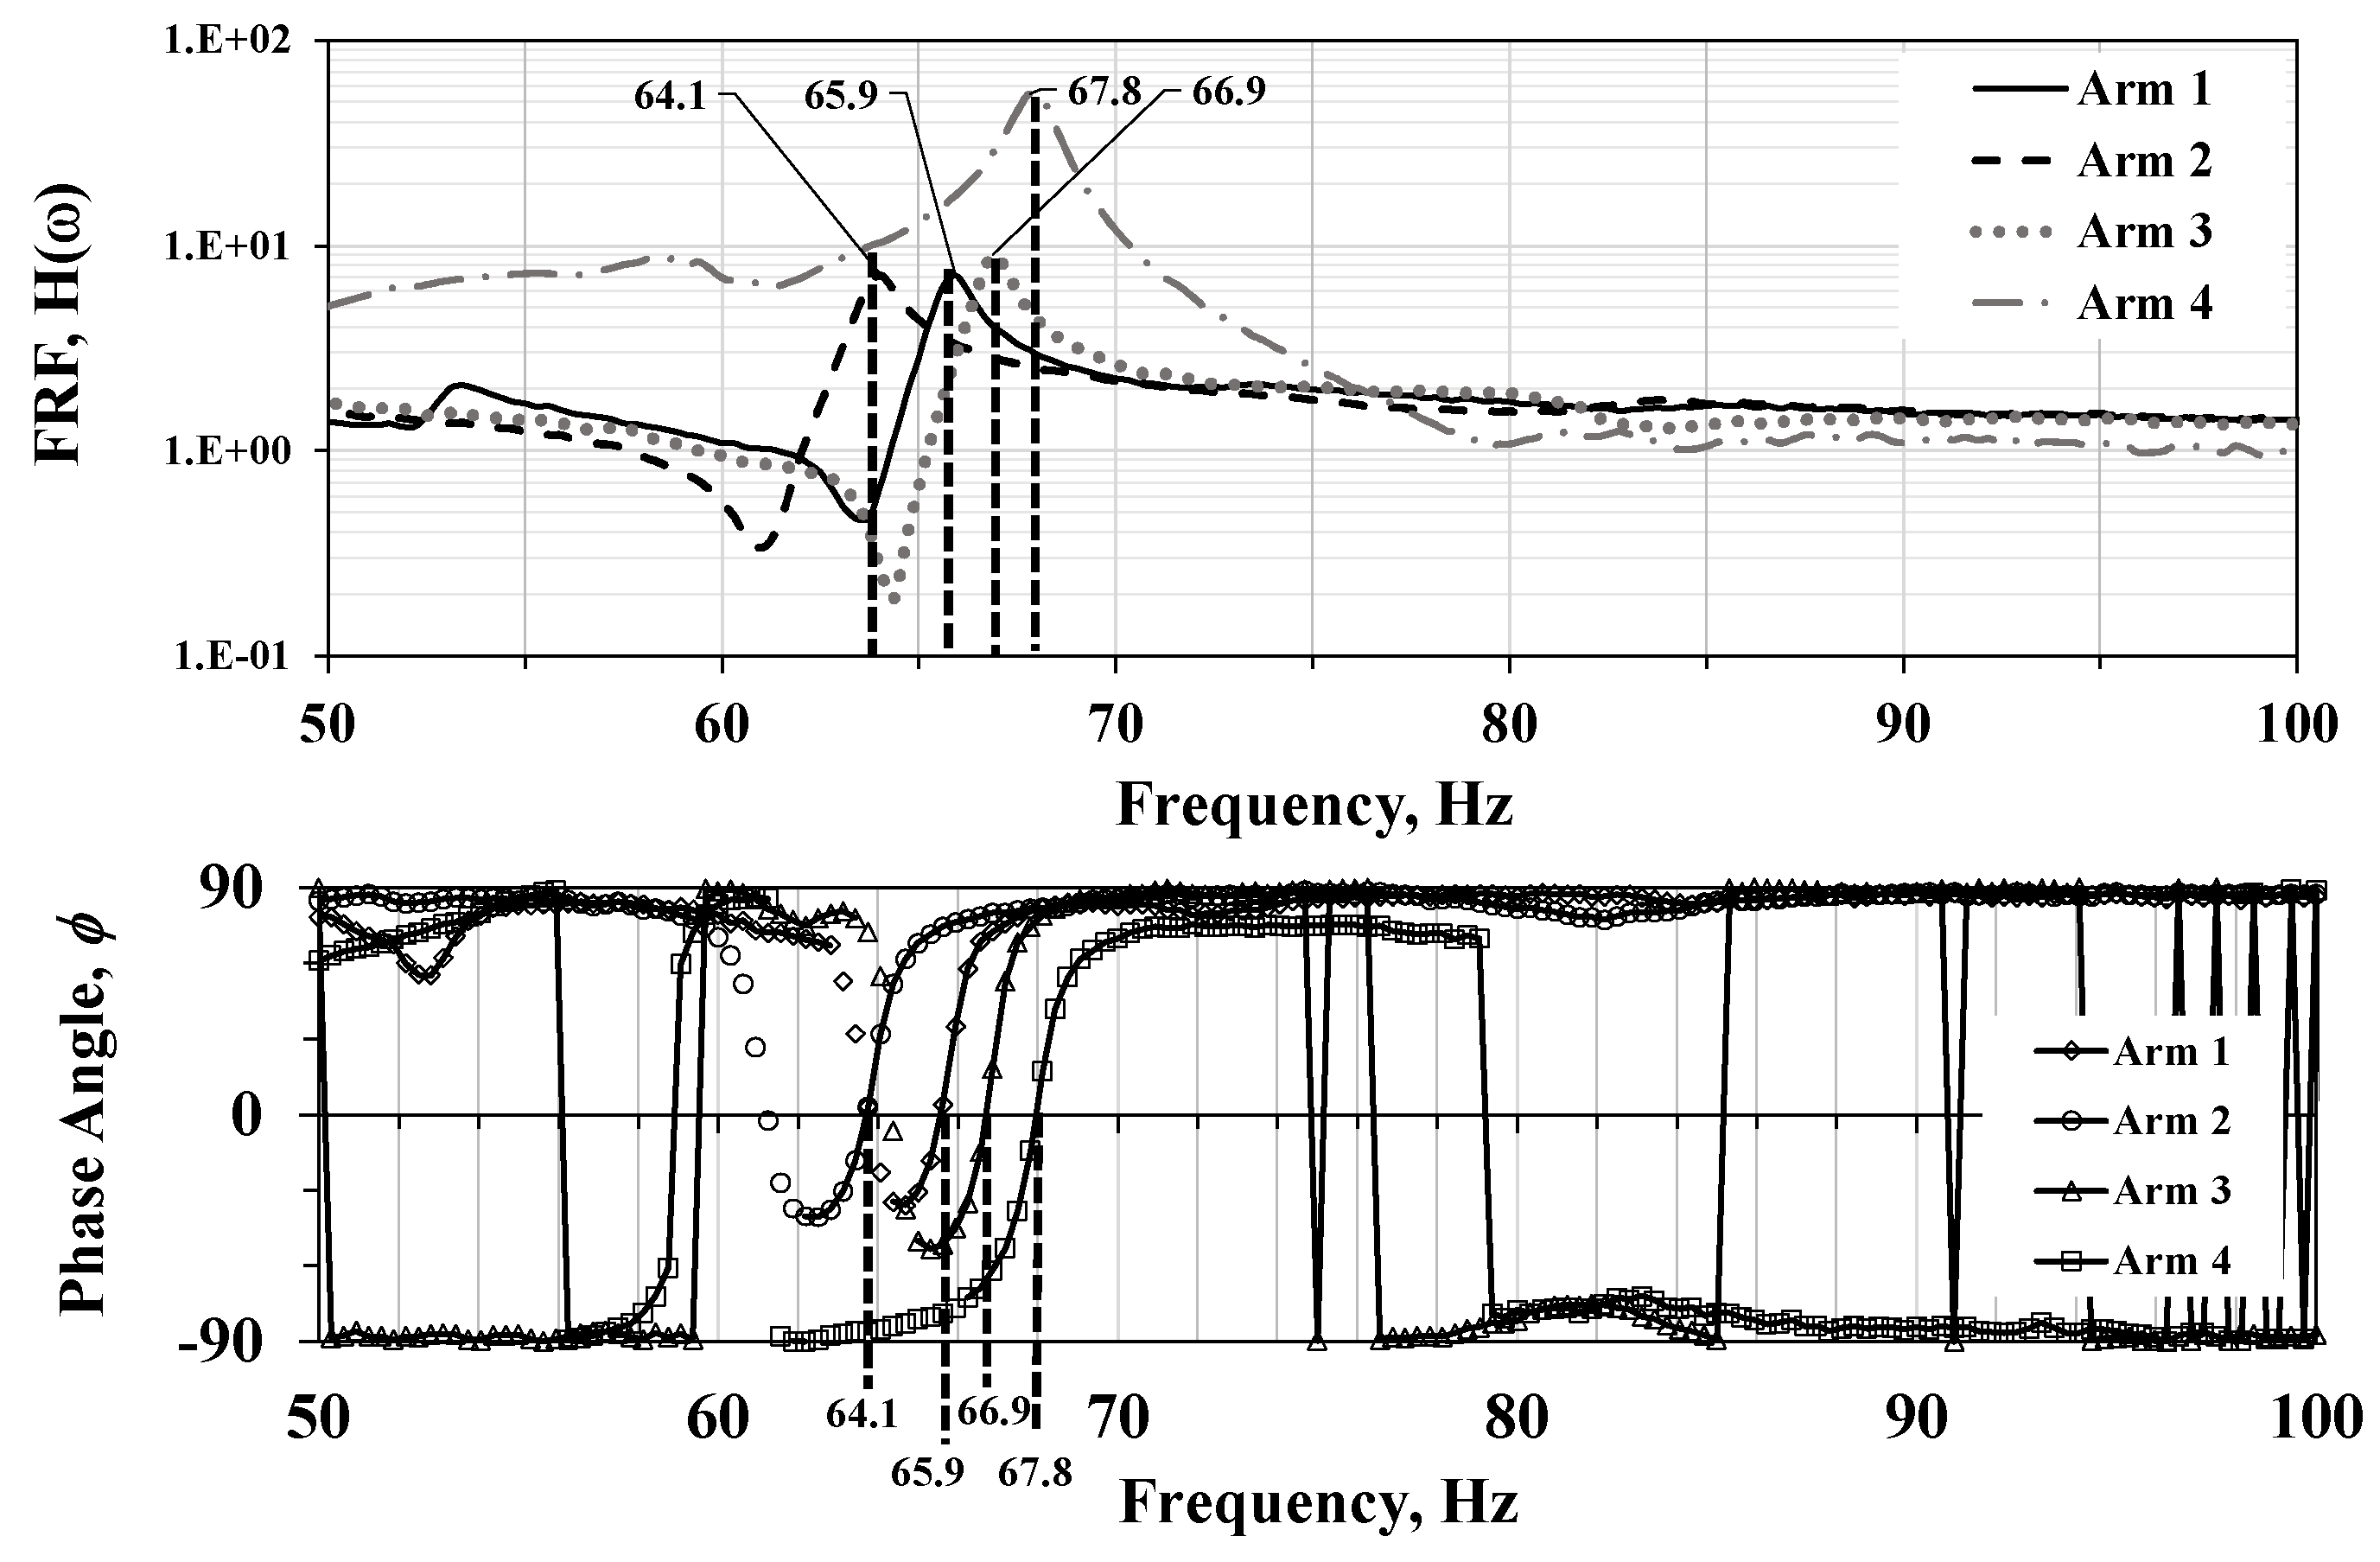
Exploring low frequency range for the arms between 50 and 100 Hz, were found only one peak for each arm with high damping. as is shown in
Figure 8.
4.2. Helices and Blades Resonance Results
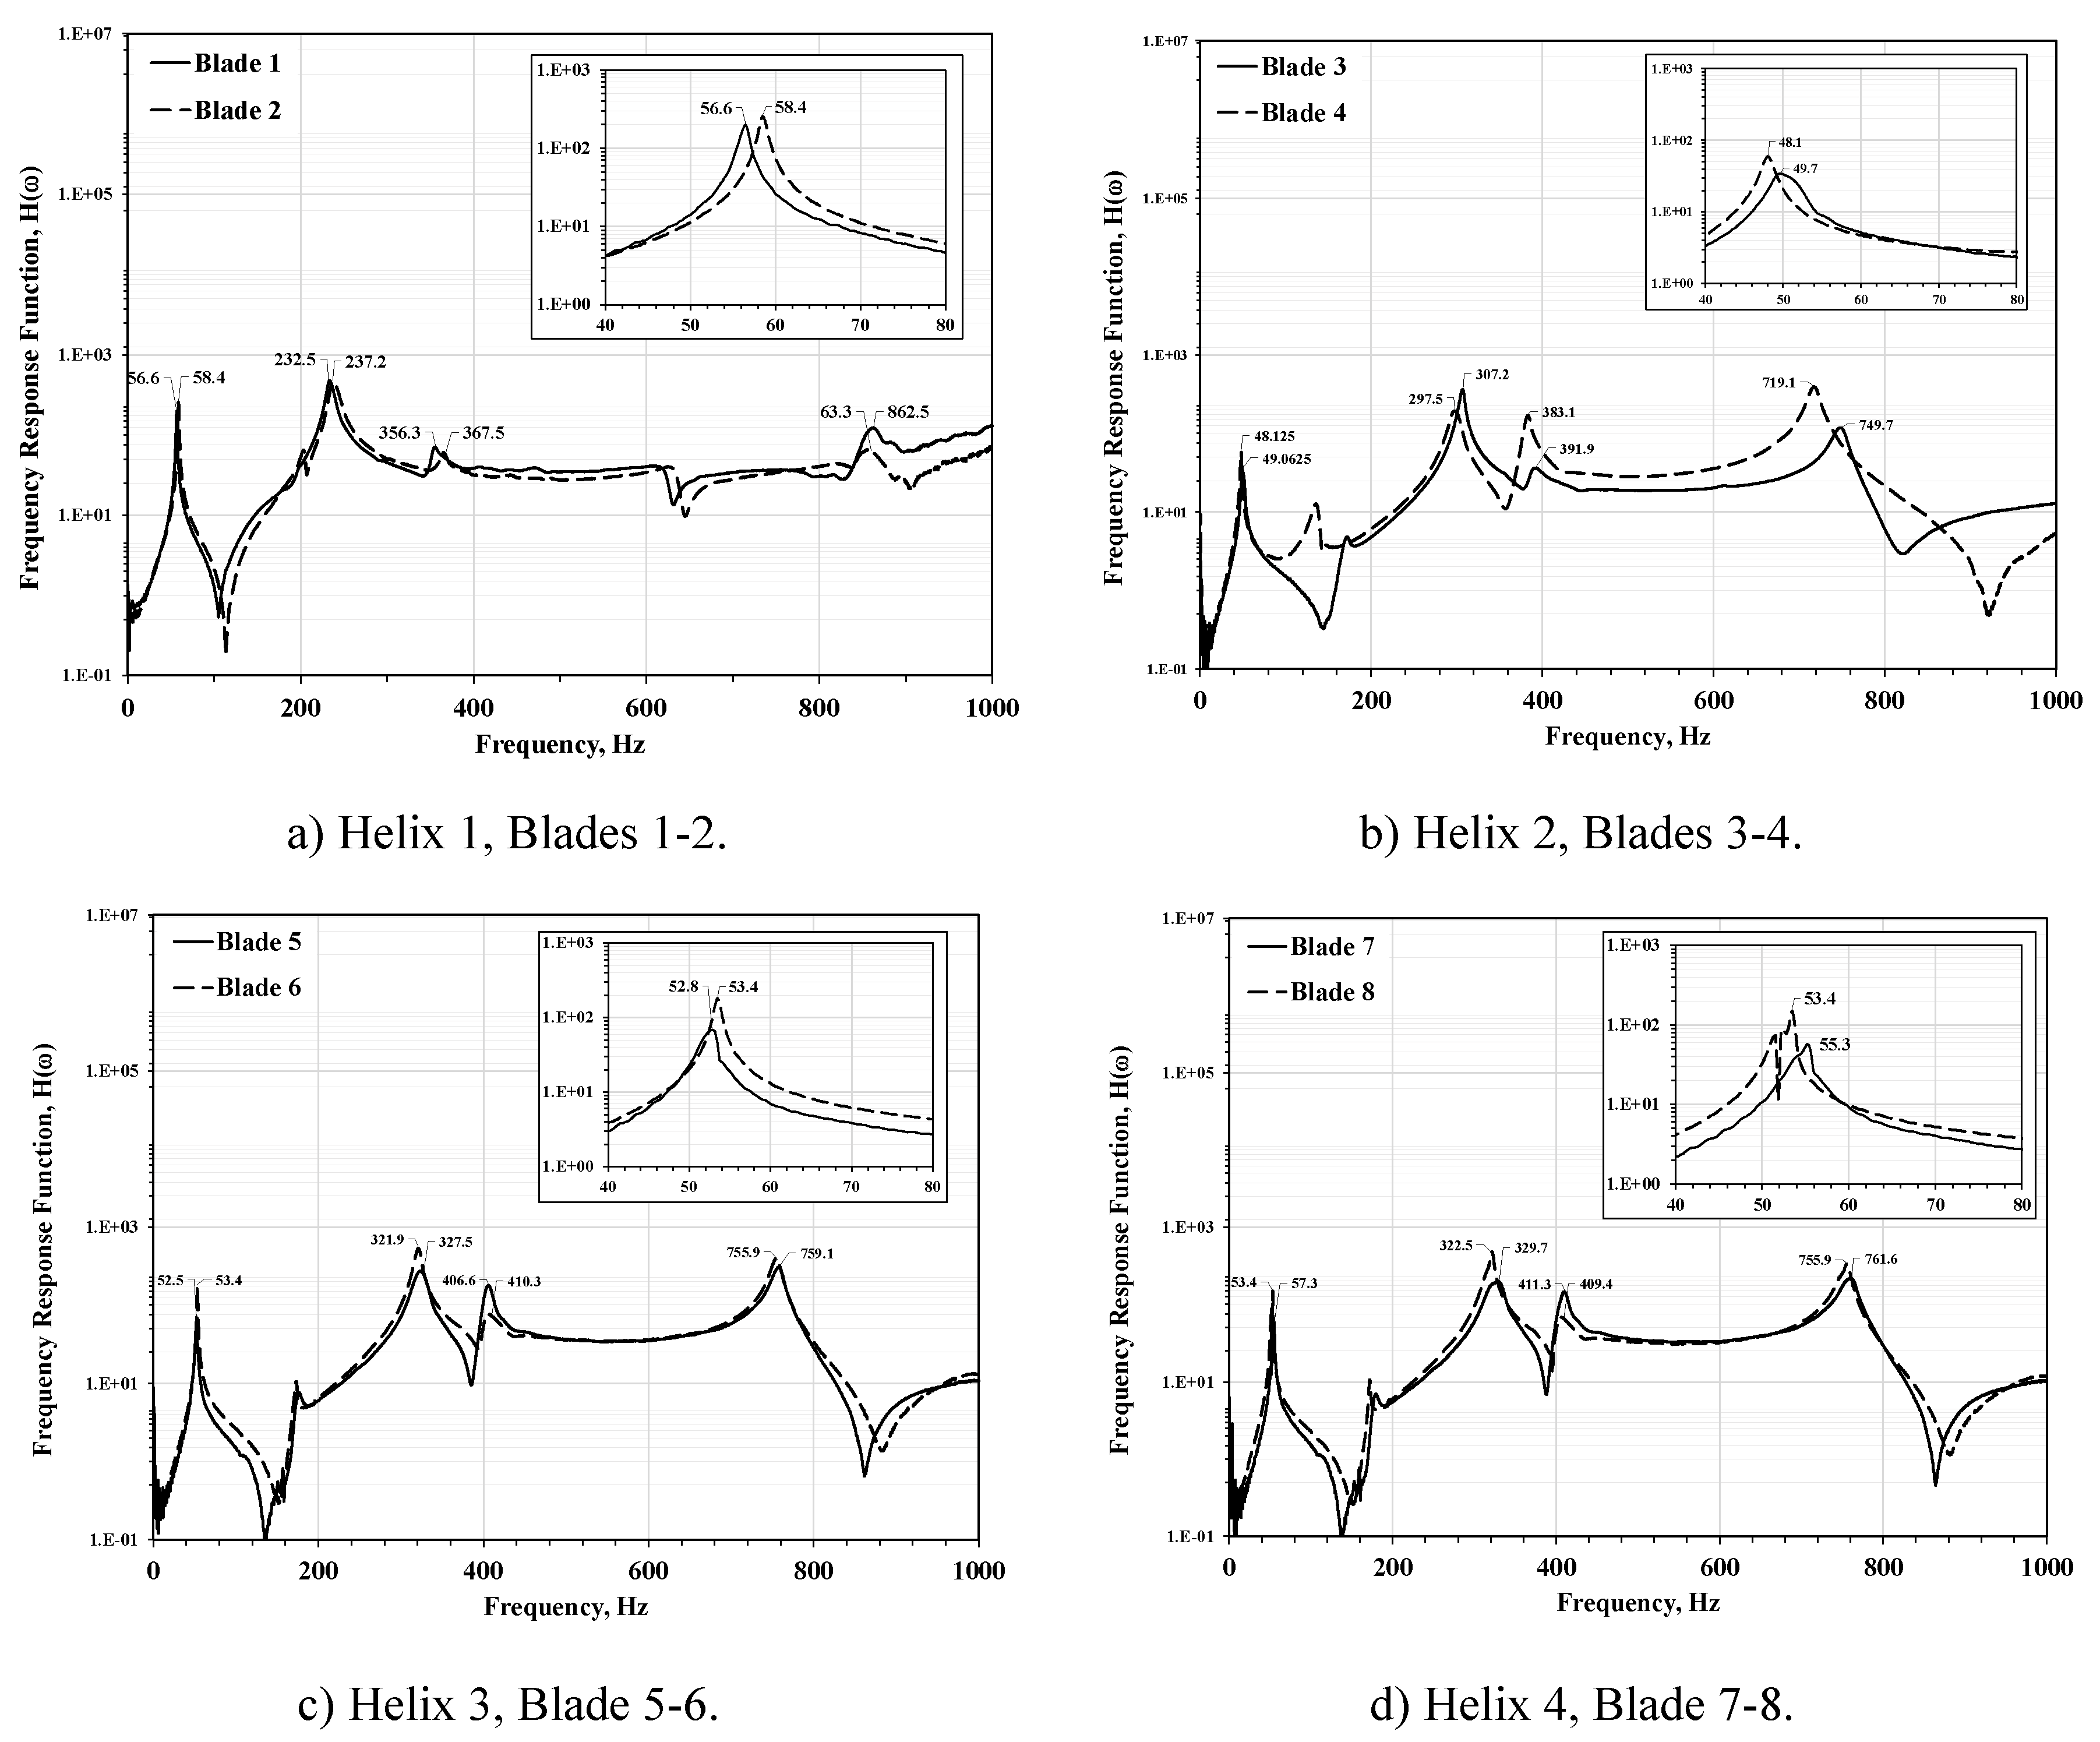
The helices were measured in pairs of blades and the same resonant frequencies can be observed in each pair because the manufacturing process of plastic injection of each helix. However, there are discrepancies between the four helices that shows almost the same number of resonance peaks but at different frequencies. The
Figure 8 shows the magnitude of the FRF for complete range and zoom for the first resonant peak at each pair or blades, a) Helix, Blades 1-2, b) Helix, Blade 3-4, c) Helix 3, Blade 5-6 and d) Helix, Blades 7-8.
Regarding the helices and blades, as shown in
Figure 9, within the range of 0 to 80 Hz, exhibits very similar resonant frequencies for example Helix pair 1-2, 56 and 58 Hz, Helix pair 3-4, 48 and 49 Hz, Helix pair 5-6, 52 y 53 Hz and Helix pair 7-8, 55 and 53 Hz. For the range of 100 Hz to 1000 Hz, FRF amplitudes and resonant peaks are very dissimilar.
The similarity exhibited between each pair of blades, could be attributed to the uniformity of the manufacturing process, either through plastic injection or 3D printing. However, although the same resonant peaks appear in all 8 blades, they occur at different frequencies, which poses the challenge of controlling or mitigating each resonant mode of each propeller within the operational ranges of interest.
For comparison proposals,
Table 1 presents a summary of resonance frequencies observed in arms showing peak frequencies in rows and each arm in columns. It can observe that there are slightly differences of resonance frequencies.
In
Table 2 the summary of the resonance frequencies and differences of blades is presented. It can observe that there are minimum differences of resonance frequencies at the peak 1, but there is more difference for the other three peaks between pairs of blades.
To have a complete comparison of peak frequencies,
Table 3 shows the difference between helices (Δ1-2, Δ1-3, Δ1-4, Δ2-3, Δ2-4, Δ3-4). It can observe that there are little differences of resonance frequencies at the peak 1, but there are more differences for the other three peaks between pairs of blades taking reference the minimum and maximum frequency for each pair.
5. Discussion
First, the four arms have an acceptable similarity for the five resonance peaks in the range from 18.8 to 67.8 Hz as is shown in
Figure 7,
Figure 8 and
Table 1. However, there are a lot of discrepancies between all the arms at high frequencies as is shown in
Figure 6.a.
Second, pairs of blades have good agreements between them individually with minimum differences (1 with 2, 3 with 4 etc.). For example, the minimum difference is 0.9 Hz between blade 5 and 6 for peak 1 and the maximum difference is -30.6 Hz between blade 3 and 4.
Third, at the comparison between helices, the differences are bigger than the blades individually as is shown in
Figure 9 and
Table 3. For example, the minimum difference is 0.7 Hz between helix 1 and 4 for peak 1 which is acceptable, however, there is a big difference between helix 1 and 2, 3 and 4 of -110.3, -100.9 and -98.4 Hz, respectively.
These differences are important challenges for the structural and full body stability and the automatic control of the Quadrotor. Because the speed rotor is variable to provide power and maneuvers control, is very critical to be aware of resonance of each element separately and coupled and apply control to minimize resonance effects.
The automatic control problem may increase if the rotor speeds differ for maneuvers such as forward, backward, lateral movements, or more complex maneuvers and external perturbations like gust loads, resulting in multiple scenarios where resonance frequencies would induce deviations in the control system, which the system itself would have to counteract to maintain stability.
From the perspective of structural dynamics, it would be necessary to standardize the frequency response by applying the following strategies:
- -
Control of the manufacturing process for the arms and propellers of the quadrotor. Optimize the design of the arms to reduce the amount of material while maintaining the minimum required strength of each arm.
- -
Control of the arm assembly process. Ensure quality control in the assembly process, paying special attention to the type of screws used at the root of the arm when joining with the flight control unit body.
- -
Control of the motor assembly process. Ensure careful assembly of the motors at the end of the arm, paying attention to the screws and tightening torque used.
- -
Control the propeller assembly process on the motor shaft and tightening with uniform and adequate torque on each propeller.
- -
Increase damping around the electric motors supports to suppress the excitation force directly impacting the structure.
- -
Increase the flexural stiffness of the arm and propeller structure through geometric optimization or proposing a new arm and propeller model.
- -
From the perspective of autonomous flight control, the following actions can be considered:
- -
Apply low-pass filters below 80 Hz to cancel the vibration signal received by the angle sensor of the control system in the range from 18.8 to 67.8 Hz.
- -
Apply band-pass filters in specific ranges of 80 to 1000 Hz to mitigate the undesirable effects of resonances at high frequencies.
6. Conclusions
An experimental analysis of the modal frequencies of a quadrotor was presented, to investigate problems due to vibration during normal stable and sustained flight. The process was performed by hammer testing on the frame and propellers of the quadrotor. It was found that while the fundamental frequencies or arms and blades are very similar, large differences were found in higher order resonances, which could be the result of manufacturing or assembling uncertainties. Consequently, this could cause different non symmetric resonances in several components at different operating speeds. It is suggested to perform structural modifications on the quadrotor to reduce those uncertainties and suppress possible resonances, as well as implementing changes in the control system to dynamically control vibration issues.
Funding
This research received no external funding.
Acknowledgments
In this section, we acknowledge the valuable support received from the Graduate School of the Faculty of Mechanical and Electrical Engineering at the Universidad Autónoma de Nuevo León. This support was instrumental beyond the author contributions and funding already mentioned. We are particularly grateful for the administrative assistance provided by the Doctoral Program in Aeronautical Engineering, which streamlined the research process.
Conflicts of Interest
The authors declare no conflicts of interest.
References
- P. Banerjee, R. Ghimire and E. Hale, "Vibration Anomaly Detection by Clustering in Unmanned Aerial Vehicles," in AIAA AVIATION Forum and Exposition 2023, San Diego, CA, USA, 2023.
- M. T. GÖRMÜŞ, B. F. ADIN and P. YAYLA, "Passive Isolator Design and Vibration Damping of EO/IR Gimbal Used in UAVs," International Journal of Aviation Science and Technology, vol. 4, no. 1, pp. 32-40, 2023. [CrossRef]
- Zhu, W.; Oakey, A.; Royall, P.G.; Waters, T.P.; Cherrett, T.; Theobald, K.; Bester, A.-M.; Lucas, R. Investigating the influence of drone flight on the stability of cancer medicines. PLOS ONE 2023, 18, e0278873. [CrossRef]
- Theobald, K.; Zhu, W.; Waters, T.; Cherrett, T.; Oakey, A.; Royall, P.G. Stability of Medicines Transported by Cargo Drones: Investigating the Effects of Vibration from Multi-Stage Flight. Drones 2023, 7, 658. [CrossRef]
- Oakey, A.; Waters, T.; Zhu, W.; Royall, P.G.; Cherrett, T.; Courtney, P.; Majoe, D.; Jelev, N. Quantifying the Effects of Vibration on Medicines in Transit Caused by Fixed-Wing and Multi-Copter Drones. Drones 2021, 5, 22. [CrossRef]
- C. Ge, K. Dunno, M. A. Singh, L. Yuan and L.-X. Lu, "Development of a Drone’s Vibration, Shock, and Atmospheric Profiles," Applied Sciences, vol. 11, no. 11, pp. 1-16, 2021.
- C. Ge, K. Dunno, M. A. Singh, L. Yuan and L.-X. Lu, "Random vibrations in unmanned aerial vehicles, mathematical analysis and control methodology based on expectation and probability," Journal of Low Frequency Noise, Vibration and Active Control, vol. 38, no. 1, pp. 3-202, 2018.
- S. Radkowski and P. Szulim, "Analysis of vibration of rotors in unmanned aircraft," in 2014 19th International Conference on Methods and Models in Automation and Robotics (MMAR), Miedzyzdroje, Poland, 2014.
- U. Kalita, R. Guntu, R. Seelam and G. Arshiya, "A review on the shape memory alloy, vibration dampers used in UAVs," in AIP Conf. Proc. 2962, 2024.
- Urdea, M. Stress and vibration analysis of a drone. IOP Conf. Series: Mater. Sci. Eng. 2021, 1009, 012059. [CrossRef]
- K. Chen, W. Meng and Z. Lu, "An investigation on the structural vibrations of multi-rotor passenger drones," International Journal of Micro Air Vehicles, vol. 15, pp. 1-10, 2023. [CrossRef]
- Wang, X.; Zhang, X.; Gong, H.; Jiang, J.; Rai, H.M. A flight control method for unmanned aerial vehicles based on vibration suppression. IET Collab. Intell. Manuf. 2021, 3, 252–261. [CrossRef]
- C. Ge, K. Dunno, M. Singh , L. Yuan and L.-X. Lu, "Development of a Drone’s Vibration, Shock, and Atmospheric Profiles," Applied Sciences, vol. 11, no. 11, pp. 1-16, 2021.
- Kim, Y.-S.; Eun, H.-C. Comparison of Damage Detection Methods Depending on FRFs within Specified Frequency Ranges. Adv. Mater. Sci. Eng. 2017, 2017, 1–9. [CrossRef]
- F. Khoshnoudian and. A. Esfandiari, "Structural damage diagnosis using modal data," Scientia Iranica, vol. 18, no. 4, pp. 853-860, 2011.
- E.-T. Lee, . Y.-S. Hong and H.-C. Eun, "Prediction of the Physical Properties of a Structural Member by the Impact Hammer Test," Sensors, vol. 22, no. 6762, pp. 1-14, 2022.
|
Disclaimer/Publisher’s Note: The statements, opinions and data contained in all publications are solely those of the individual author(s) and contributor(s) and not of MDPI and/or the editor(s). MDPI and/or the editor(s) disclaim responsibility for any injury to people or property resulting from any ideas, methods, instructions or products referred to in the content. |
© 2024 by the authors. Licensee MDPI, Basel, Switzerland. This article is an open access article distributed under the terms and conditions of the Creative Commons Attribution (CC BY) license (http://creativecommons.org/licenses/by/4.0/).
