
You are currently viewing a beta version of our website. If you spot anything unusual, kindly let us know.
Preprint
Article
Impact of Shaking Exercise on Functional Recovery in Patients with Chronic Post-Stroke Upper Limb Paralysis: A Multicenter, Open-Label, Quasi-Randomized Controlled Trial
Altmetrics
Downloads
113
Views
65
Comments
0
A peer-reviewed article of this preprint also exists.


This version is not peer-reviewed
Abstract
Stroke causes disability and significantly affects patient quality of life. Post-stroke rehabilitation of upper limb function is crucial, as it affects daily activities and individual autonomy. Traditional rehabilitation methods often require frequent visits to specialized centers, which can be costly and challenging. This study investigated the effectiveness of a home-based self-training device, "Kenko Yusuri," in improving upper limb function in patients with chronic stroke. This multicenter prospective intervention study used a quasi-randomized controlled trial design. Ninety-three outpatients from five hospitals in Japan were enrolled and assigned to either the intervention group who used the "Kenko Yusuri" device or the control group who underwent conventional rehabilitation. All patients received botulinum toxin type A (BoNT-A) injections to treat upper limb spasticity. The primary outcome measure was the Fugl-Meyer Assessment (FMA) of upper-extremity motor function. Secondary outcomes included the modified Ashworth scale (MAS) score, range of motion (ROM), and chronic pain assessments. The intervention group demonstrated significantly greater improvements in FMA total scores than the control group. Patients with moderate paralysis experienced the greatest benefits from the intervention. There were no significant between-group differences in MAS scores or ROM measurements. Pain and wrist ROM showed improvement in the intervention group. Home-based training with a shaking device significantly improved upper limb function in patients with moderate chronic post-stroke paralysis. This approach aligns with the principles of use-dependent plasticity and offers a feasible and cost-effective alternative to traditional rehabilitation methods.
Keywords:
Subject: Medicine and Pharmacology - Medicine and Pharmacology
1. Introduction
Stroke remains a leading cause of disability globally, profoundly affecting the quality of life of millions each year [1,2]. Rehabilitation of post-stroke upper limb function is crucial [3,4], as it directly affects patients’ ability to perform daily activities and enhances individual autonomy [5,6,7]. Although traditional rehabilitation methods such as physical therapy and pharmacological interventions are effective, they typically require frequent visits to specialized centers. This can be costly and logistically challenging for many patients, particularly those who may require prolonged therapy [8,9].
Spasticity is a common complication in patients with severe stroke that leads to pain and significant motor dysfunction. Treatment often involves long-term management strategies, including the use of botulinum toxin type A (BoNT-A), which has been widely adopted for its efficacy in reducing muscle hypertonicity and associated discomfort [8,9,10,11,12,13]. However, botulinum therapy is repetitive and invasive, and when administered alone it may not improve upper limb function; it must be combined with occupational therapy [14]. Patients with chronic stroke are required to exercise at home to improve their upper limb function and require assistance from their family members [15]. This long-term, daily independent training may be physically and mentally demanding for patients and their families [16].
Recent advancements in noninvasive cerebral stimulation therapies such as repetitive transcranial magnetic stimulation (rTMS) combined with intensive upper limb training have shown promise in improving functions previously considered irreversible [4,17,18,19,20,21]. Despite these advancements, the accessibility of innovative treatments in home settings remains limited, which poses a significant barrier to sustaining patient engagement and recovery. The integration of home-based training devices into standard post-stroke rehabilitation protocols could therefore represent a transformative approach to care, reducing the burden on healthcare systems, while simultaneously improving patient outcomes.
Occupational therapists manually perform rehabilitation to treat upper limb dysfunction as an after-effect of stroke [22,23], and the concept of user-dependent plasticity is particularly relevant in patients with chronic stroke [24,25]. This suggests that the nervous system can functionally reorganize itself in response to the demands placed upon it, implying that consistent, repetitive use of the affected limbs can lead to improved motor function and recovery over time. Therefore, the development of home-based self-training devices, like the "Kenko Yusuri" is not only innovative but essential. These devices enable patients to engage in regular structured training at home without continuous professional supervision, and align with the principles of use-dependent plasticity by facilitating frequent and repetitive use of the impaired limbs. This approach not only makes rehabilitation more accessible and cost-effective but also allows for therapy customization to meet individual needs, thereby enhancing the potential for recovery. These devices also ensure continuity of care, enabling patients to maintain and improve the long-term gains achieved in clinical settings. Additionally, the "Kenko Yusuri" shaking device is expected to offer therapeutic benefits in the management of spasticity. Its vibrational features are expected to relieve muscle tension, potentially complementing or reducing the need for invasive treatment. This could significantly enhance the quality of life and functional independence of stroke survivors by providing a nonpharmacological option for managing one of the most challenging complications of stroke recovery.
Integrating home-based training devices into standard post-stroke rehabilitation protocols may represent a transformative approach to care; it may alleviate the burden on healthcare systems, while simultaneously improving patient outcomes. The aim of this study was to evaluate the effectiveness of the "Kenko Yusuri" shaking device in improving upper limb function in patients with chronic stroke, thereby reducing the physical and mental burden on patients and caregivers.
2. Materials and Methods
Study Participants
This multicenter prospective intervention study adopted a randomized trial design and included outpatients enrolled between MM 20XX and MM 20XX at five hospitals in Japan. Patient data were collected from Jikei University Hospital [Tokyo], Aomori Shintoshi Hospital [Aomori], Izumi Memorial Hospital [Tokyo], Gosho Minami Rehabilitation Clinic [Kyoto], and Nishi Hiroshima Rehabilitation Hospital [Hiroshima]) and were subsequently analyzed.
Participants were included if they: 1) were stroke patients with upper limb paralysis who were aged >20 and <80 years; 2) had stroke onset at least 6 months prior; 3) had upper limb Brunnstrom recovery stage III to V, 4) were undergoing ongoing botulinum therapy for upper limb spasticity; 5) did not have cognitive impairment; and 6) had been fully informed of the study and provided voluntary written consent based on their full understanding of the study.
Patients were excluded if: 1) they had implanted medical devices (pacemakers or cochlear implants, etc.); 2) had serious cardiac disease; 3) were pregnant or suspected of being pregnant; 4) were judged by the principal investigator to be inappropriate for participation; 5) had unstable or urgent medical conditions (acute heart failure, acute renal failure, acute liver failure, severe diabetes, infectious diseases, etc.); or 6) had participated in other clinical studies within 4 months.
Study Design
This study was conducted as a multicenter, open-label, quasi-randomized controlled trial. Participants were classified by upper extremity Fugl-Meyer Assessment (FMA) score and assigned to the intervention group or control group in the order of enrollment. All participants were informed of how the study results would be used and signed an informed consent form agreeing to participate. The study was performed over 12 weeks. The study group underwent voluntary training using the shaking device, whereas the control group underwent conventional voluntary training (Figure 1). The shaking device used in this study was a "Kenko Yusuri" (JMH100, Top Run Corporation, Japan) [26,27].
Self-training using the shaking device
The shaking device was used by gripping the handle with the affected upper limb. Patients who could not grip the handle were allowed to use it by placing their palms or distal forearms on the handle.
The handle was moved by approximately 13 cm vertically at 1 Hz continuously for 10 min. If the upper limb dropped off during the exercise, the patient was allowed to stop the device once and resume use. Ten min of use was allowed per self-training session, and self-training was conducted three times a day (30 min in total). The self-training status was recorded by the patients on a form, which was collected and checked by the physician in charge at the end of each study period.
Adjunctive therapy
All patients received BoNT-A injections for upper limb spasticity (up to 400 units for the upper limb) as adjunctive therapy. The BoNT-A injection was administered immediately before the start of the shaking exercise in the study group; the control group was injected immediately before the start of observation, and no additional doses were allowed to be administered until the end of the evaluation. The following concomitant therapies were prohibited: 1) electrical stimulation therapy, 2) repetitive transcranial magnetic stimulation therapy, 3) transcranial direct-current electrical stimulation therapy, and 4) robotic rehabilitation therapy. They were prohibited during the entire study period (from the date consent was obtained until the last observation date). In addition, the initiation of new muscle relaxants was prohibited during the study period (from the date of consent to the date of final observation). If patients were taking them routinely, the dosage and administration method were not changed during the study period.
This study was approved by the Clinical Review Board of Jikei University Educational Corporation (CRB3180031). The study was registered in the Japanese Registry of Clinical Trials (jRCTs032200164) by the Ministry of Health, Labour, and Welfare.
Outcome measures
The Fugl-Meyer assessment (FMA) score was used as the main outcome in this study. It evaluates motor function, sensory function, balance, range of motion, and joint pain, and is divided into 66 points for the upper extremity. In this study, only the upper extremity was tested, and shoulder, wrist, and hand reflexes, voluntary movements, and coordinated movements were examined; the FMA method was chosen because of its high reliability, reproducibility, and validity [28,29,30]. The severity of paralysis according to the FMA score is as follows: ≤20, severe; 21–45, moderate; and 46–66, mild paralysis [31]. Secondary outcomes included the modified Ashworth scale (MAS) used to assess the degree of spasticity [32], range of motion (ROM) using active and passive joint movement, and subjective chronic pain using the visual analog scale (VAS) [33].
Statistical Analysis
We employed generalized linear mixed models (GLMM) [34] to analyze the impact of interventions and treatment periods on FMA scores, while adjusting for baseline FMA scores [35]. Our model included fixed effects for the intervention status, treatment periods, and pretreatment FMA scores (Total, A, B, C, and D), with random effects accounting for individual patient variability. GLMM analysis was performed using the restricted maximum likelihood (REML) method to provide unbiased estimates of variance and covariance parameters under fixed-effect model specifications. To evaluate the effects of the intervention, a GLMM was constructed as follows.
where y^ij is the predicted FMA score for patient jj at time ii; β0 is the model intercept, representing the baseline score before treatment in the absence of intervention; β1 represents the effect of the intervention group, where a positive value indicates that the intervention was effective; β2 quantifies the effect of the treatment period, with 1 indicating pre-treatment and 2 indicating post-treatment; β3 captures the impact of the pre-treatment FMA score, reflecting how baseline scores influence outcomes post-treatment; uj represents random effects specific to each patient, modeling inter-individual variability; and ϵij is the error term, accounting for measurement errors and other unobserved variations.
y^ij=β0+β1×Interventionij+β2×(Periodsij−1)+β3×FMA_preij+uj+ϵij
This model allows for a quantitative assessment of how the presence or absence of an intervention and the pre- and post-treatment periods affect functional improvement in patients.
To assess the adequacy and fit of our model, we used the Akaike information criterion (AIC) and Bayesian information criterion (BIC). These indices are crucial for model selection and help compare the relative goodness-of-fit of the statistical models. Considering the complexity of the model, lower AIC and BIC values indicate a better fit to the data. The AIC focuses on the trade-off between the goodness of fit and simplicity of the model, penalizing the inclusion of unnecessary variables. The BIC provides a stricter penalty for models with more parameters, thus preventing overfitting.
For stratification analysis, patients were stratified by severity using the baseline FMA score, ensuring that our model adjustments were specific to each severity group (≤20, severe; 21–45, moderate; and 46–66, mild paralysis) [31]. This stratification allowed us to assess the impact of the intervention more precisely within homogeneous subgroups defined by baseline clinical severity.
Post-hoc comparisons of changes (Δvalue) in between-group differences were performed using the Mann–Whitney U-test. In addition, intragroup comparisons were performed using the Wilcoxon signed-rank test. All statistical tests were two-sided, and significance was set at p<0.05. No statistical sample size calculations were performed. However, we performed post-hoc power and effect size analyses on the results of the 93 patients in this study using G*Power version 3.1 (Heinrich-Heine-Universität, Düsseldorf). We calculated the post-hoc power critical z=0.19, 1-β=0.48, and effect size h=0.4 using the z-test. Where data was missing from our study, we applied multiple imputation techniques to estimate and replace the missing values, ensuring comprehensive data analysis. This approach is aligned with the recommended practices for handling missing data in clinical research as detailed by Sterne et al. (2009), who emphasized the importance of addressing such gaps to maintain the validity of statistical inference [36].
Data analysis was conducted using Python (version 3.8, Wilmington, DE, USA). We used the ‘pandas‘ library (version 1.2.0) for data preprocessing and the ‘statsmodels’ library (version 0.12.0) to construct generalized linear mixed models (GLMM) using the ‘mixedlm’ function. The flexibility of Python allows for rigorous data manipulation and detailed modeling.
3. Results
Ninety-three patients with stroke were prescribed rehabilitation treatment at five medical institutions during the study period. The patients were randomly assigned to either the shaking exercise or the conventional therapy group at each hospital. The number of patients varied among the participating hospitals, ranging from nine to 41 per institution. All eligible patients were included (Table 1). Data from all 93 patients were analyzed (Figure 2).
Based on the GLMM analysis, after adjusting for the baseline FMA total score and including the random effect of individual differences, the shaking device intervention had a significant effect on the FMA total score (coefficient=0.69, SD=0.30, z=2.67, CI=[0.39 - 2.56], p=0.01). Similarly, a significant main effect difference was observed between pre- and post-intervention (Table 2).
No significant effect of the intervention was observed on the FMA subscores. Therefore, the predictive equation for the total FMA score was formulated as follows:
FMA_total=1.5+0.7×Interventionij +1.2×Periods+1.0×baseline_FMA_total
Values were inserted into the predictive equation to determine the improvement in the intervention group scores compared with those of the control group across the intervention period:
- eq 1. Control, Pre-intervention:
y^control, pre=1.5+0.7×0+1.2×(1−1)+1.0×baseline_FMA_total=1.5+FMA_pre
- eq 2. Control, Post-intervention:
y^control, post=1.5+0.7×0+1.2×(2−1)+1.0×baseline_FMA_total=2.7+FMA_pre
- eq 3. Intervention, Pre-treatment:
y^intervention, pre=1.5+0.7×1+1.2×(1−1)+1.0×baseline_FMA_total=2.2+FMA_pre
- eq 4. Intervention, Post-treatment:
y^intervention, post=1.5+0.7×1+1.2×(2−1)+1.0×baseline_FMA_total=3.4+baseline_FMA_total
- To estimate the improvement from pre- to post- in the control group:
Δcontrol =(2.7+baseline_FMA_total)−(1.5+baseline_FMA_total)=1.2
- From pre- to post- in the intervention group:
Δintervention=(3.4+baseline_FMA_total)−(2.2+baseline_FMA_total)=1.2
Interestingly, based on these calculations, both groups showed the same improvement of 1.2 points from pre-treatment to post-intervention when adjusted for the baseline FMA score. However, the intervention group scored 1.2 points higher at each stage than the control group due to the intervention effect (0.7 points directly from intervention status by GLMM). Thus, although the improvement due to the treatment period was the same, the intervention group consistently scored higher because of the effect of the intervention itself.
Table 3 provides post-hoc multiple comparisons of upper limb functional recovery measured using FMA-UE scores pre- and post-intervention involving the shaking exercise. The intervention group (Δ1.8 [0.8, 2.8]) showed a statistically greater improvement than the control group (Δ0.4 [-0.1, 1.0]) in FMA-UE total score (p=0.04, r=-0.24). A significant difference was observed in the intervention group's improvement in FMA-UE sub-score A (Δ1.2 [0.6, 1.8] vs. Δ0.3 [-0.2, 0.9], p=0.01, r=-0.29). Smaller changes were noted in both groups, with no significant differences detected in the FMA-UE sub-scores B (p=0.56, r=0.06), C (p=0.37, r=0.10), and D (p=0.16, r=0.11) (Figure 3).
Stratified analysis using GLMM showed that the intervention group had a mean increase of 1.03 points in the FMA total score (95% CI: 0.09, 1.98; p=0.033) in the moderate group. Furthermore, a mean increase of 1.38 points was observed post-intervention (95% CI: 0.46, 2.31; p=0.003). Additionally, the baseline FMA total value proved to be a significant predictor in the model, with a coefficient of 0.97, indicating statistically significant effects (95% CI: 0.91, 1.03; p<0.001) in the moderate group. The intervention effect was not statistically significant in the severe (coefficient=0.17, p=0.61) or mild groups (coefficient=0.05, p=0.61), suggesting that the intervention did not lead to measurable improvements in motor function compared with the control group. However, the significant periods effect in the severe (coefficient=0.68, p=0.02) and mild groups (coefficient=1.44, p=0.04) demonstrated that improvements were observed in both groups over time regardless of the intervention status (Table 4).
An intention-to-treat analysis was performed for secondary outcomes. The collection of MAS, ROM, and VAS data for the eight patients at one participating clinic was not feasible owing to the constraints imposed by the Japanese insurance system. To overcome this limitation and ensure the continuity and completeness of our dataset for secondary outcome analysis, missing MAS, ROM, and VAS data were imputed using multiple techniques.
To examine the effects of the intervention on chronic pain using the VAS, Wilcoxon signed-rank tests were performed to compare the pre- and post-intervention scores within each group. In the control group, a significant difference in the VAS scores was observed from pre- to post-intervention (W=23.00, p=0.02, Cohen’s d=0.00). Conversely, no significant changes were observed in the intervention group (W=8.00, p=0.60, Cohen’s d=0.00). A comparison of changes in the MAS scores, joint ROM, and pain perception measurements pre- and post-intervention between the shaking exercise and control groups showed no statistically significant differences for any of the parameters measured (Table 5).
Significant within-group changes in the control group were particularly notable in MAS elbow extension (W=19.5, p=0.005, effect size r=-0.839) and MAS wrist flexion (W=6.0, p=0.083, effect size r=-0.861). The other scores in the control group did not show statistically significant differences. In the intervention group, although there were no statistically significant overall changes, the MAS wrist flexion score showed a moderate effect size (W=97.5, p=0.206, effect size r=-0.720).
In within-group comparisons of the intervention group, the most significant change was observed in active shoulder extension ROM (W=93.0, p=0.011, effect size r=-0.727), indicating a statistically significant decrease in shoulder extension ROM following the intervention. Other ROM measurements showed no significant changes, with effect sizes indicating slight to moderate reductions, such as in passive elbow extension ROM (W=97.0, p=0.512, effect size r=-0.721) and passive wrist extension ROM (W=162.5, p=0.056, effect size r=-0.620). In the control group, no significant changes were observed in most ROM measurements after treatment. However, notable changes with moderate effect sizes were identified for several measurements, although they did not reach statistical significance at conventional thresholds.
This method allowed us to statistically estimate missing data based on available patient information and characteristics observed in complete cases. Table A1 presents the results of the per-protocol analysis of the secondary outcomes. Using non-imputed data, patients in the intervention group maintained a significantly greater active ROM in shoulder extension (Δ5.4 vs.Δ-1.3) and wrist active flexion (6.6 vs. 1.5; p=0.03), and less pain (-0.61 vs. 0.15) than the control group.
Only 1/47 patients (2.1%) in the test group experienced an adverse event that was undeniably related to the shaking device. The patient experienced mild pain in the clavicular area, which improved with follow-up. There were no adverse events in the control group.
4. Discussion
This study evaluated the effects of home-based training using a vibrational device, termed the "Kenko Yusuri" on functional recovery in patients with chronic post-stroke upper limb paralysis. According to the FMA-UE scores, the shaking exercise group showed significantly greater improvements than the control group that engaged in conventional training. Notably, this intervention was particularly effective in patients with moderate paralysis, suggesting that vibrational stimulation can enhance neuroplasticity and sensory-motor integration [37], potentially facilitating motor function recovery [38,39]. The efficacy of the intervention was further supported by the results derived from the GLMM analysis, which provided a predictive model for quantification of the intervention's impact on functional improvements.
Jiggling and vibratory exercises also reduce muscle spasticity, which is commonly observed among stroke survivors [40]. In this study, the use of a home-based shaking device significantly improved the total FMA scores of patients with moderate paralysis, demonstrating the efficacy of the device in activating sensorimotor pathways [41], which are often underused in paralyzed upper limbs [42]. Vibratory stimuli enhance proprioceptive feedback, which is essential for the motor learning and rehabilitation of individuals with neurological impairments. Recent studies have investigated the effects of vibration stimulation on upper limb spasticity after stroke, specifically comparing the effectiveness of vibration stimulation of the tendons and muscle bellies [43]. Vibration applied directly to the flexor tendon showed significantly greater reductions in spasticity than when it was applied to the muscle belly or after regular stretching. Vibratory stimulation is consistent with the hypothesized mechanism that tendon stimulation is more effective because of its effect on the Golgi tendon organ, which plays an important role in regulating muscle tone [44].
Improvements in upper limb paralysis with spasticity often necessitate the continuation of BoNT-A treatment for at least four sessions, alongside regular training [45]. However, progression towards functional improvement tends to plateau with prolonged treatment. Patients who have undergone >10 sessions of BoNT-A therapy typically show minimal functional enhancement, reaching a plateau in their recovery. For these long-term treatment patients, pain reduction is the primary goal and outcome, while spasticity control is essential for maintaining quality of life [46]. The patients in the present study underwentmultiple BoNT-A treatments, suggesting that their upper limb function may have reached a plateau despite consistent self-training. These patients often continued regular BoNT-A treatment and self-training. Although initial improvements in motor function may have been observed, these gains plateaued over time. Therefore, the unchanged MAS scores in the present study may be attributed to a plateau effect. Nonetheless, similar to the control of spasticity achieved with BoNT-A treatment, continuous self-training remains crucial.
In our study, patients with stroke used a shaking device at home, either independently or with family assistance. This approach aligns with emerging research suggesting that the engagement of patients in active movement is beneficial for recovery from paralysis. Recent research supports the idea that active participation in rehabilitation by patients with stroke can significantly enhance recovery outcomes [47]. This includes patients taking an active role in their recovery through home-based interventions, as these interventions have been shown to be effective for motor function recovery after stroke. Incorporating exercise and functional task practices into daily routines, as emphasized in recent guidelines, is crucial for motor recovery. These activities are most effective when they involve high repetition and are tailored to an individual's specific needs, allowing for the patient's active participation in the rehabilitation process (National Clinical Guideline for Stroke, 2023) [48]. The importance of patient-driven activities in stroke rehabilitation suggests that interventions should not only be guided by healthcare professionals but also encourage self-practice and active involvement in therapeutic activities to maximize recovery outcomes.
In the results of this study, in which varying degrees of stroke severity demonstrated different responses to shaking device interventions, it is important to consider the influence of initial impairment severity on rehabilitation outcomes. This differential response aligns with previous findings in stroke rehabilitation, suggesting that the initial severity of paralysis can significantly dictate the potential and rate of functional recovery [20,46]. Severe and mild cases often present with distinct challenges. Severe cases may involve extensive neurological damage, which limits the efficacy of peripheral stimulation interventions, as the central pathways may be too impaired to translate peripheral sensory inputs into meaningful motor outputs. Mild cases, on the other hand, may not show dramatic improvements simply because their baseline function is already high and the ceiling effect limits observable changes [49]. These observations underscore the necessity for a stratified approach to treatment and tailoring interventions to match the severity of impairment. Understanding and integrating severity-specific responses into rehabilitation protocols can optimize recovery trajectories and ensure that each patient receives the most appropriate and effective intervention tailored to their needs [50].
The intervention group in our study exhibited a mean increase in FMA-UE scores; however, these gains did not surpass the minimum clinically important difference (MCID) threshold [51]. The use of a shaking device represents a novel approach that provides specific neuromuscular stimulation, which may not be traditionally targeted in conventional stroke rehabilitation. Although neuroplasticity can still be promoted in the chronic phase of stroke recovery, the extent to which it can be influenced is often constrained by the severity and location of brain injury. Consequently, even modest improvements in the FMA-UE scores could indicate beneficial neurological adaptations [2,17]. The concept of MCID is critical for assessing the efficacy of interventions. However, it is inherently a population-based measurement that may not capture subtle yet clinically meaningful improvements at the individual level. Future studies should consider a personalized approach to therapy, emphasizing prolonged intervention durations and comprehensive outcome measures to fully capture the benefits of rehabilitation interventions.
This study, while innovative in its approach to post-stroke rehabilitation, has several limitations. First, the relatively small sample size and quasi-randomized design of our study may limit the generalizability of the findings. Larger, fully randomized controlled trials are recommended to confirm these results and enhance their applicability to a broader population of patients with stroke. Second, our findings indicated the variable efficacy of the intervention across different levels of severity of paralysis. The intervention showed significant benefits in patients with moderate severity, but not in those with mild or severe impairments. This suggests that the effectiveness of the intervention is contingent on the patient's initial functional status, necessitating further investigation of tailored therapeutic approaches for different severity levels. Third, all the participants received BoNT-A treatment, which may have confounded the effects of the shaking device on motor recovery. Future studies should consider separate groups for those receiving BoNT-A and those who do not to isolate the effects of the shaking device. Fourth, variability in adherence to the intervention protocol owing to the home-based nature of the therapy may have influenced the outcomes. Ensuring the consistent application of the intervention in such settings remains a challenge, and methods for monitoring and improving home-based intervention fidelity should be integrated into future studies. Fifth, the primary outcome measure, the FMA-UE, may not have captured all relevant aspects of functional improvement owing to its susceptibility to ceiling effects [49], particularly in patients with mild impairment. Including additional functional and patient-centered outcome measures could provide a more comprehensive assessment of the intervention's impact.
Continued BoNT-A treatment combined with daily training in the chronic phase can improve shoulder and arm motor function, even in patients with moderate-to-severe paralysis. The findings of this study support this hypothesis. Additionally, patients who underwent shaking training exhibited reduced chronic pain, a previously unreported benefit. Although the motor function improvements were small, they were clear, leading to greater patient motivation and activity, which, in turn, can further enhance motor function. The stratified analysis indicated that the intervention had significant effects, particularly in patients with moderate paralysis. For patients capable of isolated movement, treatments such as transcranial magnetic stimulation may further enhance functional recovery. In patients with severe or moderate paralysis, implementing a home-based training regimen using a shaking device can reduce pain and improve motor function. Conducting this training for 10 minutes, three times a day, while engaging in other activities, such as watching TV or talking, can be beneficial. This method offers a safe and sustainable treatment option that allows patients to continue treatment without excessive strain, thereby potentially reducing the economic burden on families and healthcare systems.
5. Conclusions
Our multicenter quasi-randomized controlled trial provides evidence supporting the use of home-based voluntary training using the "Kenko Yusuri" shaking device to enhance functional recovery in patients with chronic post-stroke upper limb paralysis. While the improvements in FMA-UE scores in the intervention group did not exceed the MCID, they were statistically significant compared with those of the control group. Our findings suggest that even modest gains in motor function can substantially affect the quality of life and independence of stroke survivors. Home-based interventions, such as the "Kenko Yusuri," provide a feasible and effective option to supplement traditional care strategies, making a meaningful difference to the management of chronic stroke rehabilitation.
Author Contributions
Conceptualization, M.A.; methodology, M.A.; formal analysis, T.H. and To.H.; investigation, T.H.; data curation, T.H.; writing—original draft preparation, To.H.; writing—review and editing, To.H. and M.A.; supervision, M.A.; project administration, T.H. All authors have read and agreed to the published version of the manuscript.
Funding
The shaking device in this study was rented free of charge from Shisei Medical Co.
Institutional Review Board Statement
This study was approved by the Clinical Review Board of Jikei University Educational Corporation (CRB3180031). In addition, this study was registered with the Japanese Registry of Clinical Trials (jRCTs032200164) by the Ministry of Health, Labor, and Welfare.
Informed Consent Statement
Informed consent was obtained from all subjects involved in the study. All patients provided written informed consent to publish this paper.
Data Availability Statement
Data presented in this study are available upon request from the corresponding author. These data are not publicly available because of privacy restrictions.
Acknowledgments
The authors would like to express our sincere gratitude to Dr. Tei Kensyaku of Aomori Shintoshi Hospital, Dr. Ikuo Kimura of Izumi Memorial Hospital, Dr. Mami Kodama of Gosho Minami Rehabilitation Clinic, Dr. Takatsugu Okamoto of Nishi Hiroshima Rehabilitation Hospital, and the physical and occupational therapists at each facility for their efforts in this study.
Conflicts of Interest
The authors declare no conflicts of interest.
Appendix A

Table A1.
Comparisons of the modified Ashworth scale and range of motion using active and passive movements within the shaking exercise and control groups, analyzed using raw data.
Table A1.
Comparisons of the modified Ashworth scale and range of motion using active and passive movements within the shaking exercise and control groups, analyzed using raw data.
| Intervention group (n=39) | Control group (n=39) | Between-group | Mean change | ||||
|---|---|---|---|---|---|---|---|
| Secondary endpoints (n=78) | Pre-test | Post-test | Pre-test | Post-test | p-value | Intervention group | Control group |
| (95% CI) | |||||||
| MAS (shoulder flexion) | 1 [1, 1]‡ | 1 [1, 1]‡ | 1 [1, 2] | 1 [1, 1]‡ | 0.574 | 0 [1, 0] | 0 [0, 0] |
| MAS (shoulder extension) | 1 [0, 1]‡ | 1 [0, 1]‡ | 1 [0, 1]‡ | 1 [0, 1]‡ | 0.59 | 0 [0, 0] | 0 [0, 0] |
| MAS (Elbow flexion) | 1 [1, 1]‡ | 1 [1, 1]‡ | 1 [1, 1]‡ | 1 [1, 1]‡ | 0.215 | 0 [-1, 0] | 0 [0, 0] |
| MAS (Elbow extension) | 1 [1, 1]‡ | 1 [1, 1]‡ | 1 [1, 1] ‡ | 1 [0, 1]‡ | 0.297 | 0 [-1, 0] | 0 [, 1, 0] |
| MAS (Wrist flexion) | 1 [0, 1]‡ | 1 [0, 1]‡ | 1 [1, 2] | 1 [1, 1]‡ | 0.367 | 0 [-1, 0] | 0 [0, 0] |
| MAS (Wrist extension) | 1 [1, 2]‡ | 1 [1, 1]‡ | 1 [1, 2] | 1 [1, 1] ‡ | 0.57 | 0 [-1, 0] | 0 [0, 0] |
| MAS (Finger flexion) | 1 [0, 2]‡ | 1 [0, 2] | 1 [0, 1] ‡ | 1 [0, 1] ‡ | 0.64 | 0 [-1, 0] | 0 [0, 0] |
| MAS (Finger extension) | 0 [0, 1]‡ | 1 [0, 1]‡ | 1 [0, 1]‡ | 1 [0, 1]‡ | 0.461 | 0 [0, 0] | 0 [0, 0] |
| Sholder flexion active ROM | 102.50±32.39+ | 102.78±35.65 | 80.00±46.73 | 81.03±47.69 | 0.808◊ (-5.33, 6.83) |
0.28±10.07 | 1.03±15.06 |
| Sholder flexion passive ROM | 138.47±23.11 | 140.28±22.86 | 131.76±29.56 | 134.12±29.04 | 0.796 (-3.71, 4.81) |
1.81±10.36 | 2.35±7.10 |
| Sholder extension active ROM | 32.08±15.92 | 37.50±13.91 | 30.88±15.54 | 32.21±25.14 | 0.019 (-12.39, -1.09)† |
5.42±14.31 | -1.32±8.47 |
| Sholder extension passive ROM | 49.58±11.97 | 51.06±11.54 | 45.15±11.38 | 43.82±11.68 | 0.162 (-6.78, 1.19) |
1.47±9.67 | -1.32±6.66 |
| Sholder abduction active ROM | 88.19±38.29+ | 88.89±36.80 | 65.29±33.93 | 65.15±35.52 | 0.819 (-8.19, 6.51) |
0.69±16.13 | -0.15±14.59 |
| Sholder abduction passive ROM | 122.50±35.73 | 124.86±35.89 | 113.68±37.42 | 112.06±40.99 | 0.381 (-12.86, 4.90) |
2.36±14.42 | -1.62±22.22 |
| Sholder adduction active ROM | 7.36±20.86 | 7.50±20.79 | 3.09±12.67 | 3.09±12.43 | 0.937 (-3.65, 3.37) |
0.14±8.58 | 0.00±5.77 |
| Sholder adduction passive ROM | 10.56±20.24 | 10.28±19.82 | 7.24±12.06 | 7.21±13.15 | 0.885 (-3.20, 3.70) |
-0.28±8.10 | -0.03±6.16 |
| Elbow flexion active ROM | 111.33±21.52 | 109.03±29.71 | 102.50±23.07 | 104.56±21.30 | 0.366 (-5.37, 14.09) |
-2.31±26.06 | 2.06±11.69 |
| Elbow flexion passive ROM | 135.14±8.49 | 136.25±8.14 | 132.21±16.34 | 131.47±15.45 | 0.197 (-4.66, 0.97) |
1.11±6.29 | -0.74±6.29 |
| Elbow extension active ROM | -22.78±22.57 | -20.69±21.22 | -24.71±25.88 | -25.29±27.33 | 0.281 (-7.60, 2.26) |
2.08±11.17 | -0.59±9.36 |
| Elbow extension passive ROM | -5.69±12.14 | -5.28±12.07 | -5.15±12.94 | -5.29±13.14 | 0.647 (-3.05, 1.92) |
0.42±6.48 | -0.15±3.37 |
| Wrist flexion active ROM | 23.33±28.23 | 16.67±27.95 | 16.18±30.00 | 17.65±29.47 | 0.026 (0.94, 15.34)† |
-6.67±17.81 | 1.47±11.52 |
| Wrist flexion passive ROM | 68.47±13.46 | 66.94±14.80 | 70.44±13.62 | 72.06±12.86 | 0.106 (-0.70, 7.00) |
-1.53±8.69 | 1.62±7.36 |
| Wrist extension active ROM | 13.47±38.24 | 23.33±28.88 | 7.65±30.83 | 9.41±28.81 | 0.14 (-19.05, 2.86) |
9.86±28.55 | 1.76±14.87 |
| Wrist extension passive ROM | 58.33±21.18 | 60.14±23.25 | 60.15±18.47 | 63.53±15.15 | 0.522 (-3.33, 6.49) |
1.81±10.77 | 3.38±9.75 |
| Pain VAS | 3.17±3.04 | 2.56±2.50* | 2.65±2.84 | 2.79±3.05 | 0.03 (-1.44, 0.07)† |
-0.61±1.59 | 0.15±1.26 |
| The pre-test was performed before the intervention, and the post-test was performed after 12 weeks. The Mann–Whitney U test was performed for MAS. Significantly differences were found *within groups and †between groups. ‡in the pre-test comparisons between the intervention and control groups, a significant difference was observed (p<0.05). The significance level was set at p<0.05 for differences between the two groups. CI; confidence interval, SD; standard deviation, 1Q and 3Q 25th–75th percentile values, MAS; modified Ashworth scale, ROM; range of motion | |||||||
References
- Patient survey 2020 (Classification of diseases). Available online: https://www.mhlw.go.jp/toukei/saikin/hw/kanja/10syoubyo/dl/r02syobyo.pdf (accessed on 6 May 2024).
- Langhorne, P.; Bernhardt, J.; Kwakkel, G. Stroke rehabilitation. Lancet 2011, 377, 1693–1702. [Google Scholar] [CrossRef]
- Wolf, S.L.; Winstein, C.J.; Miller, J.P.; Taub, E.; Uswatte, G.; Morris, D.; Giuliani, C.; Light, K.E.; Nichols-Larsen, D.; EXCITE Investigators. Effect of constraint-induced movement therapy on upper extremity function 3 to 9 months after stroke: The EXCITE randomized clinical trial. JAMA 2006, 296, 2095–2104. [Google Scholar] [CrossRef]
- Kwakkel, G.; Veerbeek, J.M.; van Wegen, E.E.H.; Wolf, S.L. Constraint-induced movement therapy after stroke. Lancet Neurol 2015, 14, 224–234. [Google Scholar] [CrossRef]
- Nakayama, H.; Jørgensen, H.S.; Raaschou, H.O.; Olsen, T.S. Recovery of upper extremity function in stroke patients: The Copenhagen Stroke Study. Arch Phys Med Rehabil 1994, 75, 394–398. [Google Scholar] [CrossRef]
- Palstam, A.; Sjödin, A.; Sunnerhagen, K.S. Participation and autonomy five years after stroke: A longitudinal observational study. PLoS ONE 2019, 14, e0219513. [Google Scholar] [CrossRef]
- Jørgensen, H.S.; Nakayama, H.; Raaschou, H.O.; Vive-Larsen, J.; Støier, M.; Olsen, T.S. Outcome and time course of recovery in stroke. Part I: Outcome. The Copenhagen stroke study. Arch Phys Med Rehabil 1995, 76, 399–405. [Google Scholar] [CrossRef]
- Francisco, G.E.; Bandari, D.S.; Bavikatte, G.; Jost, W.H.; McCusker, E.; Largent, J.; Zuzek, A.; Esquenazi, A. High clinician- and patient-reported satisfaction with individualized onabotulinumtoxinA treatment for spasticity across several etiologies from the Aspire study. Toxicon X 2020, 7, 100040. [Google Scholar] [CrossRef]
- Francisco, G.E.; Jost, W.H.; Bavikatte, G.; Bandari, D.S.; Tang, S.F.T.; Munin, M.C.; Largent, J.; Adams, A.M.; Zuzek, A.; Esquenazi, A. Individualized onabotulinumtoxinA treatment for upper limb spasticity resulted in high clinician- and patient-reported satisfaction: Long-term observational results from the Aspire study. PM R 2020, 12, 1120–1133. [Google Scholar] [CrossRef]
- van Mierlo, M.L.; van Heugten, C.M.; Post, M.W.M.; Hajós, T.R.S.; Kappelle, L.J.; Visser-Meily, J.M.A. Quality of life during the first two years post stroke: The Restore4Stroke cohort study. Cerebrovasc Dis 2016, 41, 19–26. [Google Scholar] [CrossRef]
- Treger, I.; Shames, J.; Giaquinto, S.; Ring, H. Return to work in stroke patients. Disabil Rehabil 2007, 29, 1397–1403. [Google Scholar] [CrossRef]
- Ward, A.B.; Wissel, J.; Borg, J.; Ertzgaard, P.; Herrmann, C.; Kulkarni, J.; Lindgren, K.; Reuter, I.; Sakel, M.; Säterö, P.; et al. Functional goal achievement in post-stroke spasticity patients: The Botox(r) Economic Spasticity Trial (BEST). J Rehabil Med 2014, 46, 504–513. [Google Scholar] [CrossRef]
- Molteni, F.; Wissel, J.; Fheodoroff, K.; Munin, M.C.; Patel, A.T.; Althaus, M.; Comes, G.; Dekundy, A.; Pulte, I.; Scheschonka, A.; et al. Improvement in quality-of-life-related outcomes following treatment with incobotulinumtoxinA in adults with limb spasticity: A pooled analysis. Toxins (Basel) 2023, 16. [Google Scholar] [CrossRef]
- Hara, T.; Niimi, M.; Yamada, N.; Shimamoto, Y.; Masuda, G.; Hara, H.; Abo, M. Prognosis prediction of the effect of botulinum toxin therapy and intensive rehabilitation on the upper arm function in post-stroke patients using hierarchical cluster analysis. Disabil Rehabil 2022, 44, 6815–6823. [Google Scholar] [CrossRef]
- Sunnerhagen, K.S.; Francisco, G.E. Enhancing patient-provider communication for long-term post-stroke spasticity management. Acta Neurol Scand 2013, 128, 305–310. [Google Scholar] [CrossRef] [PubMed]
- Palmcrantz, S.; Holmqvist, L.W.; Sommerfeld, D.K. Long-term health states relevant to young persons with stroke living in the community in southern Stockholm – a study of self-rated disability and predicting factors. Disabil Rehabil 2012, 34, 817–823. [Google Scholar] [CrossRef]
- Abo, M.; Kakuda, W.; Momosaki, R.; Harashima, H.; Kojima, M.; Watanabe, S.; Sato, T.; Yokoi, A.; Umemori, T.; Sasanuma, J. Randomized, multicenter, comparative study of NEURO versus CIMT in poststroke patients with upper limb hemiparesis: The NEURO-VERIFY Study. Int J Stroke 2014, 9, 607–612. [Google Scholar] [CrossRef]
- Kakuda, W.; Abo, M.; Sasanuma, J.; Shimizu, M.; Okamoto, T.; Kimura, C.; Kakita, K.; Hara, H. Combination Protocol of Low-Frequency rTMS and Intensive occupational therapy for post-stroke Upper Limb Hemiparesis: A 6-year Experience of more than 1700 Japanese Patients. Transl Stroke Res 2016, 7, 172–179. [Google Scholar] [CrossRef]
- Niimi, M.; Sasaki, N.; Kimura, C.; Hara, T.; Yamada, N.; Abo, M. Sleep during low-frequency repetitive transcranial magnetic stimulation is associated with functional improvement in upper limb hemiparesis after stroke. Acta Neurol Belg 2019, 119, 233–238. [Google Scholar] [CrossRef] [PubMed]
- Sakamoto, D.; Hamaguchi, T.; Murata, K.; Ito, H.; Nakayama, Y.; Abo, M. Upper limb function recovery by combined repetitive transcranial magnetic stimulation and occupational therapy in patients with chronic stroke according to paralysis severity. Brain Sci 2023, 13. [Google Scholar] [CrossRef]
- Sánchez-Cuesta, F.J.; González-Zamorano, Y.; Arroyo-Ferrer, A.; Moreno-Verdú, M.; Romero-Muñoz, J.P. Repetitive transcranial magnetic stimulation of primary motor cortex for stroke upper limb motor sequelae rehabilitation: A systematic review. NeuroRehabilitation 2023, 52, 329–348. [Google Scholar] [CrossRef]
- Almhdawi, K.A.; Mathiowetz, V.G.; White, M.; delMas, R.C. Efficacy of occupational therapy task-oriented approach in upper extremity post-stroke rehabilitation. Occup Ther Int 2016, 23, 444–456. [Google Scholar] [CrossRef]
- Rand, D.; Weingarden, H.; Weiss, R.; Yacoby, A.; Reif, S.; Malka, R.; Shiller, D.A.; Zeilig, G. Self-training to improve UE function at the chronic stage post-stroke: A pilot randomized controlled trial. Disabil Rehabil 2017, 39, 1541–1548. [Google Scholar] [CrossRef]
- Nudo, R.J. Recovery after brain injury: Mechanisms and principles. Front Hum Neurosci 2013, 7, 887. [Google Scholar] [CrossRef]
- Murphy, T.H.; Corbett, D. Plasticity during stroke recovery: From synapse to behaviour. Nat Rev Neurosci 2009, 10, 861–872. [Google Scholar] [CrossRef]
- Teramoto, Y.; Fukushima, K.; Koyama, T.; Ohashi, Y.; Uchiyama, K.; Takahira, N.; Takaso, M. Impact of jiggling exercise as conservative treatment for hip osteoarthritis: A report of two cases. Case Rep Orthop 2020, 2020, 2804193. [Google Scholar] [CrossRef]
- Yoshizuka, H.; Sato, T.; Murakami, J.; Mitsutake, T.; Hiromatsu, M. Short-term changes in radiographic joint space width after jiggling exercise as conservative treatment for hip osteoarthritis: A retrospective case series of nine patients. PLoS ONE 2021, 16, e0253643. [Google Scholar] [CrossRef]
- Gladstone, D.J.; Danells, C.J.; Black, S.E. The fugl-Meyer assessment of motor recovery after stroke: A critical review of its measurement properties. Neurorehabil Neural Repair 2002, 16, 232–240. [Google Scholar] [CrossRef]
- Hijikata, N.; Kawakami, M.; Ishii, R.; Tsuzuki, K.; Nakamura, T.; Okuyama, K.; Liu, M. Item difficulty of Fugl-Meyer assessment for upper extremity in persons with chronic stroke with moderate-to-severe upper limb impairment. Front Neurol 2020, 11, 577855. [Google Scholar] [CrossRef]
- Tauchi, Y.; Kyougoku, M.; Takahashi, K.; Okita, Y.; Takebayashi, T. Dimensionality and item-difficulty hierarchy of the Fugl-Meyer assessment of the upper extremity among Japanese patients who have experienced stroke. Top Stroke Rehabil 2022, 29, 579–587. [Google Scholar] [CrossRef]
- Woytowicz, E.J.; Rietschel, J.C.; Goodman, R.N.; Conroy, S.S.; Sorkin, J.D.; Whitall, J.; McCombe Waller, S. Determining levels of upper extremity movement impairment by applying a cluster analysis to the Fugl-Meyer assessment of the upper extremity in chronic stroke. Arch Phys Med Rehabil 2017, 98, 456–462. [Google Scholar] [CrossRef]
- Bohannon, R.W.; Smith, M.B. Interrater reliability of a modified Ashworth scale of muscle spasticity. Phys Ther 1987, 67, 206–207. [Google Scholar] [CrossRef]
- Joyce, C.R.; Zutshi, D.W.; Hrubes, V.; Mason, R.M. Comparison of fixed interval and visual analogue scales for rating chronic pain. Eur J Clin Pharmacol 1975, 8, 415–420. [Google Scholar] [CrossRef]
- de Melo, M.B.; Daldegan-Bueno, D.; Menezes Oliveira, M.G.; de Souza, A.L. Beyond ANOVA and MANOVA for repeated measures: Advantages of generalized estimated equations and generalized linear mixed models and its use in neuroscience research. Eur J Neurosci 2022, 56, 6089–6098. [Google Scholar] [CrossRef]
- Hayward, K.S.; Ferris, J.K.; Lohse, K.R.; Borich, M.R.; Borstad, A.; Cassidy, J.M.; Cramer, S.C.; Dukelow, S.P.; Findlater, S.E.; Hawe, R.L.; et al. Observational study of neuroimaging biomarkers of severe upper limb impairment after stroke. Neurology 2022, 99, e402–e413. [Google Scholar] [CrossRef]
- Sterne, J.A.C.; White, I.R.; Carlin, J.B.; Spratt, M.; Royston, P.; Kenward, M.G.; Wood, A.M.; Carpenter, J.R. Multiple imputation for missing data in epidemiological and clinical research: Potential and pitfalls. BMJ 2009, 338, b2393. [Google Scholar] [CrossRef]
- Ward, N.S.; Cohen, L.G. Mechanisms underlying recovery of motor function after stroke. Arch Neurol 2004, 61, 1844–1848. [Google Scholar] [CrossRef]
- Wang, L.; Yu, C.; Chen, H.; Qin, W.; He, Y.; Fan, F.; Zhang, Y.; Wang, M.; Li, K.; Zang, Y.; et al. Dynamic functional reorganization of the motor execution network after stroke. Brain 2010, 133, 1224–1238. [Google Scholar] [CrossRef]
- Zhang, M.; Wei, J.; Wu, X. Effects of whole-body vibration training on lower limb motor function and neural plasticity in patients with stroke: Protocol for a randomised controlled clinical trial. BMJ Open 2022, 12, e060796. [Google Scholar] [CrossRef]
- Teasell, R.; Salbach, N.M.; Foley, N.; Mountain, A.; Cameron, J.I.; Jong, A.; Acerra, N.E.; Bastasi, D.; Carter, S.L.; Fung, J.; et al. Canadian Stroke Best Practice Recommendations: Rehabilitation, Recovery, and Community Participation following Stroke. Part One: Rehabilitation and Recovery Following Stroke; 6th Edition Update 2019. Int J Stroke 2020, 15, 763–788. [Google Scholar] [CrossRef]
- Rosenkranz, K.; Rothwell, J.C. Differential effect of muscle vibration on intracortical inhibitory circuits in humans. J Physiol 2003, 551, 649–660. [Google Scholar] [CrossRef]
- Rosenkranz, K.; Butler, K.; Williamon, A.; Cordivari, C.; Lees, A.J.; Rothwell, J.C. Sensorimotor reorganization by proprioceptive training in musician’s dystonia and writer’s cramp. Neurology 2008, 70, 304–315. [Google Scholar] [CrossRef]
- Takeuchi, K.; Takebayashi, T.; Hanioka, D.; Okita, Y.; Shimada, S. Comparison of tendon and muscle belly vibratory stimulation in the treatment of post-stroke upper extremity spasticity: A retrospective observational pilot study. Sci Rep 2024, 14, 4151. [Google Scholar] [CrossRef]
- Afzal, T.; Chardon, M.K.; Rymer, W.Z.; Suresh, N.L. Stretch reflex excitability in contralateral limbs of stroke survivors is higher than in matched controls. J Neuroeng Rehabil 2019, 16, 154. [Google Scholar] [CrossRef]
- Kenmoku, M.; Murata, K.; Taguchi, K.; Tanaka, T.; Sasaki, N.; Abo, M. The effect of 6 treatment with botulinum neurotoxin type A for patients with upper limb hemiparesis after stroke. In Japanes. Tokyo Jikei Medical Journal 2017, 132, 162–167. [Google Scholar]
- Hamaguhi, T.; Abo, M. Recovery of patients with upper limb paralysis due to stroke who underwent intervention using low-frequency repetitive transcranial magnetic stimulation combined with occupational therapy: A retrospective cohort study. Neuromodulation 2023, 26, 861–877. [Google Scholar] [CrossRef]
- Godlove, J.; Anantha, V.; Advani, M.; Des Roches, C.; Kiran, S. Comparison of therapy practice at home and in the clinic: A retrospective analysis of the constant therapy platform data set. Front Neurol 2019, 10, 140. [Google Scholar] [CrossRef]
- Stroke, N.C.G.f. National Clinical Guideline for Stroke for the UK and Ireland; 2023. [Google Scholar]
- Lee, H.H.; Kim, D.Y.; Sohn, M.K.; Shin, Y.I.; Oh, G.J.; Lee, Y.S.; Joo, M.C.; Lee, S.Y.; Han, J.; Ahn, J.; et al. Revisiting the proportional recovery model in view of the ceiling effect of Fugl-Meyer assessment. Stroke 2021, 52, 3167–3175. [Google Scholar] [CrossRef]
- Kimura, I.; Senoo, A.; Abo, M. Changes in structural neural networks in the recovery process of motor paralysis after stroke. Brain Sci 2024, 14. [Google Scholar] [CrossRef]
- Page, S.J.; Fulk, G.D.; Boyne, P. Clinically important differences for the upper-extremity Fugl-Meyer Scale in people with minimal to moderate impairment due to chronic stroke. Phys Ther 2012, 92, 791–798. [Google Scholar] [CrossRef]
Figure 1.
Conceptual diagram and protocol of this study designed to examine the differences in the effects of Shaking exercise and conventional therapies on functions of upper limb in participants with paralysis. A: The patient places or grips his or her hand on the handlebar, and the device uses the principle of leverage to generate a pendulum-like motion that swings the affected hand. B: Patients in the intervention group performed daily shaking exercises at home, three times a day, for 10 minutes each time. The control group performed self-training at home that was guided by outpatient rehabilitation. Both groups continued outpatient treatment for 3 months.
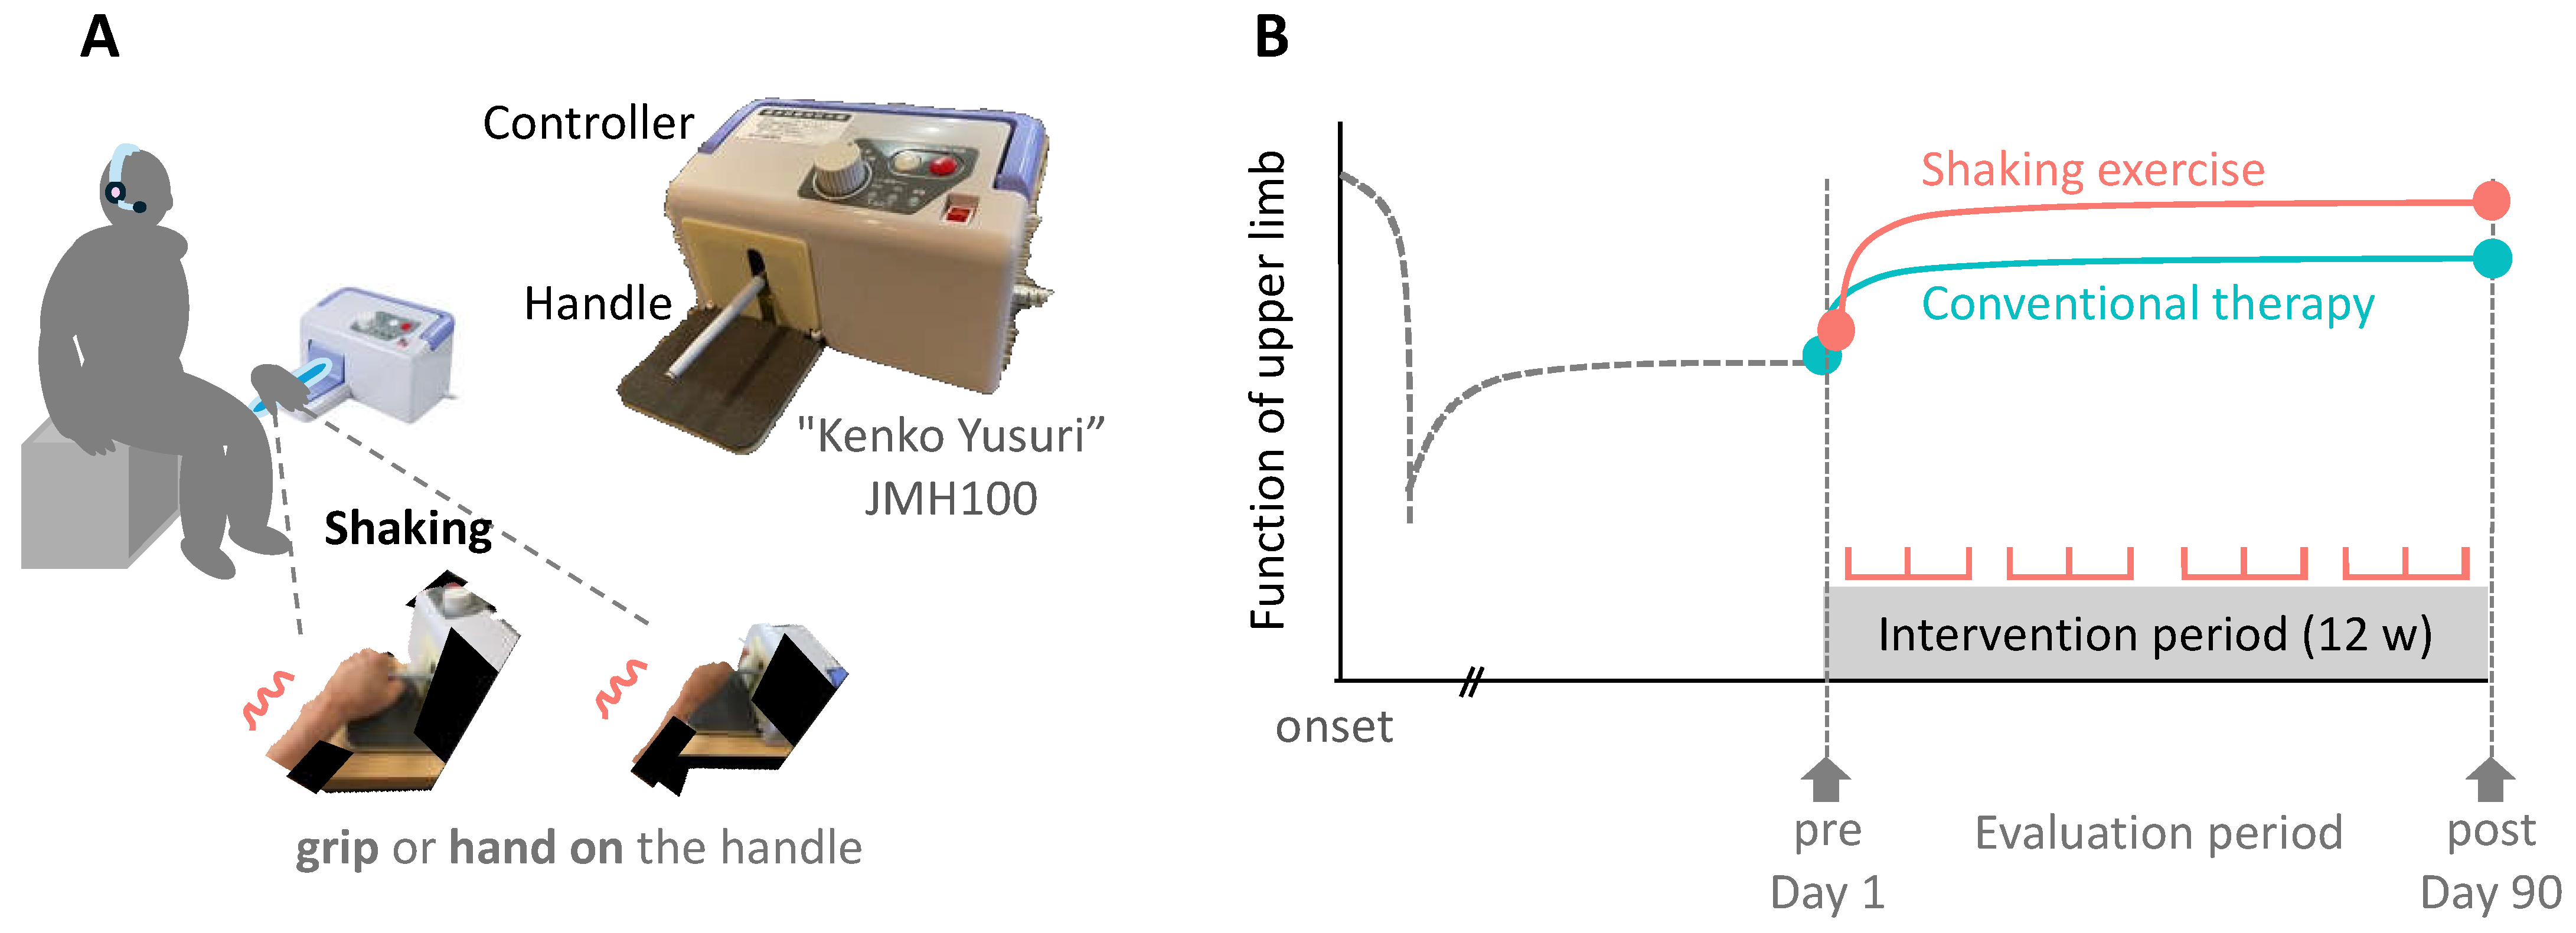
Figure 2.
Flow chart of the processing protocol applied in this study for the inclusion and categorization of the participants. The included study participants from five hospitals (n = 93) underwent shaking exercise or conventional therapy. The same patients were also divided into 3 groups according to the function score of the upper extremity.
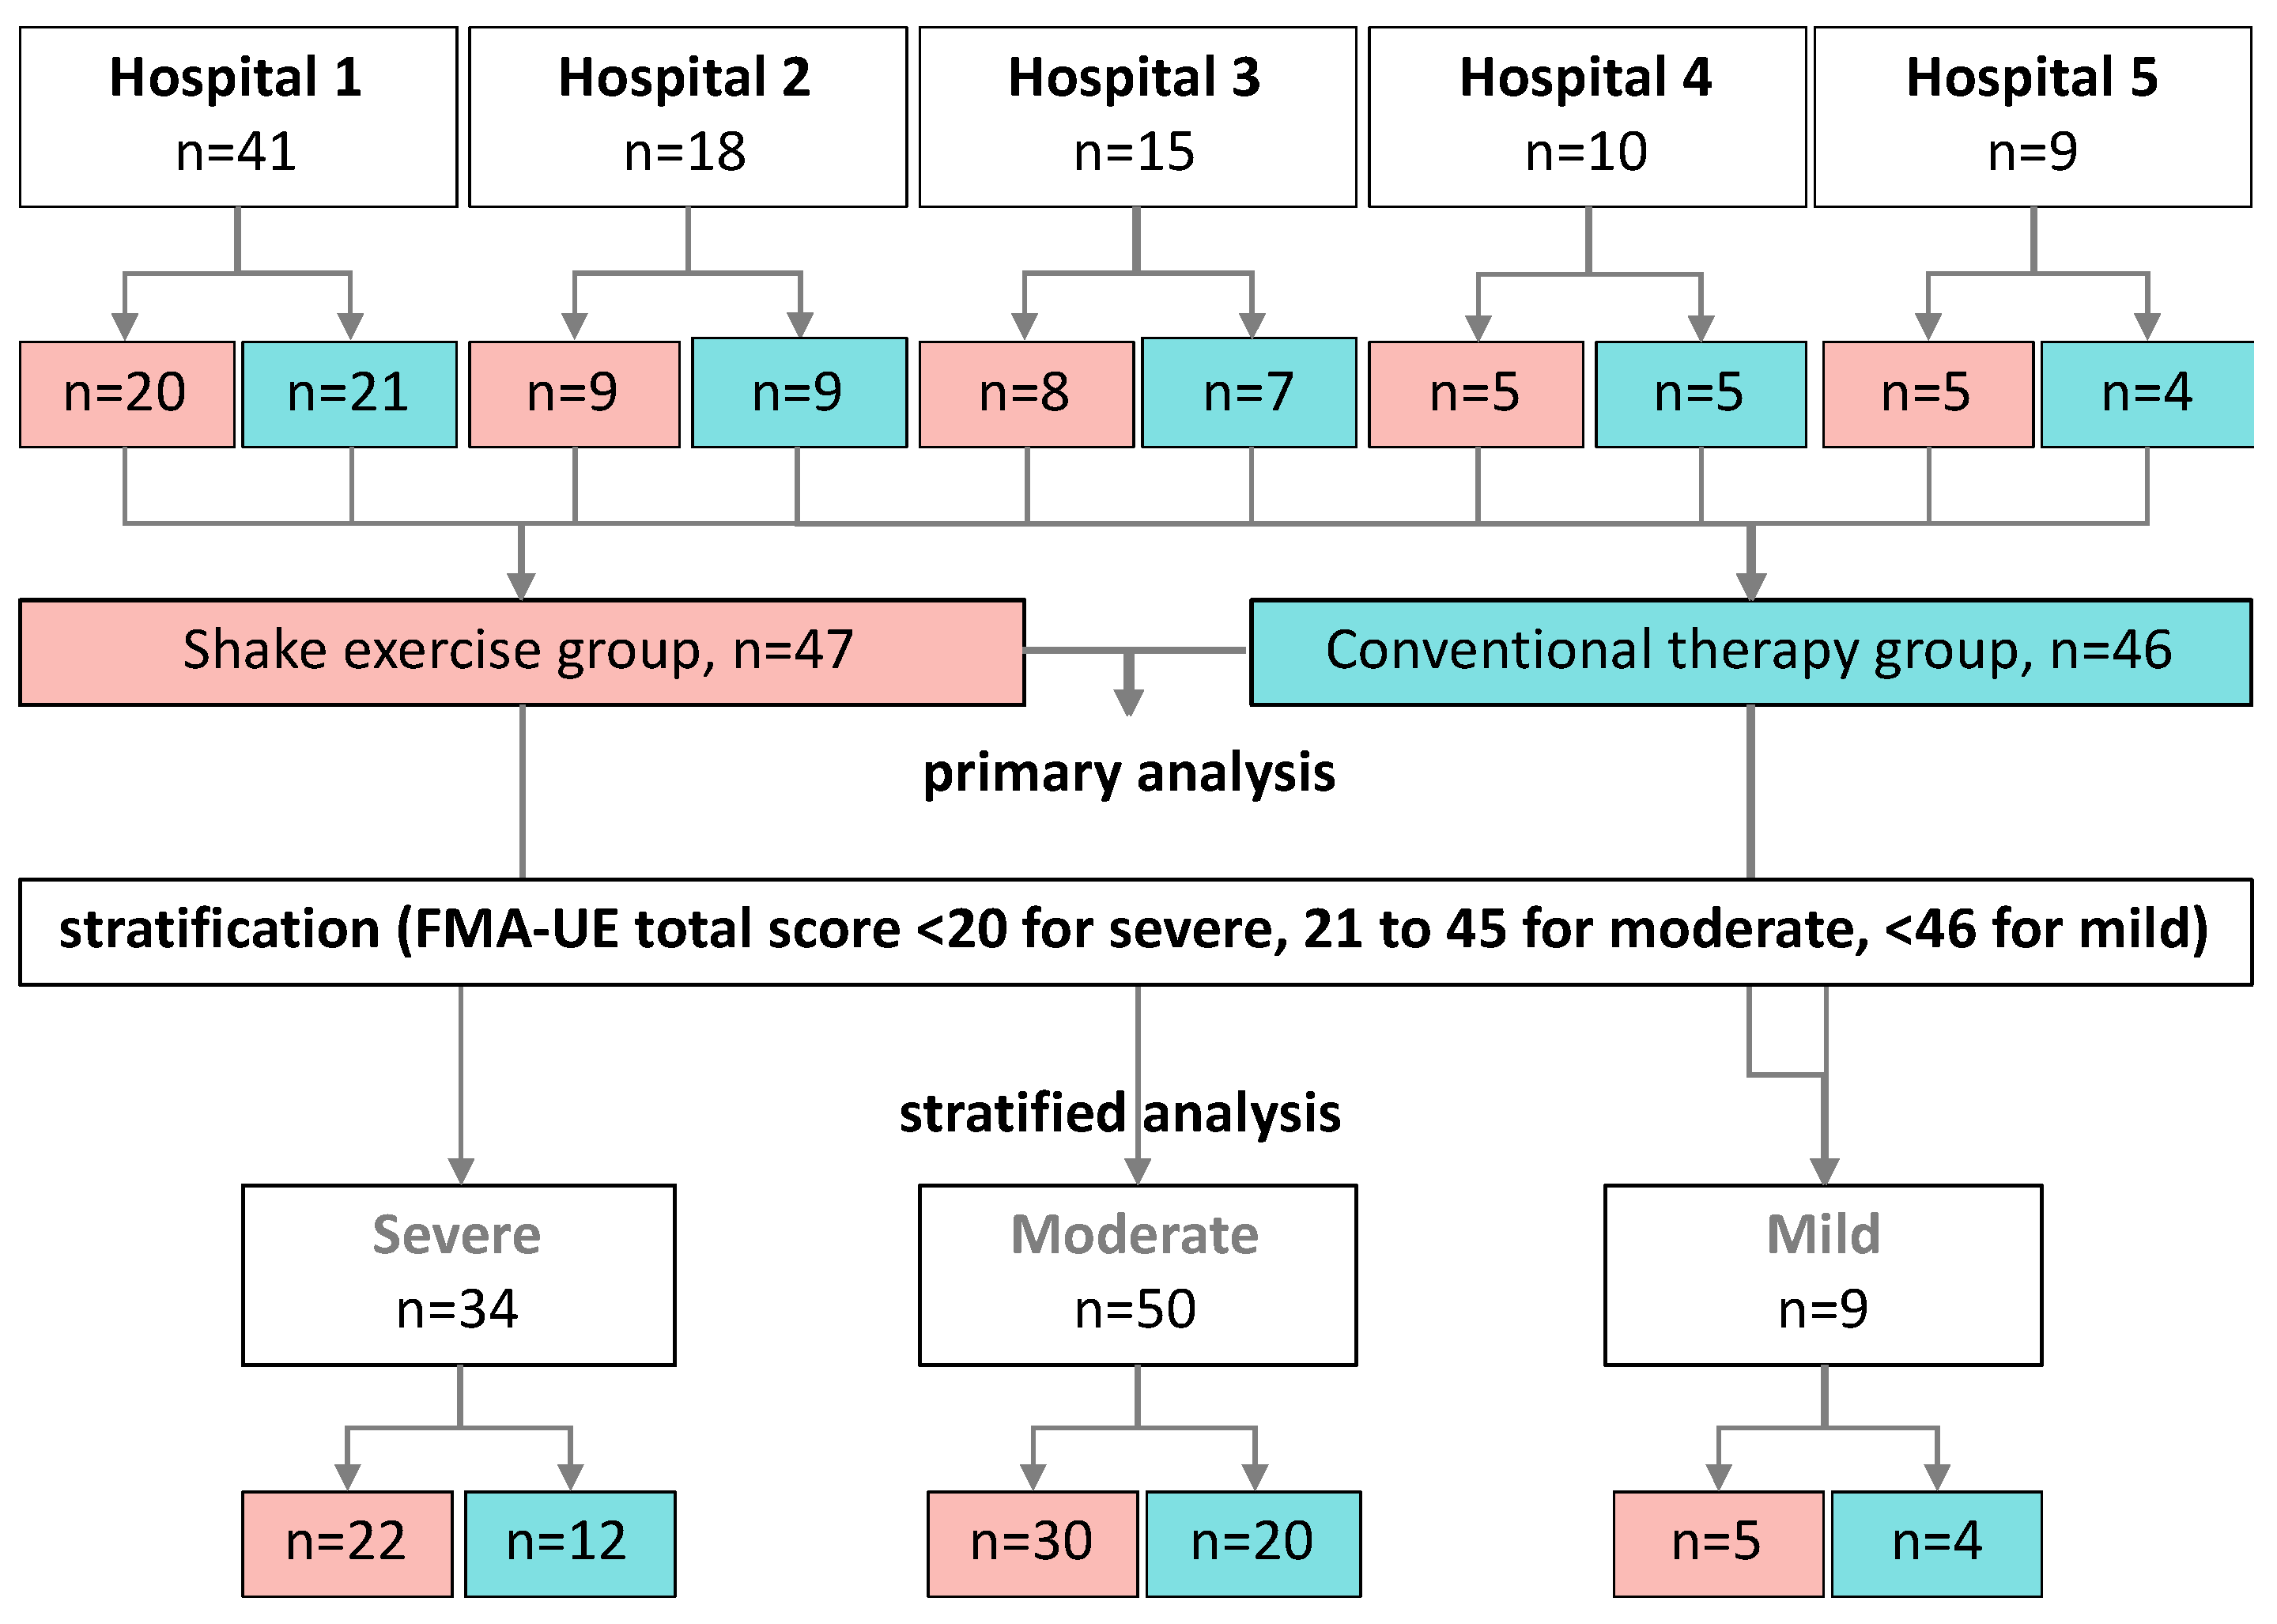
Figure 3.
Scatter plots of the FMA total score in the shaking exercise and conventional therapy groups. Plots of changes in the scores compared with pre- and post-intervention of all patients. Stratified plots of patients.
Figure 3.
Scatter plots of the FMA total score in the shaking exercise and conventional therapy groups. Plots of changes in the scores compared with pre- and post-intervention of all patients. Stratified plots of patients.
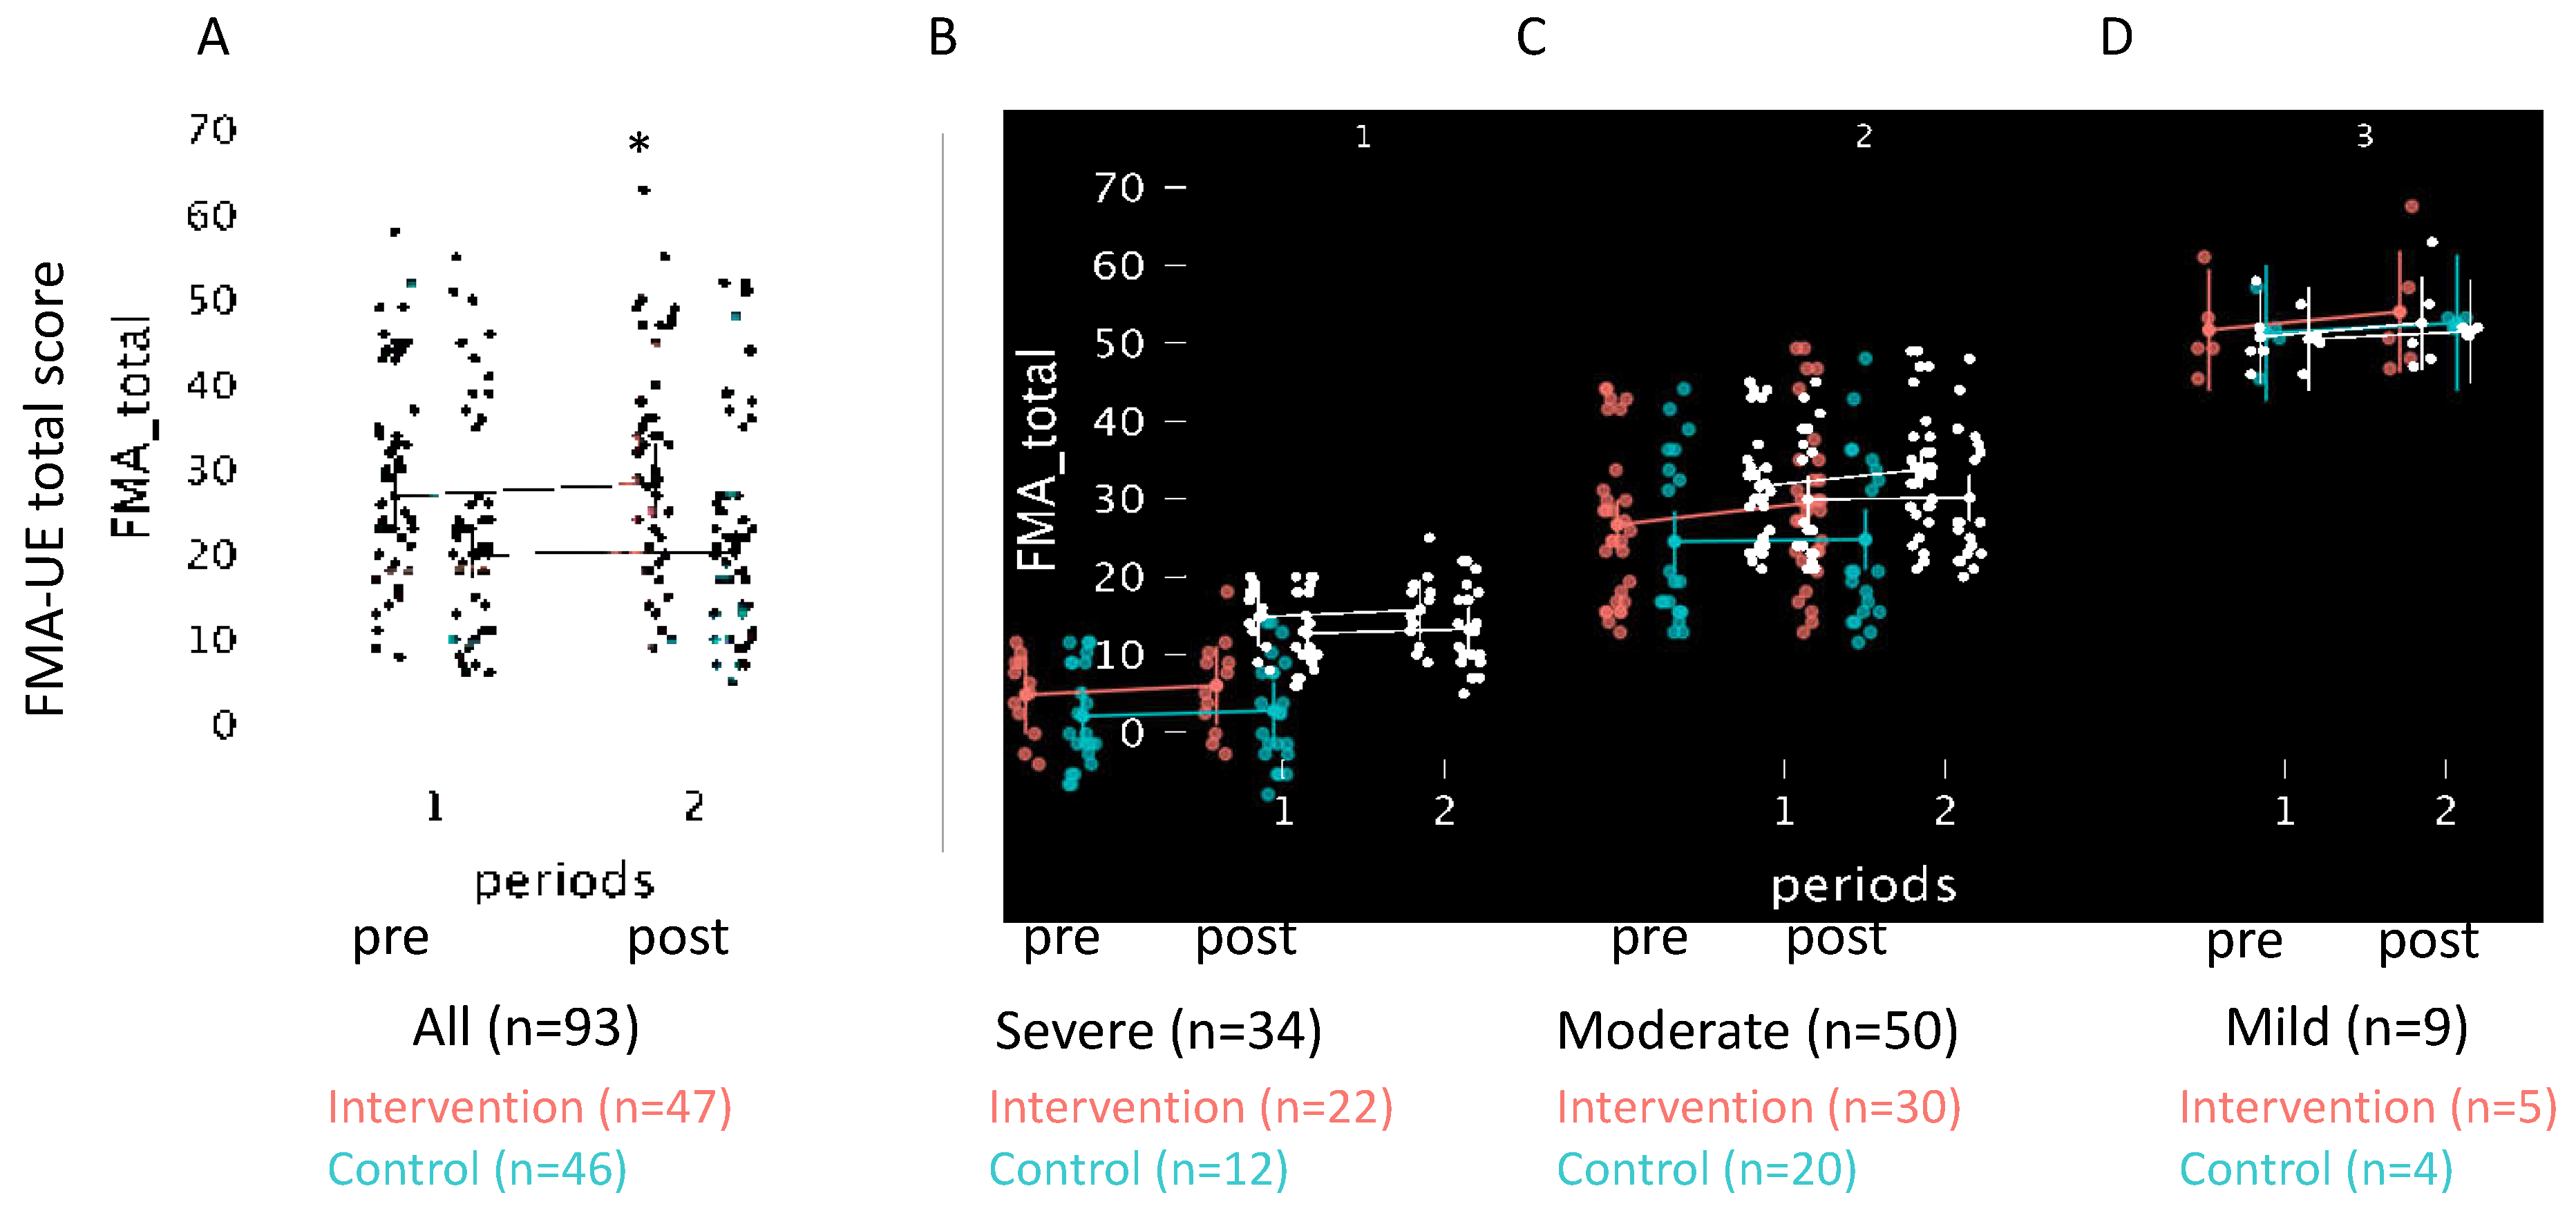
Table 1.
Pre-treatment baseline characteristics of the shaking exercise and control groups.
| variables | All | Intervention | Control | Statistics | ||
|---|---|---|---|---|---|---|
| (N=93) | (n=47) | (n=46) | χ2 or U | p-value | r or V | |
| Sex (Female/Male) | 50/43 | 26/22 | 24/21 | 0.00 | 1.00 | 0.00 |
| Age | 59 [53, 68] | 59 [53, 67] | 59 [53, 68] | 1065 | 0.91 | 0.49 |
| Diagnosis (CI/ICH/other) | 33/55/5 | 16/30/2 | 17/25/3 | 0.59 | 0.75 | 0.08 |
| Affected side (L/R) | 46/47 | 27/21 | 19/26 | 1.31 | 0.25 | 0.12 |
| Month from onset | 131 [92, 175] | 136 [98, 177] | 126 [81, 175] | 1487 | 0.36 | 0.56 |
| FMA-UE total score | 24 [18, 30] | 27 [23, 31]* | 20 [17, 23] | 1343 | 0.04 | 0.62 |
| BoNT-A treatments | 14 [10, 18] | 14 [11, 19] | 13 [9, 17] | 1124 | 0.81 | 0.49 |
| BoNT-A dose (Unit) | 250 [200, 350] | 250 [200, 400] | 250 [200, 300] | 1208 | 0.32 | 0.56 |
| Data are presented as median [1st, 3rd quartile]. Chi-square test with Cramer's V for effect size is used to compare the number of patients, diagnosis, and affected side in each group. Month from onset, FMA-UE, BoNT-A are compared with Mann-Whitney U-test. *p<0.05 compared with controls. CI; cerebral infarction, ICH; intra cerebral hemorrhage, FMA-UE; Fugl-Meyer assessment of the upper extremity, BoNT-A; Botulinum toxin type A | ||||||
Table 2.
Estimated factor levels by Generalized Mixed Linear Model for FMA-UE Scores.
| Variable | β | SD | z | P-value | 95% CI | Model Fit Indices | |
|---|---|---|---|---|---|---|---|
| FMA-UE total | Intercept | 1.48 | 0.55 | 2.67 | 0.01* | (0.39, 2.56) | AIC=789.4 BIC=805.6 REML-based Log-Likelihood=394.8 |
| Intervention | 0.69 | 0.30 | 2.30 | 0.02* | (0.10, 1.27) | ||
| Periods | 1.13 | 0,29 | 3.88 | <0.001* | (0.56, 1.70) | ||
| Baseline | 1.00 | 0.01 | 87.46 | <0.001* | (0.98, 1.02) | ||
| Part A | Intercept | 0.10 | 0.53 | 0.18 | 0.86 | (0.94, 1.13) | AIC=423.6 BIC=452.6 REML-based Log-Likelihood=-202.8 |
| Intervention | 0.84 | 0.65 | 1.28 | 0.20 | (0.44, 2.11) | ||
| Periods | 0.33 | 0.29 | 1.12 | 0.26 | (0.25, 0.90) | ||
| Baseline | 0.99 | 0.01 | 67.15 | 000* | (0.96, 1.02) | ||
| Part B | Intercept | 0.22 | 0.10 | 2.26 | 0.02 | (0.03, 0.42) | AIC=230.1 BIC=259.2 REML-based Log-Likelihood=-106.1 |
| Intervention | 0.00 | 0.04 | 0.03 | 0.98 | (0.08, 0.08) | ||
| Periods | 0.23 | 0.09 | 2.42 | 0.02* | (0.04, 0.41) | ||
| Baseline | 1.00 | 0.01 | 129.72 | < 0.001* | (0.98, 1.01) | ||
| Part C | Intercept | 0.31 | 0.30 | 1.05 | 0.29 | (0.27, 0.90) | AIC=504.7 BIC=524.1 REML-based Log-Likelihood=−246.4 |
| Intervention | 0.35 | 0.41 | 0.86 | 0.39 | (0.45, 1.16) | ||
| Periods | 0.22 | 0.19 | 1.18 | 0.24 | (0.14, 0.58) | ||
| Baseline | 0.37 | 0.26 | 1.41 | 0.16 | (0.88, 0.14) | ||
| Part D | Intercept | 0.03 | 0.14 | 0.21 | 0.84 | (0.25, 0.31) | AIC=242.2 BIC=261.5 REML-based Log-Likelihood=115.1 |
| Intervention | 0.19 | 0.2 | 0.94 | 0.35 | (0.20, 0.58) | ||
| Periods | 0.02 | 0.09 | 0.24 | 0.81 | (0.15, 0.20) | ||
| Baseline | 0.99 | 0.02 | 48.75 | < 0.001* | (0.95, 1.03) | ||
| The model includes data from 186 observations across 93 participants during each period. The intercept represents the predicted FMA_total score for a non-intervention individual at baseline FMA_total of zero. Each coefficient is presented with its respective standard error, z-value, p-value, and 95% confidence interval. The variable 'Intervention' indicates the group, and 'Periods' distinguishes between pre- and post-intervention assessments. 'Baseline' denotes FMA_total score at baseline. Statistical significance is set at *p<0.05. SD; Standard Error, β; estimated coefficient | |||||||
Table 3.
Changes in FMA-UE Scores Pre- and Post-intervention, Compared with Control and Intervention Groups.
Table 3.
Changes in FMA-UE Scores Pre- and Post-intervention, Compared with Control and Intervention Groups.
| FMA-UE | Intervention (n=47) | Control (n=46) | U | P-value | (r) | ||||
|---|---|---|---|---|---|---|---|---|---|
| pre | post | delta | pre | post | delta | ||||
| Total | 26.8 (23.0, 31.2) |
28.4 (24.4, 33.0) |
1.8 (0.8, 2.8) |
20.0 (17.1, 23.3) |
20.3 (17.4, 23.7) |
0.4 (-0.1, 1.0) |
823 | 0,04* | 0,24 |
| Part A | 21.4 (19.4, 23.5) |
22.6 (20.6, 24.7) |
1.2 (0.6, 1.8) |
17.5 (15.5, 19.6) |
17.9 (15.8, 20.0) |
0.3 (-0.2, 0.9) |
770 | 0,01* | 0,29 |
| Part B | 2.9 (2.1, 3.7) |
3.1 (2.3, 3.9) |
0.2 (-0.2, 0.6) |
1.7 (0.9, 2.4) |
1.9 (1.1, 2.7) |
0.2 (-0.1, 0.6) |
1015 | 0,56 | 0,06 |
| Part C | 4.1 (2.9, 5.2) |
4.2 (3.1, 5.4) |
0.2 (-0.3, 0.6) |
3.5 (2.4, 4.7) |
3.3 (2.2, 4.5) |
-0.2 (-0.5, 0.1) |
977 | 0,37 | 0,10 |
| Part D | 1.3 (0.8, 1.7) |
1.4 (1.0, 1.9) |
0.2 (0.0, 0.4) |
0.8 (0.3, 1.2) |
0.7 (0.3, 1.2) |
0.0 (-0.2, 0.1) |
964 | 0,16 | 0,11 |
| This table presents the results of a Mann–Whitney U test comparing the changes (Δ values) in FMA scores before and after treatment between the control and intervention groups. Δ values are calculated as the difference between post- and pre-intervention scores for each measure. The table includes the median changes along with the first and third quartiles for each group. *P-values <0.05 indicate statistically significant differences between the groups. Effect size (r) is reported to quantify the magnitude of the difference, with values closer to -1 or 1 indicating a stronger effect. Scores are presented as the mean, 95% CI. | |||||||||
Table 4.
Estimated Factor Levels using the Generalized Mixed Linear Model for FMA-UE Total Score, stratified by Severity of Paralysis.
Table 4.
Estimated Factor Levels using the Generalized Mixed Linear Model for FMA-UE Total Score, stratified by Severity of Paralysis.
| Variable | β | SD | z-Value | P-value | 95% CI | Model Fit Indices | |
|---|---|---|---|---|---|---|---|
| mild (n=9) | Intercept | 1.56 | 2.73 | -0.57 | 0.57 | (3.78, 6.90) | AIC=71.7 BIC=78.8 REML-based Log-Likelihood=-27.8 |
| Intervention | 0.05 | 0.39 | -0.12 | 0.91 | (0.73, 0.82) | ||
| Periods | 1.44 | 0.73 | 1.98 | 0.04* | (0.02, 2.87) | ||
| Baseline | 0.00 | 0.05 | 0.05 | 0.96 | (-0.10, 0.12) | ||
| moderate (n=50) | Intercept | 1.04 | 1.21 | -0.86 | 0.39 | (1.33, 3.42) | AIC=463.5 BIC=479.1 REML-based Log-Likelihood=-225.7 |
| Intervention | 1.03 | 0.48 | 2.14 | 0.03* | (0.09, 1.98) | ||
| Periods | 1.38 | 0.47 | 2.92 | 0.00 | (0.46, 2.31) | ||
| Baseline | 0.97 | 0.03 | 31.84 | < 0.001* | (0.91, 1.03) | ||
| severe (n=34) | Intercept | 0.85 | 0.66 | 1.29 | 0.20 | (0.44, 2.13) | AIC=231.8 BIC=245.1 REML-based Log-Likelihood=-113.9 |
| Intervention | 0.17 | 0.33 | 0.51 | 0.61 | (0.48, 0.82) | ||
| Periods | 0.68 | 0.30 | 2.25 | 0.02* | (0.09, 1.27) | ||
| Baseline | 1.01 | 0.03 | 29.37 | 0.00* | (0.94, 1.08) | ||
| The model includes data from 186 observations across 93 participants in each period. The intercept represents the predicted FMA_total score for a non-intervention individual at baseline FMA_total of zero. Each coefficient is presented with its respective standard error, z-value, p-value, and 95% confidence interval. The variable 'Intervention' indicates the group, and 'Periods' distinguishes between pre- and post-intervention assessments. 'Baseline' denotes FMA_total score at baseline. Scores are presented as the mean, 95% CI. *p<0.05. SD; Standard Error, β; estimated coefficient | |||||||
Table 5.
Comparative Analysis of Motor Function Outcomes Between the Control and Intervention Groups: Assessing Efficacy Through Modified Ashworth Scale and Range of Motion Measurements.
Table 5.
Comparative Analysis of Motor Function Outcomes Between the Control and Intervention Groups: Assessing Efficacy Through Modified Ashworth Scale and Range of Motion Measurements.
| Variables | Intervention group | Control group | ΔControl vs. ΔIntervention |
||||||||
|---|---|---|---|---|---|---|---|---|---|---|---|
| pre | post | delta | pre | post | delta | U | P | r | |||
| modified Ashworth scale | shoulder | flex | 1 (1, 2) | 1 (1, 2) | 0 (0, 1) | 1 (1, 2) | 1 (0, 2) | 0 (0, 0) | 908 | 0.14 | -0.16 |
| ext | 1 (0, 2) | 1 (0, 2) | 0 (0, 0) | 1 (0, 2) | 1 (0, 2) | 0 (0, 0) | 1028 | 0.62 | -0.05 | ||
| elbow | flex | 1 (1, 2) | 1 (1, 2) | 0 (0, 1) | 1 (1, 2) | 1 (1, 2) | 0 (0, 0) | 1202 | 0.31 | 0.11 | |
| ext | 2 (1, 2) | 2 (1, 2) | 0 (0, 1) | 2 (1, 2)* | 1 (0, 2) | 0 (0, 1) | 930 | 0.20 | -0.14 | ||
| wrist | flex | 1 (0, 2) | 1 (0, 2) | 0 (0, 1) | 1 (1, 2) | 1 (1, 2) | 0 (0, 0) | 1082 | 1.00 | 0.00 | |
| ext | 2 (1, 2) | 2 (1, 2) | 0 (0, 1) | 1 (0, 2) | 1 (1, 2) | 0 (0, 0) | 1087 | 0.97 | 0.01 | ||
| finger | flex | 2 (0, 2) | 1 (0, 2) | 0 (0, 1) | 1 (0, 2) | 1 (0, 2) | 0 (0, 0) | 1091 | 0.93 | 0.01 | |
| ext | 0 (0, 2) | 1 (0, 2) | 0 (0, 0) | 1 (0, 2) | 1 (0, 2) | 0 (0, 0) | 1037 | 0.68 | -0.04 | ||
| Active Range of Motion | shoulder | flex | 110 (125, 80) | 110 (125, 88) | 0 (-5, 10) | 83 (110, 43) | 83 (120, 50) | 0 (-5, 9) | 1094 | 0.92 | 0.01 |
| ext | 40 (40, 20) | 40 (50, 30) | 0 (-5, 5) | 35 (40, 25) | 35 (40, 20) | 0 (-5, 5) | 1311 | 0.06 | 0.21 | ||
| abd | 75 (120, 60) |
85 (113, 60) |
5 (0, 10) | 60 (85, 50) | 60 (80, 41) | 0 (-5, 5) | 1187 | 0.41 | 0.10 | ||
| add | 0 (10, 0) | 0 (0, 0) | 0 (0, 0) | 0 (0, 0) | 0 (0, 0) | 0 (0, 0) | 999 | 0.46 | -0.08 | ||
| elbow | flex | 115 (130, 103) | 115 (130, 100) | 5 (-10, 0) | 100 (114, 76) | 100 (120, 83) | 0 (-5, 5) | 1036 | 0.73 | -0.04 | |
| ext | -15 (-38, 0) | -10 (0, -30) | 5 (0, 10) | -18 (-49, 0) | -15 (-39, -6) | 5 (0, 10) | 1214 | 0.30 | 0.12 | ||
| wrist | flex | 15 (40, 0) | 15 (40, -5) | 0 (-5, 5) | 13 (0, 30) | 18 (-10, 30) | 0 (-5, 5) | 941 | 0.27 | -0.13 | |
| ext | 30 (40, 0) | 30 (45, 5) | 0 (0, 0) | 5 (-28, 35) | 8 (-20, 34) | 0 (-10, 0) | 1141 | 0.64 | 0.06 | ||
| Passive Range of Motion | shoulder | flex | 140 (125, 155) |
140 (120, 160) |
0 (-5, 10) | 138 (120, 160) |
135 (120, 154) |
0 (-5, 9) | 1048 | 0.80 | 0.03 |
| ext | 50 (45, 60) | 50 (48, 58) | 0 (-5, 5) | 50 (41, 50) | 50 (40, 50) | 0 (-5, 0) | 1006 | 0.55 | 0.07 | ||
| abd | 135 (130, 140) |
140 (130, 143) |
0 (0, 5) | 140 (130, 145) |
133 (125, 145) |
0 (-5, 0) | 892 | 0.12 | 0.18 | ||
| add | 0 (-10, 0) | 0 (-5, 0) | 0 (0, 0) | 0 (-9, 0) | 0 (-5, 0) | 0 (0, 0) | 1054 | 0.81 | 0.03 | ||
| elbow | flex | 120 (95, 150) |
120 (98, 155) |
5 (-10, 10) |
118 (90, 145) | 110 (90, 144) | 0 (-14, 5) | 898 | 0.16 | 0.17 | |
| ext | 0 (0, 13) | 0 (0, 0) | 0 (0, 0) | 0 (0, 12) | 0 (0, 0) | 0 (0, 0) | 1187 | 0.27 | -0.10 | ||
| wrist | flex | 70 (60, 80) | 70 (60, 80) | 0 (-8, 5) | 70 (65, 80) | 70 (60, 80) | 0 (0, 5) | 1144 | 0.62 | -0.06 | |
| ext | 60 (45, 70) | 70 (48, 80) | 0 (0, 10) | 68 (50, 75) | 68 (55, 74) | 0 (0, 9) | 1029 | 0.68 | 005 | ||
| Pain VAS | 2 (0, 5) | 2 (0, 6) | 0 (0, 0) | 3 (0, 6) | 2 (0, 5)* | 0 (-1, 0) | 914 | 0.10 | 0.10 | ||
| A Mann–Whitney U test was used to compare changes in MAS and ROM between groups, quantified by calculating the difference (Δ values) between pre- and post-intervention measurements. P-values are presented for the results of comparisons between the shaking exercise and control groups. *p<0.05 for within-group comparisons were performed using a Wilcoxon signed-rank test. Data are presented as medians and 25th–75th percentile values. | |||||||||||
Disclaimer/Publisher’s Note: The statements, opinions and data contained in all publications are solely those of the individual author(s) and contributor(s) and not of MDPI and/or the editor(s). MDPI and/or the editor(s) disclaim responsibility for any injury to people or property resulting from any ideas, methods, instructions or products referred to in the content. |
© 2024 by the authors. Licensee MDPI, Basel, Switzerland. This article is an open access article distributed under the terms and conditions of the Creative Commons Attribution (CC BY) license (http://creativecommons.org/licenses/by/4.0/).
Copyright: This open access article is published under a Creative Commons CC BY 4.0 license, which permit the free download, distribution, and reuse, provided that the author and preprint are cited in any reuse.
Submitted:
27 May 2024
Posted:
27 May 2024
You are already at the latest version
Alerts
A peer-reviewed article of this preprint also exists.
This version is not peer-reviewed
Submitted:
27 May 2024
Posted:
27 May 2024
You are already at the latest version
Alerts
Abstract
Stroke causes disability and significantly affects patient quality of life. Post-stroke rehabilitation of upper limb function is crucial, as it affects daily activities and individual autonomy. Traditional rehabilitation methods often require frequent visits to specialized centers, which can be costly and challenging. This study investigated the effectiveness of a home-based self-training device, "Kenko Yusuri," in improving upper limb function in patients with chronic stroke. This multicenter prospective intervention study used a quasi-randomized controlled trial design. Ninety-three outpatients from five hospitals in Japan were enrolled and assigned to either the intervention group who used the "Kenko Yusuri" device or the control group who underwent conventional rehabilitation. All patients received botulinum toxin type A (BoNT-A) injections to treat upper limb spasticity. The primary outcome measure was the Fugl-Meyer Assessment (FMA) of upper-extremity motor function. Secondary outcomes included the modified Ashworth scale (MAS) score, range of motion (ROM), and chronic pain assessments. The intervention group demonstrated significantly greater improvements in FMA total scores than the control group. Patients with moderate paralysis experienced the greatest benefits from the intervention. There were no significant between-group differences in MAS scores or ROM measurements. Pain and wrist ROM showed improvement in the intervention group. Home-based training with a shaking device significantly improved upper limb function in patients with moderate chronic post-stroke paralysis. This approach aligns with the principles of use-dependent plasticity and offers a feasible and cost-effective alternative to traditional rehabilitation methods.
Keywords:
Subject: Medicine and Pharmacology - Medicine and Pharmacology
1. Introduction
Stroke remains a leading cause of disability globally, profoundly affecting the quality of life of millions each year [1,2]. Rehabilitation of post-stroke upper limb function is crucial [3,4], as it directly affects patients’ ability to perform daily activities and enhances individual autonomy [5,6,7]. Although traditional rehabilitation methods such as physical therapy and pharmacological interventions are effective, they typically require frequent visits to specialized centers. This can be costly and logistically challenging for many patients, particularly those who may require prolonged therapy [8,9].
Spasticity is a common complication in patients with severe stroke that leads to pain and significant motor dysfunction. Treatment often involves long-term management strategies, including the use of botulinum toxin type A (BoNT-A), which has been widely adopted for its efficacy in reducing muscle hypertonicity and associated discomfort [8,9,10,11,12,13]. However, botulinum therapy is repetitive and invasive, and when administered alone it may not improve upper limb function; it must be combined with occupational therapy [14]. Patients with chronic stroke are required to exercise at home to improve their upper limb function and require assistance from their family members [15]. This long-term, daily independent training may be physically and mentally demanding for patients and their families [16].
Recent advancements in noninvasive cerebral stimulation therapies such as repetitive transcranial magnetic stimulation (rTMS) combined with intensive upper limb training have shown promise in improving functions previously considered irreversible [4,17,18,19,20,21]. Despite these advancements, the accessibility of innovative treatments in home settings remains limited, which poses a significant barrier to sustaining patient engagement and recovery. The integration of home-based training devices into standard post-stroke rehabilitation protocols could therefore represent a transformative approach to care, reducing the burden on healthcare systems, while simultaneously improving patient outcomes.
Occupational therapists manually perform rehabilitation to treat upper limb dysfunction as an after-effect of stroke [22,23], and the concept of user-dependent plasticity is particularly relevant in patients with chronic stroke [24,25]. This suggests that the nervous system can functionally reorganize itself in response to the demands placed upon it, implying that consistent, repetitive use of the affected limbs can lead to improved motor function and recovery over time. Therefore, the development of home-based self-training devices, like the "Kenko Yusuri" is not only innovative but essential. These devices enable patients to engage in regular structured training at home without continuous professional supervision, and align with the principles of use-dependent plasticity by facilitating frequent and repetitive use of the impaired limbs. This approach not only makes rehabilitation more accessible and cost-effective but also allows for therapy customization to meet individual needs, thereby enhancing the potential for recovery. These devices also ensure continuity of care, enabling patients to maintain and improve the long-term gains achieved in clinical settings. Additionally, the "Kenko Yusuri" shaking device is expected to offer therapeutic benefits in the management of spasticity. Its vibrational features are expected to relieve muscle tension, potentially complementing or reducing the need for invasive treatment. This could significantly enhance the quality of life and functional independence of stroke survivors by providing a nonpharmacological option for managing one of the most challenging complications of stroke recovery.
Integrating home-based training devices into standard post-stroke rehabilitation protocols may represent a transformative approach to care; it may alleviate the burden on healthcare systems, while simultaneously improving patient outcomes. The aim of this study was to evaluate the effectiveness of the "Kenko Yusuri" shaking device in improving upper limb function in patients with chronic stroke, thereby reducing the physical and mental burden on patients and caregivers.
2. Materials and Methods
Study Participants
This multicenter prospective intervention study adopted a randomized trial design and included outpatients enrolled between MM 20XX and MM 20XX at five hospitals in Japan. Patient data were collected from Jikei University Hospital [Tokyo], Aomori Shintoshi Hospital [Aomori], Izumi Memorial Hospital [Tokyo], Gosho Minami Rehabilitation Clinic [Kyoto], and Nishi Hiroshima Rehabilitation Hospital [Hiroshima]) and were subsequently analyzed.
Participants were included if they: 1) were stroke patients with upper limb paralysis who were aged >20 and <80 years; 2) had stroke onset at least 6 months prior; 3) had upper limb Brunnstrom recovery stage III to V, 4) were undergoing ongoing botulinum therapy for upper limb spasticity; 5) did not have cognitive impairment; and 6) had been fully informed of the study and provided voluntary written consent based on their full understanding of the study.
Patients were excluded if: 1) they had implanted medical devices (pacemakers or cochlear implants, etc.); 2) had serious cardiac disease; 3) were pregnant or suspected of being pregnant; 4) were judged by the principal investigator to be inappropriate for participation; 5) had unstable or urgent medical conditions (acute heart failure, acute renal failure, acute liver failure, severe diabetes, infectious diseases, etc.); or 6) had participated in other clinical studies within 4 months.
Study Design
This study was conducted as a multicenter, open-label, quasi-randomized controlled trial. Participants were classified by upper extremity Fugl-Meyer Assessment (FMA) score and assigned to the intervention group or control group in the order of enrollment. All participants were informed of how the study results would be used and signed an informed consent form agreeing to participate. The study was performed over 12 weeks. The study group underwent voluntary training using the shaking device, whereas the control group underwent conventional voluntary training (Figure 1). The shaking device used in this study was a "Kenko Yusuri" (JMH100, Top Run Corporation, Japan) [26,27].
Self-training using the shaking device
The shaking device was used by gripping the handle with the affected upper limb. Patients who could not grip the handle were allowed to use it by placing their palms or distal forearms on the handle.
The handle was moved by approximately 13 cm vertically at 1 Hz continuously for 10 min. If the upper limb dropped off during the exercise, the patient was allowed to stop the device once and resume use. Ten min of use was allowed per self-training session, and self-training was conducted three times a day (30 min in total). The self-training status was recorded by the patients on a form, which was collected and checked by the physician in charge at the end of each study period.
Adjunctive therapy
All patients received BoNT-A injections for upper limb spasticity (up to 400 units for the upper limb) as adjunctive therapy. The BoNT-A injection was administered immediately before the start of the shaking exercise in the study group; the control group was injected immediately before the start of observation, and no additional doses were allowed to be administered until the end of the evaluation. The following concomitant therapies were prohibited: 1) electrical stimulation therapy, 2) repetitive transcranial magnetic stimulation therapy, 3) transcranial direct-current electrical stimulation therapy, and 4) robotic rehabilitation therapy. They were prohibited during the entire study period (from the date consent was obtained until the last observation date). In addition, the initiation of new muscle relaxants was prohibited during the study period (from the date of consent to the date of final observation). If patients were taking them routinely, the dosage and administration method were not changed during the study period.
This study was approved by the Clinical Review Board of Jikei University Educational Corporation (CRB3180031). The study was registered in the Japanese Registry of Clinical Trials (jRCTs032200164) by the Ministry of Health, Labour, and Welfare.
Outcome measures
The Fugl-Meyer assessment (FMA) score was used as the main outcome in this study. It evaluates motor function, sensory function, balance, range of motion, and joint pain, and is divided into 66 points for the upper extremity. In this study, only the upper extremity was tested, and shoulder, wrist, and hand reflexes, voluntary movements, and coordinated movements were examined; the FMA method was chosen because of its high reliability, reproducibility, and validity [28,29,30]. The severity of paralysis according to the FMA score is as follows: ≤20, severe; 21–45, moderate; and 46–66, mild paralysis [31]. Secondary outcomes included the modified Ashworth scale (MAS) used to assess the degree of spasticity [32], range of motion (ROM) using active and passive joint movement, and subjective chronic pain using the visual analog scale (VAS) [33].
Statistical Analysis
We employed generalized linear mixed models (GLMM) [34] to analyze the impact of interventions and treatment periods on FMA scores, while adjusting for baseline FMA scores [35]. Our model included fixed effects for the intervention status, treatment periods, and pretreatment FMA scores (Total, A, B, C, and D), with random effects accounting for individual patient variability. GLMM analysis was performed using the restricted maximum likelihood (REML) method to provide unbiased estimates of variance and covariance parameters under fixed-effect model specifications. To evaluate the effects of the intervention, a GLMM was constructed as follows.
where y^ij is the predicted FMA score for patient jj at time ii; β0 is the model intercept, representing the baseline score before treatment in the absence of intervention; β1 represents the effect of the intervention group, where a positive value indicates that the intervention was effective; β2 quantifies the effect of the treatment period, with 1 indicating pre-treatment and 2 indicating post-treatment; β3 captures the impact of the pre-treatment FMA score, reflecting how baseline scores influence outcomes post-treatment; uj represents random effects specific to each patient, modeling inter-individual variability; and ϵij is the error term, accounting for measurement errors and other unobserved variations.
y^ij=β0+β1×Interventionij+β2×(Periodsij−1)+β3×FMA_preij+uj+ϵij
This model allows for a quantitative assessment of how the presence or absence of an intervention and the pre- and post-treatment periods affect functional improvement in patients.
To assess the adequacy and fit of our model, we used the Akaike information criterion (AIC) and Bayesian information criterion (BIC). These indices are crucial for model selection and help compare the relative goodness-of-fit of the statistical models. Considering the complexity of the model, lower AIC and BIC values indicate a better fit to the data. The AIC focuses on the trade-off between the goodness of fit and simplicity of the model, penalizing the inclusion of unnecessary variables. The BIC provides a stricter penalty for models with more parameters, thus preventing overfitting.
For stratification analysis, patients were stratified by severity using the baseline FMA score, ensuring that our model adjustments were specific to each severity group (≤20, severe; 21–45, moderate; and 46–66, mild paralysis) [31]. This stratification allowed us to assess the impact of the intervention more precisely within homogeneous subgroups defined by baseline clinical severity.
Post-hoc comparisons of changes (Δvalue) in between-group differences were performed using the Mann–Whitney U-test. In addition, intragroup comparisons were performed using the Wilcoxon signed-rank test. All statistical tests were two-sided, and significance was set at p<0.05. No statistical sample size calculations were performed. However, we performed post-hoc power and effect size analyses on the results of the 93 patients in this study using G*Power version 3.1 (Heinrich-Heine-Universität, Düsseldorf). We calculated the post-hoc power critical z=0.19, 1-β=0.48, and effect size h=0.4 using the z-test. Where data was missing from our study, we applied multiple imputation techniques to estimate and replace the missing values, ensuring comprehensive data analysis. This approach is aligned with the recommended practices for handling missing data in clinical research as detailed by Sterne et al. (2009), who emphasized the importance of addressing such gaps to maintain the validity of statistical inference [36].
Data analysis was conducted using Python (version 3.8, Wilmington, DE, USA). We used the ‘pandas‘ library (version 1.2.0) for data preprocessing and the ‘statsmodels’ library (version 0.12.0) to construct generalized linear mixed models (GLMM) using the ‘mixedlm’ function. The flexibility of Python allows for rigorous data manipulation and detailed modeling.
3. Results
Ninety-three patients with stroke were prescribed rehabilitation treatment at five medical institutions during the study period. The patients were randomly assigned to either the shaking exercise or the conventional therapy group at each hospital. The number of patients varied among the participating hospitals, ranging from nine to 41 per institution. All eligible patients were included (Table 1). Data from all 93 patients were analyzed (Figure 2).
Based on the GLMM analysis, after adjusting for the baseline FMA total score and including the random effect of individual differences, the shaking device intervention had a significant effect on the FMA total score (coefficient=0.69, SD=0.30, z=2.67, CI=[0.39 - 2.56], p=0.01). Similarly, a significant main effect difference was observed between pre- and post-intervention (Table 2).
No significant effect of the intervention was observed on the FMA subscores. Therefore, the predictive equation for the total FMA score was formulated as follows:
FMA_total=1.5+0.7×Interventionij +1.2×Periods+1.0×baseline_FMA_total
Values were inserted into the predictive equation to determine the improvement in the intervention group scores compared with those of the control group across the intervention period:
- eq 1. Control, Pre-intervention:
y^control, pre=1.5+0.7×0+1.2×(1−1)+1.0×baseline_FMA_total=1.5+FMA_pre
- eq 2. Control, Post-intervention:
y^control, post=1.5+0.7×0+1.2×(2−1)+1.0×baseline_FMA_total=2.7+FMA_pre
- eq 3. Intervention, Pre-treatment:
y^intervention, pre=1.5+0.7×1+1.2×(1−1)+1.0×baseline_FMA_total=2.2+FMA_pre
- eq 4. Intervention, Post-treatment:
y^intervention, post=1.5+0.7×1+1.2×(2−1)+1.0×baseline_FMA_total=3.4+baseline_FMA_total
- To estimate the improvement from pre- to post- in the control group:
Δcontrol =(2.7+baseline_FMA_total)−(1.5+baseline_FMA_total)=1.2
- From pre- to post- in the intervention group:
Δintervention=(3.4+baseline_FMA_total)−(2.2+baseline_FMA_total)=1.2
Interestingly, based on these calculations, both groups showed the same improvement of 1.2 points from pre-treatment to post-intervention when adjusted for the baseline FMA score. However, the intervention group scored 1.2 points higher at each stage than the control group due to the intervention effect (0.7 points directly from intervention status by GLMM). Thus, although the improvement due to the treatment period was the same, the intervention group consistently scored higher because of the effect of the intervention itself.
Table 3 provides post-hoc multiple comparisons of upper limb functional recovery measured using FMA-UE scores pre- and post-intervention involving the shaking exercise. The intervention group (Δ1.8 [0.8, 2.8]) showed a statistically greater improvement than the control group (Δ0.4 [-0.1, 1.0]) in FMA-UE total score (p=0.04, r=-0.24). A significant difference was observed in the intervention group's improvement in FMA-UE sub-score A (Δ1.2 [0.6, 1.8] vs. Δ0.3 [-0.2, 0.9], p=0.01, r=-0.29). Smaller changes were noted in both groups, with no significant differences detected in the FMA-UE sub-scores B (p=0.56, r=0.06), C (p=0.37, r=0.10), and D (p=0.16, r=0.11) (Figure 3).
Stratified analysis using GLMM showed that the intervention group had a mean increase of 1.03 points in the FMA total score (95% CI: 0.09, 1.98; p=0.033) in the moderate group. Furthermore, a mean increase of 1.38 points was observed post-intervention (95% CI: 0.46, 2.31; p=0.003). Additionally, the baseline FMA total value proved to be a significant predictor in the model, with a coefficient of 0.97, indicating statistically significant effects (95% CI: 0.91, 1.03; p<0.001) in the moderate group. The intervention effect was not statistically significant in the severe (coefficient=0.17, p=0.61) or mild groups (coefficient=0.05, p=0.61), suggesting that the intervention did not lead to measurable improvements in motor function compared with the control group. However, the significant periods effect in the severe (coefficient=0.68, p=0.02) and mild groups (coefficient=1.44, p=0.04) demonstrated that improvements were observed in both groups over time regardless of the intervention status (Table 4).
An intention-to-treat analysis was performed for secondary outcomes. The collection of MAS, ROM, and VAS data for the eight patients at one participating clinic was not feasible owing to the constraints imposed by the Japanese insurance system. To overcome this limitation and ensure the continuity and completeness of our dataset for secondary outcome analysis, missing MAS, ROM, and VAS data were imputed using multiple techniques.
To examine the effects of the intervention on chronic pain using the VAS, Wilcoxon signed-rank tests were performed to compare the pre- and post-intervention scores within each group. In the control group, a significant difference in the VAS scores was observed from pre- to post-intervention (W=23.00, p=0.02, Cohen’s d=0.00). Conversely, no significant changes were observed in the intervention group (W=8.00, p=0.60, Cohen’s d=0.00). A comparison of changes in the MAS scores, joint ROM, and pain perception measurements pre- and post-intervention between the shaking exercise and control groups showed no statistically significant differences for any of the parameters measured (Table 5).
Significant within-group changes in the control group were particularly notable in MAS elbow extension (W=19.5, p=0.005, effect size r=-0.839) and MAS wrist flexion (W=6.0, p=0.083, effect size r=-0.861). The other scores in the control group did not show statistically significant differences. In the intervention group, although there were no statistically significant overall changes, the MAS wrist flexion score showed a moderate effect size (W=97.5, p=0.206, effect size r=-0.720).
In within-group comparisons of the intervention group, the most significant change was observed in active shoulder extension ROM (W=93.0, p=0.011, effect size r=-0.727), indicating a statistically significant decrease in shoulder extension ROM following the intervention. Other ROM measurements showed no significant changes, with effect sizes indicating slight to moderate reductions, such as in passive elbow extension ROM (W=97.0, p=0.512, effect size r=-0.721) and passive wrist extension ROM (W=162.5, p=0.056, effect size r=-0.620). In the control group, no significant changes were observed in most ROM measurements after treatment. However, notable changes with moderate effect sizes were identified for several measurements, although they did not reach statistical significance at conventional thresholds.
This method allowed us to statistically estimate missing data based on available patient information and characteristics observed in complete cases. Table A1 presents the results of the per-protocol analysis of the secondary outcomes. Using non-imputed data, patients in the intervention group maintained a significantly greater active ROM in shoulder extension (Δ5.4 vs.Δ-1.3) and wrist active flexion (6.6 vs. 1.5; p=0.03), and less pain (-0.61 vs. 0.15) than the control group.
Only 1/47 patients (2.1%) in the test group experienced an adverse event that was undeniably related to the shaking device. The patient experienced mild pain in the clavicular area, which improved with follow-up. There were no adverse events in the control group.
4. Discussion
This study evaluated the effects of home-based training using a vibrational device, termed the "Kenko Yusuri" on functional recovery in patients with chronic post-stroke upper limb paralysis. According to the FMA-UE scores, the shaking exercise group showed significantly greater improvements than the control group that engaged in conventional training. Notably, this intervention was particularly effective in patients with moderate paralysis, suggesting that vibrational stimulation can enhance neuroplasticity and sensory-motor integration [37], potentially facilitating motor function recovery [38,39]. The efficacy of the intervention was further supported by the results derived from the GLMM analysis, which provided a predictive model for quantification of the intervention's impact on functional improvements.
Jiggling and vibratory exercises also reduce muscle spasticity, which is commonly observed among stroke survivors [40]. In this study, the use of a home-based shaking device significantly improved the total FMA scores of patients with moderate paralysis, demonstrating the efficacy of the device in activating sensorimotor pathways [41], which are often underused in paralyzed upper limbs [42]. Vibratory stimuli enhance proprioceptive feedback, which is essential for the motor learning and rehabilitation of individuals with neurological impairments. Recent studies have investigated the effects of vibration stimulation on upper limb spasticity after stroke, specifically comparing the effectiveness of vibration stimulation of the tendons and muscle bellies [43]. Vibration applied directly to the flexor tendon showed significantly greater reductions in spasticity than when it was applied to the muscle belly or after regular stretching. Vibratory stimulation is consistent with the hypothesized mechanism that tendon stimulation is more effective because of its effect on the Golgi tendon organ, which plays an important role in regulating muscle tone [44].
Improvements in upper limb paralysis with spasticity often necessitate the continuation of BoNT-A treatment for at least four sessions, alongside regular training [45]. However, progression towards functional improvement tends to plateau with prolonged treatment. Patients who have undergone >10 sessions of BoNT-A therapy typically show minimal functional enhancement, reaching a plateau in their recovery. For these long-term treatment patients, pain reduction is the primary goal and outcome, while spasticity control is essential for maintaining quality of life [46]. The patients in the present study underwentmultiple BoNT-A treatments, suggesting that their upper limb function may have reached a plateau despite consistent self-training. These patients often continued regular BoNT-A treatment and self-training. Although initial improvements in motor function may have been observed, these gains plateaued over time. Therefore, the unchanged MAS scores in the present study may be attributed to a plateau effect. Nonetheless, similar to the control of spasticity achieved with BoNT-A treatment, continuous self-training remains crucial.
In our study, patients with stroke used a shaking device at home, either independently or with family assistance. This approach aligns with emerging research suggesting that the engagement of patients in active movement is beneficial for recovery from paralysis. Recent research supports the idea that active participation in rehabilitation by patients with stroke can significantly enhance recovery outcomes [47]. This includes patients taking an active role in their recovery through home-based interventions, as these interventions have been shown to be effective for motor function recovery after stroke. Incorporating exercise and functional task practices into daily routines, as emphasized in recent guidelines, is crucial for motor recovery. These activities are most effective when they involve high repetition and are tailored to an individual's specific needs, allowing for the patient's active participation in the rehabilitation process (National Clinical Guideline for Stroke, 2023) [48]. The importance of patient-driven activities in stroke rehabilitation suggests that interventions should not only be guided by healthcare professionals but also encourage self-practice and active involvement in therapeutic activities to maximize recovery outcomes.
In the results of this study, in which varying degrees of stroke severity demonstrated different responses to shaking device interventions, it is important to consider the influence of initial impairment severity on rehabilitation outcomes. This differential response aligns with previous findings in stroke rehabilitation, suggesting that the initial severity of paralysis can significantly dictate the potential and rate of functional recovery [20,46]. Severe and mild cases often present with distinct challenges. Severe cases may involve extensive neurological damage, which limits the efficacy of peripheral stimulation interventions, as the central pathways may be too impaired to translate peripheral sensory inputs into meaningful motor outputs. Mild cases, on the other hand, may not show dramatic improvements simply because their baseline function is already high and the ceiling effect limits observable changes [49]. These observations underscore the necessity for a stratified approach to treatment and tailoring interventions to match the severity of impairment. Understanding and integrating severity-specific responses into rehabilitation protocols can optimize recovery trajectories and ensure that each patient receives the most appropriate and effective intervention tailored to their needs [50].
The intervention group in our study exhibited a mean increase in FMA-UE scores; however, these gains did not surpass the minimum clinically important difference (MCID) threshold [51]. The use of a shaking device represents a novel approach that provides specific neuromuscular stimulation, which may not be traditionally targeted in conventional stroke rehabilitation. Although neuroplasticity can still be promoted in the chronic phase of stroke recovery, the extent to which it can be influenced is often constrained by the severity and location of brain injury. Consequently, even modest improvements in the FMA-UE scores could indicate beneficial neurological adaptations [2,17]. The concept of MCID is critical for assessing the efficacy of interventions. However, it is inherently a population-based measurement that may not capture subtle yet clinically meaningful improvements at the individual level. Future studies should consider a personalized approach to therapy, emphasizing prolonged intervention durations and comprehensive outcome measures to fully capture the benefits of rehabilitation interventions.
This study, while innovative in its approach to post-stroke rehabilitation, has several limitations. First, the relatively small sample size and quasi-randomized design of our study may limit the generalizability of the findings. Larger, fully randomized controlled trials are recommended to confirm these results and enhance their applicability to a broader population of patients with stroke. Second, our findings indicated the variable efficacy of the intervention across different levels of severity of paralysis. The intervention showed significant benefits in patients with moderate severity, but not in those with mild or severe impairments. This suggests that the effectiveness of the intervention is contingent on the patient's initial functional status, necessitating further investigation of tailored therapeutic approaches for different severity levels. Third, all the participants received BoNT-A treatment, which may have confounded the effects of the shaking device on motor recovery. Future studies should consider separate groups for those receiving BoNT-A and those who do not to isolate the effects of the shaking device. Fourth, variability in adherence to the intervention protocol owing to the home-based nature of the therapy may have influenced the outcomes. Ensuring the consistent application of the intervention in such settings remains a challenge, and methods for monitoring and improving home-based intervention fidelity should be integrated into future studies. Fifth, the primary outcome measure, the FMA-UE, may not have captured all relevant aspects of functional improvement owing to its susceptibility to ceiling effects [49], particularly in patients with mild impairment. Including additional functional and patient-centered outcome measures could provide a more comprehensive assessment of the intervention's impact.
Continued BoNT-A treatment combined with daily training in the chronic phase can improve shoulder and arm motor function, even in patients with moderate-to-severe paralysis. The findings of this study support this hypothesis. Additionally, patients who underwent shaking training exhibited reduced chronic pain, a previously unreported benefit. Although the motor function improvements were small, they were clear, leading to greater patient motivation and activity, which, in turn, can further enhance motor function. The stratified analysis indicated that the intervention had significant effects, particularly in patients with moderate paralysis. For patients capable of isolated movement, treatments such as transcranial magnetic stimulation may further enhance functional recovery. In patients with severe or moderate paralysis, implementing a home-based training regimen using a shaking device can reduce pain and improve motor function. Conducting this training for 10 minutes, three times a day, while engaging in other activities, such as watching TV or talking, can be beneficial. This method offers a safe and sustainable treatment option that allows patients to continue treatment without excessive strain, thereby potentially reducing the economic burden on families and healthcare systems.
5. Conclusions
Our multicenter quasi-randomized controlled trial provides evidence supporting the use of home-based voluntary training using the "Kenko Yusuri" shaking device to enhance functional recovery in patients with chronic post-stroke upper limb paralysis. While the improvements in FMA-UE scores in the intervention group did not exceed the MCID, they were statistically significant compared with those of the control group. Our findings suggest that even modest gains in motor function can substantially affect the quality of life and independence of stroke survivors. Home-based interventions, such as the "Kenko Yusuri," provide a feasible and effective option to supplement traditional care strategies, making a meaningful difference to the management of chronic stroke rehabilitation.
Author Contributions
Conceptualization, M.A.; methodology, M.A.; formal analysis, T.H. and To.H.; investigation, T.H.; data curation, T.H.; writing—original draft preparation, To.H.; writing—review and editing, To.H. and M.A.; supervision, M.A.; project administration, T.H. All authors have read and agreed to the published version of the manuscript.
Funding
The shaking device in this study was rented free of charge from Shisei Medical Co.
Institutional Review Board Statement
This study was approved by the Clinical Review Board of Jikei University Educational Corporation (CRB3180031). In addition, this study was registered with the Japanese Registry of Clinical Trials (jRCTs032200164) by the Ministry of Health, Labor, and Welfare.
Informed Consent Statement
Informed consent was obtained from all subjects involved in the study. All patients provided written informed consent to publish this paper.
Data Availability Statement
Data presented in this study are available upon request from the corresponding author. These data are not publicly available because of privacy restrictions.
Acknowledgments
The authors would like to express our sincere gratitude to Dr. Tei Kensyaku of Aomori Shintoshi Hospital, Dr. Ikuo Kimura of Izumi Memorial Hospital, Dr. Mami Kodama of Gosho Minami Rehabilitation Clinic, Dr. Takatsugu Okamoto of Nishi Hiroshima Rehabilitation Hospital, and the physical and occupational therapists at each facility for their efforts in this study.
Conflicts of Interest
The authors declare no conflicts of interest.
Appendix A
Table A1.
Comparisons of the modified Ashworth scale and range of motion using active and passive movements within the shaking exercise and control groups, analyzed using raw data.
Table A1.
Comparisons of the modified Ashworth scale and range of motion using active and passive movements within the shaking exercise and control groups, analyzed using raw data.
| Intervention group (n=39) | Control group (n=39) | Between-group | Mean change | ||||
|---|---|---|---|---|---|---|---|
| Secondary endpoints (n=78) | Pre-test | Post-test | Pre-test | Post-test | p-value | Intervention group | Control group |
| (95% CI) | |||||||
| MAS (shoulder flexion) | 1 [1, 1]‡ | 1 [1, 1]‡ | 1 [1, 2] | 1 [1, 1]‡ | 0.574 | 0 [1, 0] | 0 [0, 0] |
| MAS (shoulder extension) | 1 [0, 1]‡ | 1 [0, 1]‡ | 1 [0, 1]‡ | 1 [0, 1]‡ | 0.59 | 0 [0, 0] | 0 [0, 0] |
| MAS (Elbow flexion) | 1 [1, 1]‡ | 1 [1, 1]‡ | 1 [1, 1]‡ | 1 [1, 1]‡ | 0.215 | 0 [-1, 0] | 0 [0, 0] |
| MAS (Elbow extension) | 1 [1, 1]‡ | 1 [1, 1]‡ | 1 [1, 1] ‡ | 1 [0, 1]‡ | 0.297 | 0 [-1, 0] | 0 [, 1, 0] |
| MAS (Wrist flexion) | 1 [0, 1]‡ | 1 [0, 1]‡ | 1 [1, 2] | 1 [1, 1]‡ | 0.367 | 0 [-1, 0] | 0 [0, 0] |
| MAS (Wrist extension) | 1 [1, 2]‡ | 1 [1, 1]‡ | 1 [1, 2] | 1 [1, 1] ‡ | 0.57 | 0 [-1, 0] | 0 [0, 0] |
| MAS (Finger flexion) | 1 [0, 2]‡ | 1 [0, 2] | 1 [0, 1] ‡ | 1 [0, 1] ‡ | 0.64 | 0 [-1, 0] | 0 [0, 0] |
| MAS (Finger extension) | 0 [0, 1]‡ | 1 [0, 1]‡ | 1 [0, 1]‡ | 1 [0, 1]‡ | 0.461 | 0 [0, 0] | 0 [0, 0] |
| Sholder flexion active ROM | 102.50±32.39+ | 102.78±35.65 | 80.00±46.73 | 81.03±47.69 | 0.808◊ (-5.33, 6.83) |
0.28±10.07 | 1.03±15.06 |
| Sholder flexion passive ROM | 138.47±23.11 | 140.28±22.86 | 131.76±29.56 | 134.12±29.04 | 0.796 (-3.71, 4.81) |
1.81±10.36 | 2.35±7.10 |
| Sholder extension active ROM | 32.08±15.92 | 37.50±13.91 | 30.88±15.54 | 32.21±25.14 | 0.019 (-12.39, -1.09)† |
5.42±14.31 | -1.32±8.47 |
| Sholder extension passive ROM | 49.58±11.97 | 51.06±11.54 | 45.15±11.38 | 43.82±11.68 | 0.162 (-6.78, 1.19) |
1.47±9.67 | -1.32±6.66 |
| Sholder abduction active ROM | 88.19±38.29+ | 88.89±36.80 | 65.29±33.93 | 65.15±35.52 | 0.819 (-8.19, 6.51) |
0.69±16.13 | -0.15±14.59 |
| Sholder abduction passive ROM | 122.50±35.73 | 124.86±35.89 | 113.68±37.42 | 112.06±40.99 | 0.381 (-12.86, 4.90) |
2.36±14.42 | -1.62±22.22 |
| Sholder adduction active ROM | 7.36±20.86 | 7.50±20.79 | 3.09±12.67 | 3.09±12.43 | 0.937 (-3.65, 3.37) |
0.14±8.58 | 0.00±5.77 |
| Sholder adduction passive ROM | 10.56±20.24 | 10.28±19.82 | 7.24±12.06 | 7.21±13.15 | 0.885 (-3.20, 3.70) |
-0.28±8.10 | -0.03±6.16 |
| Elbow flexion active ROM | 111.33±21.52 | 109.03±29.71 | 102.50±23.07 | 104.56±21.30 | 0.366 (-5.37, 14.09) |
-2.31±26.06 | 2.06±11.69 |
| Elbow flexion passive ROM | 135.14±8.49 | 136.25±8.14 | 132.21±16.34 | 131.47±15.45 | 0.197 (-4.66, 0.97) |
1.11±6.29 | -0.74±6.29 |
| Elbow extension active ROM | -22.78±22.57 | -20.69±21.22 | -24.71±25.88 | -25.29±27.33 | 0.281 (-7.60, 2.26) |
2.08±11.17 | -0.59±9.36 |
| Elbow extension passive ROM | -5.69±12.14 | -5.28±12.07 | -5.15±12.94 | -5.29±13.14 | 0.647 (-3.05, 1.92) |
0.42±6.48 | -0.15±3.37 |
| Wrist flexion active ROM | 23.33±28.23 | 16.67±27.95 | 16.18±30.00 | 17.65±29.47 | 0.026 (0.94, 15.34)† |
-6.67±17.81 | 1.47±11.52 |
| Wrist flexion passive ROM | 68.47±13.46 | 66.94±14.80 | 70.44±13.62 | 72.06±12.86 | 0.106 (-0.70, 7.00) |
-1.53±8.69 | 1.62±7.36 |
| Wrist extension active ROM | 13.47±38.24 | 23.33±28.88 | 7.65±30.83 | 9.41±28.81 | 0.14 (-19.05, 2.86) |
9.86±28.55 | 1.76±14.87 |
| Wrist extension passive ROM | 58.33±21.18 | 60.14±23.25 | 60.15±18.47 | 63.53±15.15 | 0.522 (-3.33, 6.49) |
1.81±10.77 | 3.38±9.75 |
| Pain VAS | 3.17±3.04 | 2.56±2.50* | 2.65±2.84 | 2.79±3.05 | 0.03 (-1.44, 0.07)† |
-0.61±1.59 | 0.15±1.26 |
| The pre-test was performed before the intervention, and the post-test was performed after 12 weeks. The Mann–Whitney U test was performed for MAS. Significantly differences were found *within groups and †between groups. ‡in the pre-test comparisons between the intervention and control groups, a significant difference was observed (p<0.05). The significance level was set at p<0.05 for differences between the two groups. CI; confidence interval, SD; standard deviation, 1Q and 3Q 25th–75th percentile values, MAS; modified Ashworth scale, ROM; range of motion | |||||||
References
- Patient survey 2020 (Classification of diseases). Available online: https://www.mhlw.go.jp/toukei/saikin/hw/kanja/10syoubyo/dl/r02syobyo.pdf (accessed on 6 May 2024).
- Langhorne, P.; Bernhardt, J.; Kwakkel, G. Stroke rehabilitation. Lancet 2011, 377, 1693–1702. [Google Scholar] [CrossRef]
- Wolf, S.L.; Winstein, C.J.; Miller, J.P.; Taub, E.; Uswatte, G.; Morris, D.; Giuliani, C.; Light, K.E.; Nichols-Larsen, D.; EXCITE Investigators. Effect of constraint-induced movement therapy on upper extremity function 3 to 9 months after stroke: The EXCITE randomized clinical trial. JAMA 2006, 296, 2095–2104. [Google Scholar] [CrossRef]
- Kwakkel, G.; Veerbeek, J.M.; van Wegen, E.E.H.; Wolf, S.L. Constraint-induced movement therapy after stroke. Lancet Neurol 2015, 14, 224–234. [Google Scholar] [CrossRef]
- Nakayama, H.; Jørgensen, H.S.; Raaschou, H.O.; Olsen, T.S. Recovery of upper extremity function in stroke patients: The Copenhagen Stroke Study. Arch Phys Med Rehabil 1994, 75, 394–398. [Google Scholar] [CrossRef]
- Palstam, A.; Sjödin, A.; Sunnerhagen, K.S. Participation and autonomy five years after stroke: A longitudinal observational study. PLoS ONE 2019, 14, e0219513. [Google Scholar] [CrossRef]
- Jørgensen, H.S.; Nakayama, H.; Raaschou, H.O.; Vive-Larsen, J.; Støier, M.; Olsen, T.S. Outcome and time course of recovery in stroke. Part I: Outcome. The Copenhagen stroke study. Arch Phys Med Rehabil 1995, 76, 399–405. [Google Scholar] [CrossRef]
- Francisco, G.E.; Bandari, D.S.; Bavikatte, G.; Jost, W.H.; McCusker, E.; Largent, J.; Zuzek, A.; Esquenazi, A. High clinician- and patient-reported satisfaction with individualized onabotulinumtoxinA treatment for spasticity across several etiologies from the Aspire study. Toxicon X 2020, 7, 100040. [Google Scholar] [CrossRef]
- Francisco, G.E.; Jost, W.H.; Bavikatte, G.; Bandari, D.S.; Tang, S.F.T.; Munin, M.C.; Largent, J.; Adams, A.M.; Zuzek, A.; Esquenazi, A. Individualized onabotulinumtoxinA treatment for upper limb spasticity resulted in high clinician- and patient-reported satisfaction: Long-term observational results from the Aspire study. PM R 2020, 12, 1120–1133. [Google Scholar] [CrossRef]
- van Mierlo, M.L.; van Heugten, C.M.; Post, M.W.M.; Hajós, T.R.S.; Kappelle, L.J.; Visser-Meily, J.M.A. Quality of life during the first two years post stroke: The Restore4Stroke cohort study. Cerebrovasc Dis 2016, 41, 19–26. [Google Scholar] [CrossRef]
- Treger, I.; Shames, J.; Giaquinto, S.; Ring, H. Return to work in stroke patients. Disabil Rehabil 2007, 29, 1397–1403. [Google Scholar] [CrossRef]
- Ward, A.B.; Wissel, J.; Borg, J.; Ertzgaard, P.; Herrmann, C.; Kulkarni, J.; Lindgren, K.; Reuter, I.; Sakel, M.; Säterö, P.; et al. Functional goal achievement in post-stroke spasticity patients: The Botox(r) Economic Spasticity Trial (BEST). J Rehabil Med 2014, 46, 504–513. [Google Scholar] [CrossRef]
- Molteni, F.; Wissel, J.; Fheodoroff, K.; Munin, M.C.; Patel, A.T.; Althaus, M.; Comes, G.; Dekundy, A.; Pulte, I.; Scheschonka, A.; et al. Improvement in quality-of-life-related outcomes following treatment with incobotulinumtoxinA in adults with limb spasticity: A pooled analysis. Toxins (Basel) 2023, 16. [Google Scholar] [CrossRef]
- Hara, T.; Niimi, M.; Yamada, N.; Shimamoto, Y.; Masuda, G.; Hara, H.; Abo, M. Prognosis prediction of the effect of botulinum toxin therapy and intensive rehabilitation on the upper arm function in post-stroke patients using hierarchical cluster analysis. Disabil Rehabil 2022, 44, 6815–6823. [Google Scholar] [CrossRef]
- Sunnerhagen, K.S.; Francisco, G.E. Enhancing patient-provider communication for long-term post-stroke spasticity management. Acta Neurol Scand 2013, 128, 305–310. [Google Scholar] [CrossRef] [PubMed]
- Palmcrantz, S.; Holmqvist, L.W.; Sommerfeld, D.K. Long-term health states relevant to young persons with stroke living in the community in southern Stockholm – a study of self-rated disability and predicting factors. Disabil Rehabil 2012, 34, 817–823. [Google Scholar] [CrossRef]
- Abo, M.; Kakuda, W.; Momosaki, R.; Harashima, H.; Kojima, M.; Watanabe, S.; Sato, T.; Yokoi, A.; Umemori, T.; Sasanuma, J. Randomized, multicenter, comparative study of NEURO versus CIMT in poststroke patients with upper limb hemiparesis: The NEURO-VERIFY Study. Int J Stroke 2014, 9, 607–612. [Google Scholar] [CrossRef]
- Kakuda, W.; Abo, M.; Sasanuma, J.; Shimizu, M.; Okamoto, T.; Kimura, C.; Kakita, K.; Hara, H. Combination Protocol of Low-Frequency rTMS and Intensive occupational therapy for post-stroke Upper Limb Hemiparesis: A 6-year Experience of more than 1700 Japanese Patients. Transl Stroke Res 2016, 7, 172–179. [Google Scholar] [CrossRef]
- Niimi, M.; Sasaki, N.; Kimura, C.; Hara, T.; Yamada, N.; Abo, M. Sleep during low-frequency repetitive transcranial magnetic stimulation is associated with functional improvement in upper limb hemiparesis after stroke. Acta Neurol Belg 2019, 119, 233–238. [Google Scholar] [CrossRef] [PubMed]
- Sakamoto, D.; Hamaguchi, T.; Murata, K.; Ito, H.; Nakayama, Y.; Abo, M. Upper limb function recovery by combined repetitive transcranial magnetic stimulation and occupational therapy in patients with chronic stroke according to paralysis severity. Brain Sci 2023, 13. [Google Scholar] [CrossRef]
- Sánchez-Cuesta, F.J.; González-Zamorano, Y.; Arroyo-Ferrer, A.; Moreno-Verdú, M.; Romero-Muñoz, J.P. Repetitive transcranial magnetic stimulation of primary motor cortex for stroke upper limb motor sequelae rehabilitation: A systematic review. NeuroRehabilitation 2023, 52, 329–348. [Google Scholar] [CrossRef]
- Almhdawi, K.A.; Mathiowetz, V.G.; White, M.; delMas, R.C. Efficacy of occupational therapy task-oriented approach in upper extremity post-stroke rehabilitation. Occup Ther Int 2016, 23, 444–456. [Google Scholar] [CrossRef]
- Rand, D.; Weingarden, H.; Weiss, R.; Yacoby, A.; Reif, S.; Malka, R.; Shiller, D.A.; Zeilig, G. Self-training to improve UE function at the chronic stage post-stroke: A pilot randomized controlled trial. Disabil Rehabil 2017, 39, 1541–1548. [Google Scholar] [CrossRef]
- Nudo, R.J. Recovery after brain injury: Mechanisms and principles. Front Hum Neurosci 2013, 7, 887. [Google Scholar] [CrossRef]
- Murphy, T.H.; Corbett, D. Plasticity during stroke recovery: From synapse to behaviour. Nat Rev Neurosci 2009, 10, 861–872. [Google Scholar] [CrossRef]
- Teramoto, Y.; Fukushima, K.; Koyama, T.; Ohashi, Y.; Uchiyama, K.; Takahira, N.; Takaso, M. Impact of jiggling exercise as conservative treatment for hip osteoarthritis: A report of two cases. Case Rep Orthop 2020, 2020, 2804193. [Google Scholar] [CrossRef]
- Yoshizuka, H.; Sato, T.; Murakami, J.; Mitsutake, T.; Hiromatsu, M. Short-term changes in radiographic joint space width after jiggling exercise as conservative treatment for hip osteoarthritis: A retrospective case series of nine patients. PLoS ONE 2021, 16, e0253643. [Google Scholar] [CrossRef]
- Gladstone, D.J.; Danells, C.J.; Black, S.E. The fugl-Meyer assessment of motor recovery after stroke: A critical review of its measurement properties. Neurorehabil Neural Repair 2002, 16, 232–240. [Google Scholar] [CrossRef]
- Hijikata, N.; Kawakami, M.; Ishii, R.; Tsuzuki, K.; Nakamura, T.; Okuyama, K.; Liu, M. Item difficulty of Fugl-Meyer assessment for upper extremity in persons with chronic stroke with moderate-to-severe upper limb impairment. Front Neurol 2020, 11, 577855. [Google Scholar] [CrossRef]
- Tauchi, Y.; Kyougoku, M.; Takahashi, K.; Okita, Y.; Takebayashi, T. Dimensionality and item-difficulty hierarchy of the Fugl-Meyer assessment of the upper extremity among Japanese patients who have experienced stroke. Top Stroke Rehabil 2022, 29, 579–587. [Google Scholar] [CrossRef]
- Woytowicz, E.J.; Rietschel, J.C.; Goodman, R.N.; Conroy, S.S.; Sorkin, J.D.; Whitall, J.; McCombe Waller, S. Determining levels of upper extremity movement impairment by applying a cluster analysis to the Fugl-Meyer assessment of the upper extremity in chronic stroke. Arch Phys Med Rehabil 2017, 98, 456–462. [Google Scholar] [CrossRef]
- Bohannon, R.W.; Smith, M.B. Interrater reliability of a modified Ashworth scale of muscle spasticity. Phys Ther 1987, 67, 206–207. [Google Scholar] [CrossRef]
- Joyce, C.R.; Zutshi, D.W.; Hrubes, V.; Mason, R.M. Comparison of fixed interval and visual analogue scales for rating chronic pain. Eur J Clin Pharmacol 1975, 8, 415–420. [Google Scholar] [CrossRef]
- de Melo, M.B.; Daldegan-Bueno, D.; Menezes Oliveira, M.G.; de Souza, A.L. Beyond ANOVA and MANOVA for repeated measures: Advantages of generalized estimated equations and generalized linear mixed models and its use in neuroscience research. Eur J Neurosci 2022, 56, 6089–6098. [Google Scholar] [CrossRef]
- Hayward, K.S.; Ferris, J.K.; Lohse, K.R.; Borich, M.R.; Borstad, A.; Cassidy, J.M.; Cramer, S.C.; Dukelow, S.P.; Findlater, S.E.; Hawe, R.L.; et al. Observational study of neuroimaging biomarkers of severe upper limb impairment after stroke. Neurology 2022, 99, e402–e413. [Google Scholar] [CrossRef]
- Sterne, J.A.C.; White, I.R.; Carlin, J.B.; Spratt, M.; Royston, P.; Kenward, M.G.; Wood, A.M.; Carpenter, J.R. Multiple imputation for missing data in epidemiological and clinical research: Potential and pitfalls. BMJ 2009, 338, b2393. [Google Scholar] [CrossRef]
- Ward, N.S.; Cohen, L.G. Mechanisms underlying recovery of motor function after stroke. Arch Neurol 2004, 61, 1844–1848. [Google Scholar] [CrossRef]
- Wang, L.; Yu, C.; Chen, H.; Qin, W.; He, Y.; Fan, F.; Zhang, Y.; Wang, M.; Li, K.; Zang, Y.; et al. Dynamic functional reorganization of the motor execution network after stroke. Brain 2010, 133, 1224–1238. [Google Scholar] [CrossRef]
- Zhang, M.; Wei, J.; Wu, X. Effects of whole-body vibration training on lower limb motor function and neural plasticity in patients with stroke: Protocol for a randomised controlled clinical trial. BMJ Open 2022, 12, e060796. [Google Scholar] [CrossRef]
- Teasell, R.; Salbach, N.M.; Foley, N.; Mountain, A.; Cameron, J.I.; Jong, A.; Acerra, N.E.; Bastasi, D.; Carter, S.L.; Fung, J.; et al. Canadian Stroke Best Practice Recommendations: Rehabilitation, Recovery, and Community Participation following Stroke. Part One: Rehabilitation and Recovery Following Stroke; 6th Edition Update 2019. Int J Stroke 2020, 15, 763–788. [Google Scholar] [CrossRef]
- Rosenkranz, K.; Rothwell, J.C. Differential effect of muscle vibration on intracortical inhibitory circuits in humans. J Physiol 2003, 551, 649–660. [Google Scholar] [CrossRef]
- Rosenkranz, K.; Butler, K.; Williamon, A.; Cordivari, C.; Lees, A.J.; Rothwell, J.C. Sensorimotor reorganization by proprioceptive training in musician’s dystonia and writer’s cramp. Neurology 2008, 70, 304–315. [Google Scholar] [CrossRef]
- Takeuchi, K.; Takebayashi, T.; Hanioka, D.; Okita, Y.; Shimada, S. Comparison of tendon and muscle belly vibratory stimulation in the treatment of post-stroke upper extremity spasticity: A retrospective observational pilot study. Sci Rep 2024, 14, 4151. [Google Scholar] [CrossRef]
- Afzal, T.; Chardon, M.K.; Rymer, W.Z.; Suresh, N.L. Stretch reflex excitability in contralateral limbs of stroke survivors is higher than in matched controls. J Neuroeng Rehabil 2019, 16, 154. [Google Scholar] [CrossRef]
- Kenmoku, M.; Murata, K.; Taguchi, K.; Tanaka, T.; Sasaki, N.; Abo, M. The effect of 6 treatment with botulinum neurotoxin type A for patients with upper limb hemiparesis after stroke. In Japanes. Tokyo Jikei Medical Journal 2017, 132, 162–167. [Google Scholar]
- Hamaguhi, T.; Abo, M. Recovery of patients with upper limb paralysis due to stroke who underwent intervention using low-frequency repetitive transcranial magnetic stimulation combined with occupational therapy: A retrospective cohort study. Neuromodulation 2023, 26, 861–877. [Google Scholar] [CrossRef]
- Godlove, J.; Anantha, V.; Advani, M.; Des Roches, C.; Kiran, S. Comparison of therapy practice at home and in the clinic: A retrospective analysis of the constant therapy platform data set. Front Neurol 2019, 10, 140. [Google Scholar] [CrossRef]
- Stroke, N.C.G.f. National Clinical Guideline for Stroke for the UK and Ireland; 2023. [Google Scholar]
- Lee, H.H.; Kim, D.Y.; Sohn, M.K.; Shin, Y.I.; Oh, G.J.; Lee, Y.S.; Joo, M.C.; Lee, S.Y.; Han, J.; Ahn, J.; et al. Revisiting the proportional recovery model in view of the ceiling effect of Fugl-Meyer assessment. Stroke 2021, 52, 3167–3175. [Google Scholar] [CrossRef]
- Kimura, I.; Senoo, A.; Abo, M. Changes in structural neural networks in the recovery process of motor paralysis after stroke. Brain Sci 2024, 14. [Google Scholar] [CrossRef]
- Page, S.J.; Fulk, G.D.; Boyne, P. Clinically important differences for the upper-extremity Fugl-Meyer Scale in people with minimal to moderate impairment due to chronic stroke. Phys Ther 2012, 92, 791–798. [Google Scholar] [CrossRef]
Figure 1.
Conceptual diagram and protocol of this study designed to examine the differences in the effects of Shaking exercise and conventional therapies on functions of upper limb in participants with paralysis. A: The patient places or grips his or her hand on the handlebar, and the device uses the principle of leverage to generate a pendulum-like motion that swings the affected hand. B: Patients in the intervention group performed daily shaking exercises at home, three times a day, for 10 minutes each time. The control group performed self-training at home that was guided by outpatient rehabilitation. Both groups continued outpatient treatment for 3 months.
Figure 1.
Conceptual diagram and protocol of this study designed to examine the differences in the effects of Shaking exercise and conventional therapies on functions of upper limb in participants with paralysis. A: The patient places or grips his or her hand on the handlebar, and the device uses the principle of leverage to generate a pendulum-like motion that swings the affected hand. B: Patients in the intervention group performed daily shaking exercises at home, three times a day, for 10 minutes each time. The control group performed self-training at home that was guided by outpatient rehabilitation. Both groups continued outpatient treatment for 3 months.
Figure 2.
Flow chart of the processing protocol applied in this study for the inclusion and categorization of the participants. The included study participants from five hospitals (n = 93) underwent shaking exercise or conventional therapy. The same patients were also divided into 3 groups according to the function score of the upper extremity.
Figure 3.
Scatter plots of the FMA total score in the shaking exercise and conventional therapy groups. Plots of changes in the scores compared with pre- and post-intervention of all patients. Stratified plots of patients.
Figure 3.
Scatter plots of the FMA total score in the shaking exercise and conventional therapy groups. Plots of changes in the scores compared with pre- and post-intervention of all patients. Stratified plots of patients.
Table 1.
Pre-treatment baseline characteristics of the shaking exercise and control groups.
| variables | All | Intervention | Control | Statistics | ||
|---|---|---|---|---|---|---|
| (N=93) | (n=47) | (n=46) | χ2 or U | p-value | r or V | |
| Sex (Female/Male) | 50/43 | 26/22 | 24/21 | 0.00 | 1.00 | 0.00 |
| Age | 59 [53, 68] | 59 [53, 67] | 59 [53, 68] | 1065 | 0.91 | 0.49 |
| Diagnosis (CI/ICH/other) | 33/55/5 | 16/30/2 | 17/25/3 | 0.59 | 0.75 | 0.08 |
| Affected side (L/R) | 46/47 | 27/21 | 19/26 | 1.31 | 0.25 | 0.12 |
| Month from onset | 131 [92, 175] | 136 [98, 177] | 126 [81, 175] | 1487 | 0.36 | 0.56 |
| FMA-UE total score | 24 [18, 30] | 27 [23, 31]* | 20 [17, 23] | 1343 | 0.04 | 0.62 |
| BoNT-A treatments | 14 [10, 18] | 14 [11, 19] | 13 [9, 17] | 1124 | 0.81 | 0.49 |
| BoNT-A dose (Unit) | 250 [200, 350] | 250 [200, 400] | 250 [200, 300] | 1208 | 0.32 | 0.56 |
| Data are presented as median [1st, 3rd quartile]. Chi-square test with Cramer's V for effect size is used to compare the number of patients, diagnosis, and affected side in each group. Month from onset, FMA-UE, BoNT-A are compared with Mann-Whitney U-test. *p<0.05 compared with controls. CI; cerebral infarction, ICH; intra cerebral hemorrhage, FMA-UE; Fugl-Meyer assessment of the upper extremity, BoNT-A; Botulinum toxin type A | ||||||
Table 2.
Estimated factor levels by Generalized Mixed Linear Model for FMA-UE Scores.
| Variable | β | SD | z | P-value | 95% CI | Model Fit Indices | |
|---|---|---|---|---|---|---|---|
| FMA-UE total | Intercept | 1.48 | 0.55 | 2.67 | 0.01* | (0.39, 2.56) | AIC=789.4 BIC=805.6 REML-based Log-Likelihood=394.8 |
| Intervention | 0.69 | 0.30 | 2.30 | 0.02* | (0.10, 1.27) | ||
| Periods | 1.13 | 0,29 | 3.88 | <0.001* | (0.56, 1.70) | ||
| Baseline | 1.00 | 0.01 | 87.46 | <0.001* | (0.98, 1.02) | ||
| Part A | Intercept | 0.10 | 0.53 | 0.18 | 0.86 | (0.94, 1.13) | AIC=423.6 BIC=452.6 REML-based Log-Likelihood=-202.8 |
| Intervention | 0.84 | 0.65 | 1.28 | 0.20 | (0.44, 2.11) | ||
| Periods | 0.33 | 0.29 | 1.12 | 0.26 | (0.25, 0.90) | ||
| Baseline | 0.99 | 0.01 | 67.15 | 000* | (0.96, 1.02) | ||
| Part B | Intercept | 0.22 | 0.10 | 2.26 | 0.02 | (0.03, 0.42) | AIC=230.1 BIC=259.2 REML-based Log-Likelihood=-106.1 |
| Intervention | 0.00 | 0.04 | 0.03 | 0.98 | (0.08, 0.08) | ||
| Periods | 0.23 | 0.09 | 2.42 | 0.02* | (0.04, 0.41) | ||
| Baseline | 1.00 | 0.01 | 129.72 | < 0.001* | (0.98, 1.01) | ||
| Part C | Intercept | 0.31 | 0.30 | 1.05 | 0.29 | (0.27, 0.90) | AIC=504.7 BIC=524.1 REML-based Log-Likelihood=−246.4 |
| Intervention | 0.35 | 0.41 | 0.86 | 0.39 | (0.45, 1.16) | ||
| Periods | 0.22 | 0.19 | 1.18 | 0.24 | (0.14, 0.58) | ||
| Baseline | 0.37 | 0.26 | 1.41 | 0.16 | (0.88, 0.14) | ||
| Part D | Intercept | 0.03 | 0.14 | 0.21 | 0.84 | (0.25, 0.31) | AIC=242.2 BIC=261.5 REML-based Log-Likelihood=115.1 |
| Intervention | 0.19 | 0.2 | 0.94 | 0.35 | (0.20, 0.58) | ||
| Periods | 0.02 | 0.09 | 0.24 | 0.81 | (0.15, 0.20) | ||
| Baseline | 0.99 | 0.02 | 48.75 | < 0.001* | (0.95, 1.03) | ||
| The model includes data from 186 observations across 93 participants during each period. The intercept represents the predicted FMA_total score for a non-intervention individual at baseline FMA_total of zero. Each coefficient is presented with its respective standard error, z-value, p-value, and 95% confidence interval. The variable 'Intervention' indicates the group, and 'Periods' distinguishes between pre- and post-intervention assessments. 'Baseline' denotes FMA_total score at baseline. Statistical significance is set at *p<0.05. SD; Standard Error, β; estimated coefficient | |||||||
Table 3.
Changes in FMA-UE Scores Pre- and Post-intervention, Compared with Control and Intervention Groups.
Table 3.
Changes in FMA-UE Scores Pre- and Post-intervention, Compared with Control and Intervention Groups.
| FMA-UE | Intervention (n=47) | Control (n=46) | U | P-value | (r) | ||||
|---|---|---|---|---|---|---|---|---|---|
| pre | post | delta | pre | post | delta | ||||
| Total | 26.8 (23.0, 31.2) |
28.4 (24.4, 33.0) |
1.8 (0.8, 2.8) |
20.0 (17.1, 23.3) |
20.3 (17.4, 23.7) |
0.4 (-0.1, 1.0) |
823 | 0,04* | 0,24 |
| Part A | 21.4 (19.4, 23.5) |
22.6 (20.6, 24.7) |
1.2 (0.6, 1.8) |
17.5 (15.5, 19.6) |
17.9 (15.8, 20.0) |
0.3 (-0.2, 0.9) |
770 | 0,01* | 0,29 |
| Part B | 2.9 (2.1, 3.7) |
3.1 (2.3, 3.9) |
0.2 (-0.2, 0.6) |
1.7 (0.9, 2.4) |
1.9 (1.1, 2.7) |
0.2 (-0.1, 0.6) |
1015 | 0,56 | 0,06 |
| Part C | 4.1 (2.9, 5.2) |
4.2 (3.1, 5.4) |
0.2 (-0.3, 0.6) |
3.5 (2.4, 4.7) |
3.3 (2.2, 4.5) |
-0.2 (-0.5, 0.1) |
977 | 0,37 | 0,10 |
| Part D | 1.3 (0.8, 1.7) |
1.4 (1.0, 1.9) |
0.2 (0.0, 0.4) |
0.8 (0.3, 1.2) |
0.7 (0.3, 1.2) |
0.0 (-0.2, 0.1) |
964 | 0,16 | 0,11 |
| This table presents the results of a Mann–Whitney U test comparing the changes (Δ values) in FMA scores before and after treatment between the control and intervention groups. Δ values are calculated as the difference between post- and pre-intervention scores for each measure. The table includes the median changes along with the first and third quartiles for each group. *P-values <0.05 indicate statistically significant differences between the groups. Effect size (r) is reported to quantify the magnitude of the difference, with values closer to -1 or 1 indicating a stronger effect. Scores are presented as the mean, 95% CI. | |||||||||
Table 4.
Estimated Factor Levels using the Generalized Mixed Linear Model for FMA-UE Total Score, stratified by Severity of Paralysis.
Table 4.
Estimated Factor Levels using the Generalized Mixed Linear Model for FMA-UE Total Score, stratified by Severity of Paralysis.
| Variable | β | SD | z-Value | P-value | 95% CI | Model Fit Indices | |
|---|---|---|---|---|---|---|---|
| mild (n=9) | Intercept | 1.56 | 2.73 | -0.57 | 0.57 | (3.78, 6.90) | AIC=71.7 BIC=78.8 REML-based Log-Likelihood=-27.8 |
| Intervention | 0.05 | 0.39 | -0.12 | 0.91 | (0.73, 0.82) | ||
| Periods | 1.44 | 0.73 | 1.98 | 0.04* | (0.02, 2.87) | ||
| Baseline | 0.00 | 0.05 | 0.05 | 0.96 | (-0.10, 0.12) | ||
| moderate (n=50) | Intercept | 1.04 | 1.21 | -0.86 | 0.39 | (1.33, 3.42) | AIC=463.5 BIC=479.1 REML-based Log-Likelihood=-225.7 |
| Intervention | 1.03 | 0.48 | 2.14 | 0.03* | (0.09, 1.98) | ||
| Periods | 1.38 | 0.47 | 2.92 | 0.00 | (0.46, 2.31) | ||
| Baseline | 0.97 | 0.03 | 31.84 | < 0.001* | (0.91, 1.03) | ||
| severe (n=34) | Intercept | 0.85 | 0.66 | 1.29 | 0.20 | (0.44, 2.13) | AIC=231.8 BIC=245.1 REML-based Log-Likelihood=-113.9 |
| Intervention | 0.17 | 0.33 | 0.51 | 0.61 | (0.48, 0.82) | ||
| Periods | 0.68 | 0.30 | 2.25 | 0.02* | (0.09, 1.27) | ||
| Baseline | 1.01 | 0.03 | 29.37 | 0.00* | (0.94, 1.08) | ||
| The model includes data from 186 observations across 93 participants in each period. The intercept represents the predicted FMA_total score for a non-intervention individual at baseline FMA_total of zero. Each coefficient is presented with its respective standard error, z-value, p-value, and 95% confidence interval. The variable 'Intervention' indicates the group, and 'Periods' distinguishes between pre- and post-intervention assessments. 'Baseline' denotes FMA_total score at baseline. Scores are presented as the mean, 95% CI. *p<0.05. SD; Standard Error, β; estimated coefficient | |||||||
Table 5.
Comparative Analysis of Motor Function Outcomes Between the Control and Intervention Groups: Assessing Efficacy Through Modified Ashworth Scale and Range of Motion Measurements.
Table 5.
Comparative Analysis of Motor Function Outcomes Between the Control and Intervention Groups: Assessing Efficacy Through Modified Ashworth Scale and Range of Motion Measurements.
| Variables | Intervention group | Control group | ΔControl vs. ΔIntervention |
||||||||
|---|---|---|---|---|---|---|---|---|---|---|---|
| pre | post | delta | pre | post | delta | U | P | r | |||
| modified Ashworth scale | shoulder | flex | 1 (1, 2) | 1 (1, 2) | 0 (0, 1) | 1 (1, 2) | 1 (0, 2) | 0 (0, 0) | 908 | 0.14 | -0.16 |
| ext | 1 (0, 2) | 1 (0, 2) | 0 (0, 0) | 1 (0, 2) | 1 (0, 2) | 0 (0, 0) | 1028 | 0.62 | -0.05 | ||
| elbow | flex | 1 (1, 2) | 1 (1, 2) | 0 (0, 1) | 1 (1, 2) | 1 (1, 2) | 0 (0, 0) | 1202 | 0.31 | 0.11 | |
| ext | 2 (1, 2) | 2 (1, 2) | 0 (0, 1) | 2 (1, 2)* | 1 (0, 2) | 0 (0, 1) | 930 | 0.20 | -0.14 | ||
| wrist | flex | 1 (0, 2) | 1 (0, 2) | 0 (0, 1) | 1 (1, 2) | 1 (1, 2) | 0 (0, 0) | 1082 | 1.00 | 0.00 | |
| ext | 2 (1, 2) | 2 (1, 2) | 0 (0, 1) | 1 (0, 2) | 1 (1, 2) | 0 (0, 0) | 1087 | 0.97 | 0.01 | ||
| finger | flex | 2 (0, 2) | 1 (0, 2) | 0 (0, 1) | 1 (0, 2) | 1 (0, 2) | 0 (0, 0) | 1091 | 0.93 | 0.01 | |
| ext | 0 (0, 2) | 1 (0, 2) | 0 (0, 0) | 1 (0, 2) | 1 (0, 2) | 0 (0, 0) | 1037 | 0.68 | -0.04 | ||
| Active Range of Motion | shoulder | flex | 110 (125, 80) | 110 (125, 88) | 0 (-5, 10) | 83 (110, 43) | 83 (120, 50) | 0 (-5, 9) | 1094 | 0.92 | 0.01 |
| ext | 40 (40, 20) | 40 (50, 30) | 0 (-5, 5) | 35 (40, 25) | 35 (40, 20) | 0 (-5, 5) | 1311 | 0.06 | 0.21 | ||
| abd | 75 (120, 60) |
85 (113, 60) |
5 (0, 10) | 60 (85, 50) | 60 (80, 41) | 0 (-5, 5) | 1187 | 0.41 | 0.10 | ||
| add | 0 (10, 0) | 0 (0, 0) | 0 (0, 0) | 0 (0, 0) | 0 (0, 0) | 0 (0, 0) | 999 | 0.46 | -0.08 | ||
| elbow | flex | 115 (130, 103) | 115 (130, 100) | 5 (-10, 0) | 100 (114, 76) | 100 (120, 83) | 0 (-5, 5) | 1036 | 0.73 | -0.04 | |
| ext | -15 (-38, 0) | -10 (0, -30) | 5 (0, 10) | -18 (-49, 0) | -15 (-39, -6) | 5 (0, 10) | 1214 | 0.30 | 0.12 | ||
| wrist | flex | 15 (40, 0) | 15 (40, -5) | 0 (-5, 5) | 13 (0, 30) | 18 (-10, 30) | 0 (-5, 5) | 941 | 0.27 | -0.13 | |
| ext | 30 (40, 0) | 30 (45, 5) | 0 (0, 0) | 5 (-28, 35) | 8 (-20, 34) | 0 (-10, 0) | 1141 | 0.64 | 0.06 | ||
| Passive Range of Motion | shoulder | flex | 140 (125, 155) |
140 (120, 160) |
0 (-5, 10) | 138 (120, 160) |
135 (120, 154) |
0 (-5, 9) | 1048 | 0.80 | 0.03 |
| ext | 50 (45, 60) | 50 (48, 58) | 0 (-5, 5) | 50 (41, 50) | 50 (40, 50) | 0 (-5, 0) | 1006 | 0.55 | 0.07 | ||
| abd | 135 (130, 140) |
140 (130, 143) |
0 (0, 5) | 140 (130, 145) |
133 (125, 145) |
0 (-5, 0) | 892 | 0.12 | 0.18 | ||
| add | 0 (-10, 0) | 0 (-5, 0) | 0 (0, 0) | 0 (-9, 0) | 0 (-5, 0) | 0 (0, 0) | 1054 | 0.81 | 0.03 | ||
| elbow | flex | 120 (95, 150) |
120 (98, 155) |
5 (-10, 10) |
118 (90, 145) | 110 (90, 144) | 0 (-14, 5) | 898 | 0.16 | 0.17 | |
| ext | 0 (0, 13) | 0 (0, 0) | 0 (0, 0) | 0 (0, 12) | 0 (0, 0) | 0 (0, 0) | 1187 | 0.27 | -0.10 | ||
| wrist | flex | 70 (60, 80) | 70 (60, 80) | 0 (-8, 5) | 70 (65, 80) | 70 (60, 80) | 0 (0, 5) | 1144 | 0.62 | -0.06 | |
| ext | 60 (45, 70) | 70 (48, 80) | 0 (0, 10) | 68 (50, 75) | 68 (55, 74) | 0 (0, 9) | 1029 | 0.68 | 005 | ||
| Pain VAS | 2 (0, 5) | 2 (0, 6) | 0 (0, 0) | 3 (0, 6) | 2 (0, 5)* | 0 (-1, 0) | 914 | 0.10 | 0.10 | ||
| A Mann–Whitney U test was used to compare changes in MAS and ROM between groups, quantified by calculating the difference (Δ values) between pre- and post-intervention measurements. P-values are presented for the results of comparisons between the shaking exercise and control groups. *p<0.05 for within-group comparisons were performed using a Wilcoxon signed-rank test. Data are presented as medians and 25th–75th percentile values. | |||||||||||
Disclaimer/Publisher’s Note: The statements, opinions and data contained in all publications are solely those of the individual author(s) and contributor(s) and not of MDPI and/or the editor(s). MDPI and/or the editor(s) disclaim responsibility for any injury to people or property resulting from any ideas, methods, instructions or products referred to in the content. |
© 2024 by the authors. Licensee MDPI, Basel, Switzerland. This article is an open access article distributed under the terms and conditions of the Creative Commons Attribution (CC BY) license (http://creativecommons.org/licenses/by/4.0/).
Copyright: This open access article is published under a Creative Commons CC BY 4.0 license, which permit the free download, distribution, and reuse, provided that the author and preprint are cited in any reuse.
Impact of Somatosensory Training on Neural and Functional Recovery of Lower Extremity in Patients with Chronic Stroke: A Single Blind Controlled Randomized Trial
Reem M. Alwhaibi
et al.
IJERPH,
2021
Effect of Core Exercises on Motor Function Recovery in Stroke Survivors with Very Severe Motor Impairment
Zuliana Bacho
et al.
JCDD,
2023


MDPI Initiatives
Important Links
© 2024 MDPI (Basel, Switzerland) unless otherwise stated