Preprint
Article

Evaluation of LoRa Network Performance for Water Quality Monitoring Systems

Altmetrics

Downloads

115

Views

60

Comments

0

A peer-reviewed article of this preprint also exists.

Submitted:

25 May 2024

Posted:

27 May 2024

You are already at the latest version

Alerts
Abstract
A smart water quality monitoring system based on the Internet of Things (IoT) paradigm was designed to protect water resources from pollution in real-time. Long-range (LoRa) application of the low-power, wide-area networking (LPWAN) concept has become a phenomenon in IoT smart monitoring applications. This study proposes the implementation of a LoRa network in a water quality monitoring system-based IoT approach. The LoRa nodes were embedded with measuring sensors pH, turbidity, temperature, total dissolved solids (TDS), and dissolved oxygen (DO), in the designated water station. It operates at a transmission power of 14 dB and a bandwidth of 125 kHz. The network properties were tested with two different antenna gains of 2.1 dBi and 3 dBi with three different spread factors (SF) of 7, 9, and 12. The water stations were located at Sungai Pantai and Sungai Anak Air Batu, both rivers on the Universiti Malaya campus. Following a dashboard display and K-means analysis of the water quality data received by the LoRa gateway, it was determined that both rivers are Class II B rivers. The results from the evaluation of LoRa performance on the Received Strength Signal Indicator (RSSI), Signal Noise Ratio (SNR), loss packet, and path loss at best were -83 dBm, 7 dB, < 0%, and 64.41 dB, respectively, with a minimum received sensitivity of -129.1 dBm. LoRa has demonstrated its efficiency in an urban environment for smart river monitoring purposes.
Keywords: 
Subject: Engineering  -   Electrical and Electronic Engineering

1. Introduction

Industry 4.0, uniting both the physical and digital realms, has revolutionized the industry value chain. The transformation-constructed smart machine Internet-based notorious Internet of Things (IoT) enables data exchange between machines. IoT reduces human interference by introducing a remote monitoring system that can optimize real-time connection values. Remote monitoring systems improve the reliability of data collection, analysis, and operations [1]. The implementation of IoT in autonomous monitoring has transformed the potential of various industries, including the set of environmental applications of Smart Earth technology [2]. The increase in IoT demand in Smart Earth applications for its efficiency and precision services while operating at low cost and energy is parallel to its strategy for ecosystem management.
The Anthropocene epoch contributed to the World Health Organization’s (WHO) instigation and formulated the Sustainable Development Goals (SDG) blueprint to protect the planet and promote a healthy lifestyle. Objective 3 of the SDG progresses towards healthy lives, including the provision of target 6 of the SDG, protection of water ecosystems, and management of sanitation of water resources from pollution and scarcity [3]. Consequently, Malaysia has adopted Integrated Water Resources Management (IWRM) and Integrated River Basin Management (IRBM) programs to regulate water resources, predominantly rivers, because they are the main water resources [4]. However, only 47% of the water resources in Malaysia are classified as clean, while the remaining 43% are slightly polluted, and the remaining 10% are polluted due to poor management of water resources. Even during the pandemic Covid-19 between the years 2020 and 2021, the rivers of Sungai Gong and Sungai Semenyih in Selangor were polluted by hazardous chemicals and agricultural waste [5]. The unscheduled water supply due to water shortage affects the economy and productivity, as it drives the water plant to cease operations for cleaning purposes.
Therefore, monitoring the water quality conditions based on physical, chemical, and biological characteristics is the primary operation to support IWRM and IRBM [6,7]. The analysis of qualitative data on water quality characteristics was supervised to classify water bodies based on the Water Quality Index (WQI) and National Water Quality Standards (NWQS) in Malaysia [8]. The conventional method for monitoring the water quality requires a period of laboratory analysis. Thus, the assistance of autonomous water quality monitoring can provide an analysis of water quality properties that can vary over time [9]. The modification of autonomous water quality monitoring with IoT implementation acts as a quick decision-maker for water environmentalists based on real-time data. This reduces human labor and increases the reliability of data [10].
The employment type of the wireless network, which is the main element in IoT operation, necessitates the purpose of the system, type of experimental data, and location of the study. The invention of long-range (LoRa) networks in the wireless network community has become a game changer in IoT applications [11]. LoRa is the derivation of Chirp Spread Spectrum (CSS) technology to operate at long-range using an air interface [12]. This technology allows a low-type data rate to be transmitted within geographical and urban areas by manipulating its vast network coverage at a low power consumption and low cost. Relating to the ability of LoRa to operate with a large volume of sensors with low-type data rate output, this research is intended to study the design of a continuous water quality monitoring system with the LoRa approach performance evaluation.
The remainder of this paper is organized as follows. Section 2 discusses related work on the implementation of wireless networks as IoT solutions in water quality monitoring systems and reviews LoRa technology and its applications. The parameters, development, and design of autonomous water quality monitoring are elaborated in Section 3, including descriptions of the LoRa network parameters to be evaluated. The results of the experiment are explained and analyzed in Section 4, and lastly concluded and are referred to for future reference in Section 5.

2. Literature Review

2.1. Water Quality Monitoring Based With IoT Application with Different Wireless Network

The classification of water through water quality monitoring serves a broad purpose in water resource conservation based on the assessment of pollution control, assuring the sanctuary of biological ecology and health status for living organisms, and evaluating the current water quality trends, efficiency of waste management, and water treatment. The development of a continuous water quality monitoring system that delivers real-time data overcomes the drawbacks of manual methods in improving the accuracy of water quality data analysis.
Continuous water quality monitoring using IoT-based architecture deployed Wireless Sensor Networks (WSN). It dedicates sensors to collecting water quality data that require a wireless network as a bridge to communicate with end devices that act as a portal to the IoT platform. The significance of determining the types of wireless networks to be implemented in a water quality monitoring system reflects the capabilities and limitations of the application objectives. Effective IoT execution includes balancing the power, cost, efficiency, and maintenance [13].
Adopting various types of wireless networks into the water quality monitoring system, IoT has been proposed and evaluated by previous researchers. A Personal Area Network (PAN)-type network is a solution to IoT technology, offering its competencies to operate in closed proximity applications while being cost-and energy-effective. Moldovaeba et al. and Wang et al. used Zigbee as their PAN radio frequency module for continuous water quality monitoring [14,15]. Data were transmitted through the GPRS from the GSM version, extending the communication range. Signified by water quality data rates, the merger of two networks for extension unnecessarily consumes additional energy and cost, as the SIM card is required for communication activation.
Wi-Fi is another notorious network technology in IoT applications owing to its high data rates and low-cost antennas. Dilshad et al. and Naj et al. implemented Wi-Fi as a communication network for water quality monitoring system [16,17]. The vast amount of data transmitted improved the accuracy of water quality analysis with low latency. However, the limited range of Wi-Fi requires additional Wi-Fi extenders for river environments, which increases the utilization of operational costs and power.
Joseph et al. subscribed to the 3G network as a communication medium for water quality monitoring applications that transmit data to a remote database through Short Message Service (SMS) [18]. The use of a cellular network extended from the GSM version is secure and has low latency. However, it is more suitable for IoT applications with high data throughput and overwhelmingly low-type data sensors. In Stockholm, Ericsson collaborated with municipal councils and universities to deploy IoT systems with massive sensors and narrowband NB-IoT to monitor water quality throughout Stockholm City [19]. This system can increase the efficiency of sensors in longer and larger areas while delivering direct feedback for water quality classification. Nevertheless, both networks require expensive reserved channels to exploit implementation costs.

2.2. LoRa Overview

LoRa is a network solution categorized as low-power, wide-area networking (LPWAN) that allows long-range communication between devices designated for low-bit-rate data applications operated on batteries. The development of LoRa aims to exclude repeaters, improve network capacity, and support a large number of devices [20]. The LoRa solution was composed of two layers of LoRa and LoRaWAN that were significant to each other.

2.2.1. LoRa and Radio Modulation

The radio modulator-based CSS modulation technique in the physical layer (PHY) process gain in the radio frequency channel increases the data signal in the total signal spectrum. It maintains the signal data rate while reducing the output power for the transmission. CSS employs the orthogonal spreading factor (SF) method to synchronize transmission within a similar channel frequency. However, this affects the frequency offsets within the transmission and receiver, which are diminished in the decoder. Furthermore, it increases resistance to the Doppler effect. In addition, the SF method optimizes the power levels and data rates of each node to preserve the battery life and improve the efficiency of the receiver to decode signals [21]. The signal can be demodulated to an even lower signal-to-noise ratio (SNR) below the noise floor between -7.5 dB and -20 dB.
The integration of SF with the bandwidth (BW) and coding rate can deduce the expected data rate (DR). The relationship between SF and BW, deducing DR, is given by (1).
D R = S F * B W 2 S F  
The chirp 2 S F used in LoRa doubles the bandwidth correlated to the symbol, and the bit rate increases the transmission rate. The relationship between BW and double SF and the duration of package transmission ( T S ) is given by (2).
T S = 2 S F B W  
The generated diverse data transmission differs from the difference in the spread factor, as the LoRa data transmission can be determined every second. The symbol rate is denoted by R s expressed as in equation (3).
R s = B W 2 S F        
The sync word encoder in the LoRa frame differentiates LoRa networks that use the same frequency band. The LoRa frame, formatted with a short header, consists of information on bytes, Cyclic Redundancy Check (CRC), and Coding Rate (CR), as illustrated in Figure 1.
The influence of bandwidth on decoder sensitivity causes a change in CR that impacts the Packet Error Data (PER) when quick erupted interference occurs [21]. The effective bit rate ( R b ) which is significant for the correlation of CR, BW, and SF in Equation (1), is given by Equation (4).
R b = S F × B W 2 S F × C R = S F R s
The LoRa in the PHY layer manages the radio frequency signals within the transmission line, including the frequencies, modulation waveforms, and power levels. Reflecting the condition of non-line-of-sight (NLOS) and multipath propagation factors in urban environments requires authentication in wireless medium characterization, such as path loss, shadowing, and multipath fading. Furthermore, the signal values obtained by the IoT platform must adapt to the sensitivity of the transceivers.
Equation (5) defines the corresponding losses and gains of the received power, P r x   at the receiver:
P r x = P t x + G t x L t x L r x L f s M + G r x    
Where P t x is the transmission power, and the gains at the transmitter and receiver are denoted as G t x and G r x   respectively. The L t x and L r x   are the expressions of the loss antenna and cable connectors at the transmitter and receiver, respectively, including the loss from environmental influence, L f s . M is the fading margin between the sensitivity of the receiver and the signal strength level.
In free space propagation, attenuation occurs as the power spreads over the areas. The power flux, which is the signal strength, is calculated as shown in (6).
P d = P t x 4 π d 2
The effective area of an isotropic antenna, G e is used in LoRa, as shown in equation (7).
G e = λ 2 4 π
Equation (8) defines received power in free space.
P r x = P d G e
P r x = P t x × λ 2 4 π
Path loss is generally defined as in equation (10):
L f s = P t x P r x
Substitute equation (9) in (10):
L f s = 20 log 10 4 π + 20 log 10 d 20 log 10 λ  
In free space, as λ (in km) = 0.3/f turn equation (11) into equation (12):
L f s = 32.44 + 20 log 10 d + 20 log 10 f
The propagation path loss model of the earth plane entailed attenuation from the earth plane influence in Equation (13).
L p = 40 log 10 d 20 log 10 h t 20 log 10 h r  
Although there is still a non-definite path loss model for LoRa evaluation, the empirical formulation of the Okumura-Hata model, which can derive the propagation loss in an urban environment, is given by (14).
L H = 69.55 + 26.16 log 10 f 13.82 log 10 h T a h R + ( 44.9 6.55 log 10 h T ) log 10 d
where h R   and h T   are the heights of the receiver and transmitter, respectively; f is the operating frequency (MHz); d is the distance between the transmitter and receiver; and a h R   is the correction parameter that is affected by the type of environment. a h R   for a large city environment (refer to (15)).
a h R = 3.2 [ log 10 ( 11.75 h R ) ] 2 4.97
Following the limitation of the Okumura-Hata model, which is applicable to land mobile services with a frequency range of 100-1500 MHz, distances of 1-20 km, and base station height of 30-200 m, Petajajarvi et al. obtained the maximum range for different transmitted powers with a constant variable height from the Okumura-Hata model [22]. Furthermore, the received power obtained was as low as -120 dBm for the two transceivers, resulting in a lower signal translation. The analysis by Oliveira et al. on the LoRa communication ranges impacted from the surroundings resulted in maximum communication ranges of 5.6 km and 2 km in rural and urban environments, respectively [23]. Furthermore, the received power obtained was as low as -120 dBm for the two transceivers resulting in a lower signal translation.

2.2.2. LoRaWAN

LoRaWAN is an open network protocol standardized by the LoRa Alliance located at the MAC layer to secure bi-directional communication that known as ALOHA. The ALOHA protocol allows uplink transmission at low power, followed by two short downlinks that receive the windows. LoRaWAN utilizes a star topology to connect end-devices, gateways, and network servers for information exchange. LoRaWAN applies the ADR method to the network server to initiate the increment of the spread factor, which allows a higher delivery ratio between the end-nodes and gateway when a lower spread factor fails.
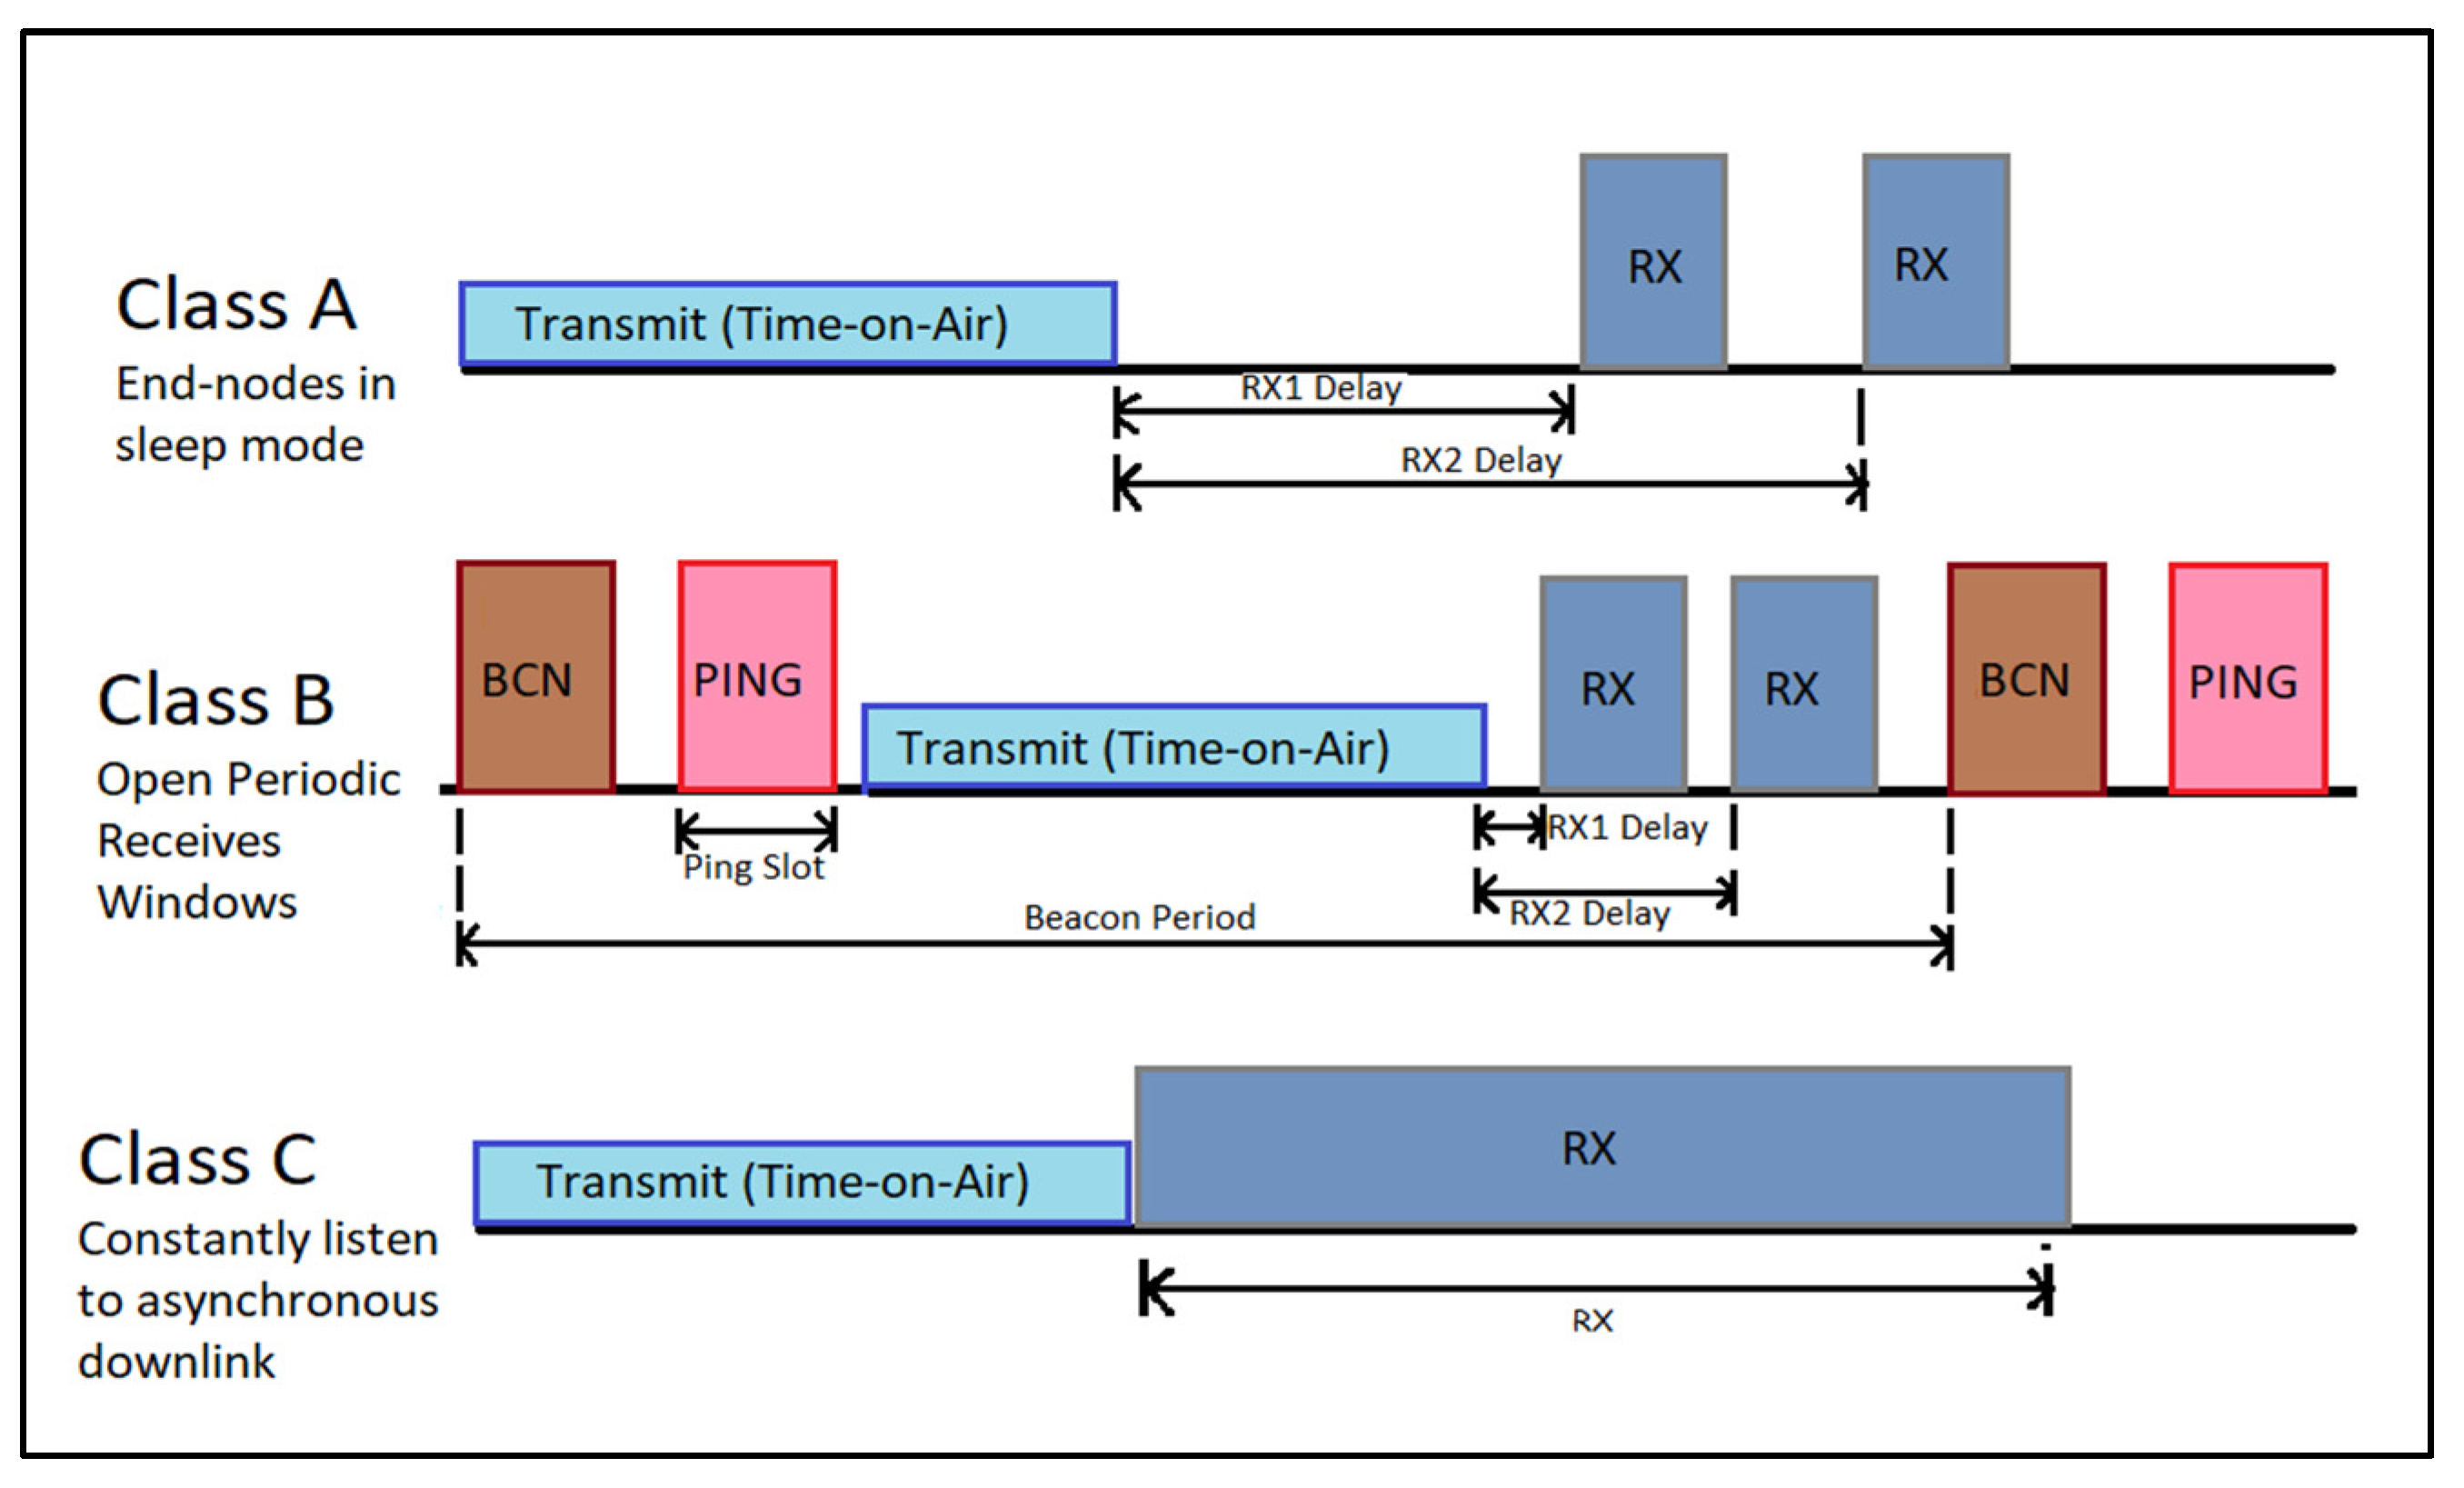
LoRaWAN offers two types of activation for security verification and service quality authorization: over-the-air activation (OTAA) and Activation by Personalization (ABP). LoRaWAN reflects the requirements of the application address, downloading, and energy limitations. It scheduled three classes for downlink communication: Class A, Class B, and Class C. The default Class A is supported by all LoRaWAN end-devices, whereas Classes B and C are optional supports. Class B mode scheduling opens downlinks from periodic beacons and receives the network windows with regulated latency. The Class C mode keeps the receivers of end devices open except during transmission, resulting in fading of latency [24]. A summary of the class mode applied by the LoRaWAN is shown in Figure 2.
Ertürk et al. found that the performance of LoRaWAN on successful packet transfer is affected by high volumes of end-nodes after simulating the Class A mode on the MAC layer using MATLAB [25].
Delobel et al. analyzed the delay of confirmed downlink frames in class and concluded that the gateway was influenced by a sudden data outburst, causing interference in radio transmission [26].

2.2.3. Implementation of LoRa in Application from the Previous Study

Since the LoRaWAN protocol was officially publicized in 2015, it has been studied, analyzed, and implemented in various IoT applications. The performance of LoRa in an urban environment was evaluated using propagation measurement by Parades et al., who were able to predetermine the interference that occurs during transmission [27]. Rizzi et al. used the Okumura-Hata model to calculate the path loss in an urban environment, requiring a reduction in the signal-to-noise ratio with a higher antenna gain to increase the transmission range [28].
A flood warning system based on a Wireless Sensor Network (WSN) developed by Leon et al. used an ultrasonic sensor alerting a user on Twitter with LoRa as a data exchanger and found no loss of packet data, but it had a 1 cm margin error of the water level [30]. Codeluppi et al. built an ad-hoc-level module with a LoRaWAN architecture, and transmitted sensor data to provide advanced information to farmers [31]. The results differed based on its location in the greenhouse and vineyard, and there were also few samples owing to the lack of solar radiation during rainy days.
Abbasi et al. utilized LoRa in smart grid applications and found that LoRa is sensitive to an increase in the number of nodes, thereby increasing the energy consumption [32]. Furthermore, the employment of a directional antenna approximately fixed the Data Extraction Rate (DER). Prakosa et al. monitored the soil state based on IoT with LoRa for smart agriculture applications in rural areas and concluded that the large coverage influenced by high SF increased delays in data transfer [33]. The recent epidemic of the SARS-Cov 2 virus initiated Lousado and Antunes to monitor the health of elderly people using LoRa perceived that high repetition was influenced by constant connection and LoRa capability was limited owing to its low coverage in that region [34].
Different applications and scenarios result in differences in the LoRa performance. The LoRa network can be modified and enhanced for effective utilization based on its application.

2. Methodology

The procedure of this study was upgraded from that of a previous paper [35]. The development process of this system involves selecting water sensor types to be operated with end-nodes based on the WQI element and its capability to operate independently in a river environment. The end-nodes were integrated into the gateway, and the water quality data transmitted to the LoRa server were verified. The LoRa network performance with different network properties of SF and antenna gains was also evaluated before refining the final network property design to be implemented in a water quality monitoring system. In this study, the gateway server was encoded to connect to ThingSpeak. Water quality monitoring stations designated for outdoor purposes and monitoring dashboards for user interfaces were built for display and information delivery. The process of this study is summarized in Figure 3.

3.1. Water Quality Monitoring System Built

The type of water quality sensor was selected based on water characteristics regulated by the WHO. The robustness and reliability of the water quality sensors embedded in the water quality monitoring station are based on the specifications and datasheets supplied. The water quality sensors that were used are listed in Table 1.
The water sensors were connected to a microcontroller board (TTGO ESP32-LoRa32) at an operating frequency of 868/915 MHz, which is suitable for the Malaysian region. The end-nodes deployed the Frequency Shift Keying (FSK) modulation mode, equipped with a data rate of 1.2 kbps to 300 kbps. The antenna installed at the water station was of the whip 915 MHz omnidirectional type. Table 2 and Table 3 describe the LoRa end-node parameter setup with different SF for the antenna gain of 2.1 dBi and 3 dBi.
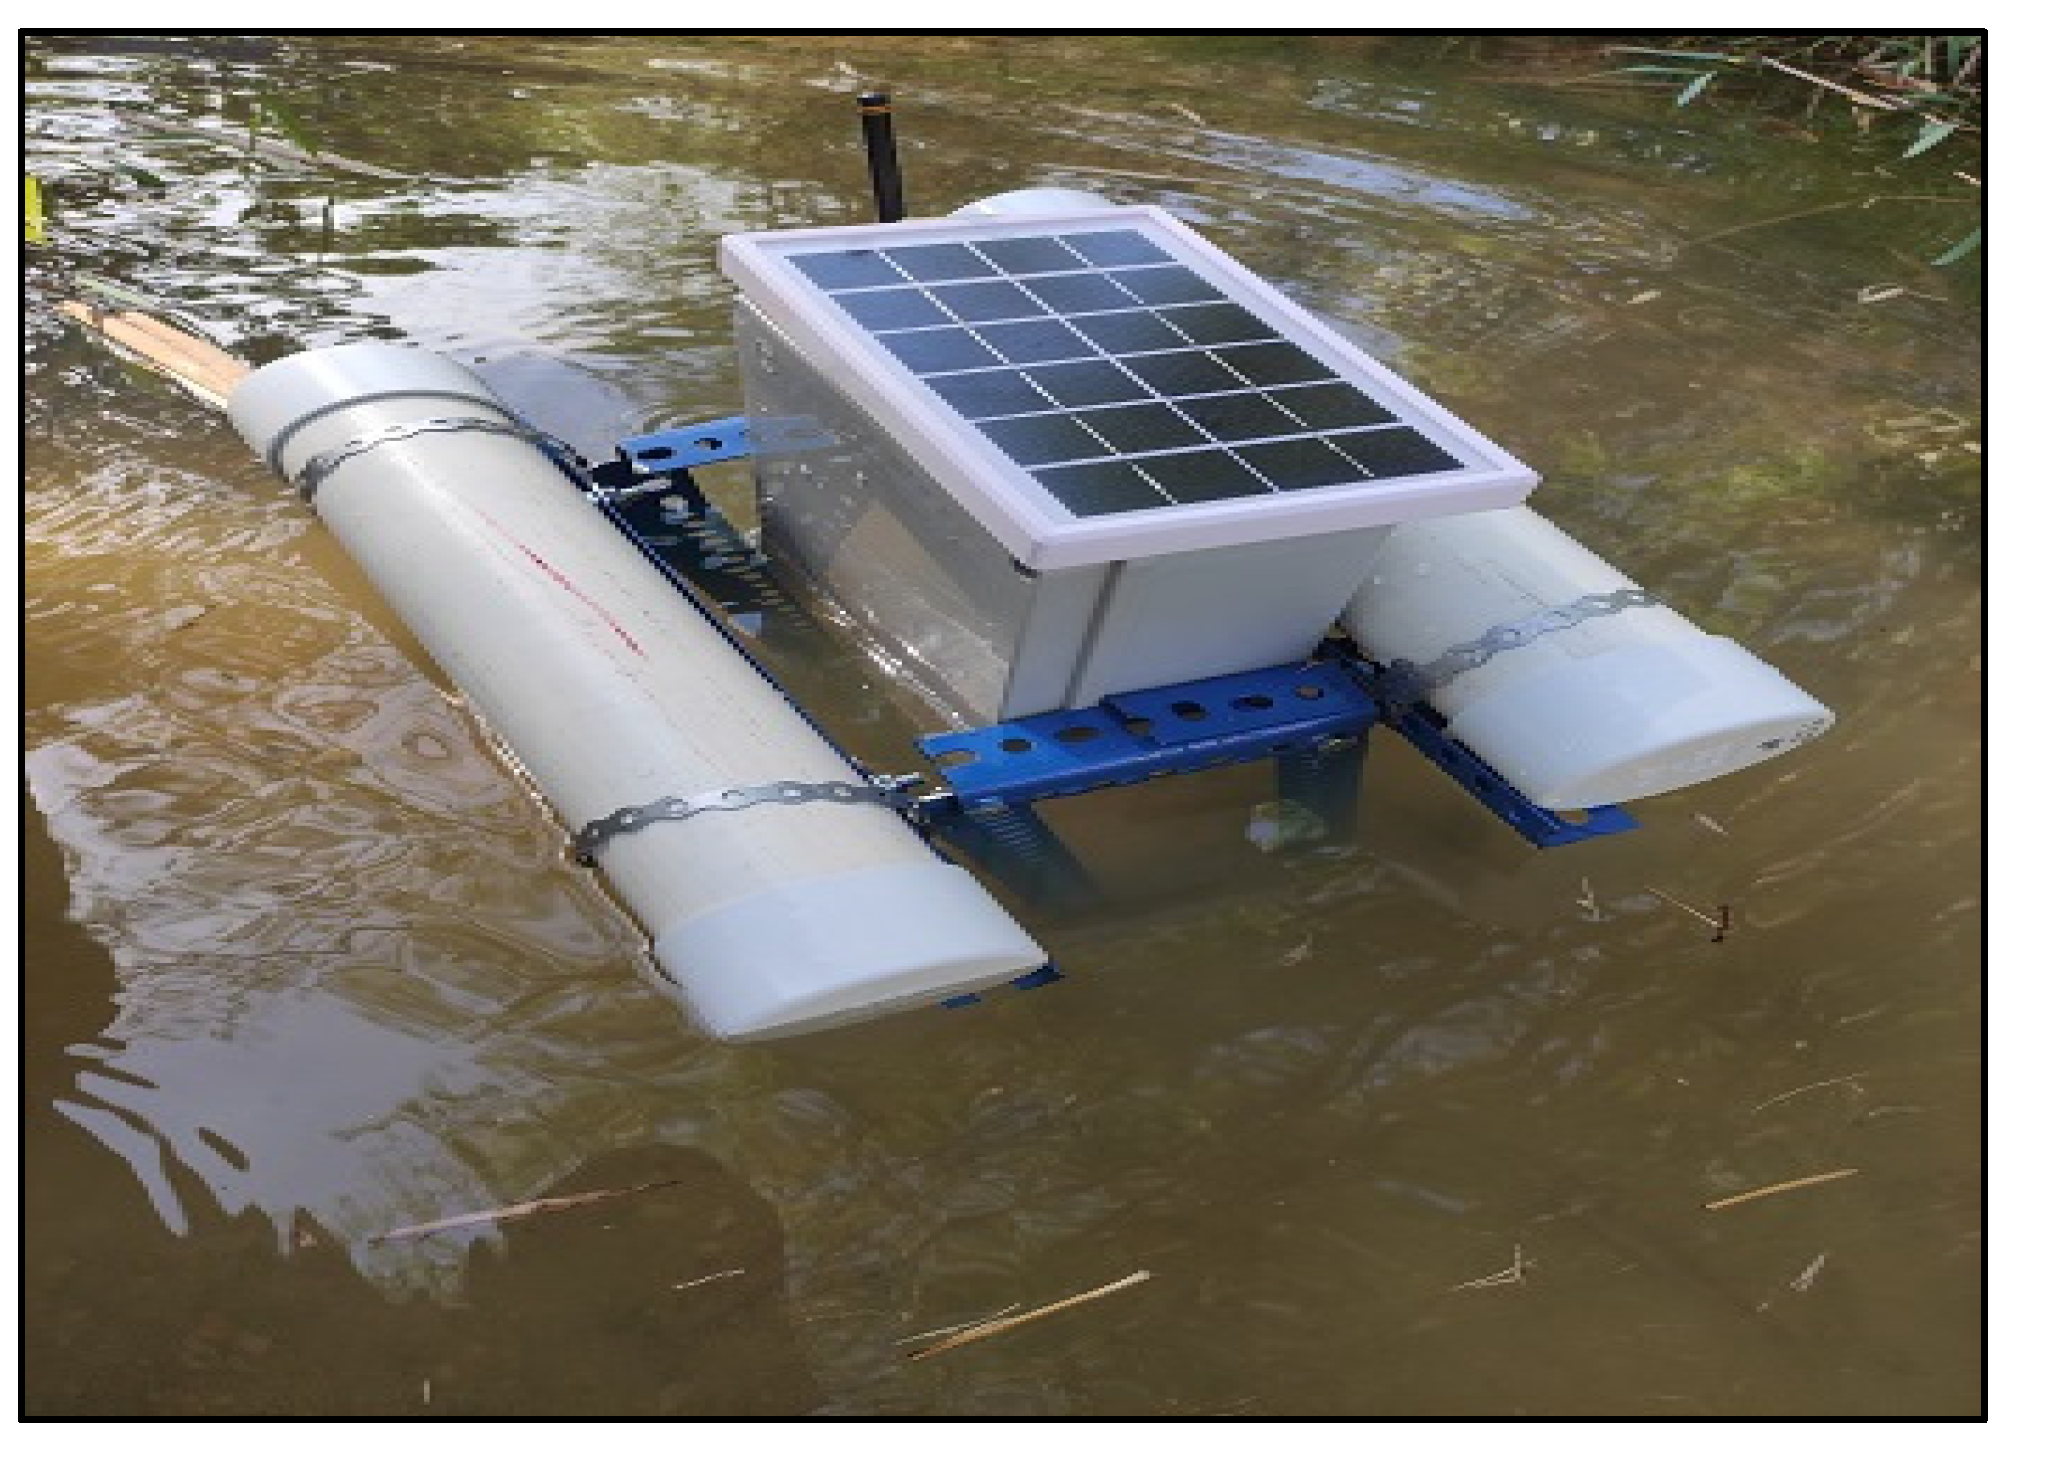
The prototype water quality monitoring station was powered by a polycrystalline solar panel of 6 W/6 V, as shown in Figure 4
Water stations P1, P2, and P3 were located at three different locations in both rivers at the Universiti Malaya, Sungai Anak Air Batu and Sungai Pantai, at distances of 117 m, 1560 m, and 566 m, respectively, from the gateway, as shown in Figure 5.

3.2. LoRa Gateway Configuration

The Raspberry Pi HAT was assembled using an LPWAN concentrator module deployed as the LoRa gateway. The gateway module includes a GPS module and a Heat Sink. The package is based on the Semtech transceiver concentrator, and the S1257/58 front-end chirps allow the management of packets from the scattered endpoints.
The gateway operated with the support of the global license-free frequency AS920-923, which corresponds to the location of Malaysia within the Asian region. The antenna gain used for the gateway was 5.8 dBi for a larger spread and better perception in an urban environment.
The gateway was integrated with Balena.io and connected to Thing Stack V3.16.2, using the latest Semtech Packet Forward protocol. The water quality data and performance of LoRa on the Received Signal Strength Indicator (RSSI), signal-to-noise ratio (SNR), downlink, uplink, and packet data can be directly monitored from the server, The Thing Stack.
The system does not require a full-time alert for the end nodes and allows them to fall into the sleep mode. Its purpose is to minimize the power consumption of the end nodes and prolong battery life.
The gateway was positioned on the rooftop of Block C Faculty of Engineering at an estimated height of 25 m from the ground, as shown in Figure 6.

3.3. Water Quality Monitoring Dashboard

The Thing Stack server was programmed to interconnect with the IoT analytic platform, ThingSpeak. ThingSpeak was trained as a cloud to observe, record, and store daily water quality monitoring activities. The recorded water quality data were extracted from the cloud and analyzed for water quality status classification.
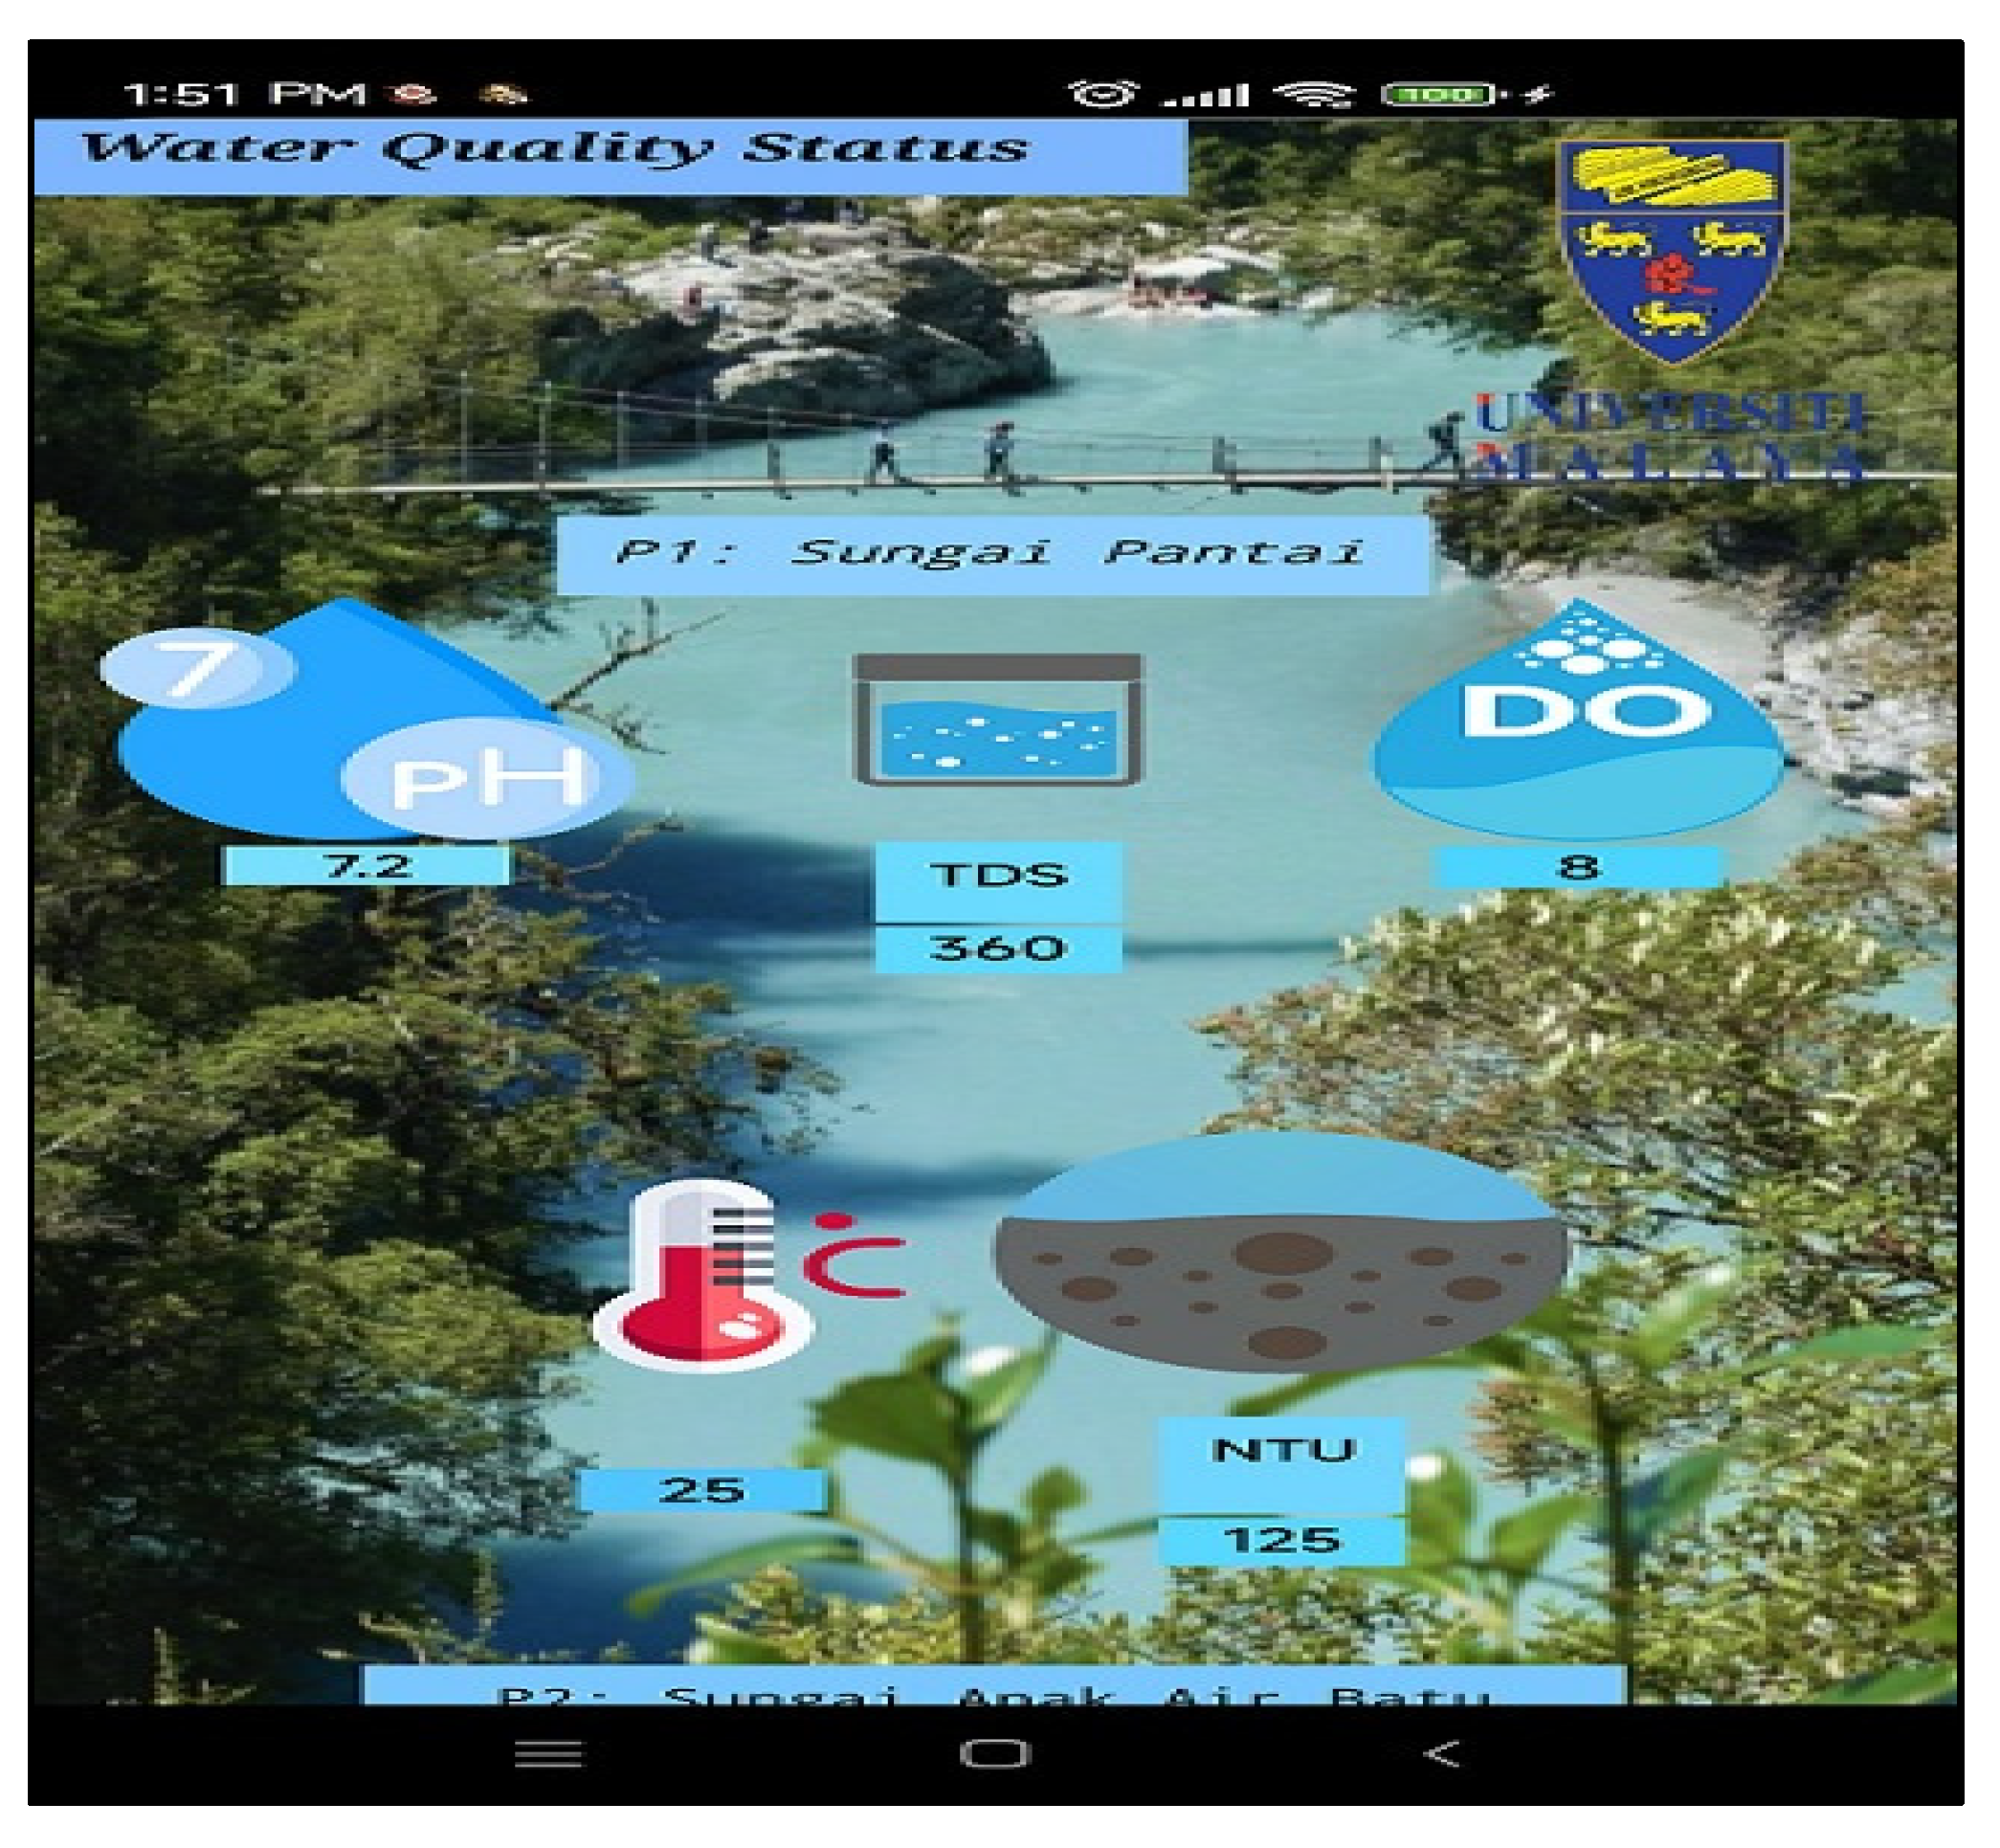
An Android APK application was developed using MIT Inventor Developer integrated with ThingSpeak as the GUI. Users can acquire and monitor the water quality status of Sungai Anak Air Batu and Sungai Pantai daily. The display includes pH, Total Dissolved Solids (TDS), Dissolved Oxygen (DO), temperature, and NTU values from the water stations at Sungai Pantai and Sungai Anak Air Batu. The GUI of the Android version of the water quality monitoring dashboard is shown in Figure 7.

3.4. Evaluation of LoRa Performance

Several network performance indicators were evaluated to verify the implementation of LoRa in a continuous water quality monitoring design. This section discusses the network performance that was evaluated in this study.
First, the commonly inspected network characteristic RSSI estimates the strength of the radio signal received during transmission to determine the capability of the device to listen to a signal. The value of the RSSI is affected by the location, Line of Sight (LOS) variable, n, and distance between the node and receiver, d, as shown in equation (16). In addition, the background noise energy influences signal strength, causing communication errors. The Expected Signal Power (ESP), referring to equation (17), eliminates the impact of the noise effect on the RSSI in equation (16) and acts as an indicator to measure the exact received power.
R S S I = 10 n log 10 d + A  
E S P = R S S I + S N R 10 log 10 1 + 10 0.1 S N R
The SNR in (17) differentiates the received signals within the spectrum from unfeasible background signals. The SNR is simplified in (18).
S N R = P S n P n  
S N R   d B = 10 log 10 P R X P n
Where P S n   is the signal power, and P S n   is the noise power. A higher signal power can demodulate the noise signal, thereby eliminating the potentially corrupted signals. The corrupted signals below the noise floor initiate retransmission, which requires airtime in wireless networks and hence degrades throughput and latency. Nevertheless, the LoRa technology can demodulate the minimum signal below the noise floor based on its spreading factor.
Next, the observed network characteristic, packet loss, is usually affected by errors in the lack of signal strength at the receiver, severe system noise, overload of network nodes, network congestion, hardware issues, and distances. Degrading communication from packet loss reduces throughput, security communication, and inadequate data transmission, thereby causing loss in data encryption.
In this study, LoRa is a wireless network that applies at UDP protocol. Although it tolerates packet loss, the sender cannot detect whether packets have been received. The server, The Thing Stack, applies the Semtech UDP Packet Forwarder. The monitoring of packet loss was observed and recorded through the gateway log. Packet loss can be defined by Equation (20).
P L   % = P s t P r c P s t × 100
Where PL is the packet loss defined over time with P s t , sent packet and P r c , the received packet.
In this study, the conclusion from the K-means clustering result of water quality properties will be integrated with packet loss to assist in detecting patterns in network traffic data. This pattern allows the deduction of various possible factors during transmission, such as hardware failure, network congestion, and signal interference.
One of the influential factors for all network performance is path loss because it determines the energy loss within the transmitter and receiver. The general path loss is given by Equation (21).
L p =   P t + G r + G t + P r  
Where   L p , the path loss, which is a combination of P t , G r , G t , and P r , which are the antenna transmission power, receiver power gain, transmitter power gain, and RSSI, respectively. The path loss with wavelength or frequency is denoted by (22).
L f s = 4 π d λ 2
L f s = 10 log λ 2 4 π 2 d 2
The carrier frequency in this study, 915 MHz, changes the value of λ as in equations (24) and (25).
λ = v f
λ = 3 × 10 8 915 × 10 6 = 0.3279 m
In a free-space damping propagation application, the usual logarithm extended from (23) and (12) amalgamates with the energy spread and antenna fault, as given by equation (26).
L f s = 20 log 10 d + 91.67 G t x G r x  
where G t x and G r x   are the transmitter antenna gains, and the antenna receiver gain includes feeder losses. The increment in distance increased the loss in free space by 6 dB. Reflection, refraction, and penetration of radio waves affected by the attenuation structure are also significant for the impact of energy losses on the budget link. Referrings to equation (14) in the previous section, the Okumura-Hata module is used for propagation loss in an urban environment.
The last network performance analyzed is the received power because its quantification links the performance from the link budget. Temporary attenuation during transmission requires the fade margin to specify its power level performance. The minimum power level is determined using the link budget related to the received sensitivity. The determination of the received sensitivity corresponds to the minimum power received by the receiver node to decode the transmitted bit promptly. The receiver sensitivity, R x   applied Equation (27) tolerance to thermal noise.
R x s = 174 + 10 log 10 B W + N F + S N R
Where BW is the bandwidth and NF is the noise factor, referring to equation (27). The received power declines as it passes through the channel over a distance and in the environment. The received sensitivity in LoRa can be below -130 dBm to allow interpretation of the lower signal. The received power accumulates all losses and gains, as mentioned in Section 2, referring to equation (5). Furthermore, setting the value of SF also affects the sensitivity, as it is used to set the data transfer against the range. The setup bandwidth of the receiver operated at 922 MHz and the noise level generated in this study also affected the receiver power level.

4. Result and Discussion

The monitored water quality data were collected and analyzed to validate the compatibility of LoRa as a linkage for autonomous water quality monitoring systems. This segment also observed and analyzed the trend of the LoRa performance based on the network characteristics selected in the previous section.

4.1. Water Quality Data

Users can access the water quality status from the application dashboard, as shown in Fig. 6 in the previous section. The trend of water quality data for each water quality property for the station, as mentioned in the previous section, can be previewed on the Thing Speak monitor dashboard, as shown in Figure 8.
For further analysis, water quality data were extracted from Thing Speak, which acts as a cloud for data storage. Water quality data were analyzed based on WQI and NWQS by Malaysia for pH, Dissolved Oxygen (DO), turbidity, temperature, and Total Dissolved Oxygen (TDS). Table 4 shows the results of the K-means pre-processing of raw water quality data for 1 month’s observation. Moreover, K-means allows for the detection of abnormalities in unsupervised water quality data during data collection. The observation relating the K-means results of water quality data and network performance is further discussed in Section 4.2.2.
Based on the tabulated data in Table 4, the status of water quality at each station can be classified based on the NWQS standard guide. The pH values for all water stations had similar ranges, with near-neutral pH values of 7. Referring to the WQI and NWQS, the pH of all stations qualified to be included in Class Ⅰ because its range remained within 6.5–8.5. For turbidity, which measures the salinity of water, the value obtained from station P1 was slightly different from P2 and P3, with an estimated difference of 30 NTU. However, the water status from all stations classified was included in Class Ⅲ because the turbidity standard tabulated at 0 NTU-50 NTU is above Class ⅡB.
The standard river water temperature in Malaysia ranges from 22.0°C to 31.7°C, depending on the seasonal effect. The tabulated data in Table IV show that the temperature of river water from all locations falls within the standard range; hence, the class of water temperature based on the WQI and NWQS remains Class Ⅰ. However, the water temperature at station 2 was 2°C higher than that at the other stations. Therefore, according to NWQS Malaysia, an additional 2°C from the current average temperature at that time classifies the water as class Ⅱ.
Although the total dissolved solids contained the water from all water stations fluctuated marginally from each other, their quality remained within Class Ⅰ because the range still fell below 500 mg/l. The last water quality property monitored in this study, dissolved oxygen, was constant at all locations, with a total volume of 8 mg/l. Based on the WQI and NWQS guidelines, the total volume of dissolved oxygen in the river water in this study is suitable for aquatic organisms and is labeled as Class Ⅰ.
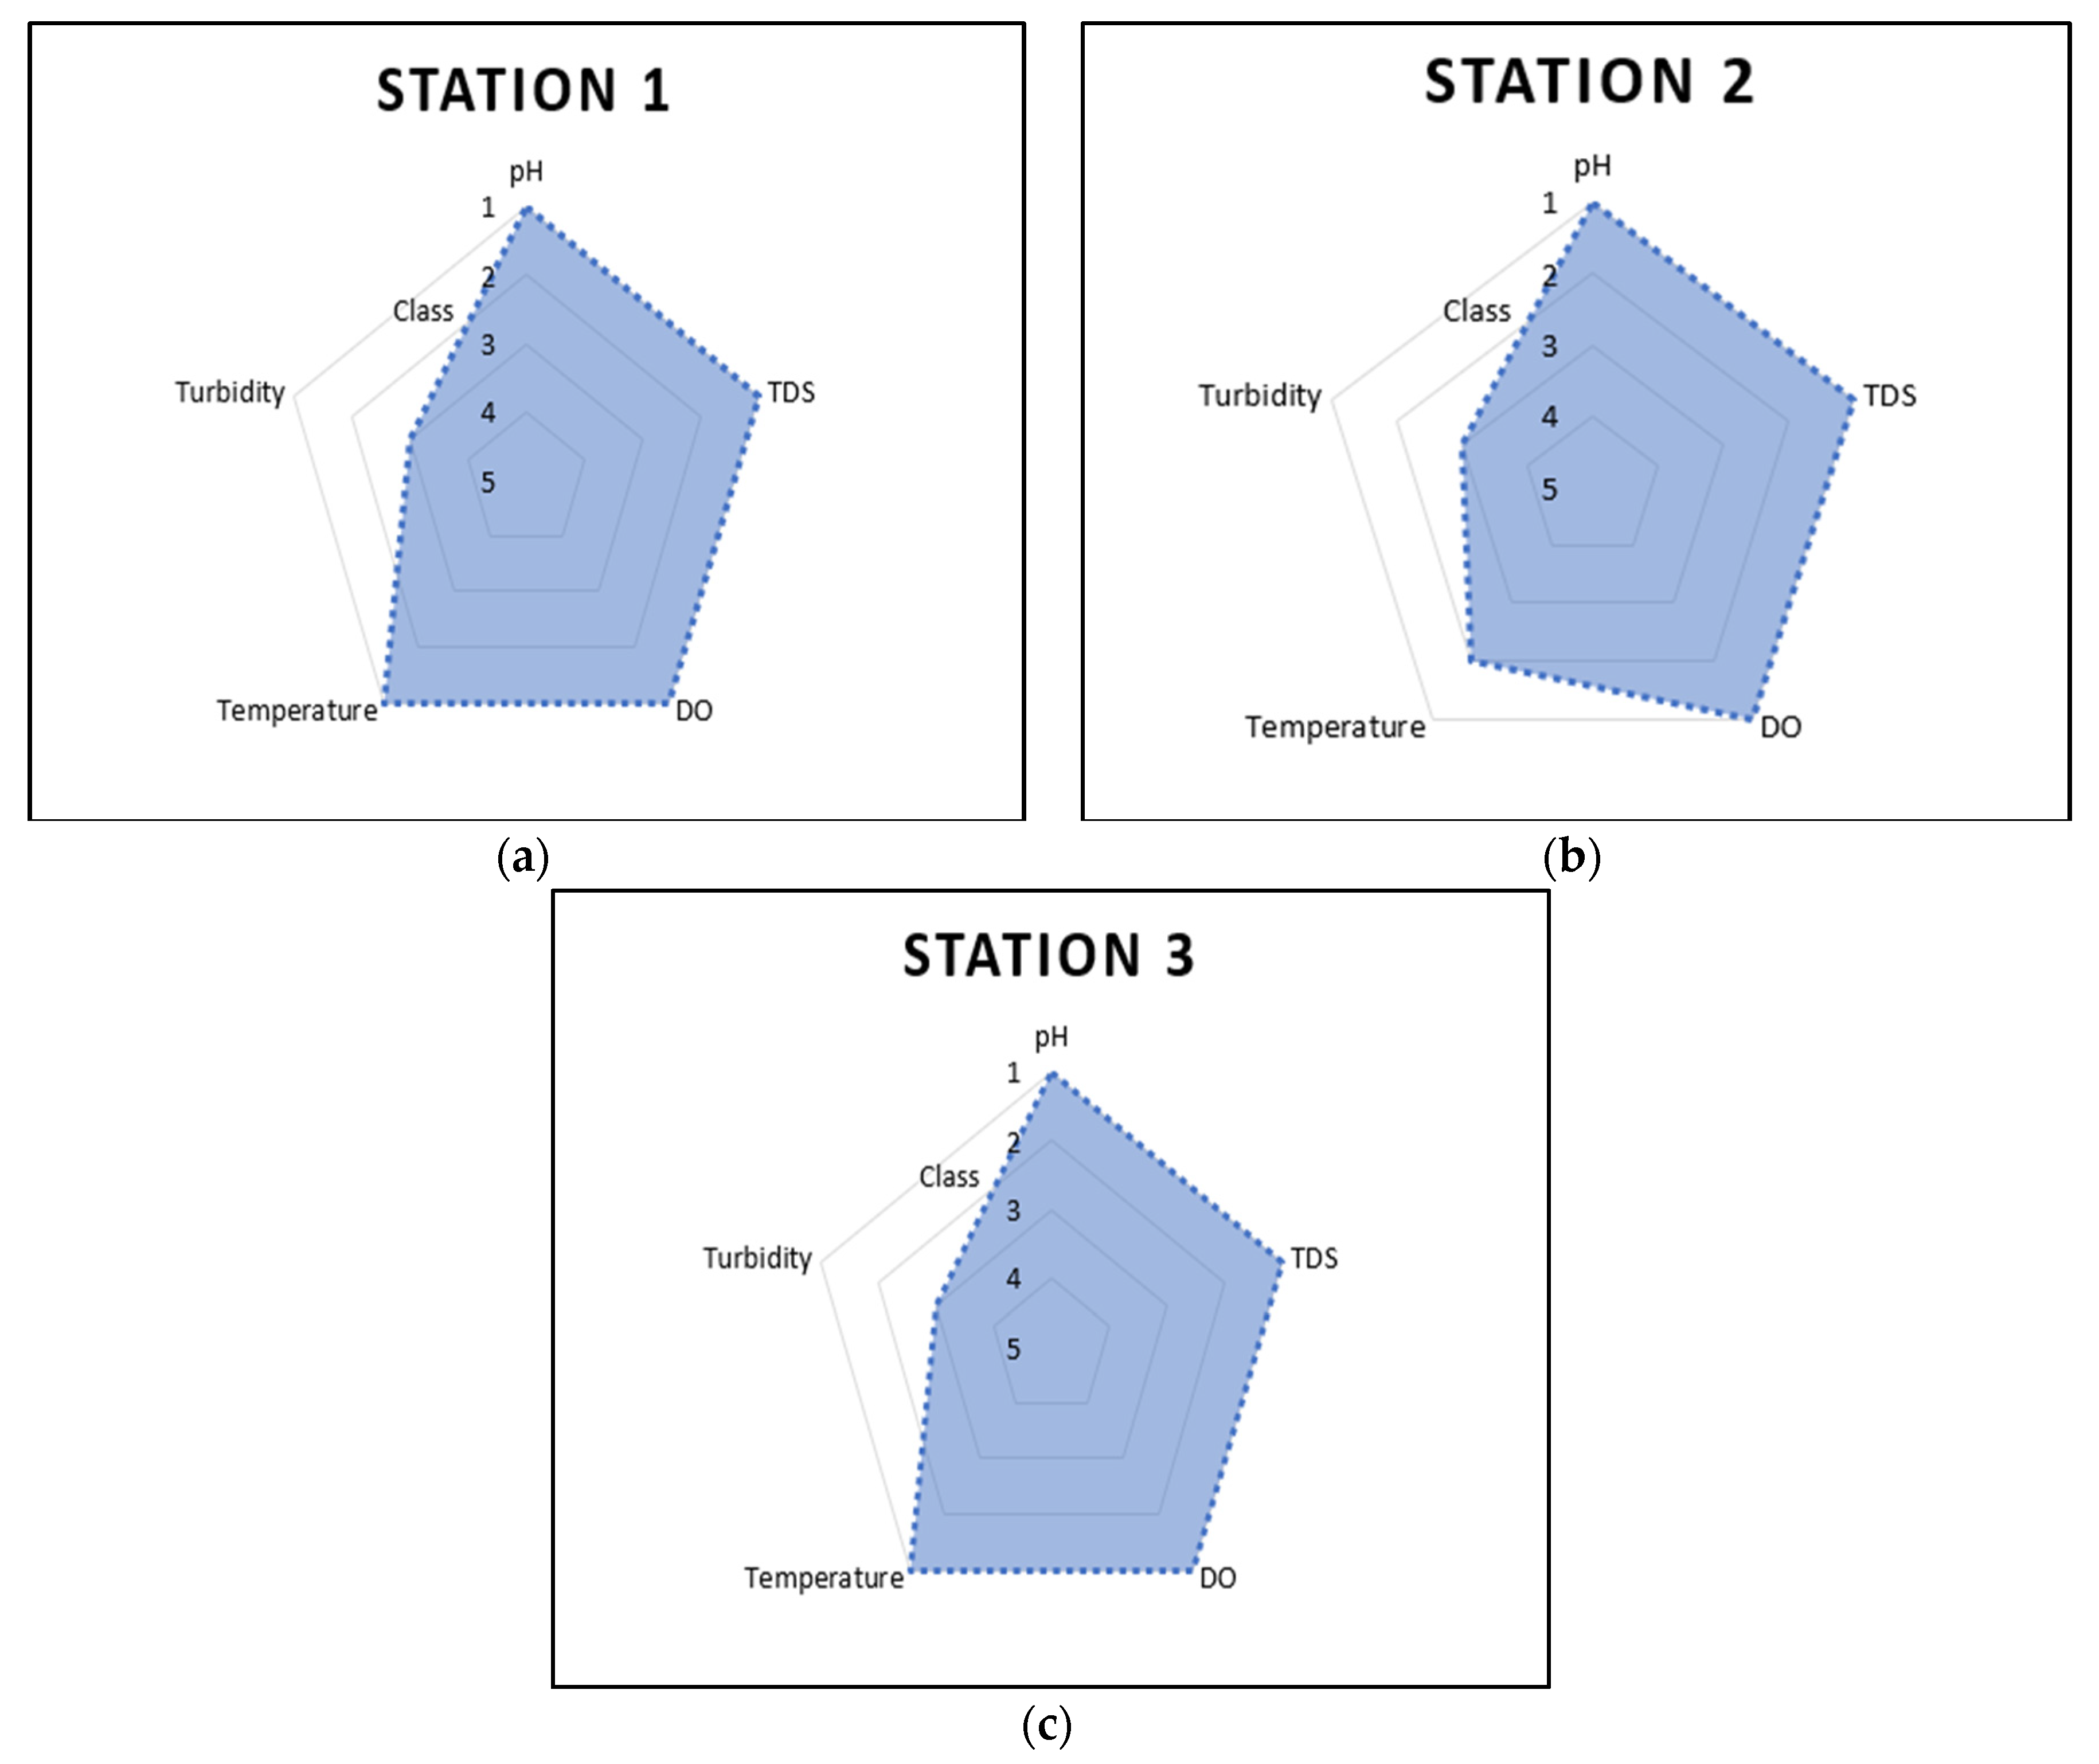
The conclusions from the analyzed water quality properties can be used to classify water into water quality classes based on the WQI and NWQS benchmarks. The class of river at each water station at Sungai Anak Air Batu and Sungai Pantai, Universiti Malaya , was summarized in a pentagonal shape as five parameters of water quality were monitored in this study, as shown in Figure 9. The shape and blue color of the pentagon effectively visualizes the summarization of real-time monitoring of water quality to support the study of sampling site data [7].
Based on the summary pentagonal shape shown in Figure 9, the water bodies at all locations exhibited a similar trend. The full pentagonal shape classifies the water body as Class Ⅰ, but the trend of water in the figures above for all stations had an imperfect shape, as it was affected by the water quality class of turbidity. Water bodies at station 2 were affected by the temperature and turbidity class. In conclusion, the water bodies at Sungai Pantai and Sungai Anak Air Batu at Universiti Malaya are classified as class ⅡB, which are suitable for recreational purposes but are undrinkable. Furthermore, conventional treatments are required for the water supply.
The absolute conclusion based on the WQI calculation of its water quality properties subindex (SI), as shown in (25), cannot be defined as the presence of water quality elements such as Ammoniacal Nitrogen (AN), Biochemical Oxygen Demand (BOD), and Chemical Oxygen Demand (COD), which cannot be obtained with real-time methods and require laboratory analysis.
While 0 ≤ WQI ≤ 100,
W Q I = 0.22 * S I D O + 0.19 * S I B O D + 0.16 * S I C O D + 0.15 * S I A N + 0.16 * S I S S + 0.12 * S i p H
Where SIDO is the subindex of dissolved oxygen, SIBOD is the subindex of biochemical oxygen demand, SICOD is the subindex of chemical oxygen demand, and SIAN and SIpH are the subindices of ammoniacal nitrogen and pH, respectively.
The result of river classification in Universiti Malaya from the early prediction in this study is significant compared to a previous study by Gafri et al., who concluded that the study area contained a moderate level of pollution due to urban activities [7].
Nonetheless, early prediction from real-time systems allows water environmentalists to periodically monitor the health of water bodies as an early step toward conserving clean river water.

4.2. LoRa Network Performance

The importance of monitoring LoRa network performance during water quality data transmission corresponds to the efficiency of LoRa as a communication bridge for water quality monitoring in real-time. The analysis of the network performance for the radio coverage of LoRa is discussed in this section based on the setup of different transmitter antennas, as discussed in the previous section.

4.2.1. RSSI and SNR

The recorded RSSI and SNR from The Thing Stack were measured through standard deviation to observe its spread variance, which was affected by differences in the antenna gain, spread factor (SF), distances, and NLOS. Table 5 list the maximum minimum and mean RSSI for each LoRa node at all water stations.
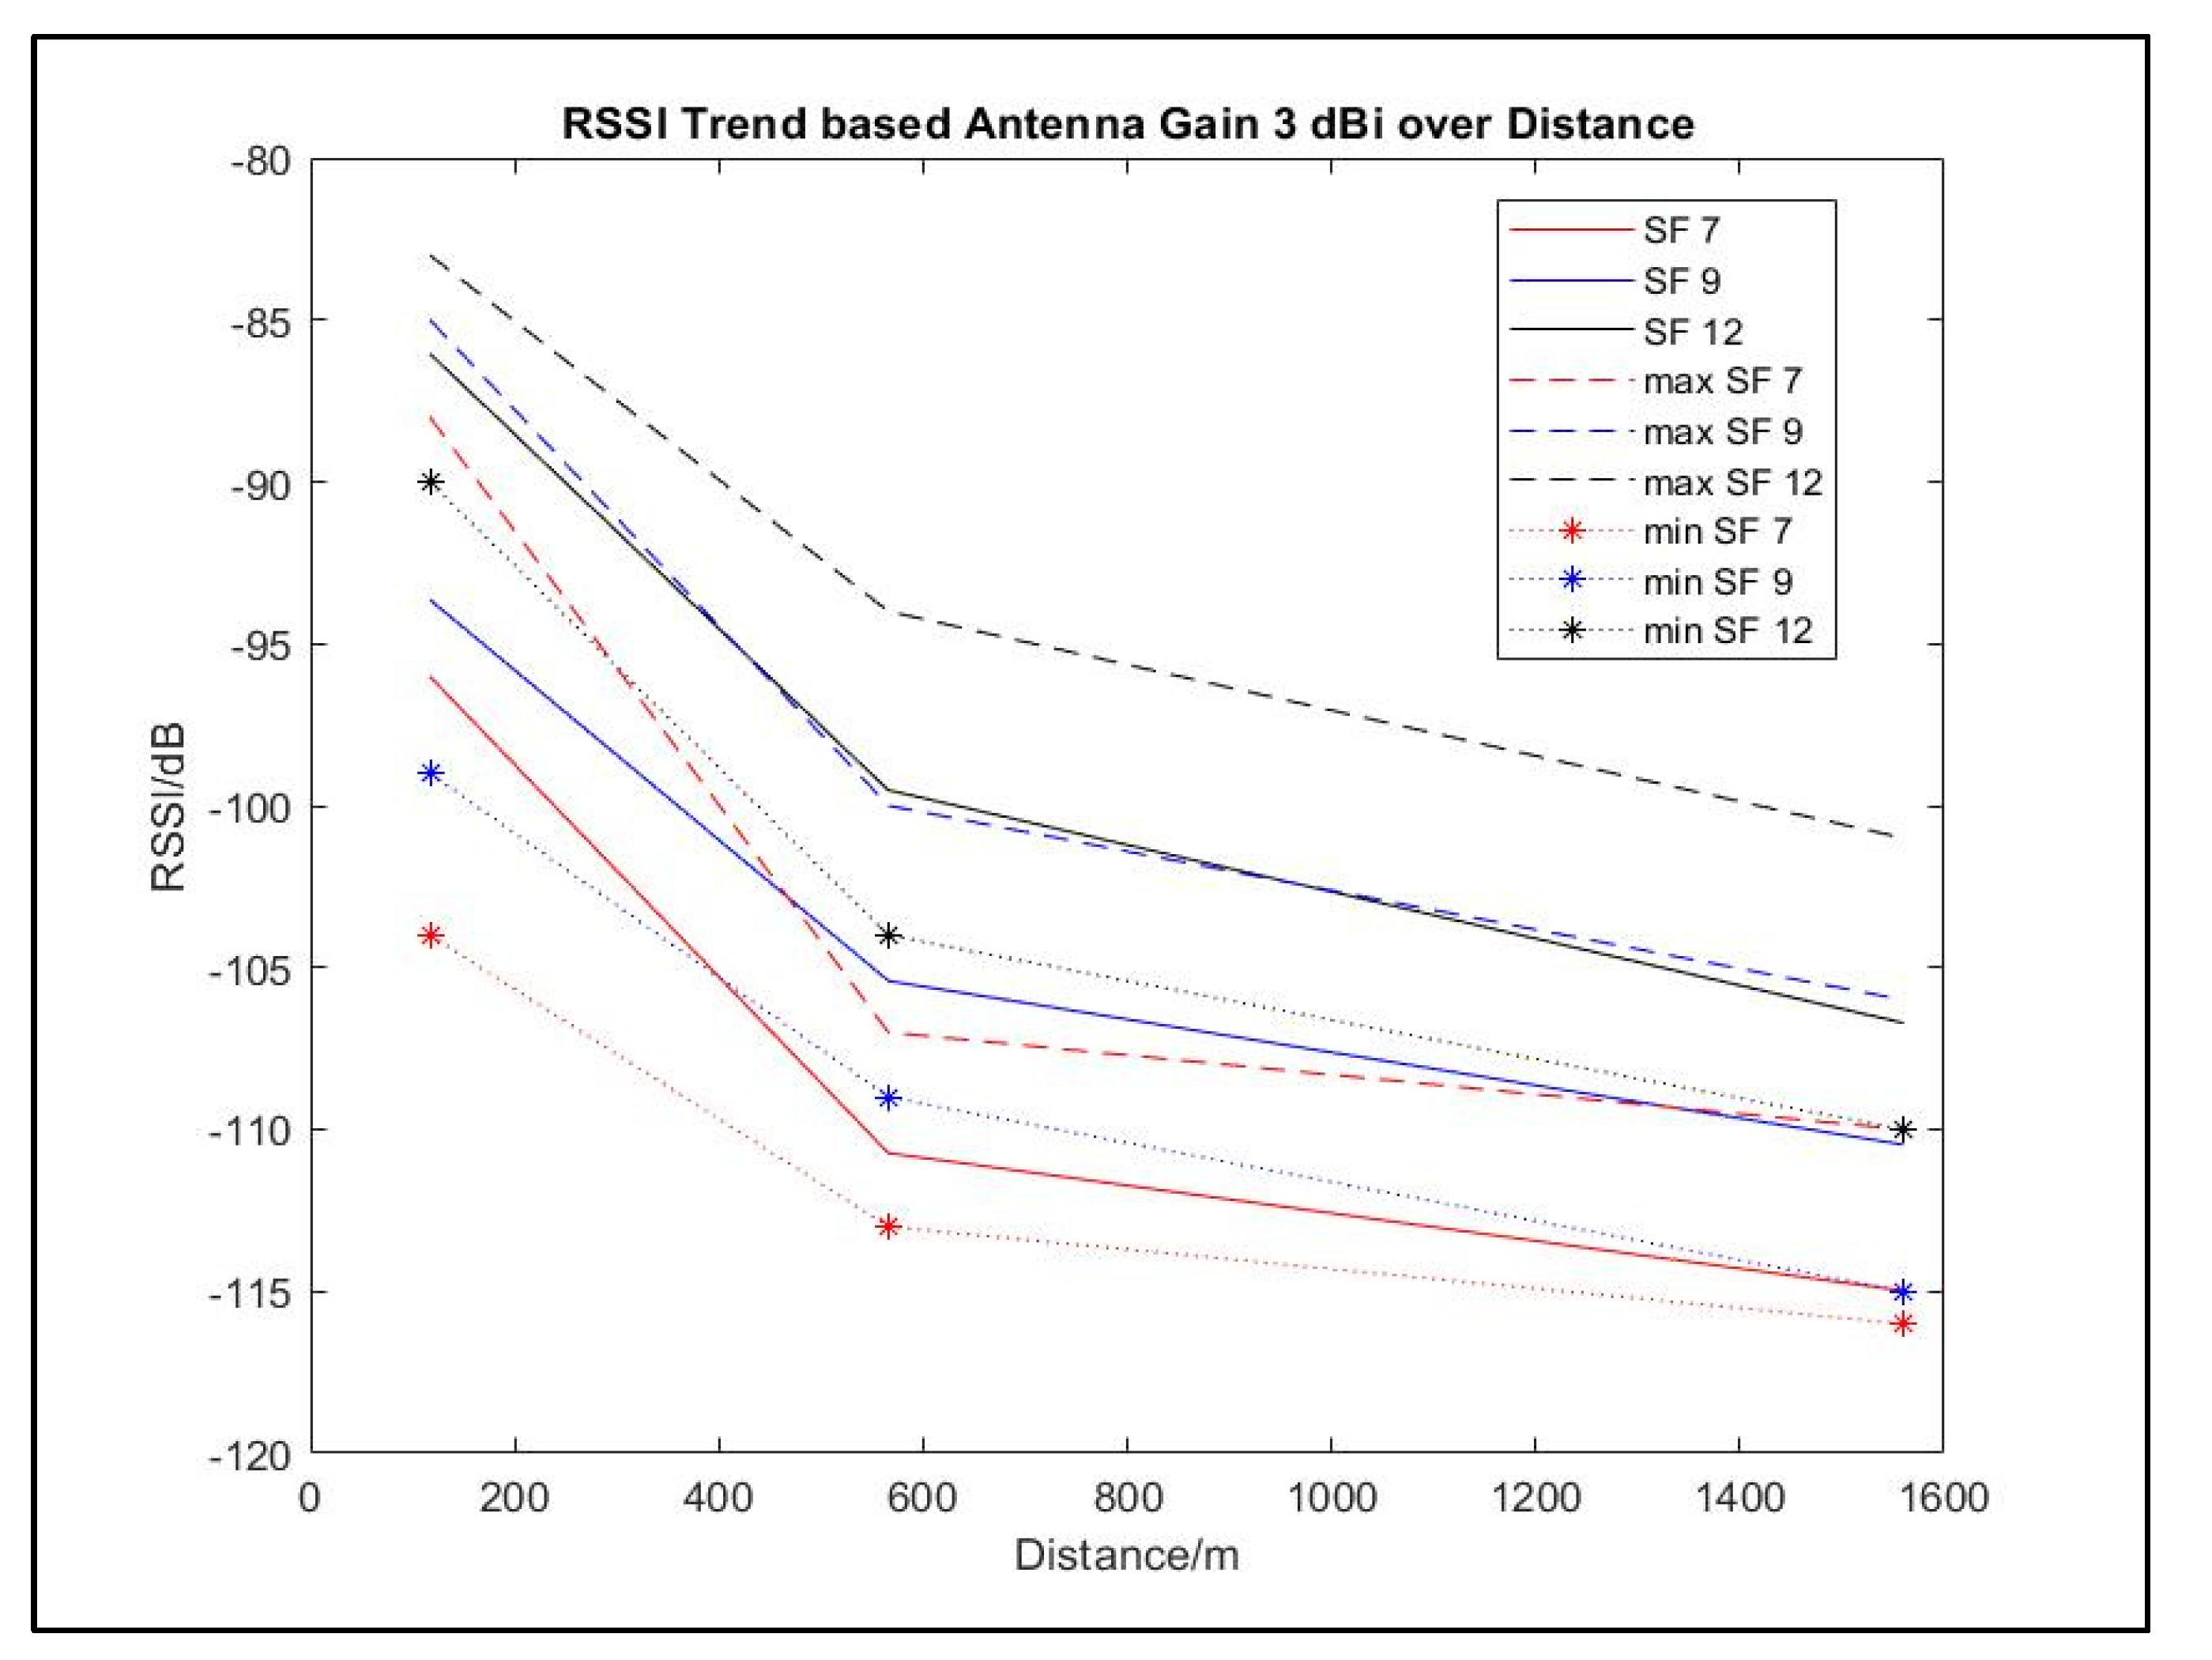
The measurement of RSSI determines the quality of the received signal. The minimum acceptable range value of the RSSI for LoRa was -120 dBm, and a low RSSI indicated that the signal was weak. Table 5 shows that the lowest RSSI recorded was -118 dBm at the second node, P2, which was located farthest from the receiver for SF of 7 and 9. The lowest recorded RSSI was still above the minimum KPI for the RSSI of LoRa and wireless networks. The differences in the antenna gains and spread factors influenced the trend of the RSSI for each distance. Figure 10 and Figure 11 show the mean, maximum, and minimum trends of RSSI based on each antenna gain.
As shown in Figure 10 and Figure 11, the trends of the minimum and maximum values from the mean RSSI value are spread over certain distances. The increment of antenna gains by 0.9 dBi from 2.1 dBi based on Fig. 11, affects the increment of the maximum and minimum RSSI for all SF from all locations.
The use of a 3 dBi antenna increases the minimum value from the farthest location of node P2 at 1560 m from the receiver with the lowest SF of 7. The minimum and maximum values obtained were -116 dBm, and -110 dBm respectively. The RSSI of the nearest end-node at 117 m from the receiver also shows its best performance antenna gain of 3 dBi, as it reached above -90 dBm even when implied with SF 7.
Furthermore, the spread value of the RSSI was affected by distance, urban environmental influences, weather, interruption of other radio frequencies, and other variables. It can be concluded that the RSSI value of LoRa decreases as the distance increases with the effect of NLOS [37]. In addition, the higher gain of the antenna strengthens the received signal while reducing interference during transmission.
Although the SNR of LoRa can operate below the noise floor, the higher the SNR during data transmission, the higher is the quality of the signal transferred. The SNR collected simultaneously with the RSSI shown in Table 6 falls below the noise floor for all the minimum, maximum, and mean values from all locations for each implied spread factor.
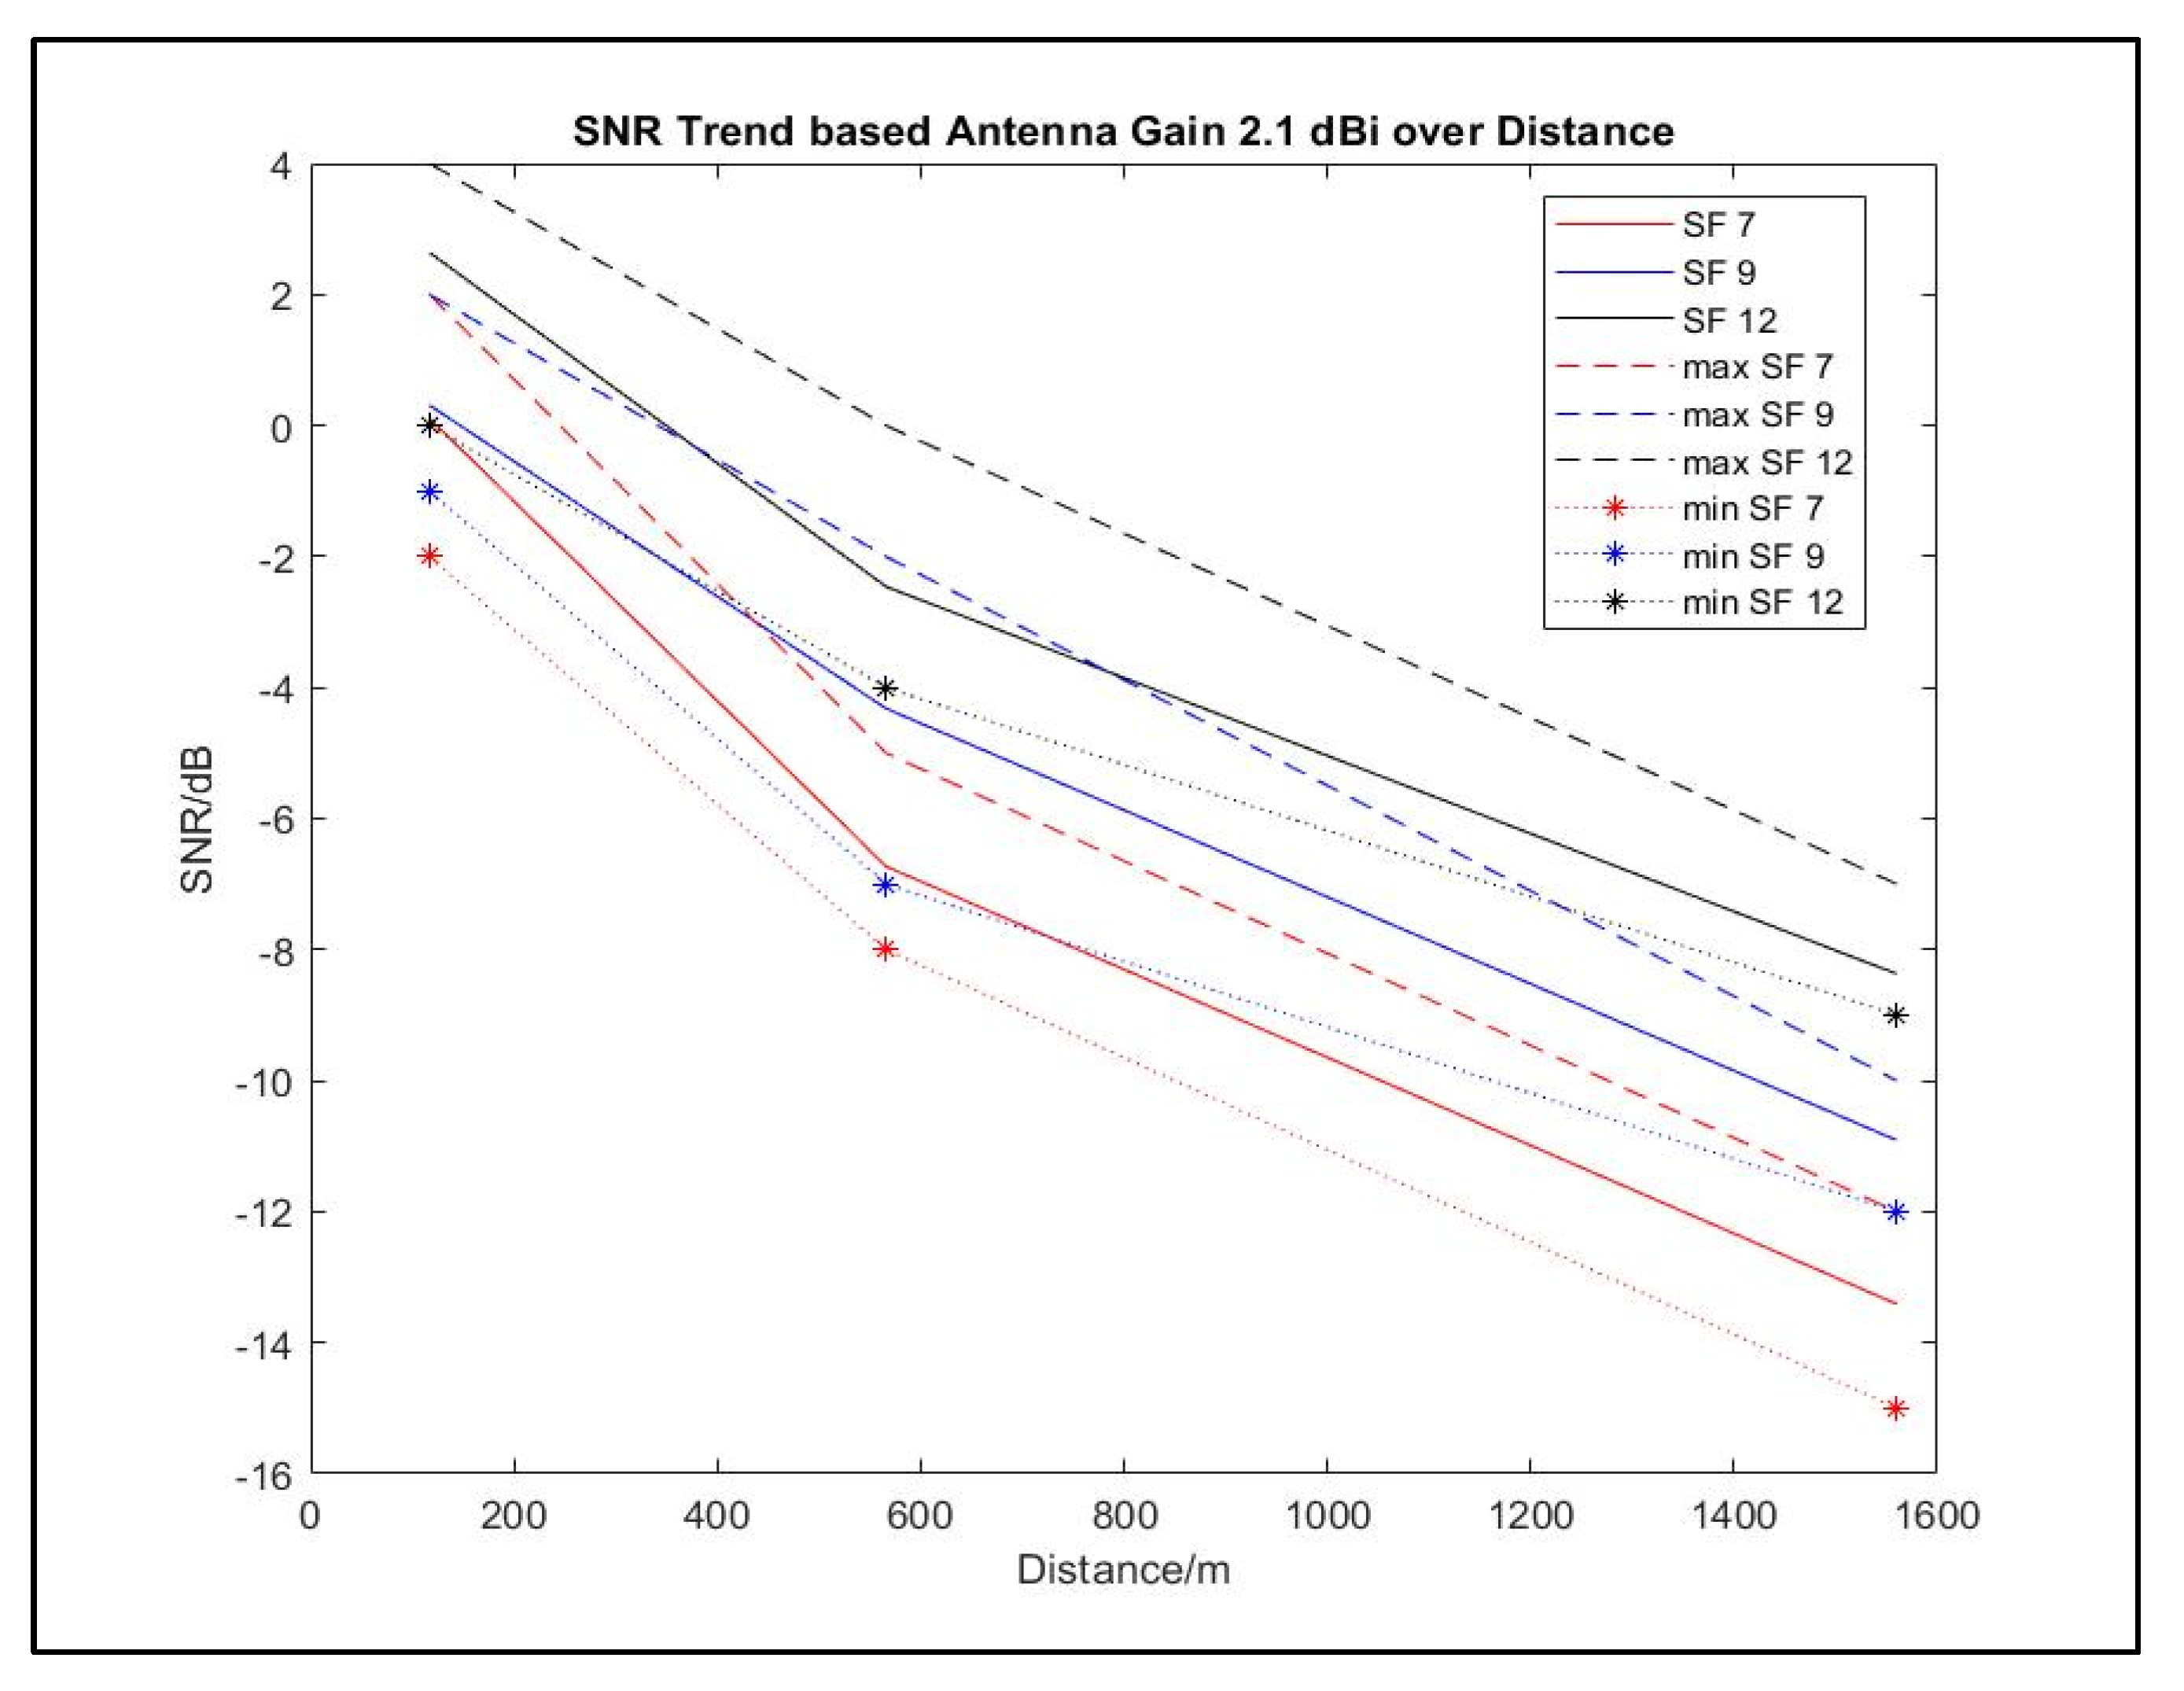
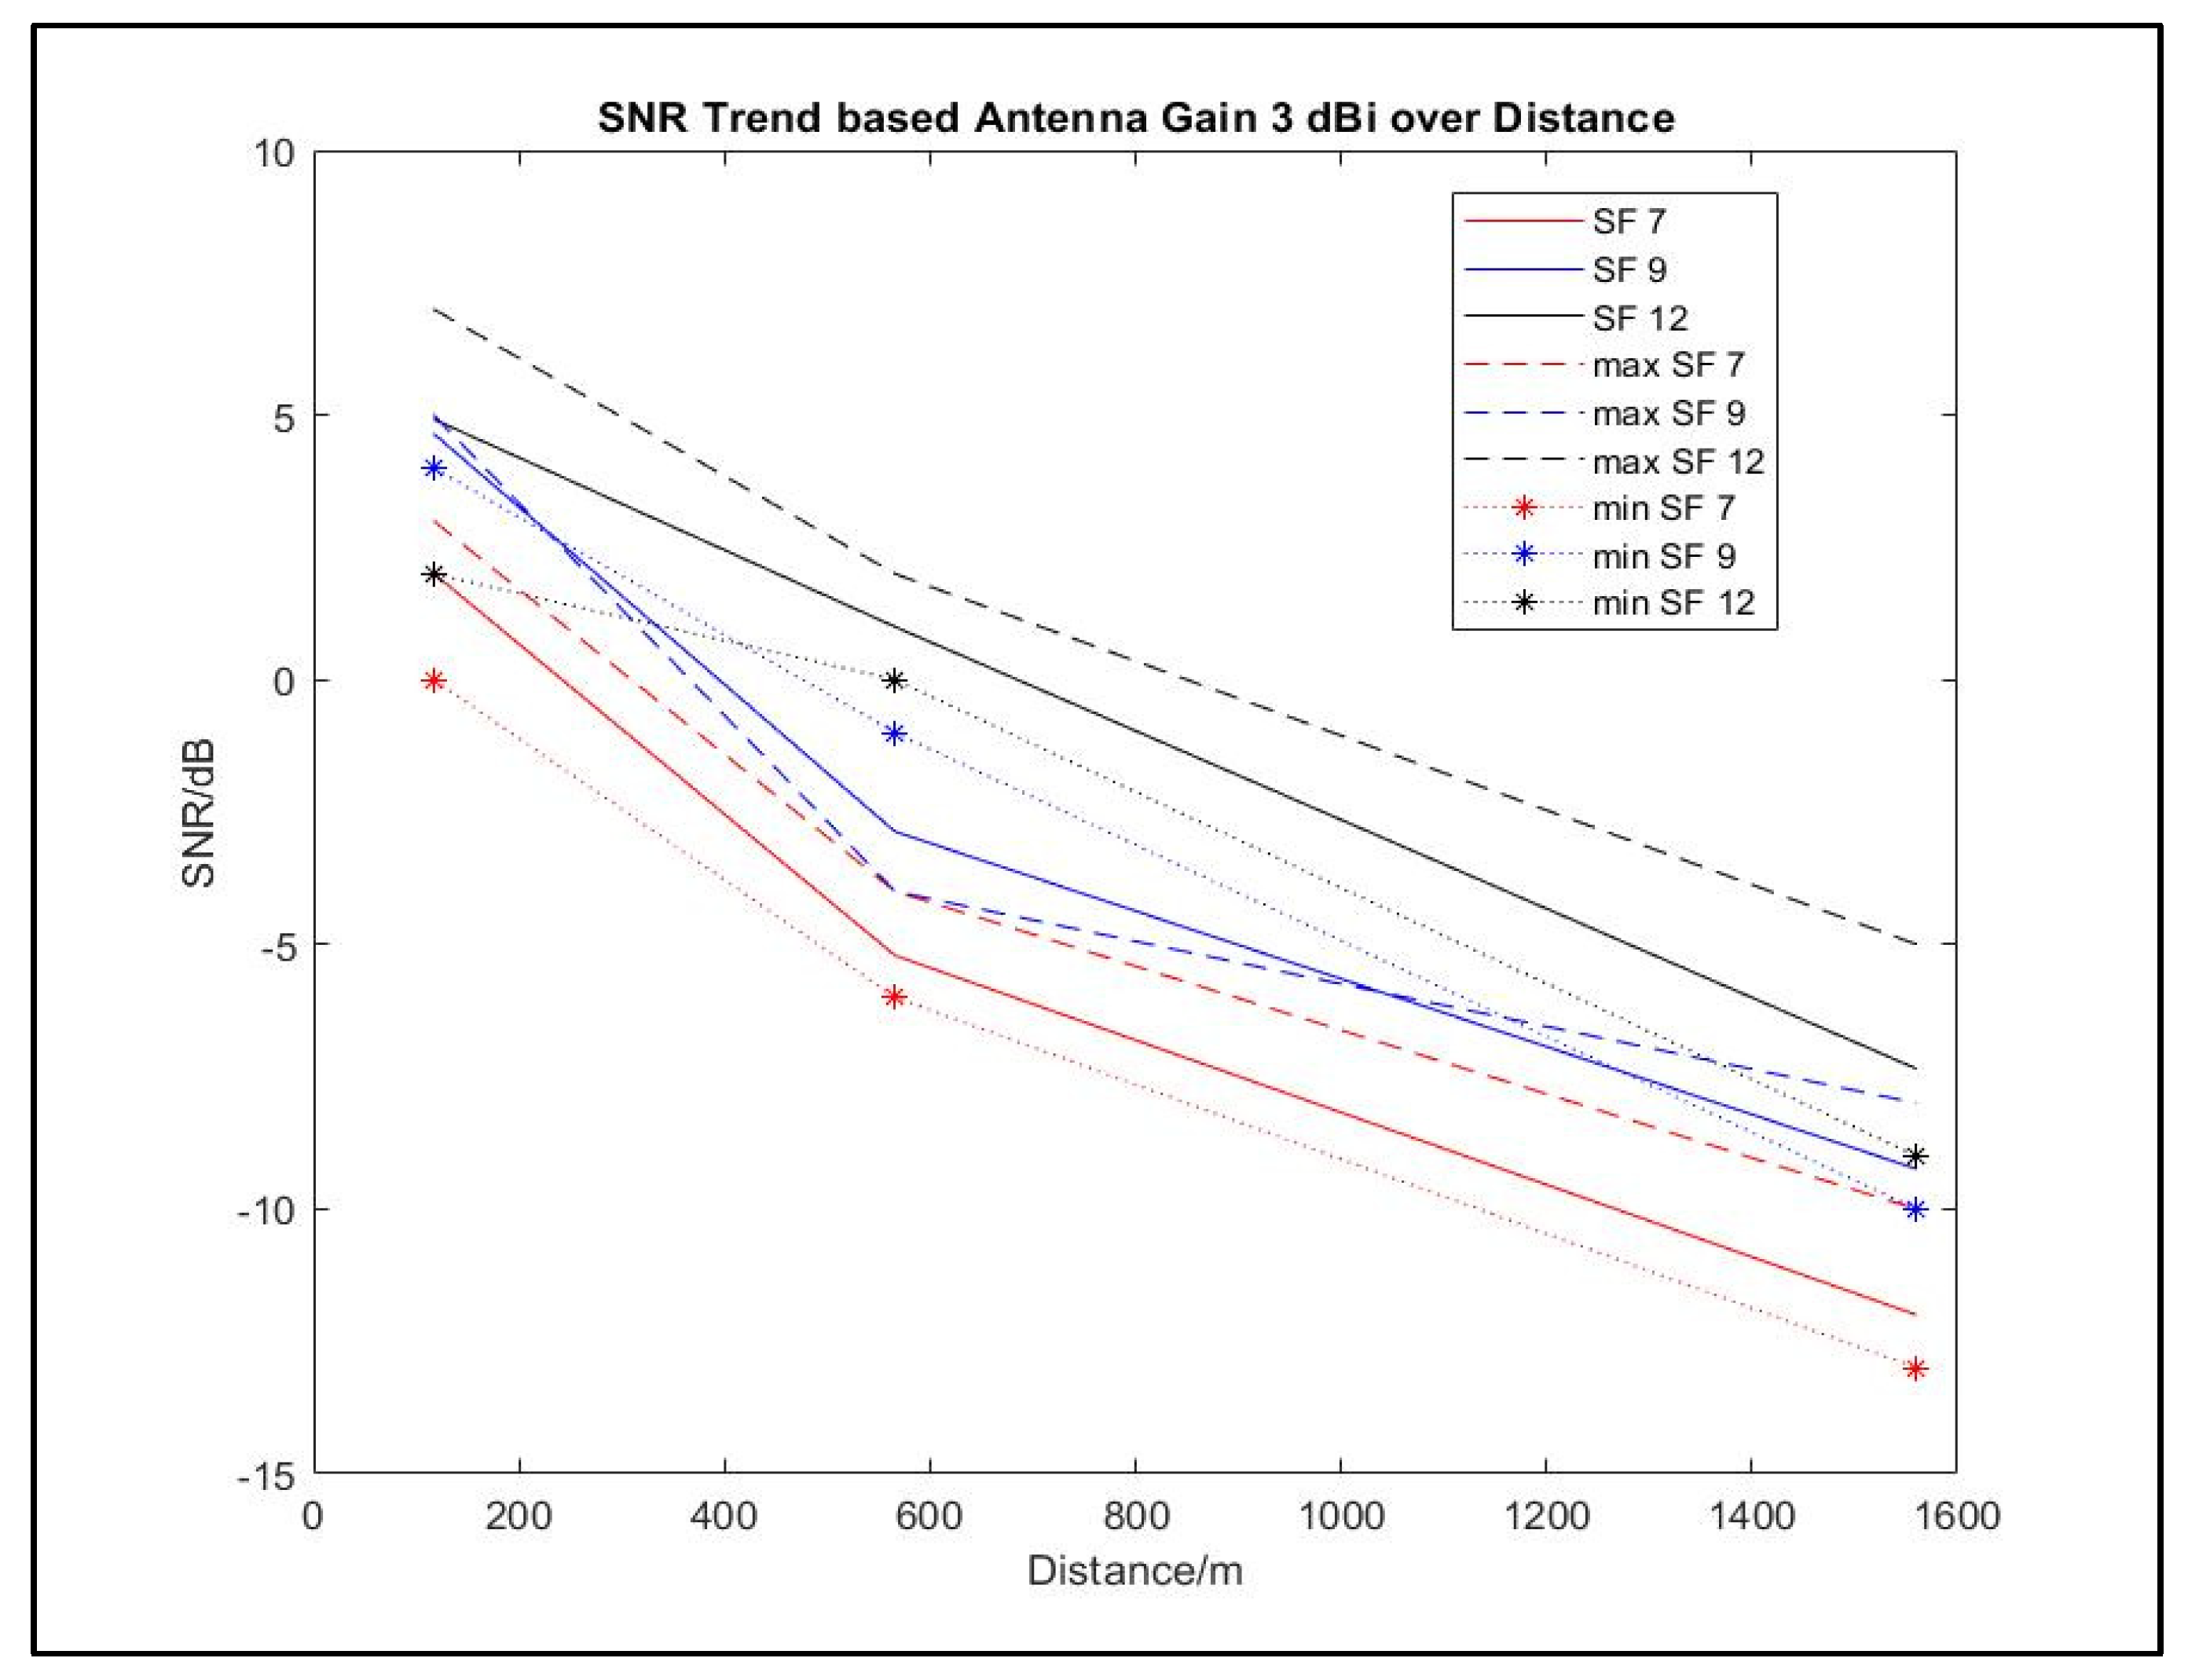
The accumulated SNR sample value iss slightly different from the implied SF value for each distance. The capability of LoRa to allow the signal to travel below the noise floor constructed the KPI of the LoRa demodulator to translate the received signal for SF of 7, 9, and 12 as -7.5 dB, -12.5 dB, and -20 dB, respectively. The recorded SNR value stays above the KPI of the LoRa demodulator except for station P2, which was located 1560 m away from the receiver when SF 7 was implied for both antennas gain of 2.1 dBi and 3 dBi with its mean values of -13.41 and -12, respectively. Although the signal can travel below the noise floor, it cannot be interpreted by the demodulator; therefore it can affect the packet data. Further aspects of the SNR are also monitored in Figure 12 and Figure 13, which illustrate the minimum, maximum, and mean over distances.
Based on Figure 12 and Figure 13, antenna gains of 3 dBi increased all SNR values from station P1 above the noise floor, even with the implementation of SF 7. Nonetheless, SF 7 is inapplicable for station P2, as mentioned previously, because its SNR value did not surpass its KPI of -7.5 dB. Meanwhile, at water station P3, the use of SF 7 and an antenna gain of 3 dBi exceeded its KPI, with a minimum SNR value of -6 dB. Furthermore, the dispersion trend of the SNR for an antenna gain of 3 dBi was smaller and more stable compared with the implementation of an antenna gain 2.1 dBi.
The stability of the SNR trend supported by an antenna gain of 3 dBi can improve the optimization of the transmission and reduce undesirable signals. The increase in antenna gain also increases the signal power to overcome the NLOS and temperature factors [38]. High and stable SNR values can reduce packet loss, thus increasing throughput.
Relating the RSSI and SNR is significant to the expected signal power, as shown in equation (17). ESP information estimates the average desired signal in a noisy environment.

4.2.2. Packet Loss

The execution of the RSSI and SNR corresponds to the dropped packet data. Table VII lists the daily average packet losses for each period in which the end node transmits data to the receiver.
Referring to Table 7, packet loss from both station P1 and P3 remained below 10% for all conditions, whereas the highest average packet data dropped by 22% from location P2, which was embedded with an antenna gain of 2.1 dBi and SF of 7.
The occurrence of high packet loss was heavily affected by a low SNR, which could not be demodulated by the receiver, and the NLOS effect in the urban environment.
The effects of high packet loss degrade the network throughput and increase latency, thereby influencing the accuracy of the water quality data. In addition, the increment in SF can increase the latency, thereby affecting the time delay and packet loss, depending on the density of the environment [33]. However, the packet loss from station P2 was reduced with changes in SF and antenna gain, reaching a maximum of 5.4%.
Nonetheless, absolute prevention of packet loss in any network condition is impossible, but it can be minimized through preventive measures. Sudden changes in data packets support the prediction of network abnormalities.
Anomalies in water quality data caused by high packet loss corrupt and reduce the accuracy of the generated result. A previous method by Jáquez et al. detected an anomaly with a scalar-type program using a Boolean value [35]. They detect errors in the data owing to malfunctioning hardware from the sensor and the water pump.
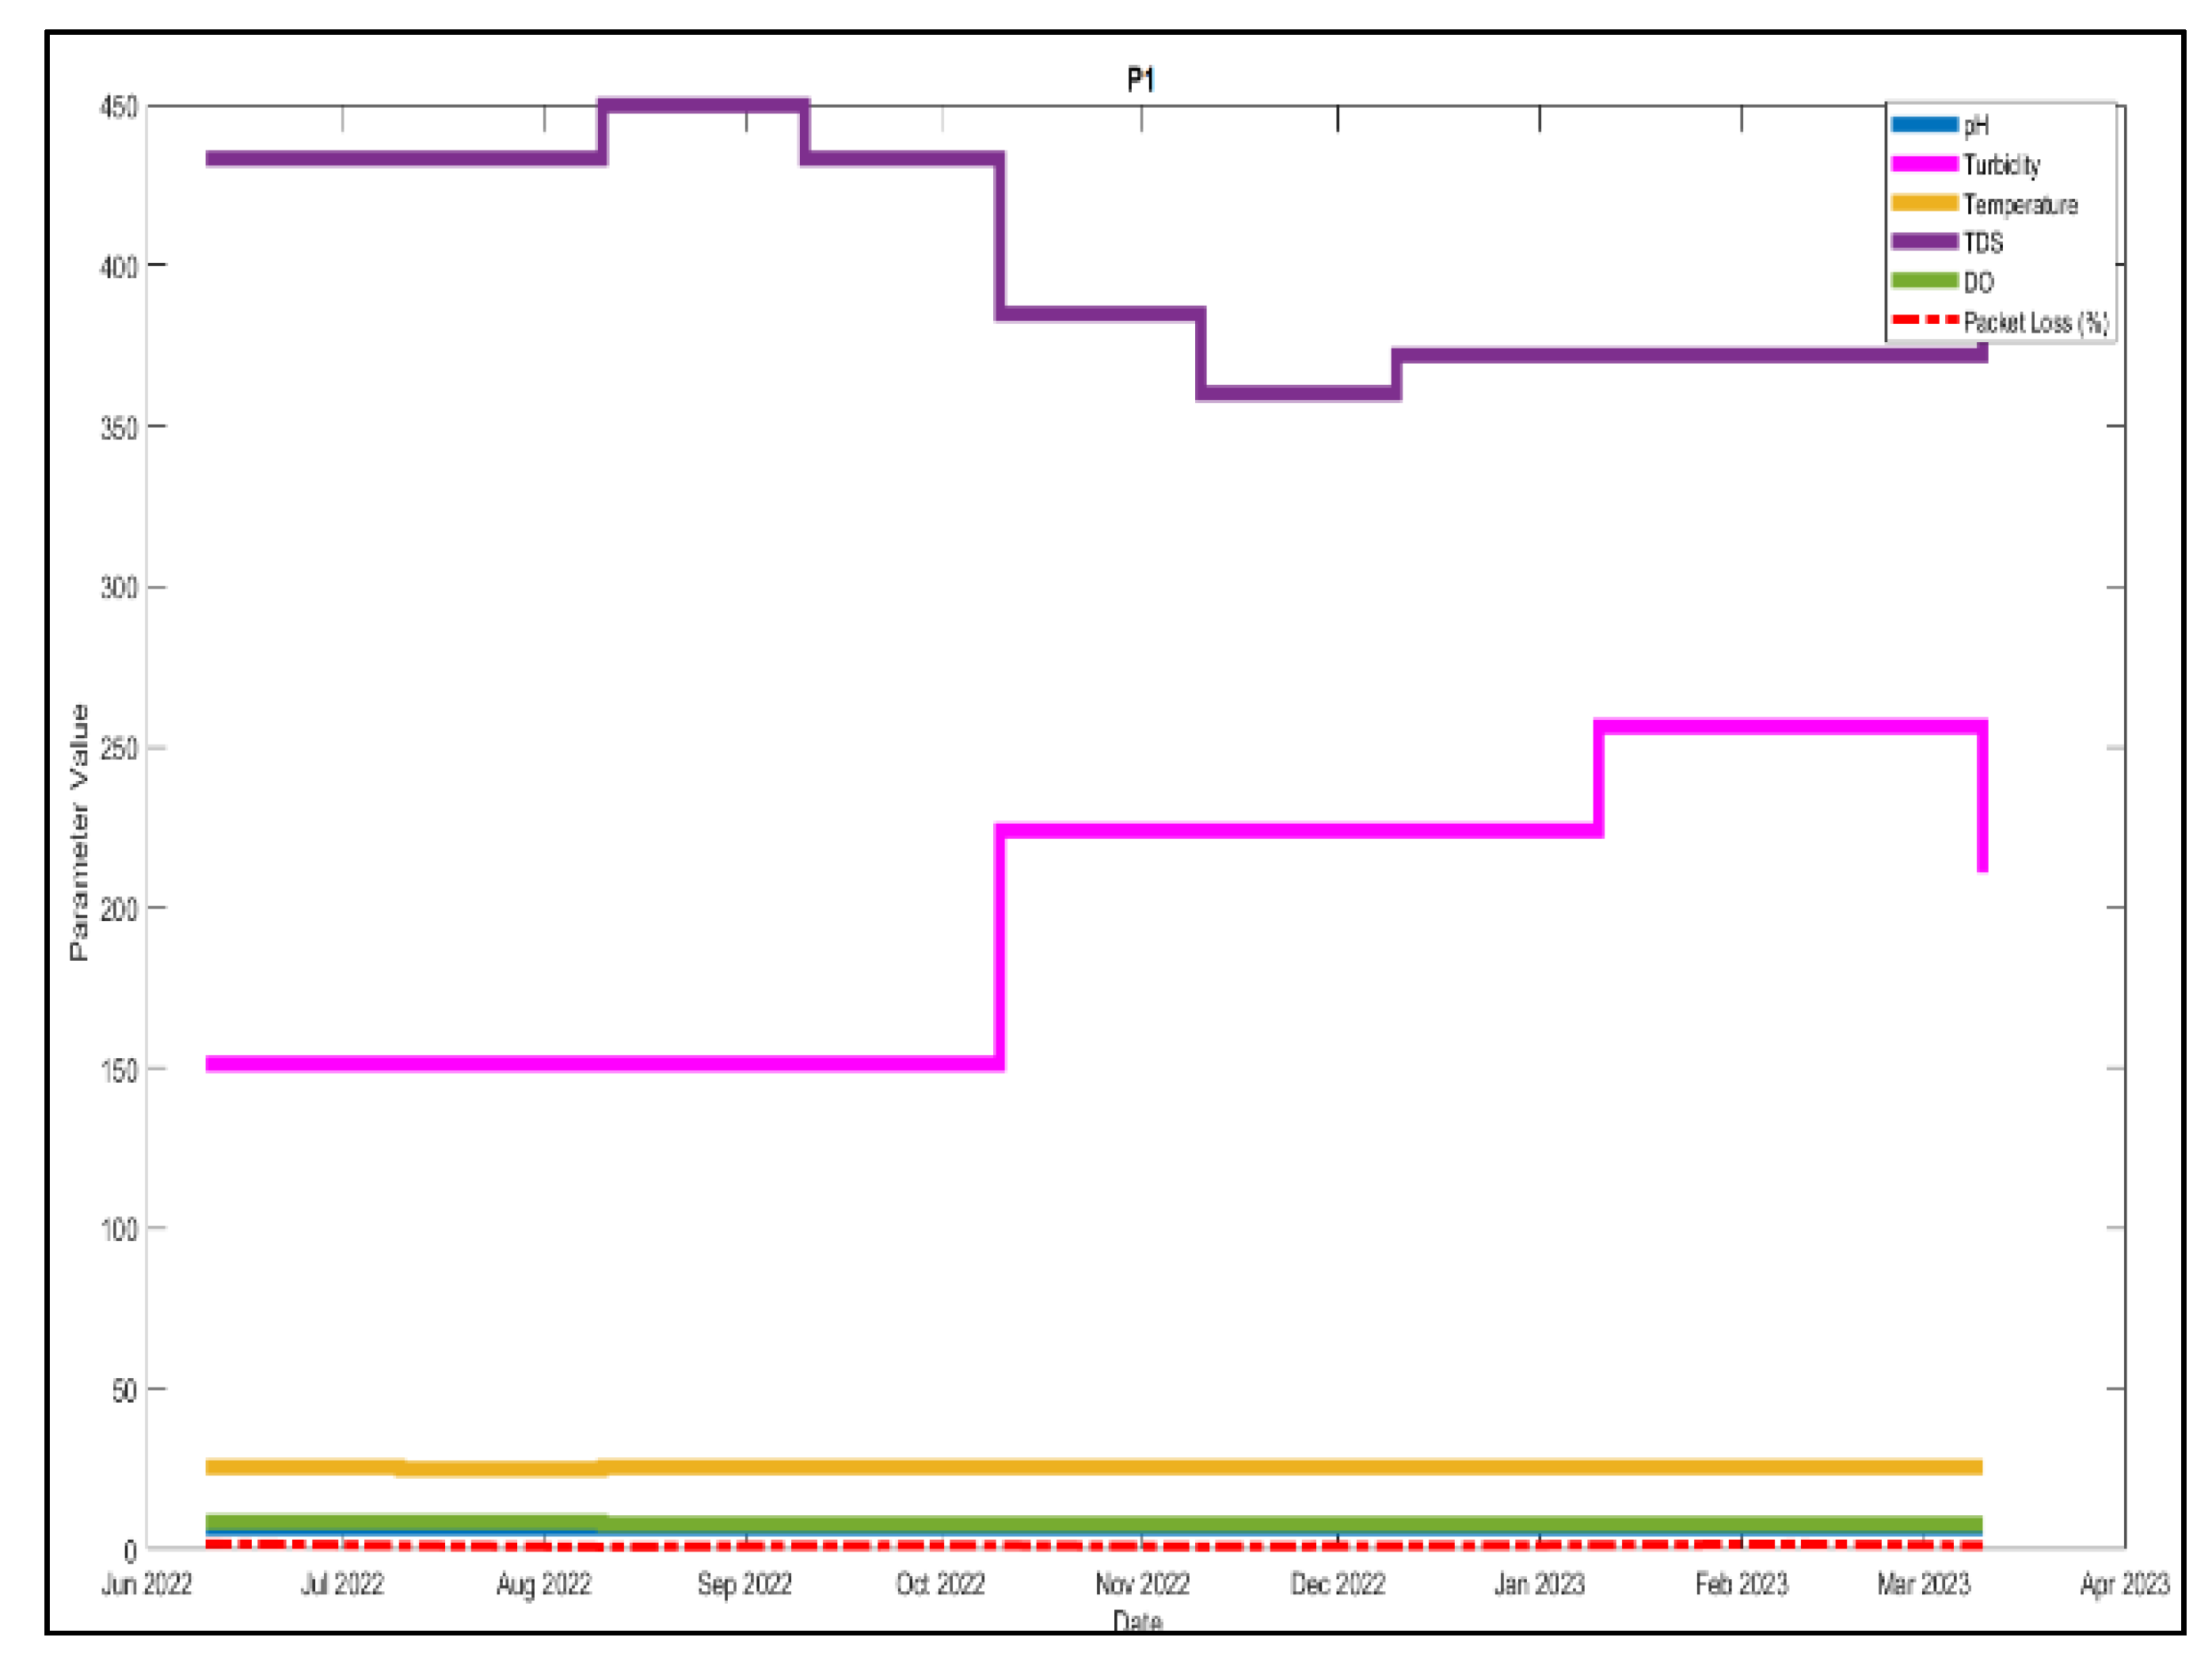
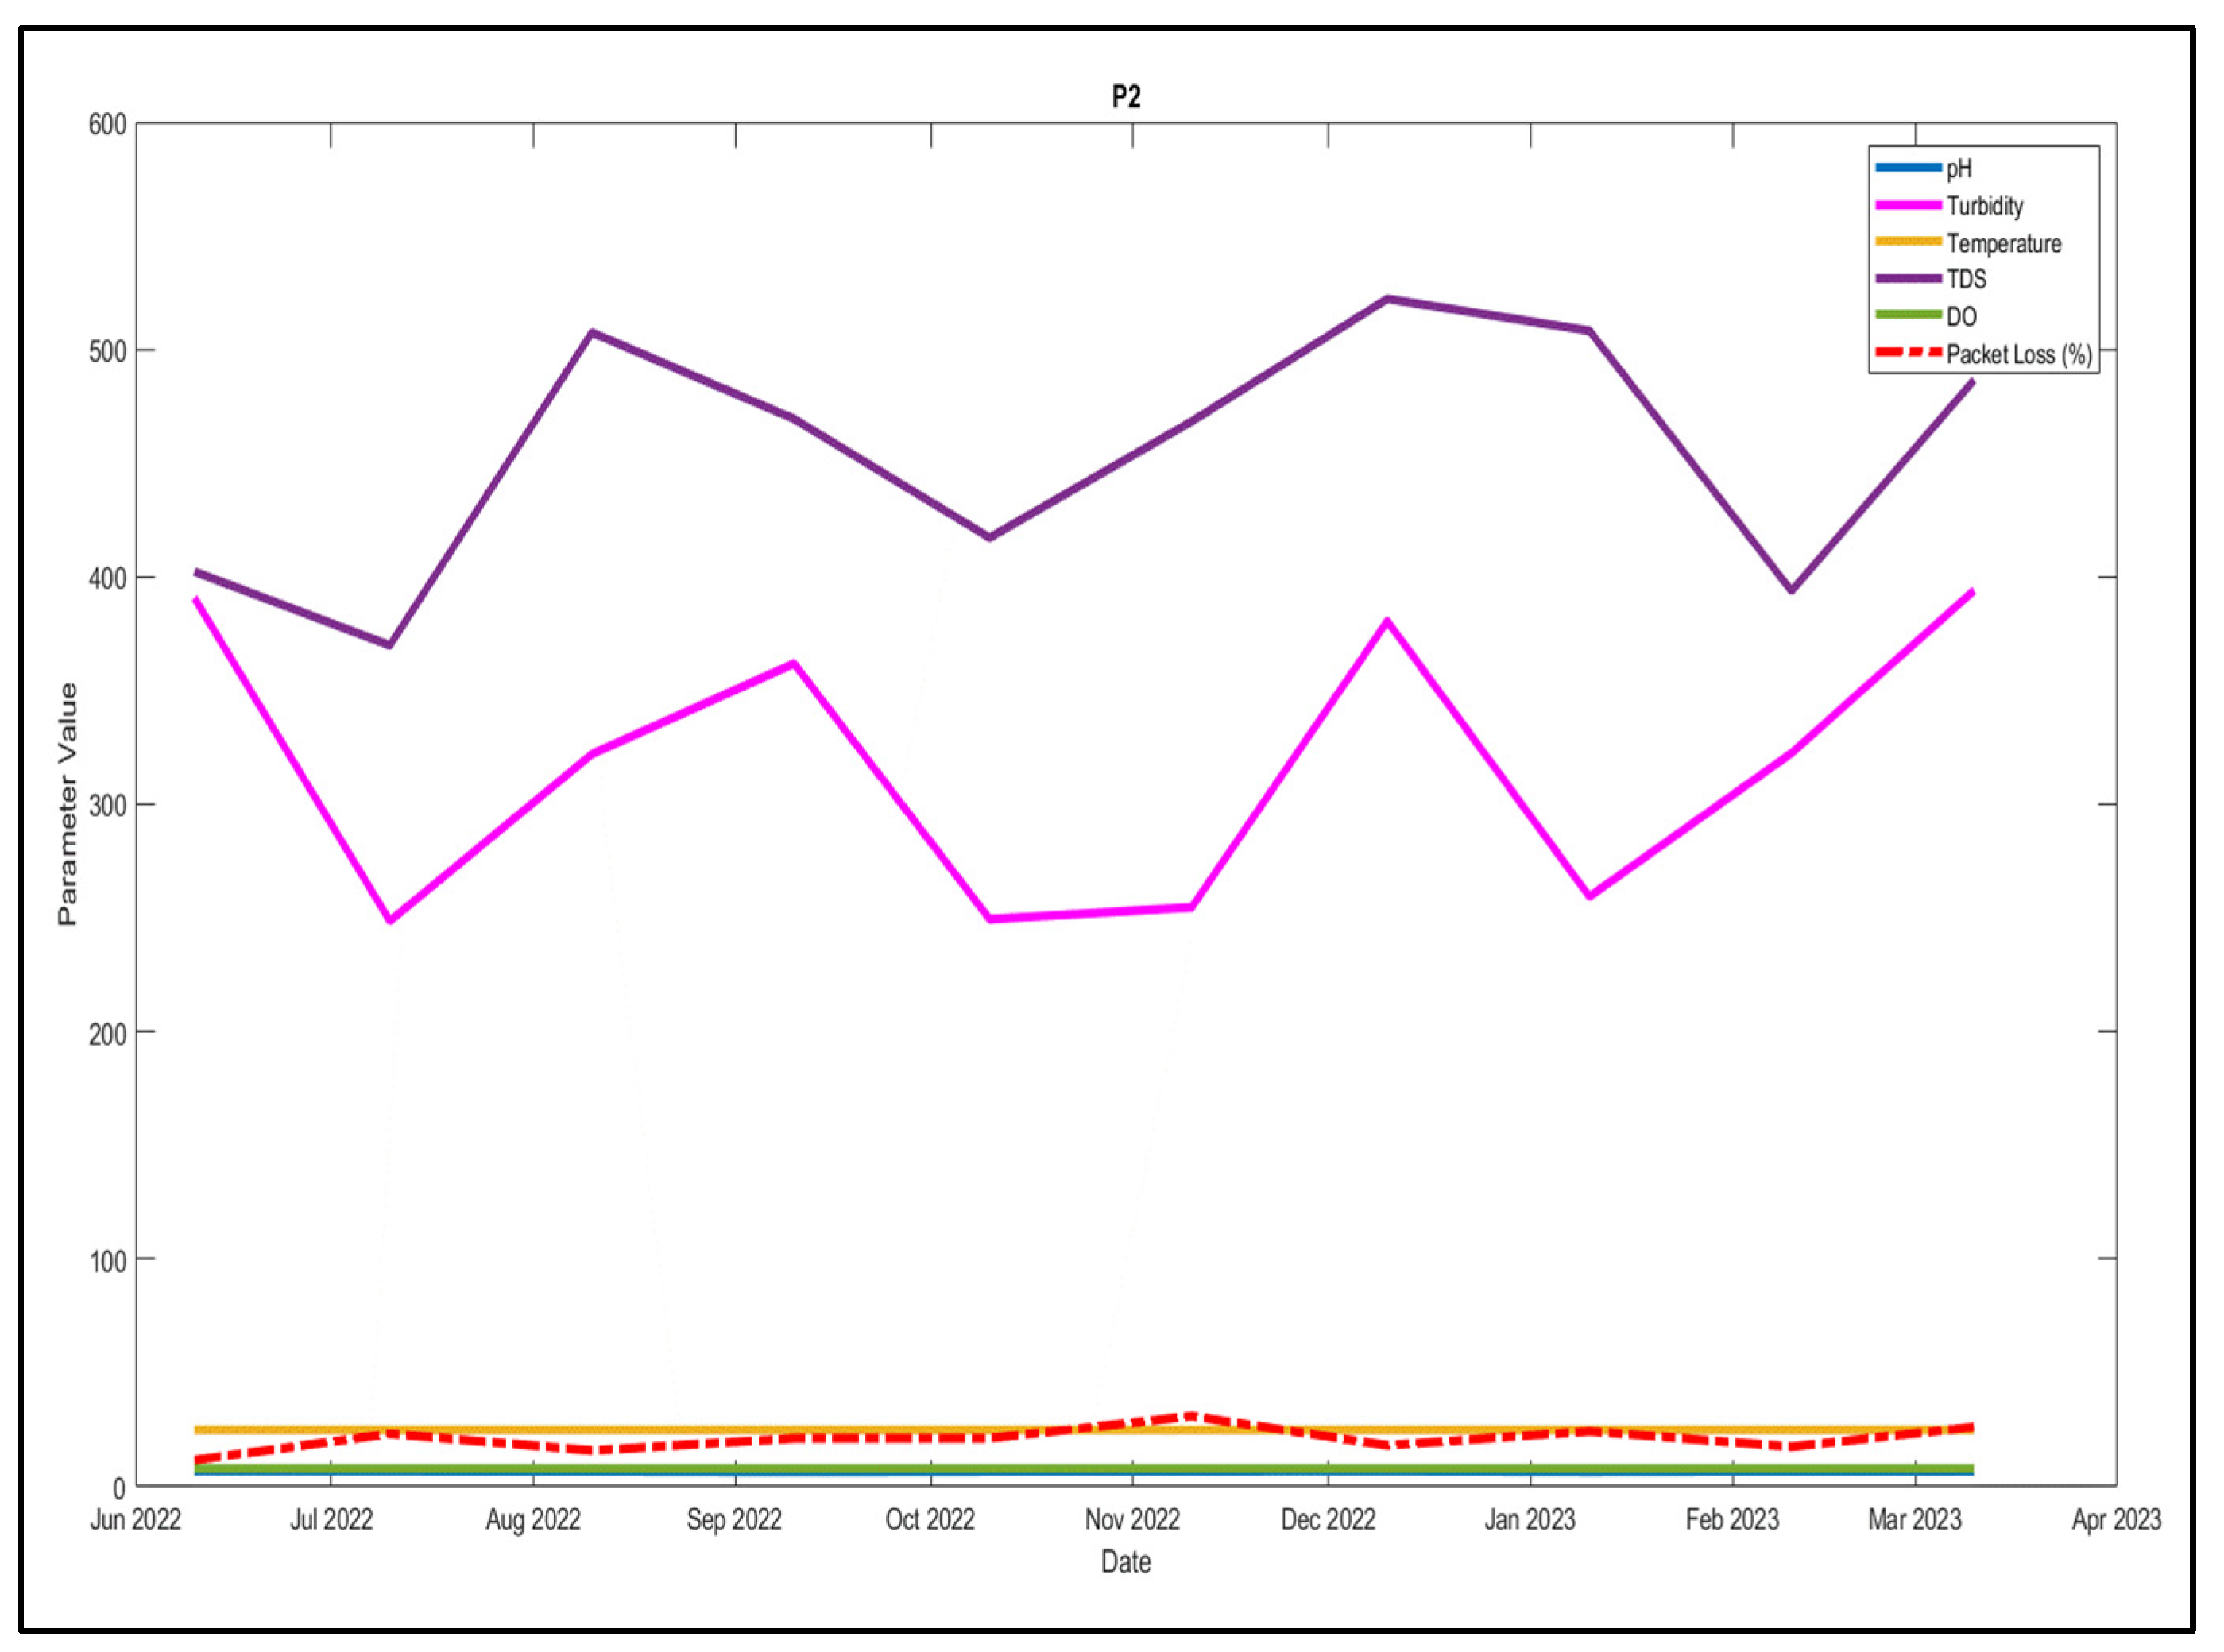
In this study, packet loss was integrated with the results of K-means from water quality data to predict anomalies in the data. The observation of K-means from the water quality data integrated with packet loss from all water stations is shown in Figure 14, Figure 15 and Figure 16.
While the trend of K-means of water quality properties at water station 3 was stable, turbidity and TDS trends at station 1 increased and decreased respectively, in the middle of October 2022. However, its packet data operates with a stable trend and a low packet loss rate. Hence, it can be concluded that the water bodies at station 1 varied in salinity and dissolved content. Water bodies at Station 2 showed stable fluctuations in turbidity and TDS throughout the experimental timeline. There was a high packet loss at Station 2 recorded between November and December 2022 because of the affected transmitted packet data caused by the seasonal change in the monsoon season in Malaysia. Observations of packet loss and water quality data allow environmentalists to inspect and maintain the condition of water sensors and network performance. By using packet loss as an additional input feature, the proposed solution can better distinguish between true and false positives, resulting in an improved overall performance. The integration analysis resulted in enhancements in the water quality monitoring and network performance analysis.
Although, the trend of packet loss from station 2 had a high loss compared to the other stations, the packet loss rates were still within acceptable ranges for low packet data. A previous study by Wei et al. concluded that an increase in communication distance increases the packet loss rate [37].
Thus, monitoring packet loss in this study is important for troubleshooting the network performance and ensuring the efficiency of operational tasks.

4.2.3. Path Loss

Identifying path loss for wireless network applications in urban environments with possible power attenuation is important for defining the budget link. The path losses in this study were analyzed using the propagation of free space (FSDP), referring to (26), and the Okumura-Hata (Oku-Hata) model, referring to (14). The path losses are presented in Table 8.
Because the FSDP method includes antenna gain and feeder losses, the path loss with an antenna gain of 3 dBi showed a slight decline from each end node compared to the implementation of an antenna gain of 2.1 dBi. However, there were no differences in path loss when the antenna gain changed with the Oku-Hata method because its significant elements were the height of the transmitter and receiver, frequency, and distances. However, the Oku-Hata method results in a higher path loss than the FSDP method because it accounts for the effects of diffraction, penetration, and reflection of multiple obstacles in the exterior realm. The obtained FSDP for distance with an estimation of 1 km in this study was significant, as calculated by Ali et al. for a similar omnidirectional antenna used for both the receiver and transmitter [39].
Nevertheless, the use of the FSDP model can provide information for modifications to reduce the average free-space path loss.

4.2.4. Received Power

The computation of the transmission power, gains, and losses influencing the amount of received power has a significant effect on the total budget link. correlating to the link budget, the findings of the received power and received sensitivity are significant in concluding the value of the fading margin. The result of the fading margin allows the design specification to ensure the system performance level.
This parameter was not widely discussed in a previous study of the LoRa monitoring system, as it is known that the receiver sensitivity of LoRa can operate below -130 dBm. Hence, it allows the interpretation of lower signals; however it is crucial to determine the minimum strength to be detected and processed for transmission quality assurance. Table 9 shows a comparison of the total received sensitivity and received power.
The received power gain from all locations can be perceived by the gateway, because the received sensitivity is distributed at a minimum of -129.1 dBm. The received power analyzed from all locations remained below the received sensitivity values. The low value of the received sensitivity in this study allowed the receiver to interpret the weak signals transmitted from the LoRa nodes at each water station. The use of a higher antenna gain in this design system allows it to maintain a minimum fading margin with an estimation of 10 dB from all distances.

5. Conclusions

The objective of this study is to monitor water quality data in an urban environment using the LoRa network as the primary communication method. Real-time analysis of water quality data allows for a quick decision-making system for water environmentalists to prevent pollution outbreaks. Therefore, evaluating the LoRa network performance for developing an autonomous system is signified by its heterogeneous operating conditions in an urban environment. A detailed analysis of the RSSI, SNR, packet loss, path loss, and received power demonstrated the LoRa compatibility for independent operation. Changes in the network properties of LoRa, such as SF and antenna gain, heavily impacts the performance of the LoRa network. The increase in SF and antenna gain increases the distance, receiver sensitivity, and ability to overcome obstacles within the transmission line. The results can assist different configurations for environmental monitoring with an IoT-based LoRa network in urban settings. Furthermore, the large distance between the end-nodes can reduce the redundancy of packet data. The integration of observations of water quality data from the K-means method and packet loss can be used to analyze the anomaly deduction on instruments, changes in water quality properties and network performance. Although LoRa is known for its capability to operate below -130 dBm, enhancement of its network properties, such as bandwidth, can improve its efficiency in terms of its and data type. Finally, this study demonstrates the real-world performance of LoRa as a water quality monitoring communication system, highlighting its various network properties, within an urban area on campus.

Funding

This research was funded by Universiti Malaya, grant number IIRG006B and GPF007A.

Data Availability Statement

We encourage all authors of articles published in MDPI journals to share their research data. In this section, please provide details regarding where data supporting reported results can be found, including links to publicly archived datasets analyzed or generated during the study. Where no new data were created, or where data is unavailable due to privacy or ethical restrictions, a statement is still required. Suggested Data Availability Statements are available in section “MDPI Research Data Policies” at https://www.mdpi.com/ethics.

Acknowledgments

Special thanks to the team of Collaborative IR4.0 Strategies for Lake and River Conservation Management using Innovative Sensing Platforms, the team of sub-programs for river conservation using the LoRa network, and the Water Warriors team for their ideas, knowledge, and material support. Financial support under the research grant of IIRG006B-2019 and GPF007A-2023 were provided by the Universiti Malaya.

Conflicts of Interest

The authors declare no conflict of interest.

References

  1. Karen Bakker, Max Ritts, Smart Earth: A meta-review and implications for environmental governance, Global Environmental Change, Volume 52, 2018, Pages 201-211.
  2. Q. Zhou, K. Zheng, L. Hou, J. Xing and R. Xu, "Design and Implementation of Open LoRa for IoT," in IEEE Access, vol. 7, pp. 100649-100657, 2019. [CrossRef]
  3. Obaideen, K. et al. (2022) ‘The role of wastewater treatment in Achieving Sustainable Development Goals (sdgs) and sustainability guideline’, Energy Nexus, 7, p. 10 0112. [CrossRef]
  4. Academics, S.M. (2020) Roadmap for the national agenda on water sector transformation 2040, 2020 Annual Report Academy of Sciences Malaysia. (Chapter 1: pp 2).
  5. A. R. Haliza. (2021). A Review on Water Issues in Malaysia. International Journal of Research in Business and Social Science (2147-4478). 11. 860-875. 10.6007/IJARBSS/v11-i8/10783.
  6. N. Hassan Omer, ‘Water Quality Parameters’, Water Quality - Science, Assessments and Policy. IntechOpen, Jul. 29, 2020. [CrossRef]
  7. Gafri, Hasan & Mohamed Zuki, Fathiah & Mohamad, Zeeda & Nasaruddin, Affan & Sulaiman, Abdul & Norasiah, Siti. (2018). A study on water quality status of Varsity Lake and 1 Pantai River, Anak Air Batu River in UM Kuala Lumpur, 2 Malaysia and classify it based on (WQI) Malaysia. EQA. 29. 10.6092/issn.2281-4485/7967.
  8. Cham, H. et al. (2020) ‘Web-based system for visualisation of Water Quality index’, All Life, 13(1), pp. 426–432. [CrossRef]
  9. Keshipeddi, S.B. (2021) ‘IOT based Smart Water Quality Monitoring System’, SSRN Electronic Journal [Preprint]. [CrossRef]
  10. Karen Bakker, Max Ritts, Smart Earth: A meta-review and implications for environmental governance, Global Environmental Change, Volume 52, 2018, Pages 201-211,.
  11. Faber, M.J. et al. (2020) ‘A theoretical and experimental evaluation on the performance of Lora Technology’, IEEE Sensors Journal, 20(16), pp. 9480–9489. [CrossRef]
  12. Zourmand, A. et al. (2019) ‘Internet of things (IOT) using Lora Technology’, 2019 IEEE International Conference on Automatic Control and Intelligent Systems (I2CACIS) [Preprint]. [CrossRef]
  13. Bedi, G. et al. (2018) ‘Review of internet of things (IOT) in Electric Power and Energy Systems’, IEEE Internet of Things Journal, 5(2), pp. 847–870. [CrossRef]
  14. Moldobaeva, M. (2019) ‘Water quality monitoring by implementing zigbee network wireless sensors’, International Journal of Psychosocial Rehabilitation, 23(4), pp. 1403–1413. [CrossRef]
  15. Wang, L. , Chen, X. and Gu, D. (2018) ‘Design of water quality monitoring system for aquaculture based on Zigbee’, DEStech Transactions on Computer Science and Engineering [Preprint], (iceiti). [CrossRef]
  16. Dilshad, A., & Abishek, K. (2018). IoT based Smart River Monitoring System. International Of Advanced Research, Ideas and Innovation in Technology, 4(2), 60-64.
  17. Naj, N. and Sanzgiri, A. (2021) ‘An IOT based real-time monitoring of water quality system’, SSRN Electronic Journal [Preprint]. [CrossRef]
  18. Joseph Bryan G., I. , Meo Vincent C., C., Jen, A., Magno Christian Lemuel, S., Villaruel, K., Villeza, S., & Zaliman, S. (2018). Water Quality Monitoring System Using 3G Network. Journal Of Telecommunication, Electronic and Computer Engineering, 10(1-13), 15-18.
  19. BAFWAC-Ericsson. (2017). Using smart technology to monitor Stockholm’s water systems [Ebook] (pp. 3-5). Stockholm. Retrieved: https://ceowatermandate.org/wpcontent/uploads/2017/11/BAFWAC_-_Ericcson_11.2.pdf.
  20. Wu, Y., He, Y. and Shi, L. (2020) ‘Energy-saving measurement in Lorawan-based wireless sensor networks by using compressed sensing’, IEEE Access, 8, pp. 49477–49486. [CrossRef]
  21. RP002-1.0.0 LoRaWAN® Regional 49 Parameters. Fremont, California: LoRa Alliance, 2019, pp. 21-22, 83-86.
  22. Q. M. Qadir, "Analysis of the Reliability of LoRa," in IEEE Communications Letters, vol. 25, no. 3, pp. 1037-1040, 21. 20 March. [CrossRef]
  23. Petajajarvi J, Mikhaylov K, Pettisalo M, et al. Performance of low-power wide-area network based on LoRa technology: Doppler robustness, scalability and coverage. Int J Distr Sensor Networks. 2017;13(13):155014771769941.
  24. Oliveira, R.; Guardalben, L.; Sargento, S. Long range communications in urban and rural environments. In Proceedings of the IEEE Symposium on Computers and Communications (ISCC), Heraklion, Greece, 3–6 July 2017; pp. 810–817. [Google Scholar]
  25. "An In-depth Look at LoRaWAN® Class B Devices | DEVELOPER PORTAL", Lora-developers.semtech.com. [Online]. Available: https://lora-developers.semtech.com/library/tech-papers-and-guides/lorawan-class-b-devices/.
  26. M. Ertürk, M. Aydın, M. Büyükakkaşlar and H. Evirgen, "A Survey on LoRaWAN Architecture, Protocol and Technologies", Future Internet, vol. 11, no. 10, p. 216, 2019.
  27. Delobel, F.; Rachkidy, N.E.; Guitton, A. Analysis of the Delay of Confirmed Downlink Frames in Class Bof LoRaWAN. In Proceedings of the IEEE 85th Vehicular Technology Conference (VTC Spring), Sydney,Australia, 4–7 June 2017. pp. 1–6.
  28. Paredes, M., Bertoldo, S., Carosso, L., Lucianaz, C., Marchetta, E., Allegretti, M., & Savi, P. (2019). Propagation measurements for a LoRa network in an urban environment. Journal Of Electromagnetic Waves and Applications, 33(15), 2022-2036. [CrossRef]
  29. Rizzi M, Ferrari P, Flammini A, et al. Evaluation of the IoT LoRaWAN solution for Distributed measurement applications. IEEE Trans Instr. and Meas. 2017;66(12):3340–3349.
  30. E. Leon, C. Alberoni, M. Wister and J. Hernández-Nolasco, "Flood Early Warning System by Twitter Using LoRa", Proceedings, vol. 2, no. 19, p. 1213, 2018.
  31. G. Codeluppi, A. Cilfone, L. Davoli and G. Ferrari, "LoRaFarM: A LoRaWAN-Based Smart Farming Modular IoT Architecture", Sensors, vol. 20, no. 7, p. 2028, 2020.
  32. M. Abbasi, S. Khorasanian and M. Yaghmaee, "Low-Power Wide Area Network (LPWAN) for Smart grid: An in-depth study on LoRaWAN", 2019 5th Conference on Knowledge Based Engineering and Innovation (KBEI), 2019.
  33. Prakosa, S.W. et al. (2021) ‘Design and implementation of Lora based IOT scheme for Indonesian Rural Area’, Electronics, 10(1), p. 77. [CrossRef]
  34. J. Lousado and S. Antunes, "Monitoring and Support for Elderly People Using LoRa Communication Technologies: IoT Concepts and Applications", Future Internet, vol. 12, no. 11, p. 206, 2020.
  35. S. N. S. Tahatahir et al., "IoT Architecture Based Water Resources Conservation Management Using LoRa," 2021 International Conference on Smart City and Green Energy (ICSCGE), Hangzhou, China, 2021, pp. 63-68. [CrossRef]
  36. Jáquez, A.D. et al. (2023) ‘Extension of Lora coverage and integration of an unsupervised anomaly detection algorithm in an IOT water quality monitoring system’, Water, 15(7), p. 1351. [CrossRef]
  37. Wei Chen, Xiao Hao, JianRong Lu, Kui Yan, Jin Liu, ChenYu He, Xin Xu, "Research and Design of Distributed IoT Water Environment Monitoring System Based on LoRa", Wireless Communications and Mobile Computing, vol. 2021, Article ID 9403963, 13 pages, 2021. [CrossRef]
  38. Ali, N.A. , Adilah, N. and Salimi, I. (2019) ‘Performance of lora network for environmental monitoring system in Bidong Island Terengganu, Malaysia’, International Journal of Advanced Computer Science and Applications, 10(11). [CrossRef]
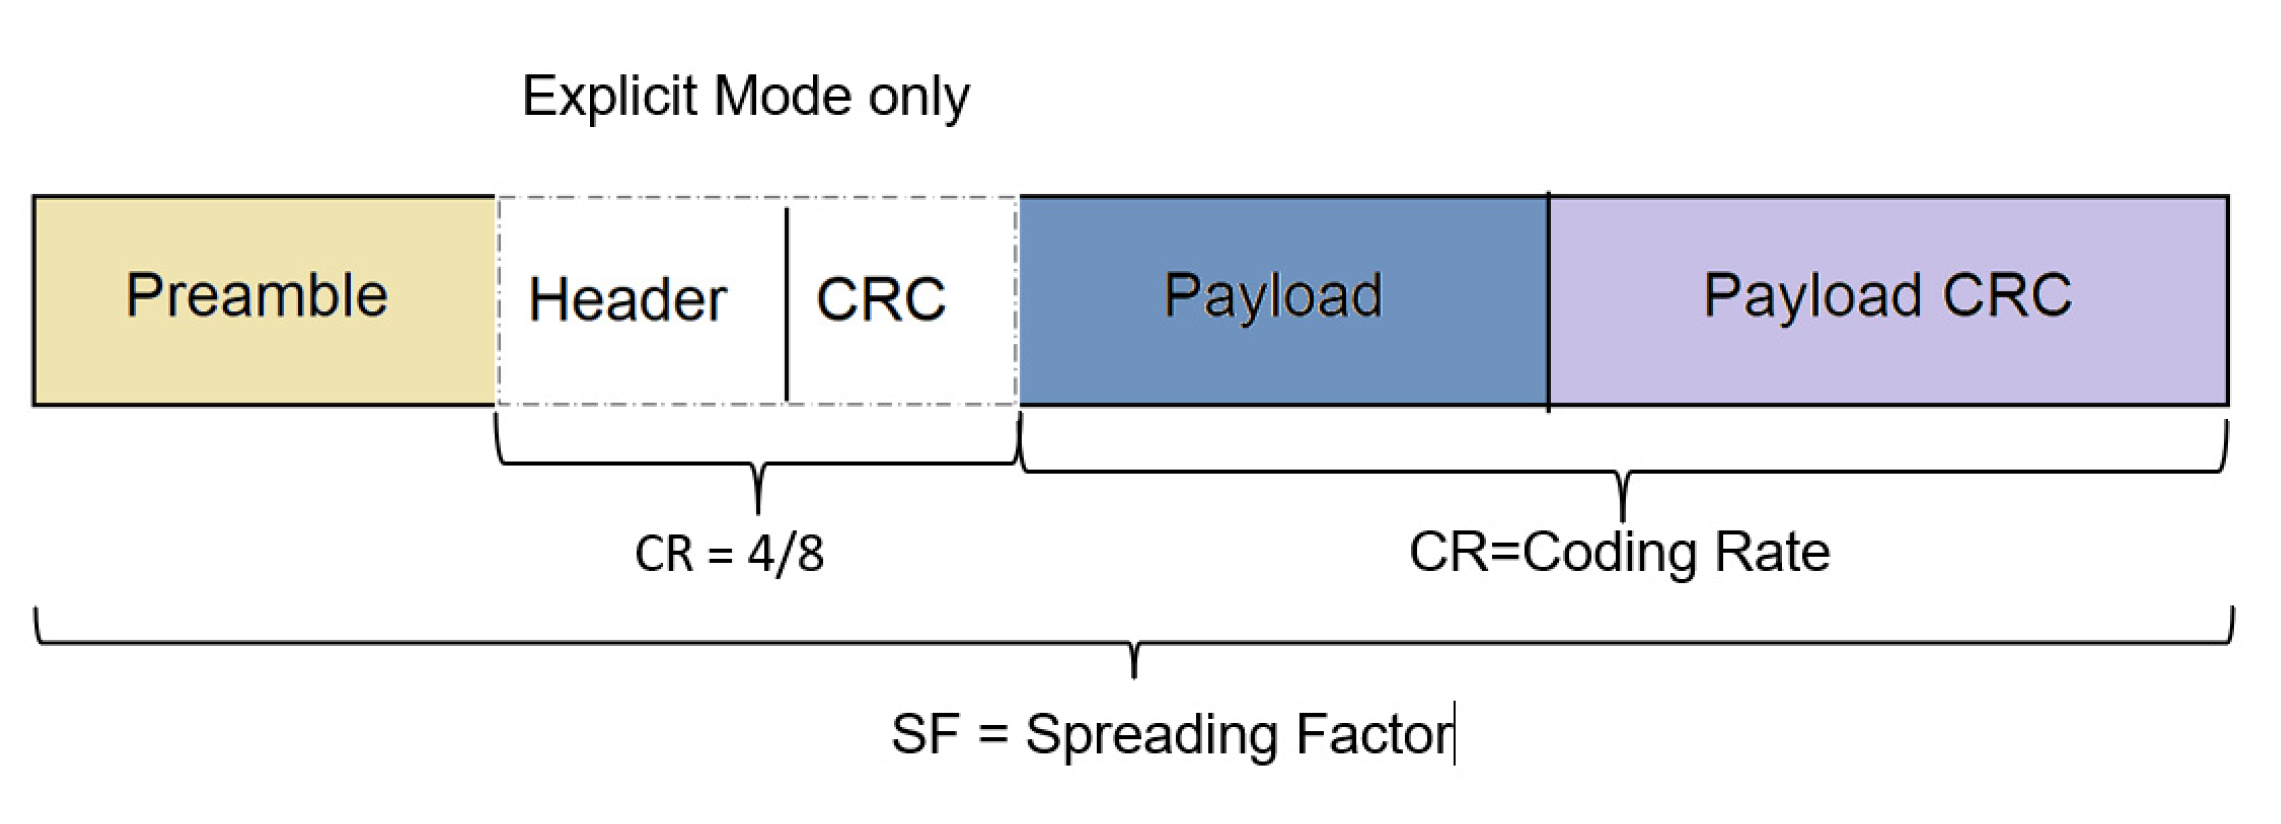
Figure 1. LoRa Frame Format Configuration.
Preprints 107460 g001
Figure 2. Summary of the Type of Class for Downlink Communication by LoRaWAN.
Preprints 107460 g002
Figure 3. Process of Developing a Water Quality Monitoring System with LoRa Integration.
Preprints 107460 g003
Figure 4. Prototype of a Water Quality Monitoring Station.
Preprints 107460 g004
Figure 5. Location of the Water Station in Universiti Malaya from the Gateway.
Preprints 107460 g005
Figure 6. LoRa Gateway Positioned on the Rooftop.
Preprints 107460 g006
Figure 7. Water Quality Monitoring Dashboard in Android View.
Preprints 107460 g007
Figure 8. Thing Speak Interface (a) Field 1 Chart: pH. (b) Field 2 Chart: Turbidity. (c) Field 3 Chart: Temperature. (d) Field 4 Chart: TDS (e) Field 5 Chart: Dissolved Oxygen.
Preprints 107460 g008aPreprints 107460 g008b
Figure 9. Water Quality Status (a) Station 1 (b) Station 2 (c) Station 3.
Preprints 107460 g009
Figure 10. Mean, Maximum, and Minimum of RSSI Trend Based on Antenna Gain of 2.1 dBi.
Preprints 107460 g010
Figure 11. Mean, Maximum, and Minimum of RSSI Trend Based on Antenna Gain of 3 dBi.
Preprints 107460 g011
Figure 12. Mean, Maximum, and Minimum of SNR Trend Based on Antenna Gain of 2.1 dBi.
Preprints 107460 g012
Figure 13. Mean, Maximum, and Minimum of SNR Trend Based on Antenna Gain of 3 dBi.
Preprints 107460 g013
Figure 14. Integration K-means trend on water quality data and packet loss at Water Station 1.
Preprints 107460 g014
Figure 15. Integration K-means trend on water quality data and packet loss at Water Station 2.
Preprints 107460 g015
Figure 16. Integration K-means trend on water quality data and packet loss at Water Station 3.
Preprints 107460 g016
Table 1. List of Water Sensors Embedded in the Water Quality Station.
Water Quality Sensor Functions
Dissolved Oxygen Examine the amount of oxygen volume for aquatic life
Temperature Variables for other water properties
Turbidity Water opacity
pH Meter Acidification
TDS Salinity and Total Dissolved Solids for Conductivity
Table 2. LoRa Parameter Setup at Water Station for Antenna Gain 2.1 dBi.
Parameter Setup
Spread Factor 7 9 12
Bandwidth (kHz) 125
Frequency Plan 868/915 MHz
Transmitted Power (dBm) 14
Antenna Gain (dBi)
Data Transfer Rate (kbps)
2.1
5.47 1.758 0.25
Table 3. LoRa Parameter Setup at Water Station for Antenna Gain 3 dBi.
Parameter Setup
Spread Factor 7 9 12
Bandwidth (kHz) 125
Frequency Plan 868/915 MHz
Transmitted Power (dBm) 14
Antenna Gain (dBi) 3
Data Transfer Rate (kbps) 5.47 1.758 0.25
Table 4. Result of Water Quality Data from the K-Means Method.
Water Station pH Turbidity
(NTU)
Temperature
(°C)
Total Dissolved Solid
(mg/l)
Dissolved Oxygen
(mg/l)
P1 6.9777 213.2889 25.4 434.1407 8.1036
P2 6.6643 285.4009 27.57 440.4035 7.0559
P3 6.9985 183.0859 25.1 346.0336 7.9974
Table 5. RSSI Spread Values.
Antenna Gain
(dBi)
Water Station Distance
(m)
SF Maximum
(dBm)
Minimum
(dBm)
Mean
(dBm)
2.1 P1 117 7 -98 -111 -99.22
9 -92 -102 -97.04
12 -87 -93 -90.14
P2 1560 7 -115 -118 -116.73
9 -112 -118 -113.88
12 -102 -115 -109.4
P3 566 7 -110 -113 -111.74
9 -105 -113 -107.92
12 -97 -109 -102.87
3 P1 117 7 -88 -104 -96.01
9 -85 -99 -93.64
12 -83 -90 -86.04
P2 1560 7 -110 -116 -114.98
9 -106 -115 -110.47
12 -101 -110 -106.71
P3 566 7 -107 -113 -110.73
9 -100 -109 -105.41
12 -94 -104 -99.52
Table 6. SNR Spread Values.
Antenna Gain
(dBi)
Water Station Distance
(m)
SF Maximum
(dBm)
Minimum
(dBm)
Mean
(dBm)
2.1 P1 117 7 2 -2 0.11
9 2 -1 0.31
12 4 0 2.64
P2 1560 7 -12 -15 -13.41
9 -10 -12 -10.91
12 -7 -9 -8.37
P3 566 7 -5 -8 -6.73
9 -2 -7 -4.32
12 0 -4 -2.46
3 P1 117 7 3 0 2.01
9 5 4 4.65
12 7 2 4.92
P2 1560 7 -10 -13 -12
9 -8 -10 -9.24
12 -5 -9 -7.35
P3 566 7 -4 -6 -5.21
9 -4 -1 -2.87
12 2 0 1
Table 7. Average of Daily Packet Loss.
Antenna Gain
(dBi)
Water Station Distance
(m)
SF Packet Loss
%
2.1 P1 117 7 1.7
9 1.2
12 0.4
P2 1560 7 22
9 13
12 15
P3 566 7 6
9 3.2
12 2
3 P1 117 7 1.2
9 0.3
12 < 0
P2 1560 7 10
9 5.4
12 2.8
P3 566 7 3
9 2.2
12 5
Table 8. Total of Path Loss based on FSDP and Oku-Hata Model.
Antenna Gain
(dBi)
Water Station Distances (m) Path Loss FSDP
(dB)
Path Loss Oku-Hata
(dB)
2.1 P1 117 65.31 88.21
P2 1560 83.61 127.34
P3 566 74.81 112.03
3 P1 117 64.41 88.21
P2 1560 82.71 127.34
P3 566 73.91 112.03
Table 9. Total of Received Power and Received Sensitivity.
Antenna Gain
(dBi)
Station Distances (m) Received Sensitivity
(dBm)
Received Power
(dBm)
2.1 P1 117 -116.72 -109.65
P2 1560 -127.9 -120.75
P3 566 -121.35 -113.86
3 P1 117 -118.58 -108.34
P2 1560 -129.1 -118.02
P3 566 -122.98 -112.44
Disclaimer/Publisher’s Note: The statements, opinions and data contained in all publications are solely those of the individual author(s) and contributor(s) and not of MDPI and/or the editor(s). MDPI and/or the editor(s) disclaim responsibility for any injury to people or property resulting from any ideas, methods, instructions or products referred to in the content.
Copyright: This open access article is published under a Creative Commons CC BY 4.0 license, which permit the free download, distribution, and reuse, provided that the author and preprint are cited in any reuse.
Prerpints.org logo

Preprints.org is a free preprint server supported by MDPI in Basel, Switzerland.

Subscribe

© 2024 MDPI (Basel, Switzerland) unless otherwise stated