1. Introduction
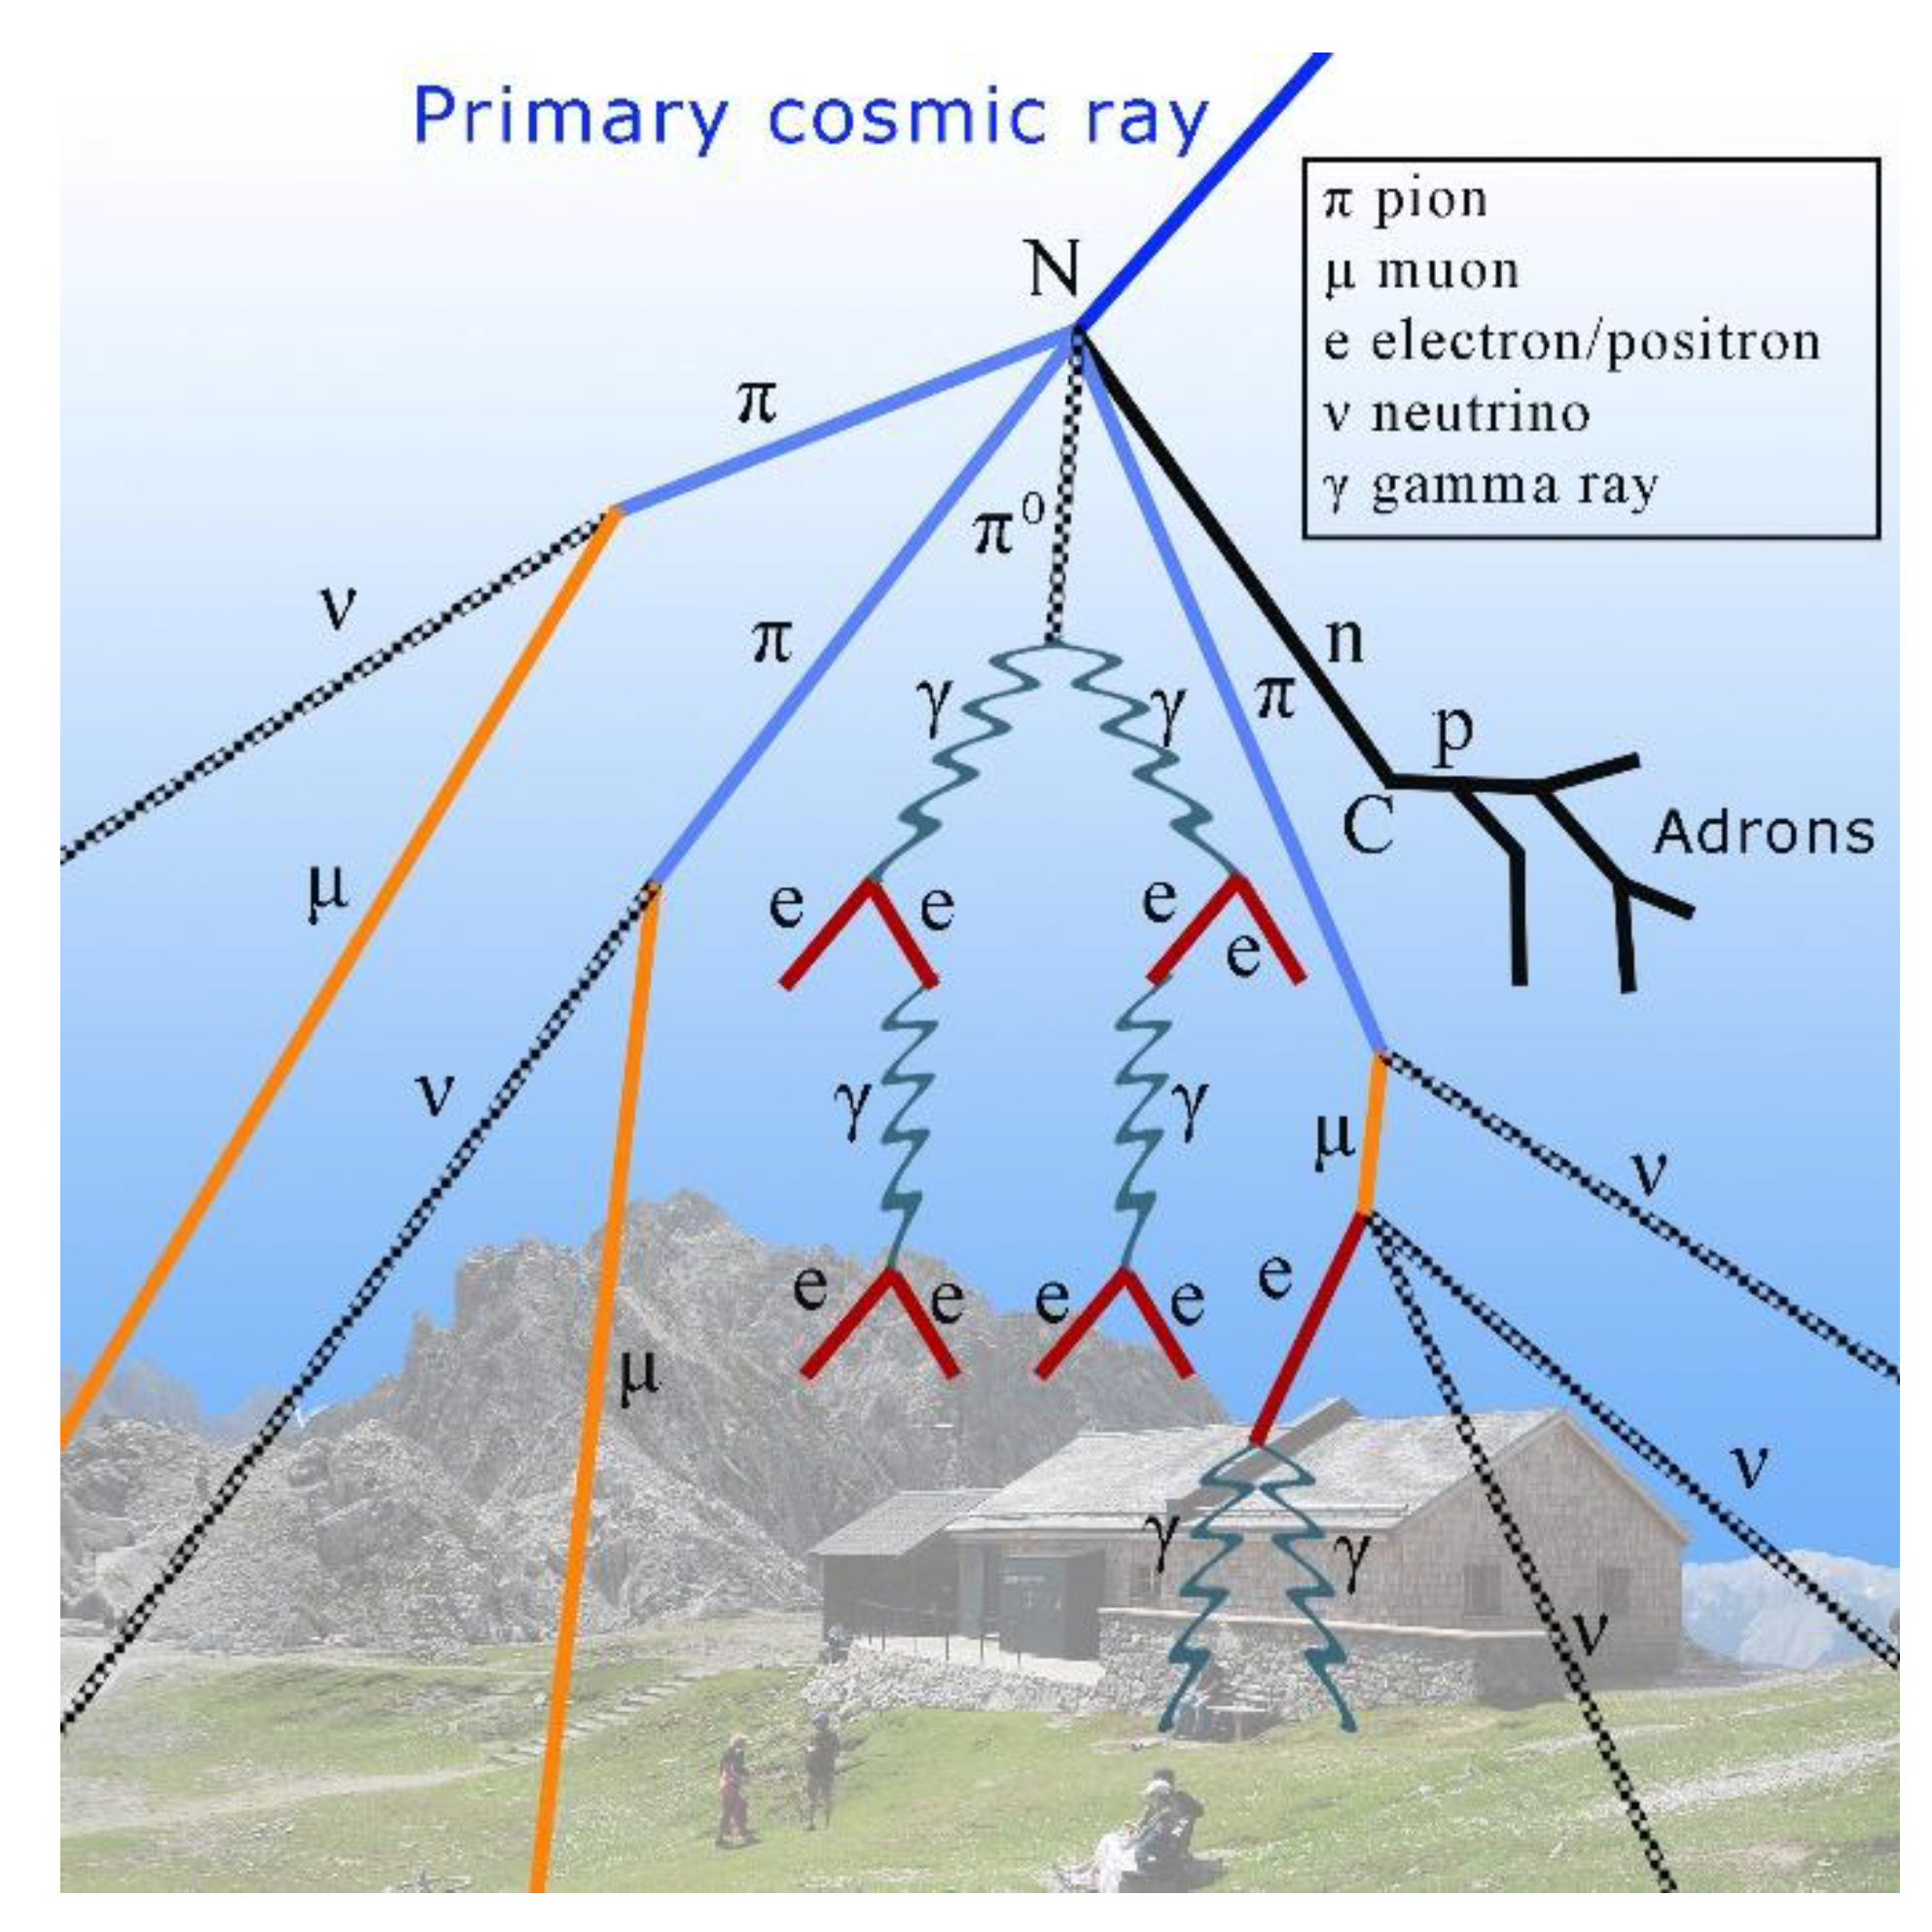
Primary cosmic rays predominantly consist of protons, which travel through space at relativistic speeds and continuously bombard the Earth. When these high-energy protons enter the atmosphere, they collide with atmospheric atoms, initiating a cascade or shower of secondary particles known as secondary cosmic rays. A cosmic-ray shower is composed of various types of particles. The central part of the shower primarily contains a soft component known as the electromagnetic (or electro-photonic) cascade, while an hard component mainly consists of muons. In addition to muons, other secondary cosmic rays that reach the ground include photons and electrons, some neutrons, and few heavy nuclei (
Figure 1).
Ground-based cosmic ray detectors measure not only muons, but also other ionizing particles present in the cosmic ray showers. The minimum energy carried by a muon reaching the ground exceeds 2 GeV, whereas ionizing particles from natural radioactivity, typically have energies on the order of a few MeV, representing a difference of approximately three orders of magnitude (a factor of 1000).
Detectors based on Geiger-Müller tubes (GMTs) are sensitive to a wide range of radiation energies, including X-rays with energies as low as a few keV. To selectively measure cosmic rays and exclude other particles, it is necessary to stack two or more GMTs and consider only the particles that pass through the tubes simultaneously, a method known as coincidence detection. Any cosmic ray detector works on this coincidence technique invented by Walther Bothe and Hans Geiger and then perfected by Bothe and Rossi in order to use three sensors and more [
1]. Alternatively, a thick lead shield (provided it is pure) can be used to block lower-energy particles, or both methods can be employed in combination. Muons, due to their high energies, can penetrate deep material thicknesses, whereas particles produced by natural radioactivity are typically stopped by the first sensor itself or by the lead shielding. It is important to note that detectors of this type can only record the number of events or particles, but they cannot measure the energy released by individual particles.
The motivation for building a cosmic ray detector using DIY Geiger counters comes out from several key factors that make this approach particularly appealing and practical. One of the primary motivations is cost containment. Modern cosmic ray detectors, which rely on scintillators and photomultiplier tubes (PMTs), can be quite expensive, often necessitating specialized components and sophisticated electronics. However, by opting for GMTs instead, it becomes possible to significantly reduce the overall cost of constructing a cosmic ray detector while still obtaining a portable and functional instrument. Although the use of GMTs may seem outdated today, they are still utilized even in cosmic ray physics [
2]. DIY Geiger counter kits, in the last years are widely available from various suppliers and can be easily purchased online or from local electronics stores. This widespread availability ensures that researchers, educators, and enthusiasts have easy access to the necessary components, making it easier to embark on projects involving muon detection without facing supply chain limitations or procurement challenges. Geiger counters are simple and generally affordable, this is another compelling motivation for their use in building cosmic ray detectors. These counters are designed to be user-friendly and relatively straightforward to assemble and operate, even for individuals with limited technical expertise or experience in electronics. The simplicity of DIY Geiger counters makes them accessible to a broader audience, including students and educators, who may not have extensive background knowledge in particle physics or detector technology but are interested in learning about and exploring cosmic rays, or incorporating cosmic ray detection into educational curricula.
We have previously developed a cosmic ray detector named AMD5 (AMD stands for Astroparticle Muon Detector, plus version number), which has been in use since 2012. This detector was initially constructed during the centenary of the discovery of cosmic rays, and a predecessor version called AMD4 was utilized during the VHANESSA expedition, which involved flying on a hot air balloon to repeat the Victor Hess experiment [
3]. Over the years, the AMD5 detector has undergone improvements, and with its latest version, we have achieved significant and interesting results (see supplementary materials). This detector has proven to be a valuable tool for teaching modern physics, especially in secondary educational settings such as high schools and colleges.
To date, more than twenty AMD5 and similar detectors have been installed in Italy, Switzerland, Luxembourg, and even Iceland as part of a larger project called “Astroparticle Detector Array” (ADA), a network that aims to detect high-energy cosmic rays [
4]. The AMD5 detector is constructed using two GMTs of Soviet production type SBM 20. Unfortunately, due to the ongoing conflict between Russia and Ukraine, these sensors are almost impossible to find. This was also a motivation for looking at the Chinese market in search of a substitute for such GMTs. That's how we discovered the DIY Geiger kits.
In an AMD5 detector, the two GMTs are stacked one over the other, and the signal from the sensors is captured and sent to an electronic board, where a logic gate "and" functions as a coincident circuit. The processed signal is then sent to different outputs, allowing for connectivity to: a computer via USB; a microcontroller via TTL logic; or a sound card.
The availability of these outputs enables the use of various software options for Geiger counters that are already available on the market, including some applications for smartphones. Additionally, we have developed our own software called AstroRad for counting the flux of cosmic particles. AstroRad serves as a data logging tool, generates graphs from readings, and offers additional functionalities to facilitate data analysis and statistics.
While we are developing a new electronics board and other improvements for the AMD5, building upon the success and capabilities of our detector, we present an alternative and simple way to obtain a replica of a similar instrument. This alternative approach provides the opportunity to construct a detector that we named AMD5ALI, leveraging the proven design and functionalities of our existing detectors, since our intention is to promote further scientific exploration and educational initiatives in the field of astroparticle physics.
2. Materials and Methods
2.1. Muon Detector AMD5 Features
Bruno Rossi referred to this type of detector as a "cosmic ray telescope" [
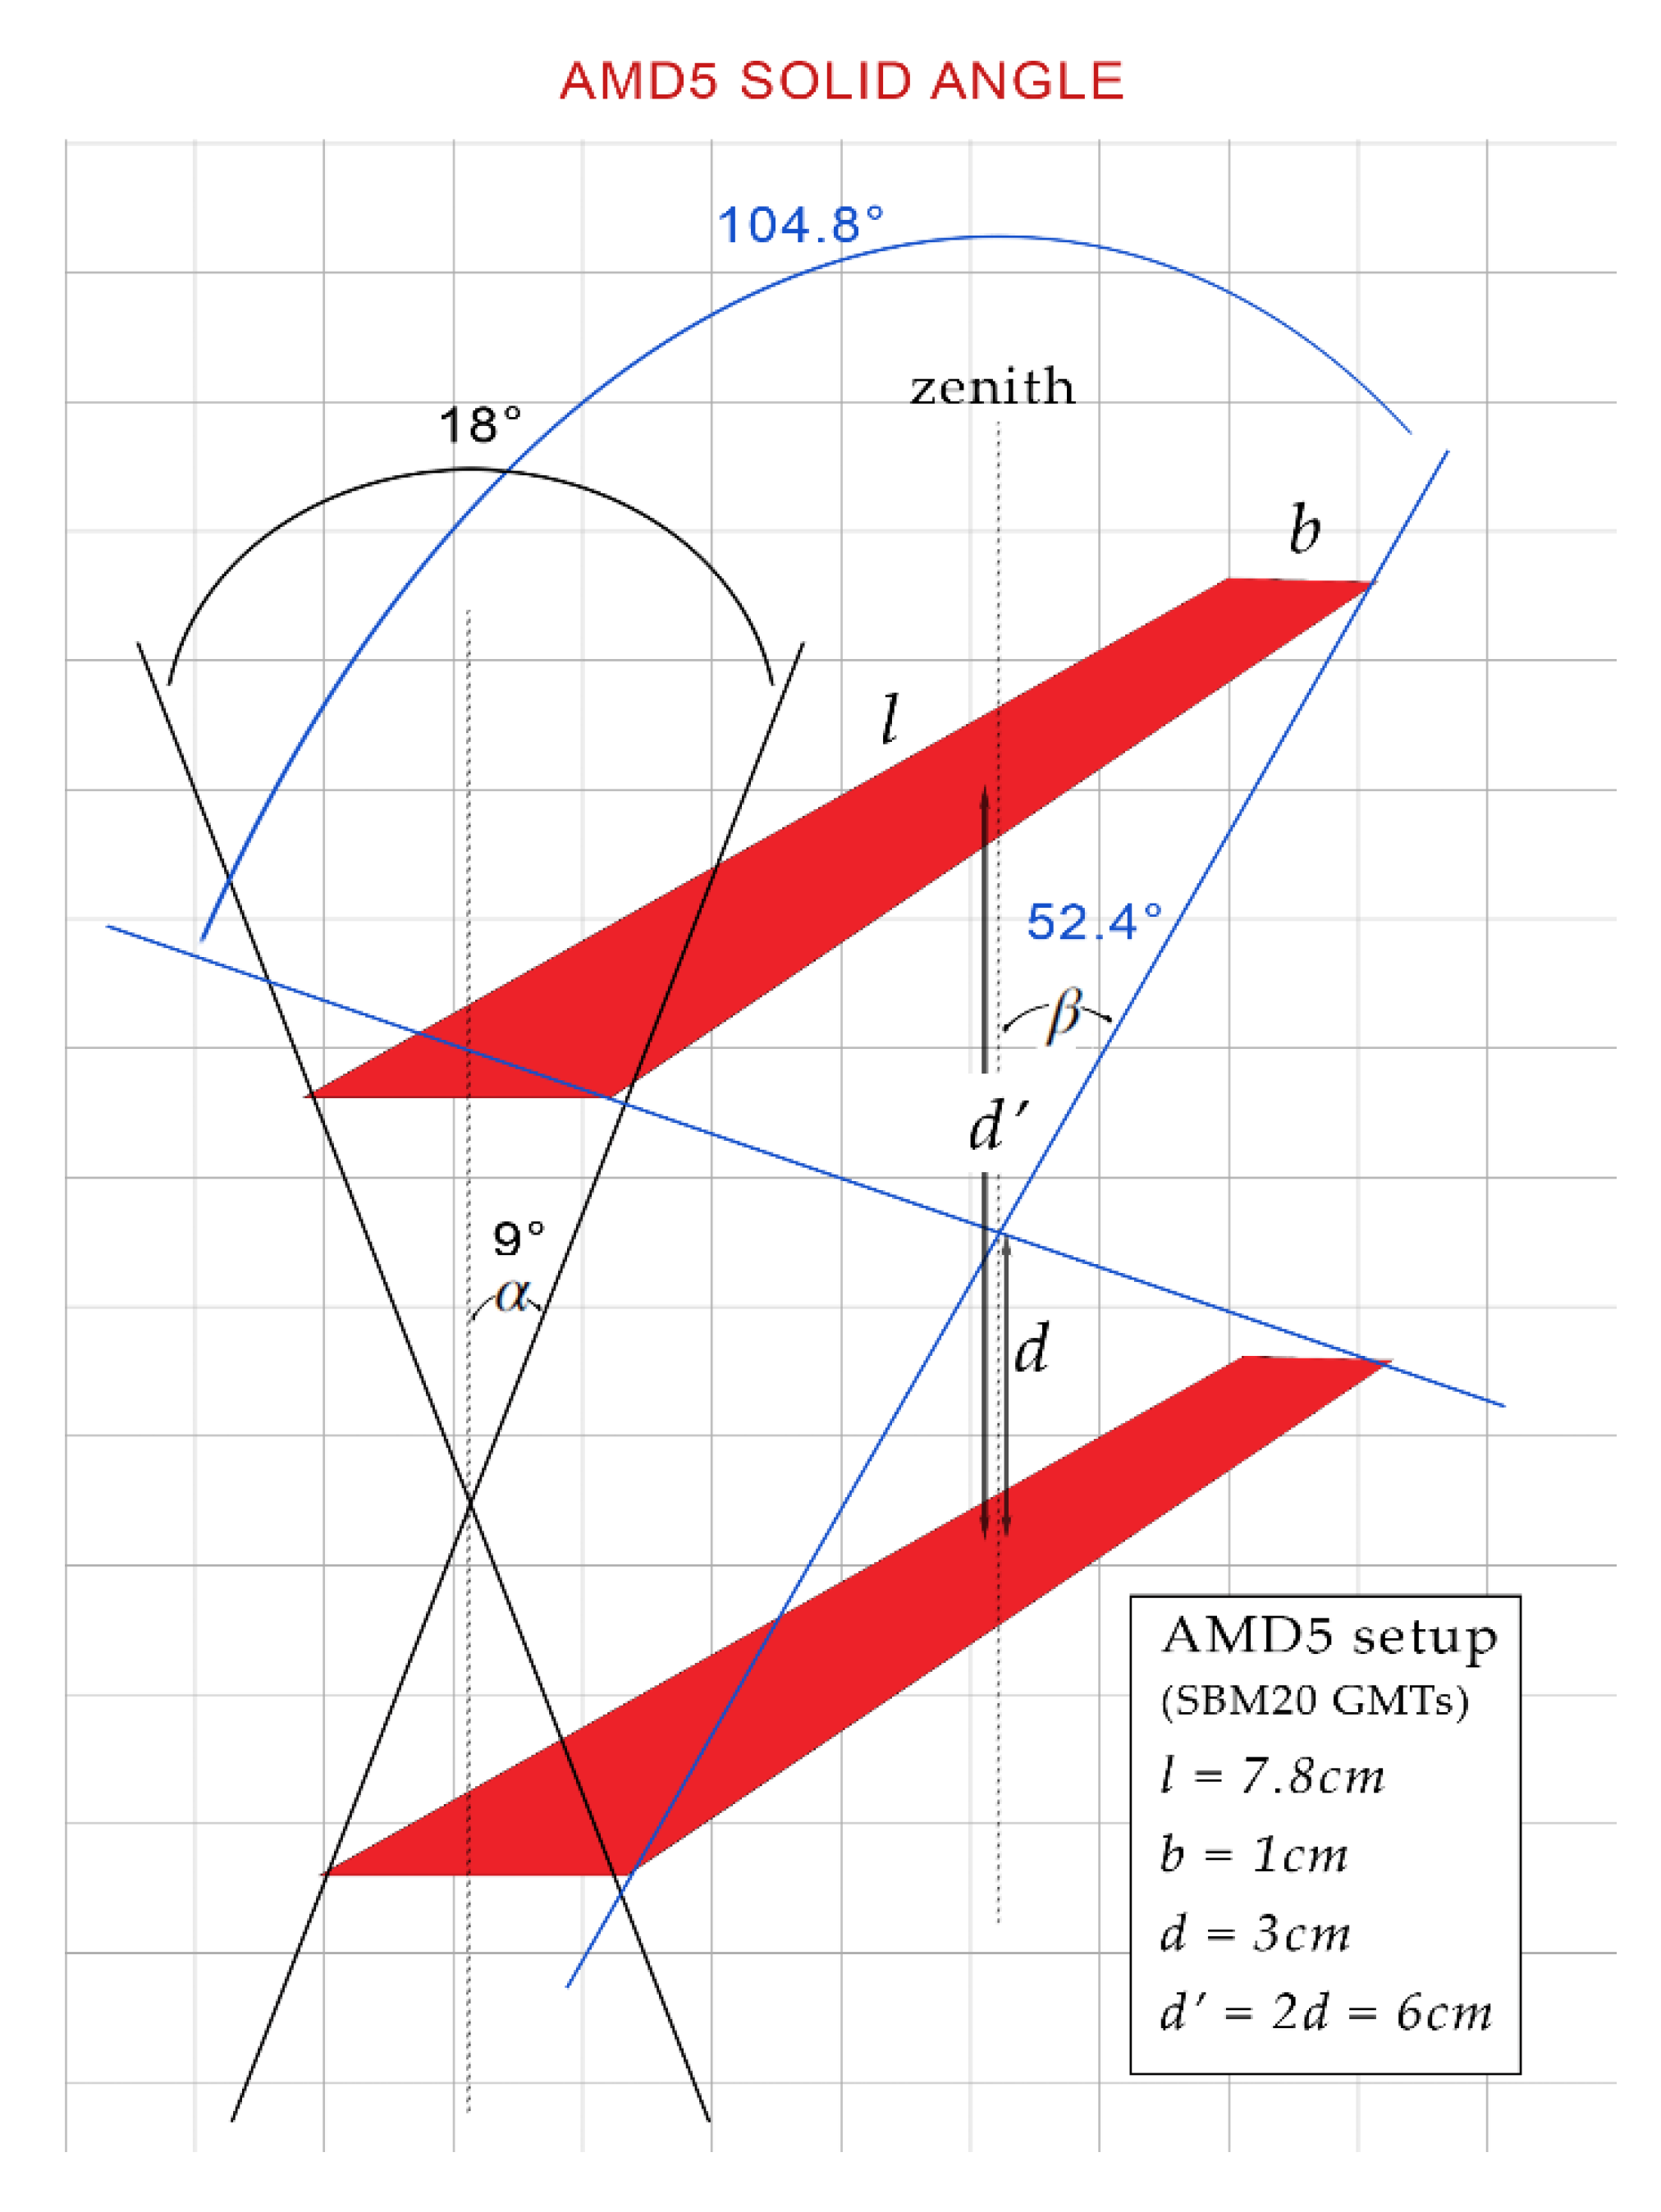
5]. Indeed, stacking two or more tubes creates a specific field of view, or geometry, for the instrument. In the case of the AMD5 detector, the distance between the tubes was arbitrarily chosen to be 6 cm. As a result, the instrument has a radial angle field of approximately 18°, given that the diameter of the GMTs is about 1 cm, and an axial angle field of view of about 105°, considering the length of the useful (sensitive) GMT part is 7.8 cm. Using the following equation, is possible to calculate the solid angle view of the detector [
6]:
where “l” is the length of the tubes, “b” is the width (diameter), and “d” is the semi-distance. In this way, we have found that the telescope "sees" a solid angle of approximately 0.52 steradians (sr) (
Figure 2).
As we make several detectors with different configurations, we have an online tool to calculate the solid angle for any type of detector (see
https://www.astroparticelle.it/login/page10_eng.asp). This tool is also implemented in our own ADA app for Android smartphones. As previously seen, particle detectors are designed according to the coincidence method to record the passage of a particle in two or more interaction channels. This method helps to distinguish genuine cosmic ray events from natural background radiation. Since the pulse from a GMT is usually quite short and noisy, it is common practice to extend the duration of the pulse. Such a time is called the "coincidence window". If the two pulses arrive overlapping, the event is considered a cosmic particle or a muon. One of the initial considerations was determining the timing for the coincidence window between the signals from the two GMTs, as an excessively long time window would result in recording numerous environmental particles.
The first prototype made use of a coincidence time window of 100 ms. Using a time between 20 and 100 ms, the results provided substantially similar outcomes. A test involving the placement of weak radioactive elements in close proximity to the detector (a few tens of centimeters away) did not result in a significant increase in coincidences.
Subsequently, the coincidence timing for the AMD5 detector was adjusted to the current value of approximately 60 ms. Over time, we observed that some sites where AMD5 detectors were installed had elevated levels of radon. This element is problematic because it wraps the GMTs, and its decay products generate particles that can cause false coincidences. This sneaky effect introduces a modulation in the cosmic ray flux. To address this issue, an additional time window of approximately 190 μs (0.2 ms) was introduced. This value corresponds about to the dead time of the GMT (SBM20); therefore, it is the minimum possible value. Thanks to this modification, the issue related to radon has been significantly mitigated, although not entirely solved.
To calculate the rate of accidental coincidences, we can employ methods that have been traditionally used when Geiger-Müller tubes (GMTs) were extensively utilized for the study of cosmic rays. Janossy describes two equivalent methods, which in our case can be expressed as [
7]:
where A is the number of false coincidences per second, N is the GMT rate (cps), and τ is the acquisition time. Using the GMT model SBM20, we have N = 0.4 ± 0.01 cps. Therefore, with τ = 60 ms, we obtain A = 0.02. In contrast, for τ = 0.2 ms, we calculate A = 6.4 10
–5. This indicates that with the first time window (let’s call it CW1), the rate of false coincidences (regarding N) is approximately 5%, whereas with the second time window (CW2), the rate significantly decreases to 0.016%.
Table 1 shows the data for both detectors.
These calculations must always be considered with caution. "False coincidences" can also be produced by different but contemporary cosmic particles. For example, two muons can affect, at the same time, the two sensors with different inclinations, and other secondary (tertiary) particles can be produced in the detector by scattering or recoil interaction with the metal parts of the detector itself.
The motivation for maintaining two coincidence windows relies on the dimensions of the detection surface, which are relatively modest compared to professional muon detectors. For normal operation, we have chosen to use the larger coincidence window as a compromise to achieve a satisfactory event rate and obtain reliable scientific results. However, for optimal performance in focused experiments, we recognize the need to use the shorter available coincidence window. The average flux of cosmic particles measured by the AMD5 detector is approximately 5.3 cpm sr with the standard time window (CW1) of 60 ms and about 1.2 cpm sr with the minimum time window (CW2) of 0.2 ms.
2.2. The Zenith Angle Dependence Test
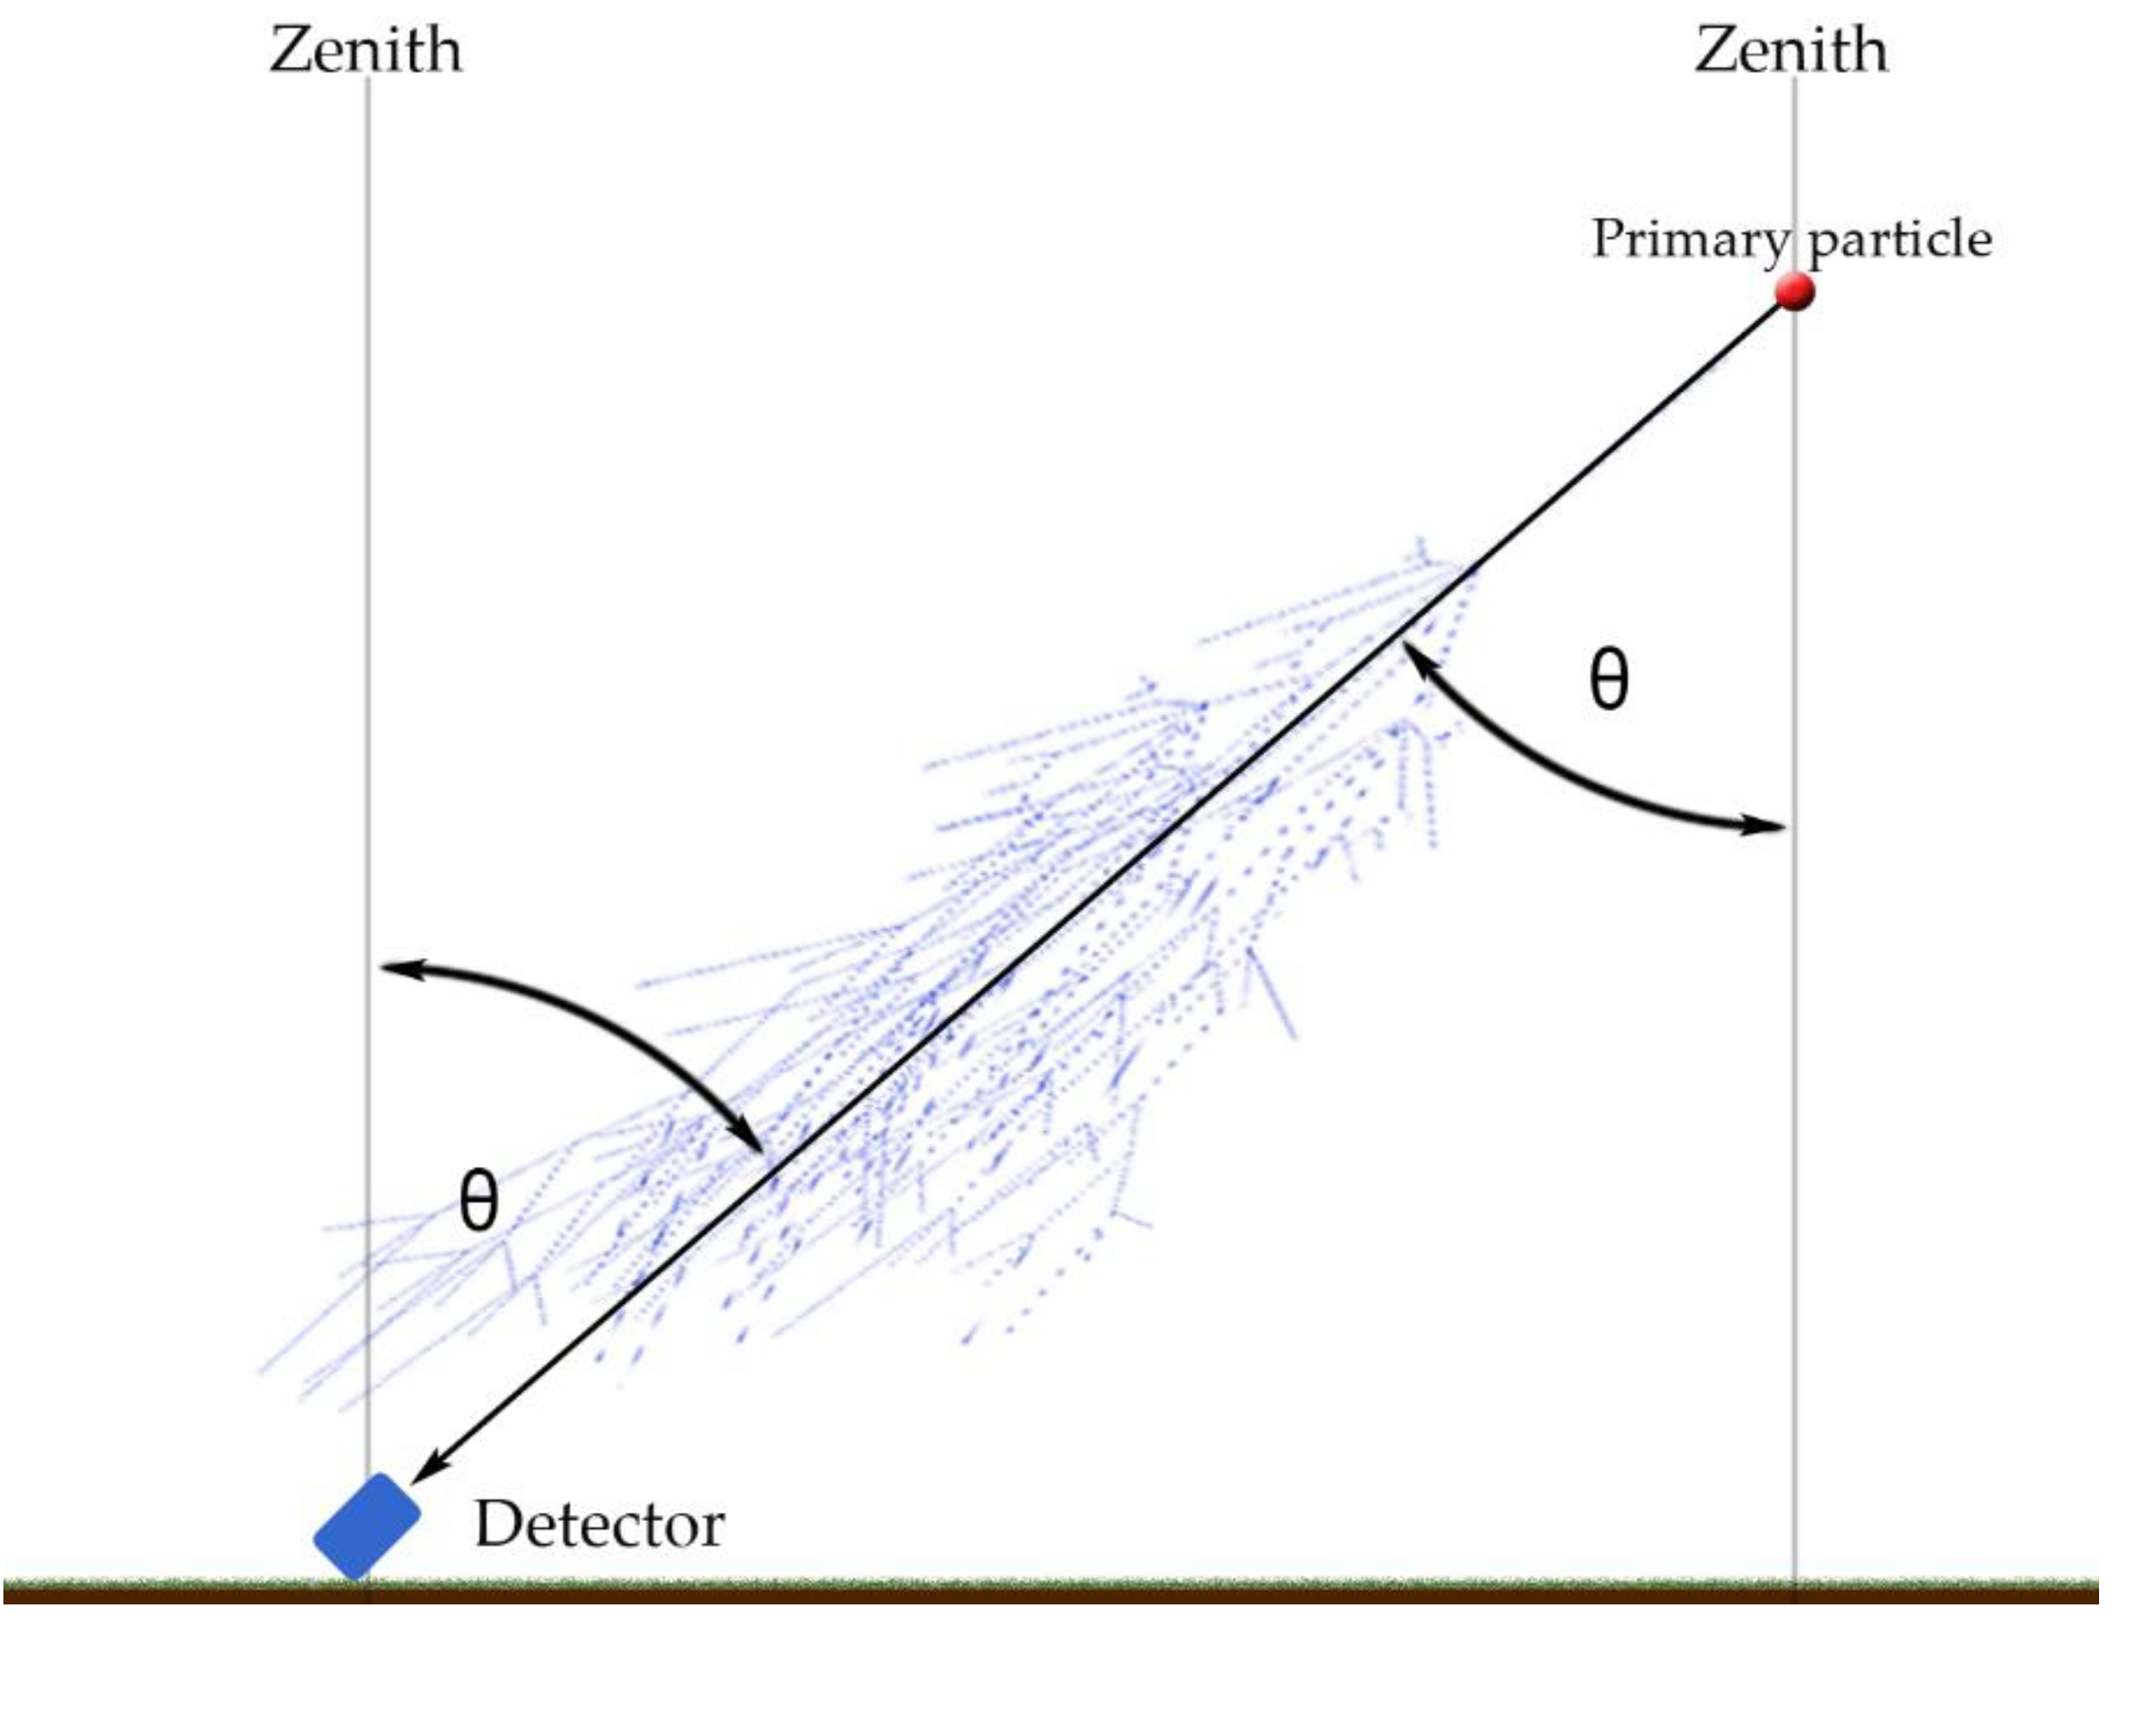
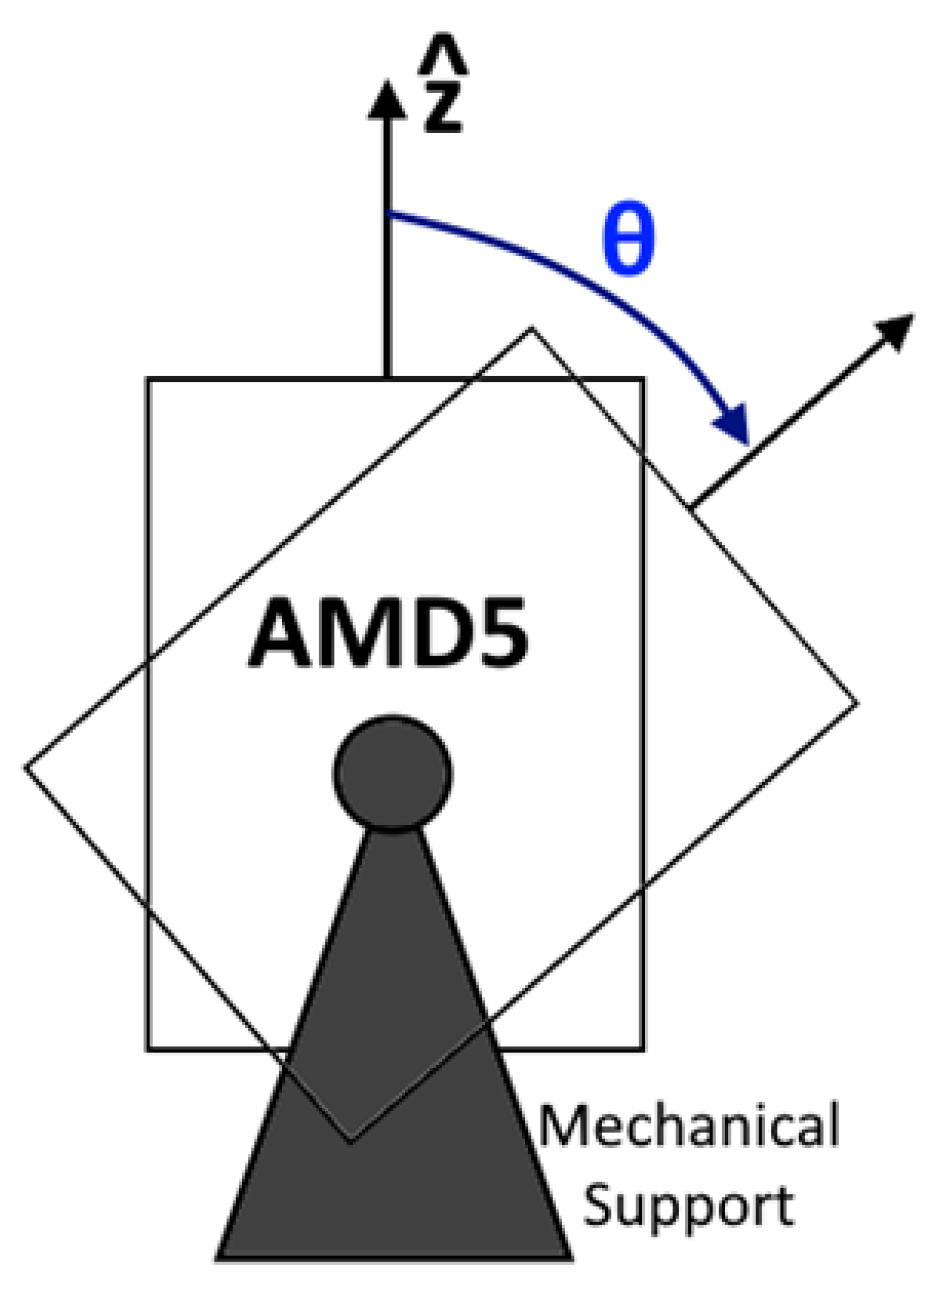
The intensity of cosmic rays is strongly dependent on the Alt-Azimuth system of coordinates. If the orientation with respect to the azimuth can be neglected (apart from the east-west effect, which also depends on the latitude), the orientation with respect to the zenith angle is instead dominant. The more their trajectory is inclined, the more matter particles have to pass through, and by losing their energy, they become extinct more quickly (
Figure 3).
Cosmic rays therefore decrease in number with an increase in the zenith angle. For certain angles of incidence and at high altitudes, even the curvature of the earth must be taken into account. The intensity of the measured flux depends on the following relation [
8]:
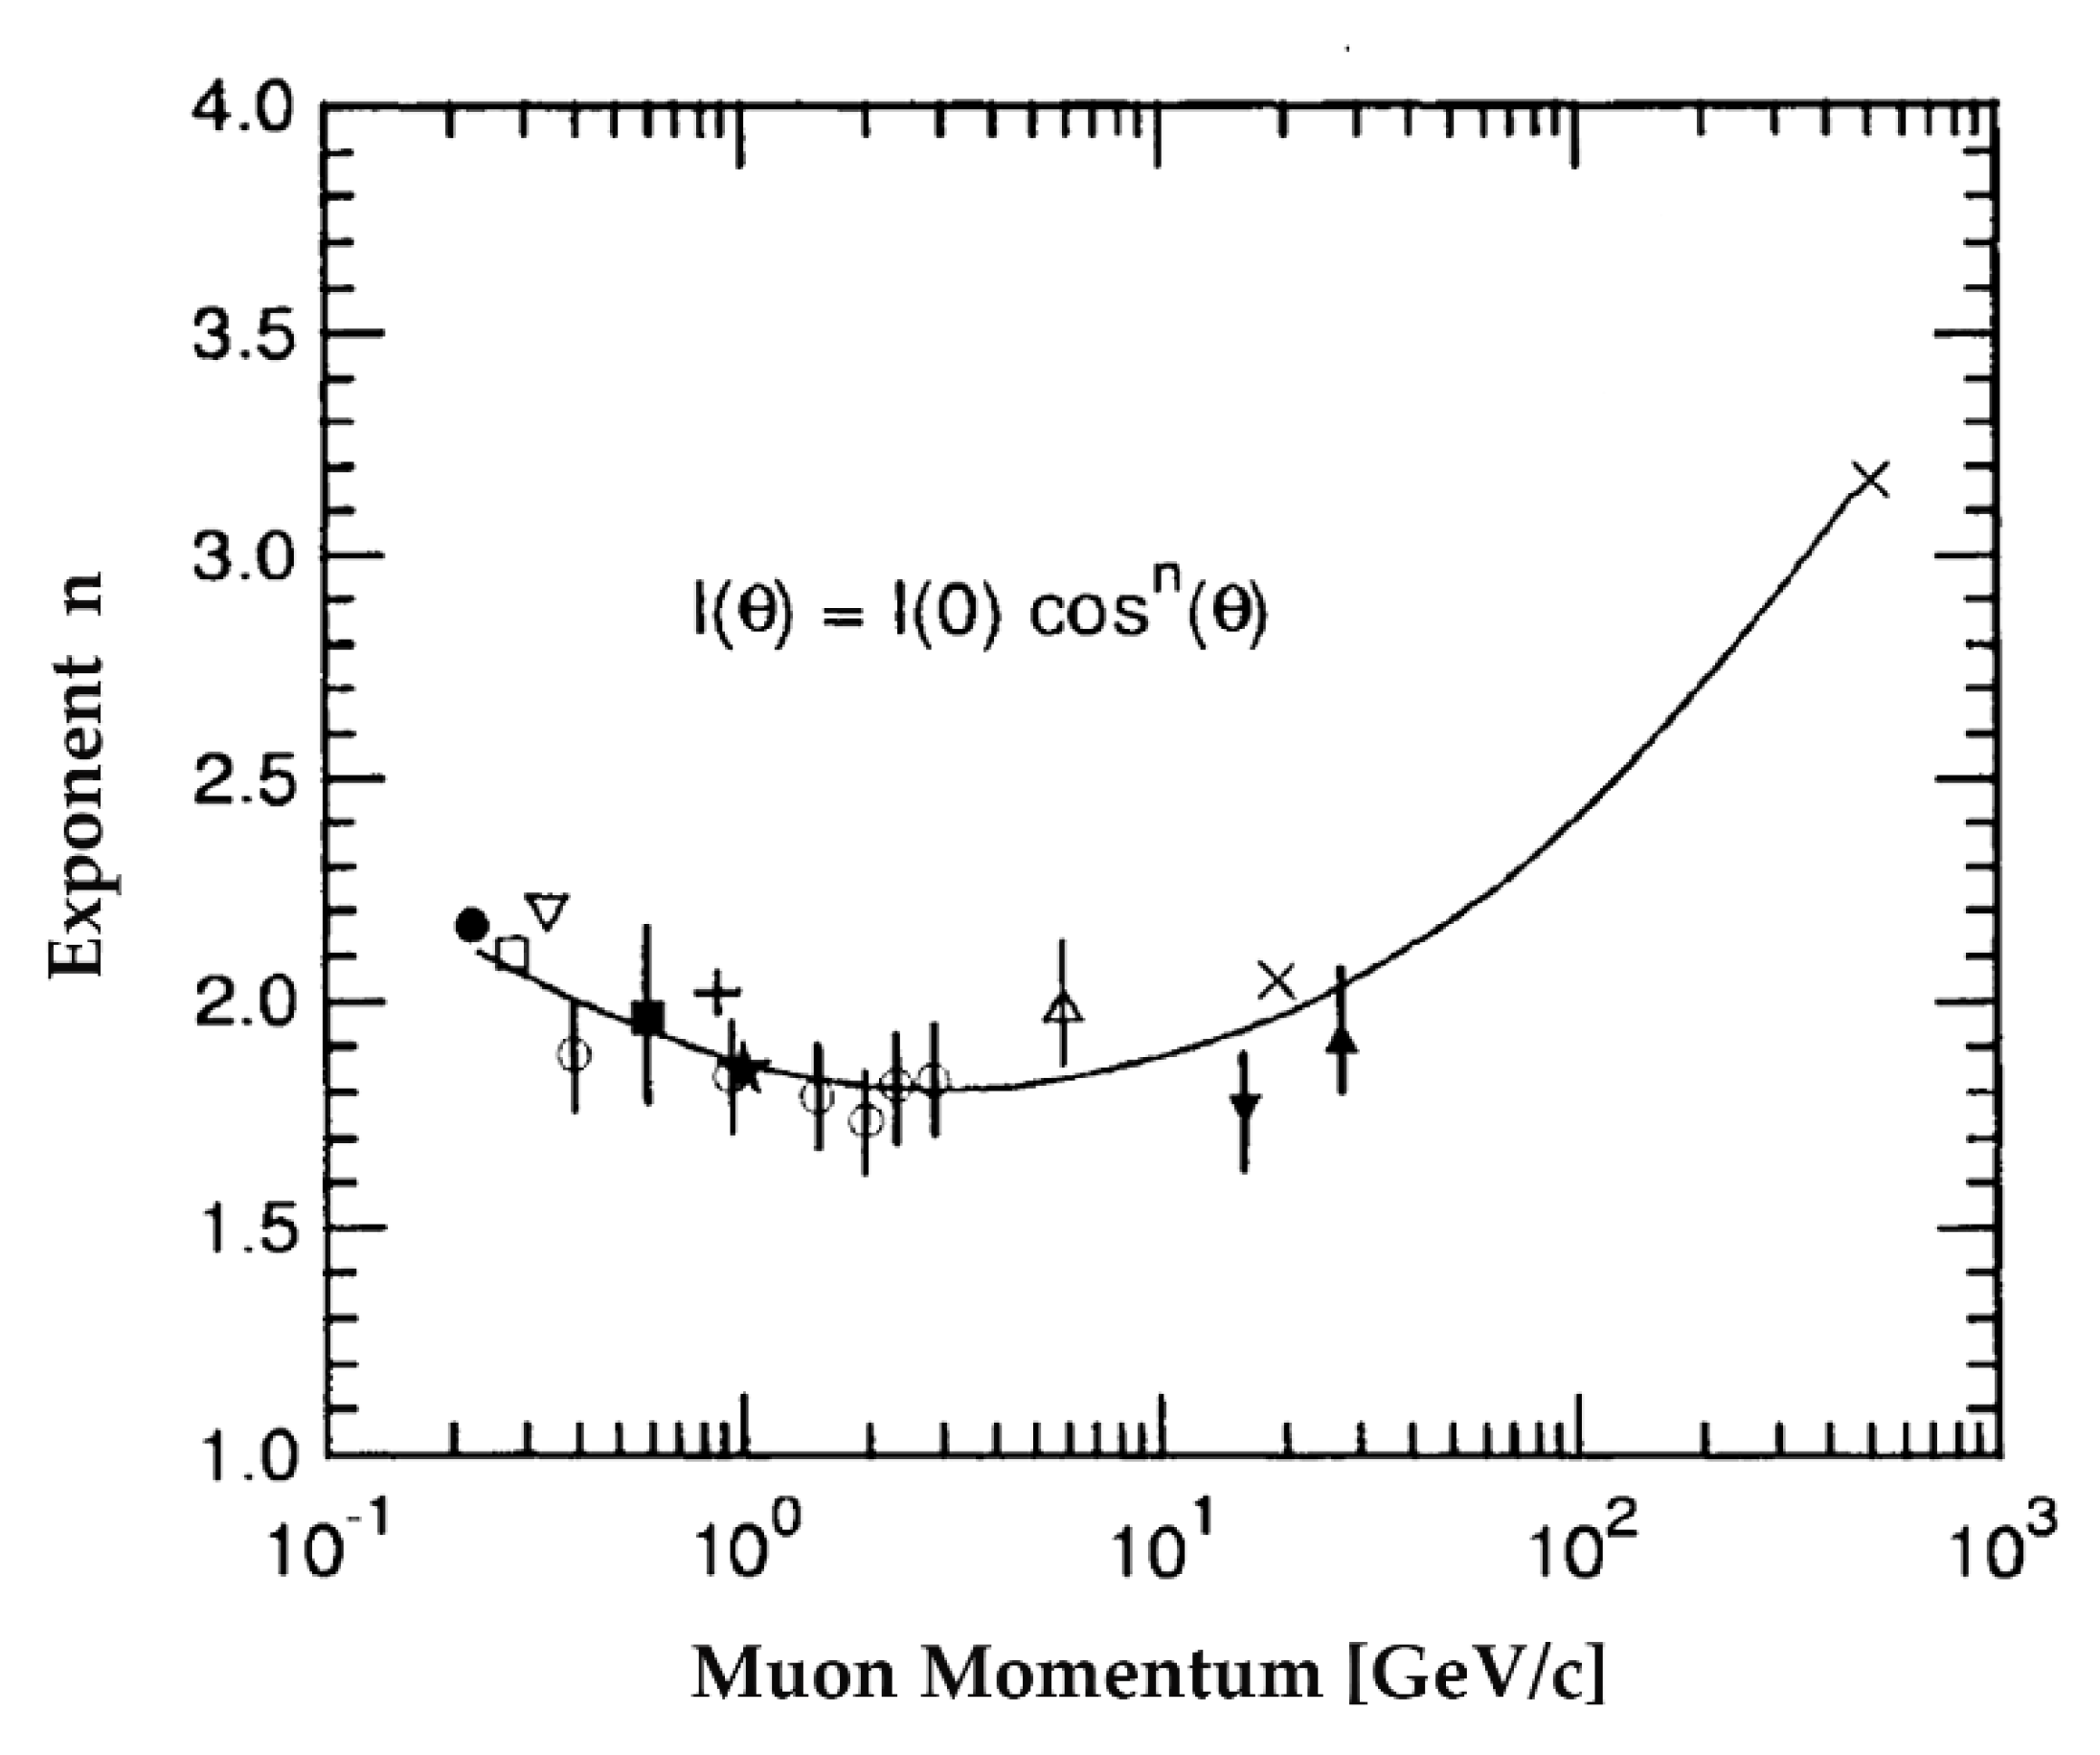
where the exponent “ni” is a function of: the energy, the kind of particle, and the thickness of the air, which is indicated as interaction depth (X), which is measured in gcm
−2. Generally this proportionality can be approximated to:
For neutrons, “n” is approximately equal to 3.5 (1971, Heidbreder et al.). For electrons, experimental measurements indicate a value of “n” equal to 2, where it becomes 3.6 for particles with energies equal to or greater than 100 MeV. For muons, which are the particles of our main interest, the issue is more tricky. Muons arise from the decay of pions and kaons; thus, their production depends on the interaction with the air of their progenitors, which have different behaviors; furthermore, the energy spectrum of muons at sea level is very broad. In any case, the expression (4) is still valid; however, for muons, “n” is directly proportional to the momentum (ρ). For example, if the average of ρ is in the range of 1 GeV/c, “n” is equal to 1.85. At sea level, for muons around 3 GeV of energy (let's say their minimum value at sea level), the distribution can more simply be considered proportional to the cos
2 of the zenith angle θ (
Figure 4).
A simple and valid test to check the good functioning of any muon detector is to collect the rate of muon at a zenith angle equal to 45° and in a vertical position (θ equal to zero). As cos
2 (45°) is equal to 0.5, the ratio between the two measurements must be equal to 0.5. In
Table 2, we show the response for the AMD5 detector with both its coincidence windows for 250 counts (minutes).
This test confirms that using CW2, the recorded value is pretty much close to the expected result, while using the standard window CW1, the ratio exceeds 0.5 by 46%. As discussed earlier, this discrepancy arises because CW2 allows natural radioactivity to influence the counts, although this effect can be mitigated by extending the counting duration. This example illustrates that, in some types of experiments, a shorter coincidence window is indeed a better choice.
2.3. DIY Geiger Counter Kits
The two commercial DIY Geiger counter kits used for this instrument come from one of the biggest Chinese online stores (aliexpress.com, thus the name AMD5ALI). They don’t have a particular code of identification but can be easily found searching for “Geiger counter kit” and are sold as an assembled or unassembled version. We suggest buying the assembled version unless you need extra experience with electronics mounting. The assembled kit is ready to use after simple operations, one of which is the insertion of the GMT in its dedicated slot. The GMT is labeled as J305 (also M4011). We were not lucky to contact the manufacturer of these sensors, so the only data available are those published by the sellers (see
Table 3).
For unknown reasons, there are two versions under the same code that differ only in their length, one 90 mm and the other 107 mm long, while the diameter is 10 mm for both. The former is included in these kits, while the latter has exactly the same dimension as the model SBM20 made in Russia, and since these days it is impossible to buy items from Russia or Ukraine, that model (long version) will likely be the choice for our next AMD5 detectors. Alas, the official electronic diagram is not available; however, it is possible to find some hints on the web [
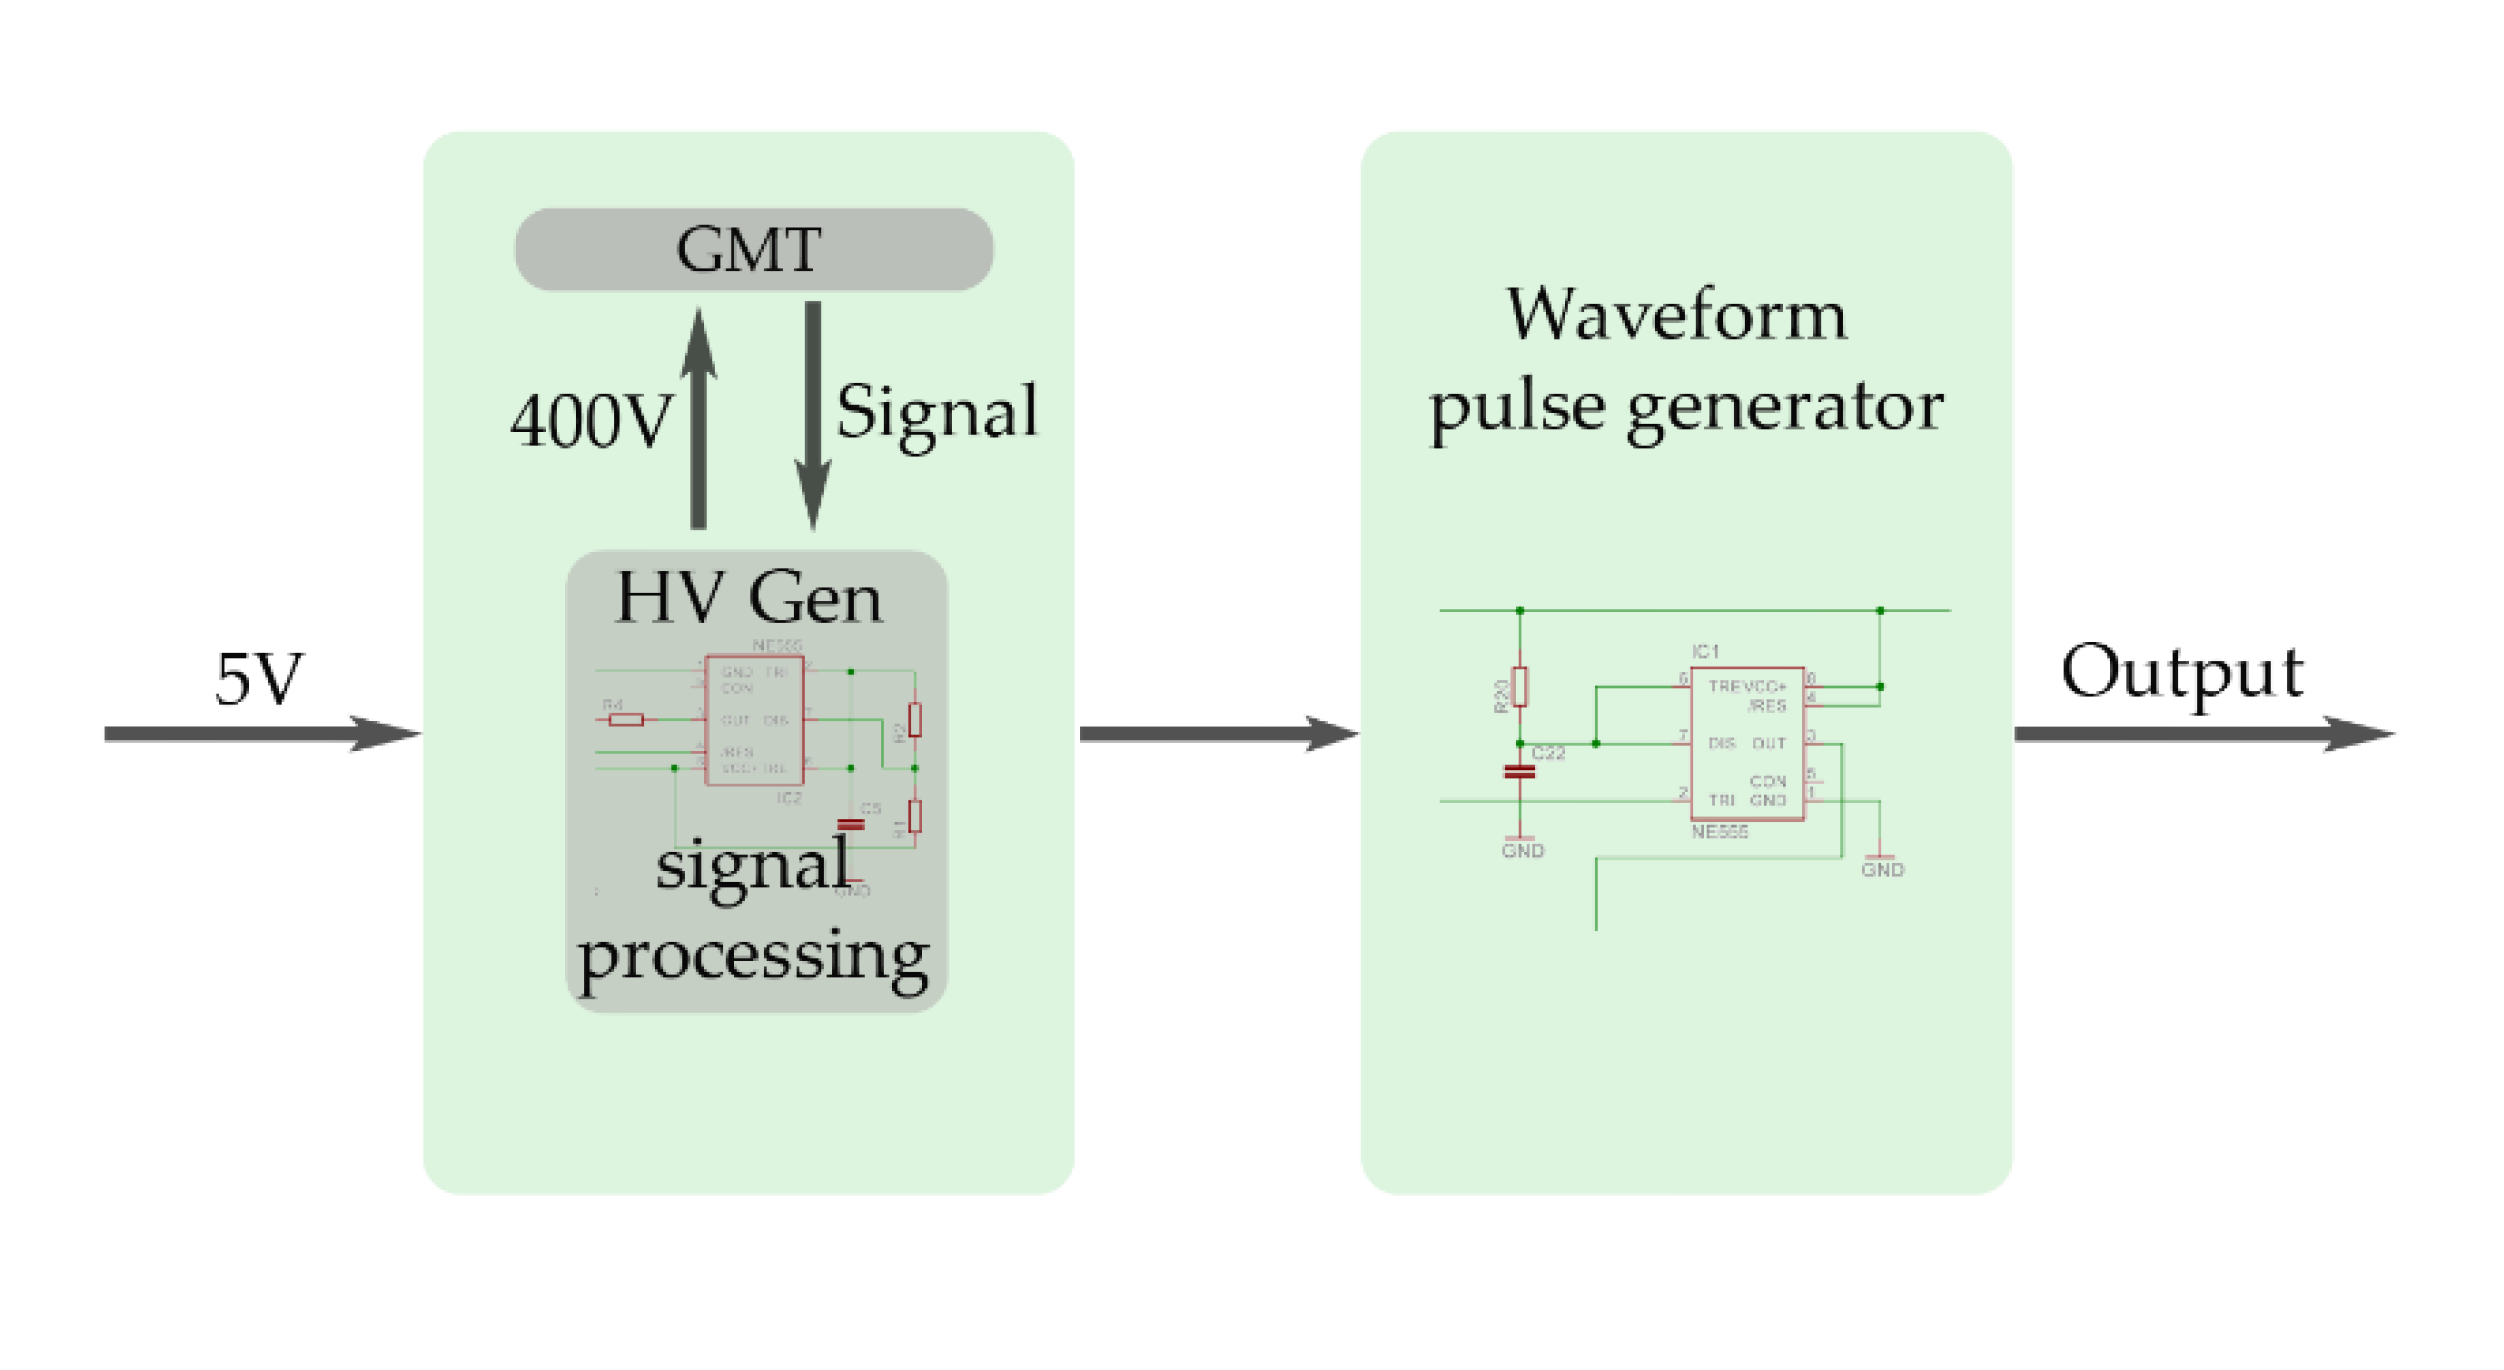
9]. The electronics of the counter provide the power source for the GMT (around 400 V) and include a waveform generator for the output signal (
Figure 5).
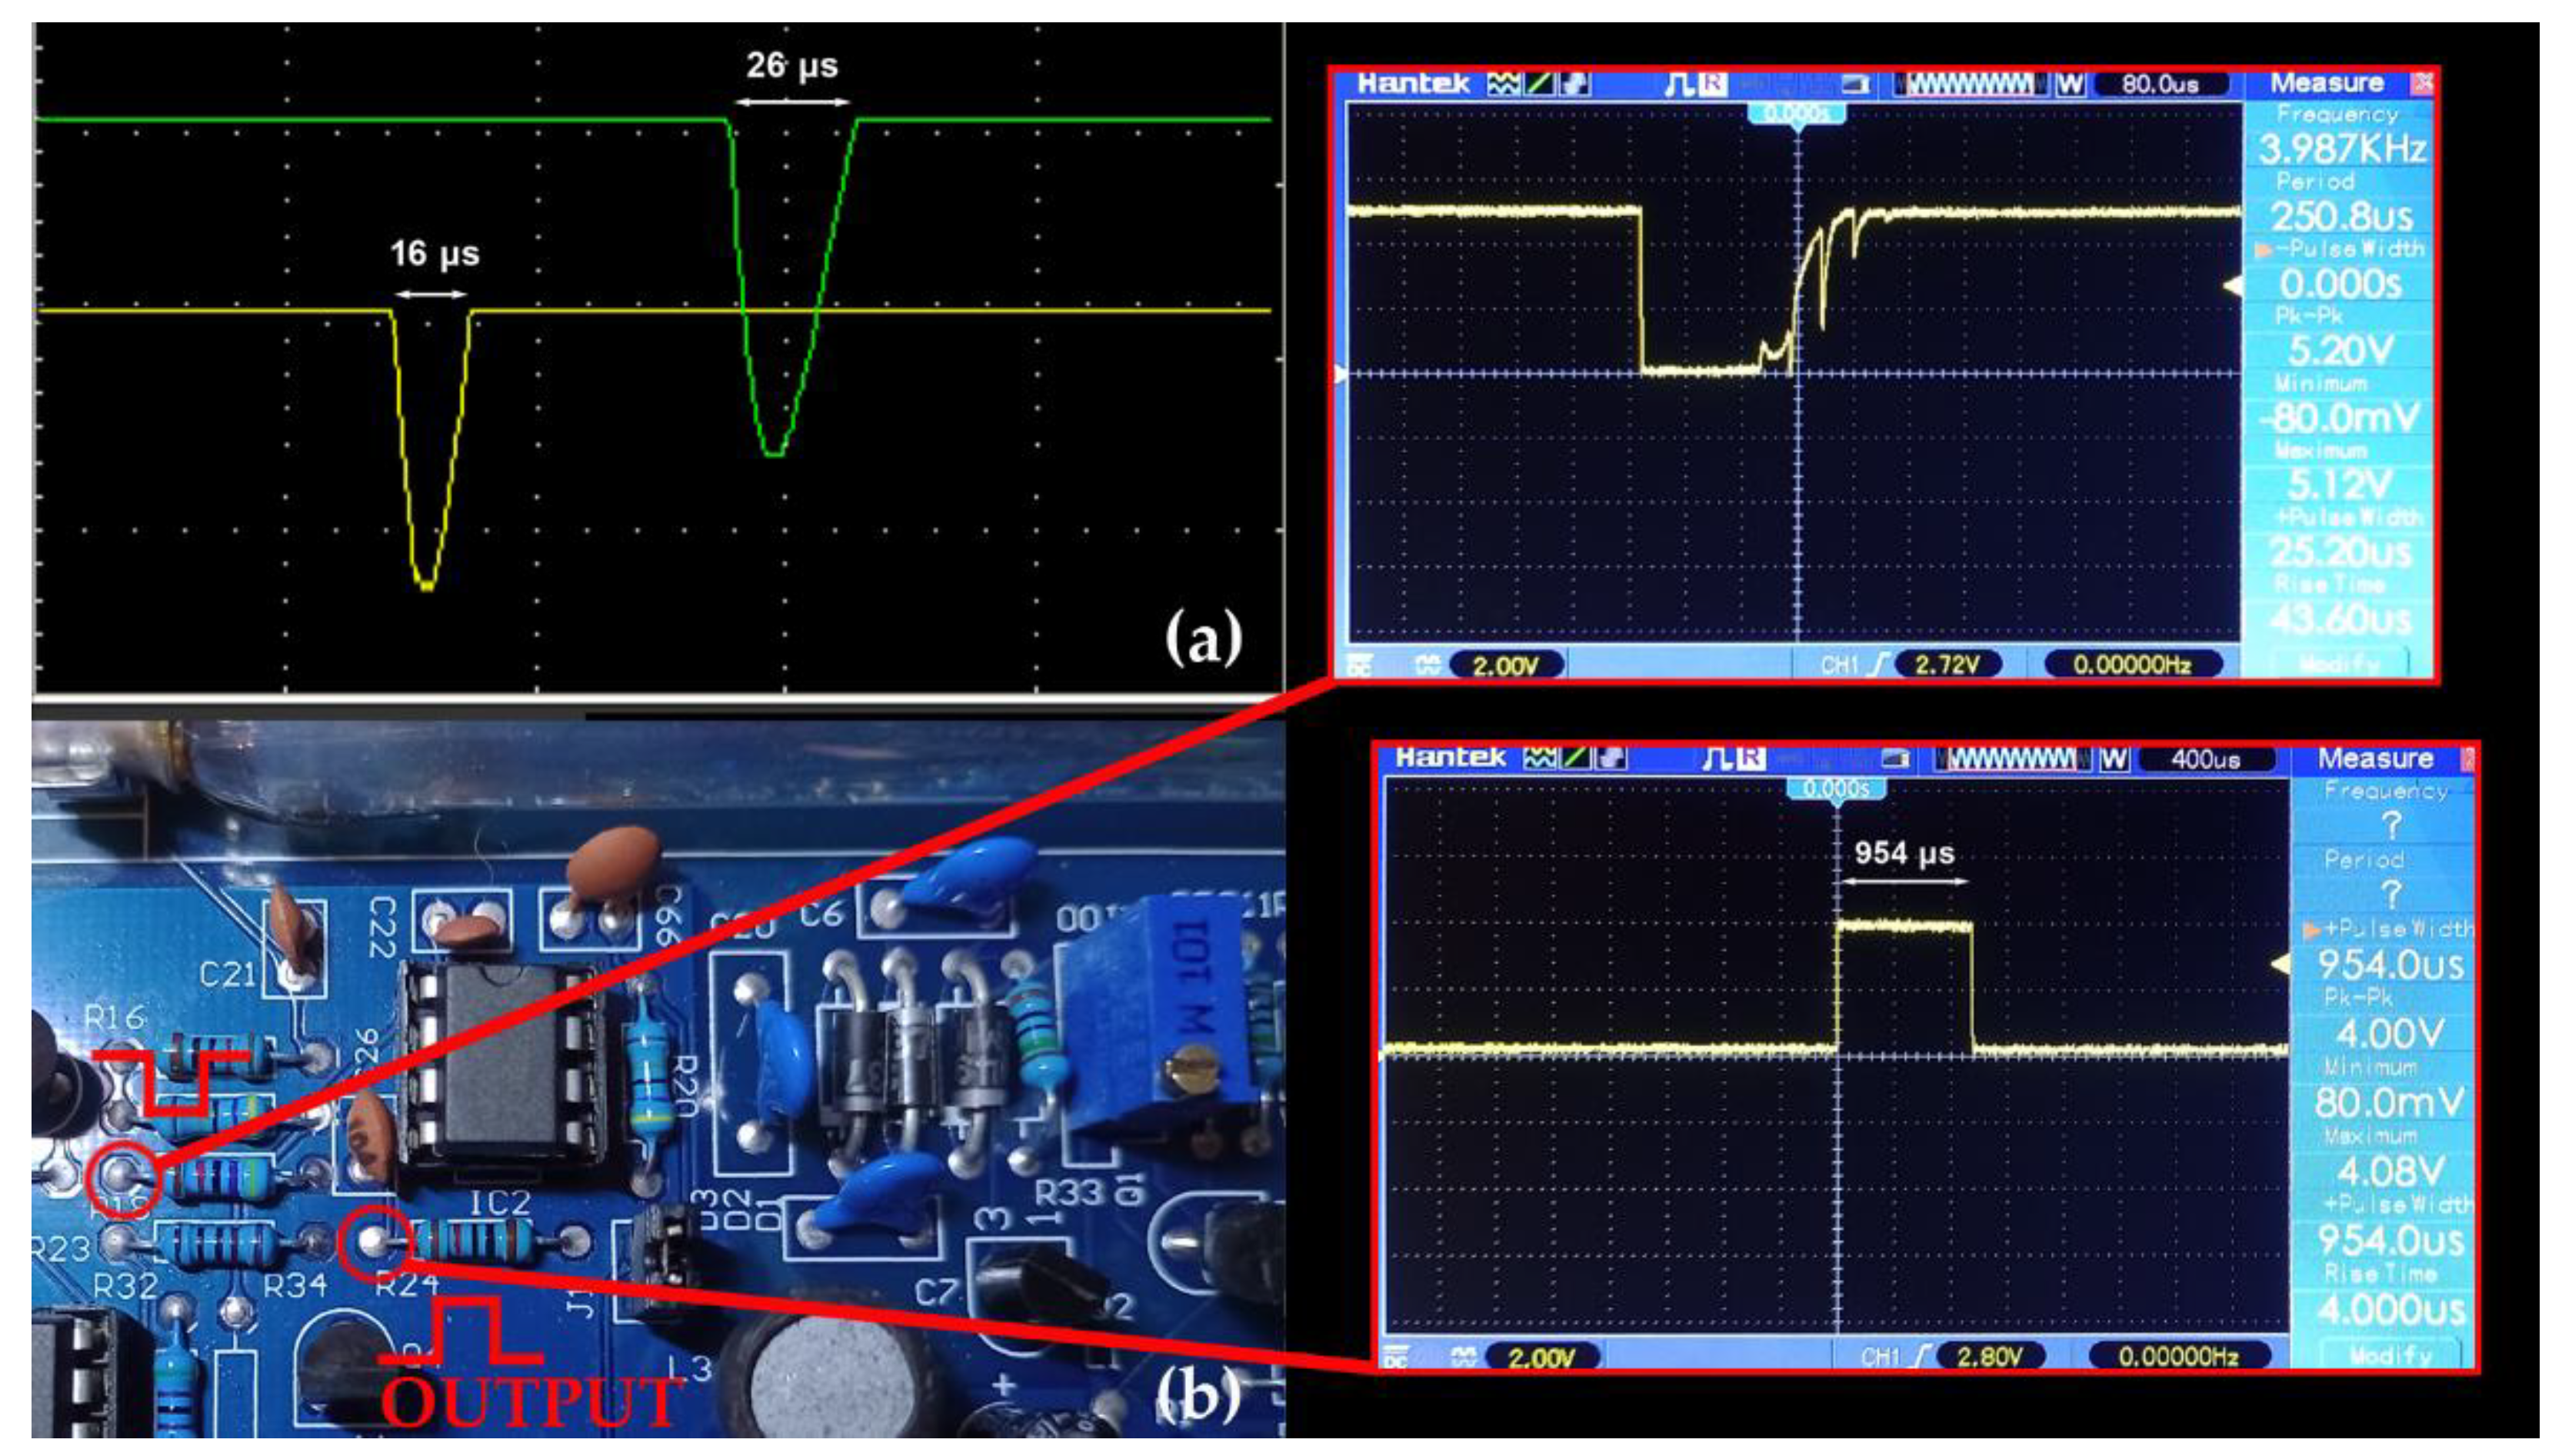
We have tested the signal output features of the GMT sensors with an oscilloscope, and the results are shown in
Figure 6. Each tube's signal is very clean, and the pulse form is nearly triangular, with a very short width of around 20 μs. The output signal from the electronics is a square-wave pulse with a width of about 1 ms (exactly 954 μs). In the assembled version, there is no need for calibration, while the unassembled kit needs the calibration of the high-voltage source and a control on the proper working of the GMT pulse signal [
10].
2.4. Hardware Transformation into a Muon Detector
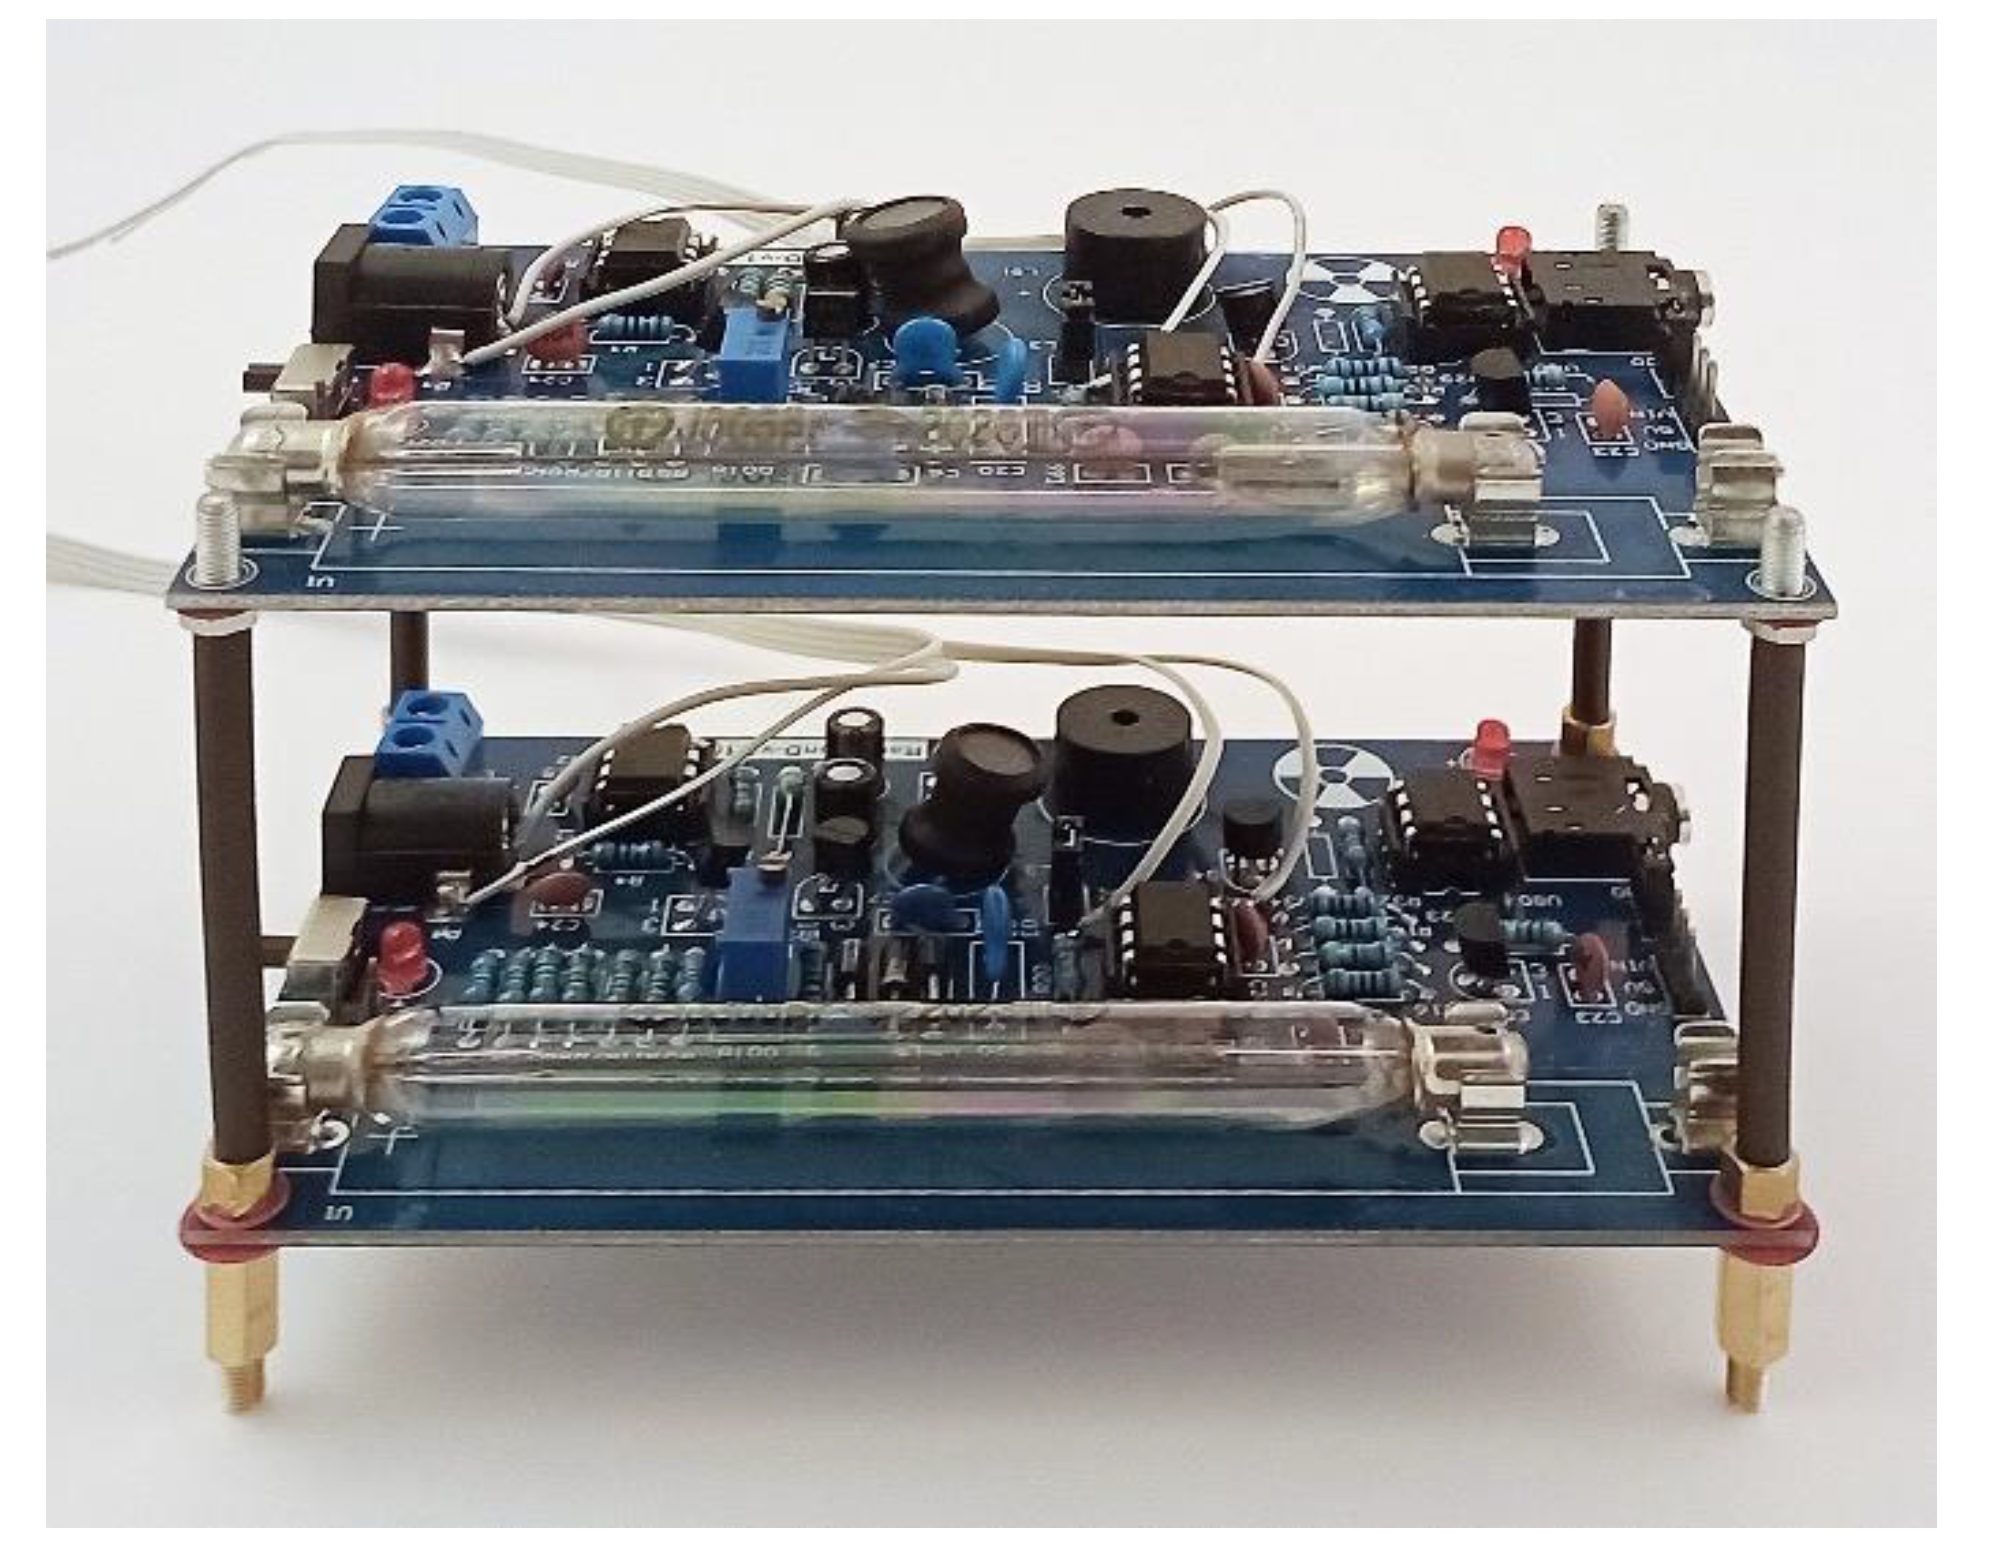
The modifications required to transform the device into a muon detector are relatively straightforward and can be completed quickly in practical terms. After assembling and confirming the proper functioning of both individual counters, it is advisable to proceed with the following tasks by removing the GMTs to prevent any damage. First, four MA3-type screws, each 6.5 cm long, are needed, along with a thin rubber tube, sheath, or tape for insulation. These screws are used to assemble the two boards together and should be wrapped with a sheath or tape to ensure electrical insulation. Care should be taken to ensure there is no connection between the screws and the GMT clips (
Figure 7).
In order to have a solid angle of 0.5 sr as for the AMD5 setting, the distance between the two GMTs should also be 6 cm and can be adjusted by moving the bolts. Anyway, one can choose a different solid angle (e.g., 1 sr), according to equation (1), and therefore a different distance between the two boards (GMTs). The second part requires the construction of the coincidence circuit that is the core of a muon detector.
2.5. The Coincidence Board
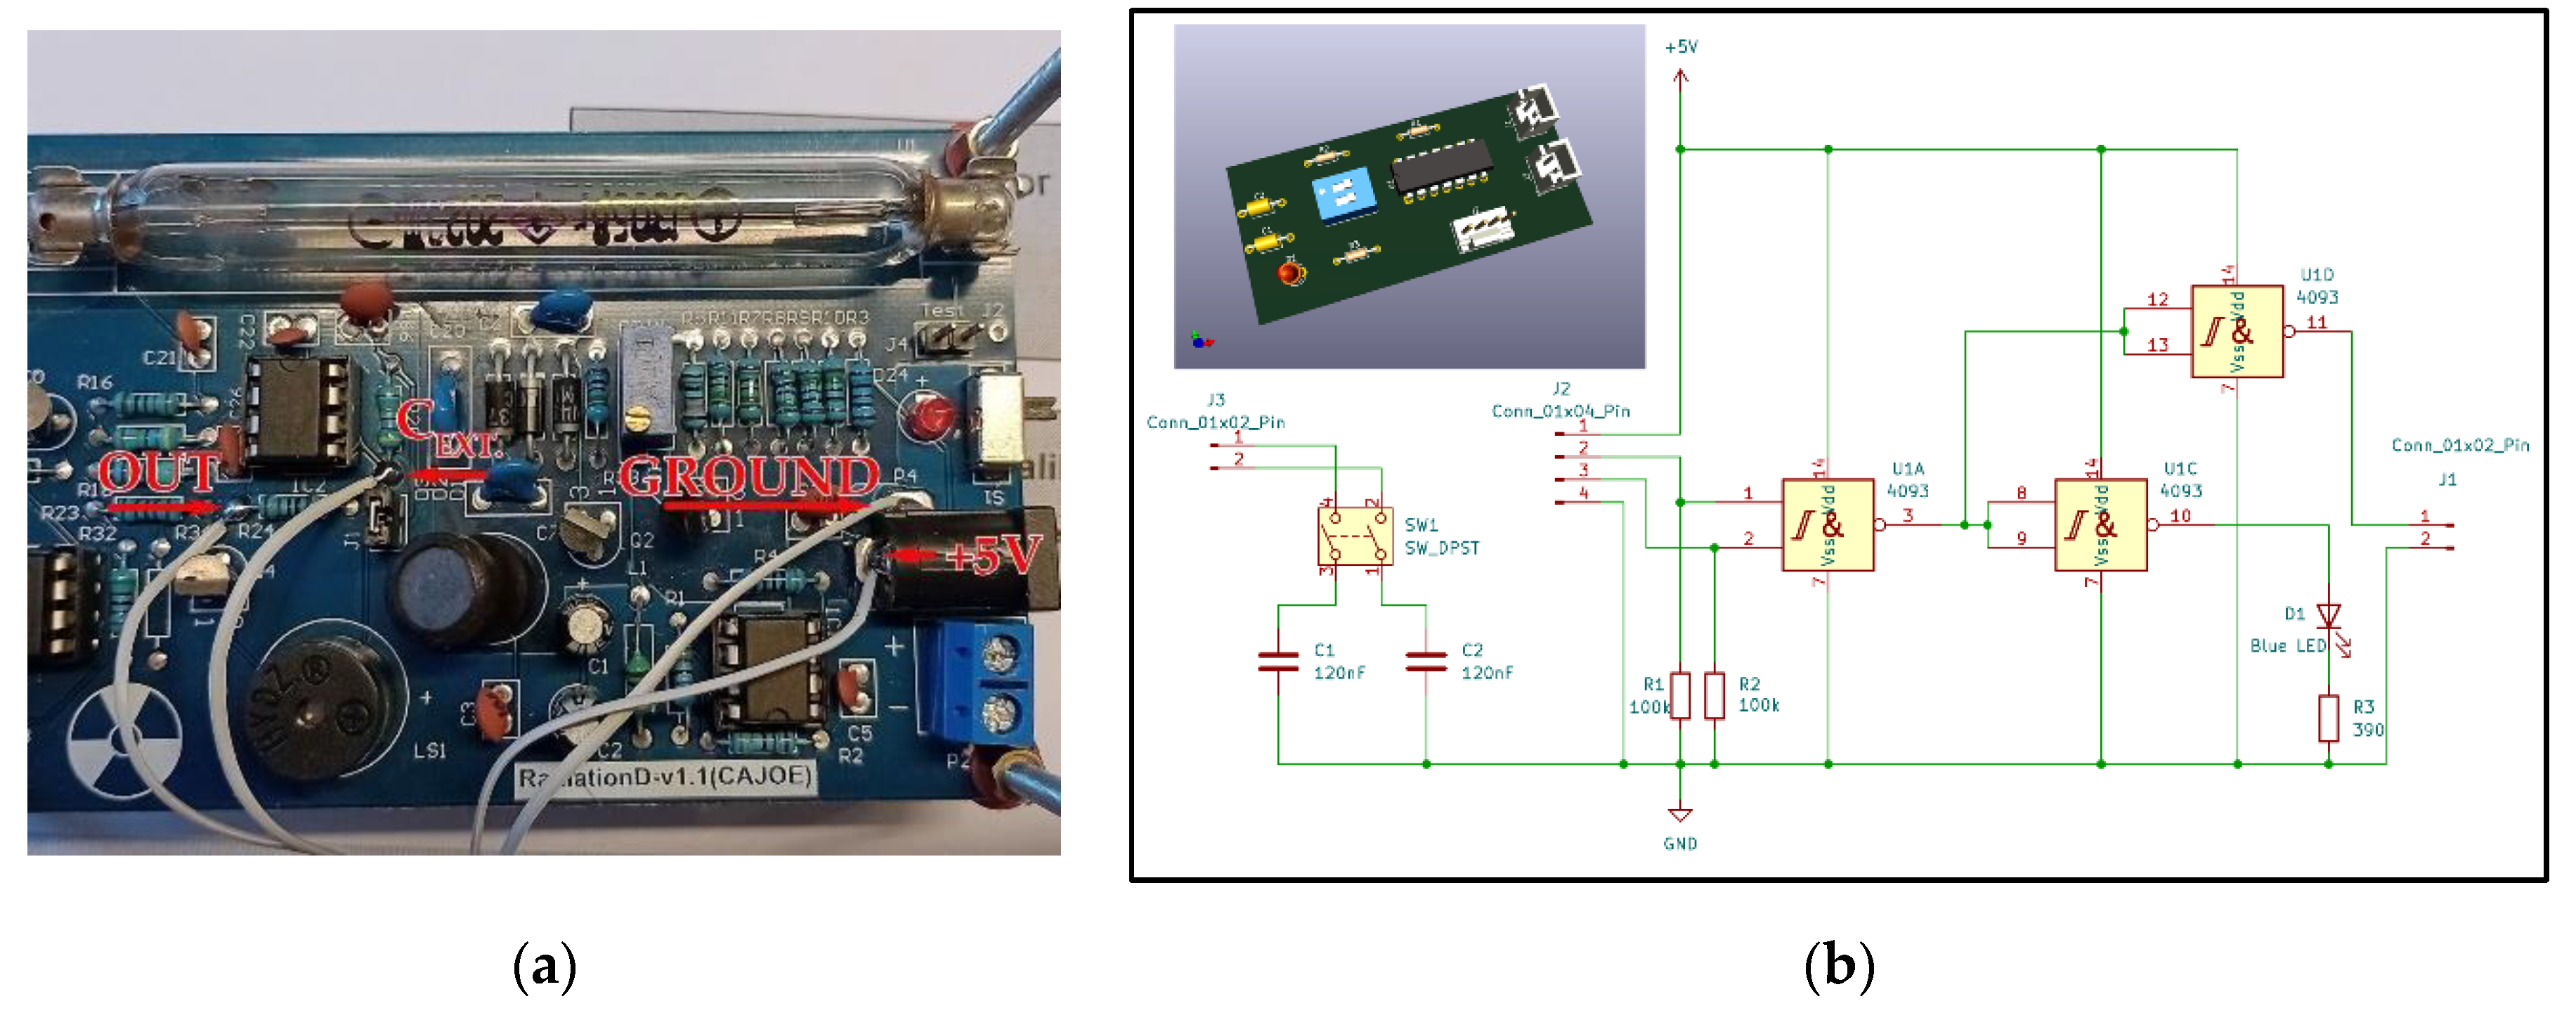
This circuit consists of an “and” logic gate, as previously described. The electronics use an IC 4093, which is a quadruple Schmitt trigger NAND gate. The Schmitt trigger configuration usually assures a very clean square wave, even though in this case it is not required as the pulse is already squared. From the two boards, it is indispensable to solder four wires: Vcc (5V), ground, pulse output, and capacitor reference (optional in order to get the second time window), as shown in
Figure 8a. The whole schematic, with a possible board realization, is shown in
Figure 8b.
IC 4093-A works as an NAND gate, while IC 4093-C and IC 4093-D (IC 4093-B is not used) work as independent NOT/buffers; the first drives an LED, and the second is actually the output of the muon detector. In normal operation, when the electronics of these Geiger counters detect a particle, they provide an output consisting of a square pulse with a width of 1 ms. So the detection of a cosmic particle consists of two pulses arriving simultaneously from both counters within 1 ms. As previously mentioned, the AMD5 offers two selectable coincidence windows. We can replicate almost the same features in the AMD5ALI by adding two 120 nF capacitors. This allows us to achieve two coincidence windows, one of 1 ms and the other of 60 ms. It is also possible to shorten the first window to 0.2 ms (as in the original AMD5), but this would require replacing a capacitor on the GMT counter board, which we believe is not necessary as the results in terms of muon detection would be quite similar, according to the previous tests.
Sw1 is the selector used to switch from the short coincidence window to the long one. As can be seen, the switch adds the two capacitors (C1 and C2) in parallel to the original capacitor mounted on each GMT board. Since all the boards are powered by a 5V power source (any capable of a few hundred mA), the output is compatible with any sort of development board or microcontroller, Arduino included.
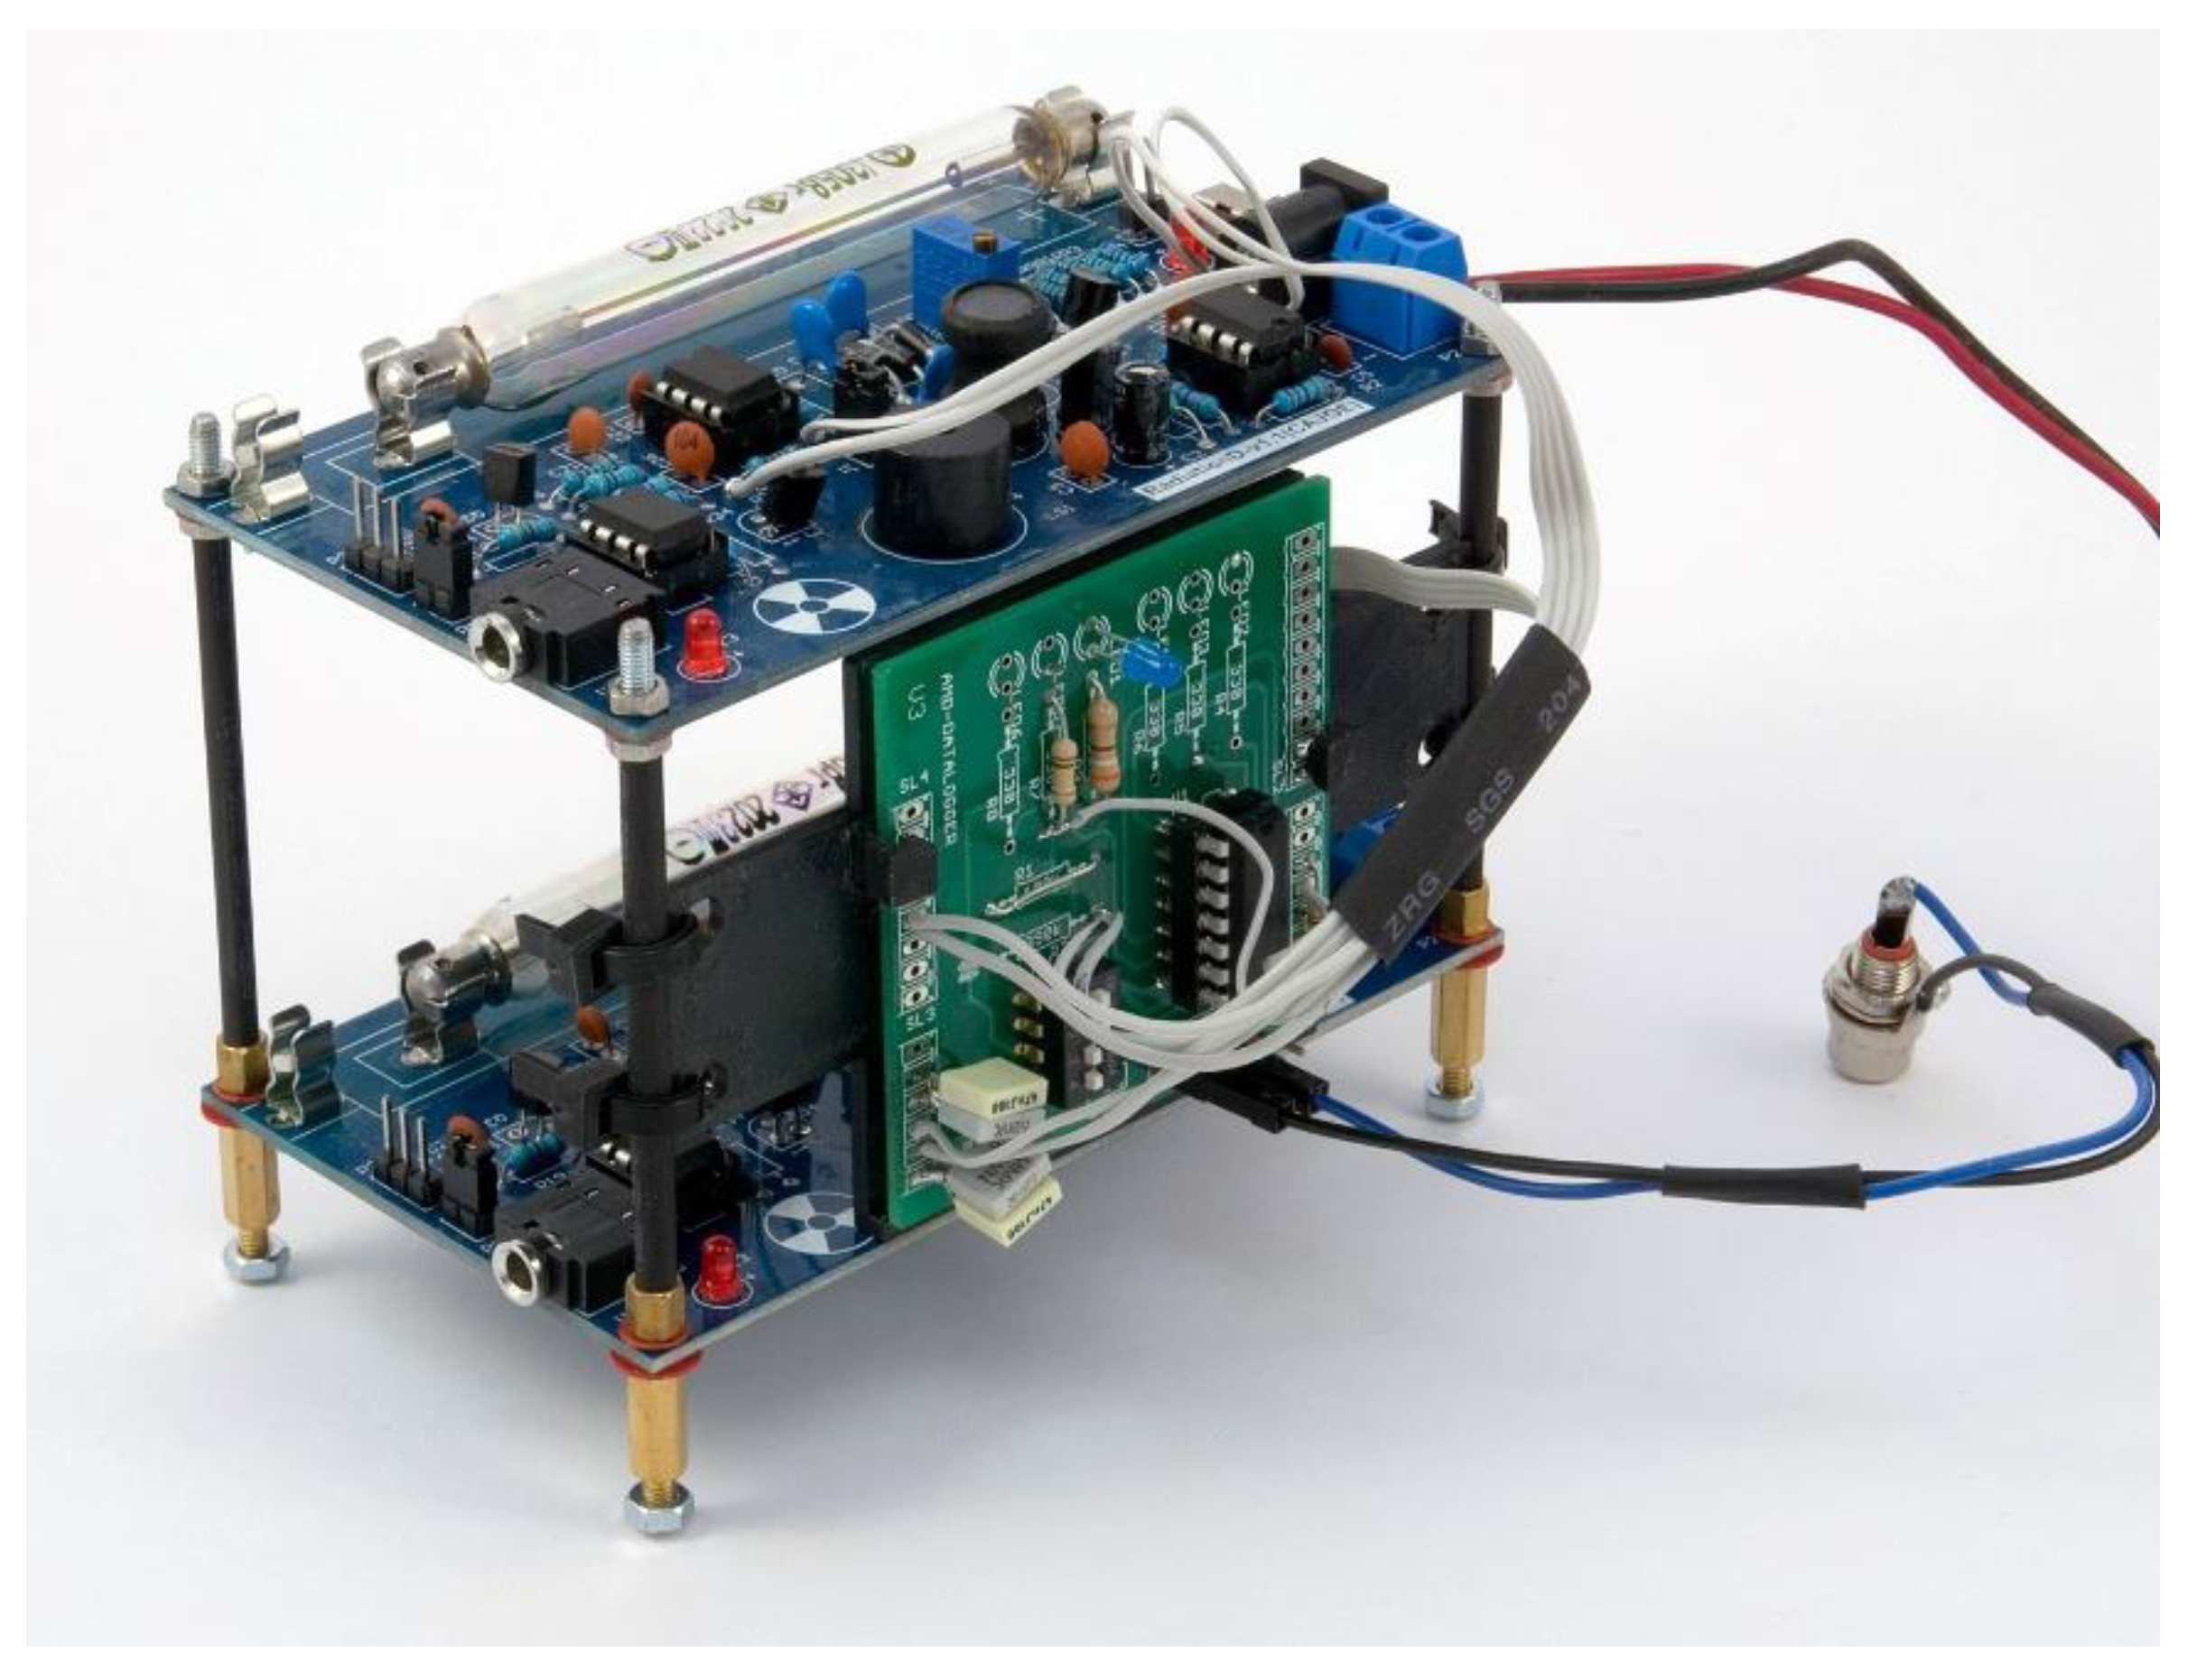
We conducted several tests to verify the correct working status. Firstly, we had a problem with a board. Being a cheap product, the PCB is of poor quality, resulting in bad solder joints and missing copper pads and traces. After resolving these issues, the detector started to work properly. The average flux of cosmic particles measured by the AMD5ALI detector is approximately 2.3 cpm sr with the standard time window (CW1) of 60 ms and about 0.5 cpm sr with the minimum time window (CW2) of 1 ms. Our first AMD5ALI prototype is shown in
Figure 9.
3. Results
We made a set of two zenith angle dependence tests (as shown in
Section 2.2). Anyway, in the second test, we decided to add a lead plate 4 mm thick between the two sensors in order to get any other possible insights. The results are shown in
Table 4. For comparison, we added the data related to an AMD5 detector.
In any setup, the AMD5ALI detector shows a rate that is about half that of an AMD5, despite the fact that the dimensions of the GMTs are similar (they differ only by about 1 cm
2 of useful surface). This discrepancy suggests that the SBM20 sensors may be more sensitive. Regarding the lead shield, there seems to be a degree of energy absorption in each measurement. However, it has only resulted in a noticeable improvement in the ratio data associated with the AMD5ALI (from 0.6 to 0.5); no such improvement is evident in the other detector. To confidently determine the effectiveness of the lead shield, it would require further statistical analysis. In conclusion, the ratio value evidences that the AMD5ALI definitely works as a muon detector. Of course, these are tiny devices, and their overall rate is low. Nonetheless, one of the strengths of these instruments is their portability in the classroom for educational purposes and their ability to participate in interesting activities such as the International Cosmic Day organized by DESY every year [
11]. From the scientific point of view, these kinds of instruments are very useful for long-term measurement and the possibility of comparing the data among them, as in the ADA project. This can potentially lead to interesting results. For instance, in
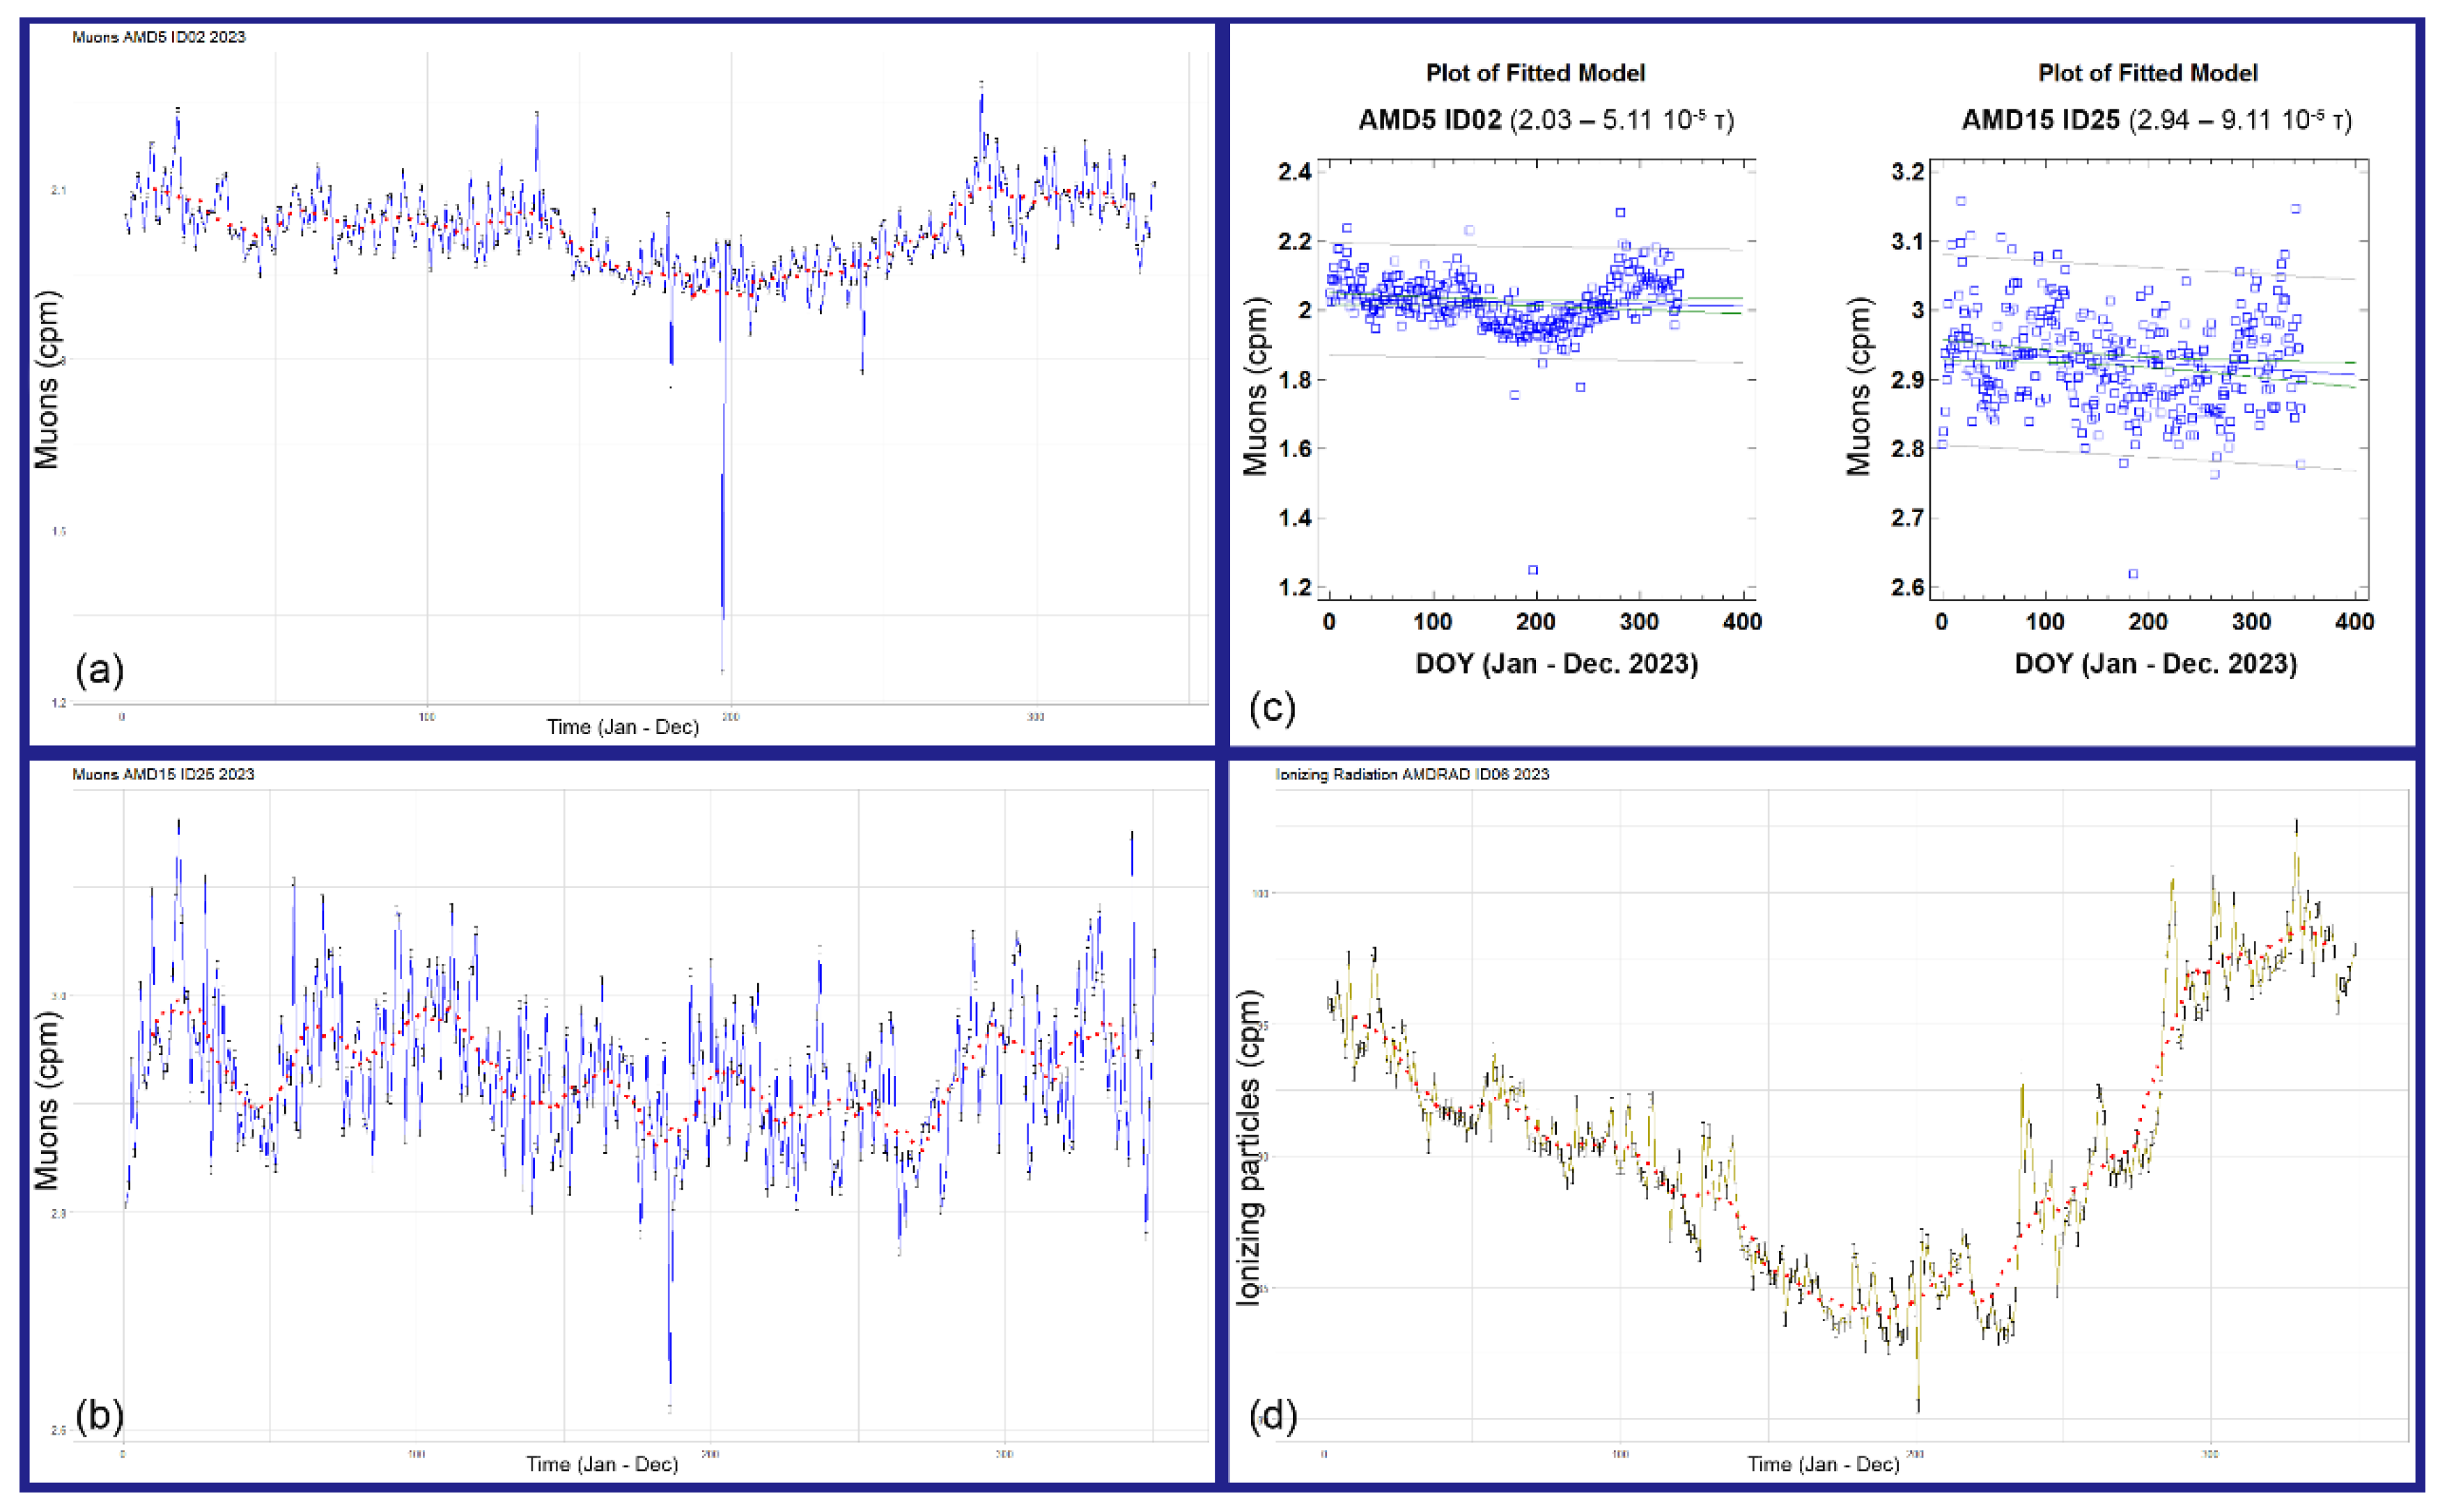
Figure 10, we show the measurements of three detectors for the last entire year: an AMD5, an AMD11 (it differs only for bigger GMTs), and an AMDRAD (a dosimeter with a single and even big GMT).
A brief analysis shows in both muon detectors the seasonal effect related mainly to the atmospheric temperature (and pressure) that is inversely proportional to the muon flux; indeed, the rate in the summer month is low compared to the winter one. An interesting result is that practically the same seasonal trend is also present in the dosimeter data (AMDRAD), here also expressed in raw counts per minute (cpm). The average count in the period 121-234 (around May 1–August 10)—certainly the hottest months in our location—is around 85.5 ± 0.17 cpm, compared to 92.9 ± 0.23 cpm in the remaining period. The comparison indicates a difference of 8.6% between the two averages. This contribution is in the order of magnitude of the cosmic component, which, as is known, is between 10 and 15% of the total ionizing radiation, so our assumption is that the seasonal effect in this detector coincides with the atmospheric absorption of muons, which also occurs for the other detectors.
The two muon detectors also show that the general trend (linear regression) is slightly decreasing for the last year; this means that the Sun until December 2023 was still rising in its magnetic strength, and maybe even today it has not reached the maximum of its current cycle (see
Appendix A). Other features present and visible in the detector data are currently under assessment. The detectors can be operated to study the relationship between cosmic particles and weather or space weather phenomena. We know that some researchers are using similar simple devices to study the role of cosmic rays in relation to sudden ionosphere disturbances. However, our greatest ambition would be to record signals from the next galactic supernova, and these detectors could potentially do even that.
3.1. Scientific Exploration: Detectors in the Stratosphere
With GMT-based detectors like those in the AMD family of the ADA project, it is possible to carry out several educational experiments. These include measuring the variation in cosmic ray flux as a function of altitude, studying the dependence of muon flux on atmospheric parameters such as temperature, pressure, and humidity, investigating diurnal and seasonal variations in flux rates, assessing the attenuation of cosmic ray intensity through different materials such as water, concrete, or lead [
12], examining the dependence of cosmic muon rates on measurement angles relative to the vertical direction (zenith effect), conducting coincidence measurements to study the geometric acceptance of the detector, and performing measurements of equivalent absorbed dose (see supplementary materials). Over the years, these experiences have been carried out in many secondary schools, with remarkable results in terms of teaching. Laboratory activities with cosmic rays arouse great interest among young students and offer them the opportunity to put into practice the theoretical concepts studied in data analysis techniques, programming, and electronics. One of the most important examples in this area was the MoCRiS (Measurement of Cosmic Rays in Stratosphere) project [
13]. This experiment involved the students of the fourth and fifth classes of the Scientific High School of Cariati (CS) during the 2022–23 school year. In an educational approach, a weather balloon was loaded with instruments to study the variation of cosmic radiation flux as a function of altitude. The aim of the experiment was to replicate, using modern methods, the historic measurements conducted by Victor Hess [
14] and by Erich Regener and Georg Pfotzer [
15,
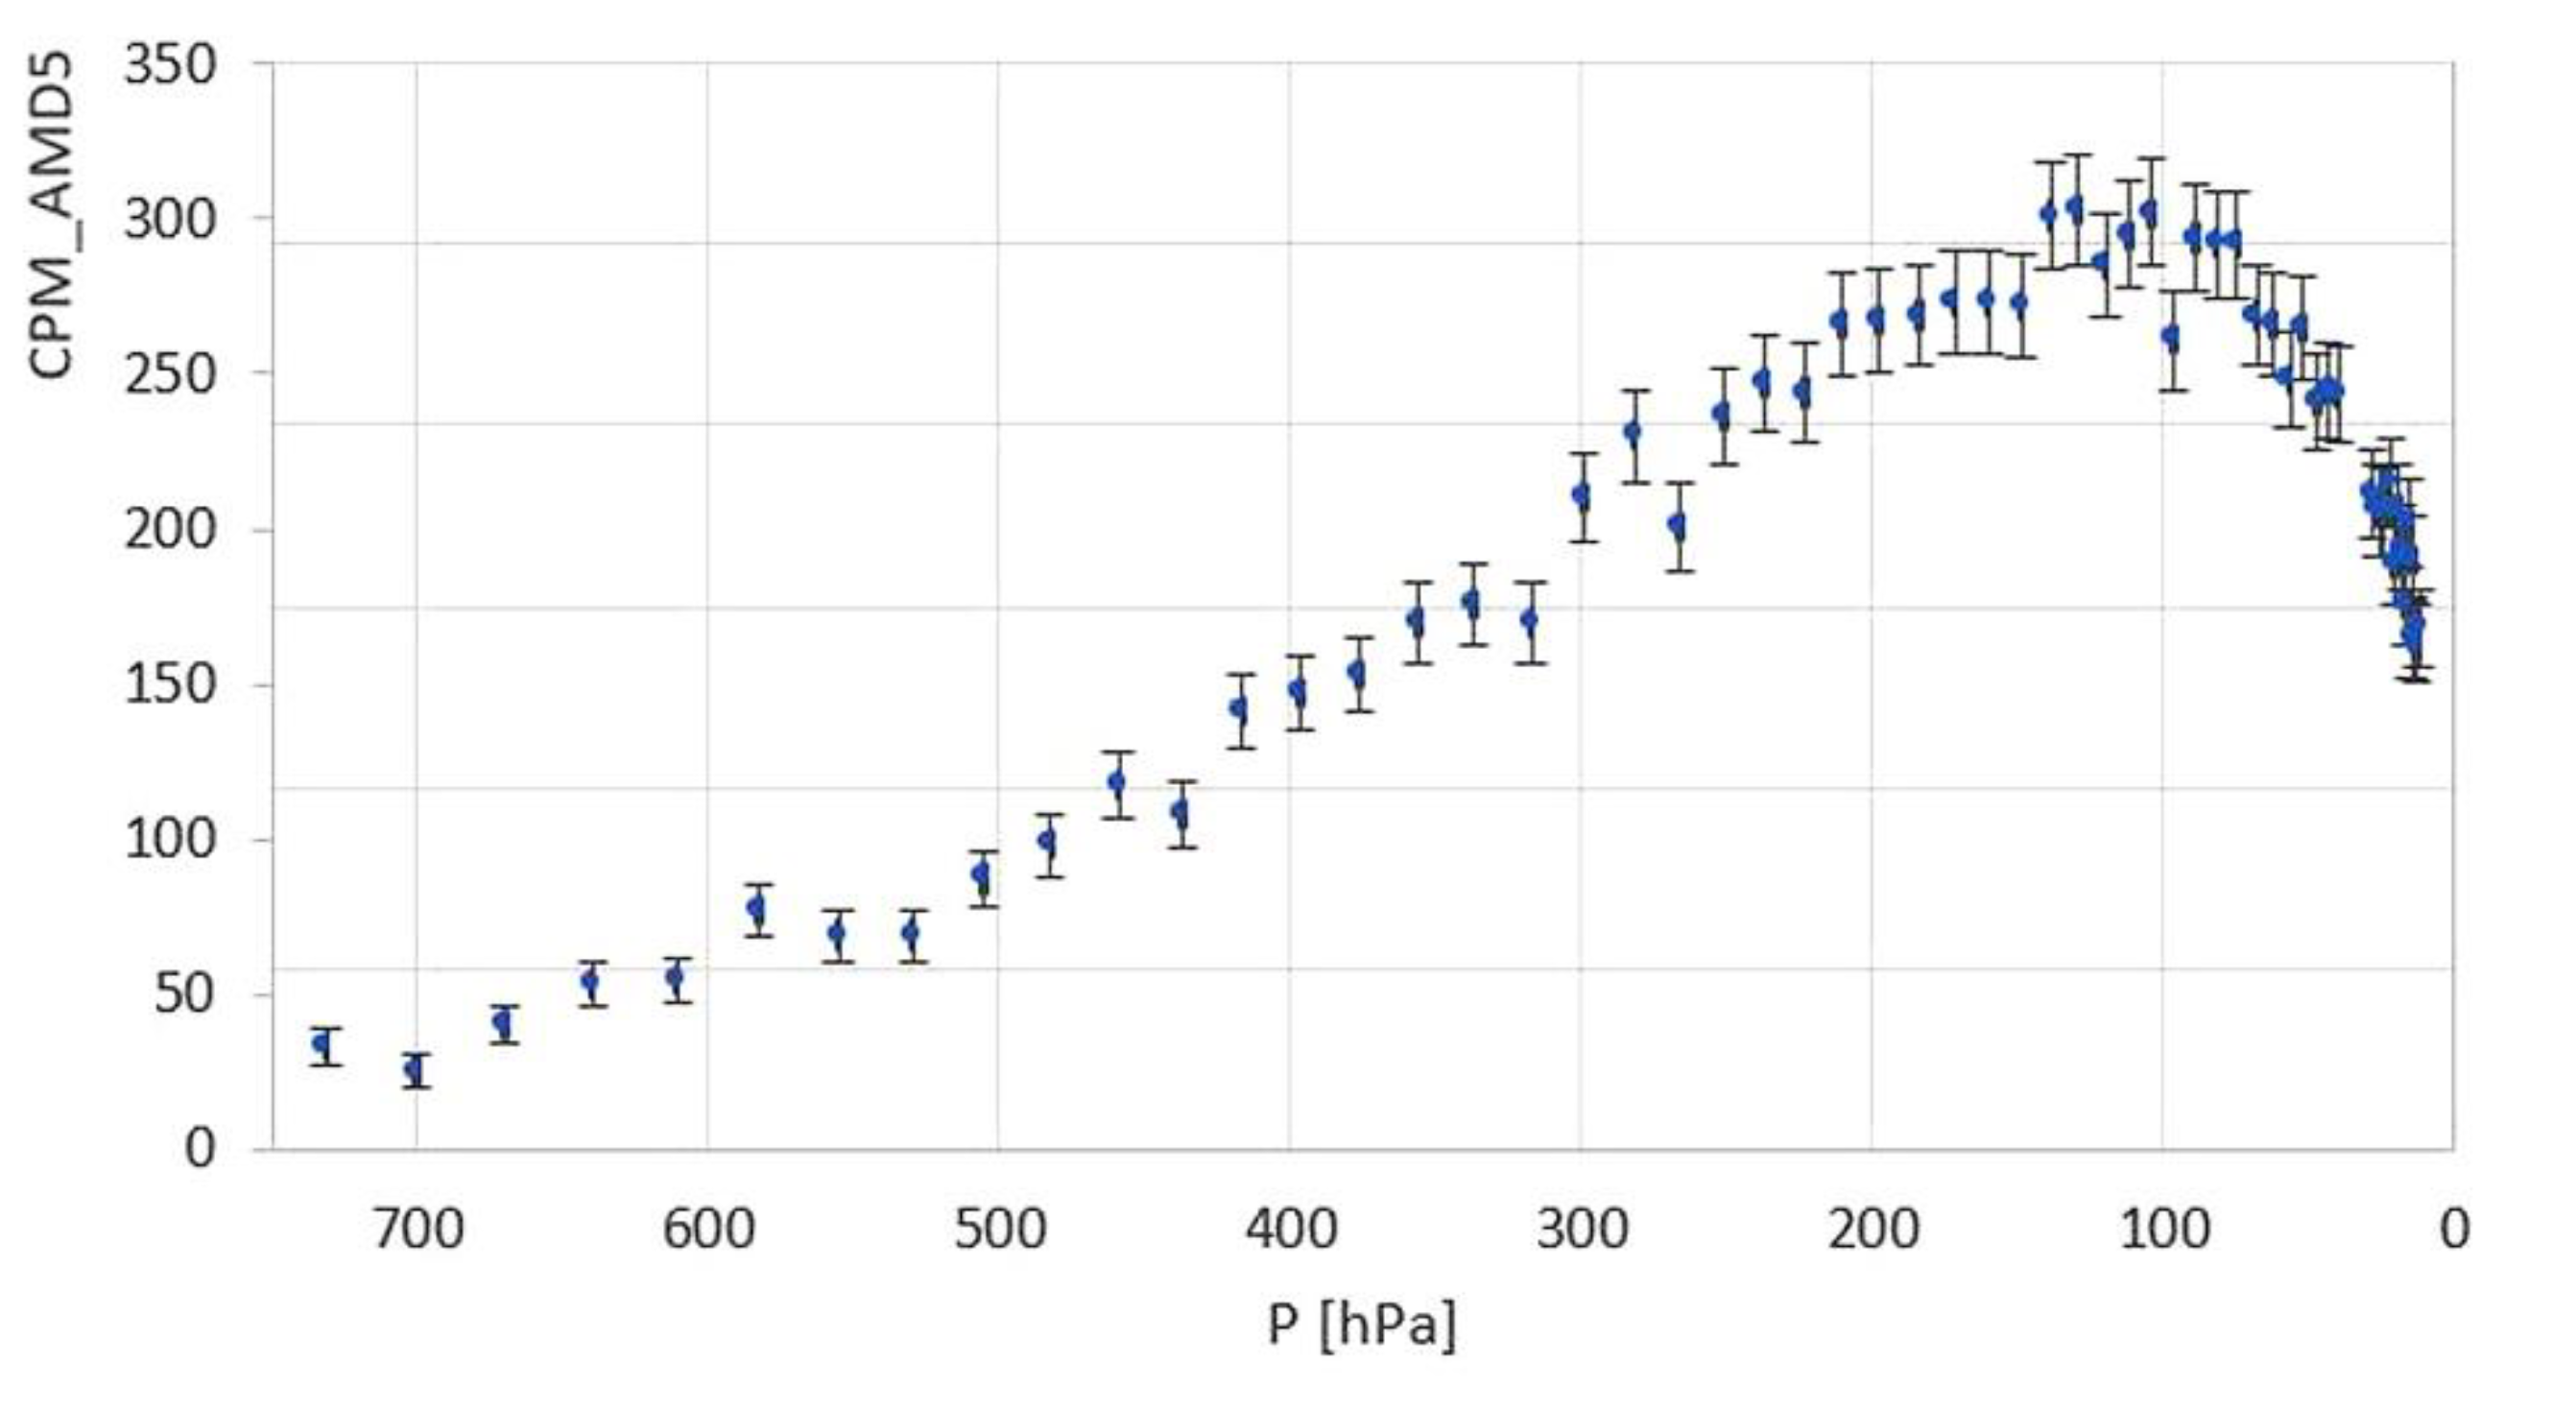
16]. The objective was to introduce pupils to the physical characteristics of near-Earth space, focusing particularly on the ionizing radiation present in the stratosphere as well as its temperature, pressure, relative humidity, UV radiation, and ozone concentration. The measuring instruments were carried aloft by a sounding balloon, which reached an altitude of about 33,200 meters. Students were involved in every stage, from designing and constructing the probe to studying the theoretical principles of physics and aerospace technologies. They also participated in the launch of the balloon. The data depicting the variation in cosmic ray flux, measured using an AMD5 detector as a function of atmospheric pressure and consequently altitude, are illustrated in
Figure 11.
In this study, we also estimated the equivalent dose value absorbed during the stratospheric flight of the MoCRiS balloon (approximately 33,000 meters). This measurement served as a useful introduction to the topic of radiation protection on space flights for the classroom. The calculation of the dose equivalent was conducted using the following relationship:
where H represents the equivalent absorbed dose (mSv/h), and C
f is a calculated conversion coefficient. In our case, we assumed C
f to be equal to 5.8 10
–3 mSv/h [
17]. For the one-hour flight duration, we estimated an equivalent dose of 3.0 ± 0.1 mSv. This can be compared to the approximate 2.4 mSv of natural radiation background (worldwide average annual value) [
18] or to the 160 mSv dose absorbed by astronauts during approximately 6 months of orbit around the Earth [
19].
3.2. Case Study: A Muon Telescope in the Classroom
Implementing AMD5 detectors for educational purposes offers a versatile tool for various educational settings. One innovative application involves the construction of a muon telescope, a structure capable of rotating and scanning the sky at different angles. In Biella, such a structure was erected last year by mounting the AMD5 detector on a telescope mount, enabling it to span over 90° in zenithal angle. This setup provided a unique opportunity to measure the flux of muons from cosmic rays and explore its dependence on distance from the zenith (
Figure 12).
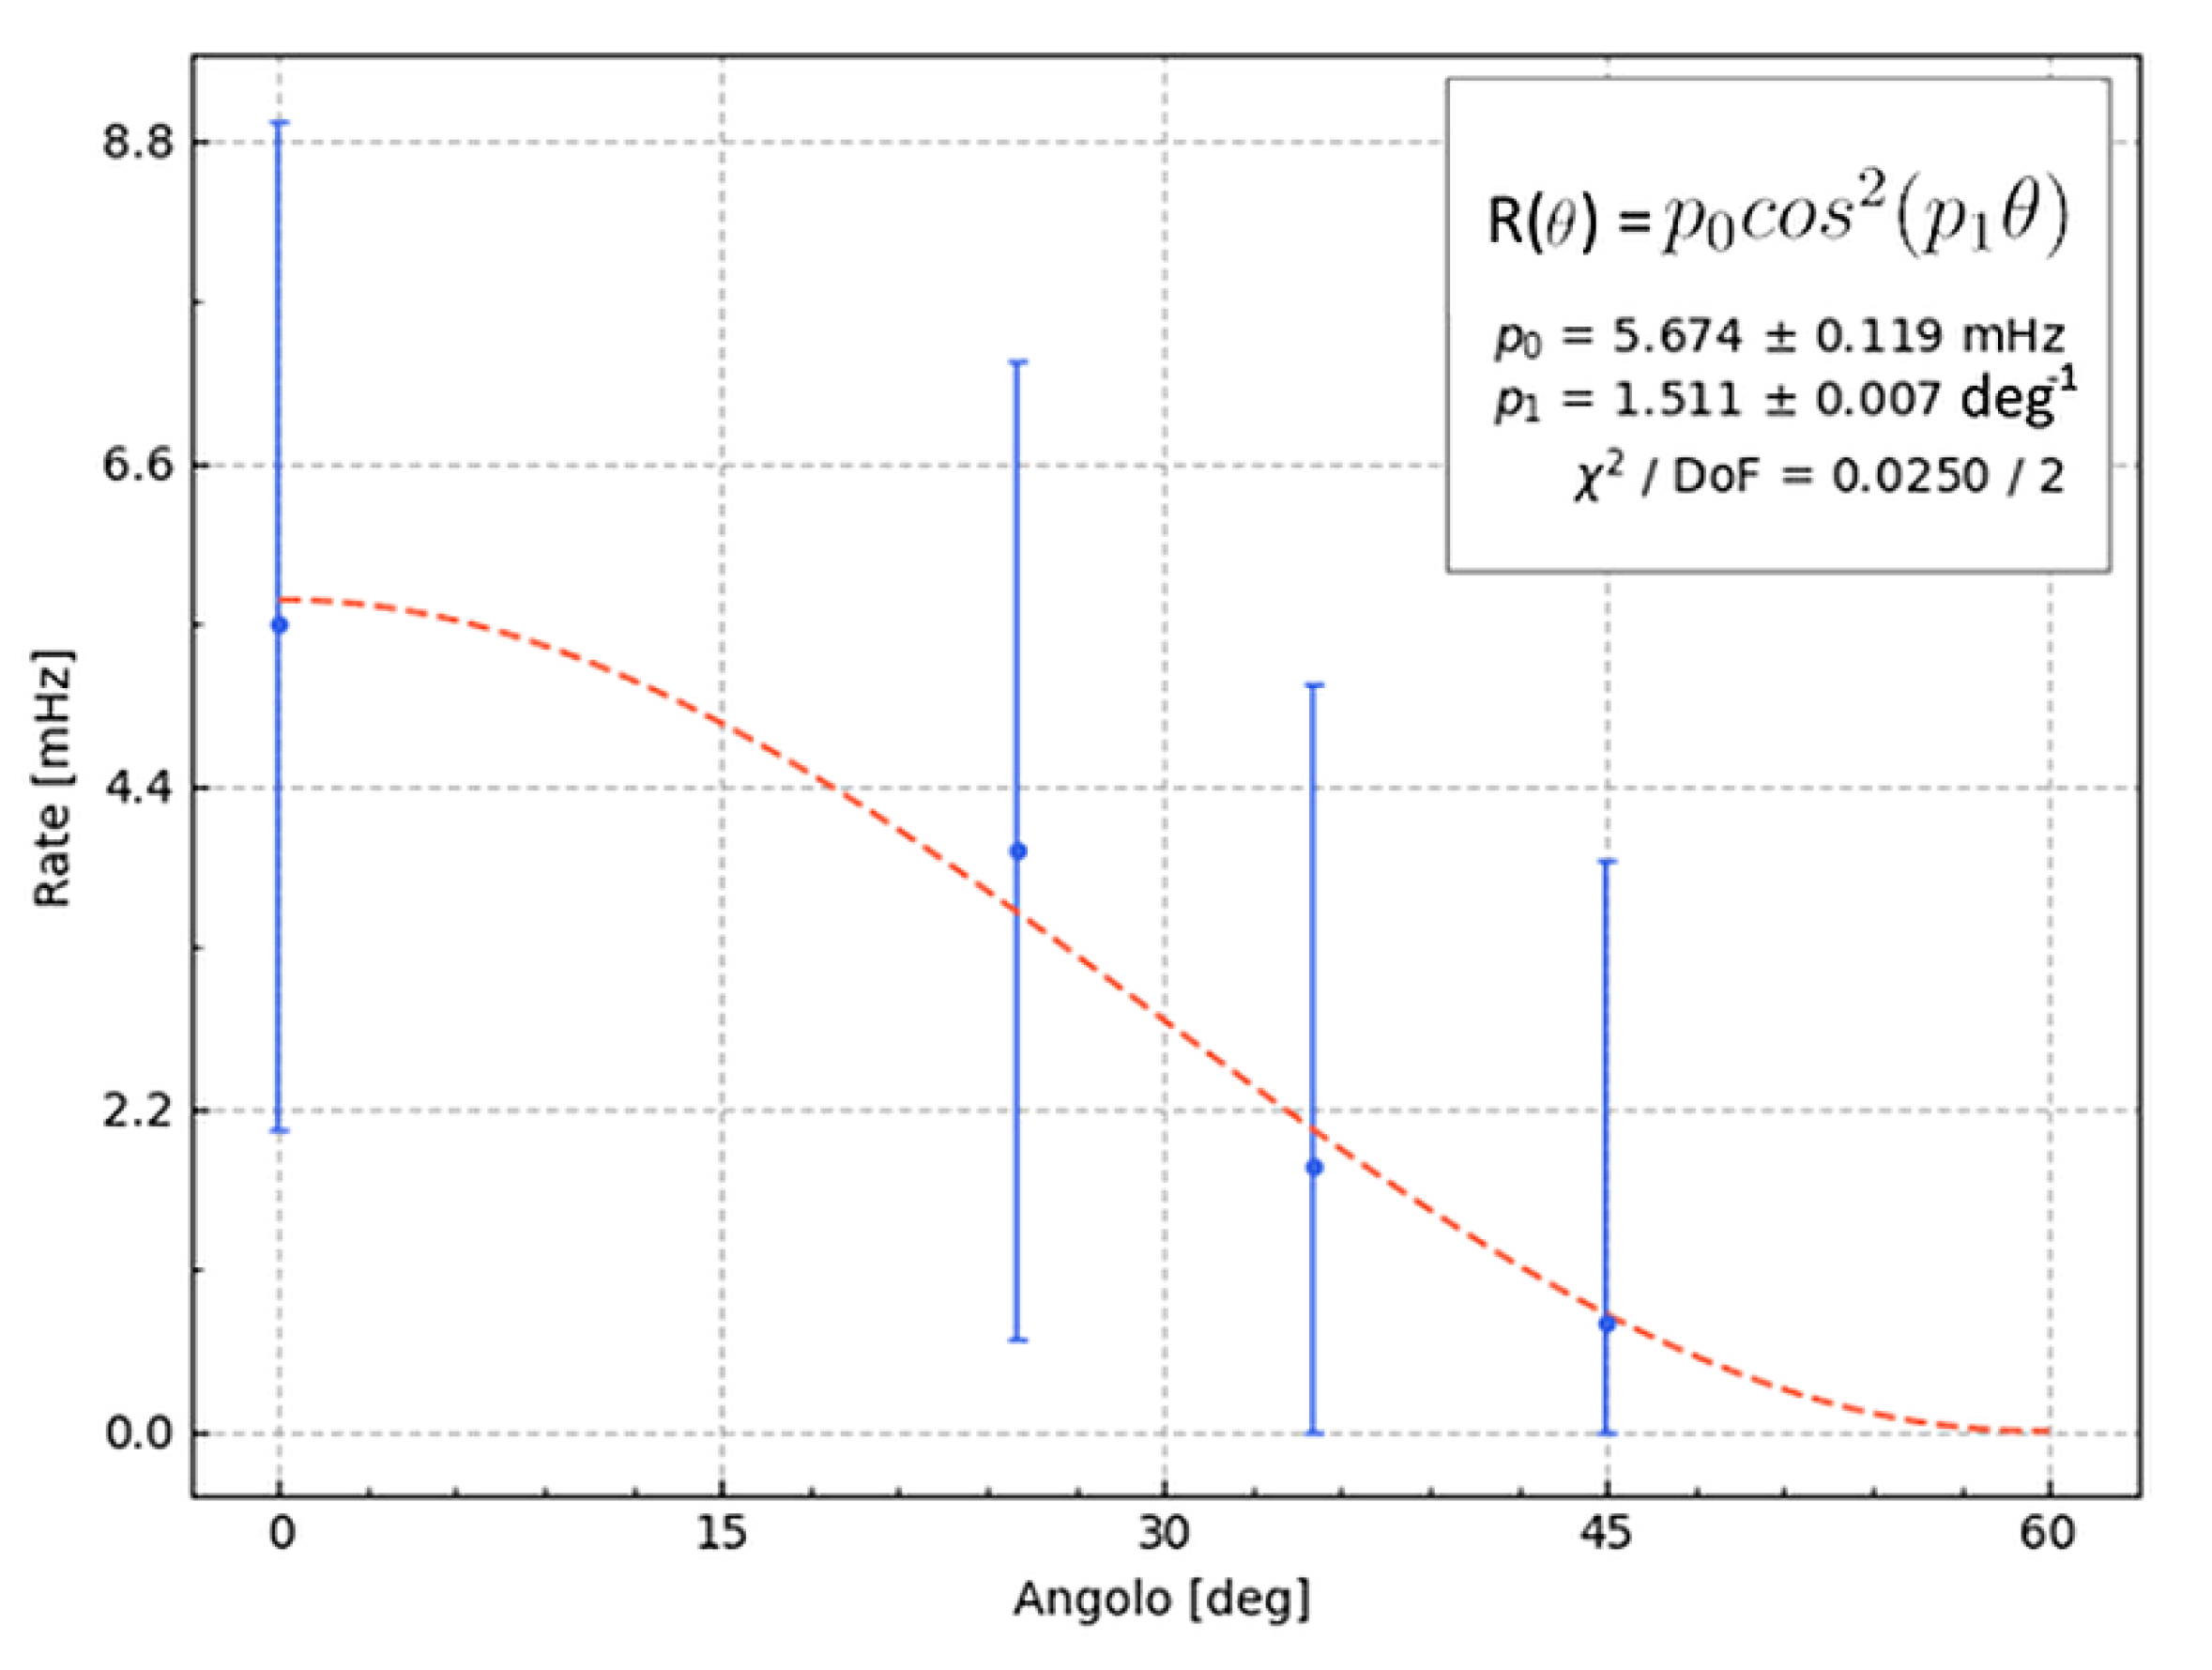
Students from diverse academic backgrounds engaged in a range of projects utilizing the muon telescope. They conducted experiments to measure the rate of incoming muons at different angles and applied mathematical models to fit the data. While the results mostly behaved as anticipated, an unexpected phase shift was observed. Subsequent investigations by educators revealed that the room's walls contained traces of radioactive elements, contributing to higher background noise at lower angles. Subtracting the background and fitting the new data yielded no phase shift. Errors are largely overestimated due to the low statistics taken by students, further studies will certainly be performed on larger datasets (
Figure 13).
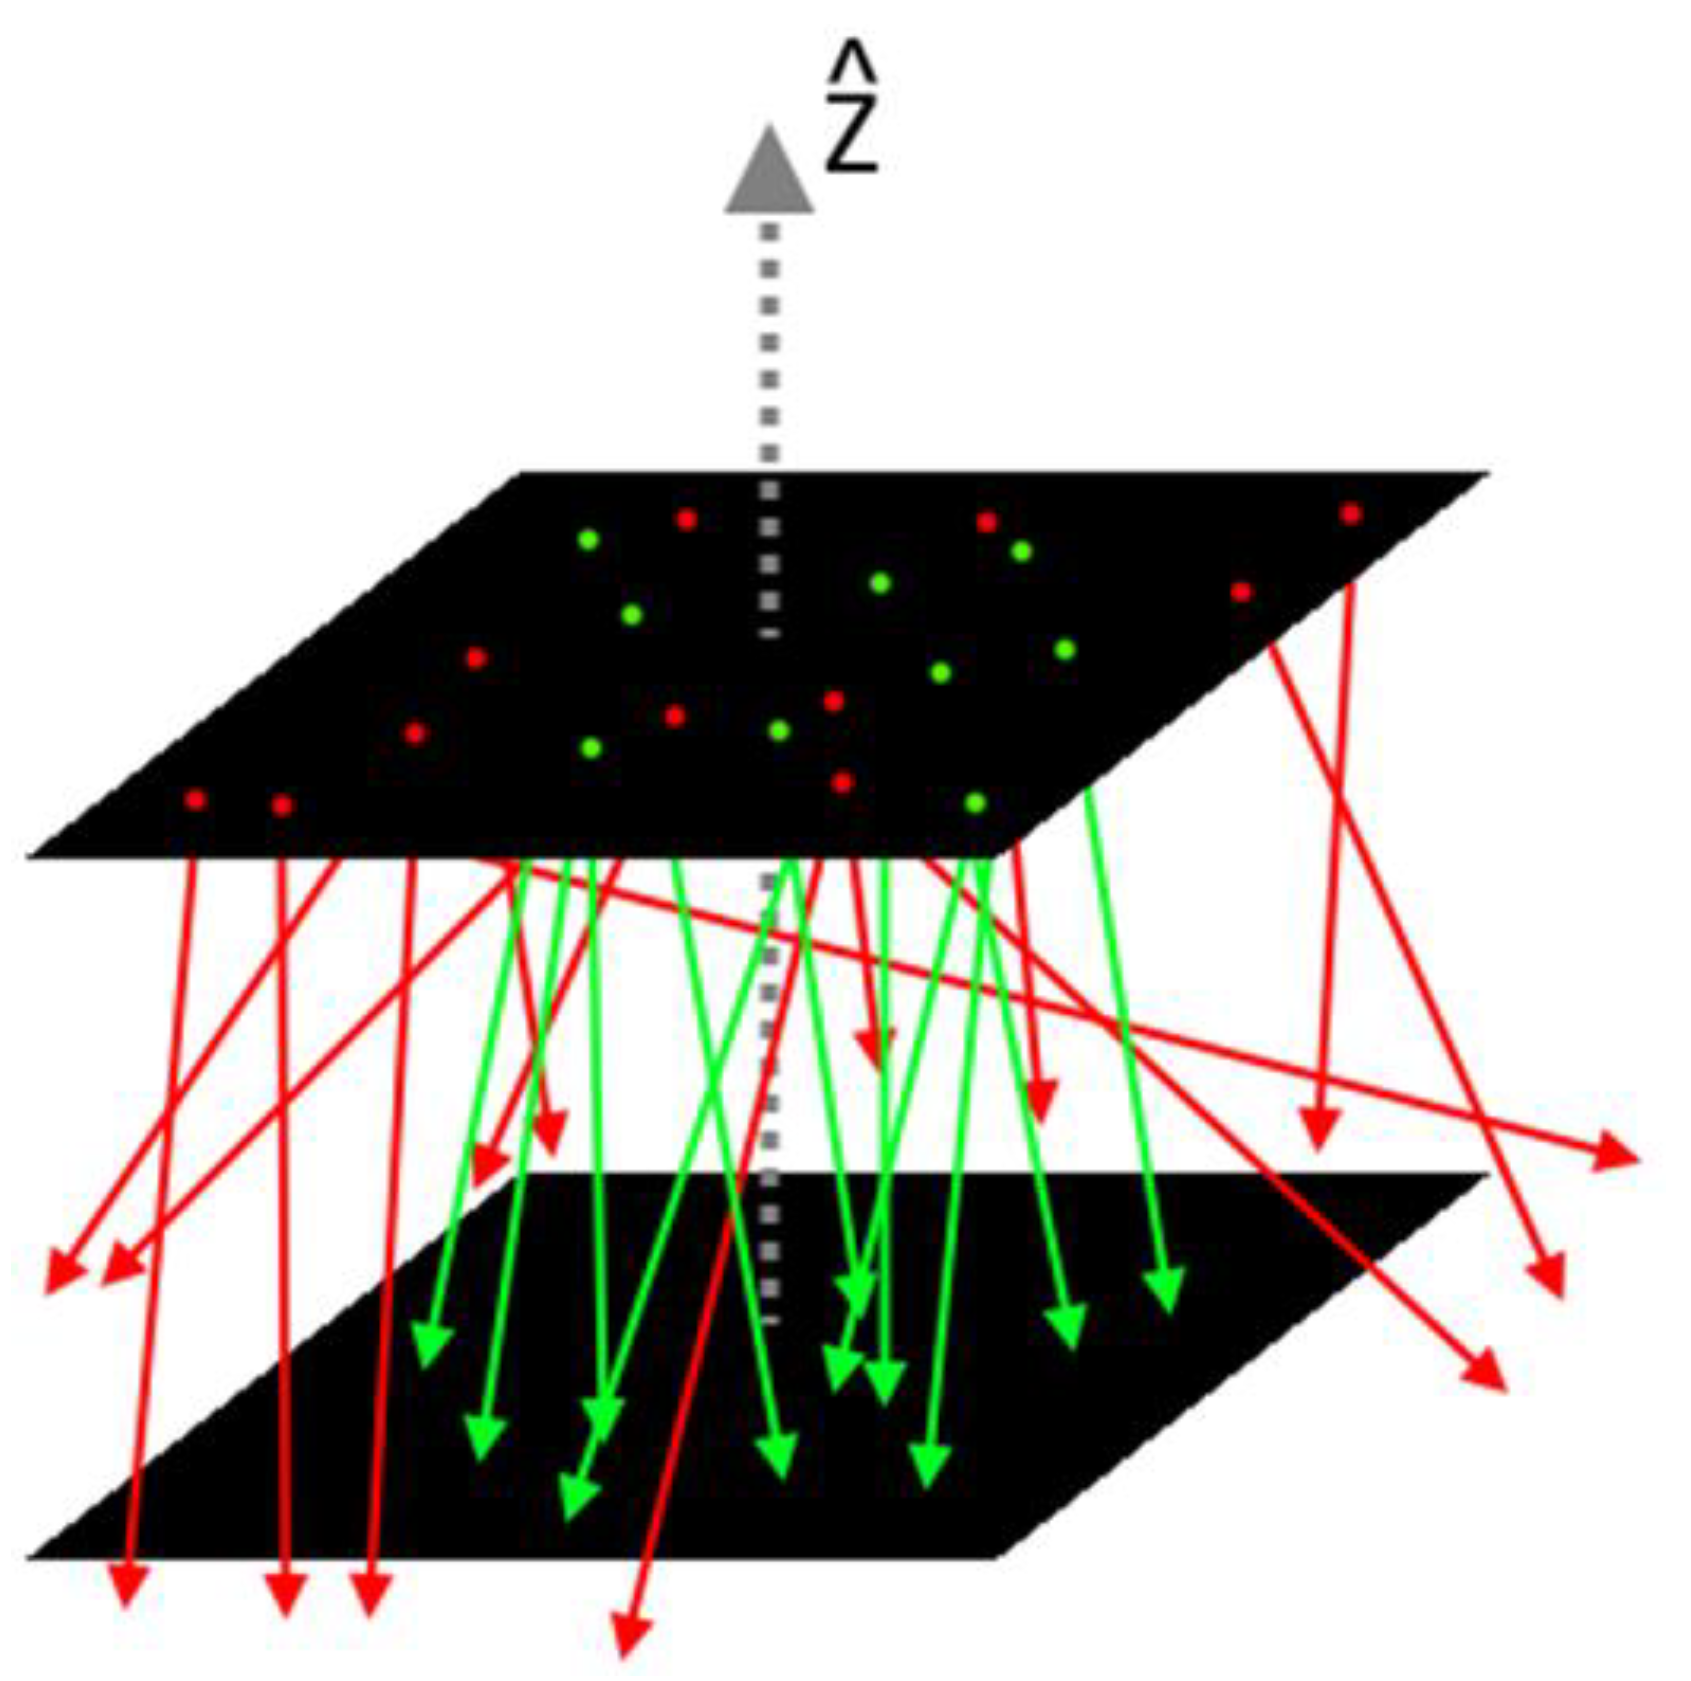
Impressively, some students ventured further by conducting Monte Carlo simulations to assess the geometric acceptance of the AMD5 detector. Their simulation, assuming a muon direction distribution following a specific pattern and uniform azimuthal angle distribution, yielded valuable insights. By propagating generated particles and counting only those that interacted with the second layer of detectors, they determined the detector's geometric acceptance: 0.03 ± 0.06.
Upon completion of these projects, feedback from both students and educators was overwhelmingly positive. Students expressed fascination with the hands-on, problem-solving approach that is inherent in experimental physics, finding it more engaging than traditional textbook learning. Educators appreciated the opportunity to introduce complex concepts in particle physics through a tangible, visual tool, bridging the gap between theory and practice in the classroom.
4. Discussion
In today's rapidly evolving scientific landscape, there are numerous avenues for promoting scientific exploration. Among these, the transformation of DIY Geiger counter kits into muon detectors stands out as one of the most accessible and straightforward methods. These detectors provide a convenient starting point for enthusiasts, educators, and researchers alike, offering a user-friendly platform for engaging with astroparticle physics. There are plenty experiments available with this type of instruments and we showed only a few in this paper. Beyond their initial construction, GMTs based detectors offer versatility in their applications. With the development of software applications like AstroRad for data logging and analysis, or other solutions involving microcontrollers, these detectors can serve as powerful tools for scientific research. Students can gain hands-on experience in physics, electronics, and data analysis through the construction and operation of muon detectors. These educational opportunities cultivate curiosity and critical thinking skills, laying the foundation for future scientific pursuits.
Supplementary Materials
The following supporting information can be downloaded at the website of this paper posted on Preprints.org.:
D. Liguori, D., P. Barone, Esperienza con i raggi cosmici, La Fisica nella Scuola, XLVIII, p. 97-109, (2015).
D. Liguori, D., P. Barone, Uno sguardo sul Sole attraverso i raggi cosmici, Astronomia, XLI, 5, p. 18-23, (2016).
D. Liguori et al., MoCriS: Misura di raggi cosmici in stratosfera, Astronomia, XLV, 1, p. 31-36, (2020).
D. Liguori, M. Arcani, S. Procopio, A. Brosio, “Misure di radiazione cosmica in stratosfera con MoCRiS2”, Astronomia UAI, n°1 Gennaio-Marzo 2024 Anno XLIX.
Author Contributions
Conceptualization, M.A.; methodology, M.A.; software, M.A.; validation, M.A., D.L. and O.D.L.; formal analysis, M.A., D.L. and A.F.; investigation, M.A., D.L. and A.F.; resources, M.A.; data curation, M.A., D.L. and A.F.; writing—original draft preparation, M.A.; writing—review and editing, M.A., D.L., A.R.M.N., O.D.L. and C.G.; visualization, M.A., D.L., A.R.M.N., O.D.L. and C.G.; supervision, C.G.; All authors have read and agreed to the published version of the manuscript.
Funding
This research received no external funding.
Data Availability Statement
The raw data supporting the conclusions of this article will be made available by the authors on request.
Acknowledgments
We acknowledge the support given by:
MOCRIS: a project carried on by Liceo Scientifico di Cariati (CS) in collaboration with: ABProject Space; the OCRA-INFN collaboration; the physic department of UNICAL University; the ADA Project; and Arpacal in Catanzaro.
Gruppo Astronomico Tradatese (GAT), 21049 Tradate.
Unione Biellese Astrofili (UBA), 13897 Occhieppo Inferiore.
Gen. Elia Rubino, Associazione Arma Aeronautica (AAA), 81100 Sezione di Caserta.
We acknowledge the NMDB database (
www.nmdb.eu), founded under the European Union's FP7 programme (contract no. 213007) for providing data, and the PIs of individual neutron monitors at: IGY Jungfraujoch (Physikalisches Institut, University of Bern, Switzerland)
Conflicts of Interest
The authors declare no conflicts of interest.
Appendix A
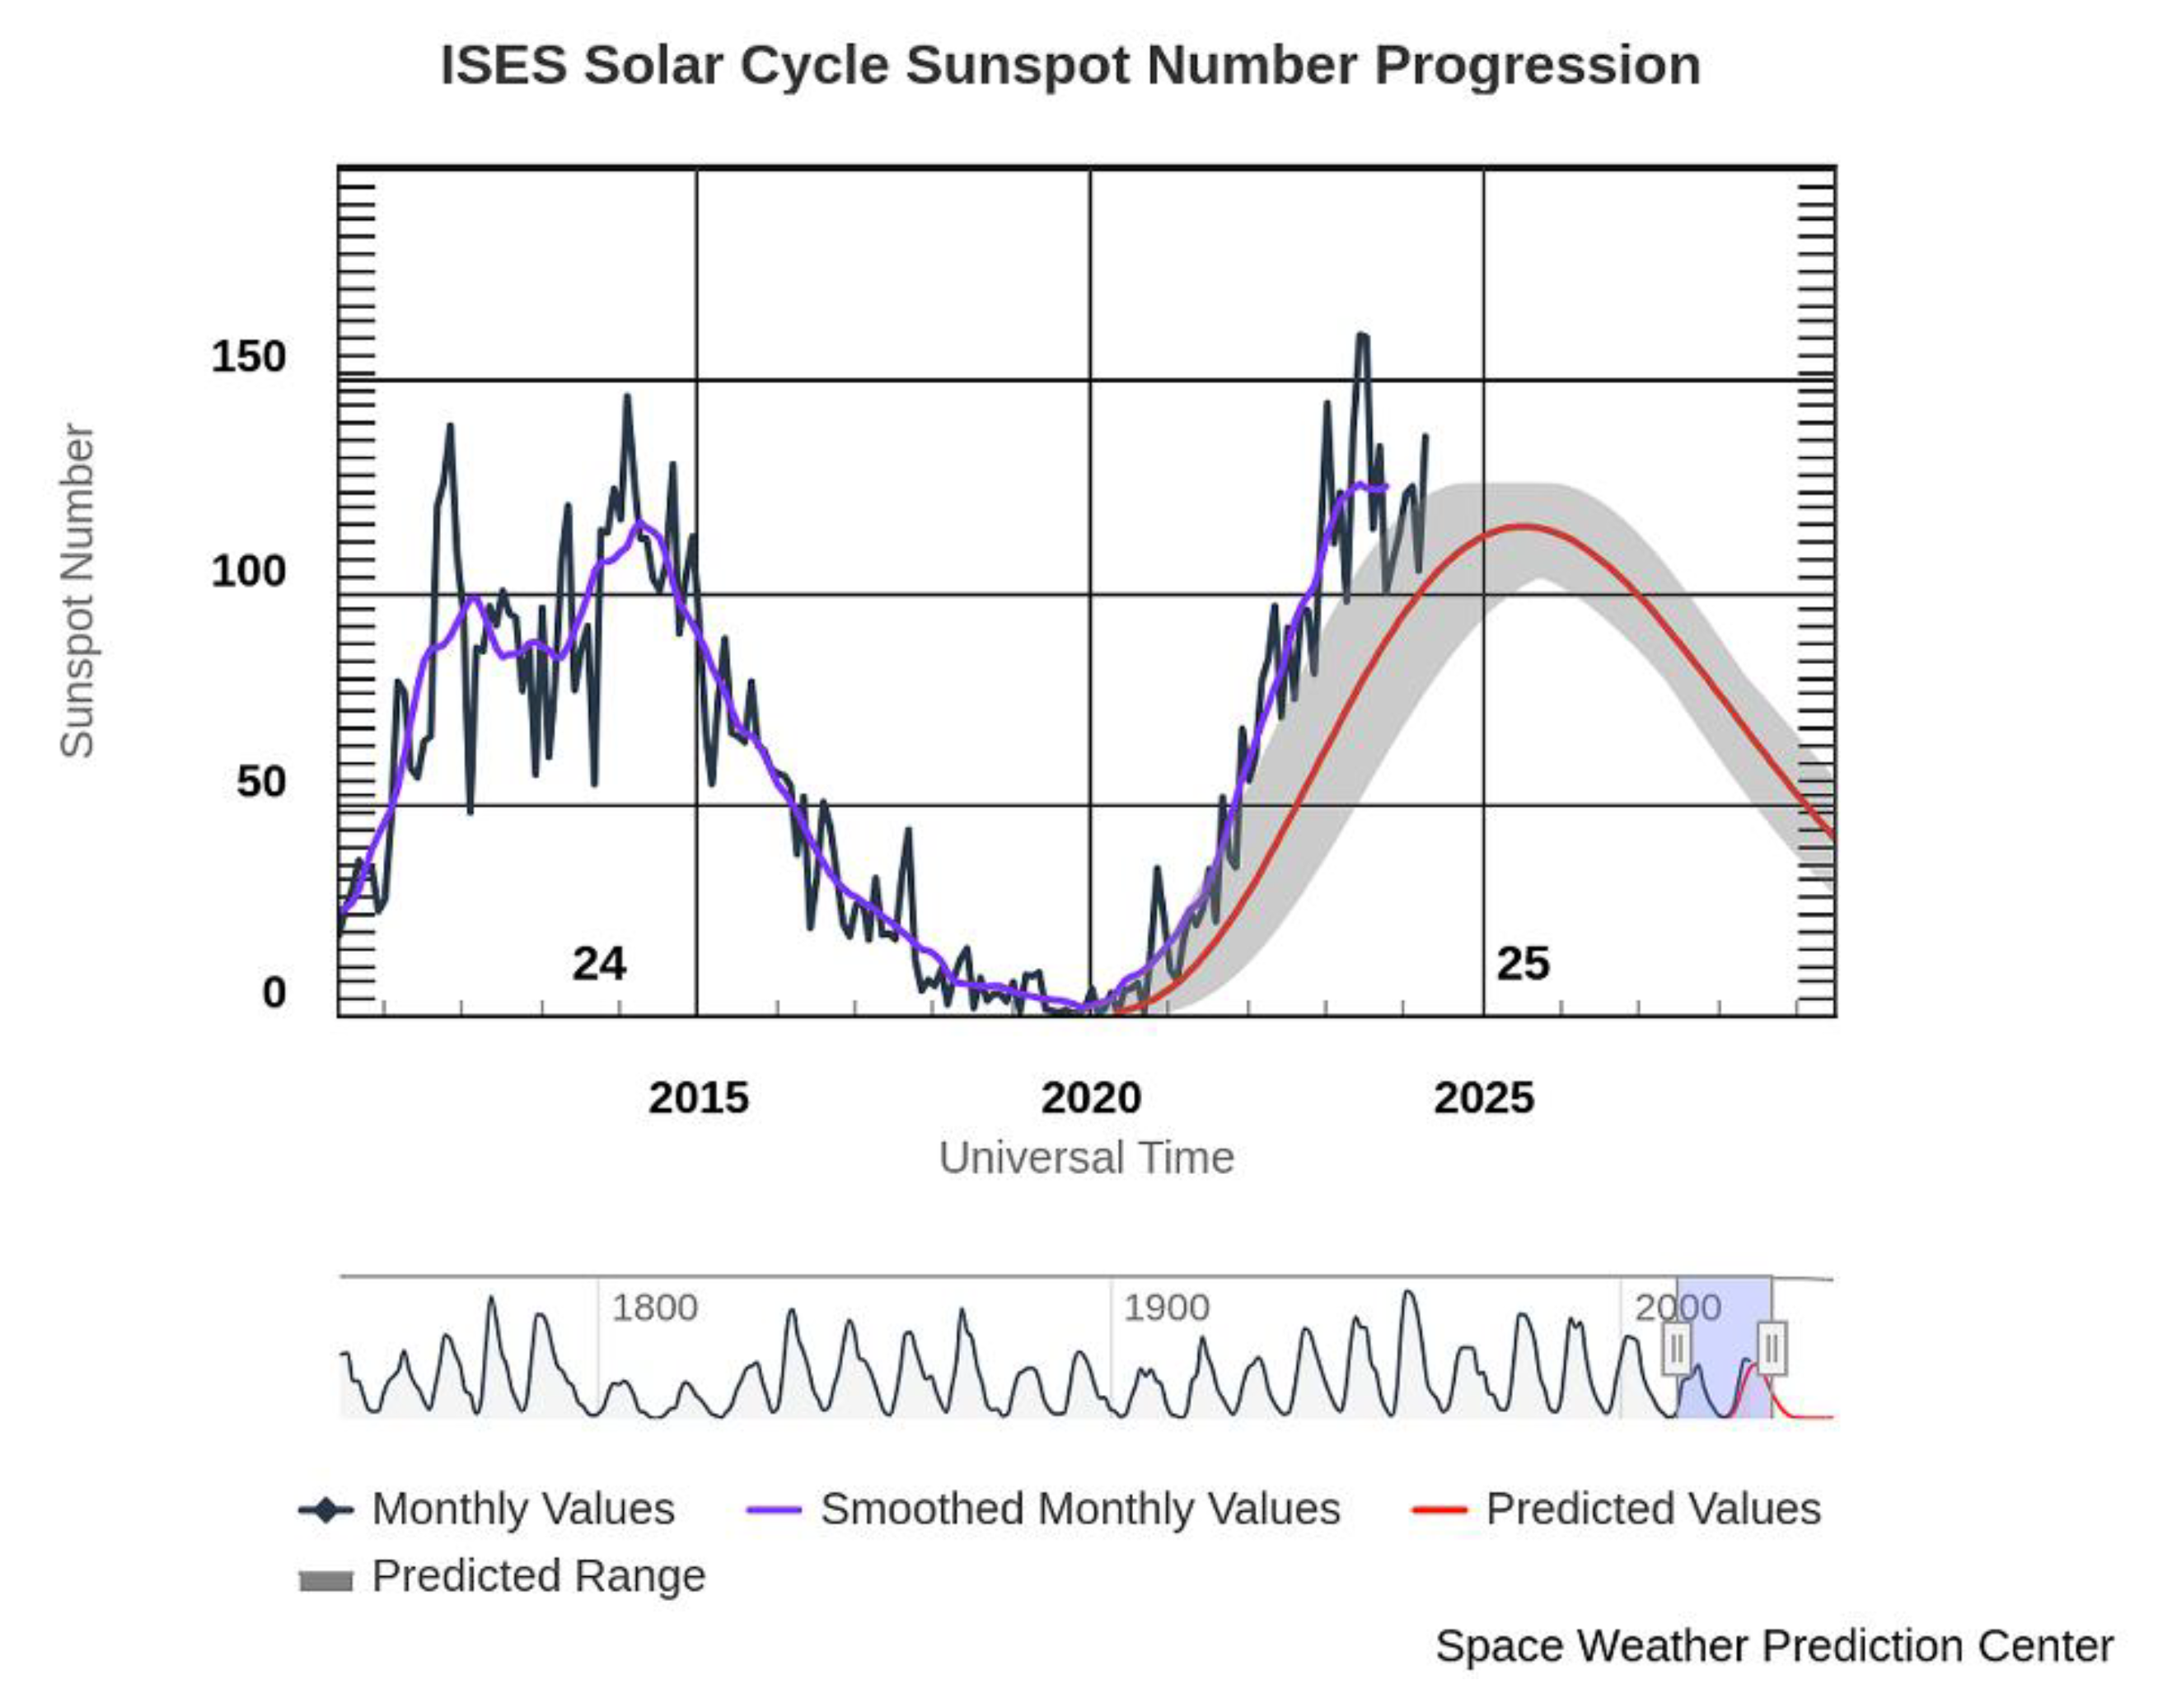
Solar cycles are periodic changes in the activity of the Sun. These cycles are driven by the strength of the Sun's magnetic field, usually last about 11 years, and are characterized by fluctuations in sunspot numbers, solar eruptions, and solar radiation. Solar eruptions like Coronal Mass Ejection (CME) or solar flares can significantly impact space weather and can affect Earth's technology and climate. Solar activity influences the intensity of cosmic rays reaching Earth; during solar maximum, increased solar wind and magnetic field strength deflect more cosmic rays, reducing their intensity. Currently, we are in Solar Cycle 25, which began in December 2019. Monitoring cosmic rays is a good indicator for understanding and predicting solar activity and its effects on our planet. The current activity of the solar cycle shows a kind of plateau, as can be seen from the sunspot number index plotted by NOAA (
Figure A1).
Figure A1.
Progression of solar cycles 24 and 25 as sunspot number (retrieved from SWPC_NOAA on 18 May 2024).
Figure A1.
Progression of solar cycles 24 and 25 as sunspot number (retrieved from SWPC_NOAA on 18 May 2024).
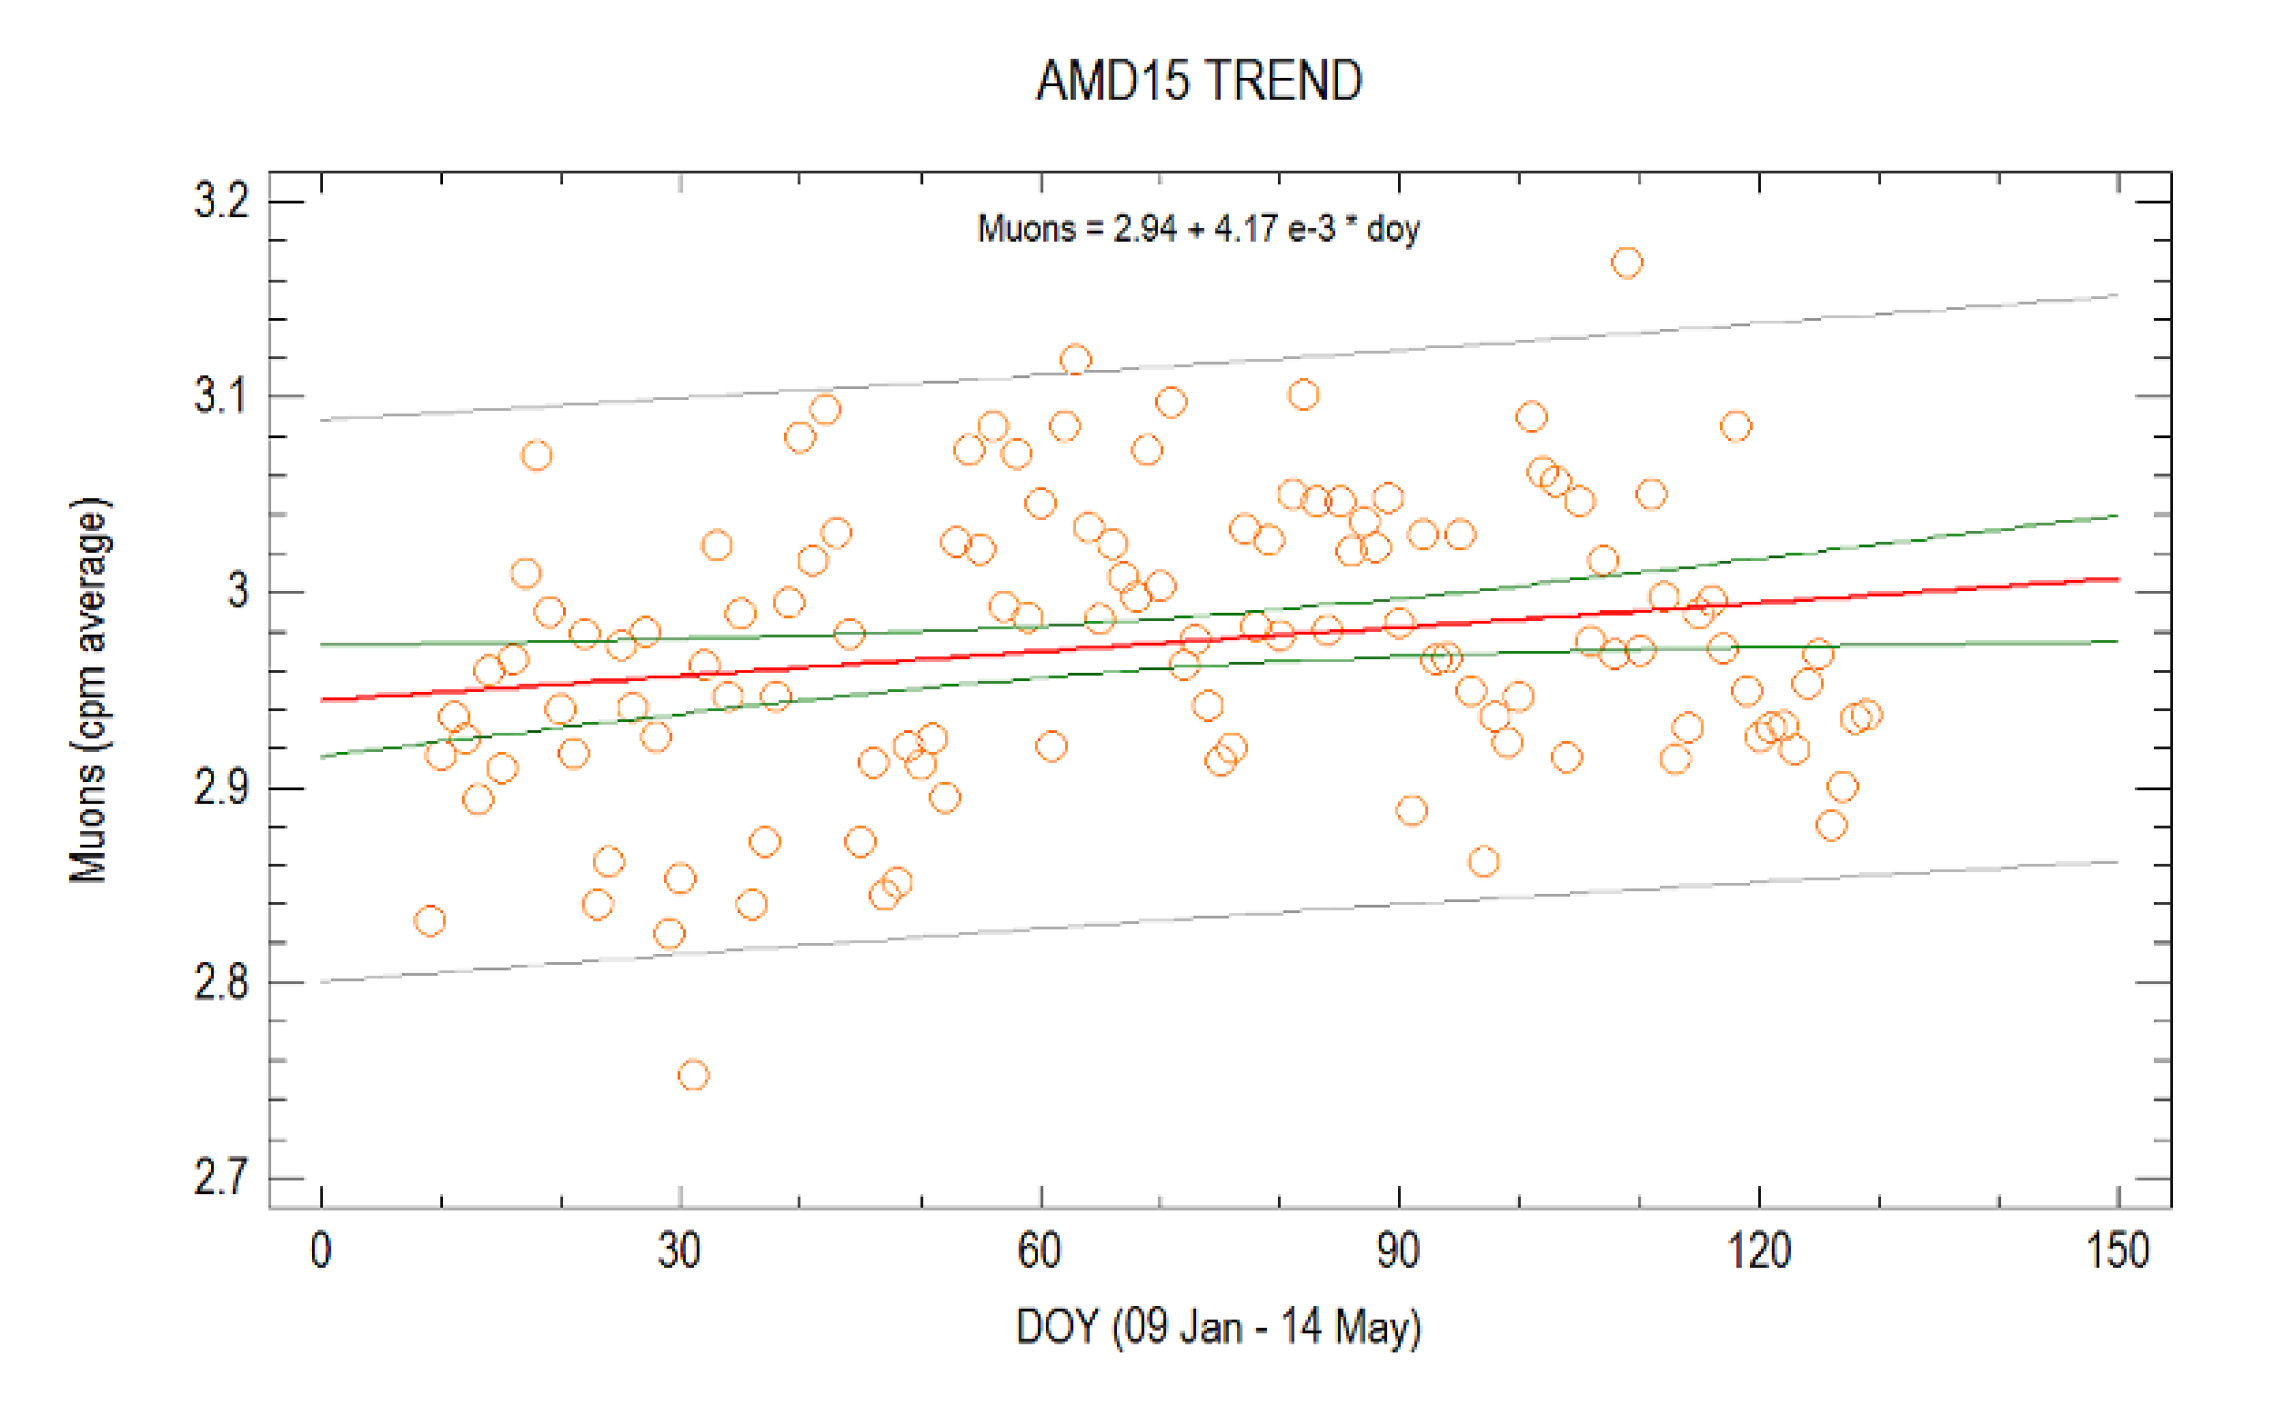
Our best detector shows a slight increase in the muon data over the last few months (
Figure A2). This could suggest a drop or a steady state of the Sun.
Figure A2.
Daily trend of muons recorded by the AMD15 detector from January to May 2024.
Figure A2.
Daily trend of muons recorded by the AMD15 detector from January to May 2024.
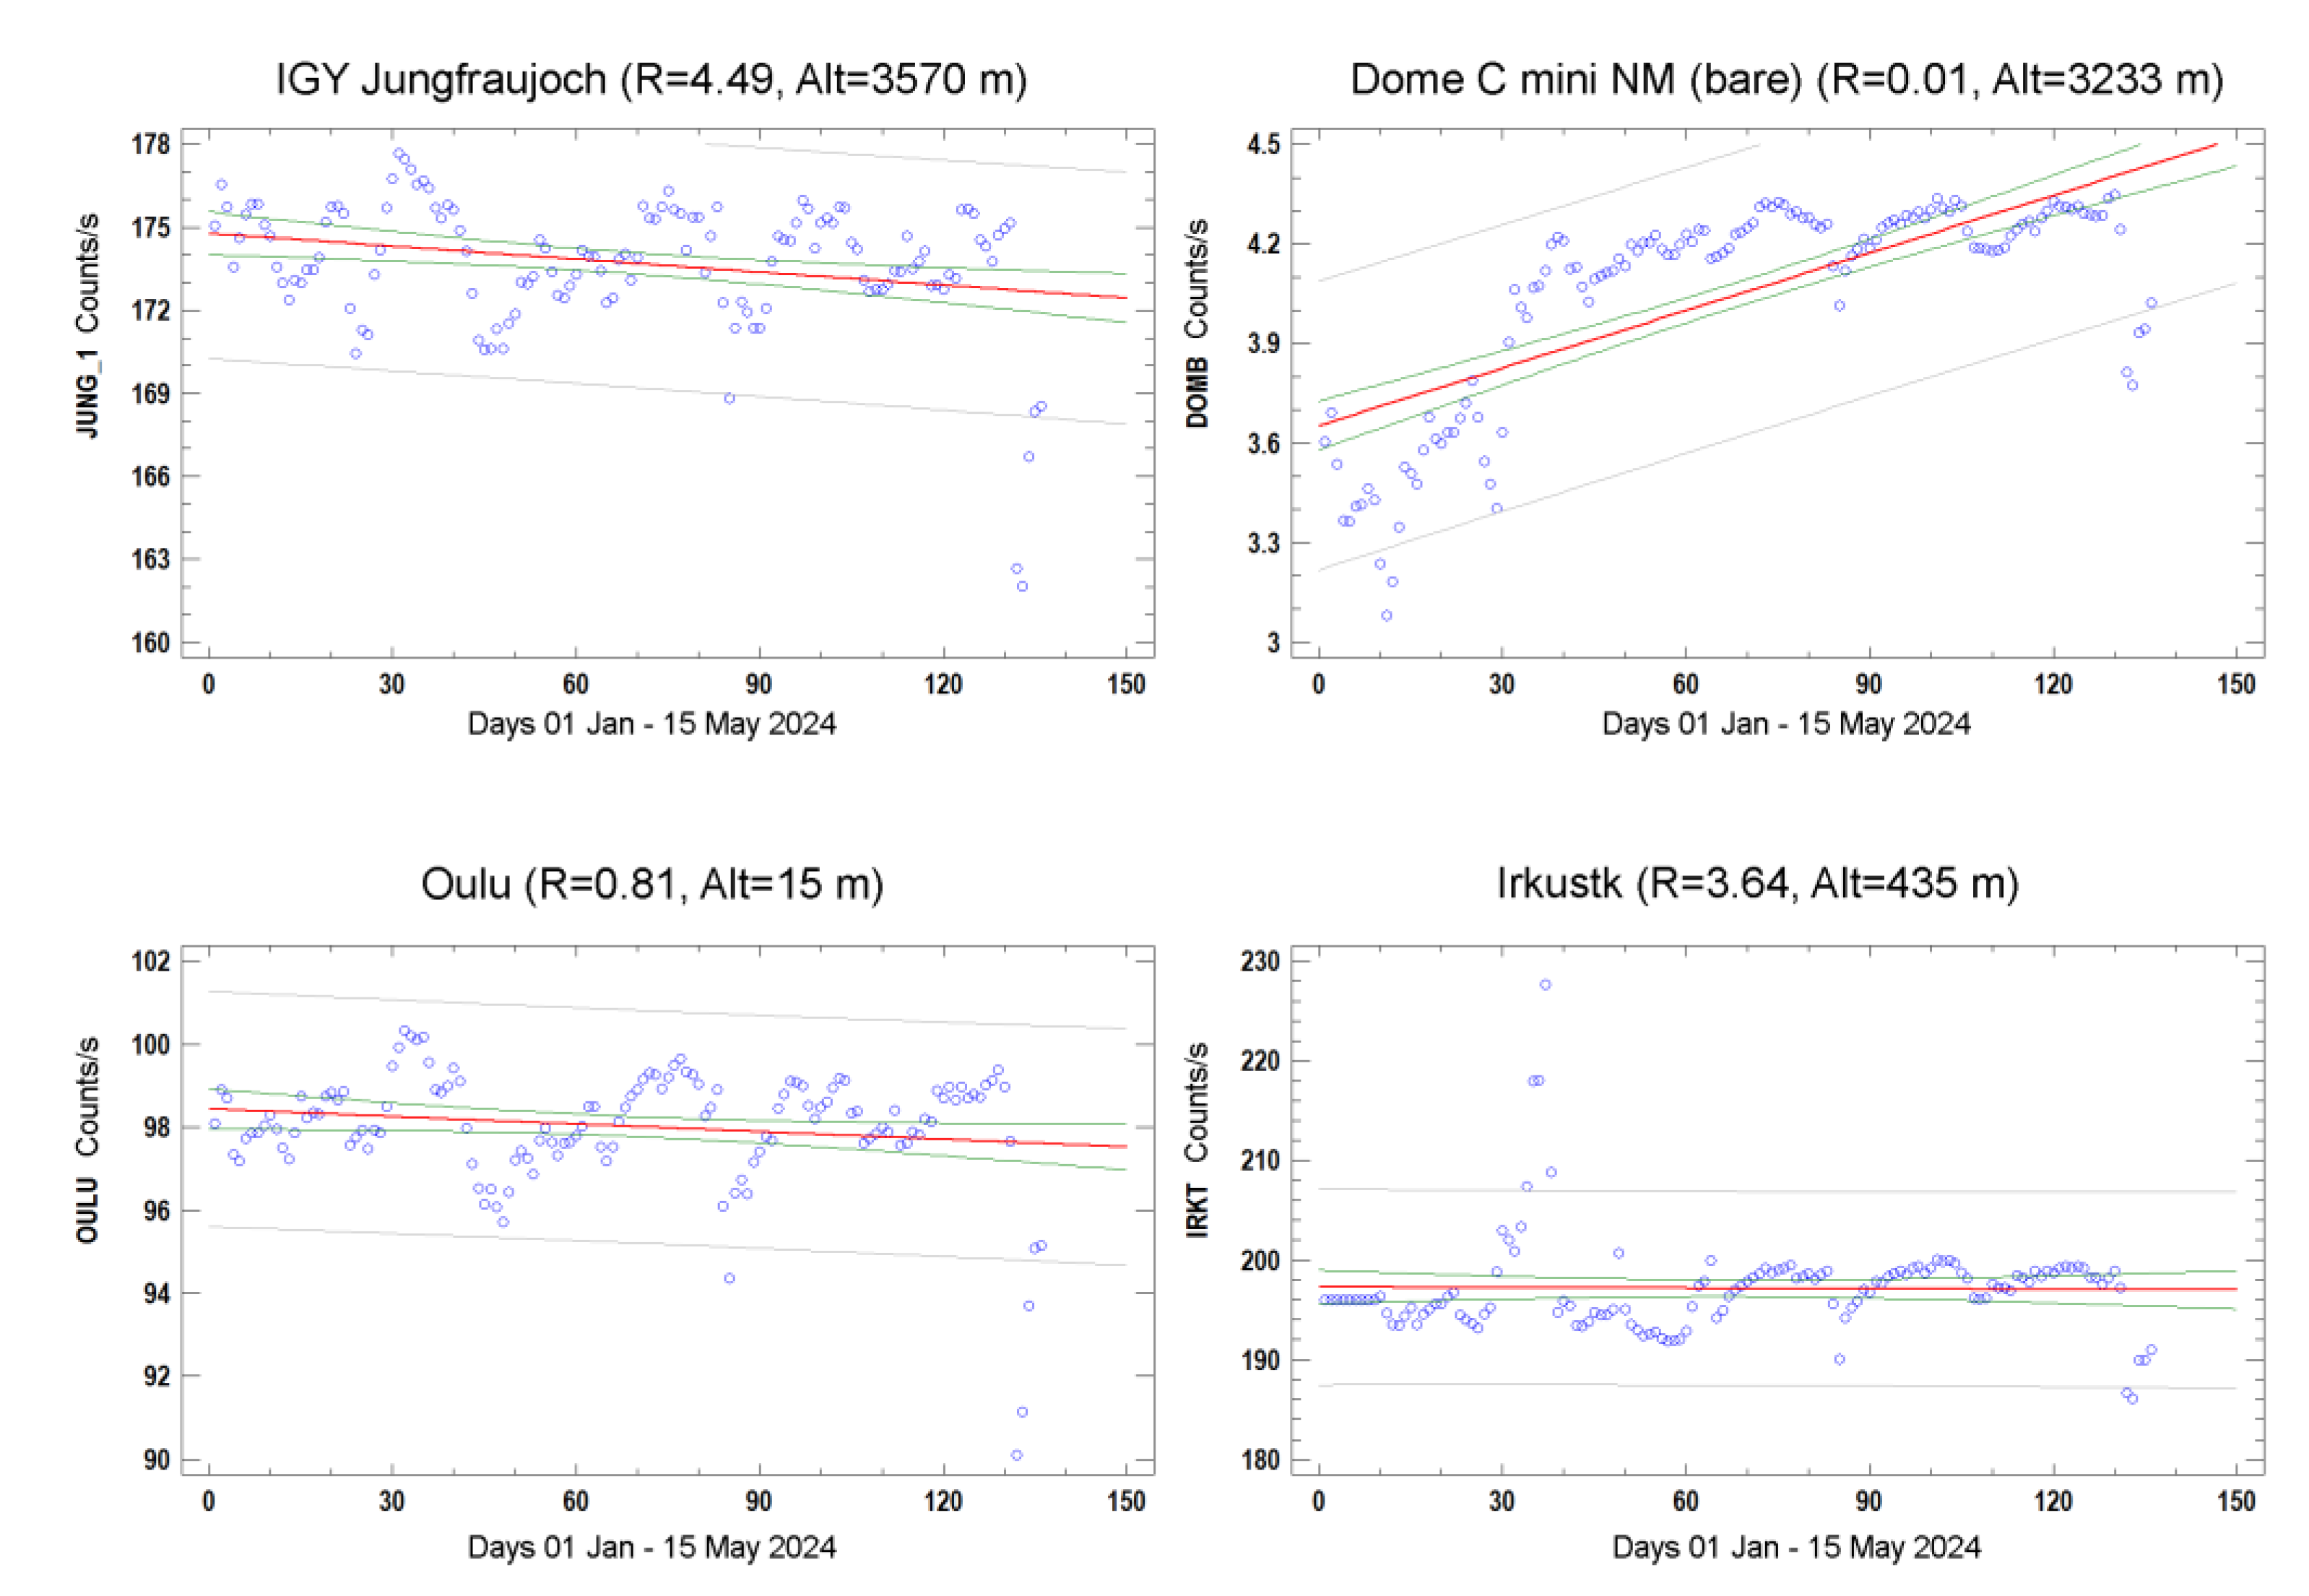
Other data from the NMDB network (cosmic neutron monitors) show different trends (
Figure A3). The typical shape of a solar cycle often reveals a two-peak pattern (e.g., see cycle 24), so there is a good chance that we are at the top of the first peak of the current cycle 25. Actually, the sun is currently very active; a recent solar flare produced auroras visible at low latitudes in many parts of the world.
Figure A3.
Plots of cosmic neutrons from some detectors of the NMDB network (IGY-Jungfraujoch, Switzerland; Dome C, Antarctica; Oulu, Finland; Irkutsk, Russia).
Figure A3.
Plots of cosmic neutrons from some detectors of the NMDB network (IGY-Jungfraujoch, Switzerland; Dome C, Antarctica; Oulu, Finland; Irkutsk, Russia).
References
- Bonolis, Luisa. “Walther Bothe and Bruno Rossi: The birth and development of coincidence methods in cosmic-ray physics.” American Journal of Physics 79 (2011): 1133-1150.
- Maghrabi, A.; Makhmutov, V.S.; Almutairi, M.; Aldosari, A.; Altilasi, M.; Philippov, M.V.; Kalinin, E.V. Cosmic ray observations by CARPET detector installed in central Saudi Arabia-preliminary results. J. Atmos. Sol. Terr. Phys. 2020, 200, 105194.
- Marco Arcani, Cesare Guaita, Antonio Paganoni, VHANESSA expedition, Astroparticle Physics, Volume 53, 2014, Pages 100-106, ISSN 0927-6505,. [CrossRef]
- Arcani, M.; Conte, E.; Monte, O.D.; Frassati, A.; Grana, A.; Guaita, C.; Liguori, D.; Nemolato, A.R.M.; Pigato, D.; Rubino, E. The Astroparticle Detectors Array—An Educational Project in Cosmic Ray Physics. Symmetry 2023, 15, 294. [Google Scholar] [CrossRef]
- Rossi, B. Cosmic Rays; McGraw-Hill: New York, NY, USA, 1964; pp. 68–73. [Google Scholar]
- Rajpoot, H.C. HCR’s Theory of Polygon (proposed by Harish Chandra Rajpoot) solid angle subtended by any polygonal plane at any point in the space. Int. J. Math. Phys. Sci. Res. 2014, 2, 28–56. [Google Scholar]
- Janossy, L. Cosmic Rays; Oxford University press: Amen House, London, 1948; pp. 48–49. [Google Scholar]
- Grieder, P.K.F. (Ed.) Cosmic Ray Properties, Relations and Definitions. In Cosmic Rays at Earth; Elsevier: Amsterdam, The Netherlands, 2001; Chapter 1; pp. 25. Grieder, P.K.F. (Ed.) ISBN 9780444507105.
- Radiation Detector DIY Kit: http://f4fdw.free.fr/geiger/DIY%20Geiger%20Counter%20Radiation%20Detector%20Kit%20ver.2.pdf. (accessed on 10 May 2024).
- Geiger-Counter-Radiation D-v1.1-CAJOE: https://github.com/SensorsIot/Geiger-Counter-RadiationD-v1.1-CAJOE-/tree/master. (accessed on 10 May 2024).
- Hütten, Moritz and Karg, Timo and Schwerdt, Carolin and Steppa, Constantin and Walter, Michael. “The International Cosmic Day – An Outreach Event for Astroparticle Physics.” doi 10.22323/1.301.0405, "PoS", 2017, ICRC2017, p. 405.
- Arcani, M.; Liguori, D.; Grana, A. Exploring the Interaction of Cosmic Rays with Water by Using an Old-Style Detector and Rossi’s Method. Particles 2023, 6, 801–818. [Google Scholar] [CrossRef]
- D. Liguori “MoCRiS: a stratospheric project for an innovative approach to science education”CERN Teaching Methods for Science, 2023; 1(1): 7-12. [CrossRef]
- F. Hess, Uber Beobachtungen der durchdringenden Strahlung bei sieben Freiballonfahrten, Physikalische Zeitschrift, XIII, p. 1084-1091, (1912).
- E. Regener, G. Pfotzer, Intensity of the Cosmic Ultra-Radiation in the Stratosphere with the Tube-Counter, Nature, 134, p. 325–325, (1935).
- E. Regener, G. Pfotzer, Vertical Intensity of Cosmic Rays by Threefold Coincidences in the Stratosphere, Nature, 136, p. 718–719.
- Holovatyy, A.; Teslyuk, V.; Kryvinska, N.; Kazarian, A. Development of Microcontroller-Based System for Background Radiation Monitoring. Sensors 2020, 20, 7322. [Google Scholar] [CrossRef] [PubMed]
- United Nations Scientific Committee on the Effects of Atomic Radiation (2008). Sources and effects of ionizing radiation. New York: United Nations (published 2010). p. 4. ISBN 978-92-1-142274-0. (accessed on 16 May 2024).
- Restier-Verlet J, El-Nachef L, Ferlazzo ML, Al-Choboq J, Granzotto A, Bouchet A, Foray N. Radiation on Earth or in Space: What Does It Change? Int J Mol Sci. 2021 Apr 3;22(7):3739. [CrossRef] [PubMed]
Figure 1.
Artistic image of an atmospheric shower.
Figure 1.
Artistic image of an atmospheric shower.
Figure 2.
Schematic representation of the field of view by the AMD5 detector.
Figure 2.
Schematic representation of the field of view by the AMD5 detector.
Figure 3.
Inclination of the detector with respect to the zenithal angle.
Figure 3.
Inclination of the detector with respect to the zenithal angle.
Figure 4.
Graph obtained from experimental data, it shows the value of n as a function of the moment in GeV (Bhattacharyya, 1974).
Figure 4.
Graph obtained from experimental data, it shows the value of n as a function of the moment in GeV (Bhattacharyya, 1974).
Figure 5.
Simplify block diagram for the electronics of the DIY Geiger counter kit.
Figure 5.
Simplify block diagram for the electronics of the DIY Geiger counter kit.
Figure 6.
Output signals from the GMTs and the electronic board: (a) measurement of the pulse width directly from the GMTs (test circuit not shown); (b) signals from the board as shown, the square pulse of 1 ms width is the final output.
Figure 6.
Output signals from the GMTs and the electronic board: (a) measurement of the pulse width directly from the GMTs (test circuit not shown); (b) signals from the board as shown, the square pulse of 1 ms width is the final output.
Figure 7.
The two boards assembled together.
Figure 7.
The two boards assembled together.
Figure 8.
Last operations for the construction of the muon detector: (a) soldering of four wires towards the coincidence board; (b) schematic of the coincidence board and 3D outcome from the Kicad software.
Figure 8.
Last operations for the construction of the muon detector: (a) soldering of four wires towards the coincidence board; (b) schematic of the coincidence board and 3D outcome from the Kicad software.
Figure 9.
Ended version of an AMD5ALI prototype.
Figure 9.
Ended version of an AMD5ALI prototype.
Figure 10.
Quick analysis of three detector data sets from January to December 2023 (daily average). (a) Muon detector AMD5 Id02 plot; (b) Muon detector AMD15 Id25 plot; (c) simple regression of the two muon detectors; (d) Dosimeter AMDRAD Id06 plot; for (a), (b), and (d), the red dotted line represents a running mean (ADA project network).
Figure 11.
AMD5 counts per minute (cpm for a single GMT) as a function of atmospheric pressure. The counts increase with decreasing atmospheric pressure, indicating the balloon's ascent in altitude. Till about 500 hPa (Hess reached 5200 m), the trend reproduces Hess's results. The counts reach a maximum, replicating the historical findings of Regener and Pfotzer.
Figure 12.
Row schematic of the mounting for the muon telescope.
Figure 12.
Row schematic of the mounting for the muon telescope.
Figure 13.
Rate of incoming muon at different angles starting from the Zenit. Error bars are calculated following Poissonian statistics, which is the square root of counts, then divided by the sampling time.
Figure 13.
Rate of incoming muon at different angles starting from the Zenit. Error bars are calculated following Poissonian statistics, which is the square root of counts, then divided by the sampling time.
Figure 14.
The figure shows how the Monte Carlo was done: particles were generated on the top detector and then moved in a random direction. Geometric acceptance is calculated as a fraction of those crossing the second layer (green ones) over the total number of particles (red and green).
Figure 14.
The figure shows how the Monte Carlo was done: particles were generated on the top detector and then moved in a random direction. Geometric acceptance is calculated as a fraction of those crossing the second layer (green ones) over the total number of particles (red and green).
Table 1.
False coincidence rate (for AMD5 CW2 = 0.2 ms, while for AMD5ALI CW2 = 1 ms).
Table 1.
False coincidence rate (for AMD5 CW2 = 0.2 ms, while for AMD5ALI CW2 = 1 ms).
| Detector |
N (average) [cps] |
A-CW1 (60ms) [cps] |
A-CW2 (0.2ms/1ms) [cps] |
| AMD5 (SBM20 GMTs) |
4.01 10–1 ± 0.01 |
1.93 10–2
|
6.43 10–5
|
| AMD5ALI (J305 GMTs)a
|
3.72 10–1 ± 0.01 |
1.66 10–2
|
2.77 10–4
|
Table 2.
Zenith angle dependence test for AMD5 (uncertainty expressed as standard error).
Table 2.
Zenith angle dependence test for AMD5 (uncertainty expressed as standard error).
| Coincidence window |
Rate (θ0°) [cpm] |
Rate (θ45°) [cpm] |
Ratio |
| CW1 |
2.75 ± 0.1 |
2.01 ± 0.1 |
0.73 |
| CW2 |
5.80 10–1 ± 0.05 |
3.32 10–1 ± 0.03 |
0.57 |
Table 3.
J305 Geiger Tube Specification.
Table 3.
J305 Geiger Tube Specification.
| Type |
Glass, Tin oxide Cathode, Coaxial cylindrical thin shell structure (Wall density 50±10cg/cm2)10–5
|
| Application temperature |
-40°C~55°C |
| Application detection |
Both beta and gamma radiation |
| γ sensitivity |
20mR/h~120mR/h |
| Sensivity to β Radiation |
range 100~1800 ChangingIndex/minutes·cm2 soft β Ray1
|
| Sensivity to γ Radiation |
0.1 MeV |
| Background |
0.2 Pulses/second2
|
| Working Voltage |
380-450V |
| Working Current |
0.015-0.02 mA |
| Length |
90±3mm and 107±3mm |
| Diameter |
10±0.5mm |
Table 4.
Zenith angle dependence test using the narrow coincidence window CW2.
Table 4.
Zenith angle dependence test using the narrow coincidence window CW2.
| Detector |
Rate (θ0°) [cpm] |
Rate (θ45°) [cpm] |
Ratio |
| AMD5ALI |
2.55 10–1 ± 0.05 |
1.55 10–1 ± 0.05 |
0.60 |
| 2.43 10–1 ± 0.05* |
1.23 10–1 ± 0.05* |
0.50 |
| AMD5 |
5.80 10–1 ± 0.05 |
3.32 10–1 ± 0.03 |
0.57 |
| 4.68 10–1 ± 0.04* |
2.76 10–1 ± 0.05* |
0.59 |
|
Disclaimer/Publisher’s Note: The statements, opinions and data contained in all publications are solely those of the individual author(s) and contributor(s) and not of MDPI and/or the editor(s). MDPI and/or the editor(s) disclaim responsibility for any injury to people or property resulting from any ideas, methods, instructions or products referred to in the content. |
© 2024 by the authors. Licensee MDPI, Basel, Switzerland. This article is an open access article distributed under the terms and conditions of the Creative Commons Attribution (CC BY) license (http://creativecommons.org/licenses/by/4.0/).
