Preprint
Article

Anti-Proliferative and Cytoprotective Activity of Ethylenediurea Derivatives with Alkyl and Oxygen-containing Groups as Substituents

Altmetrics

Downloads

102

Views

85

Comments

0

Submitted:

27 May 2024

Posted:

27 May 2024

You are already at the latest version

Alerts
Abstract
Natural cytokinins are a promising group of cytoprotective and anti-tumor agents. In this research, we synthesized a set of novel cytokinin analogs with alkyl substituents at various positions of the aromatic moiety, as well as with oxygen-containing groups, and tested their antiproliferative activity in MDA-MB-231, A-375, and U-87 MG cell lines, and cytoprotective properties in H2O2 and CoCl2 models. Two amino-linked compounds were anti-proliferative with the ability to act synergistically with doxorubicin, and two carbamate-based ones were cytoprotective. According to the molecular docking data, anti-proliferation was based on the A2AR and APRT inhibition and cytoprotection on the CDK2 inhibition. The obtained results are promising for the development of novel anti-cancer therapeutics.
Keywords: 
Subject: Chemistry and Materials Science  -   Medicinal Chemistry

1. Introduction

Plant-isolated compounds [1], such as flavonoids [2,3,4] and phytohormones, as well as their synthetic analogs [5,6,7,8,9] are considered to be very promising as potential anti-cancer agents.
Among phytohormones, cytokinins and their derivatives are particularly noteworthy due to their anticancer [7,10], antiproliferative activity [9,11], and immunomodulatory properties [10,12]. The first attempt to enhance the activity of cytokinins was the synthesis of their ribosides. The ribosides of adenine cytokinins exhibit varying degrees of cytotoxic properties against a wide range of malignant human tumor cells, including glioblastoma, rhabdomyosarcoma, melanoma, breast cancer, leukemia, colon cancer, lung cancer, tumors of the central nervous system, prostate, ovarian, and kidney cancers [7,13,14,15]. Ortho-topolin riboside has high activity (IC50 = 0.5-11.6 μM) against several human malignant cell lines [15].
Although the cytotoxic activity of the ribosides trans-Zeatin, N6-(2-Isopentenyl)adenine, and benzyl aminopurine against tumor cells was demonstrated as early as the end of the 1960s to the middle of the 1970s, these compounds were not introduced into medical practice due to their low selectivity [7,14,16]. To alleviate this problem, another chemical modifications of cytokinins were proposed. A typical example is, forchlorfenuron (CPPU) [17] (Figure 1) that inhibits proliferation, migration, and invasion in cells of various types of oncological diseases, such as tumors of the prostate, mesothelioma, lung, colon, breast, ovary, and cervix. Additionally, CPPU was shown to inhibit tumor growth in mouse trials [18]. Forchlorfenuron derivatives with oxygen and sulfur-containing groups at significantly lower doses (4-33 μM versus 100 μM for CPPU) inhibit the proliferation of cancer cells in several endometrial and ovarian cell lines [17]. However, in agricultural use, CPPU is known to promote cell division and growth, which could potentially lead to undesirable proliferative effects in humans [17].
Given the aforementioned problems and promises with the existing cytokinin analogs, we proposed another modification of these compounds, ethylenediurea (EDU). In crops, it mainly acts as a protective agent against the damaging effects of ozone and increases the phytotoxicity of many herbicides that are degraded in plants by oxygenases. A set of aryl carbamate and aryl urea EDU analogs with chlorine substitutions were synthesized and tested on antiproliferative activity in MDA-MB-231, A-375, and U-87 MG cell lines, and cytoprotective properties in H2O2 and CoCl2 models [11,19,20]. Aryl carbamates with the oxamate moiety were anti-proliferative for some cancer cell lines, while the aryl ureas were inactive. In the cytoprotection studies, all the derivatives displayed only little or no activity. The possible molecular targets of aryl carbamates' anti-proliferative action may be the adenosine A2 receptor and CDK2 [11]. However, the observed anti-cancer and cytoprotective activity was rather low (about 30% decrease in cell proliferation at the concentration of the substances of 100 µM), and thus a search for a more active derivatives of this kind seems to be an interesting task.
In this work, ten novel EDU derivatives with alkyl and oxygen-containing groups as substituents at various positions in the aromatic moiety were tested for anti-proliferative and cytotoxic activity in MDA-MB-231, U-87 MG, and A-375 cell lines, as well as for their cytoprotective activity in the H2O2 and CoCl2 toxicity tests on SH-SY5Y cell line. Two of the compounds displayed a selective anti-proliferative activity towards breast cancer and melanoma cell lines. This activity was synergetic with doxorubicin and antagonistic with temozolomide. The probable targets in this case were the A2AR receptor and APRT. Two other compounds displayed a slight cytoprotective activity, which relied on CDK2 inhibition.

2. Results

2.1. Compound Synthesis

New EDU derivatives (1-10) were obtained in a known way according to Scheme 1, from 2-imidazolidinone with an aminoethyl or with a hydroxyethyl substituent by reaction with various aryl isocyanates in the presence of triethylamine in anhydrous acetonitrile, as described in [11,20]. The resulting substances are crystalline white powders, poorly soluble in water and alcohols, and highly soluble in DMSO. They are stable when stored at room temperature, slightly hygroscopic. The main physicochemical characteristics of compounds (1-10) including NMR spectra are given in the Supplement.

2.2. Anti-Proliferative Activity of the Synthesized Compounds

First, we tested the synthesized compounds for their ability to induce cell death or decrease proliferation in a set of cancer cell lines. We used human cell lines of three major cancer types (glioblastoma U-87 MG, melanoma A-375, metastatic breast cancer MDA-MB-231), and a neuroblastoma SH-SY5Y, which was later intended to be a model in a cytoprotection setting. The cells were incubated with the test compounds overnight, and their proliferation was evaluated using the resazurin assay. The incubation time was chosen to model an acute toxic effect of a substance, for which a short incubation is just enough to elicit necrosis or apoptosis induction. In the case of substantial activity, additional experiments were carried out to evaluate the activity of the compounds after 72 h of incubation to detect the effects on cell proliferation. The compounds were assayed in the concentration range of 1–100 µM to account for the lowest potential load for the patient’s organism.
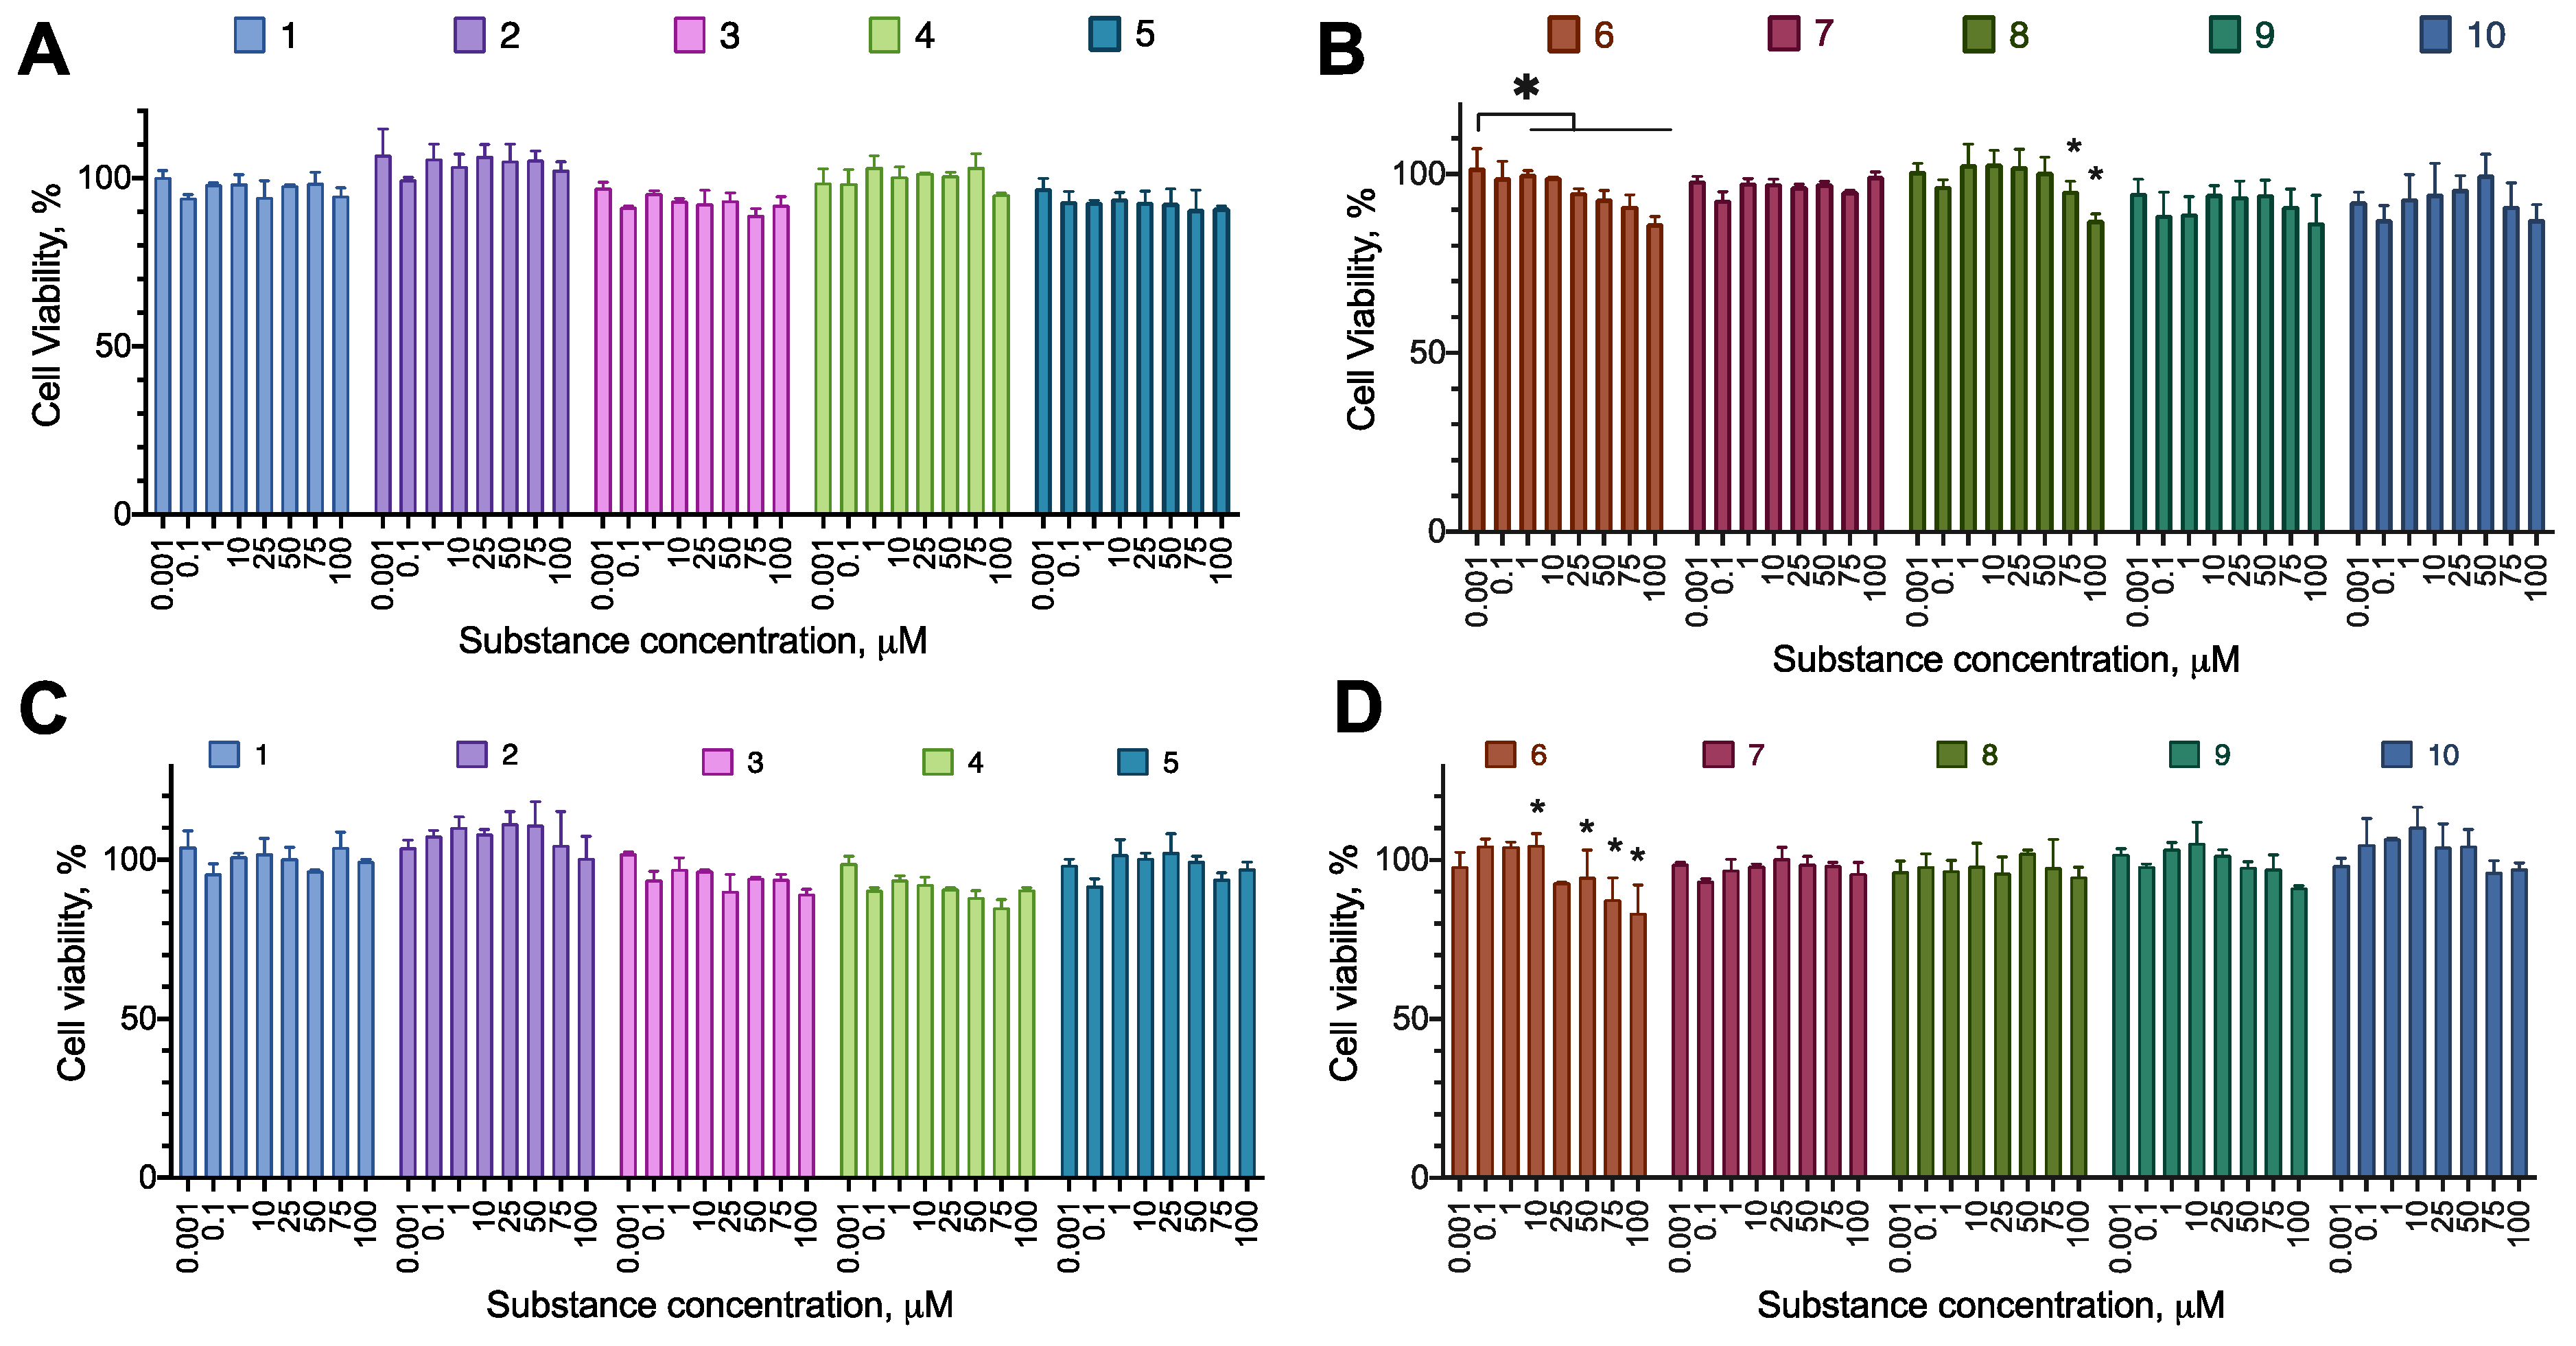
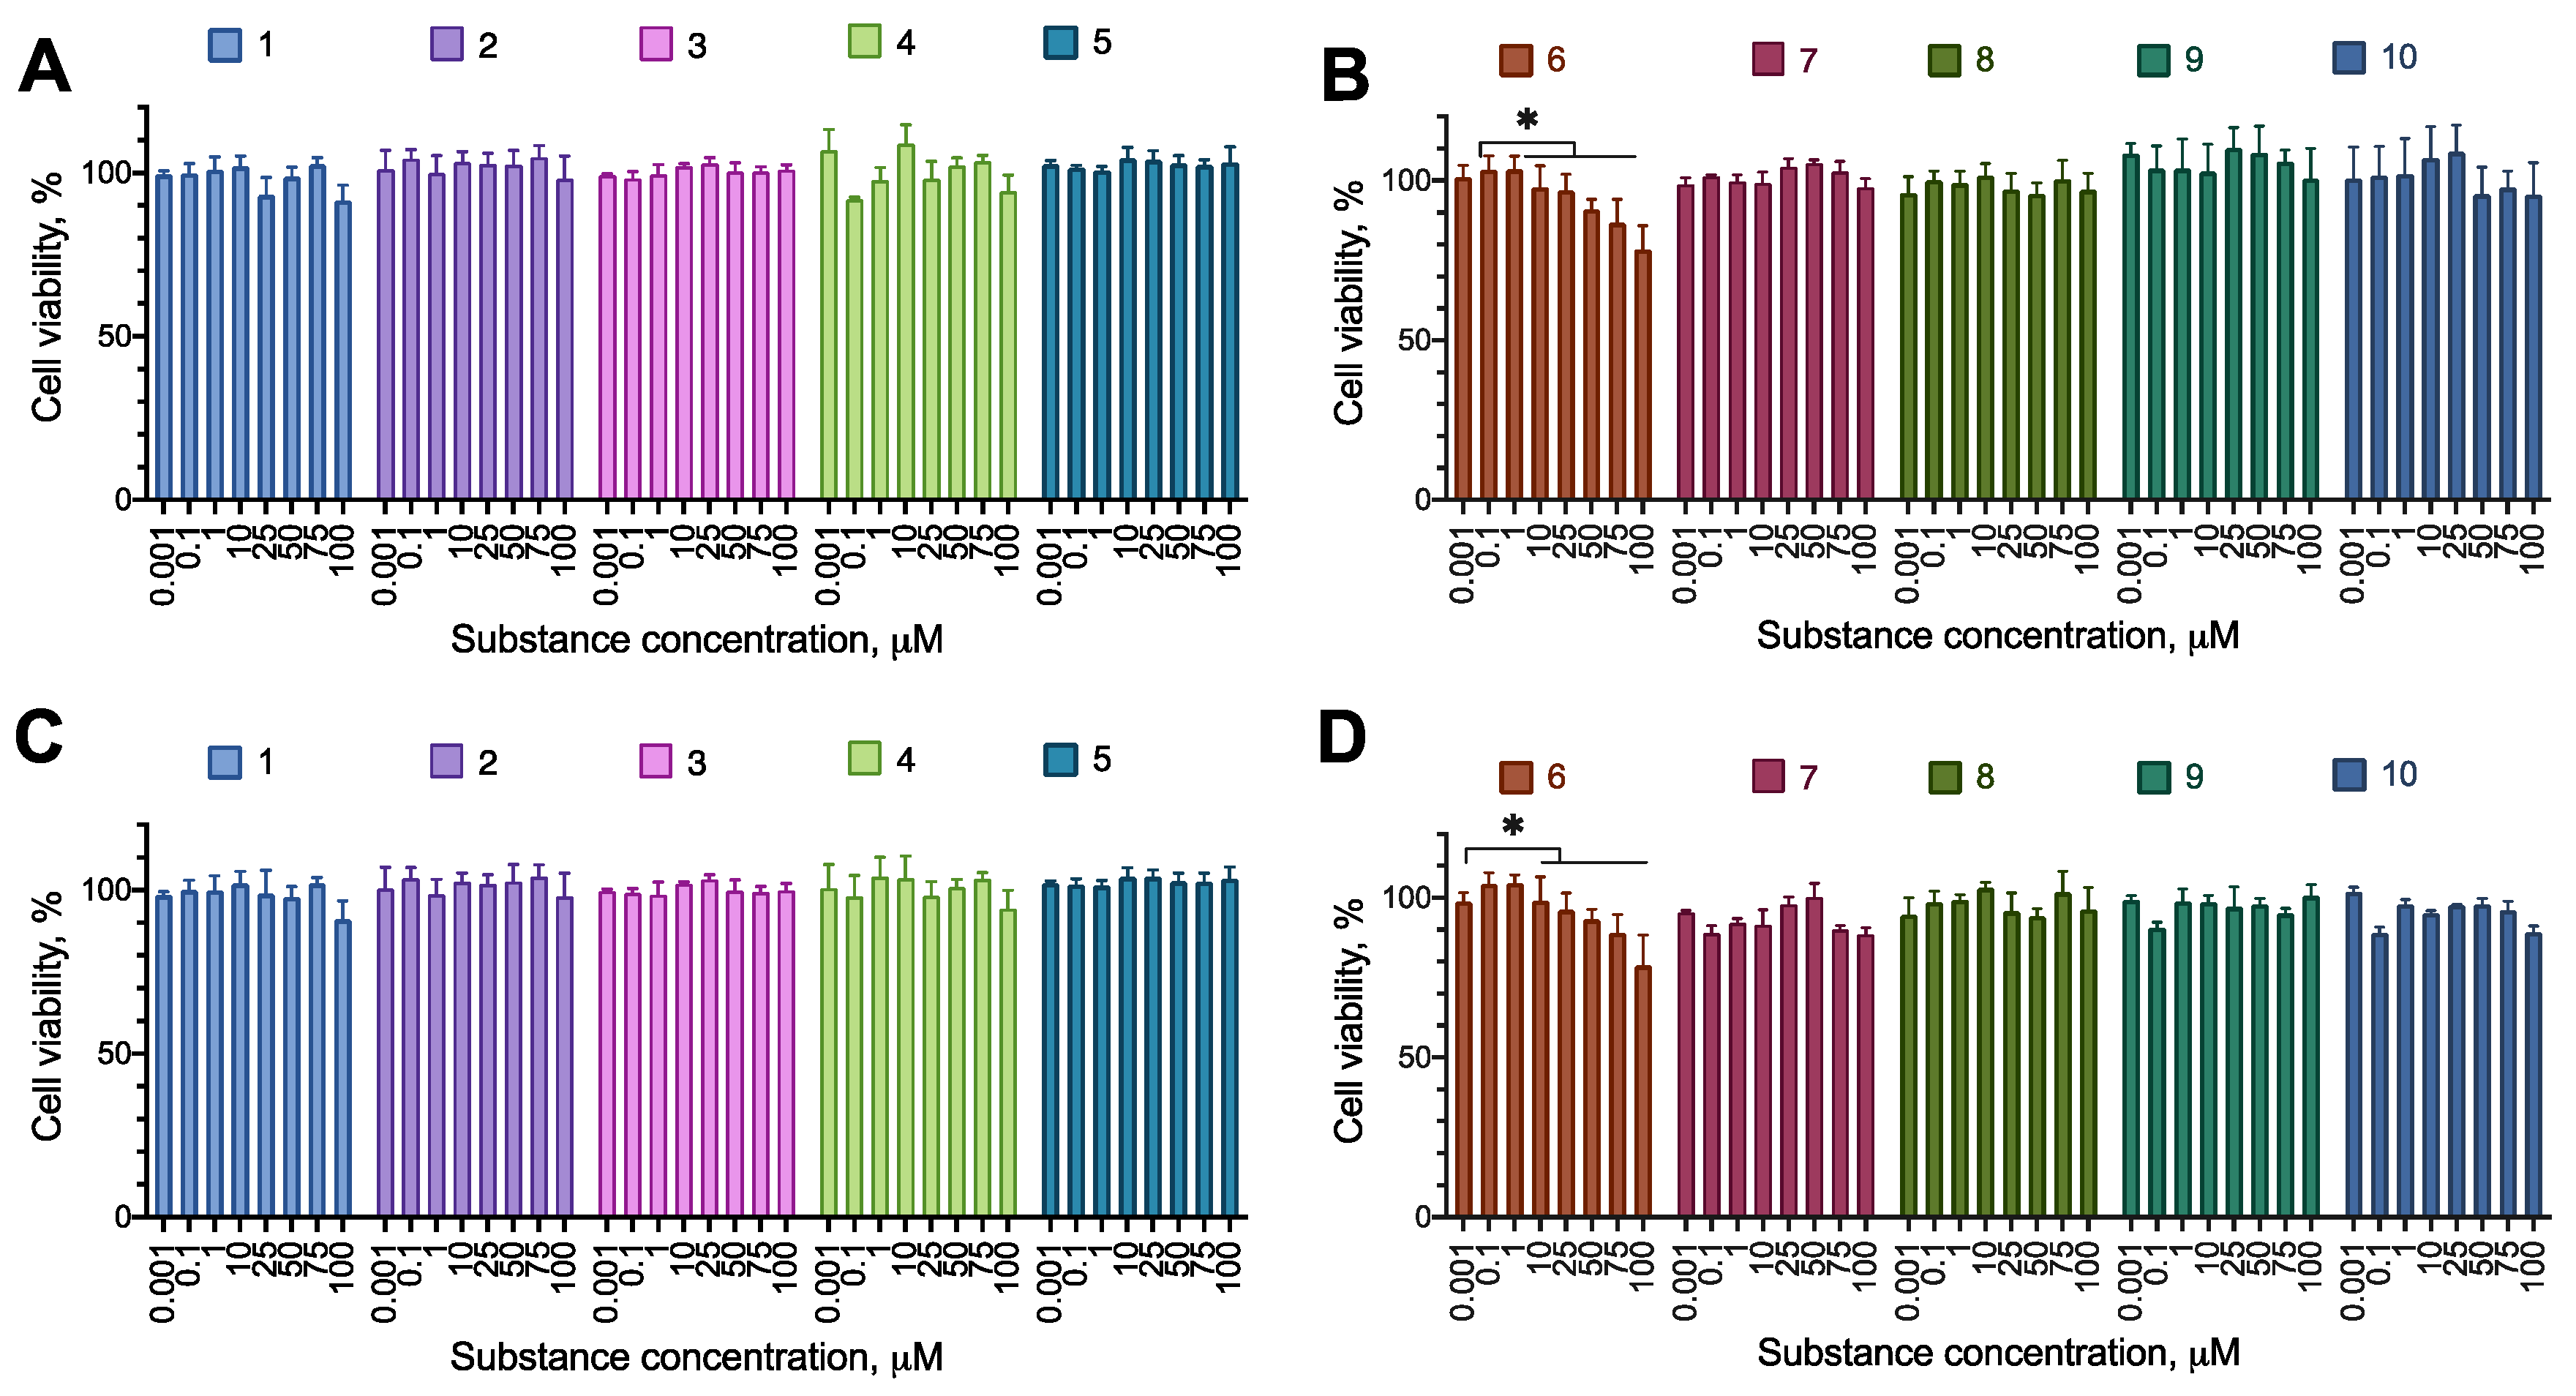
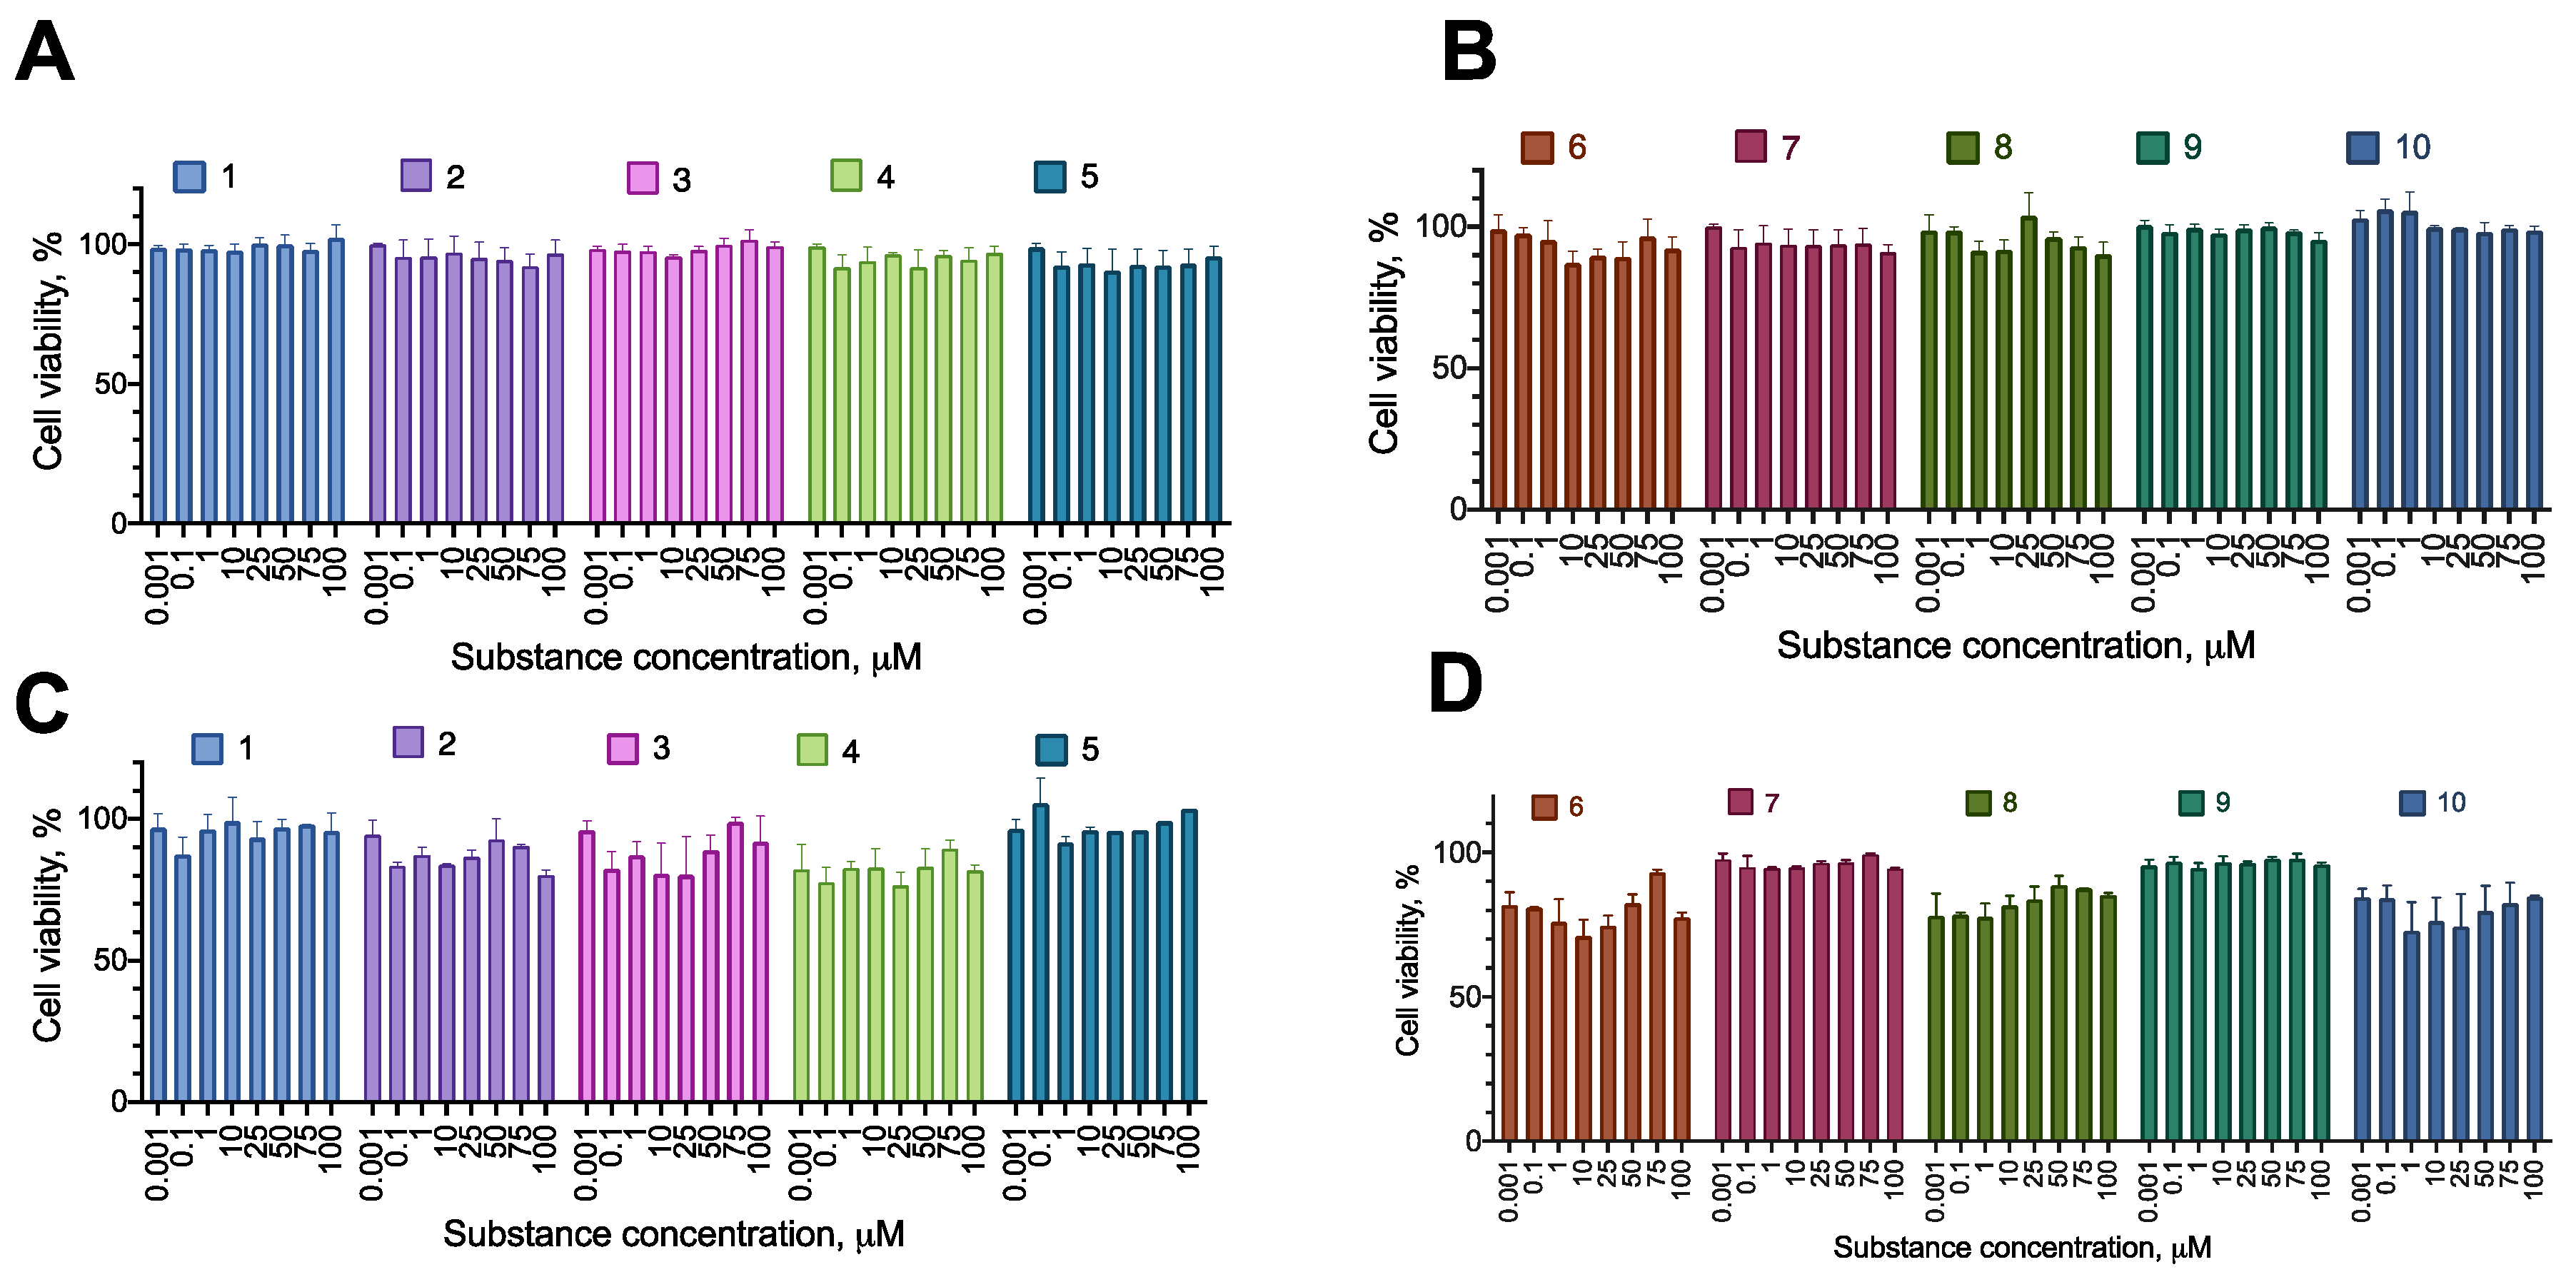
Most of the compounds displayed no cytotoxicity for all cell lines tested. Compound 6 had an anti-proliferative effect on the cell lines MDA-MB-231 and A-375, decreasing the cell viability by about 20% at the concentration of 100 µM. Compound 8 had an anti-proliferative effect on MDA-MB-231, decreasing the cell viability by about 20% at the concentration of 100 µM (Figure 2, Figure 3, Figure 4 and Figure 5; Table 2 and Table 3).
Thus, the compound 6 was chosen for further evaluation.

2.3. Selectivity of the Active Compounds

To investigate substance selectivity, we used normal immortalized human fibroblast cell line Bj-5ta in the same experimental setting as in the cytotoxicity studies.
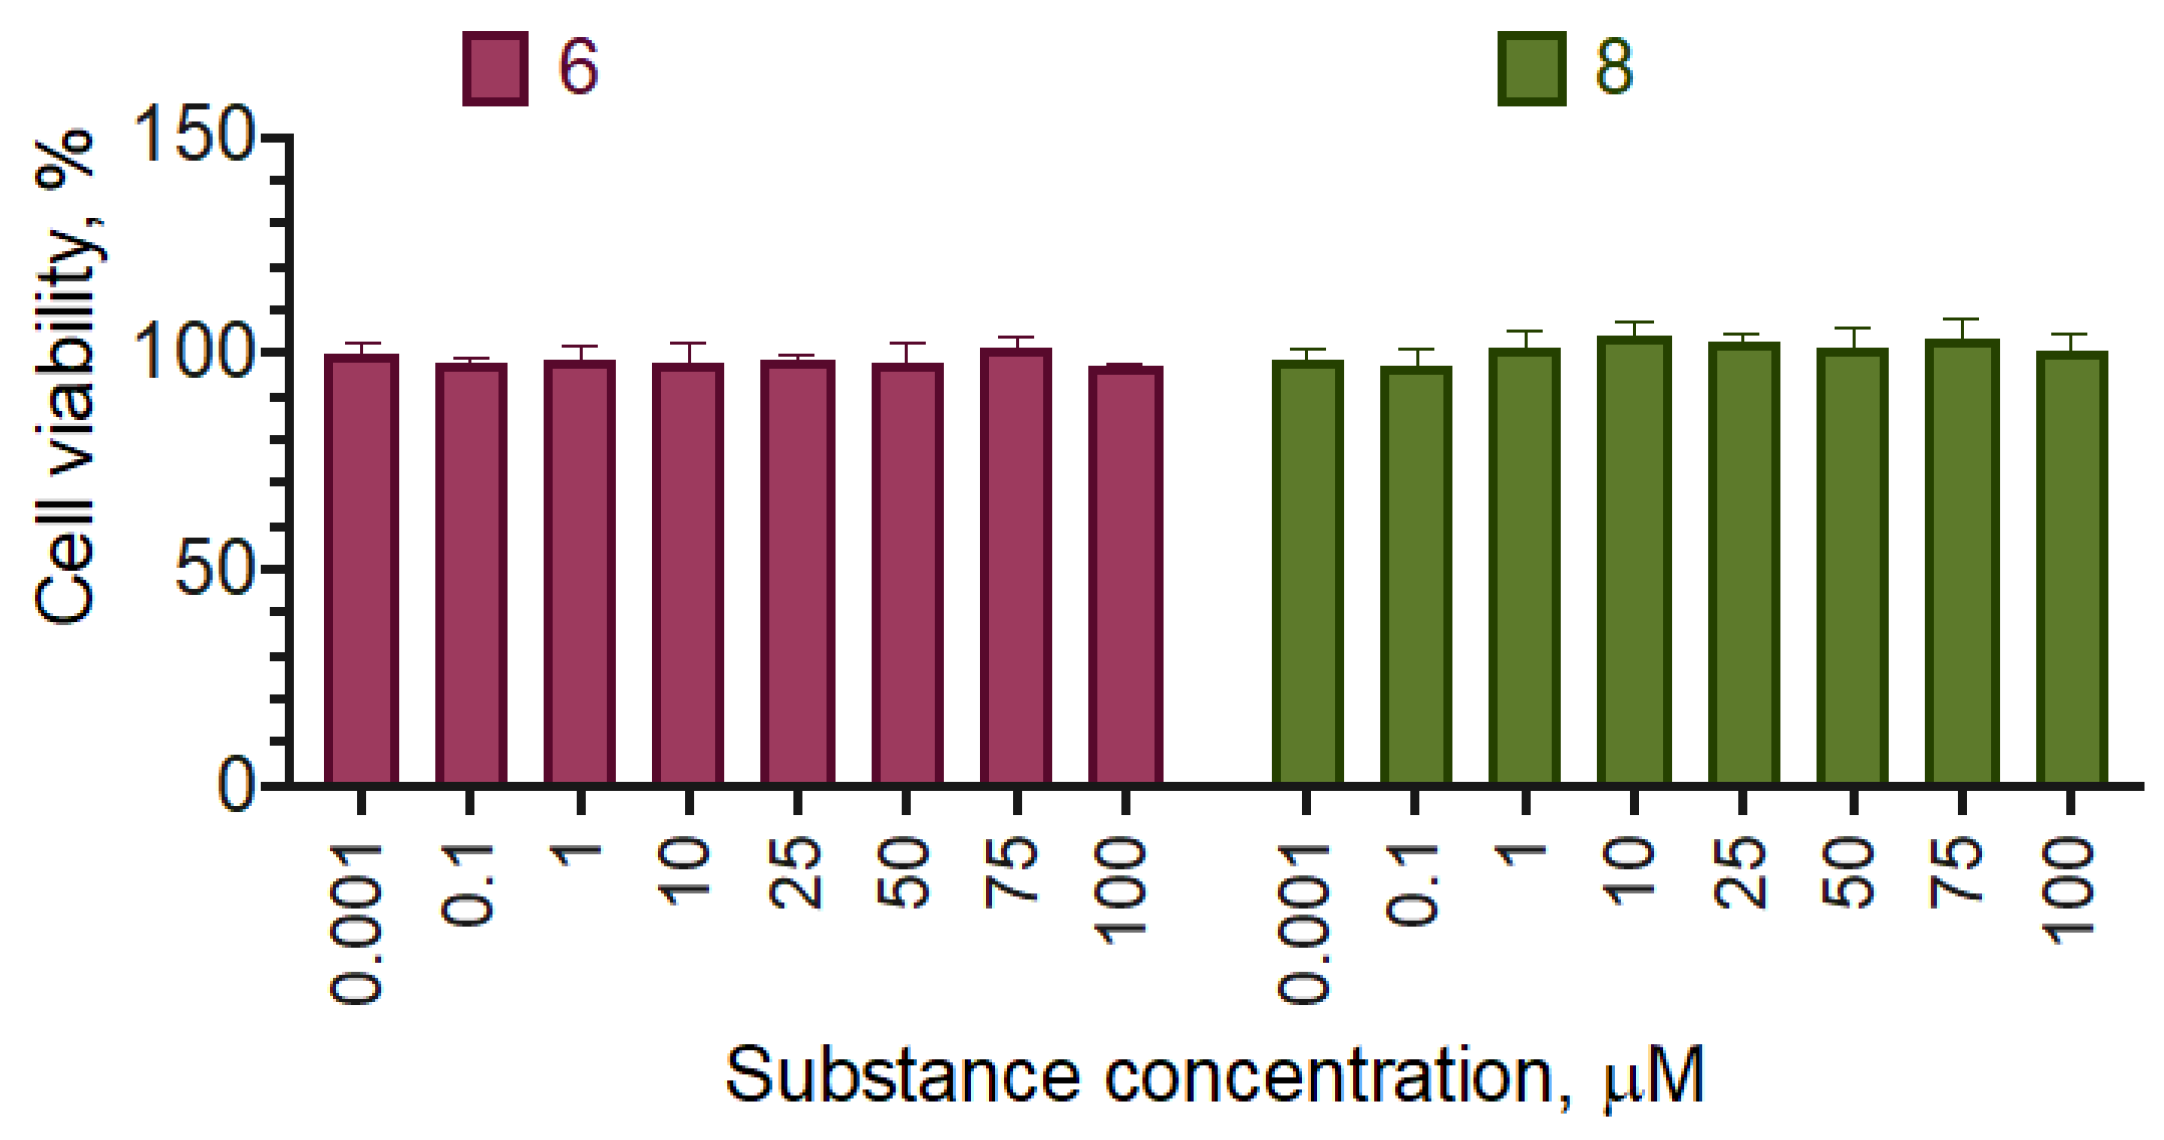
The chosen compounds 6 and 8 displayed no effect on the cell proliferation up to the concentration of 100 µM (Figure 6). The selectivity indices were not calculated, as neither of the compounds affected Bj-5ta cell line viability in the designated concentration range.

2.4. Mechanism of Action of Compound 6

An investigation of the mechanism of cell viability effects was performed for compound 6 on the MDA-MB-231 cell line as the most promising model. Several sets of experiments were performed: (1) lactate dehydrogenase (LDH) test for cell death; (2) measurement of the chronic incubation effects on the cell viability.
As far as the resazurin test cannot differentiate between proliferation inhibition and cell death (except for the extreme cases of 100% cell death), LDH test was performed. LDH is an intracellular enzyme that is released upon membrane destruction during necrosis or secondary apoptosis. Thus, if a compound treatment leads to an increase of the LDH activity in the cell culture medium, this is an indication of cell death induction.
Compound 6 treatment did not produce any LDH activity in the cell medium up to the concentration of 100 µM, indicating that this substance only inhibited cell proliferation (Figure 7).
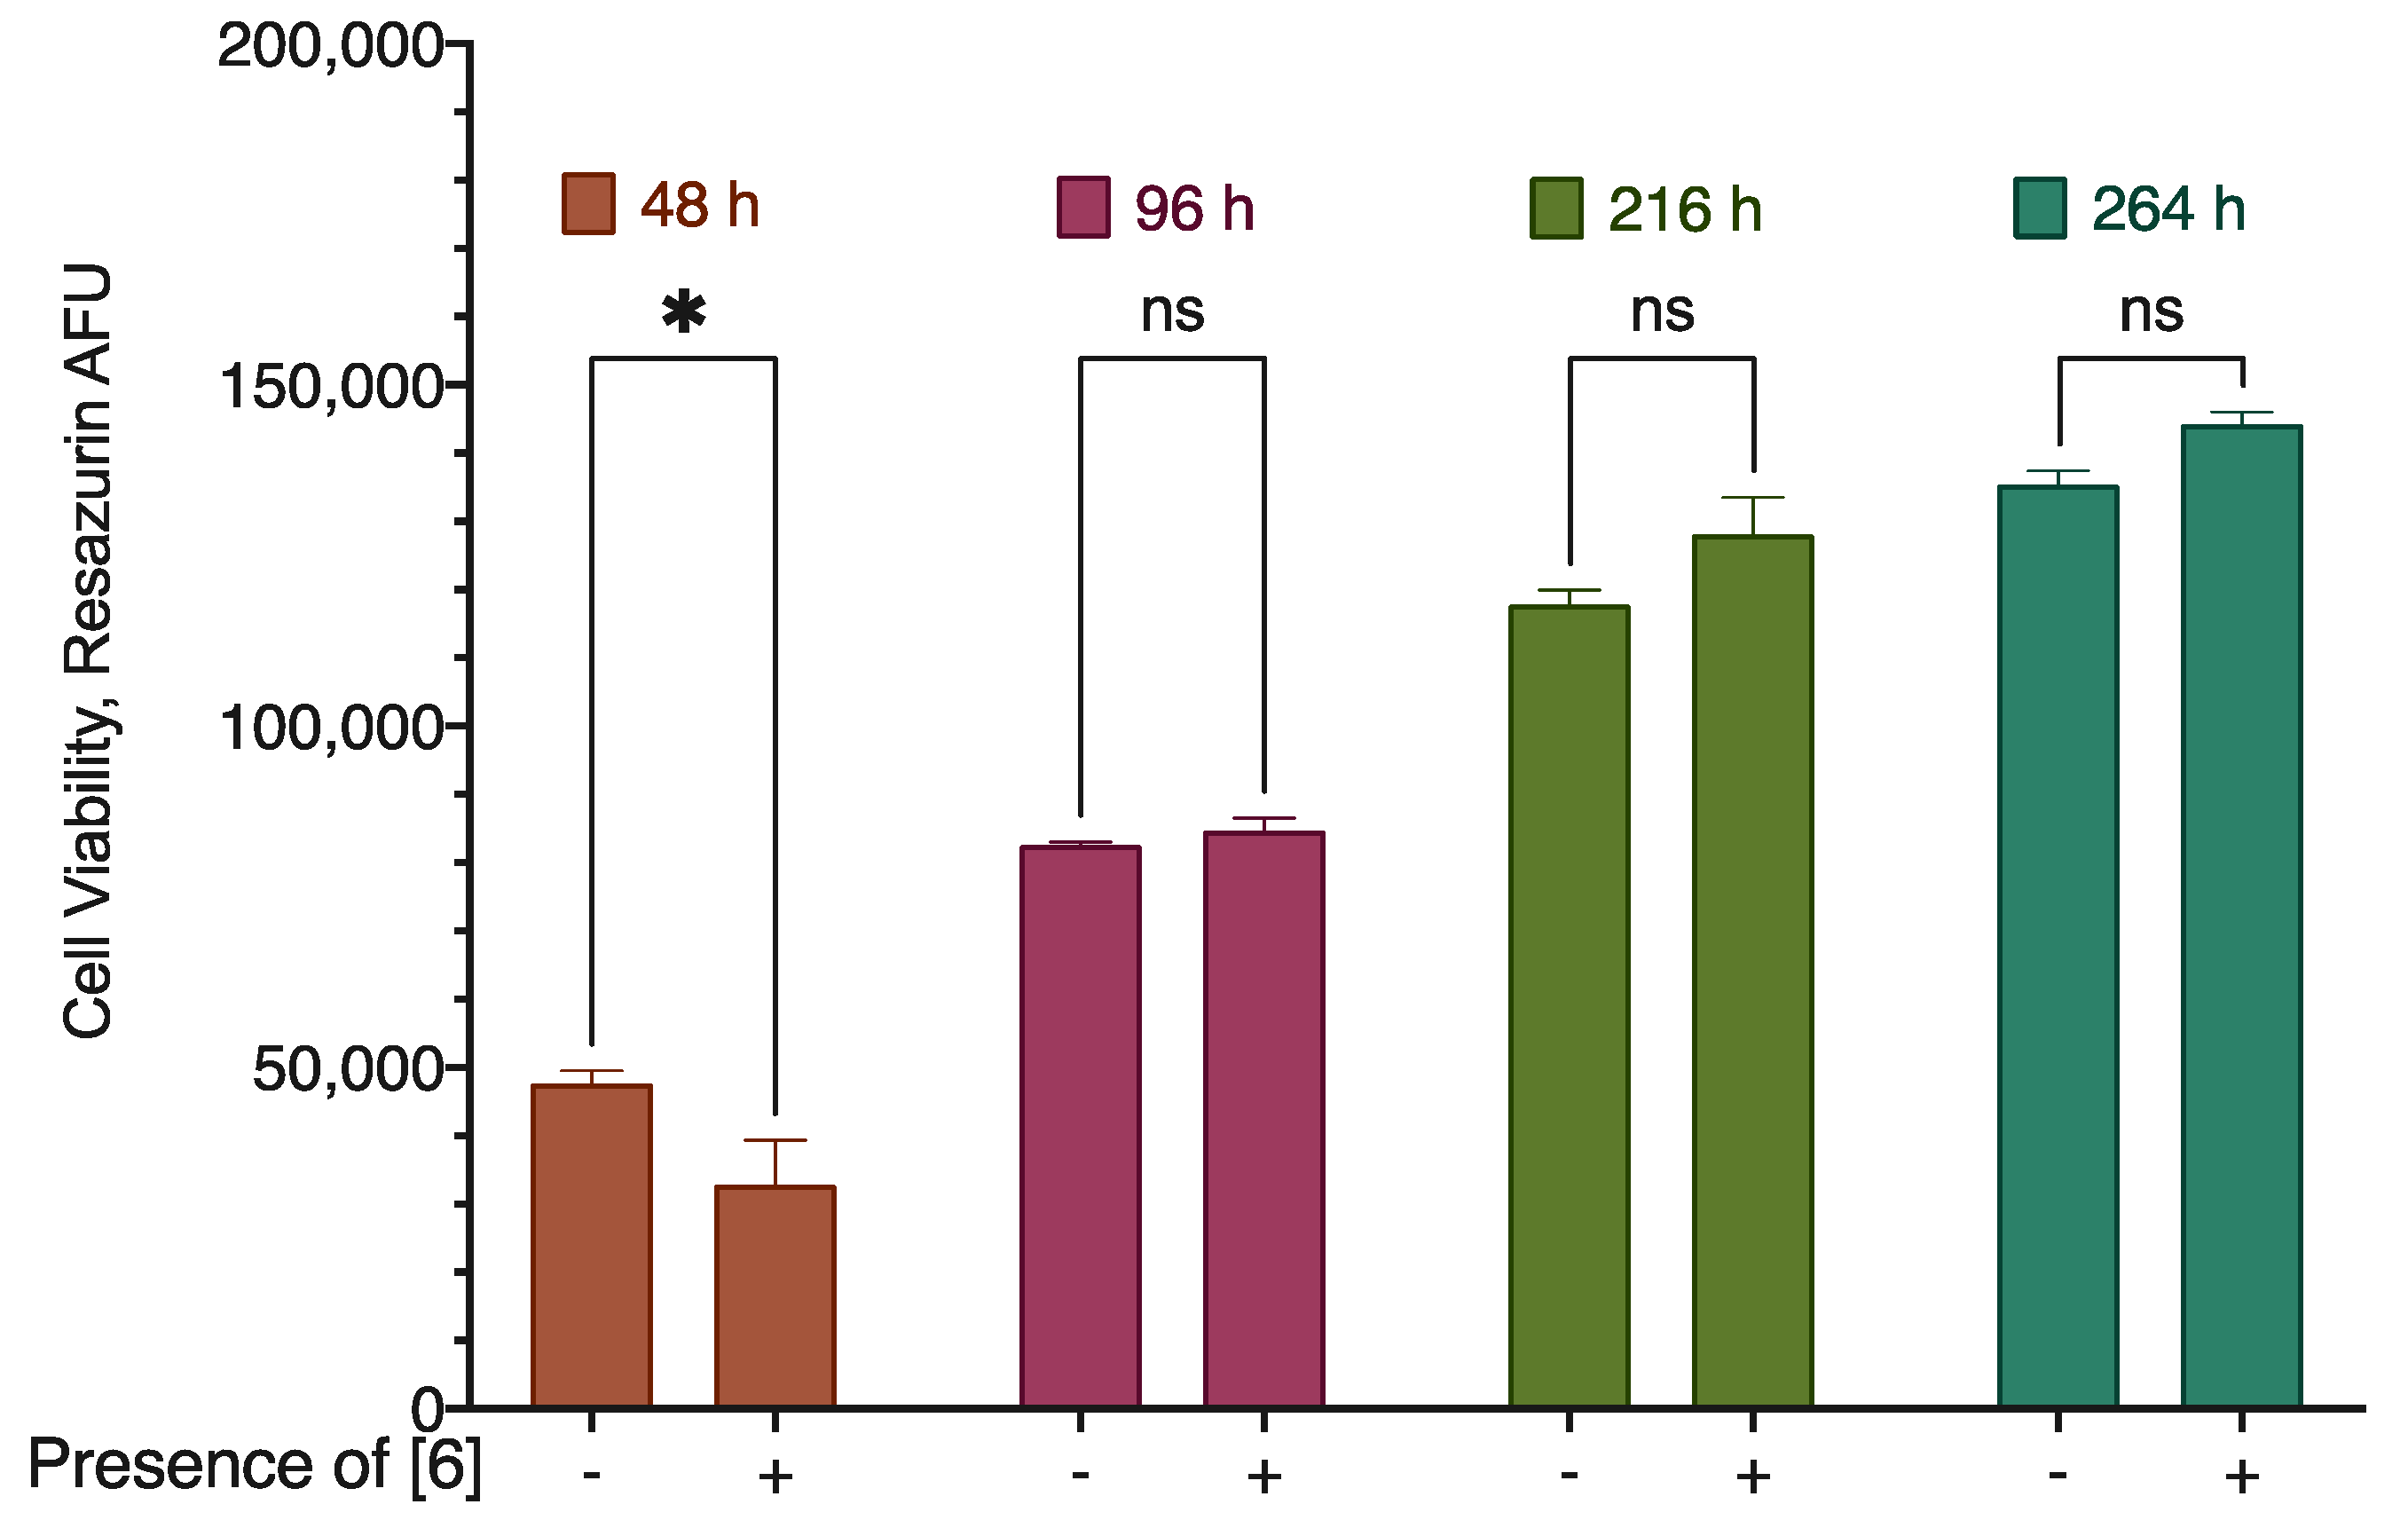
In the long-term experiments, after the forst 48 h of treatment, the compound reduced the cell viability by about 20%. However, these differences in cell viabilities between the treated and non-treated cells disappeared already after 96 h of the incubation time (Figure 8). Given that the fresh portion of the substance was added every 48 hours, these data indicate the ability of the cells to develop resistance to the compound action.

2.5. Combined Activity of Compound 6 with Doxorubicin and Temozolomide

Given that compound 6 action was anti-proliferative, we hypothesized that it could enhance the cytotoxic effects of the standard cytotoxic drugs, temozolomide, and doxorubicin. To test this hypothesis, we performed a 72-hour-long incubation of various concentrations of doxorubicin and temozolomide with 90 and 100 µM of 6 and evaluated the cell response using the resazurin and LDH test. As far as the action of temozolomide was mostly anti-proliferative, we didn’t run an LDH test for its combinations with compound 6. The concentrations of 6 were chosen around its maximum established active concentration. Two cell lines were used in this set of experiments: breast cancer MDA-MB-231, for which the activity of 6 was the most pronounced, and glioblastoma U-87 MG, for which temozolomide is a standard drug. To evaluate the mode of compound interaction, the coefficient of interaction (CI) was calculated according to the Chou-Talalay methodology [21]; the compounds with CI > 1 were considered synergetic, and with CI < 1 antagonistic.
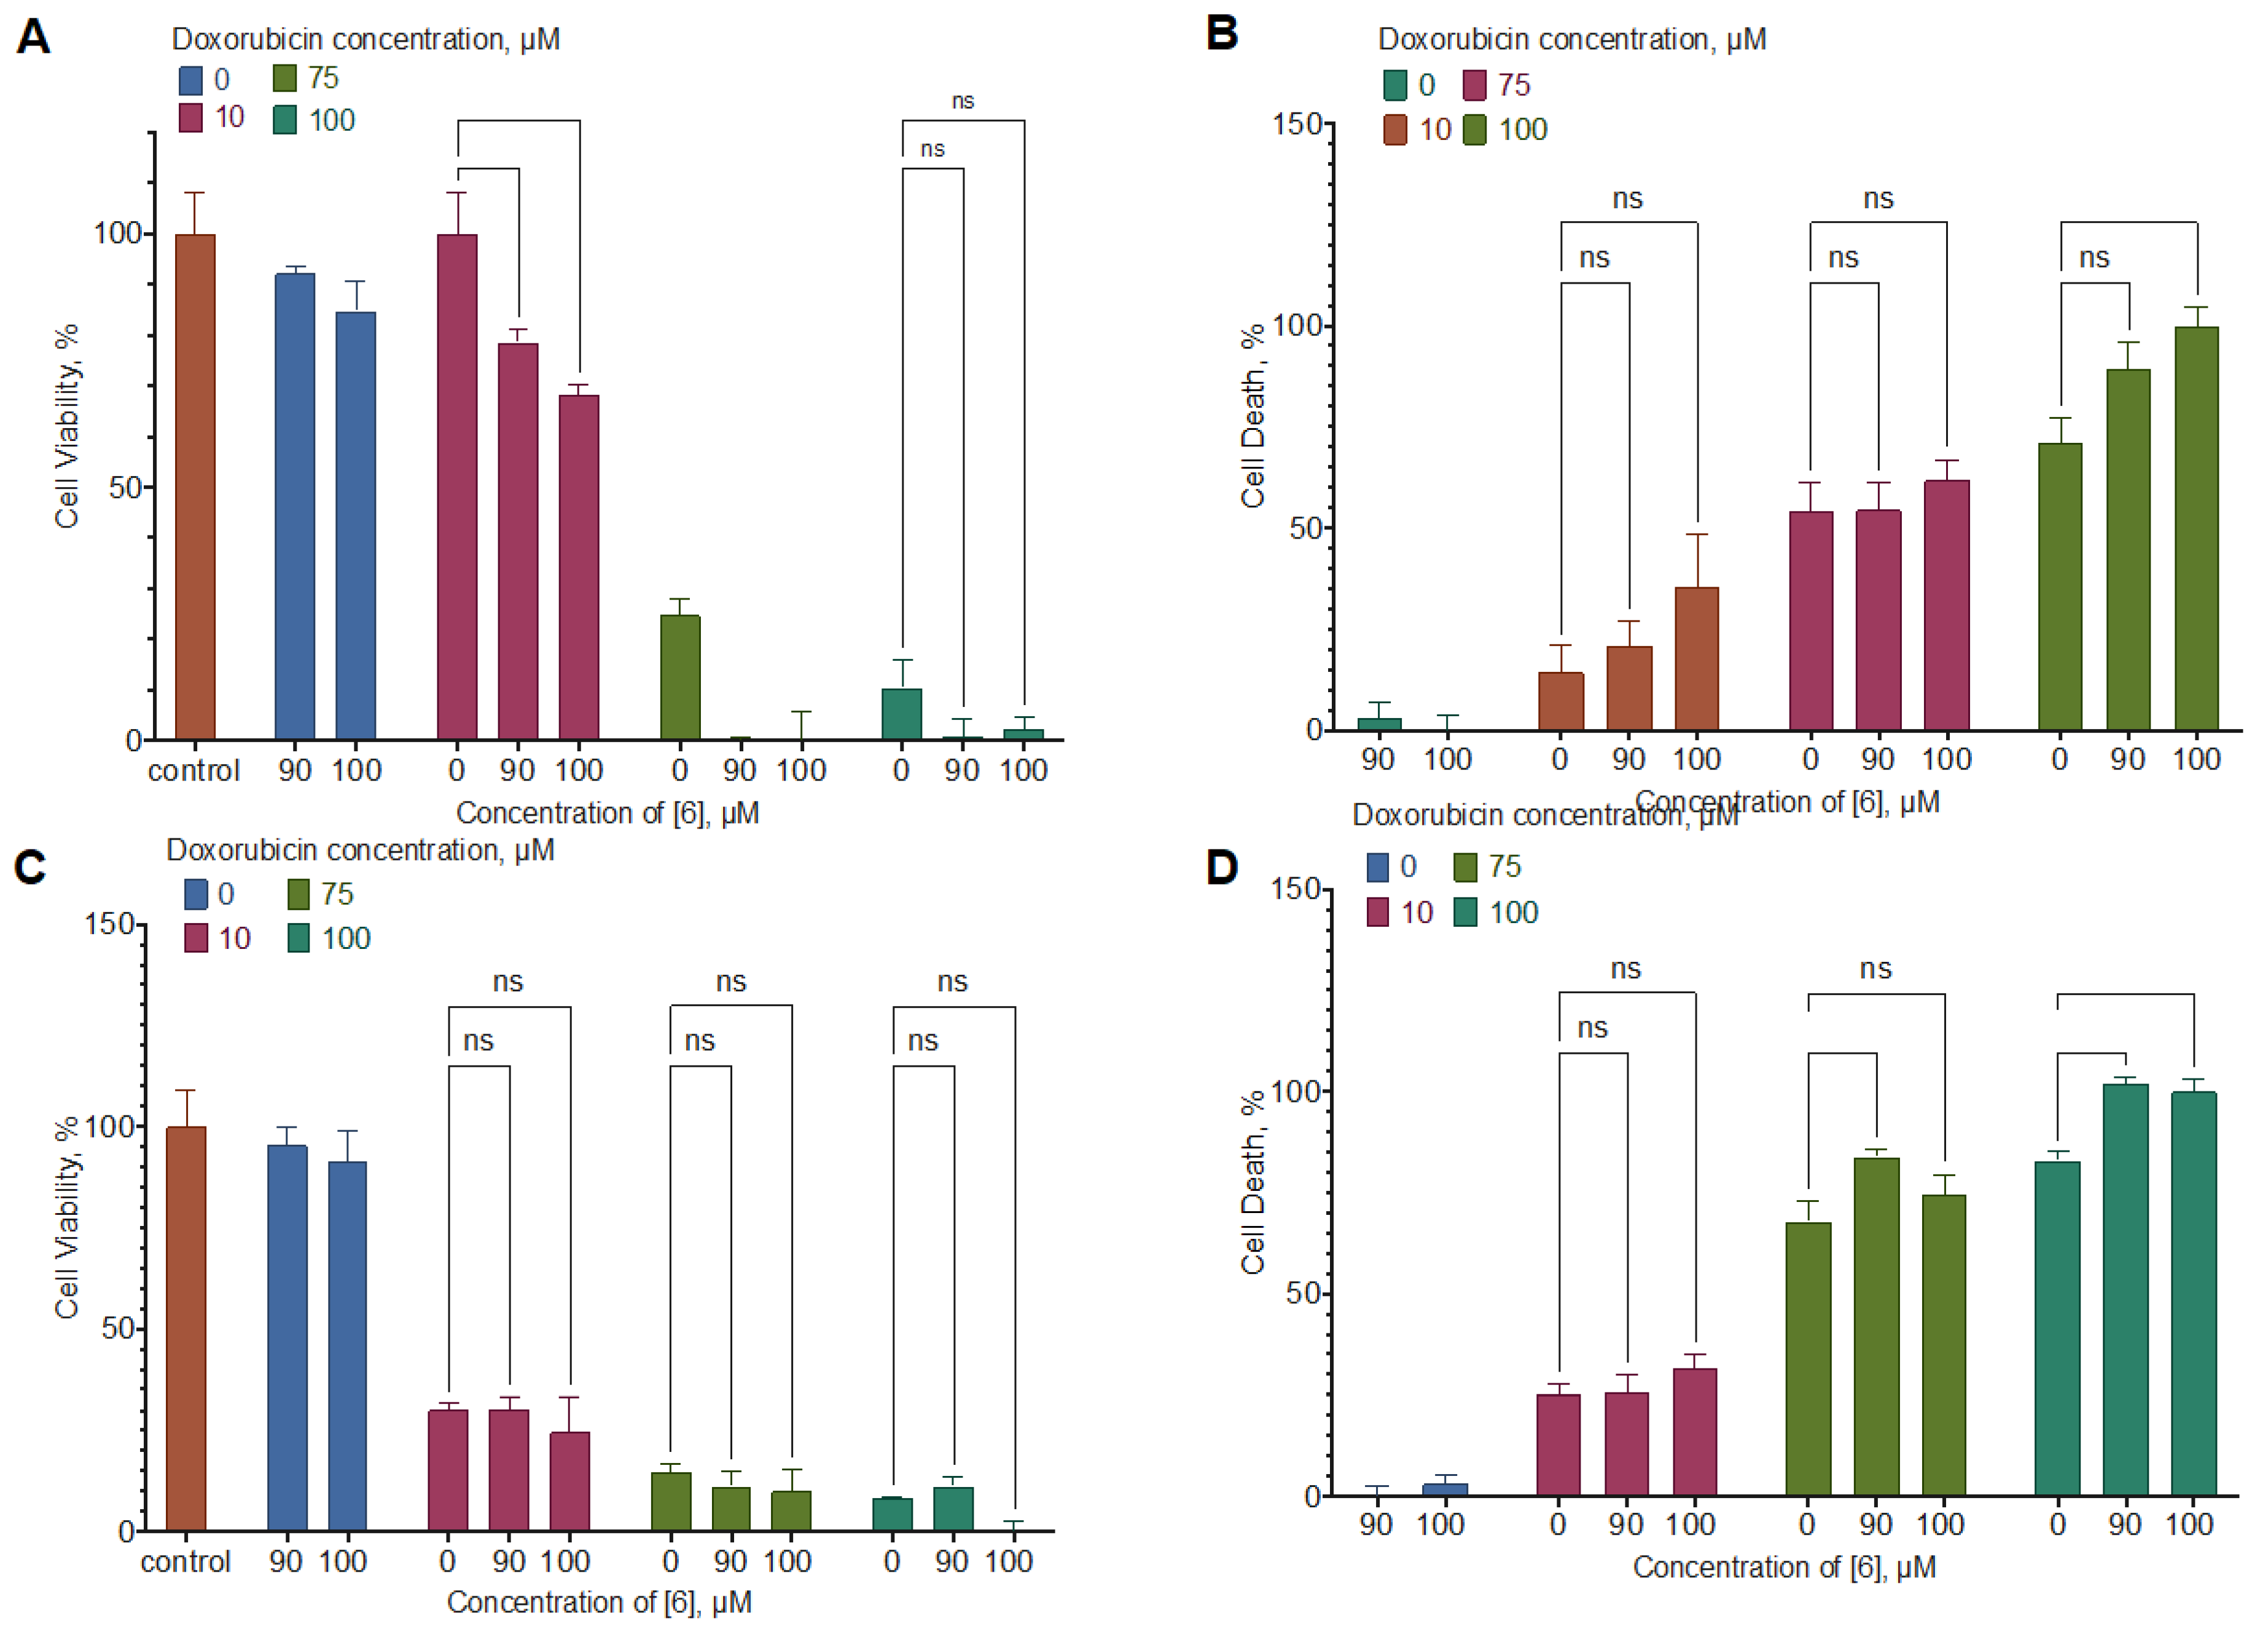
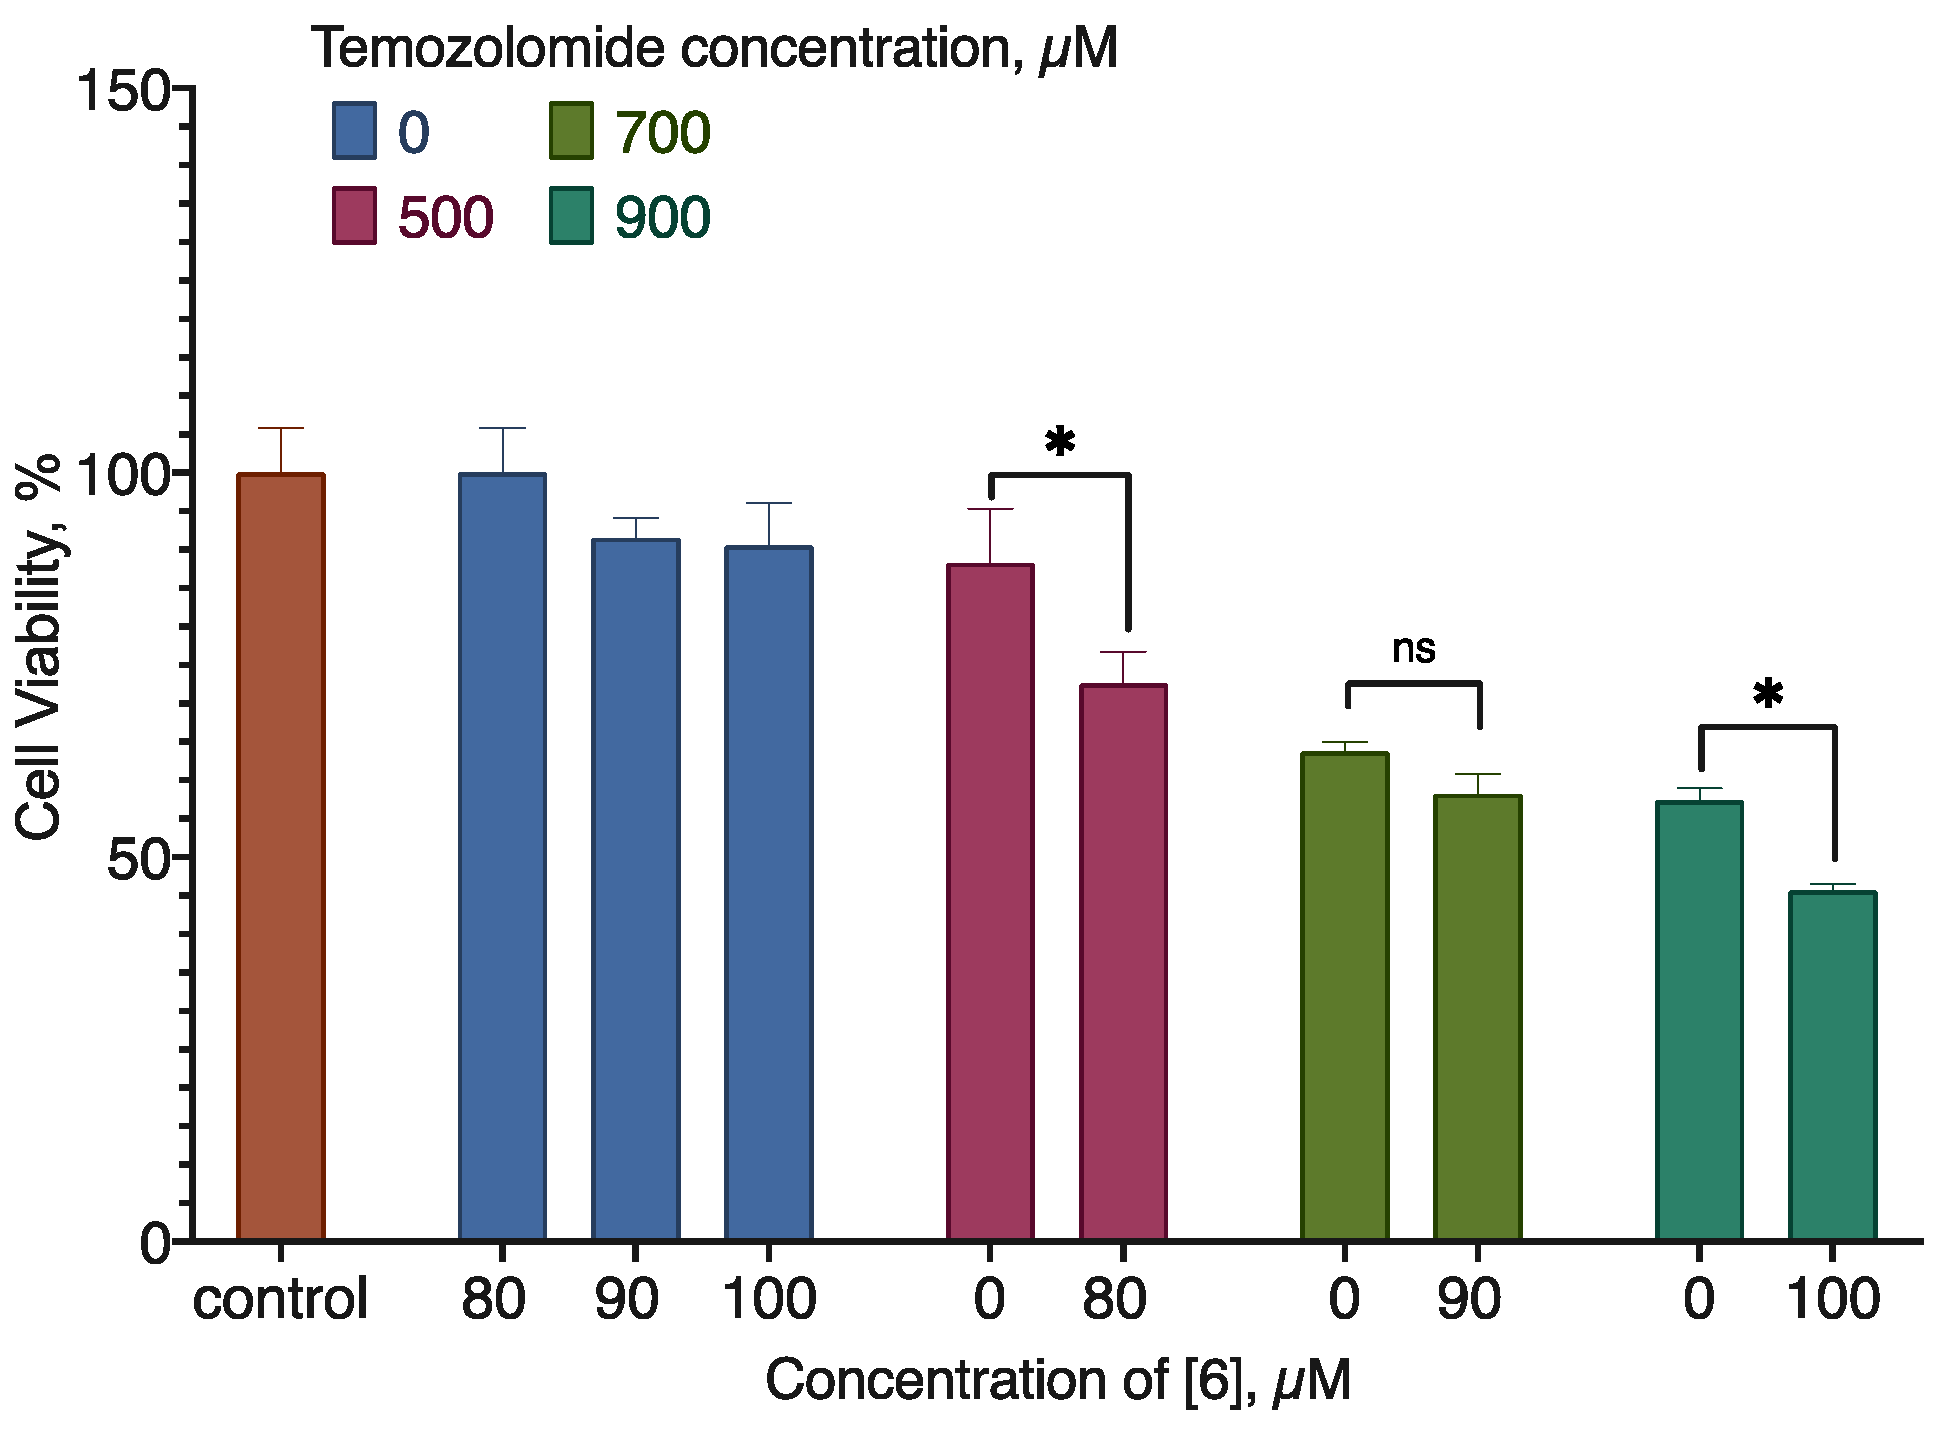
Combined with doxorubicin, compound 6 enhanced its activity by 20-30% in the U-87 MG cell line; the interaction mode was additivity at low concentrations and synergism at high concentrations. In the MDA-MB-231 cell line, the effect was similar, but the mode of interaction changed to antagonism (Figure 9, Table 4). In combination with temozolomide on the U-87 MG cell line, compound 6 also enhanced the net cell viability decrease, but the interaction mode again was antagonism (Figure 10, Table 5).

2.5. Cytoprotection

Based on the data on the cytoprotective activity of the structurally similar compounds [5,19,22,23], we tested the synthesized compounds in two antioxidant models (protection against the H2O2 and CoCl2 cytotoxicity) in a 24-hour incubation.
In the cytoprotection experiments, the substances were mainly inactive (Figure 11 and Figure 12). However, compounds 2 and 10 were able to increase the viability of the cell culture by 10-20% in the CoCl2 toxicity test, and compound 7 had a similar activity in the H2O2 toxicity test.
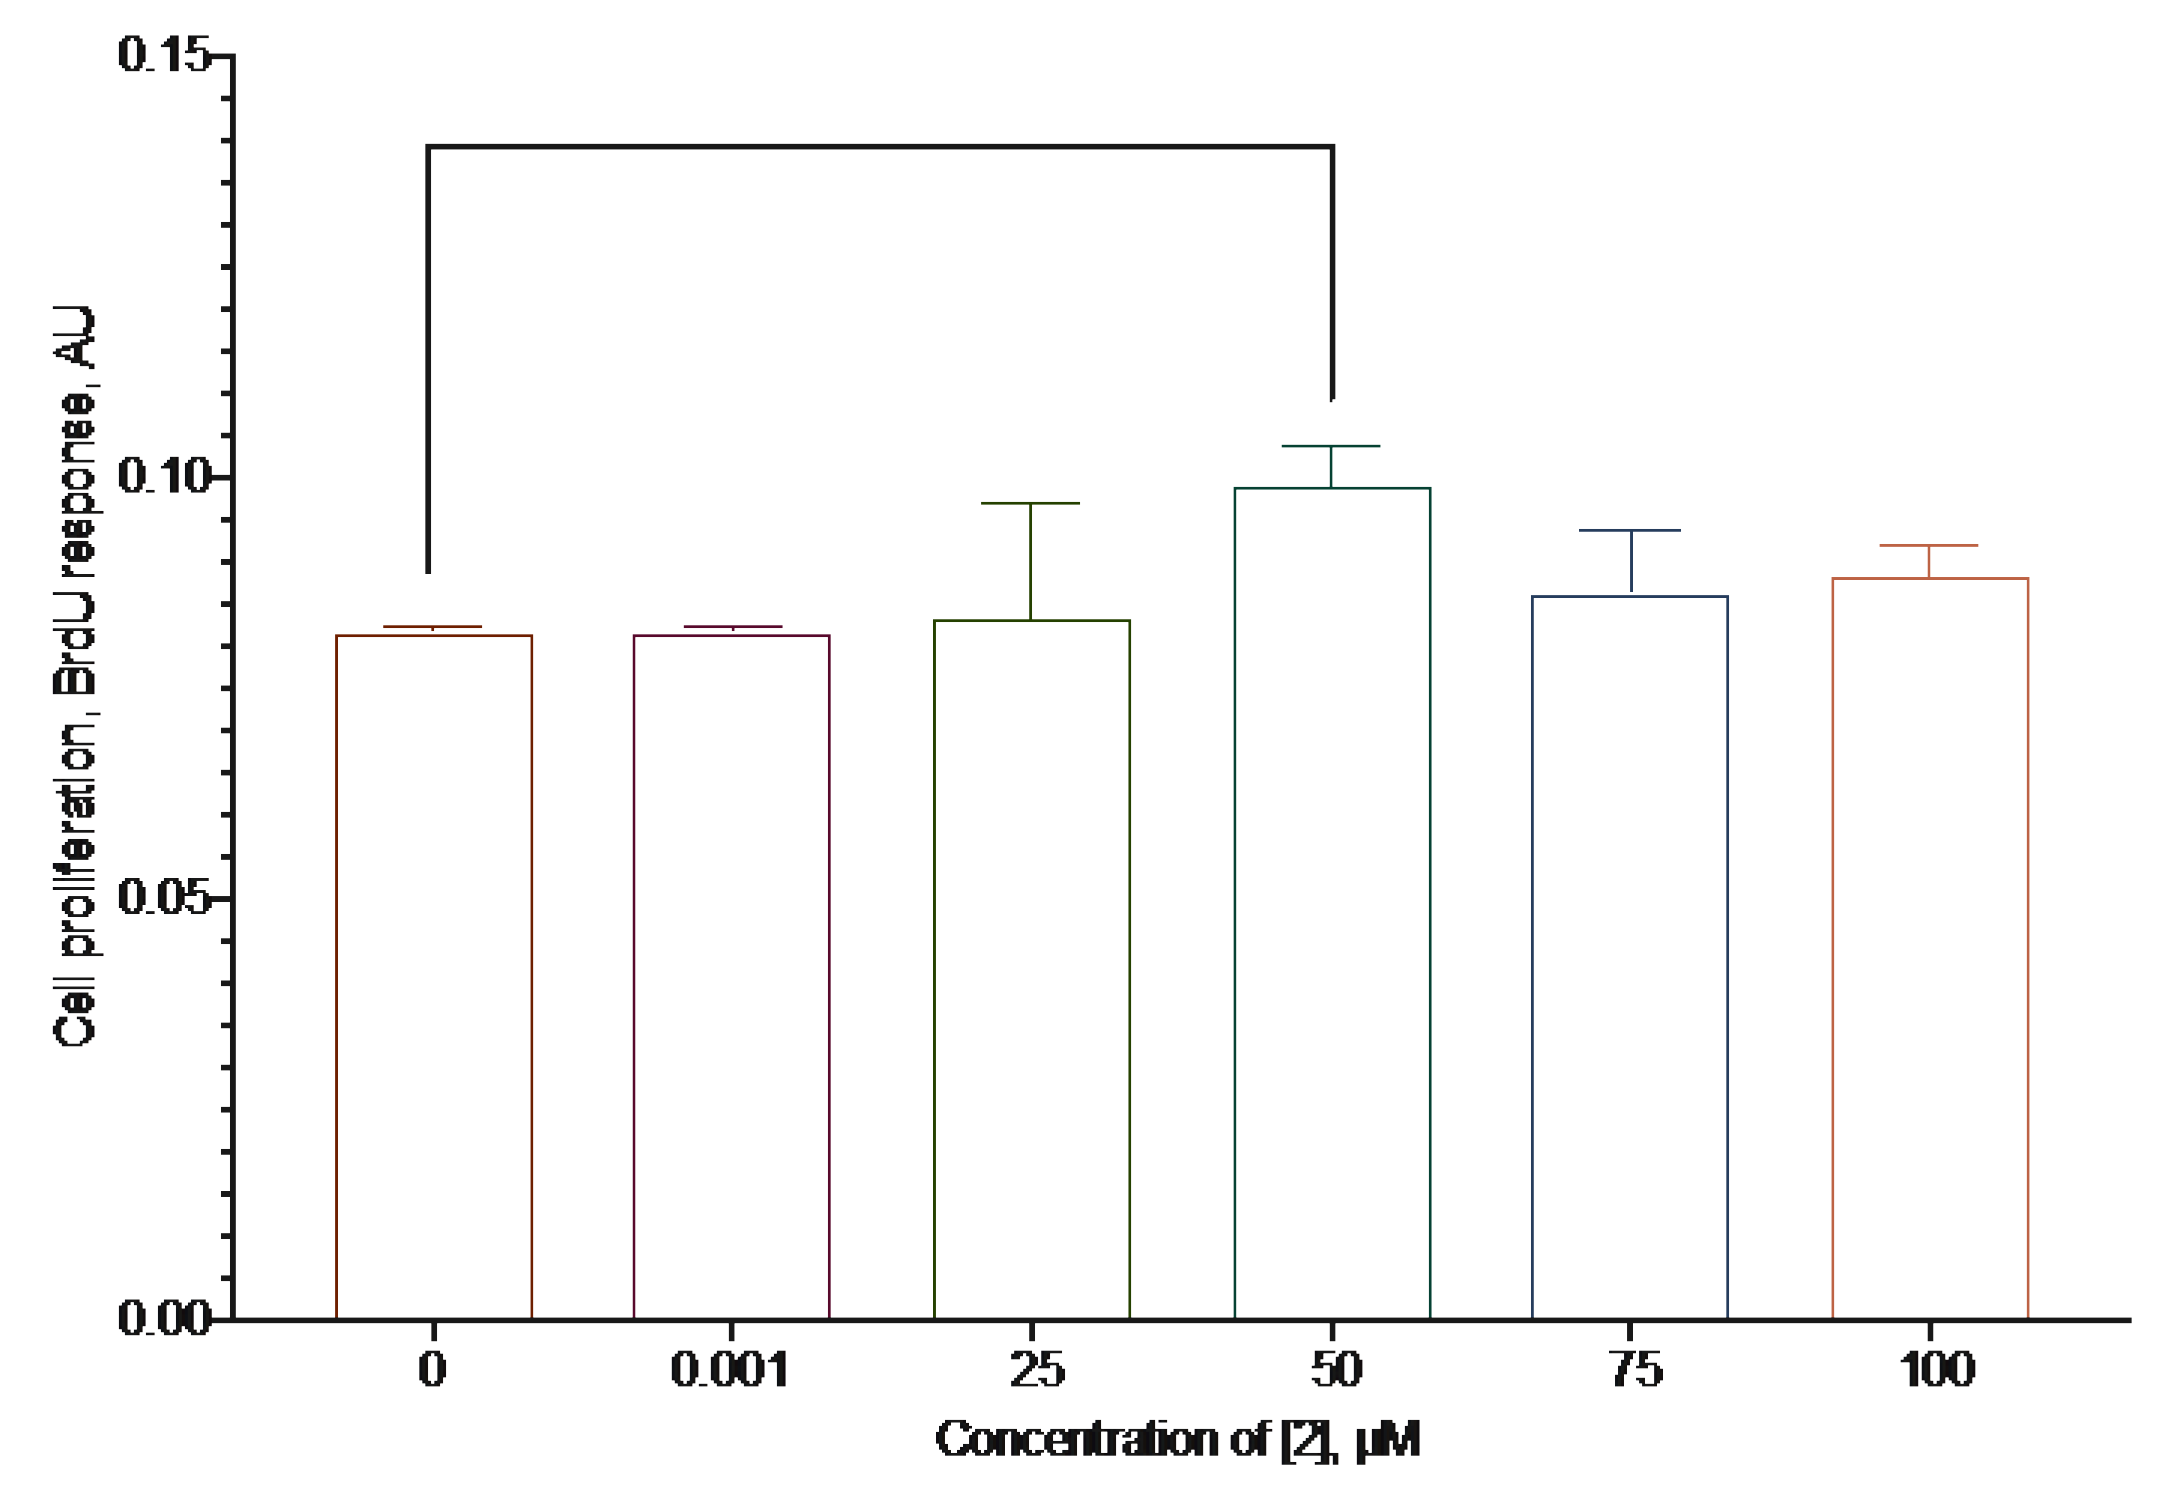
As far as a possible mechanism of the cytoprotection activity of a compound could be a stimulation of proliferation, we evaluated the ability of the most active compound 2 using the BrdU test with an increased incubation time to make the possible changes in proliferation more prominent.
The compounds slightly increased the proliferation of the cells by about 20% at the concentration of 50 µM (Figure 13).

2.6. Molecular Docking

To evaluate the possible mechanism of the anti-proliferative and cytoprotective action of the synthesized compounds, we performed a series of molecular docking experiments. We hypothesized that the active compounds and their molecular prototypes cytokinins could share at least some of the receptors and used these proteins as the targets.
Cytokinins, the molecular prototypes of the synthesized compounds, have several core molecular targets in mammalian cells: adenosine A2 receptor (A2AR), adenine phosphoribosyl transferase (APRT), and cyclin-dependent kinase 2 (CDK2). To explore these proteins as potential targets for the synthesized compounds, we performed a set of molecular docking experiments using the AutoDock Vina tool. For each protein, several conformation variants were analyzed (A2AR, 5mzj [22], 2ydo [23], and 5mzp [22]; APRT, 6hgs, 6hgr, and 6hgp [24]; CDK2, 5fp5 [25] and 2jgz [26]).
The hypothesis behind the docking experiments was as follows: to compare the computed binding energies for active and inactive conformations with the known protein inhibitors and activators. If a synthesized substance would have a binding energy close to the one of the inhibitor or activator for the appropriate protein conformation, that would indicate a possibility of a similar activity of the substance.
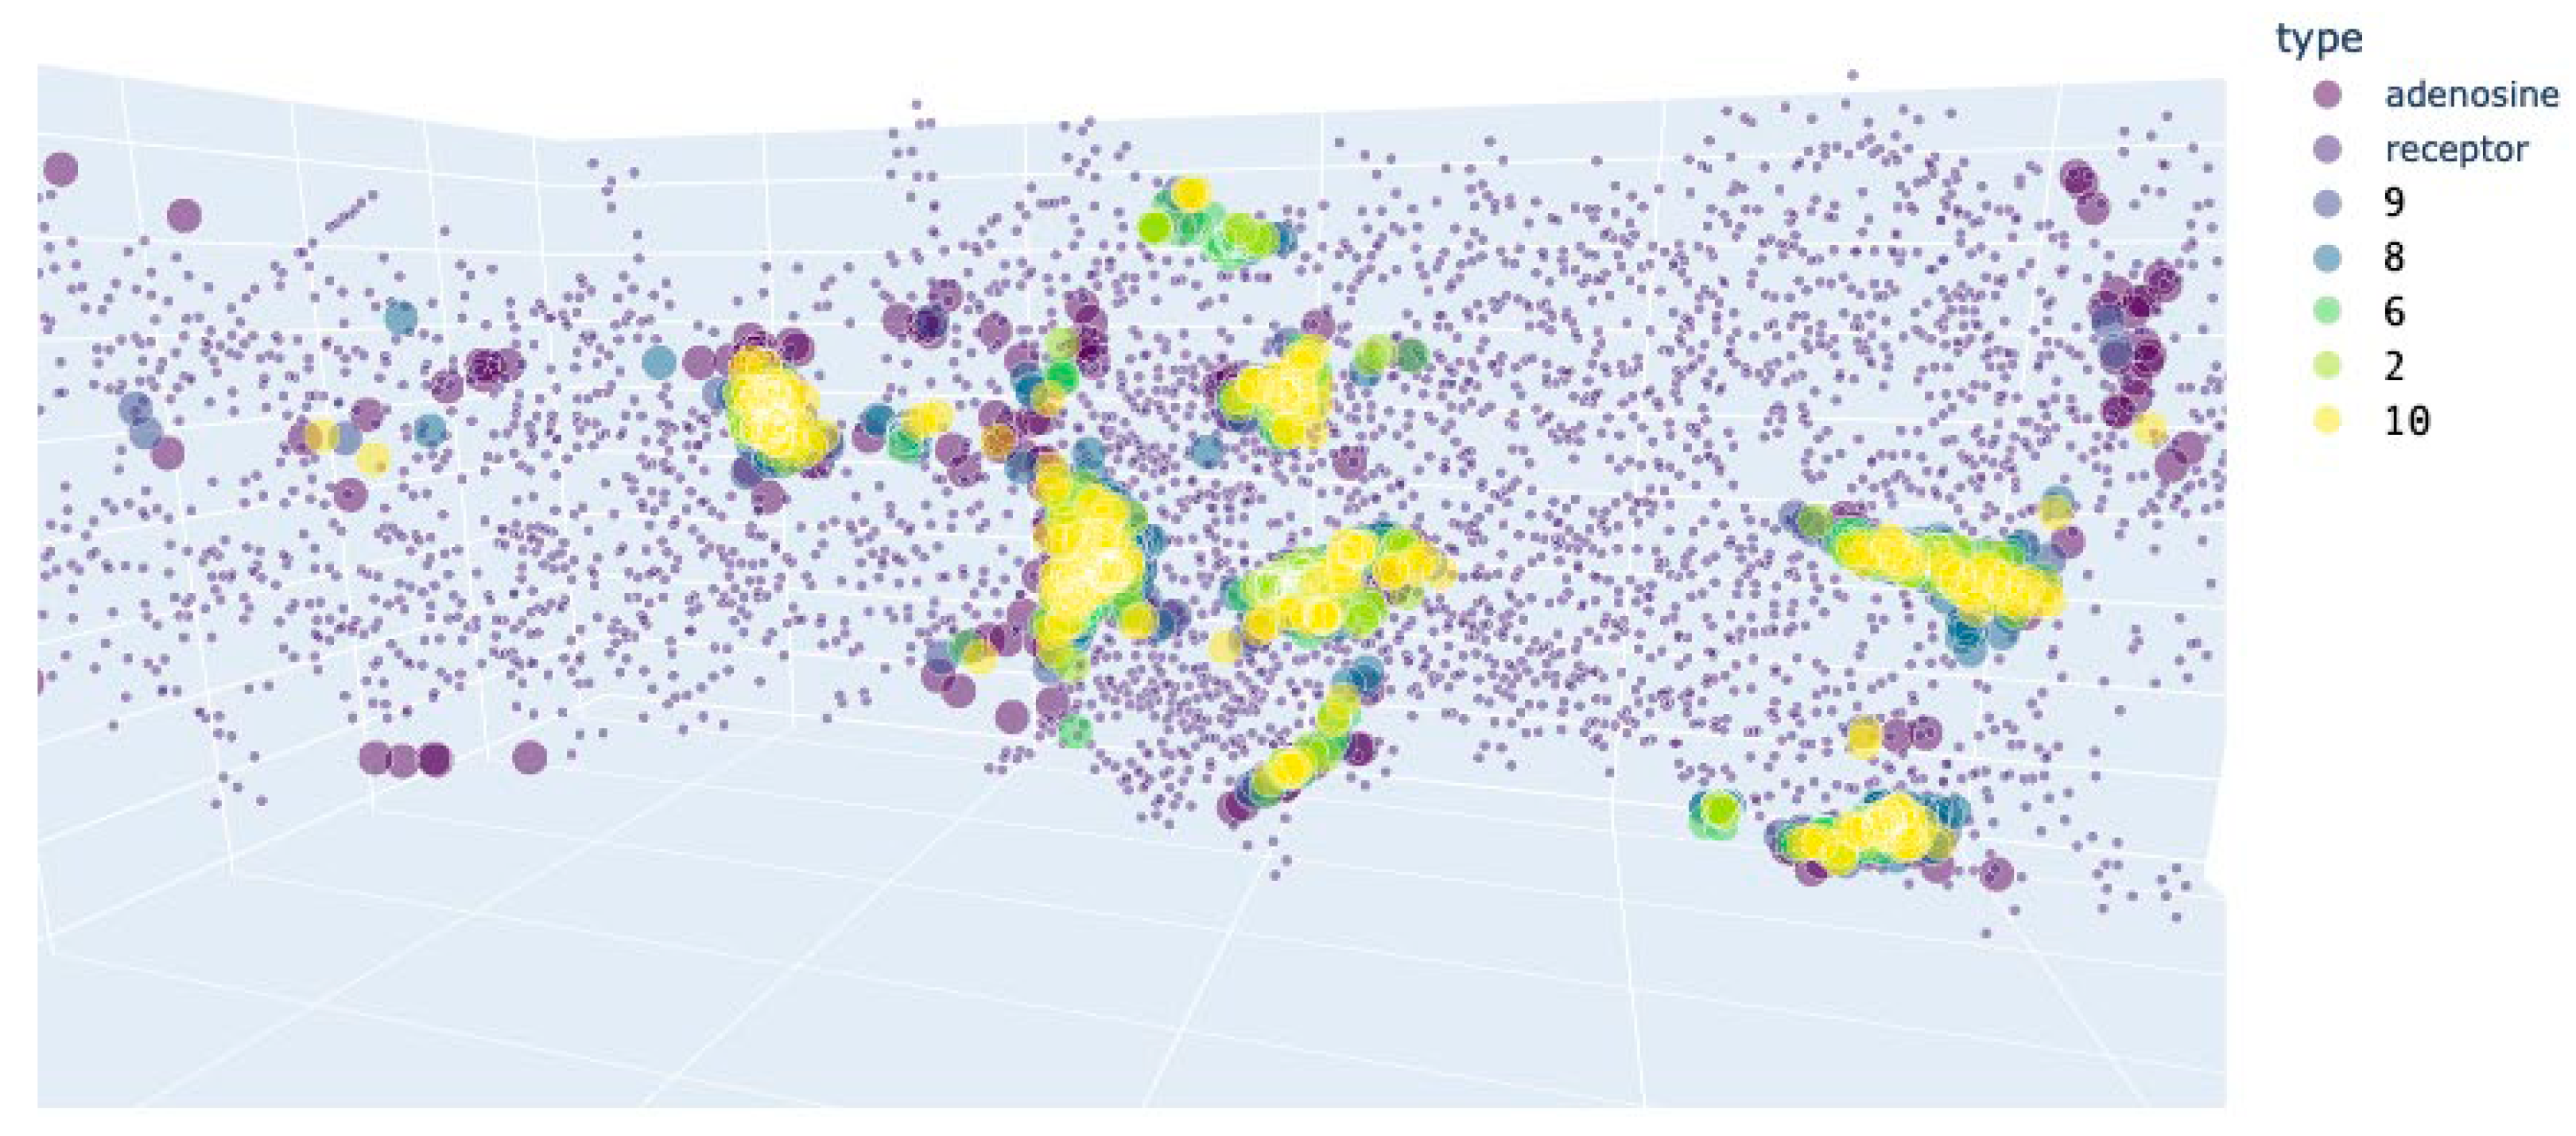
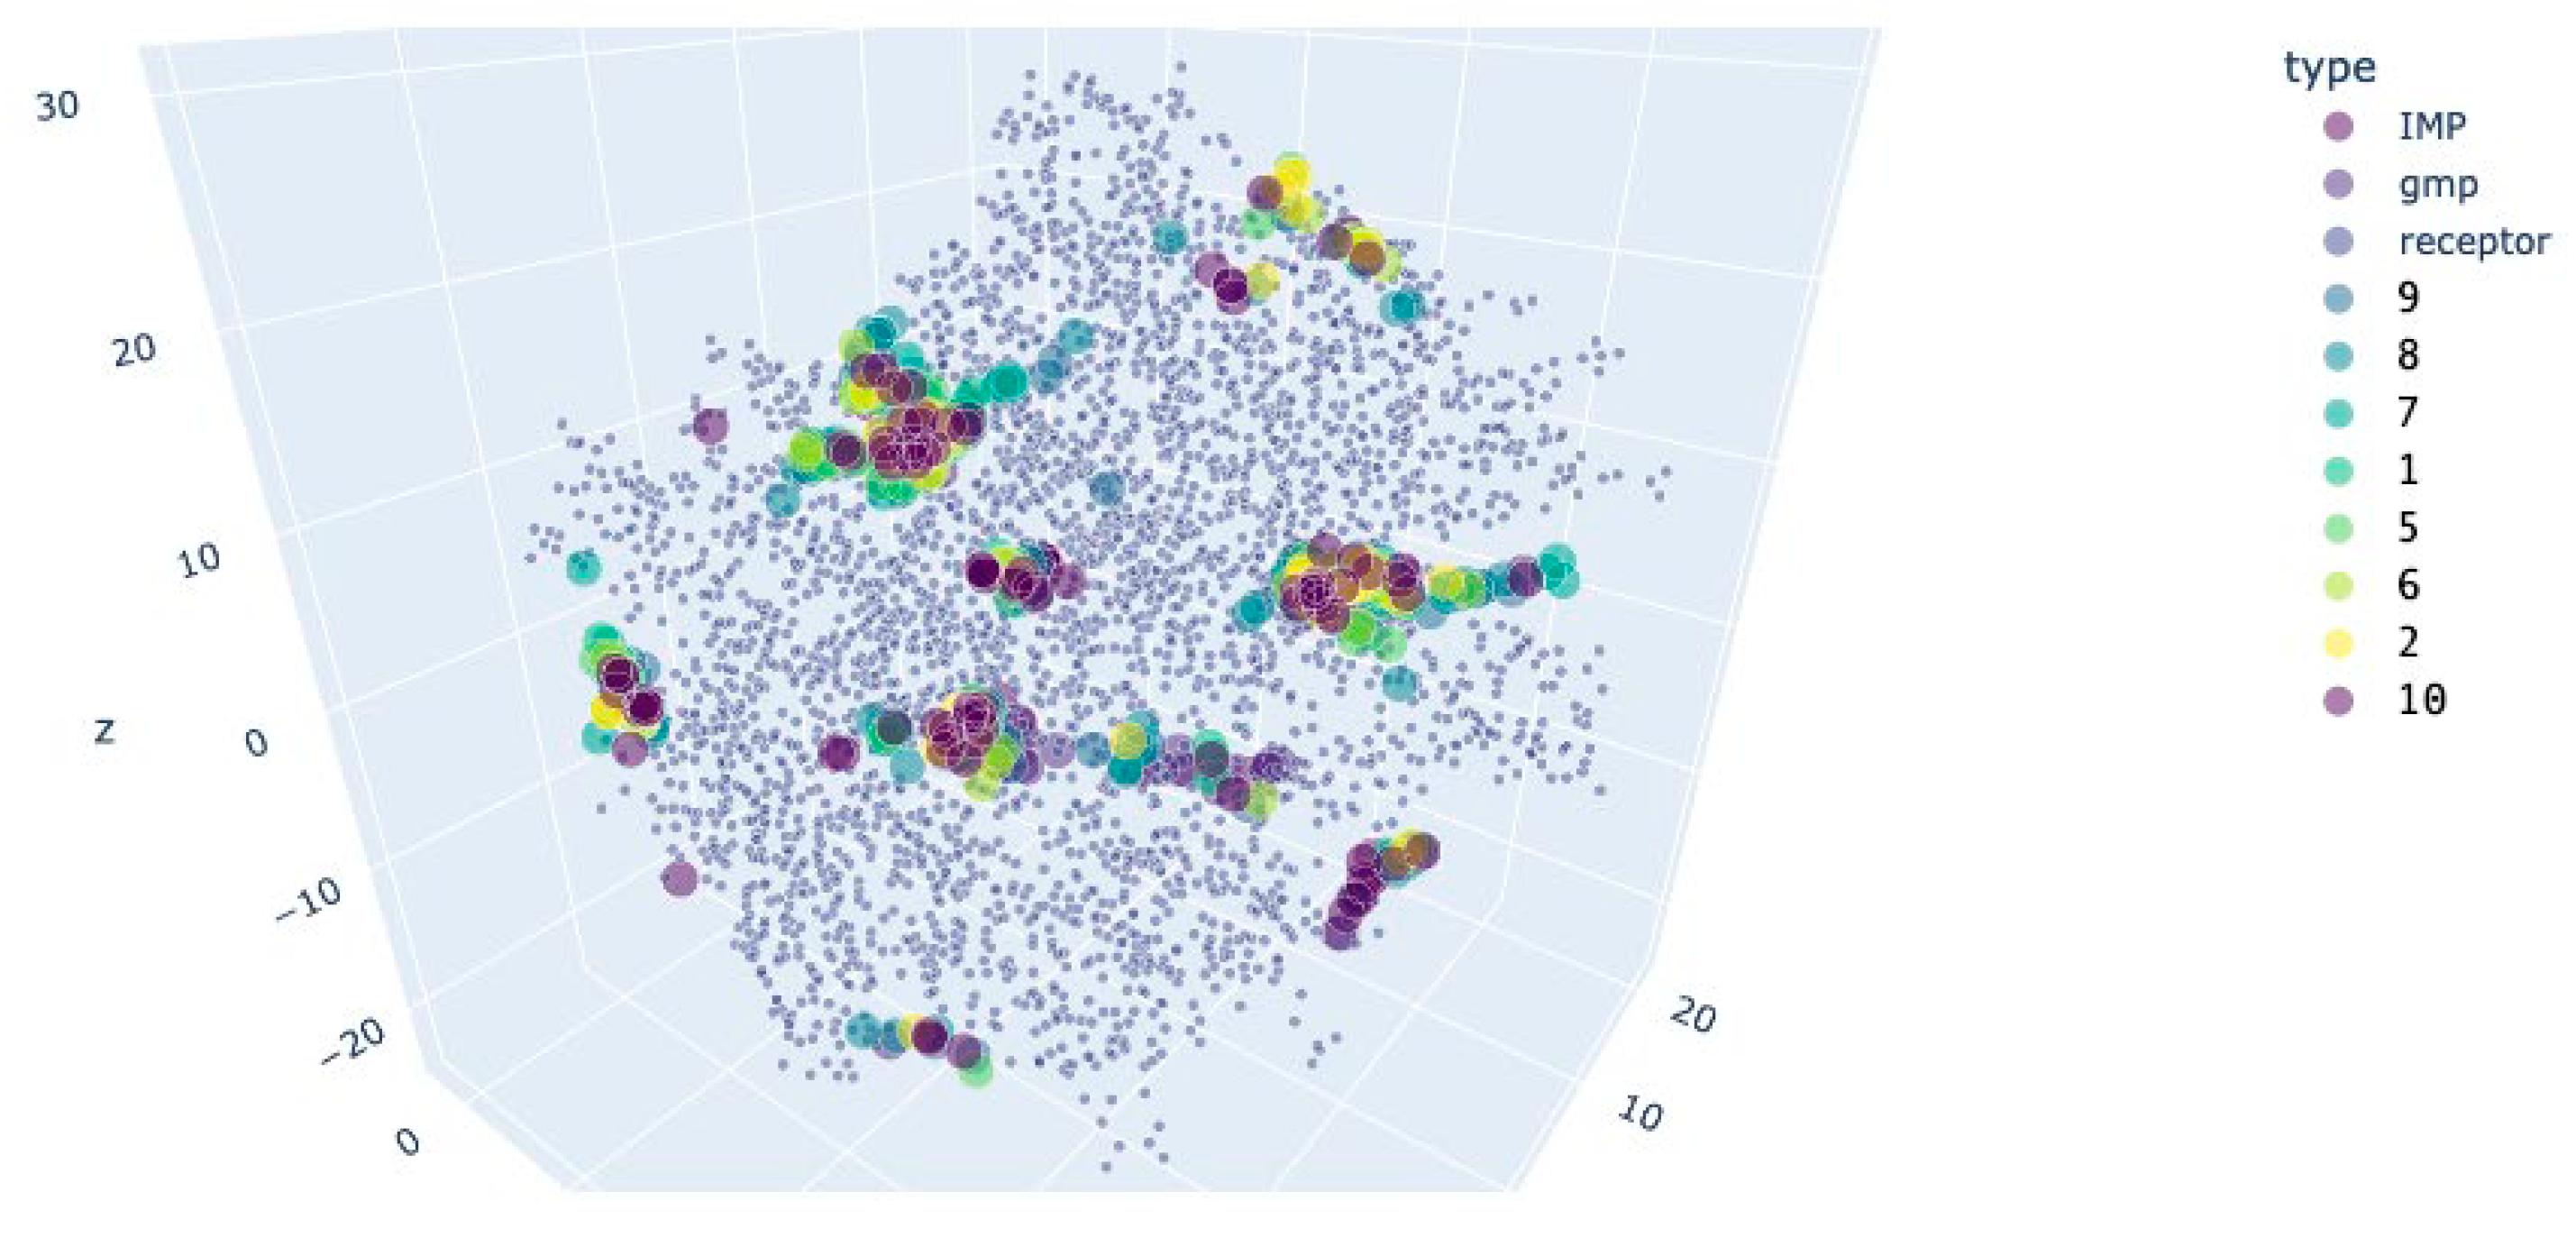
For A2AR and APRT, the active compounds shared the most populated docking area with the ones of the activator (Figure 14 and Figure 15), and their docking energy was close to the one of inhibitors in the inactivated protein conformation, but not to the activator in the active protein conformation (Table 6 and Table 7). From these data it could be assumed, that the active substances inhibit these proteins.
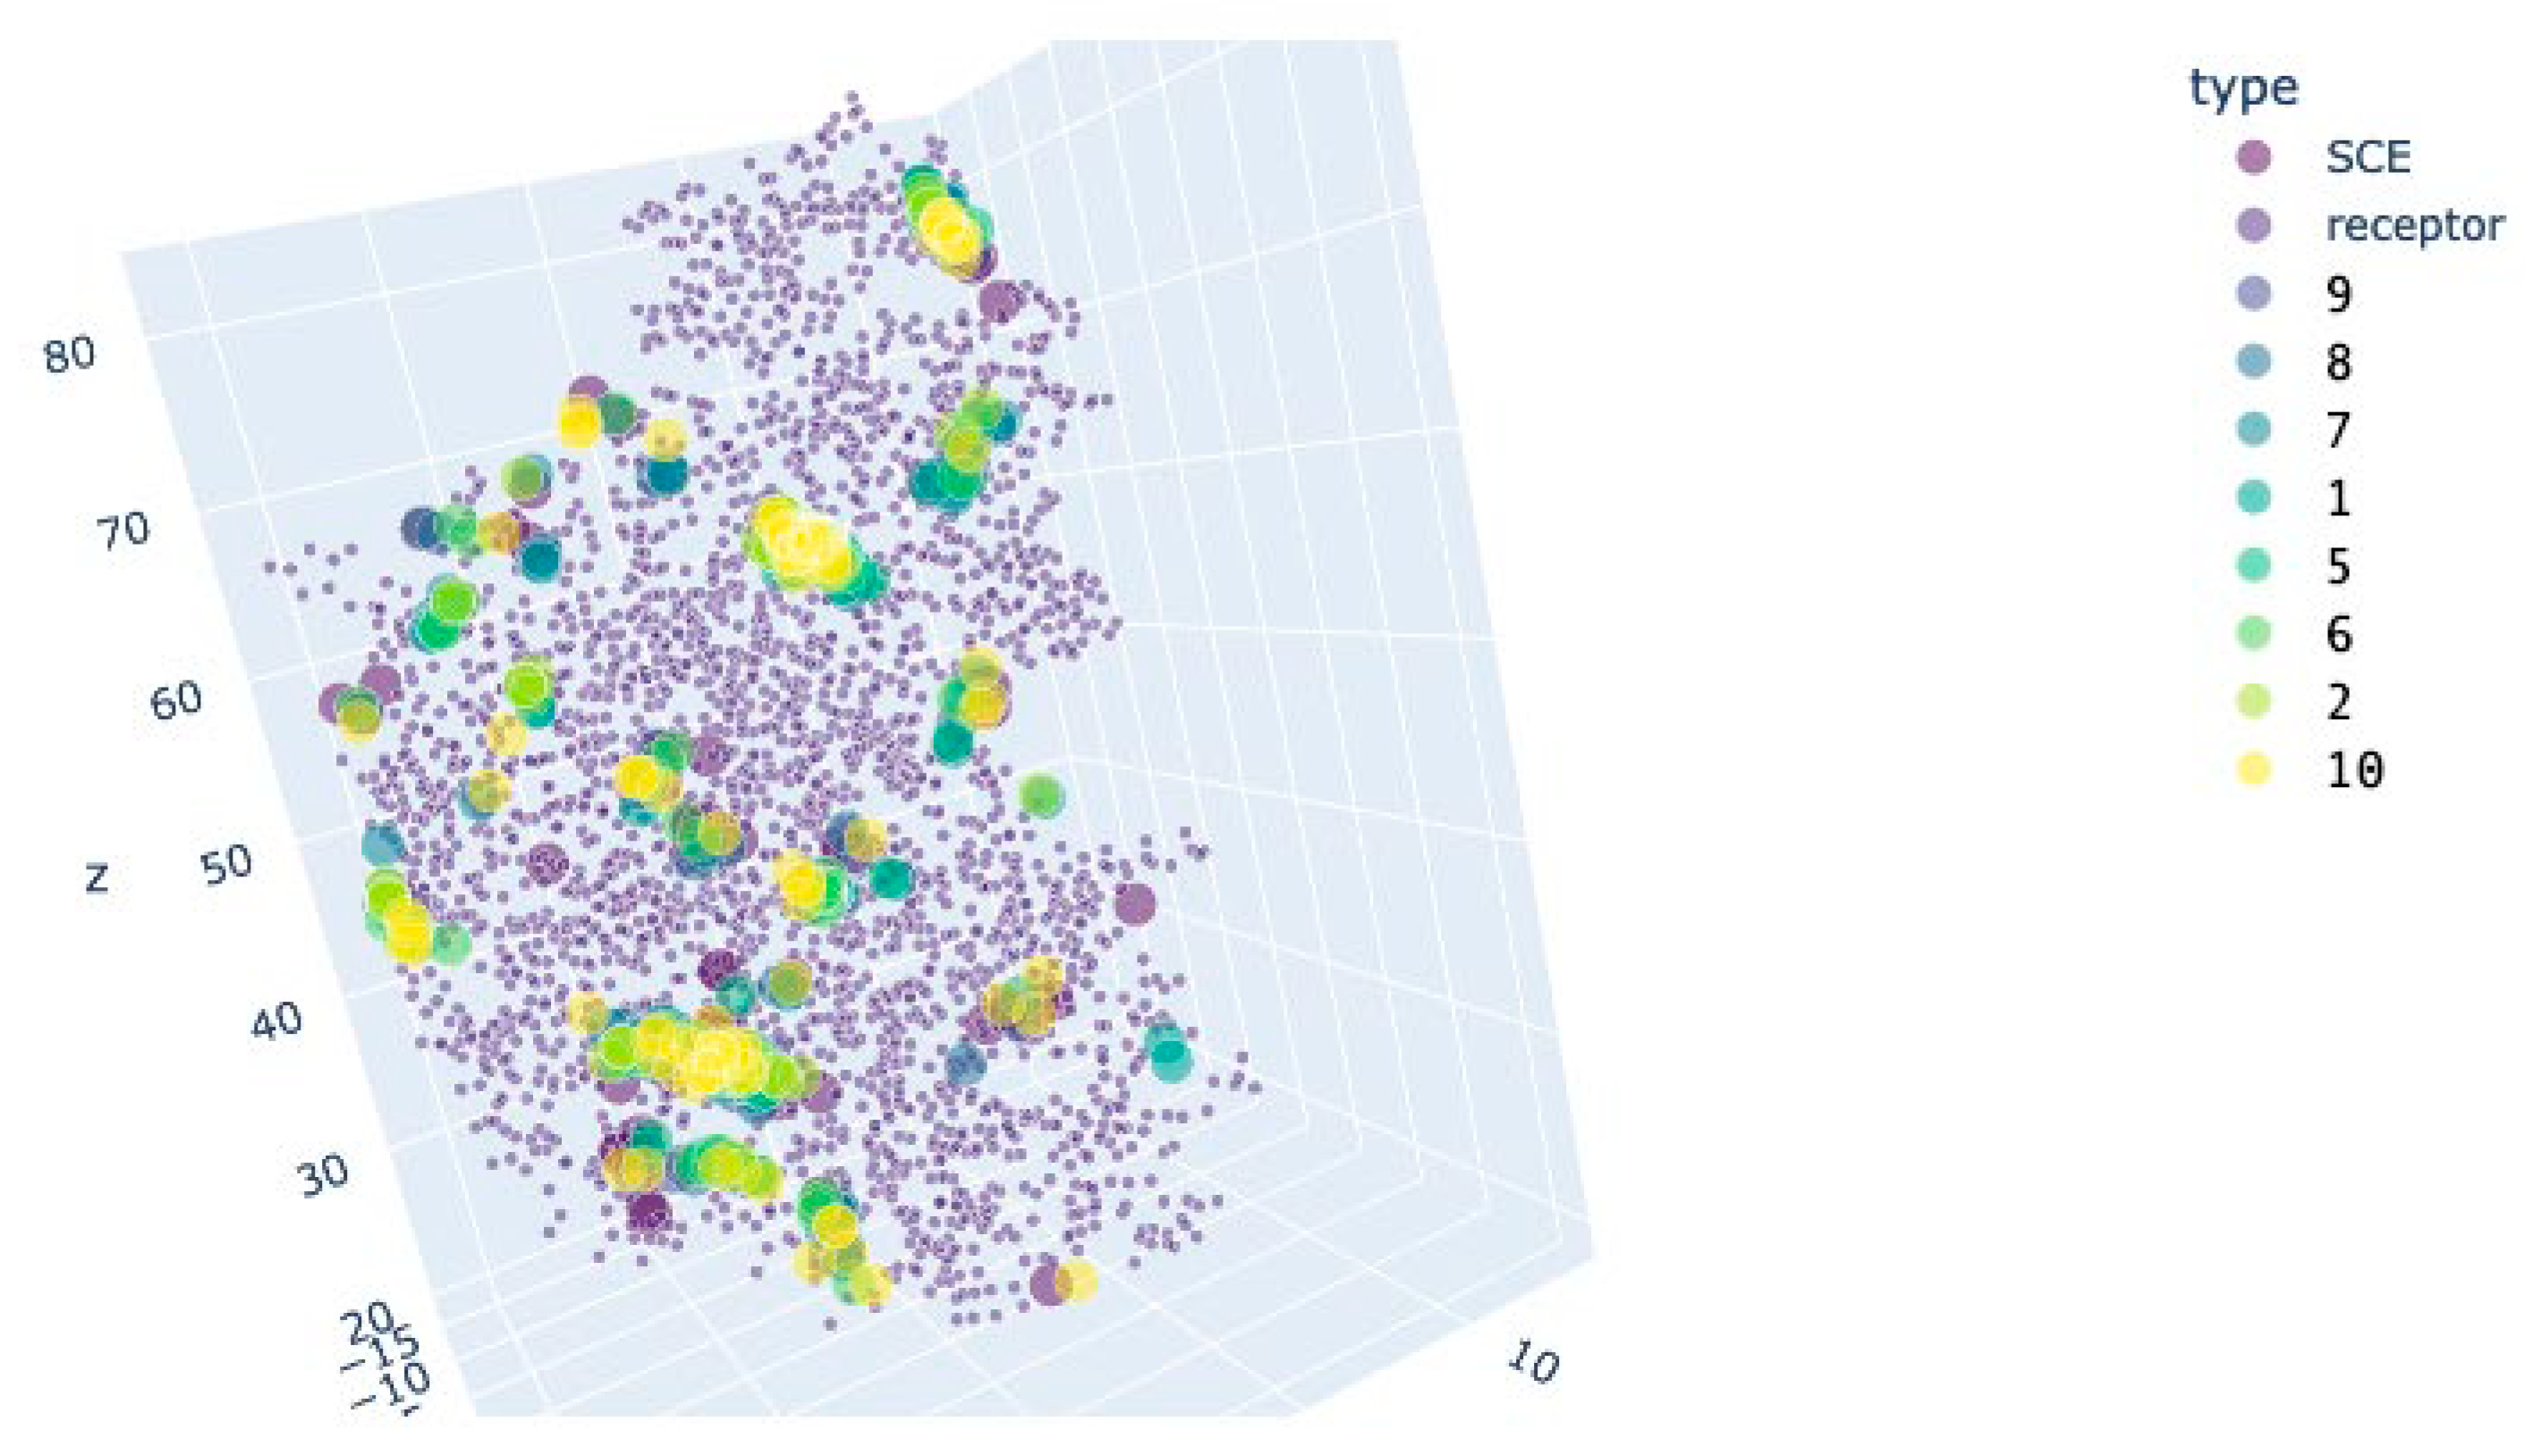
For CDK2, the docking affinity for the cytoprotective compound 10 was close to the one of the inhibitor SCE (Figure 16, Table 8), again leading to the assumption that this substance inhibits CDK2.

3. Discussion

In this paper, we report the synthesis of some novel EDU derivatives and their evaluation for biological activity. The compounds were designed to fill the gap in the known spectrum of activities of synthetic analogs of the substituted cytokinin-like derivatives. This research continues our earlier study [11,19,20], extending it with novel compounds and data on the activity mechanisms.
To synthesize the designated derivatives, we used known methods with a yield in the range of 15 to 55%, which is typical for this type of compound.
The synthesized compounds were evaluated for their ability to induce cell death in a set of human cancer cell lines (glioblastoma U-87 MG, melanoma A-375, and metastatic breast cancer MDA-MB-231) chosen based on the clinical significance of the corresponding tumors and on the neuroblastoma SH-SY5Y cell line, which was later intended to be used in the cytoprotection tests. Most of the compounds displayed no activity, but the amino-linked compounds with C2H5 and OCH3 substituents were able to inhibit proliferation by 20%. Given that the percent was calculated after a 72-hour-long incubation against a proliferating control, which has duplicated twice during this time, the real decrease in the cell proliferation was about 26%. This was in line with the activity of other similar molecules, studied by us previously [11,19,20]. On the other hand, the observed proliferation decrease was pretty low, especially compared to other cytokinin analogs [17]. Such a low activity could potentially arise from the inability of the synthesized molecules to interact with other targets beyond the classical cytokinin ones. However, compound 6 was active in several cell lines, and thus we decided to obtain more details on its mechanism of action.
In contrast to the general cell viability test, in the test for cell death induction, the compound 6 displayed no activity, thus indicating a purely anti-proliferative action. It also did not affect normal immortalized fibroblasts proliferation. Given these properties, we hypothesized that such activity could be complementary to the standard anti-cancer drugs and tested the combined activity of 6 with standard chemotherapeutic drugs doxorubicin and temozolomide. As it was expected, these combinations reduced the viability of the cell cultures to a greater extent (by 20-30% more compared to the doxorubicin or temozolomide alone). However, the mode of interaction was substantially between these two drugs: it was synergetic for doxorubicin at high drug concentrations, but antagonistic for temozolomide. The action mechanisms of temozolomide and doxorubicin also differ: the first one is an alkylating agent [27], which prevents cell division, and the second one is not only a DNA damaging agent but also induces reactive oxygen species formation and apoptosis induction [28]. These properties make the observed interaction logical: when a drug stops cell division at the DNA level, inhibition of pro-proliferative signaling from the compounds 6 should be either of no effect or even reduce the damage-induced apoptosis due to fewer DNA replication events. On the other hand, oxidative stress-related cell death and inhibition of proliferation should complement each other.
Another line of the research was to test the ability of the synthesized compounds to protect cells against oxidative stress, as this activity is typical for the cytokinins. Thus, we tested whether the synthesized compounds increase cell proliferation after the CoCl2 and H2O2 treatment. In these experiments, the compounds’ activity was also low and manifested only for compounds 2, 7, and 10. Given the data of the BrdU test, the mechanism of the observed effect was stimulation of proliferation, which is quite typical for cytokinin analogs [14,29].
To obtain more insights into the molecular mechanism of action of the active compounds, we performed molecular docking studies with the most known cytokinin analog targets: adenosine A2 receptor, ARPT, and CDK2 [30,31]. By their receptor interaction characteristics (binding site, protein conformation preference, and binding energy), the anti-proliferative compounds were similar to A2AR and APRT inhibitors, and thus porbably are themselves inhibitors of these proteins. It is in line with the APRT requirement for cell proliferation [32] and pro-proliferative or pro-survival signaling of the adenosine receptors and anti-proliferative effects of their blockers [33,34]. Previously, we have already observed similar effects for other cytokinin analogs [11].
On the other hand, the cytoprotective compounds, especially compound 10, had a different pattern of interaction with the mentioned proteins. By their binding energy, they were very similar to the CDK2 inhibitor SCE. This behavior is in line with the existing knowledge: CDK2 inhibition puts cells in a quiescent state [35], and quiescent cells adapt to oxidative stress much better [36].
Overall, the observed activity of the synthesized cytokinin analogs points to some potential in the further optimization of their structures either to produce better cytoprotective agents by enhancing their affinity towards CDK2 or to produce better anti-proliferation agents by manipulating the A2AR and APRT interaction. Such compounds would be of use, as they probably would possess low non-specific toxicity and are easy to synthesize [7,8,9].

4. Materials and Methods

4.1. Materials

L-glutamine, fetal bovine serum, penicillin, streptomycin, amphotericin B, Hanks’ salts, Earle’s salts, trypsin, DMEM, and MEM were from PanEco, Moscow, Russia. Isopropanol, HCl, EDTA, HEPES, DMSO, resazurin, toluene, acetonitrile, carbon tetrachloride, diethylenetriamine, urea, triethylamine, 4-methylphenyl isocyanate, 2,4-dimethylphenyl isocyanate, 2,5-dimethylphenyl isocyanate, 2-ethylphenyl isocyanate, 4-methoxyphenyl, 4-methoxycarbonylphenyl isocyanate, CoCl2*6H2O, lactate dehydrogenase, NAD+, INT, sodium lactate, Triton X-100, diaphorase, H2O2, and D-glucose were from Sigma-Aldrich, St. Louis, MO, USA. BrdU assay kit was from Abcam, Cambridge, MA, USA.
Cell lines were purchased from ATCC, Manassas, VA, USA.

4.2. Synthesized Compounds Characterization

Structures of all synthesized compounds were confirmed by 1H NMR spectroscopy and mass spectrometry. The purity of the compounds was confirmed by HPLC-MS and was in the range of 95–99%. 1H-spectra were recorded with a «Bruker DRX-400» spectrometer operating at 400.13 MHz frequency, using DMSO-d6 as a solvent and TMS as an internal standard. Chemical shifts were measured with 0.01 ppm accuracy, and coupling constants are reported in Hertz. HPLC-MS was recorded on an inductively coupled plasma mass spectrometer XSeries II ICP-MS (Thermo Scientific Inc., Waltham, MA, USA). Melting points are determined using the melting point (temperature) apparatus Stuart SMP20 (Cole-Palmer, Stone, Staffordshire, UK).
The structures of all synthesized compounds were confirmed by 1H NMR and mass-spectrometry analysis data. 1Н NMR-spectra were recorded with a «Bruker DRX-400» spectrometer operating at 400.13 MHz frequency, using DMSO-d6 as solvent and TMS as an internal standard. Chemical shifts were measured with 0.01 ppm accuracy, and coupling constants are reported in Hertz. HPLC-MS was recorded on an inductively coupled plasma mass spectrometer XSeries II ICP-MS (Thermo Scientific Inc., USA). The melting points are determined by using the melting point (temperature) apparatus Stuart SMP20 (UK).
For a qualitative analysis of reaction mixture compositions, aluminum TLC plates with silica gel (0.015–0.040 mm) with a fluorescent indicator F254 (20 × 20 cm2) (Merck Millipore, Darmstadt, Germany) were used. For preparative chromatographic separation of the substances mixtures, «Kieselgel 60» silica gel (0.015–0.040 mm, Merck Millipore, Darmstadt, Germany) was used.

4.3. Chemical Synthesis

The general procedure for the synthesis of aryl ureas is described in the literature [11,20].
In a three-neck flask with a thermometer, a dropping funnel, and a magnetic stirrer, 31 mmol of 1-(2-aminoethyl)-2-imidazolidinone, which was obtained by the condensation of diethylene triamine with urea in 65% yield according to the procedure presented in the work [20], in 50 ml of dry toluene was placed. The mixture was cooled in an ice bath to a temperature no higher than 5 °C. Then solution of 31 mmol of the relevant phenyl isocyanate in 50 ml of dry toluene was added dropwise with stirring, keeping a temperature not higher than 5 °C. The reaction mixture was stirred overnight. The precipitate was filtered off and recrystallized from acetone.
The general procedure of aryl carbamates (2,4,6,9,10) synthesis according to ref. [11,20] was as follows. In a round bottom flask equipped with a calcium chloride tube and magnetic stirrer 6.55 mmol of 1-(2-hydroxyethyl)-2-imidazolidinon in a small volume of dry acetonitrile, solution of 6.58 mmol of the relevant phenyl isocyanate in dry acetonitrile (total volume 50 ml) and 2-3 drops of triethylamine were stirred overnight. The reaction mixture was evaporated to dryness, the residue was recrystallized from methanol and isopropanol. The precipitate was filtered off and washed with a small amount of cold isopropanol.
2-(2-oxoimidazolidin-1-yl)ethyl-N-(2,5-dimethylphenyl) urea (1) 59% yield. M.p. = 212-214°C. 1 H NMR (DMSO-d6, δ, ppm, J, Hz): 2.12 (s, 6H, -CH3); 3.07-3.09 (m, 2H); 3.12-3.23 (m, 4H); 3.32-3.37 (m, 2H, -CH2-); 6.01 (t, 1H, -CH2-NH-C(O)-NH-, J = 5.4); 6.26 (s, 1H, -NH-C(O)-N-); 6.97-7.04 (m, 3H, CHar); 7.50 (s, 1H, -C(O)-NH-Ar). HPLC-MS: [M + 1]+ 277.41; calculated value is 277.34. 13С NMR (100.70 MHz, DMSO-D6, , δ, ppm): 17.56, 21.25, 37.34, 38.12, 43.84, 44.13, 117.97, 120.03, 122.28, 127.51, 132.65, 135.37, 151.80, 160.39.
2-(2-oxoimidazolidin-1-yl)ethyl-N-(p-tolil) urea (3) 31% yield. M.p. = 189-190°C. 1 H NMR (DMSO-d6, δ, ppm, J, Hz): 2.19 (s, 3H, -CH3); 3.07-3.13 (m, 2H); 3.15-3.20 (m, 2H); 3.20-3.25 (m, 2H); 3.31-3.39 (m, 2H) (-CH2-); 5.98 (t, 1H, -CH2-NH-C(O)-NH-, J = 5.4); 6.16 (s, 1H, -NH-C(O)-N-); 6.99 (d, 2H, J = 8.2); 7.23 (d, 2H, J = 8.4, CHar); 8.29 (s, 1H, -C(O)-NH-Ar). HPLC-MS: [M + 1]+ 263.30; calculated value is 263.31. 13С NMR (100.70 MHz, DMSO-D6, δ, ppm): 20.85, 37.28, 38.12, 43.92, 44.33, 121.24, 129.15, 132.78, 136.95, 150.12, 160.41.
2-(2-oxoimidazolidin-1-yl)ethyl-N-(2-ethylphenyl) urea (5) 62% yield. M.p. = 148-149°C. 1 H NMR (DMSO-d6, δ, ppm, J, Hz): 1.10 (t, 3H, -CH3, J = 7.5); 2.51 (q, 2H, -CH2-, J = 7.9); 3.07-3.12 (m, 2H); 3.16-3.23 (m, 4H); 3.32-3.38 (m, 2H, -CH2-); 3.67 (s, 3H, -OCH3); 6.30 (s, 1H, -NH-C(O)-N-); 6.51 (t, 1H, -CH2-NH-C(O)-NH-, J = 5.4); 6.88-6.93 (m, 1H); 7.04-7.12 (m, 2H, CHar); 7.66 (s, 1H, -C(O)-NH-Ar); 7.68-7.73 (m, 1H, CHar). HPLC-MS: [M + 1]+ 277.41; calculated value is 277.34. 13С NMR (100.70 MHz, DMSO-D6, δ, ppm): 13.84, 22.98, 37.25, 37.30, 43.92, 44.03, 122.37, 124.12, 127.64, 129.44, 130.19, 137.46, 151.80, 160.29.
2-(2-oxoimidazolidin-1-yl)ethyl-N-(2,4-dimethylphenyl) urea (7) 58% yield. M.p. = 178-181 °C. 1 H NMR (DMSO-d6, δ, ppm, J, Hz): 2.11 (s, 3H, -CH3); 2.18 (s, 3H, -CH3); 3.09-3.12 (m, 2H); 3.16-3.24 (m, 4H); 3.34-3.38 (m, 2H, -CH2-); 6.30 (t, 1H, -CH2-NH-C(O)-NH-, J = 5.5); 6.16 (s, 1H, -NH-C(O)-N-); 6.84-6.87 (m, 1H); 6.89-6.90 (m, 1H, CHar); 7.51 (s, 1H, -C(O)-NH-Ar); 7.51-7.53 (m, 1H, CHar). HPLC-MS: [M + 1]+ 277.40; calculated value is 277.34. 13С NMR (100.70 MHz, DMSO-D6, δ, ppm): 18.29, 20.73, 37.43, 37.19, 43.87, 44.13, 120.02, 125.03, 127.24, 129.50, 134.48, 135.33, 151.85, 160.44.
2-(2-oxoimidazolidin-1-yl)ethyl-N-(4-methoxyphenyl) urea (8) 35% yield. M.p. = 155-157 °C. 1 H NMR (DMSO-d6, δ, ppm, J, Hz): 3.11-3.17 (m, 2H); 3.17-3.31 (m, 4H); 3.35-3.42 (m, 2H, -CH2-); 3.67 (s, 3H, -OCH3); 5.93 (t, 1H, -CH2-NH-C(O)-NH-, J = 5.4); 6.16 (s, 1H, -NH-C(O)-N-); 6.76-6.87 (m, 2H); 7.24-7.32 (m, 2H, CHar); 8.20 (s, 1H, -C(O)-NH-Ar). HPLC-MS: [M + 1]+ 279.38; calculated value is 279.31. 13С NMR (100.70 MHz, DMSO-D6, δ, ppm): 37.31, 37.45, 43.84, 44.21, 55.60, 114.53, 124.14, 130.98, 150.31, 156.04, 160.21.
2-(2-oxoimidazolidin-1-yl)ethyl-N-(2,5-dimethylphenyl) carbamate (2) 30% yield. M.p. = 147-148°C. 1 H NMR (DMSO-d6, δ, ppm, J, Hz): 3.18-3.24 (m, 2H); 3.26-3.31 (m, 2H); 3.39-3.45 (m, 2H, -CH2-); 4.12 (t, 2H, -CH2-O-, J = 5.5); 6.36 (s, 1H, -NH-C(O)-N-); 7.04 (m, 1H, CHar); 8.73 (s, 1H, -C(O)-NH-Ar). HPLC-MS: [M + 1]+ 278.37; calculated value is 278.32. 13С NMR (100.70 MHz, DMSO-D6, δ, ppm): 17.44, 21.25, 37.68, 44.02, 45.32, 62.86, 118.46, 119.57, 123.08, 126.12, 133.15, 135.70, 151.52, 163.82.
2-(2-oxoimidazolidin-1-yl)ethyl-N-(p-tolil) carbamate (4) 36% yield. M.p. = 158-160°C. 1 H NMR (DMSO-d6, δ, ppm, J, Hz): 2.22 (s, 3H, -CH3); 3.14-3.25 (m, 2H); 3.33 (t, 2H, J = 5.6); 3.36-3.45 (m, 2H); 4.14 (t, 2H, -CH2-, J = 5.6); 6.21 (s, 1H, -NH-C(O)-N-); 6.96-7.17 (m, 2H); 7.25-7.35 (m, 2H, CHar); 9.38 (s, 1H, -C(O)-NH-Ar). HPLC-MS: [M + 1]+ 264.25; calculated value is 264.30. 13С NMR (100.70 MHz, DMSO-D6, δ, ppm): 20.70, 37.71, 44.02, 45.36, 62.77, 119.54, 129.09, 130.21, 137.84, 150.02, 163.84.
2-(2-oxoimidazolidin-1-yl)ethyl-N-(2-ethylphenyl) carbamate (6) 50% yield. M.p. = 115-117°C. 1 H NMR (DMSO-d6, δ, ppm, J, Hz): 1.09 (td, 3H, -CH3, J = 7.4, 1.9); 2.57 (q, 2H, -CH2-, J = 7.5, 1.9); 3.16-3.22 (m, 2H); 3.26-3.29 (м, 2H); 3.31-3.41 (m, 2H, -CH2-); 4.09-4.14 (m, 2H, -CH2-O-); 6.35 (s, 1H, -NH-C(O)-N-); 7.08-7.15 (m, 2H); 7.16-7.21 (m, 1H); 7.23-7.28 (m, 1H, CHar); 8.85 (s, 1H, -C(O)-NH-Ar). HPLC-MS: [M + 1]+ 278.37; calculated value is 278.32. 13С NMR (100.70 MHz, DMSO-D6, δ, ppm): 13.64, 24.02, 37.85, 44.02, 45.31, 62.85, 119.82, 123.01, 127.09, 130.27, 130.79, 137.76, 151.53, 164.03.
2-(2-oxoimidazolidin-1-yl)ethyl-N-(4-methoxyphenyl) carbamate (9) 18% yield. M.p. = 127-133°C. 1 H NMR (DMSO-d6, δ, ppm, J, Hz): 3.19-3.22 (m, 2H); 3.28 (t, 2H, J = 5.5); 3.37-3.43 (m, 2H, -CH2-); 3.68 (s, 3H, -OCH3); 4.12 (t, 2H, -CH2-O-, J = 5.5); 6.35 (s, 1H, -NH-C(O)-N-); 6.84 (d, 2H, J = 8.9); 7.34 (d, 2H, CHar, J = 8.0); 9.44 (s, 1H, -C(O)-NH-Ar). HPLC-MS: [M + 1]+ 280.38; calculated value is 280.30. 13С NMR (100.70 MHz, DMSO-D6, δ, ppm): 37.71, 44.12, 45.30, 55.63, 62.81, 117.86, 121.35, 135.99, 150.02, 154.56, 164.25.
2-(2-oxoimidazolidin-1-yl)ethyl-N-(4-methoxycarbonylphenyl) carbamate (10) 30% yield. M.p. = 198-201°C. 1 H NMR (DMSO-d6, δ, ppm, J, Hz): 3.18-3.23 (m, 2H); 3.33 (t, 2H, J = 5.5); 3.39-3.44 (m, 2H, -CH2-); 3.80 (s, 3H, -CH3); 4.19 (t, 2H, -CH2-O-, J = 5.5); 6.21 (s, 1H, -NH-C(O)-N-); 7.53-7.61 (m, 2H); 7.81-7.92 (m, 1H, CHar); 9.94 (s, 1H, -C(O)-NH-Ar). HPLC-MS: [M + 1]+ 308.28; calculated value is 308.31. 13С NMR (100.70 MHz, DMSO-D6, δ, ppm): 37.78, 44.01, 45.36, 51.78, 62.78, 117.56, 129.59, 132.31, 141.86, 150.02, 163.82, 165.79.

4.4. Cell Culture

All cell lines were maintained in a CO2 incubator at 37 °C, 95% humidity, and 5% CO2. The composition of the culture medium for the cells was as follows: human metastatic breast cancer MDA-MB-231 (ATCC HTB-26), human immortalized fibroblasts Bj-5ta (ATCC CRL-4001), and human melanoma A-375 (ATCC CRL-1619): DMEM, 4 mM L-Gln, 10% fetal bovine serum (FBS), human glioblastoma U-87 MG (ATCC HTB-14): MEM, 2 mM L-Gln, 1% non-essential amino acids, 1 mM pyruvate, and 10% FBS; human neuroblastoma SH-SY5Y (ATCC CRL-2266): 1:1 MEM: F12, 10% FBS, 2 mM L-Gln, 0.5 mM sodium pyruvate, 0.5% non-essential amino acids. The cells were routinely checked for mycoplasma contamination using RT-PCR. All cell media contained 100 U/mL penicillin, 100 µg/mL streptomycin, and 2.5 µg/mL amphotericin B. The cells were passaged using Trypsin-EDTA solution (PanEco, Moscow, Russia), the continuous passaging time did not exceed 40 passages.
Mycoplasma contamination was controlled using the Mycoplasma Detection Kit (Jena Bioscience, Jena, Germany).

4.5. Oxidative Stress Induction

For cell viability experiments, the cells were seeded at a density of 30,000 per well of a 96-well plate in 100 µL of the test medium (culture medium with 50 mM HEPES, pH 7.4, and without serum and pyruvate) and incubated for 12 h. After that, a substance solution with or without the cytotoxic agent in 100 µL fresh test medium was added to the medium present in the wells and incubated for 24 h, after which cell viability was measured using the MTT assay. Cytotoxicity was induced by either 100 µM of H2O2 or 700 µM of CoCl2 (from the freshly prepared stock in EtOH).

4.6. Cytotoxicity and Proliferation Stimulation

For analysis of cell death induction, the cells were plated in 96-well plates at a density of 1.5 × 10⁴ cells for the cytotoxicity assay and 8000 for the proliferation study per well and grown overnight. The dilutions of the test compounds prepared in DMSO and dissolved in the culture medium (without serum starvation) were added to the cells in triplicate for each concentration (100 µL of the fresh medium with the substance to 100 µL of the old medium in the well) and incubated for 18 h in the case of cytotoxicity and 72 h in the case of the proliferation stimulation. The incubation time was chosen based on the most pronounced differences between the compounds tested. The final DMSO concentration was 0.5%. Negative control cells (100% viability) were treated with 0.5% DMSO. Positive control cells (100% cell death) were treated with 3.6 μL of 50% Triton X-100 in ethanol per 200 μL of the cell culture medium. Separate controls were without DMSO (no difference with the control 0.5% DMSO was found). The effects of the test substances on the cell viability were evaluated using the resazurin assay.

4.7. Cell Viability Assay

To evaluate cell viability, the culture medium in the wells was replaced with a 0.2 mM resazurin solution in Earle's solution with the addition of 1 g/l D-glucose and incubated for 1.5 hours at 37°C under cell culture conditions [37]. After that, the fluorescence of the solution was determined at the excitation wavelength of 550 nm and the emission wavelength of 590 nm using the Hidex Sense Beta Plus microplate reader (Hidex, Turku, Finland). The positive control was the cell culture treated with the solvent alone, and the negative control was treated with 0.9% Triton X-100.

4.8. BrDU Cell Proliferation Assay

The stimulation of the cell proliferation by the chosen compounds was validated using the BrdU cell proliferation kit (Abcam, Cambridge, MA, USA). The cells were seeded in 96-well plates at a density of 4000 per well and grown overnight. After that, peptide solution in the fresh culture medium was added to the cells with full medium replacement; the peptide addition was performed on days 1 and 4 after the seeding. On day 6, BrdU reagent was added to the cells for 24 h and assayed according to the manufacturer’s protocol.

4.9. Compound Interaction Analysis

The interaction of the compounds with doxorubicin and temozolomide was analyzed using the Chou-Talalay methodology [21]. CompuSyn (https://www.combosyn.com/, accessed on 01.09.2023) software was used for the CI calculation.

4.10. Molecular Docking

Ligand structures were obtained from the PubChem database (https://pubchem.ncbi.nlm.nih.gov/, access date 01.05.2022) or prepared manually using Avogadro 1.93.0 software and optimized using the OpenBabel 3.0.0 software (http://openbabel.org/, access date 01.05.2022) [37] using the FFE force field with Fastest descent and dE ≤ 5e−6 threshold. Protein structures were obtained from the PDB database (https://www.rcsb.org/, access date 01.05.2022) and optimized using the Chiron service (https://dokhlab.med.psu.edu/chiron/processManager.php, access date 01.05.2022) [38]. Molecular docking was performed using the AutoDock Vina 1.1.2 (http://vina.scripps.edu/, access date 01.05.2022) [39]. To detect possible alternative binding sites and compare the affinities of the ligands for them, the procedure described in the literature [40] was used. As such, molecular docking was performed in two steps: first, we docked each molecule to the whole receptor as one large binding area to locate potential alternative binding sites, then the coordinates of the docking results were clustered and averaged to give the centers of the binding sites. The grid center coordinates are represented in Table 9. For large proteins, several grid centers were used to cover the whole protein. In all cases, the grid size was 126 × 126 × 126 Å, chosen to cover the whole protein, and exhaustiveness was set to 16. For each ligand, the docking was performed 10 times with different random seeds generating 10 conformations each time. The resulting coordinates were clustered using the OPTICS algorithm [41] from the package scikit-learn [42].

4.11. Statistics

All experiments were performed at least in triplicate. Statistical analysis was performed with the GraphPad Prism 9.0 software using ANOVA with the Holm-Sidak or Tukey post-tests; p < 0.05 was considered a statistically significant difference.

5. Conclusions

In this paper, we report the synthesis of some aryl carbamate, pyridyl urea, and aryl urea derivatives with alkyl and chlorine substitutions and tests of their cytotoxic and cytoprotective activity. Amino-linked derivatives with ethyl and methoxy substituents were anti-proliferative for the breast cancer and melanoma cell lines tested and enhanced doxorubicin and temozolomide activity in a synergetic and antagonistic manner, accordingly. In the cytoprotection studies, aryl carbamates were able to counteract the CoCl2 cytotoxicity by 3–8%. The possible molecular targets of the aryl carbamates with oxamate moiety during the anti-proliferative action were the adenosine A2 receptor and APRT, while for the cytoprotection activity, the interaction with CDK2 was important.
The novelty of the research was the screening of the chemically synthesized cytokinin analogs, which have never been characterized for such biological activity before. Although most of the compounds displayed little activity in most tests, some of the compounds displayed an interesting highly selective antiproliferative capacity. This activity was observed, among others, for the glioblastoma cell line and was able to enhance the action of standard drugs doxorubicin and temozolomide. Given the lack of efficient treatments for this cancer type, such activity could be used in the combined or supporting therapy after additional research.

Supplementary Materials

The following are available online at www.mdpi.com/xxx/s1. Figure S1. NMR spectroscopy data for the synthesized compounds.

Author Contributions

Conceptualization, M.A. and M.O.; methodology, M.O. and M.A.; software, M.A. and A.A.; validation, M.O., L.K., A.K. and M.A.; formal analysis, M.A.; investigation, M.I., G.S., E.G., K.U., A.C., N.K. and A.A.; resources, L.K.; data curation, M.A.; writing—original draft preparation, M.O. and M.A.; writing—review and editing, M.O. and L.K.; visualization, M.A.; supervision, L.K.; project administration, M.O. and A.K.; funding acquisition, M.O. All authors have read and agreed to the published version of the manuscript.

Funding

The study was supported by a grant from the Ministry of Science and Higher Education of Russian Federation No. 22-73-10076 (Unique identifier RF 190220 × 0031)

Institutional Review Board Statement

Not applicable.

Informed Consent Statement

Not applicable.

Data Availability Statement

The data presented in this study are available on request from the corresponding author. The data are not publicly available due to legal issues.

Acknowledgments

The authors are grateful for the analytical studies carried out at the D.I. Mendeleev Center for Collective Use of Scientific Equipment.

Conflicts of Interest

The authors declare no conflict of interest. The funders had no role in the design of the study; in the collection, analyses, or interpretation of data; in the writing of the manuscript, or in the decision to publish the results.

Sample Availability

Samples of all the synthesized compounds are available from the authors.

References

  1. Ramakrishna, W.; Kumari, A.; Rahman, N.; Mandave, P. Anticancer Activities of Plant Secondary Metabolites: Rice Callus Suspension Culture as a New Paradigm. Rice Sci. 2021, 28, 13–30. [Google Scholar] [CrossRef]
  2. Tuli, H.S.; Garg, V.K.; Bhushan, S.; Uttam, V.; Sharma, U.; Jain, A.; Sak, K.; Yadav, V.; Lorenzo, J.M.; Dhama, K.; et al. Natural Flavonoids Exhibit Potent Anticancer Activity by Targeting MicroRNAs in Cancer: A Signature Step Hinting towards Clinical Perfection. Transl. Oncol. 2023, 27, 101596. [Google Scholar] [CrossRef] [PubMed]
  3. de Luna, F.C.F.; Ferreira, W.A.S.; Casseb, S.M.M.; de Oliveira, E.H.C. Anticancer Potential of Flavonoids: An Overview with an Emphasis on Tangeretin. Pharmaceuticals (Basel) 2023, 16. [Google Scholar] [CrossRef] [PubMed]
  4. Kopustinskiene, D.M.; Jakstas, V.; Savickas, A.; Bernatoniene, J. Flavonoids as Anticancer Agents. Nutrients 2020, 12, 457. [Google Scholar] [CrossRef] [PubMed]
  5. Lee, H.; Kwon, Y.-J.; Jin, H.; Liu, H.; Kang, W.; Chun, Y.-J.; Bae, J.; Choi, H.-K. Anticancer Activity and Metabolic Profile Alterations by Ortho-Topolin Riboside in in Vitro and in Vivo Models of Non-Small Cell Lung Cancer. FASEB J. 2022, 36, e22127. [Google Scholar] [CrossRef] [PubMed]
  6. Voller, J.; Béres, T.; Zatloukal, M.; Džubák, P.; Hajdúch, M.; Doležal, K.; Schmülling, T.; Miroslav, S. Anti-Cancer Activities of Cytokinin Ribosides. Phytochem. Rev. 2019, 18, 1101–1113. [Google Scholar] [CrossRef]
  7. Oshchepkov, M.S.; Kalistratova, A.V.; Savelieva, E.M.; Romanov, G.A.; Bystrova, N.A.; Kochetkov, K.A. Natural and Synthetic Cytokinins and Their Applications in Biotechnology, Agrochemistry and Medicine. Russ. Chem. Rev. 2020, 89, 787–810. [Google Scholar] [CrossRef]
  8. Gill, A.; Patranabis, S. Phytohormones as Potential Anticancer Agents. Int. j. res. appl. sci. biotechnol. 2021, 8. [Google Scholar] [CrossRef]
  9. Gonzalez, G.; Grúz, J.; D’Acunto, C.W.; Kaňovský, P.; Strnad, M. Cytokinin Plant Hormones Have Neuroprotective Activity in in Vitro Models of Parkinson’s Disease. Molecules 2021, 26, 361. [Google Scholar] [CrossRef]
  10. Atallah-Yunes, S.A.; Robertson, M.J. Cytokine Based Immunotherapy for Cancer and Lymphoma: Biology, Challenges and Future Perspectives. Front. Immunol. 2022, 13, 872010. [Google Scholar] [CrossRef]
  11. Oshchepkov, M.; Kovalenko, L.; Kalistratova, A.; Ivanova, M.; Sherstyanykh, G.; Dudina, P.; Antonov, A.; Cherkasova, A.; Akimov, M. Anti-Proliferative and Cytoprotective Activity of Aryl Carbamate and Aryl Urea Derivatives with Alkyl Groups and Chlorine as Substituents. Molecules 2022, 27, 3616. [Google Scholar] [CrossRef] [PubMed]
  12. Berraondo, P.; Sanmamed, M.F.; Ochoa, M.C.; Etxeberria, I.; Aznar, M.A.; Pérez-Gracia, J.L.; Rodríguez-Ruiz, M.E.; Ponz-Sarvise, M.; Castañón, E.; Melero, I. Cytokines in Clinical Cancer Immunotherapy. Br. J. Cancer 2019, 120, 6–15. [Google Scholar] [CrossRef] [PubMed]
  13. Castiglioni, S.; Casati, S.; Ottria, R.; Ciuffreda, P.; Maier, J.A.M. N6-Isopentenyladenosine and Its Analogue N6-Benzyladenosine Induce Cell Cycle Arrest and Apoptosis in Bladder Carcinoma T24 Cells. Anticancer Agents Med. Chem. 2013, 13, 672–678. [Google Scholar] [CrossRef] [PubMed]
  14. Voller, J.; Zatloukal, M.; Lenobel, R.; Dolezal, K.; Béres, T.; Krystof, V.; Spíchal, L.; Niemann, P.; Dzubák, P.; Hajdúch, M.; et al. Anticancer Activity of Natural Cytokinins: A Structure-Activity Relationship Study. Phytochemistry 2010, 71, 1350–1359. [Google Scholar] [CrossRef] [PubMed]
  15. Wang, L.; Yu, D.L.; Zhang, H.W.; He, L.Y.; Wu, L. Ortho-Topolin Riboside Induces Apoptosis in Acute Myeloid Leukemia HL-60 Cells. Mol. Cell. Toxicol. 2016, 12, 159–166. [Google Scholar] [CrossRef]
  16. Yonova, P. ChemInform Abstract: Design, Synthesis and Properties of Synthetic Cytokinins. Recent Advances on Their Application. ChemInform 2012, 43, no. [Google Scholar] [CrossRef]
  17. Kim, K.K.; Singh, R.K.; Khazan, N.; Kodza, A.; Singh, N.A.; Jones, A.; Sivagnanalingam, U.; Towner, M.; Itamochi, H.; Turner, R.; et al. Development of Potent Forchlorfenuron Analogs and Their Cytotoxic Effect in Cancer Cell Lines. Sci. Rep. 2020, 10, 3241. [Google Scholar] [CrossRef] [PubMed]
  18. Blum, W.; Henzi, T.; Pecze, L.; Diep, K.-L.; Bochet, C.G.; Schwaller, B. The Phytohormone Forchlorfenuron Decreases Viability and Proliferation of Malignant Mesothelioma Cells in Vitro and in Vivo. Oncotarget 2019, 10, 6944–6956. [Google Scholar] [CrossRef]
  19. Weidner, C.; Rousseau, M.; Micikas, R.J.; Fischer, C.; Plauth, A.; Wowro, S.J.; Siems, K.; Hetterling, G.; Kliem, M.; Schroeder, F.C.; et al. Amorfrutin C Induces Apoptosis and Inhibits Proliferation in Colon Cancer Cells through Targeting Mitochondria. J. Nat. Prod. 2016, 79, 2–12. [Google Scholar] [CrossRef]
  20. Kalistratova, A.V.; Kovalenko, L.V.; Oshchepkov, M.S.; Gamisoniya, A.M.; Gerasimova, T.S.; Demidov, Y.A.; Akimov, M.G. Synthesis of New Compounds in the Series of Aryl-Substituted Ureas with Cytotoxic and Antioxidant Activity. Mendeleev Commun. 2020, 30, 153–155. [Google Scholar] [CrossRef]
  21. Chou, T.-C. Theoretical Basis, Experimental Design, and Computerized Simulation of Synergism and Antagonism in Drug Combination Studies. Pharmacol. Rev. 2006, 58, 621–681. [Google Scholar] [CrossRef] [PubMed]
  22. Cheng, R.K.Y.; Segala, E.; Robertson, N.; Deflorian, F.; Doré, A.S.; Errey, J.C.; Fiez-Vandal, C.; Marshall, F.H.; Cooke, R.M. Structures of Human A 1 and A 2A Adenosine Receptors with Xanthines Reveal Determinants of Selectivity. Structure 2017, 25, 1275–1285.e4. [Google Scholar] [CrossRef] [PubMed]
  23. Lebon, G.; Warne, T.; Edwards, P.C.; Bennett, K.; Langmead, C.J.; Leslie, A.G.W.; Tate, C.G. Agonist-Bound Adenosine A2A Receptor Structures Reveal Common Features of GPCR Activation. Nature 2011, 474, 521–525. [Google Scholar] [CrossRef] [PubMed]
  24. Ozeir, M.; Huyet, J.; Burgevin, M.-C.; Pinson, B.; Chesney, F.; Remy, J.-M.; Siddiqi, A.R.; Lupoli, R.; Pinon, G.; Saint-Marc, C.; et al. Structural Basis for Substrate Selectivity and Nucleophilic Substitution Mechanisms in Human Adenine Phosphoribosyltransferase Catalyzed Reaction. J. Biol. Chem. 2019, 294, 11980–11991. [Google Scholar] [CrossRef] [PubMed]
  25. Ludlow, R.F.; Verdonk, M.L.; Saini, H.K.; Tickle, I.J.; Jhoti, H. Detection of Secondary Binding Sites in Proteins Using Fragment Screening. Proc. Natl. Acad. Sci. U. S. A. 2015, 112, 15910–15915. [Google Scholar] [CrossRef] [PubMed]
  26. Brown, N.R.; Lowe, E.D.; Petri, E.; Skamnaki, V.; Antrobus, R.; Johnson, L. Cyclin B and Cyclin A Confer Different Substrate Recognition Properties on CDK2. Cell Cycle 2007, 6, 1350–1359. [Google Scholar] [CrossRef] [PubMed]
  27. Wesolowski, J.R.; Rajdev, P.; Mukherji, S.K. Temozolomide (Temodar). AJNR Am. J. Neuroradiol. 2010, 31, 1383–1384. [Google Scholar] [CrossRef] [PubMed]
  28. Thorn, C.F.; Oshiro, C.; Marsh, S.; Hernandez-Boussard, T.; McLeod, H.; Klein, T.E.; Altman, R.B. Doxorubicin Pathways. Pharmacogenet. Genomics 2011, 21, 440–446. [Google Scholar] [CrossRef] [PubMed]
  29. Wang, Q.; Ye, B.; Wang, P.; Yao, F.; Zhang, C.; Yu, G. Overview of MicroRNA-199a Regulation in Cancer. Cancer Manag. Res. 2019, 11, 10327–10335. [Google Scholar] [CrossRef]
  30. Naseem, M.; Othman, E.M.; Fathy, M.; Iqbal, J.; Howari, F.M.; AlRemeithi, F.A.; Kodandaraman, G.; Stopper, H.; Bencurova, E.; Vlachakis, D.; et al. Integrated Structural and Functional Analysis of the Protective Effects of Kinetin against Oxidative Stress in Mammalian Cellular Systems. Sci. Rep. 2020, 10. [Google Scholar] [CrossRef]
  31. Spíchal, L.; Kryŝtof, V.; Paprskářová, M.; Lenobel, R.; Stýskala, J.; Binarová, P.; Cenklová, V.; De Veylder, L.; Inzé; , D. ; Kontopidis, G.; et al. Classical Anticytokinins Do Not Interact with Cytokinin Receptors but Inhibit Cyclin-Dependent Kinases. J. Biol. Chem. 2007, 282, 14356–14363. [Google Scholar] [CrossRef] [PubMed]
  32. Young, G.-H.; Lin, J.-T.; Cheng, Y.-F.; Ho, C.-F.; Kuok, Q.-Y.; Hsu, R.-C.; Liao, W.-R.; Chen, C.-C.; Chen, H.-M. Modulation of Adenine Phosphoribosyltransferase-mediated Salvage Pathway to Accelerate Diabetic Wound Healing. FASEB J. 2021, 35. [Google Scholar] [CrossRef] [PubMed]
  33. Gessi, S.; Bencivenni, S.; Battistello, E.; Vincenzi, F.; Colotta, V.; Catarzi, D.; Varano, F.; Merighi, S.; Borea, P.A.; Varani, K. Inhibition of A2A Adenosine Receptor Signaling in Cancer Cells Proliferation by the Novel Antagonist TP455. Front. Pharmacol. 2017, 8. [Google Scholar] [CrossRef] [PubMed]
  34. Merighi, S.; Mirandola, P.; Milani, D.; Varani, K.; Gessi, S.; Klotz, K.-N.; Leung, E.; Baraldi, P.G.; Borea, P.A. Adenosine Receptors as Mediators of Both Cell Proliferation and Cell Death of Cultured Human Melanoma Cells. J. Invest. Dermatol. 2002, 119, 923–933. [Google Scholar] [CrossRef] [PubMed]
  35. Spencer, S.L.; Cappell, S.D.; Tsai, F.-C.; Overton, K.W.; Wang, C.L.; Meyer, T. The Proliferation-Quiescence Decision Is Controlled by a Bifurcation in CDK2 Activity at Mitotic Exit. Cell 2013, 155, 369–383. [Google Scholar] [CrossRef] [PubMed]
  36. White, E.Z.; Pennant, N.M.; Carter, J.R.; Hawsawi, O.; Odero-Marah, V.; Hinton, C.V. Serum Deprivation Initiates Adaptation and Survival to Oxidative Stress in Prostate Cancer Cells. Sci. Rep. 2020, 10. [Google Scholar] [CrossRef]
  37. Gong, X.; Liang, Z.; Yang, Y.; Liu, H.; Ji, J.; Fan, Y. A Resazurin-Based, Nondestructive Assay for Monitoring Cell Proliferation during a Scaffold-Based 3D Culture Process. Regen. Biomater. 2020, 7, 271–281. [Google Scholar] [CrossRef]
Figure 1. Cytokinin-like compounds forchlorfenuron (CPPU) and ethylenediurea (EDU).
Preprints 107505 g001
Scheme 1. Preparation of EDU derivatives (1-10).
Preprints 107505 sch001
Figure 2. The effect of the synthesized compounds on the MDA-MB-231 cells viability. The compounds are partitioned into two panes for convenience. (A,B) Incubation time 24 h; (С) incubation time 72 h. Resazurin test data, combined data of N=3, mean±standard error. *, a statistically significant difference from control without substance, p<0.05 in ANOVA with the Tukey post-test.
Preprints 107505 g002
Figure 3. The effect of the synthesized compounds on the U-87MG cells viability. The compounds are partitioned into two panes for convenience. (A,B) Incubation time 24 h; (С,D) incubation time 72 h. Resazurin test data, combined data of N=3 experiments, mean±standard error. *, a statistically significant difference from control without substance, p<0.05 in ANOVA with the Tukey post-test.
Preprints 107505 g003
Figure 4. The effect of the synthesized compounds on the A-375 cells viability. The compounds are partitioned into two panes for convenience. (A,B) Incubation time 24 h; (С,D) incubation time 72 h. Resazurin test data, combined data of N=3 experiments, mean±standard error. *, a statistically significant difference from control without substance, p<0.05 in ANOVA with the Tukey post-test.
Preprints 107505 g004
Figure 5. The effect of the synthesized compounds on the SH-SY5Y cells viability. The compounds are partitioned into two panes for convenience. (A,B) Incubation time 24 h; (C,D) incubation time 72 h. Resazurin test data, combined data of N=3 experiments, mean±standard error.
Preprints 107505 g005
Figure 6. The effect of the most active compounds on the viability of the human immortalized fibroblast Bj-5ta cell line. Negative control cells (100% viability) were treated with 0.5% DMSO. Positive control cells (100% cell death) were treated with 3.6 μL of 50% Triton X-100 in ethanol per 200 μL of the cell culture medium. 24 h incubation. Resazurin test data. Mean ± standard error (N=3 experiments).
Preprints 107505 g006
Figure 7. Cell death induction by the 23.1 compound for the MDA-MB-231 cell line. LDH test data, 48 h incubation time. Combined data of N = 3 experiments. * Statistically significant difference in the ANOVA with the Dunnett post-test, p < 0.05.
Preprints 107505 g007
Figure 8. The effect of the long-term incubation of compound 6 with the MDA-MB-231 cell line. Resazurin fluorescence data (background subtracted), N = 3 combined experiments. * Statistically significant difference from the control without substance, ANOVA with the Tukey post-test, p < 0.05.
Preprints 107505 g008
Figure 9. The effect of compound 6 on doxorubicin activity for the MDA-MB-231 (C, D) and U-87 MG (A, B) cell line. 24 h Incubation time, resazurin (B, D) and LDH (A, C) test data, mean±standard error (N=3 combined experiments). *, **, *** Statistically significant difference from the indicated control, ANOVA with the Tukey post-test, p < 0.05.
Preprints 107505 g009
Figure 10. The effect of compound 6 on temozolomide activity for the U-87 MG cell line. 24 h Incubation time, resazurin test data, mean±standard error (N=3 combined experiments). * Statistically significant difference from the indicated control, ANOVA with the Tukey post-test, p < 0.05.
Preprints 107505 g010
Figure 11. The effect of the synthesized compounds on the cytotoxicity of CoCl2 for the SH-SY5Y cell line; 24 h incubation time, resazurin test data, combined data of N=4 experiments, mean±standard error. * Statistically significant difference from the control without substance, ANOVA with the Tukey post-test, p < 0.05.
Preprints 107505 g011
Figure 12. The effect of the synthesized compounds on the cytotoxicity of H2O2 for the SH-SY5Y cell line; 24 h incubation time, resazurin test data, combined data of N=4 experiments, mean±standard error.
Preprints 107505 g012
Figure 13. The effect of compound 2 on the SH-SY5Y cells proliferation, 72 h incubation time, BrDU test data, mean±standard error (N=3 experiments). * Statistically significant difference from the control without substance, ANOVA with the Tukey post-test, p < 0.05.
Preprints 107505 g013
Figure 14. Preferred docking sites’ location for the A2AR variant 5mzj. Violet: centroids of the receptor residues.
Preprints 107505 g014
Figure 15. Preferred docking sites’ location for the APRT variant 6hgs. Rose: centroids of the receptor residues.
Preprints 107505 g015
Figure 16. Preferred docking sites’ location for the CDK2 variant 5fp5. Brown: centroids of the receptor residues. Blue: centroids of the docked molecules.
Preprints 107505 g016
Table 1. The structure and yields of the synthesized compounds.
Compound R1 R2 R3 X Yield, %
1 CH3 - CH3 NH 59
2 CH3 - CH3 O 30
3 - CH3 - NH 31
4 - CH3 - O 36
5 C2H5 - - NH 62
6 C2H5 - - O 50
7 CH3 CH3 - NH 58
8 - OCH3 - NH 35
9 - OCH3 - O 18
10 - COOCH3 - O 30
Table 2. Cell viability at the concentration of 100 µM of the active compounds; 24 h incubation time, resazurin test data, combined data of N=3 experiments, mean (95% C.I.).
Bj-5ta MDA-MB-231 U-87 MG A-375 SH-SY5Y
Cell viability, % (95% C.I.)
6 96.8 (91.39-102.2) 86.26 (62.59-109.94) 102.83 (83.22-122.43) 78.46 (46.77-110.16) 92.2 (39.62-144.79)
8 100.85 (55.45-146.25) 87.15 (65.36-108.94) 92.77 (-23.93-209.49) 97.07 (74.48-119.67) 90.27 (35.67-144.87)
Table 3. Cell viability at the concentration of 100 µM of the active compounds; 72 h incubation time, resazurin test data, combined data of N=3 experiments, mean (95% C.I.).
MDA-MB-231 U-87 MG SH-SY5Y
Cell viability, % (95% C.I.)
6 83.25 (78.1-96.6) 85.87 (80.19-99.93) 77.44 (55.52-99.36)
8 94.71 (56.93-132.48) 107.81 (91.59-124.04) 85.13 (74.19-96.06)
Table 4. The effect of the combination of 6 with doxorubicin on the MDA-MB-231 and U-87 MG cell lines, 24 h incubation time, averaged resazurin (viability), or LDH (cell death) test data. Averaged data from N=3 combined experiments.
Doxorubicin, µm (6), µM CI
MDA-MB-231, Viability MDA-MB-231,Cell death U-87 MG, Viability
10.0 90.0 1.50 1.81 1.09285
10.0 100.0 1.17 1.68 1.09440
75.0 90.0 1.35 1.40 0.32642
75.0 100.0 1.22 1.90 0.53187
100.0 90.0 1.65 0.79 0.57710
100.0 100.0 0.17 0.88 0.60758
Table 5. The effect of the combination of 6 with temozolomide on U-87 MG cell line, 24 h incubation time, averaged resazurin test data. Averaged data from N=3 combined experiments.
Temozolomide, µm (6), µM CI
500.0 80.0 1.51722
700.0 90.0 1.68461
900.0 100.0 1.82996
Table 6. Affinity of the synthesized compounds for the adenosine A2 receptor crystal variants. AutoDock Vina data. Lower energy means higher affinity.
A2AR A2AR (active) + Adenosine (activator) A2AR (inactivated) + Caffeine (blocker)
Mean±SEM p Mean±SEM p Mean±SEM p
Adenosine 5.32±0.05 - 3.06±0.15 - 5.17±0.06 -
9 5.11±0.04 0.340 3.87±0.11* 0.000 5.09±0.04 1.000
8 5.53±0.04 0.310 4.67±0.09* 0.000 5.26±0.04 1.000
7 5.79±0.03* 0.000 4.66±0.19* 0.000 5.75±0.04* 0.000
1 5.8±0.04* 0.000 4.96±0.09* 0.000 5.71±0.04* 0.000
5 5.67±0.03* 0.000 4.8±0.14* 0.000 5.61±0.03* 0.000
6 5.42±0.03 0.999 3.54±0.2 0.072 5.38±0.04 0.166
2 5.56±0.04 0.078 3.66±0.18* 0.002 5.59±0.03* 0.000
10 5.28±0.04 1.000 4.37±0.11* 0.000 5.2±0.03 1.000
*, a statistically significant difference from the adenosine binding, ANOVA with the Tukey post-test.
Table 7. Affinity of the synthesized compounds for the APRT crystal variants. AutoDock Vina data. Lower energy means higher affinity.
APRT+GMP (active conformation) APRT+IMP (inactivated conformation)
Mean±SEM P Mean±SEM p
IMP (blocker) 7.32±0.08 - 7.69±0.07 -
GMP (activator) 6.23±0.06 - 6.24±0.07 -
9 5.33±0.06* 0.000 5.55±0.06* 0.000
8 5.63±0.05* 0.000 5.7±0.04* 0.000
7 6.22±0.06 1.000 6.27±0.06 1.000
1 6.1±0.07 0.918 6.4±0.06 0.720
5 5.95±0.05* 0.044 6.0±0.05 0.088
6 5.93±0.05* 0.020 5.65±0.07* 0.000
2 6.29±0.06 0.999 6.21±0.06 1.000
10 5.4±0.05* 0.000 5.57±0.05* 0.000
*, a statistically significant difference from the GMP binding, ANOVA with the Tukey post-test.
Table 8. Affinity of the synthesized compounds for the CDK2 crystal variants. AutoDock Vina data. Lower energy means higher affinity.
CDK2 CDK2+Cyclin D (active conformation)
Mean±SEM p Mean±SEM p
SCE (blocker) 5.03±0.05 - 5.44±0.04 0.963
9 5.18±0.06 0.849 5.3±0.04* 0.004
8 5.71±0.06* 0.000 5.9±0.03* 0.000
7 6.12±0.09* 0.000 6.32±0.05* 0.000
1 5.91±0.07* 0.000 6.1±0.05* 0.000
5 6.36±0.09* 0.000 6.22±0.04* 0.000
6 5.36±0.07* 0.025 5.78±0.05 0.133
2 5.99±0.08* 0.000 5.95±0.04* 0.000
10 5.24±0.07 0.495 5.56±0.04 1.000
*, a statistically significant difference from the GMP binding, ANOVA with the Tukey post-test.
Table 9. Grid centers of the docking experiments.
Protein Configuration Variant x y z
A2AR 5mzj 1 −17.629 −30.760 18.168
2 −4.629 −50.760 18.168
3 −17.629 6.760 18.168
A2AR 2ydo 1 −23.602 10.545 −25.256
2 −23.602 20.545 −25.256
3 −4.629 −50.760 18.168
A2AR 5mzp 1 −16.417 −40.474 18.316
2 −16.417 5.474 18.316
3 −1.417 −50.474 18.316
APRT 6hgs 1 22.572 −3.082 4.313
APRT 6hgr 1 23.667 −7.067 5.057
APRT 6hgp 1 −24.642 0.247 1.919
CDK2 5fp5 1 29.547 4.964 49.678
CDK2 2jgz 1 55.623 20.504 −10.503
2 38.623 20.504 5.503
3 38.623 20.504 −30.503
Disclaimer/Publisher’s Note: The statements, opinions and data contained in all publications are solely those of the individual author(s) and contributor(s) and not of MDPI and/or the editor(s). MDPI and/or the editor(s) disclaim responsibility for any injury to people or property resulting from any ideas, methods, instructions or products referred to in the content.
Copyright: This open access article is published under a Creative Commons CC BY 4.0 license, which permit the free download, distribution, and reuse, provided that the author and preprint are cited in any reuse.
Prerpints.org logo

Preprints.org is a free preprint server supported by MDPI in Basel, Switzerland.

Subscribe

© 2024 MDPI (Basel, Switzerland) unless otherwise stated