Preprint
Brief Report

Exploring the Potential of Using High-Performance Rubberized Concrete in Column Jacketing

This version is not peer-reviewed.

Submitted:

25 May 2024

Posted:

28 May 2024

You are already at the latest version

Abstract
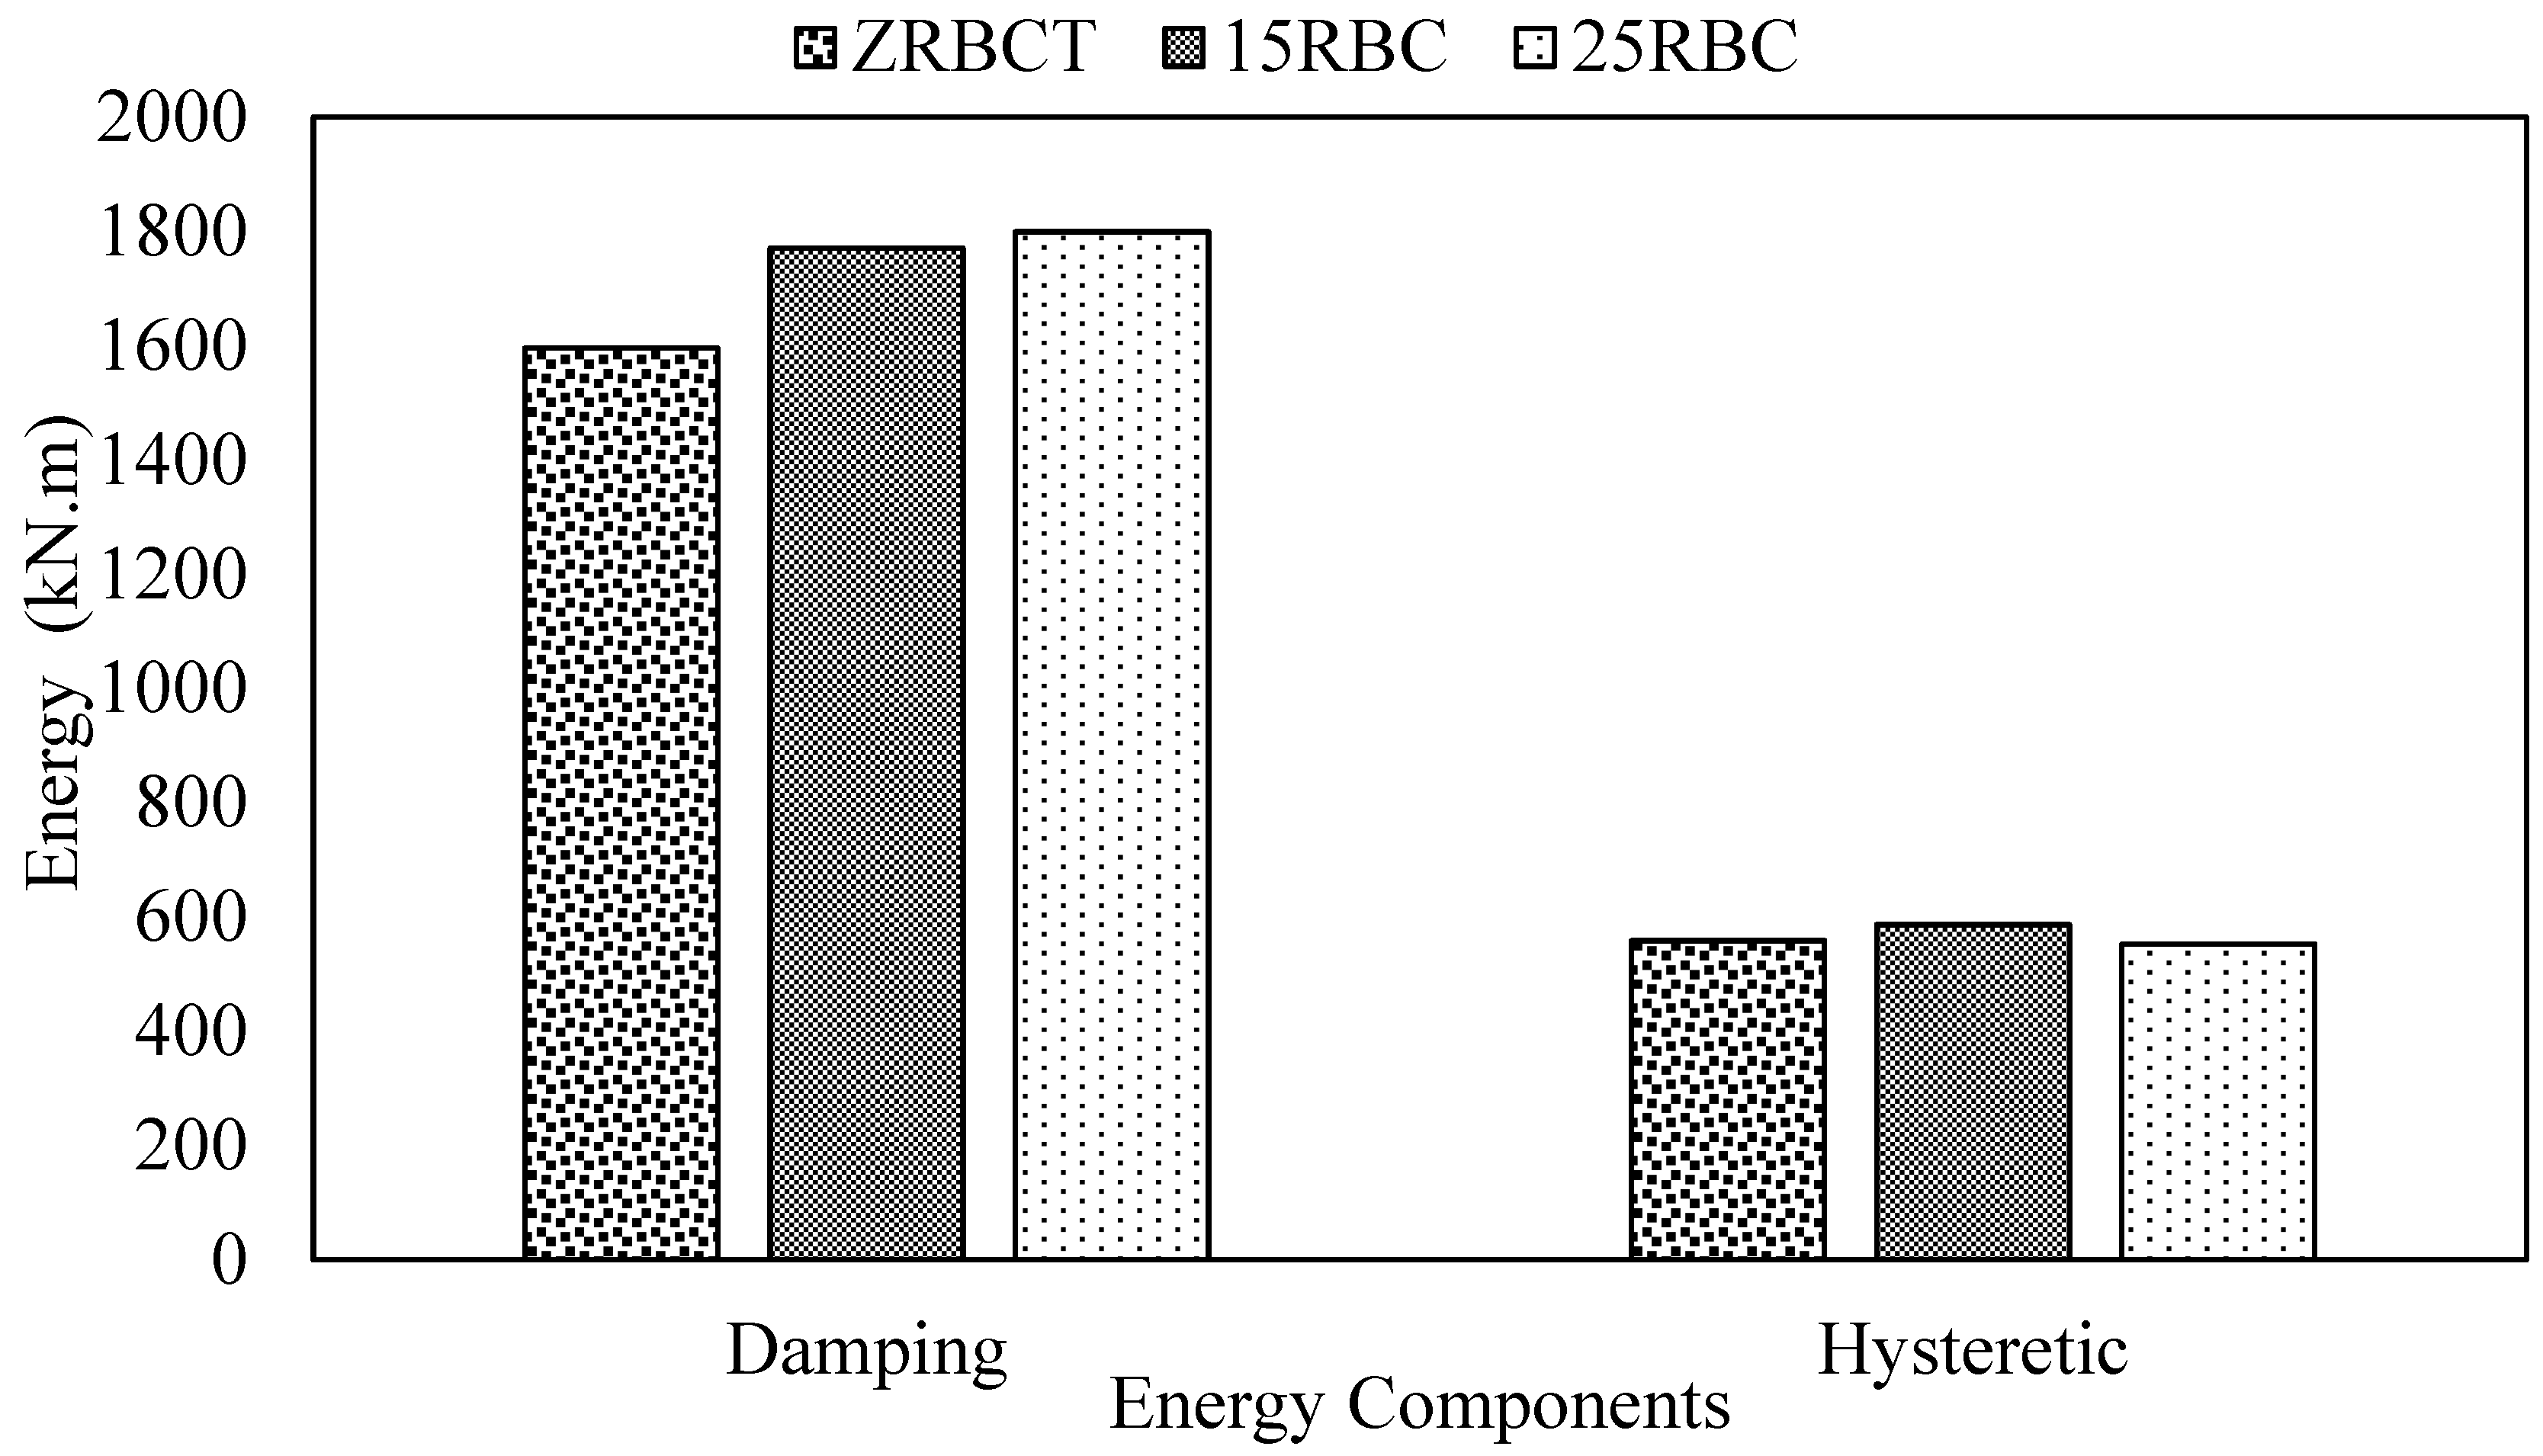
In recent years, extensive research has focused on investigating rubberized concrete as a structural material due to its enhanced properties, including increased ductility, improved energy dissipation, and higher damping ratios. Additionally, rubberized concrete contributes to sustainable development by recycling non-biodegradable waste and reducing the use of natural aggregates in concrete mixtures. However, its performance in retrofitting existing structures remains unclear and requires thorough investigation before it can be widely implemented in construction activities. The main objective of this research is to evaluate the seismic performance of reinforced concrete buildings strengthened with rubberized concrete jackets under severe earthquake excitations. To achieve this, laboratory tests were conducted to assess the properties of high-performance, self-compacting rubberized concrete mixes with various rubber content levels. Additionally, finite element models of reinforced concrete retrofitted with these mixes were analyzed using nonlinear response history analysis to compare their performance against control models. The results of this experimental work indicate a significant reduction in the mechanical properties of rubberized concrete. However, there is a considerable improvement in the damping ratio, which enhances the energy dissipation capacity of the structures. This improvement contributes to an increase in damping energy and a reduction in hysteretic energy, suggesting that rubberized concrete jackets can enhance the seismic resilience of reinforced concrete buildings.
Keywords: 
Subject: 
Engineering  -   Civil Engineering

1. Introduction

1.1. General Introduction

Under catastrophic disasters such as earthquakes, typhoons, etc… a stochastic shaking intensity will vibrate structures like buildings, skyscrapers and bridges and will severely damage their structural elements due to the energy-dissipation mechanism that composed of rebar yielding, rebar slip, concrete cracking, and concrete spalling (Moustafa et al., 2017). Over the past decades several methods were proposed for retrofitting reinforced concrete (RC) members to increase their load carrying capacity, stiffness and confinement. During the recent years, many investigations on the use of recycled rubber particle in concrete by means of aggregate replacement were done trying to develop what so-called ‘rubberized concrete (RBC)’. The main benefit of that type of concrete comes from the ability of rubber to highly dissipates energy which when used in the structural members can positively influence the vibration behavior of the structures. However, applications of such a concrete for structural strengthening is still unclear and needs to be highlighted. Therefore, the vibration behavior and energy dissipation capacity of RBC are raising the need for a comprehensive investigation to assess the capability of using this material in strengthening old RC structures. This study is intended to take the research in the field of the retrofitting RC structures one step further, to enhance the vibration behavior and energy dissipation of strengthened members in addition to increase the safety level of existing structures and to protect human lives.

1.2. Aim of the Study

This research focuses on developing high-performance self-compacting rubberized concrete (HPSCRBC) and evaluate it in strengthening of RC structures. This is planned to be achieved through a solid experimental test in addition to a computer-based numerical investigation composed of FEM that will be analyzed using the equivalent lateral force method (ELFM) and the nonlinear response history analysis method (NRHA). Thus, the primary aim of this study is divided into two main sub-aims, the first one intends to develop a concrete mixture that meets the requirements of high-performance self-compacting concrete in terms of compressive strength capacity, durability and flowability using rubber aggregates and to study the effects of adding these particles on the mechanical, durability and vibration properties of the developed concrete. The second one intends to address the performance of seismically retrofitted structure using reinforced RBC jacketing in comparison to control models. This information is missing from the literature and essential toward ensuring the reliability of using such a material for strengthening purposes.

2. Literature Review

2.1. Introduction

This chapter is going to represents a review of the previous studies on the fields of RBC and RC jacketing. Difficulties that were faced and remarks of many papers are summarized to clarify the current state of the art in these majors. In general, most of the available works on RBC have tried to highlight and suggest solutions to overcome the decrease in properties of concrete is due to including rubber aggregates in mixture. On the other hand, the published papers on RC jackets have provided useful information on its behavior and its bonding strength with the old element in addition to theoretical methods to find the expected strength and properties of the retrofitted element. Therefore, the aim of this chapter is to obtain useful information from the literature which can be used for developing a suitable RBC mix to be used for retrofitting purposes.

2.2. Properties and Structural Behavior of Rubberized Concrete: A Review

2.2.1. Introduction

Discarding of old tires rubber is indeed a very serious environmental problem all over the world (Yung et al., 2013; Pelisser et al., 2011; Aslani et al., 2015; Habib et al., 2020a) represented by a high risk for uncontrolled fires and other environmental hazards and health problems (Hassanli et al., 2017). It was estimated by the World Business Council for Sustainable Development (WBCSD, 2010) that about one billion tires get to the end of its life span yearly in the world. In addition, by the year 2030 the number of disposed rubber tire will be 1200 million tires per year excluding those stockpiled (Thomas and Gupta, 2016). For that reason, some programs for managing this waste material had already started in the USA, however, there still 128 million tires dumped in the land (Xue and Shinozuka, 2013). This availability and high volume of generation encouraged researchers in the construction industry to consider some sustainable plans by incorporating this recycled material as part of aggregates in the concrete mixes (Thomas and Gupta, 2016; Onuaguluchi and Panesar 2014). These plans are considered a double-sided victory from a sustainable point of view in which they are saving the environment from the risk caused by dumping this material and preserving the natural resources by introducing an alternative material that can be used instead of natural aggregates in the form of RBC (Thomas et al., 2014). These plans align with the intention of the construction industry to recycling non-biodegradable wastes in construction materials (Habib and Habib, 2020). Nowadays, RBC is attracting many scholars who are seeking to overcome the obstacles preventing its implantation in solving real life engineering problems. During the previous years, many investigations were done to address the properties and characteristics of this type of concrete. This number of studies encouraged some researchers to conduct literature reviews clarifying the findings and highlighting the challenges in this field (Alam et al., 2015; Soni and Mary 2017; Kumaran et al., 2009; Li et al., 2016; Mushunje et al., 2018; Najim and Hall 2010; Siddique and Naik 2004; Thomas and Gupta 2016; Li et al., 2012).

2.2.2. Characteristics of Recycled Rubber Particles

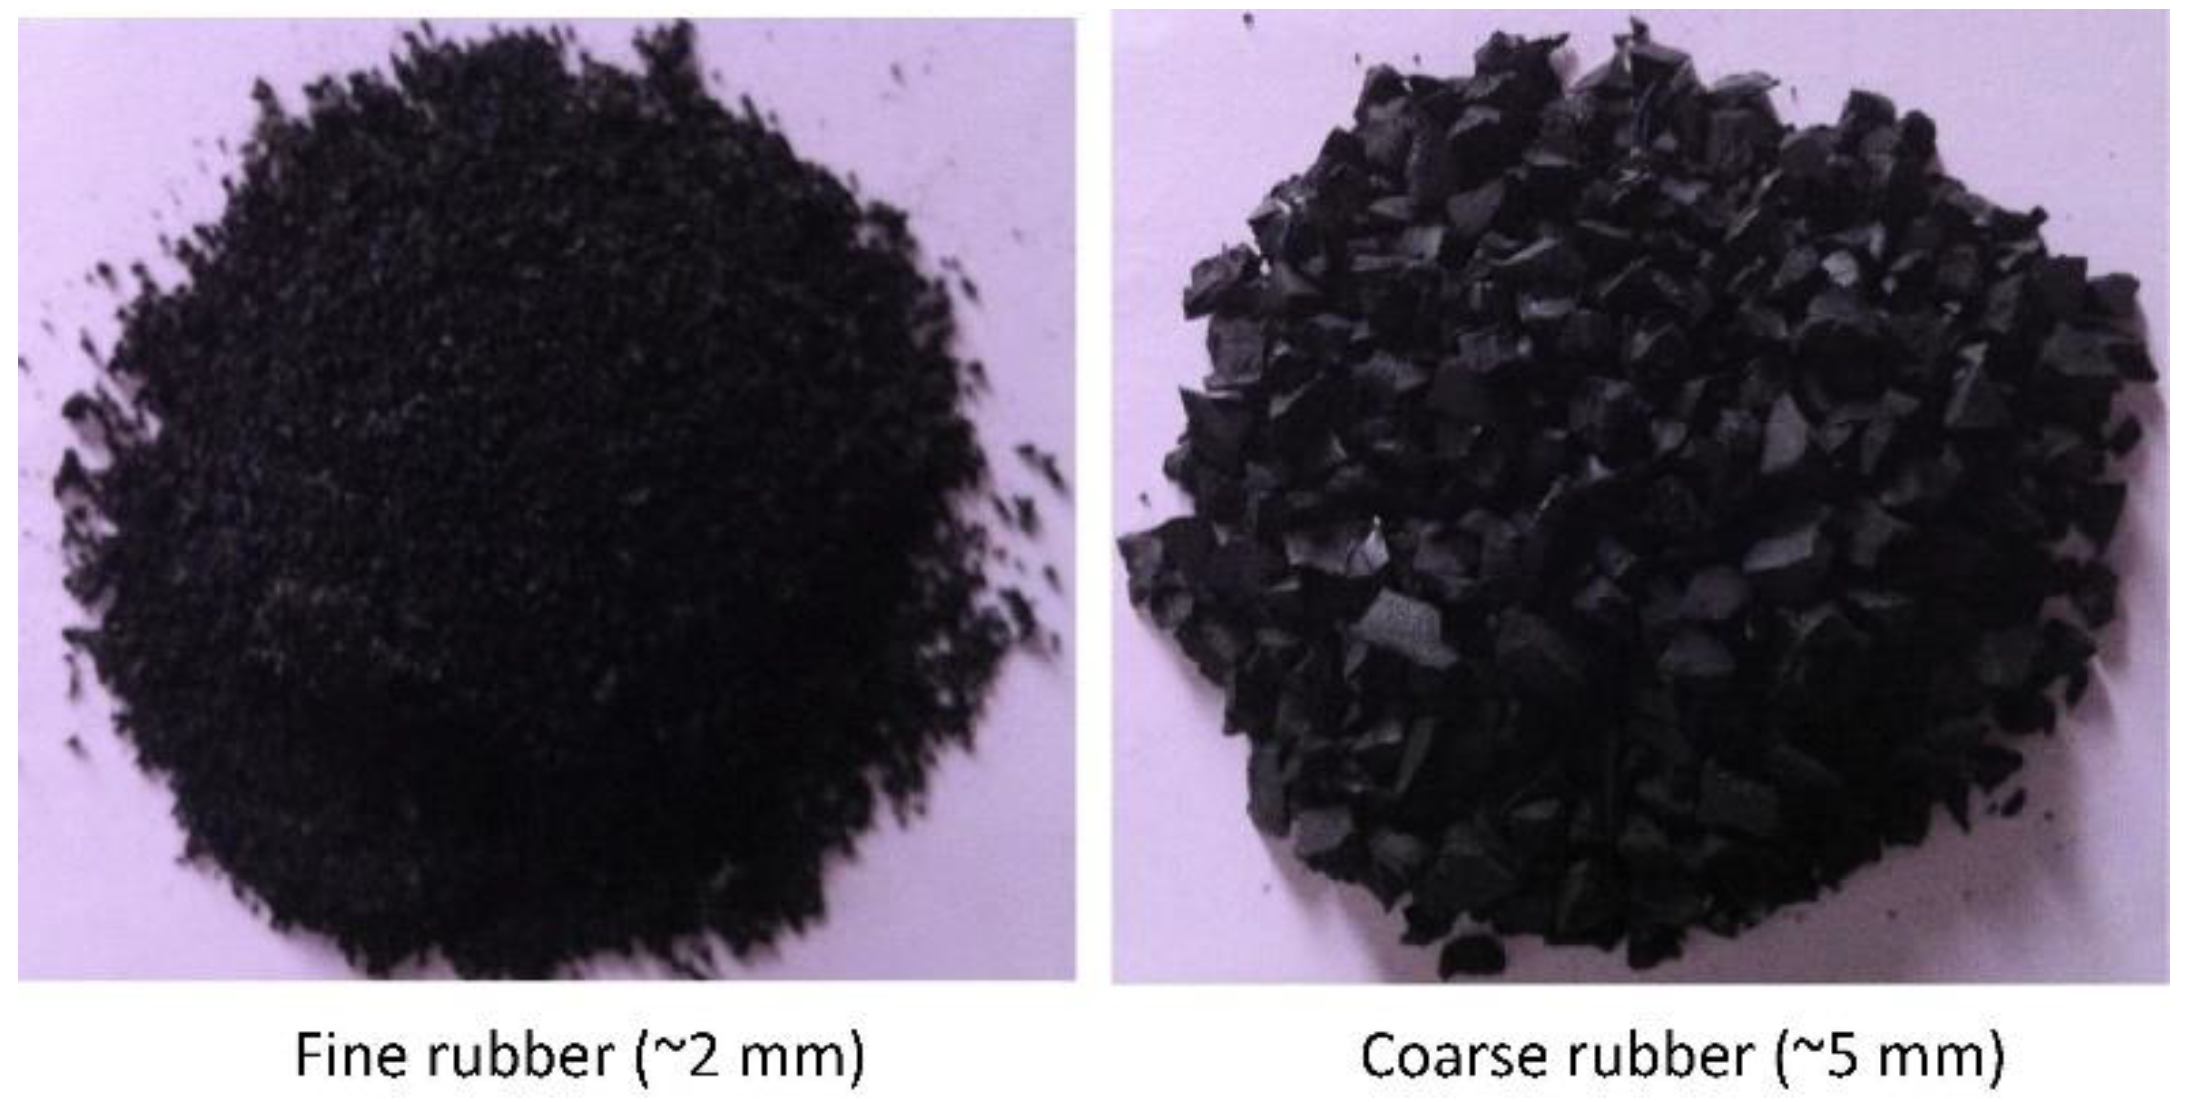
Recycled rubber (Figure 1) as a term generally refers to the material that is produced by cutting irreparable, old and no longer usable tires into small particles. Similar to aggregate it which is categorized into different categories (Table 1) according its size distribution (Siddique and Naik, 2004). Due to its low specific gravity (Table 2) compared to normal one (2.65) it can be clearly considered as a lightweight aggregate. Furthermore, mix that included this material must be designed careful considering its high-water absorption which will definitely affect the properties of concrete.

2.2.3. Fresh Properties of Rubberized Concrete

Old investigations on RBC have confirmed a drop in its workability while increasing the percentage of rubber replacement (Eldin and Senouci 1992; Su et al., 1999; Hernández-Olivares and Barluenga 2004; Güneyisi et al., 2004; Youssf et al., 2014), this is due to the difference in rubber shape and texture in comparison to the natural aggregate ones which slow down its movement in the fresh mix causing a lower concrete slump (Youssf et al., 2014). However, it was reported that using rubber particles with a size distribution similar to sand enhances the workability considerably (Su et al., 2015). Although adding rubber particles to concrete makes the handling process harder compared to normal mixes, its workability was still good (Eldin and Senouci, 1992) even for mixes with up to 50% replacement of total aggregate by volume (Hernández-Olivares and Barluenga, 2004), however, it is required to increase the amount of admixture for high rubber content in order to maintain a possible placement and finishing (Bisht and Ramana, 2017). Fresh density of concrete is another property reduced when rubber particles are included resulting a lighter mix in comparison to the control one (Güneyisi et al., 2004). This is induced by the variety in the density of rubber in comparison to natural aggregate (Su et al., 2015). On the other hand, the air content is directly proportional to rubber content regardless of the compaction effort (Khatib et al., 1999). This is resulted from the non-polarity of rubber aggregate such that they tend to entrap air in around their surfaces (Siddique and Naik, 2004).

2.2.4. Mechanical Properties of Rubberized Concrete

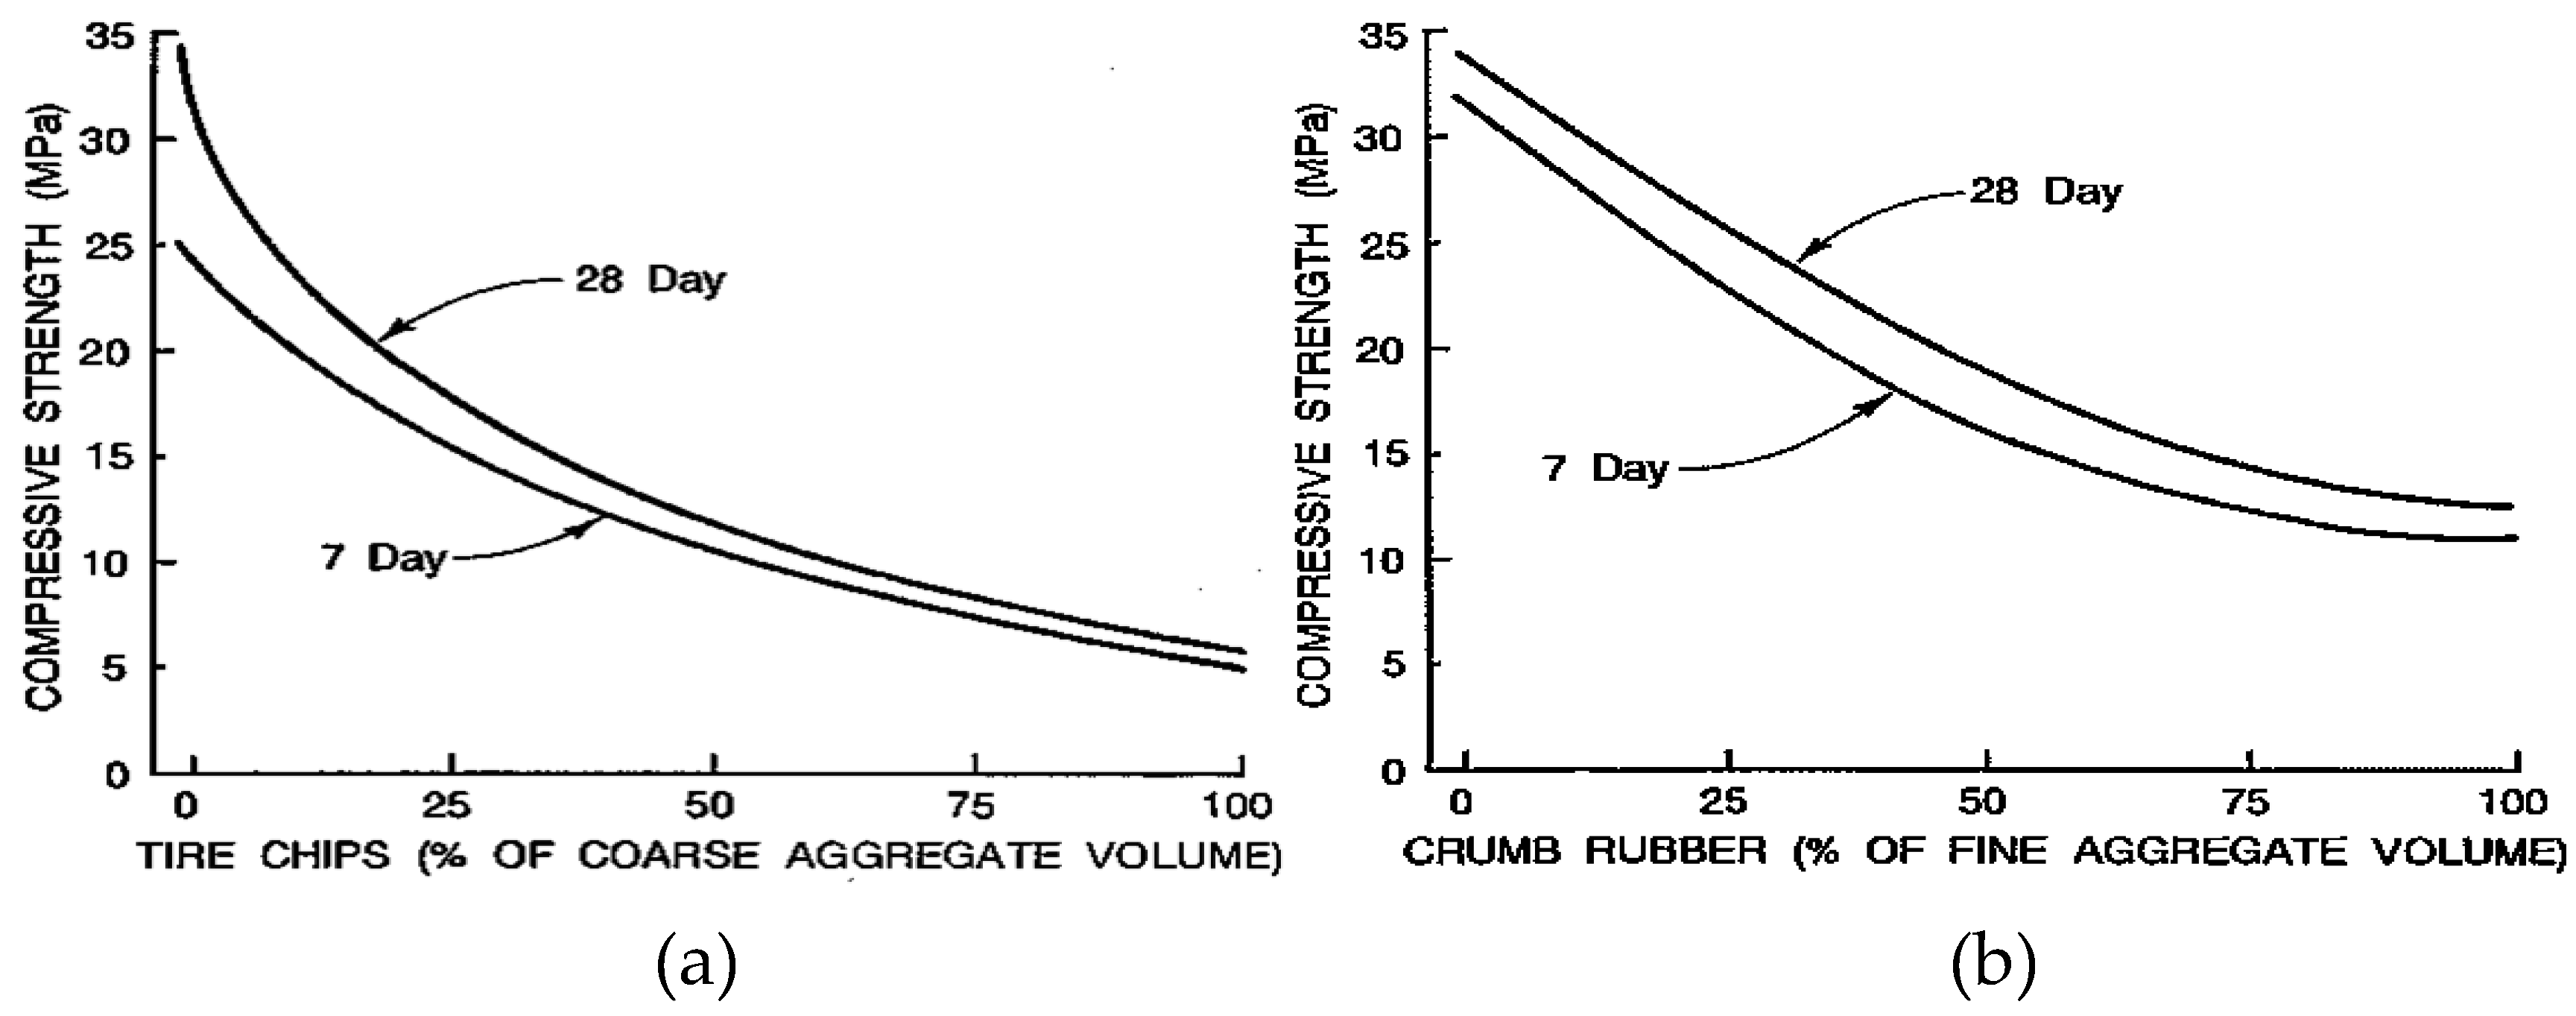
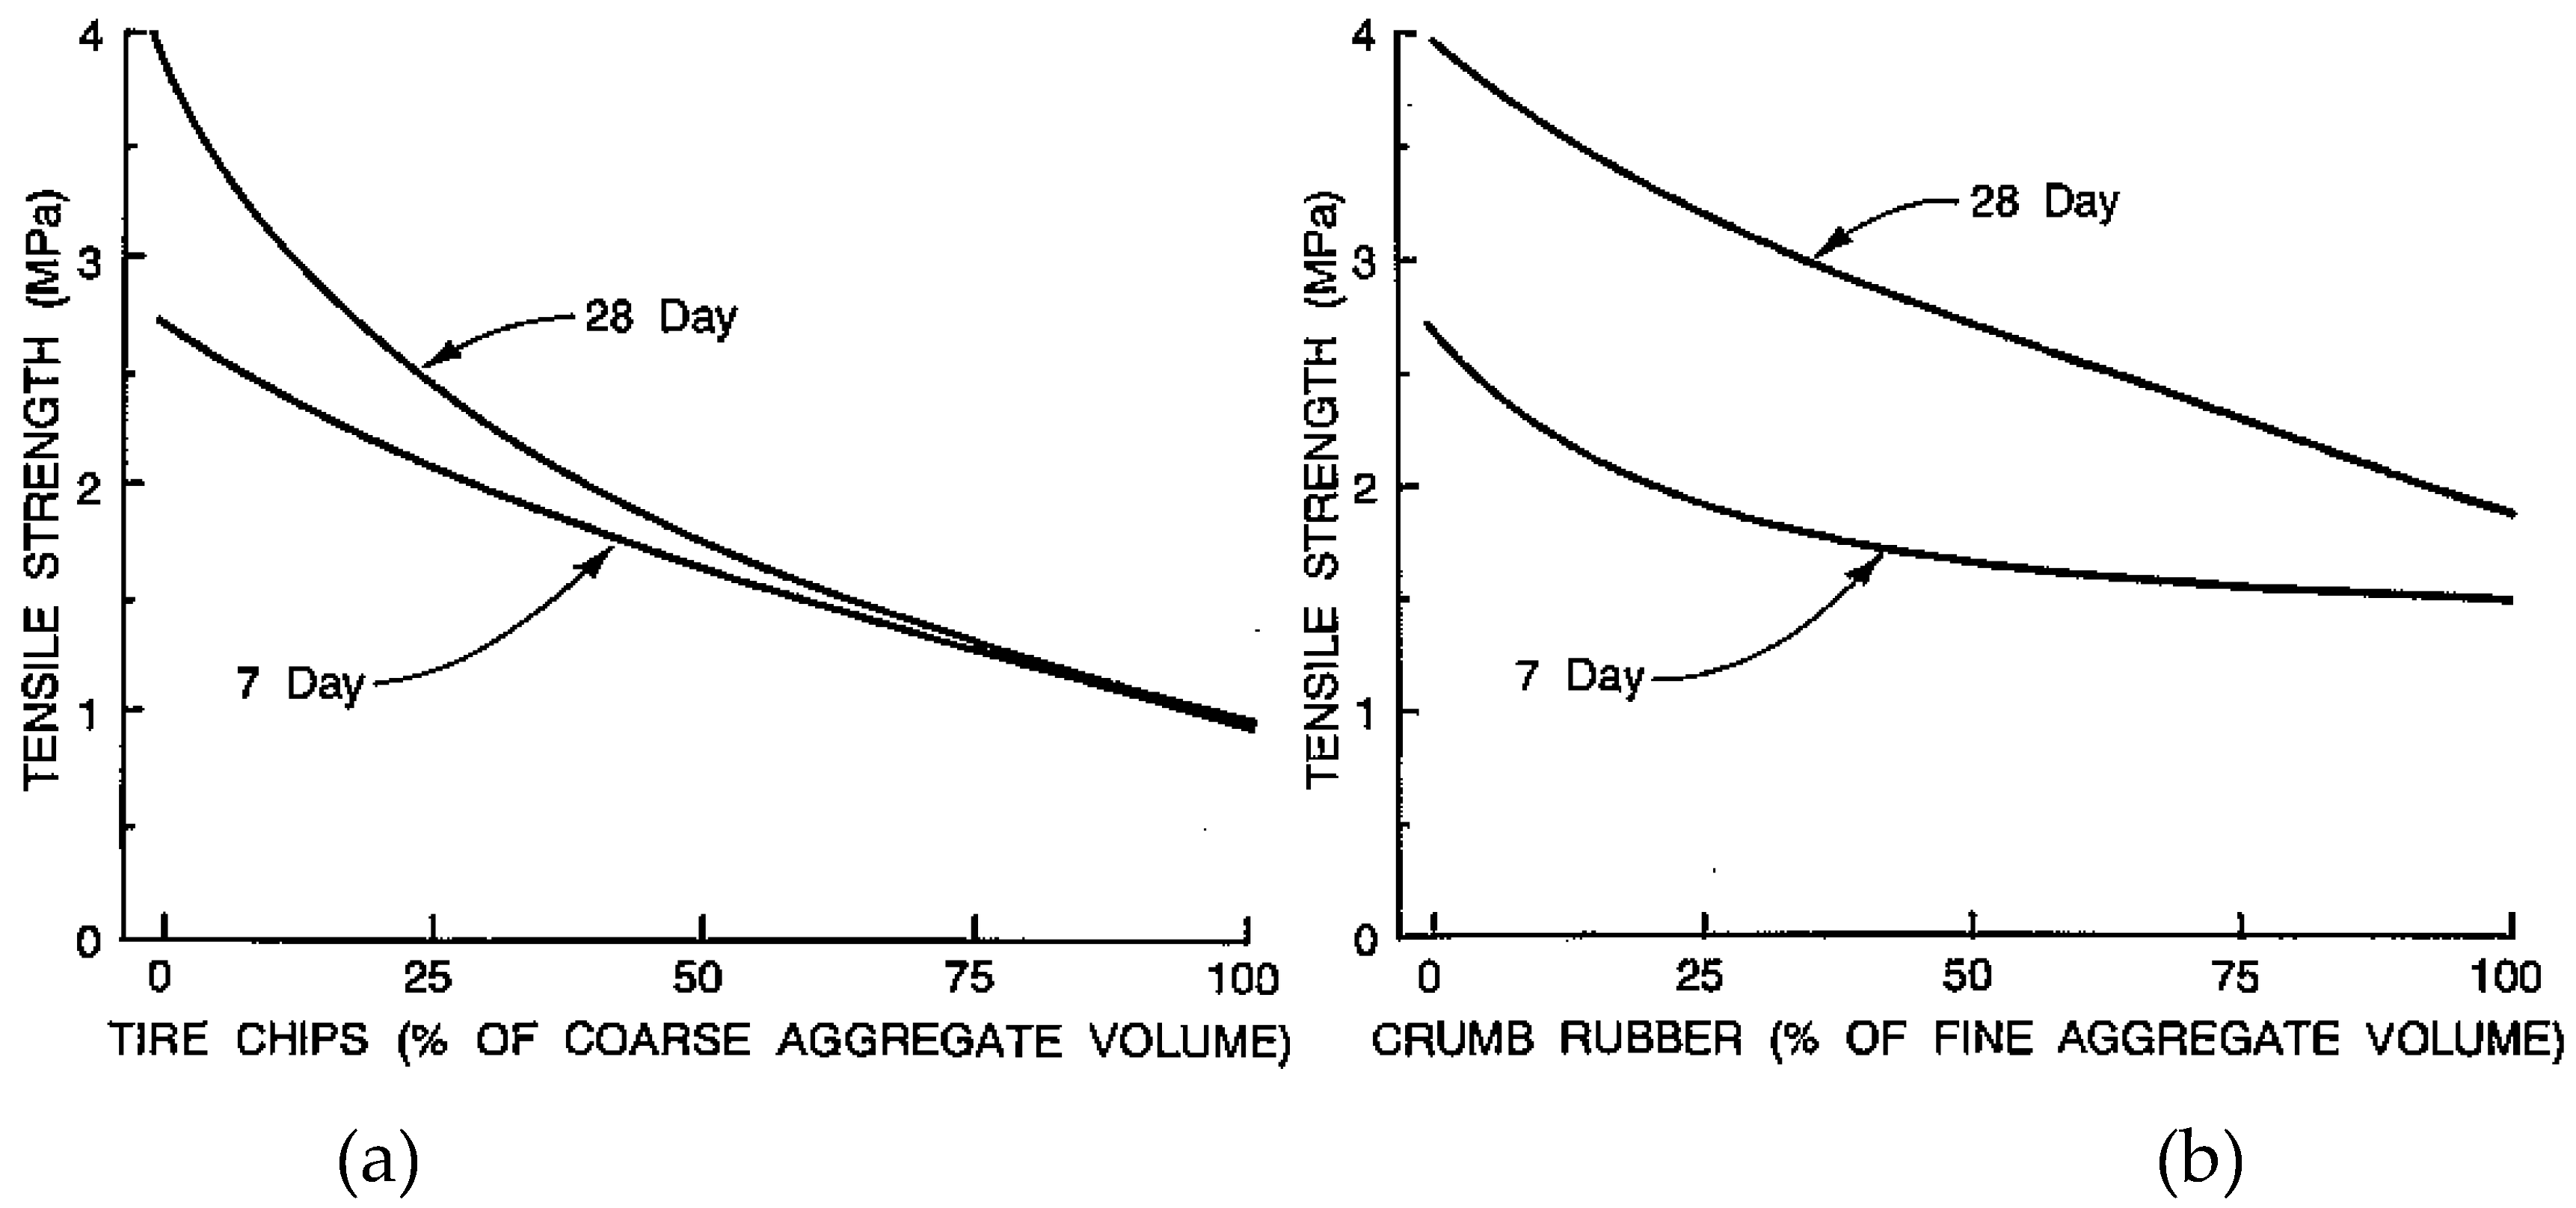
Indeed, the strengths of concrete are important factors in investigating the properties of construction materials (Malkawi et al., 2020a, b; Habib and Okayli, 2024). Since the early 1990s studies on the mechanical properties kept confirming that replacing aggregate by rubber particles in concrete changes its behavior compared to normal concrete. Authors (Eldin and Senouci, 1992; Fattuhi and Clark, 1996; Khatib and Bayomy, 1999; Zheng et al., 2008) concluded that the compressive strength of RBC faced a reduction correlated to rubber percentage in concrete mix. In addition, Güneyisi et al. (Güneyisi et al., 2004) extended this conclusion to cover the relation between reduction in modulus of elasticity and rubber content. Findings (Eldin and Senouci 1993; Eldin and Senouci 1994; Topçu 1995) confirmed that replacing coarse aggregate by coarse rubber particles significantly decrease the compressive (Figure 2) and tensile strength (Figure 3) of concrete in compression with replacing sand by fine rubber. This reduction is attributed to (1) replacing higher strength and load-carrying capacity aggregate by lower one (Xue and Shinozuka, 2013) (2) the weaker bond between rubber aggregates and cement past which lead to rapid rupture of concrete (Bisht and Ramana 2017) (3) disturbing the water transfer process which lead to imperfections in the hydration of cement surrounding rubber particles and overall dropping in compressive strength capacity of concrete (Chou et al., 2007).
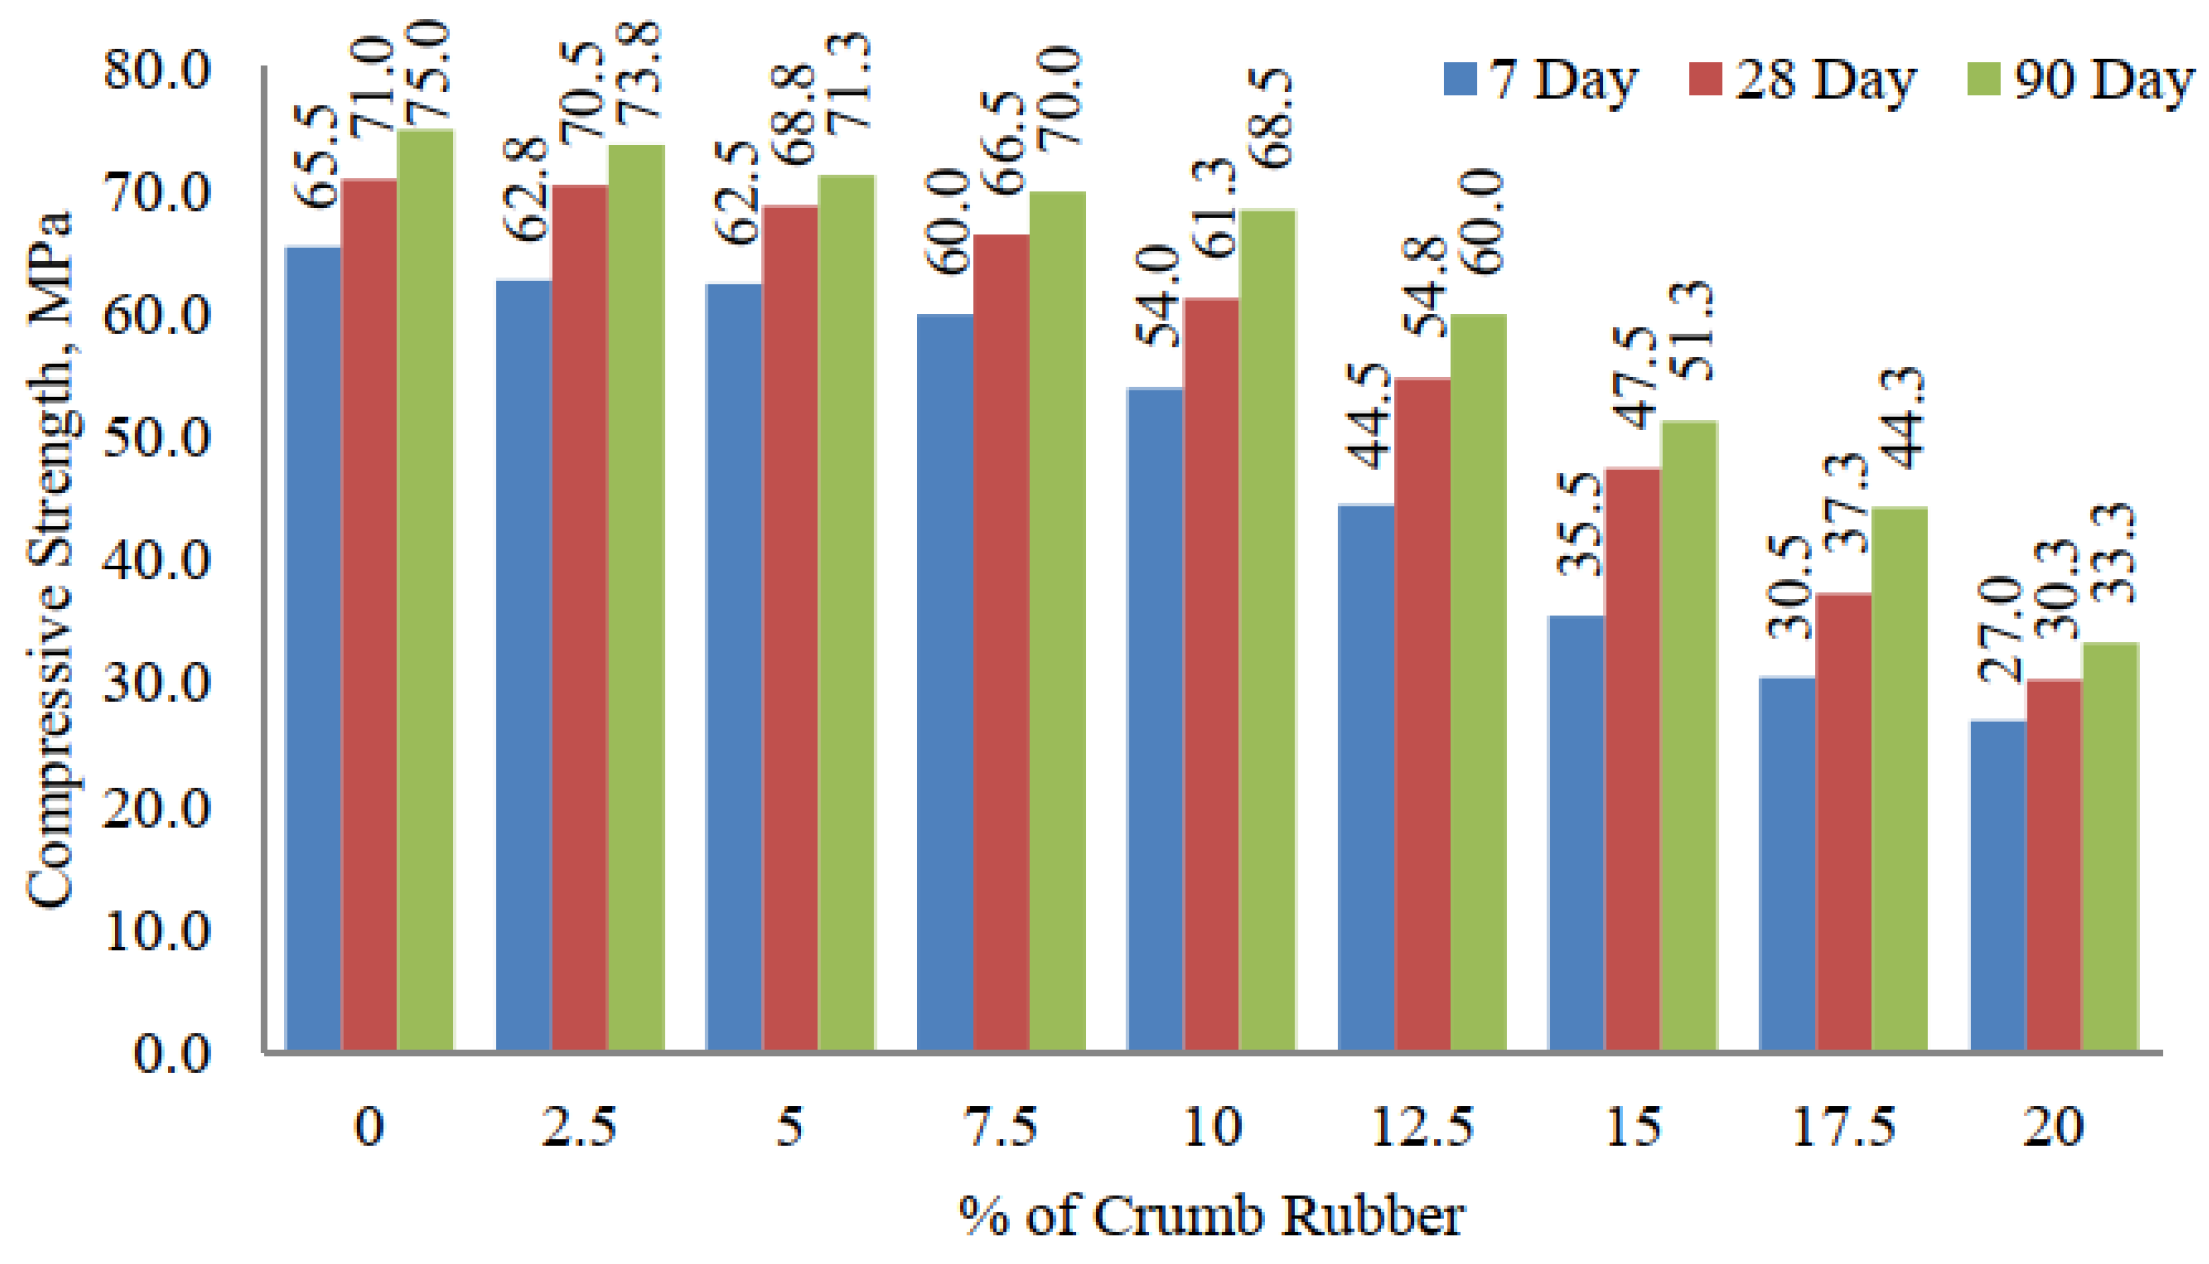
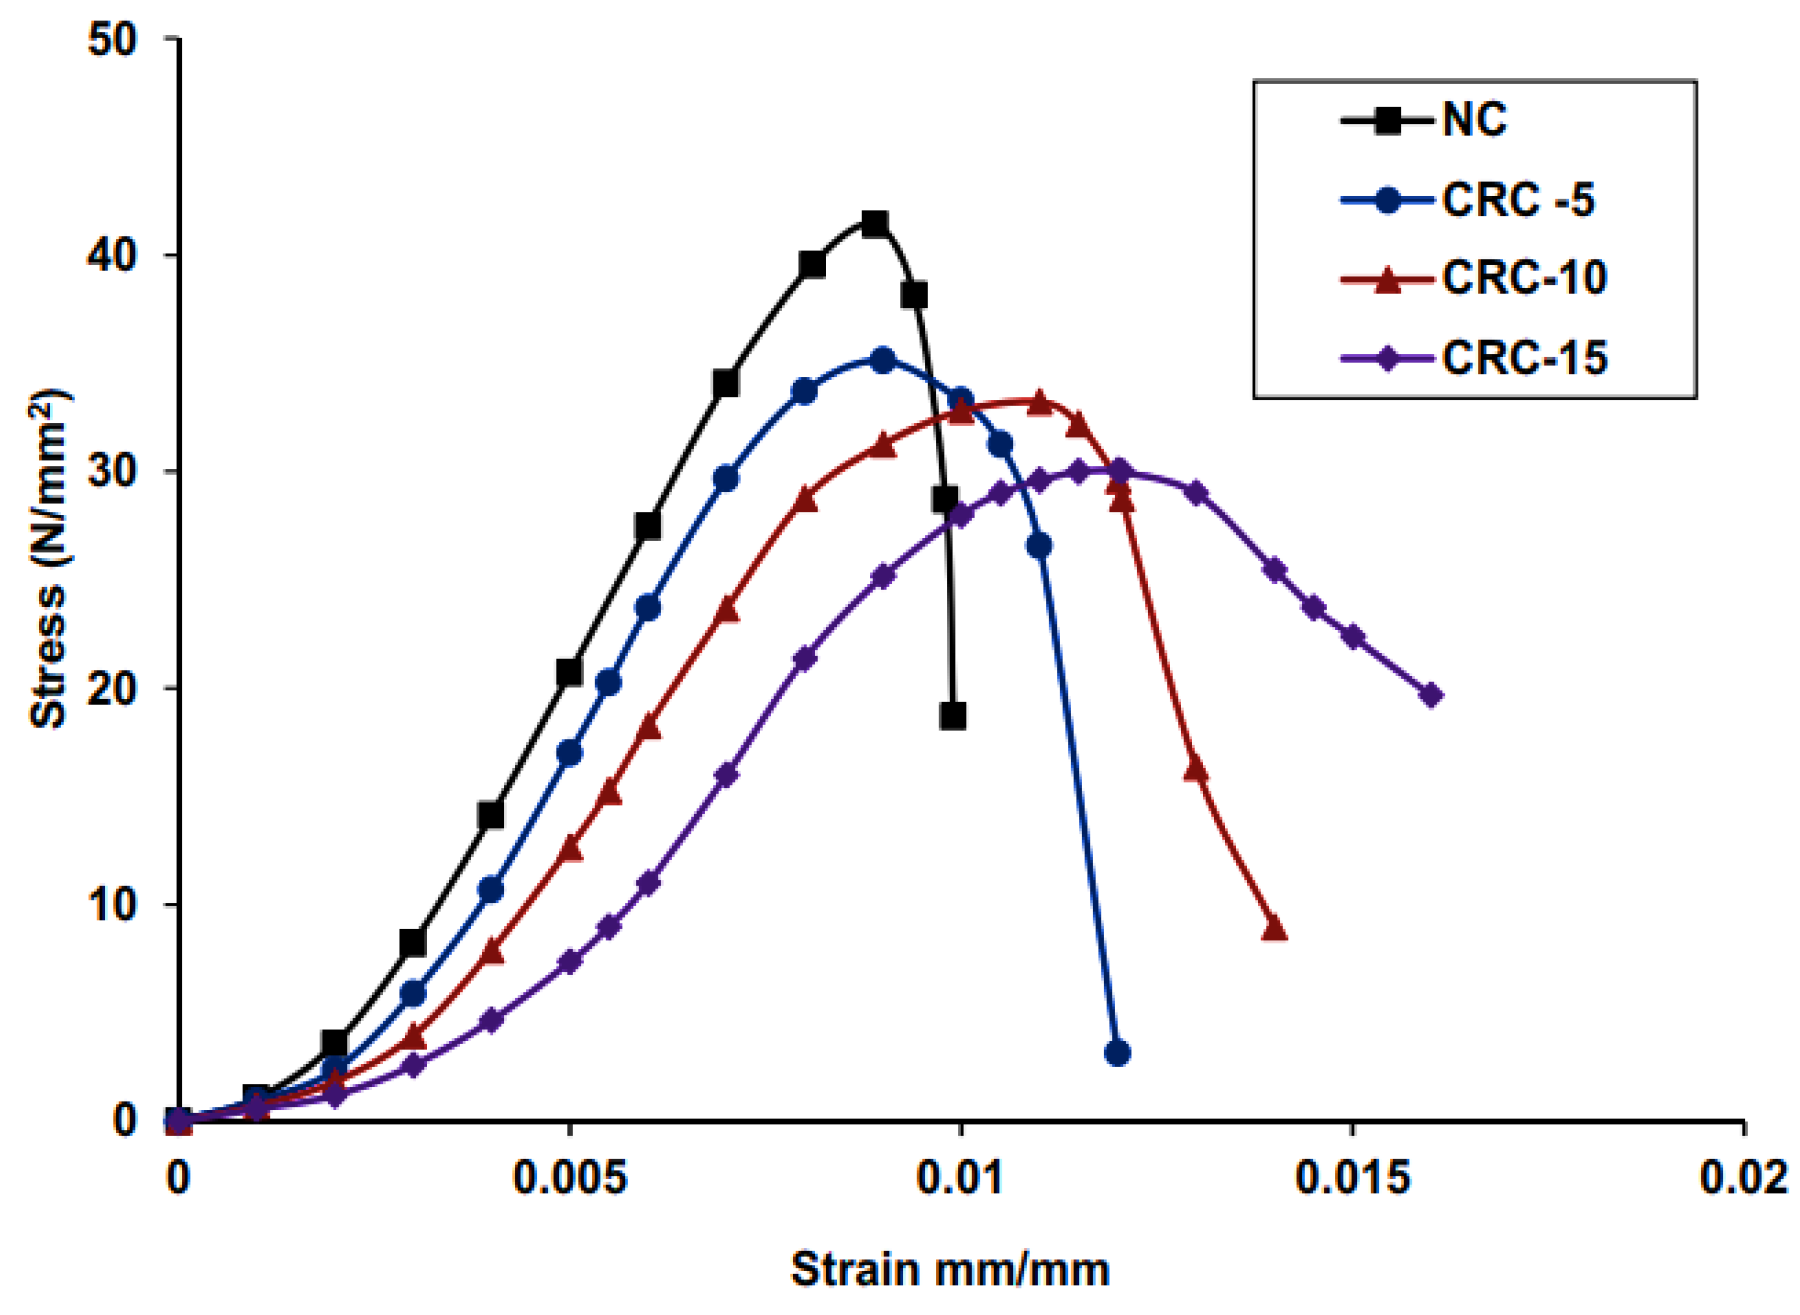
Mendis et al. (Mendis et al., 2017) investigated the performance of similar strengths concrete mixes with different rubber content, they reported that regardless of the amount of rubber in concrete at similar strength RBC specimens showed similar rate of strength development, splitting tensile strength, modulus of elasticity and rupture and stress-strain behavior. Furthermore, they concluded that existing design guidelines can provide a good estimation of rate of strength development, splitting tensile strength and modulus of elasticity, but cannot predict the modulus of rupture and post failure behavior. Thomas and Chandra Gupta (Thomas and Gupta, 2016) developed a high strength concrete (Figure 4), they concluded that although concrete faced an over 50% drop in compressive strength for 20% fine rubber content limiting the percentage to 12.5% can help in making a high strength RBC that exhibits a ductile failure. Other researchers (Su et al., 2015) performed experiments to study RBC mixes that included fine rubber particles with different size distributions, they concluded that the size of fine rubber has a negligible influence on both the compressive and tensile strengths of concrete. Noaman et al. (Noaman et al., 2016) mentioned that increasing fine rubber aggregate in concrete enhances strain capacities and changes its behavior from brittle to ductile. Moreover, it improves the absorption energy by increasing the area under stress–strain curve (Figure 5).

2.2.5. Analytical and Numerical Models in Predicting the Behavior of Rubberized Concrete

Previous studies (Bompa et al., 2017) and (Strukar et al., 2018) have developed some constitutive models for predicting the behavior of RBC. These models have showed better results in comparison to old models for normal concrete, since rubber aggregate changes the properties of concrete. In fact, (Bompa et al., 2017) proposed a prediction model for RBC with different rubber aggregate sizes and content, as part of their study, they compared their findings with other models and they concluded that the suggested expressions have provided a significant improvement to the existing ones available in the literature. Moreover, authors of (Strukar et al., 2018) conducted an experimental study and developed a constitutive prediction model for RBC. Their model has provided a good matching with the experimental results in comparison to the old equations. Other numerical models using regression and machine learning techniques were also investigated in the literature and showed considerable performance in accurately predicting the mechanical and dynamics properties (Habib and Yildirim 2021; Habib and Yildirim 2022a, b; Habib et al., 2023)

2.2.6. Durability of Rubberized Concrete

Water Permeability
In general, resistance against water permeability is reduced when recycled rubber aggregate are added to the concrete mix. This is attributed to the increased porosity of RBC due to elastic behavior under compaction effort and the lower specific gravity of rubber that floating the particles on the wet mix, however, when well graded rubber particles are incorporated the reduction is recovered partially (Su et al., 2015).
Water Absorption
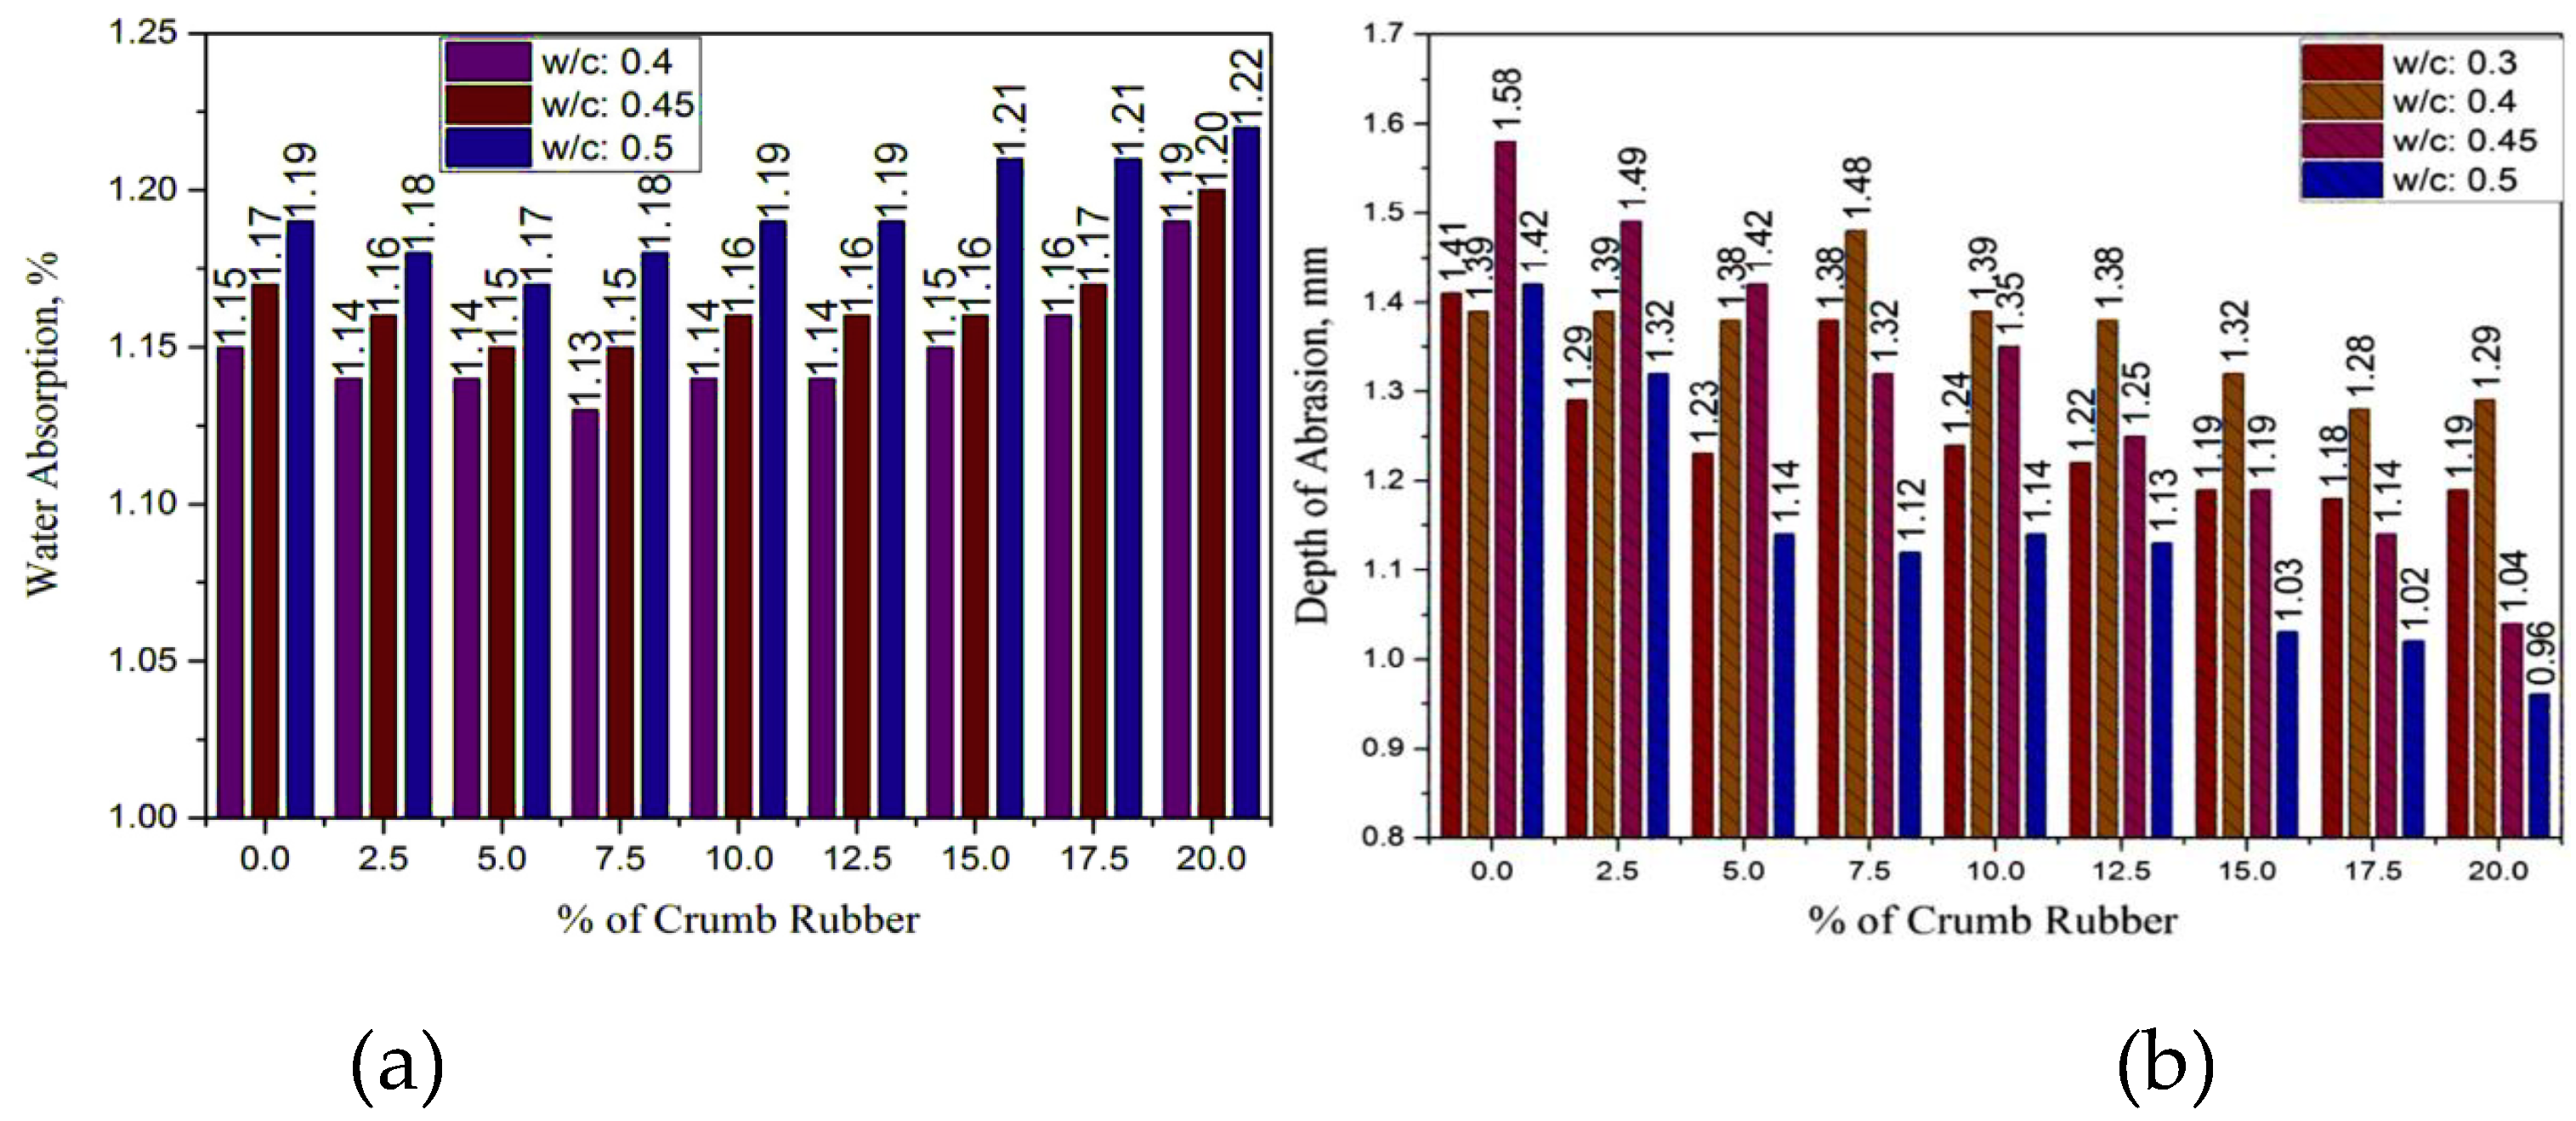
In fact, adding rubber aggregate to concrete reduces the resistance against water absorption as concluded by some research studies (Thomas et al., 2014; Thomas et al., 2015; Thomas and Gupta 2016), this is caused by the non-polarity effect that traps water bubbles at the interfaces. However, decreasing the rubber particle size fills the voids in the mix and decreasing the absorption (Sukontasukkul and Tiamlom, 2012). Although both studies (Thomas and Gupta 2016; Thomas and Gupta 2015) (Figure 6a) reported a fluctuation in the water absorption as the percentage of rubber is increasing in the mix up to 12.5% they concluded that over 12.5% replacement by volume the absorption started to increase as the amount of rubber aggregate is increasing.
Abrasion Resistance
Thomas et al. (Thomas and Gupta 2016; Thomas et al., 2014) investigated the abrasion resistance of high and normal strength concrete mixes respectively where well graded fine tire rubber particles were used as a replacement of natural river sand. Both reported that the abrasion resistance is enhanced when rubber is incorporated in the concrete mix. Furthermore, Thomas et al. (Thomas et al., 2016) conducted an abrasion test (Figure 6b) and developed a mathematics relation between depth of abrasion and rubber replacement ratio. Based on the analysis he concluded that rubber content has a linear positive effect on the abrasion resistance of concrete. These studies recommended the use of RBC in pavements and structures due to its enhanced resistance compared to normal concrete in situations where deterioration is imposed on the surface by environmental forces. On the other hand, Bisht and Ramana (Bisht and Ramana, 2017) have provided contrary results in which the resistance to abrasion was reduced (but still under the allowable limits) when single-graded rubber particles of 0.6mm size were used as a replacement of fine aggregate and this was attributed to the fact that rubber aggregates tend to move toward the surface of the cube during vibration which at the end resulted in lowering the strength of the concrete surface and reducing the abrasion resistance.
Freezing–Thawing Resistance
In general, adding fine rubber particles to concrete (up to 25%) improves the resistance against freeze-thaw and pre-treating it with sodium hydroxide (NaOH) enhance this property significantly due to the higher bonding strength between NaOH pre-treated aggregates and cement paste which reduce the loss of mass under freeze-thaw deterioration (Si et al., 2017). Furthermore, it was found that increasing the fineness of rubber aggregate enhances the freeze–thaw resistance when the particles size is less than 60 mesh, in contrast, for particles size that exceeds 60 mesh high fineness of rubber causes a reduction in the resistance against freeze–thaw (Zhu et al., 2012).
Shrinkage
The shrinkage behavior of rubberized concrete was investigated before as mentioned by Elzokra et al. (2020). Yung et al. (Yung et al., 2013) concluded in their study on the durability properties of self-compacted concrete including rubber powder that the shrinkage in RBC is small but larger than the control one, furthermore, the increase in shrinkage is directly proportional to the amount of rubber. Similar findings were mentioned by Bravo et al. (Bravo and Brito, 2012). Moreover, Sukontasukkul (Sukontasukkul and Tiamlom, 2012) concluded that the shrinkage is also affected by the size of the recycled aggregate where small particles exhibits higher shrinkage than the big one which was attributed to the smaller elastic modulus caused by the spring-like particle shape of the small rubber particles which allows the specimen to exhibit higher deformation.
Carbonation Resistance
In fact, an acceptable resistance to carbonation was obtained for RBC with well graded fine tire rubber replacements up 12.5% (Thomas and Gupta, 2015). However, when coarse rubber particles are added to the mix resistance is significantly affected (Bravo and Brito, 2012).
Electrical Resistance
In general, RBC shows a better electrical resistance in comparison to normal one in which the resistance is being increased as the content of rubber is increasing and the particle size is decreasing (Yung et al., 2013).

Dynamic Behavior of Rubberized Concrete

It is important for structures exposed to vibration waves to have enough damping capacity in order to ensure both life safety and comfortability of residences in their homes. Thus, structures designed against earthquake excitations, and floors where noise is expected to be generated from neighbors represent potential applications for this material (Habib et al., 2020). (Xue and Shinozuka, 2013) studied the potential of using RBC in structural elements aiming to improve its dynamic behavior. Both free vibration test and shaking table test were done on columns constructed from concrete with 6 mm rubber particles that replaced 15% of the coarse aggregate. It was concluded that using rubber in concrete mixes increases the damping ration by 62% compared to normal control samples. Gintautas et al. (Gintautas et al., 2009) measured the effect of tire rubber aggregate on damping behavior of concrete. Singly graded rubber aggregate replaced 20% of the fine aggregate, it was concluded that damping decrement of concrete increased by 37.5% which as mentioned allows this material to be used for noise insolation of buildings, foundations and industrial floors.
Rubberized Concrete Properties-Improvement Techniques
Many methods for improving the engineering characteristics of RBC have been introduced to the literature including rubber pre-treatment with NaOH solution (Raghavan et al., 1998; Segre et al., 2002; Albano et al., 2005; Chou et al., 2007; Tian et al., 2011; Youssf et al., 2014; Youssf et al., 2016), addition of silica fume and steel fiber (Youssf et al., 2014; Noaman et al., 2015; Youssf et al., 2016; Wang et al., 2018), and limestone powder pre-coating (Onuaguluchi and Panesar, 2014).
Pre-Treatment of Rubber Particles with NaOH
The aim of this action is mainly to improve the surface roughness of rubber aggregates and reduce the significant negative effect of the weak bond between rubber particle and cement paste. Segre et al. (Segre et al., 2002) performed an infrared experiment to study the modification achieved in rubber tire surface by soaking the rubber particles in NaOH solution for different periods of time. They reported a presence of zinc stearate on the rubber’s surface and indicated that this compound would be removed from the surface by NaOH treatment, which will cause a considerable change in the treated rubber leading to an enhanced adhesion in-between the recycled material and the cement paste. Chou et al. (Chou et al., 2007) reported that modifying the surfaces of rubber by 10% NaOH solution decreases its negative effect on the hydration process by means of disturbing the water transfer which helps in recovering the reduction in the concrete strength. Youssf et al. (Youssf et al., 2014) concluded that treating rubber by 10% NaOH solution enhances concrete compressive strength by 6% and 15% at 7 and 28 days, respectively, in comparison to non-treated one. Youssf et al. (Youssf et al., 2016) tested the influence of NaOH pre-treatment duration on the characteristics of concrete, they concluded that a period of 30 minutes of treatment is the best for improving the strength of concrete and a long duration would lead to a negative impact due to high penetration of the NaOH solution into the rubber. On the other hand, they recorded a reduction in the workability of concrete when the recycled aggregates are treated using NaOH solution in comparison to the untreated ones, this is due to the rough surface of the pre-treated material that results in relatively slower movement in the fresh concrete which lead to slump reduction.
Using Mineral Additives
The aim of incorporating silica fume in RBC is to create a dense packing and to fill cement matrix pores Thomas et al. (Thomas and Gupta, 2016). Xie et al. (Xie et al., 2019) found that compressive strength is significantly recovered when 10% silica fume are added to the mix even for 20% rubber content. AbdelAleem et al. (AbdelAleem and Hassan, 2018) concluded that by adding silica fume to concrete it is possible to develop a self-compacted RBC with enhanced fresh properties and compressive strength when up to 25% rubber content in incorporated in the concrete mix. Ramdani et al. (Ramdani et al., 2019) test the effect of replacing 15% of the cement by glass power on the compressive strength of concrete, and they verified a lower strength at 7 days in RBC with glass power in comparison to RBC this was due to the slower rate of hydration the glass powder mixes than the normal mixes which have higher cement content, however, the results of 28 days strength was higher in the glass powder mix RBC than those of non-glass powder one. Furthermore, adding both rubber particles and glass powder to concrete increase its ductility by slowing the elastic and plastic deformation of the specimens.
Other Techniques
Wang et al. (Wang et al., 2018) reported an improvement in the failure mode of concrete accompanied with significant increase in the compressive and splitting tensile strengths when steel fiber and nanosilica are incorporated in the mix. Onuaguluchi et al. (Onuaguluchi and Panesar, 2014) found a considerable enhancement in the compressive and tensile strengths when the rubber aggregate is pre-coated with limestone powder together and silica fume is added to concrete mix. Youssf et al. (Youssf et al., 2014) concluded that confining RBC with FRP layers significantly increase the compressive strength of concrete. Chen et al. (Chen et al., 2019) concluded that premixing rubber with binder paste increases their bonding strength due to the large interface area between rubber aggregate and binder paste. Bisht and Ramana (Bisht and Ramana, 2017) confirmed that using Portland Pozzolana cement in RBC provide a better strength in compression and tension using ordinary Portland cement.

2.2.7. Structural Performance of Rubberized Concrete

Behavior of Rubberized Concrete Columns
Youssf et al. (Youssf et al., 2015) performed a seismic loading test on reinforced RBC column with 20% finer rubber particles. Although compressive strength of RBC was 28% less than the normal one, the results of the seismic loading test showed that RBC column sustained almost 98.6% of the lateral load of normal column. Furthermore, RBC column hit an ultimate drift of 91.5% of that by the normal one. These results mean that rubber aggregate can be added to concrete column without any considerable influence on its maximum lateral strength and deformability although the concrete has less compressive strength capacity. Moreover, due to its enhanced ductility RBC can delay spalling of concrete cover and reduce the concrete cracks occurring under seismic loading in comparison with the conventional concrete. Youssf et al. (Youssf et al., 2016) conducted a reverse cyclic loading test on FRP- confined reinforced RBC column, they concluded that the overall behavior of these test specimens was very similar to conventional concrete. In addition, using fine rubber particles as the one used in their study have not got any significant effect on energy dissipation and viscous damping of concrete. Furthermore, confinement effectiveness of RBC specimens was more than that of the control one at the same confinement pressure which means that the required thickness of FRP to confine the RBC can be reduced. Pham, et al. (Pham, et al., 2018) performed an impact loading test on RBC column with and without FRP confinement. In general, the test results showed that RBC specimens are more ductile than the reference ones and considerably decrease the peak impact force (27%–40%). In addition, they provide a higher impact energy absorption compared to conventional column where specimens with 15% and 30% rubber found to absorb 58% and 63% more impact energy than the reference columns, respectively. Habib et al. (2021a) has investigated the seismic behavior of reinforced concrete columns retrofitted using rubberized concrete jackets and reported improved damping behavior under strong seismic excitations.
Behavior of Rubberized Concrete Beams
Mendis et al. (Mendis et al., 2017) conducted an experimental investigation on the flexural behavior of RBC beams. It was found that regardless of replacing rubber by natural aggregate in concrete, rubberized beams showed a very close ultimate flexural capacity, cracking moments, load-deflection behavior and peak deflection to those made of conventional concrete with similar strength. Hassanli et al. (Hassanli et al., 2017) mentioned in their study on the behavior of beams constructed from concrete with different rubber replacement percentages that the maximum compressive strain and deflection capacities increase with the increase of rubber content. Furthermore, they suggested to use this type of concrete in flexural members where ductile behavior is governing since the drop in the flexural capacity due to adding rubber particles is not as high as the decrease in compression capacity. Ismail et al. (Ismail and Hassan, 2017) investigated the shear behavior of RBC beams constructed without shear reinforcement, it was found that members with rubber content in the range of 5% to 35% and steel fiber up to 0.35% exhibited a shear failure mode close to the zero-rubber member but with smaller crack widths. Moreover, it was clear that adding 1% steel fiber decreased the widths of the crack and changed the failure mode from shear to shear-flexure failure for 60-mm fibers or to flexure failure in the case 35-mm fibers. Mendis (Mendis et al., 2018) studied the effects of rubber content on the flexural shear behavior of beams with similar compressive strength, they observed that there is a variation of 10–15% in flexural shear capacities with the amount of rubber being changed which means that shear capacity is affected by that the rubber content of the concrete mix. On the other hand, similar tension stiffness was obtained in each specimen regardless of the rubber content and stirrups availability. Using ACI 318 guideline was confirmed to provide a safe prediction for the flexural behavior (Mendis et al., 2017) and shear strength (Ismail and Hassan, 2017) of RBC beam with a lower shear capacity than the predicted rising the need for modifying the available design guidelines (Mendis et al., 2018).
Behavior of Rubberized Concrete Slabs
Li (Li et al., 2018) conducted an experimental investigation together with a FEA to study the effect of rubber aggregate on the behavior of RC slabs. It was found that regardless of the high reduction in compressive strength when rubber particles are added, slabs with RBC showed a similar bending moment capacity to that of conventional concrete accompanied with higher ductility with enhanced maximum deflection, smaller cracks and uniform crack distribution at failure. Mohammed (Mohammed 2010) tested the effects of using steel sheets with RBC since it is lighter in weight and more ductile than conventional concrete. It was concluded that the ultimate failure loads of RBC slabs with shorter shear span were very close to that of normal concrete slab, however, in the case of longer shear span the control slab had the highest failure load. In addition, RBC slabs reached higher stain at failure than the control one that did not even develop a full strain capacity (0.003-0.0035).

2.2.8. Finite Element Modeling of Rubberized Concrete

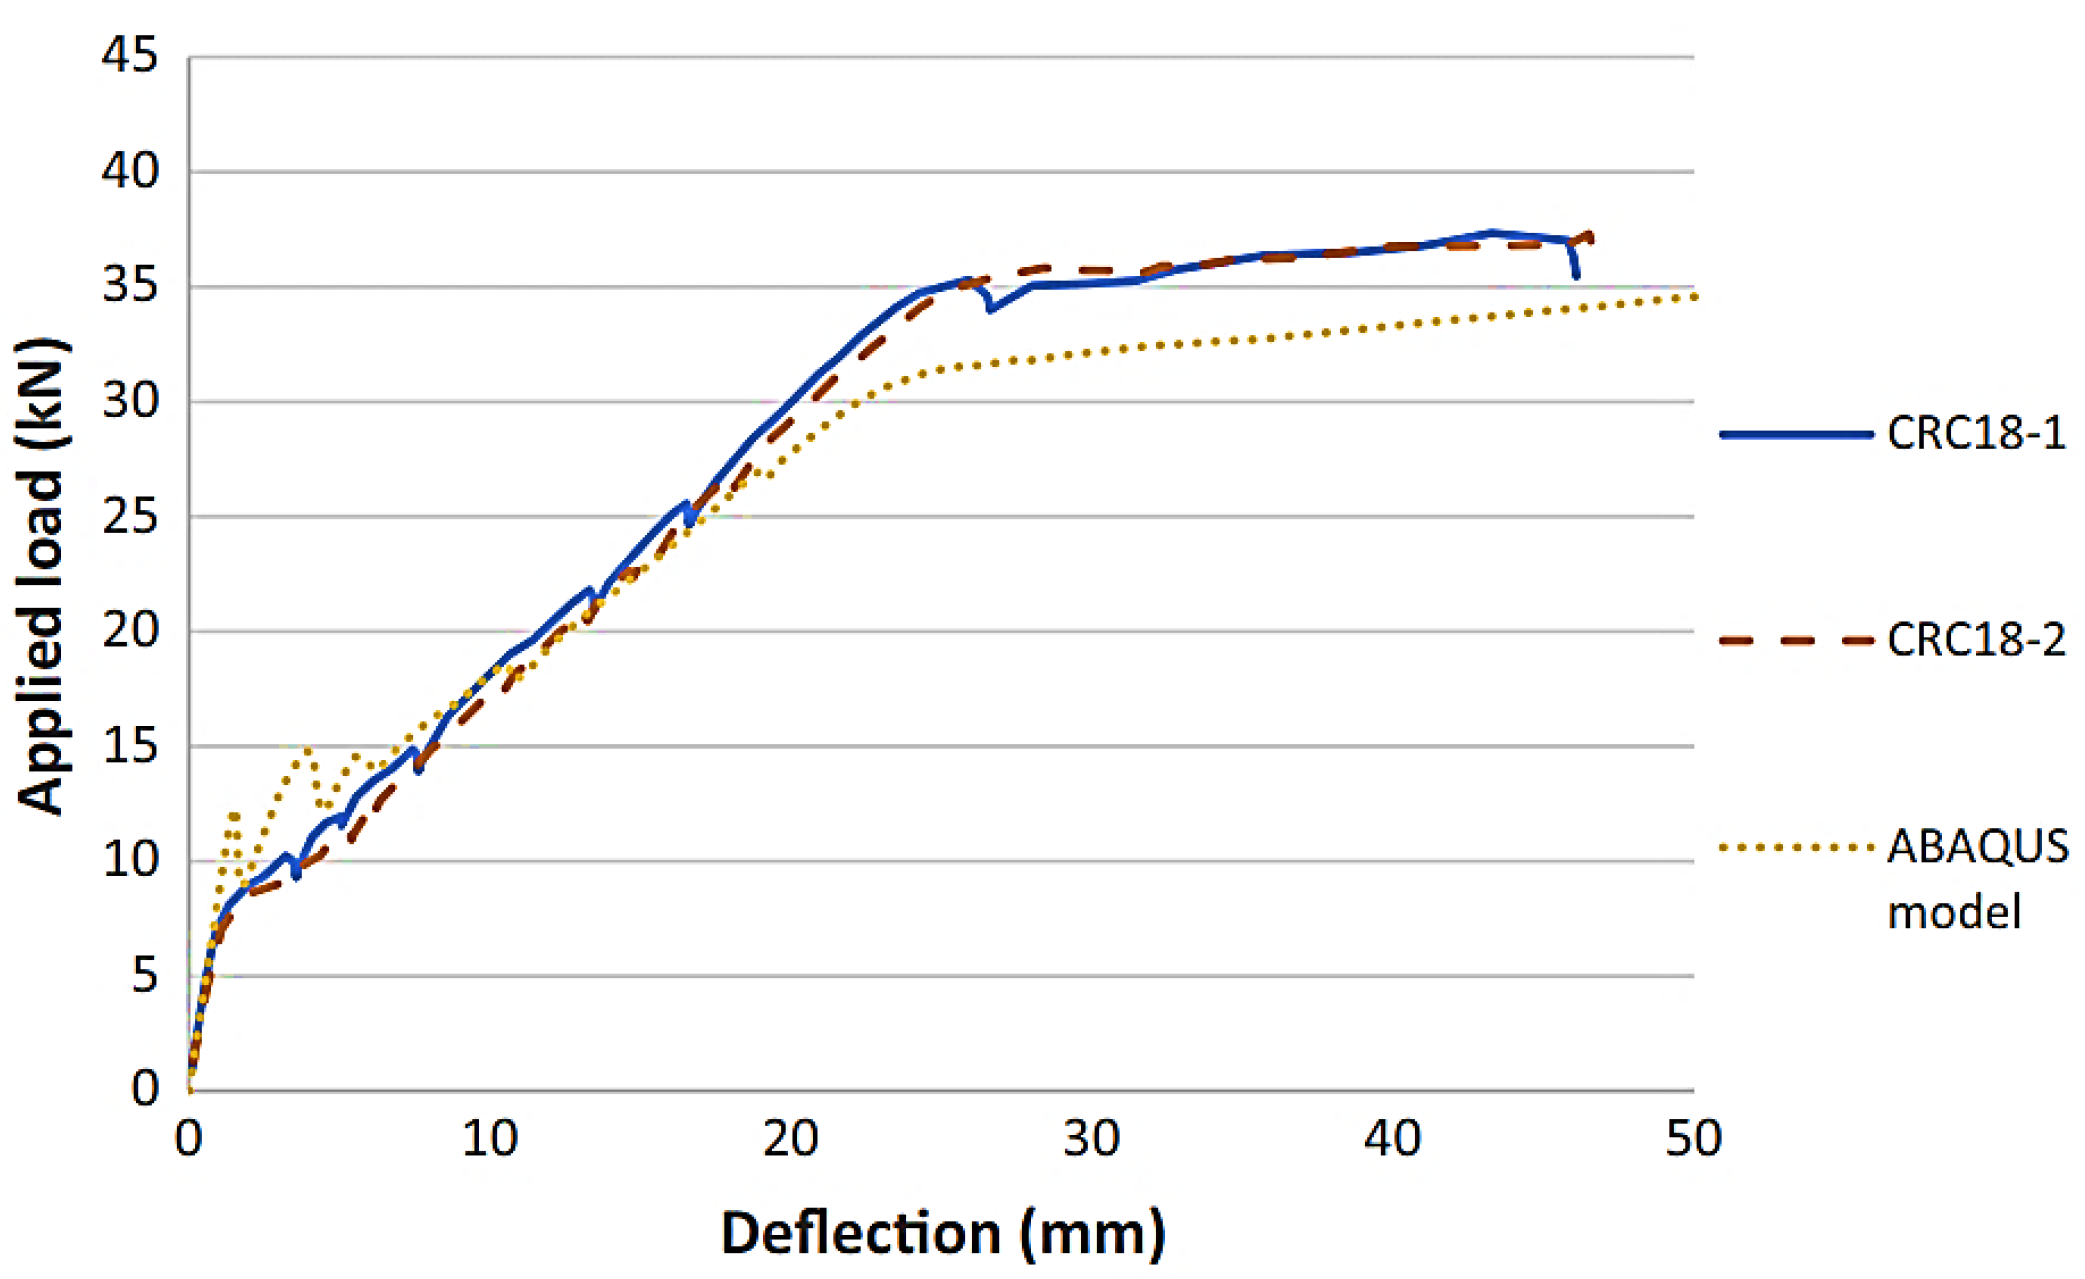
Finite element is a very commonly used appraoch for accurate stress analysis of materials and structures (Habib et al., 2021b). Li (Li et al., 2018) constructed finite element model using ABAQUS to simulate reinforced RBC slabs. RIKS solution method was followed in ABAQUS to get the load-deflection curve through a nonlinear displacement control. 3D solid element was used to model concrete with approximately 20 mm meshing, furthermore, cohesive elements of thickness 0.1 mm were used to model the bond-slip relationships between RBC and steel bars. In general, although the finite element model provided a higher irregularity than the test results the load deflection curve (Figure 7) showed a behavior similar to that observed from the experimental works. In addition, Hassanli et al. (Hassanlie et al., 2017) concluded that it is possible to accurately simulate the behavior of RBC in a finite element model. This conclusion was also derived by Anmeeganathan (Anmeeganathan et al., 2018) which means that using finite element modelling is a reliable way for predicating the behavior of RBC member.

2.3. Estimating the Dynamic Parameters of Concrete Specimens

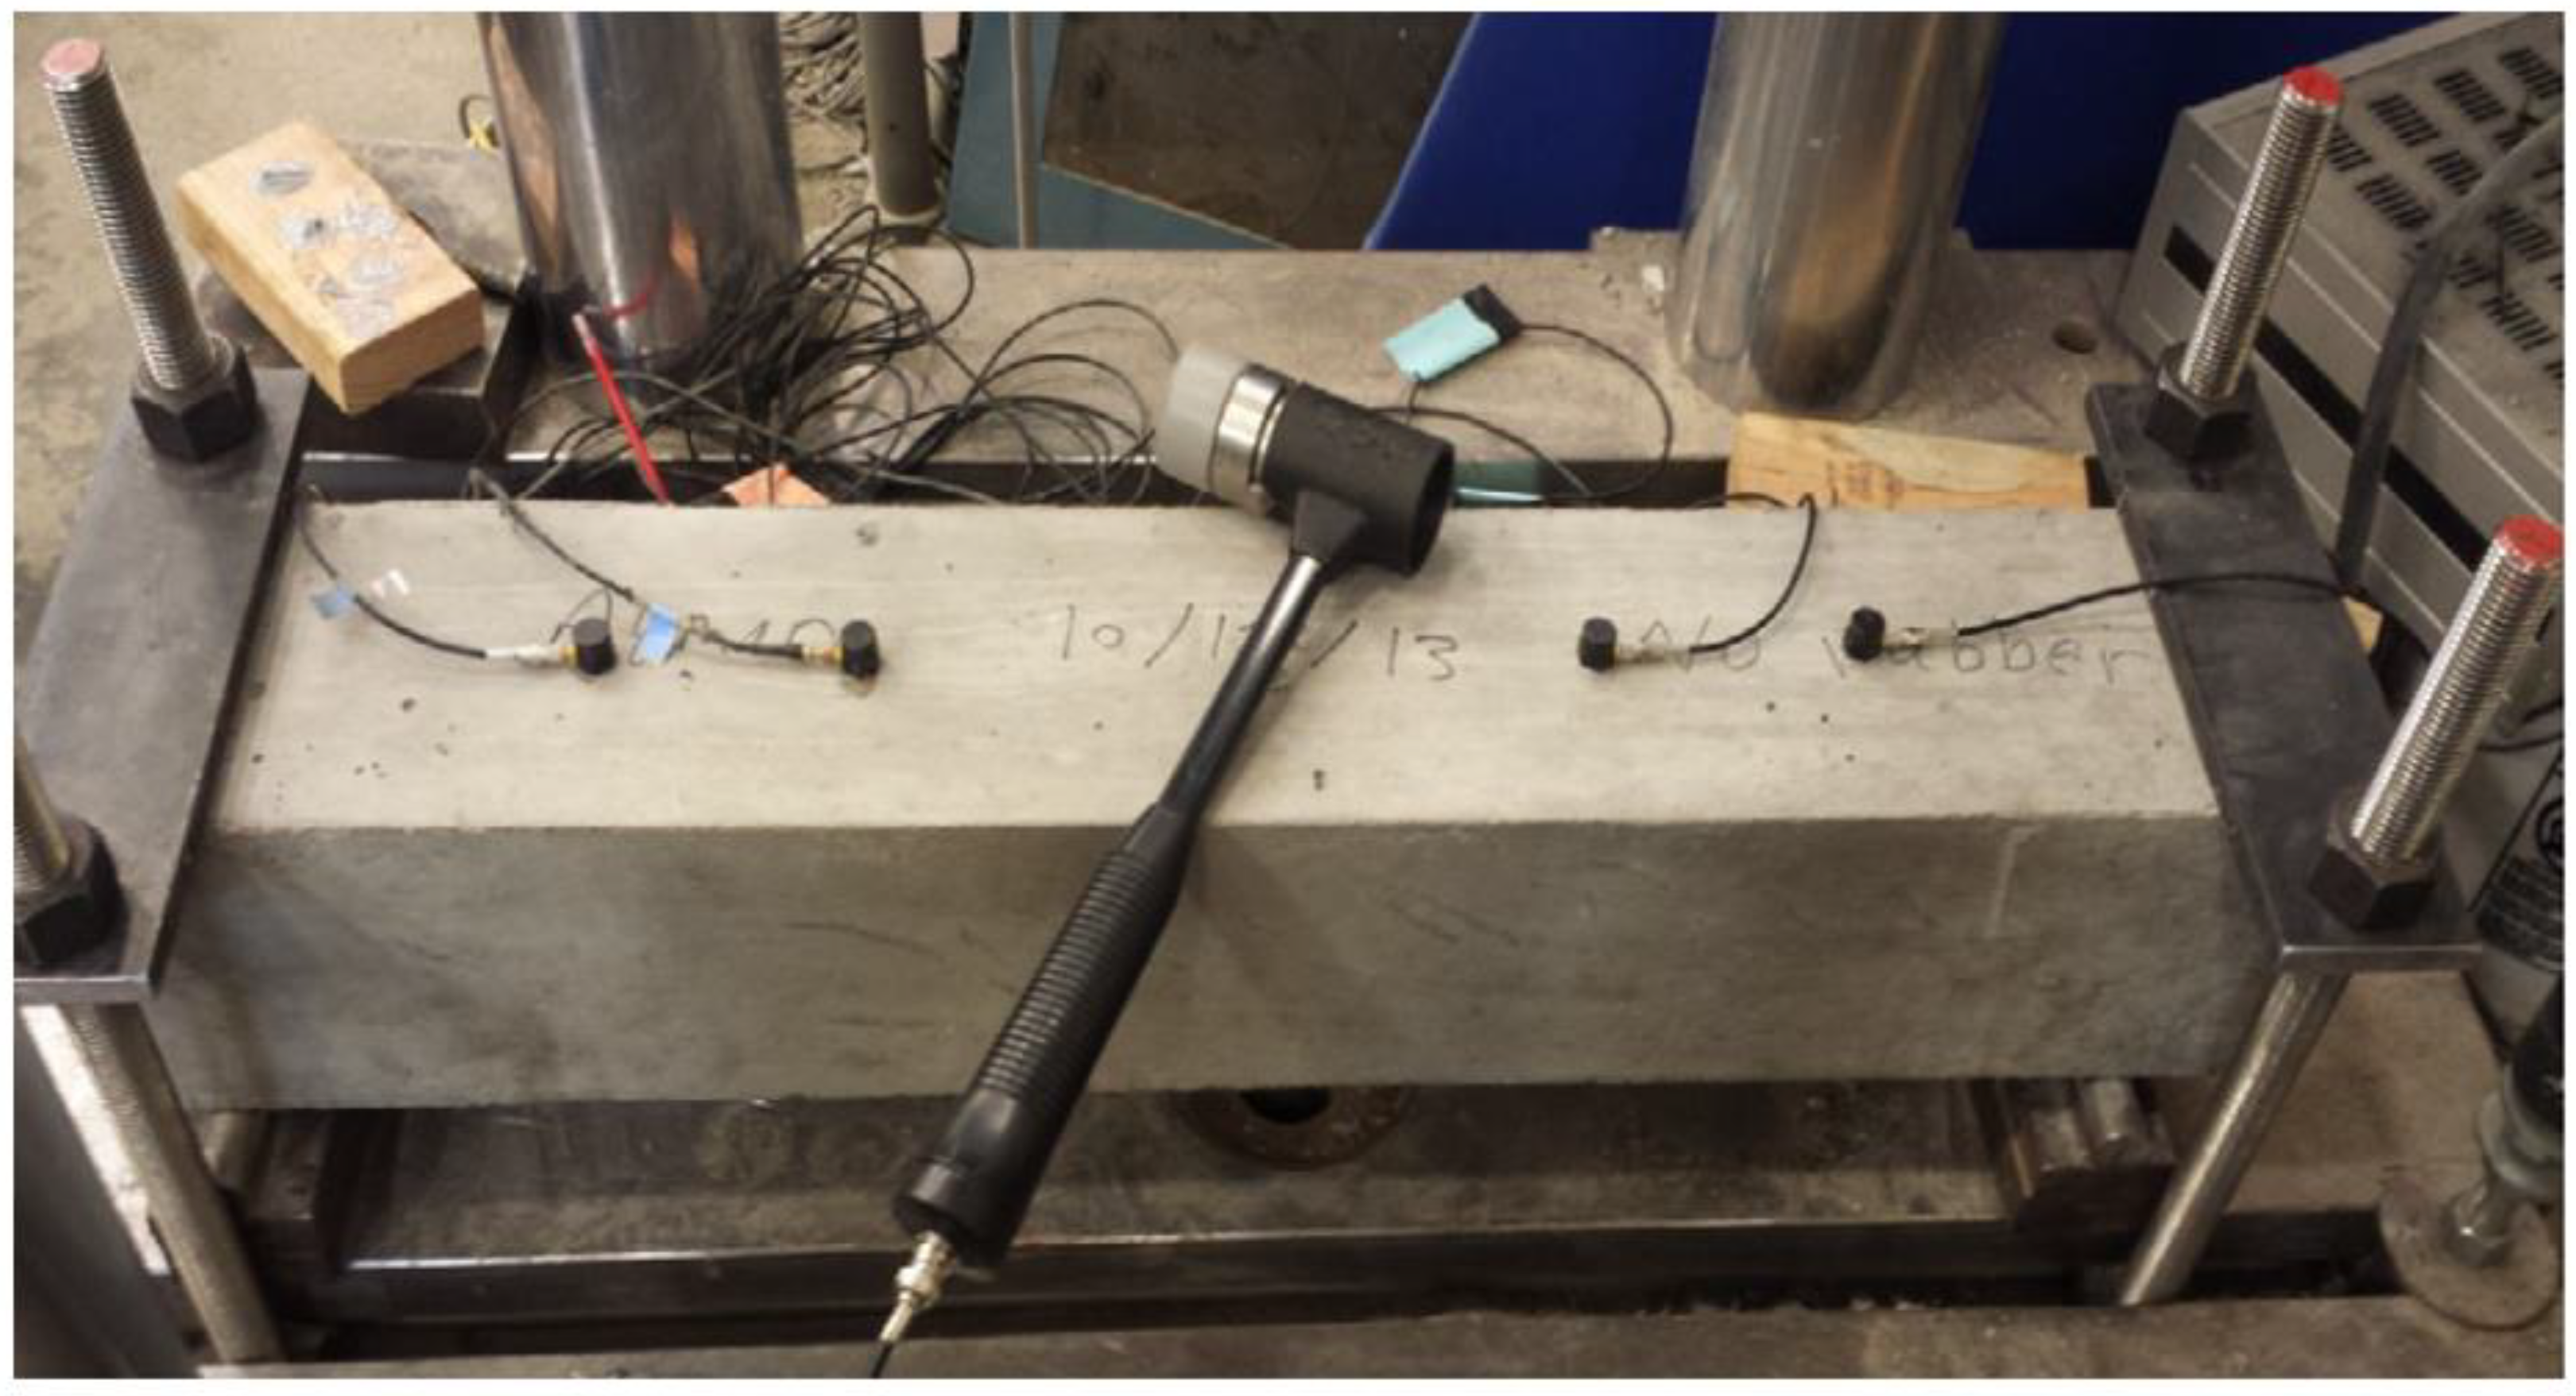
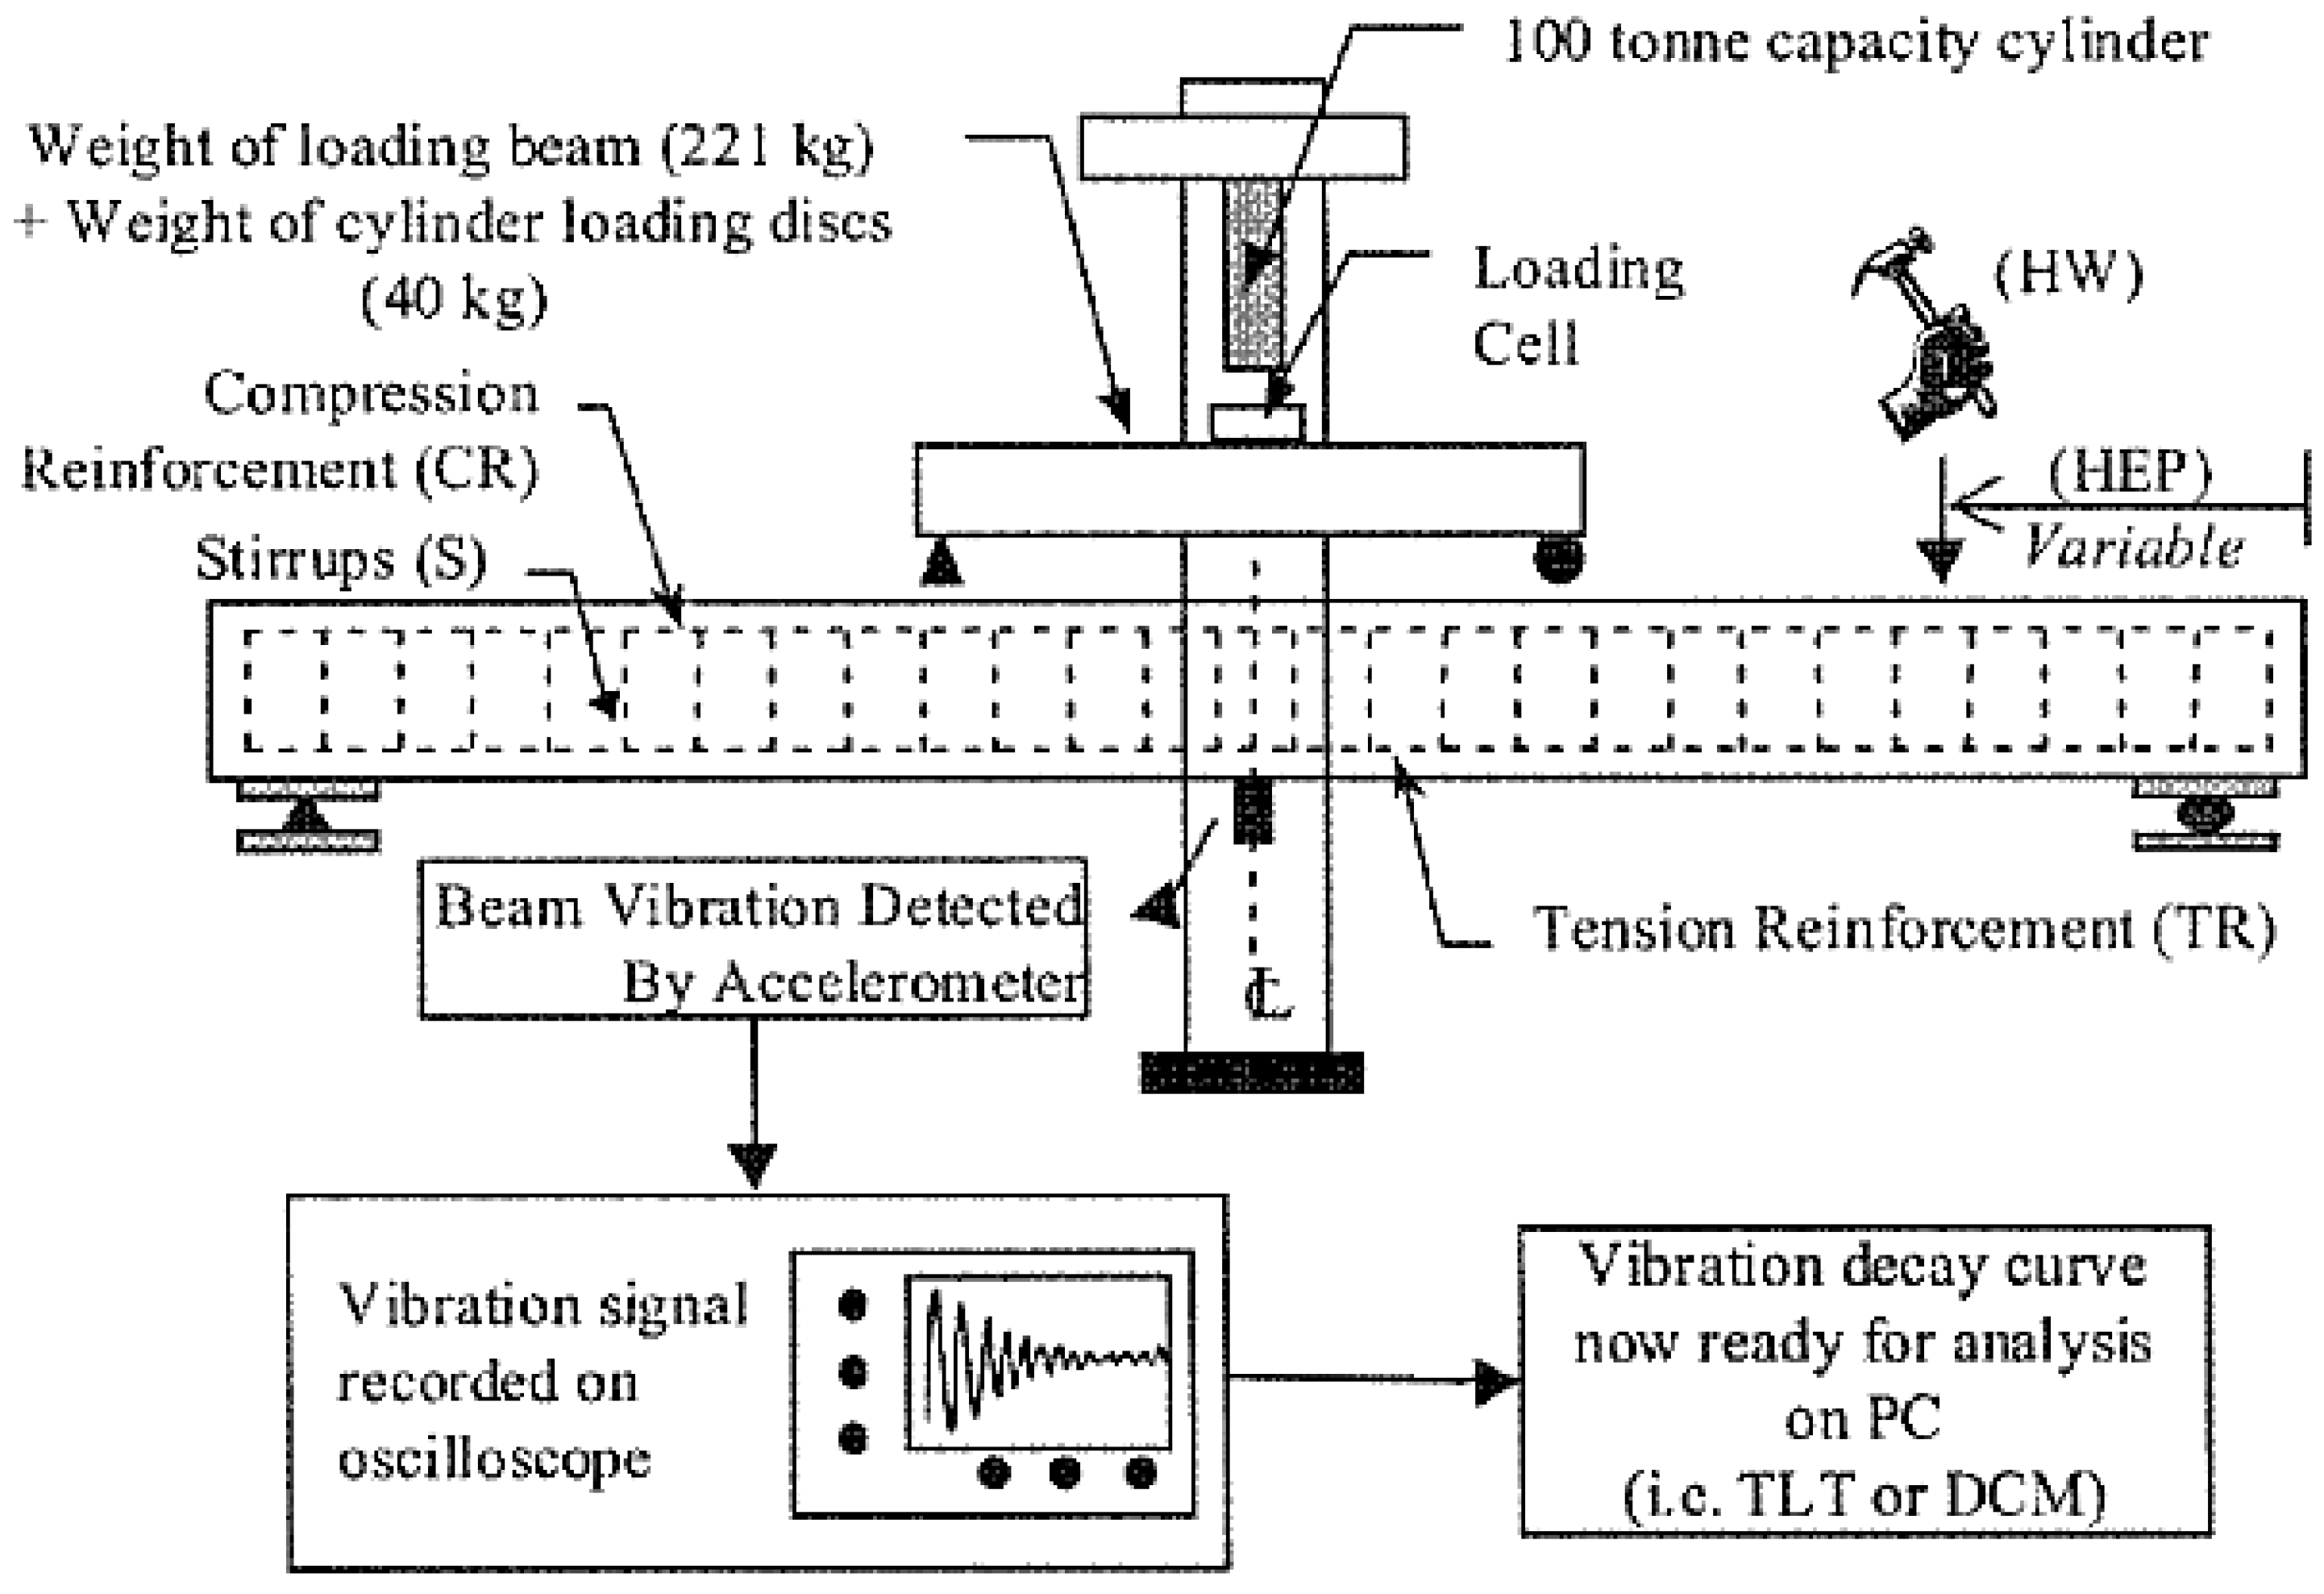
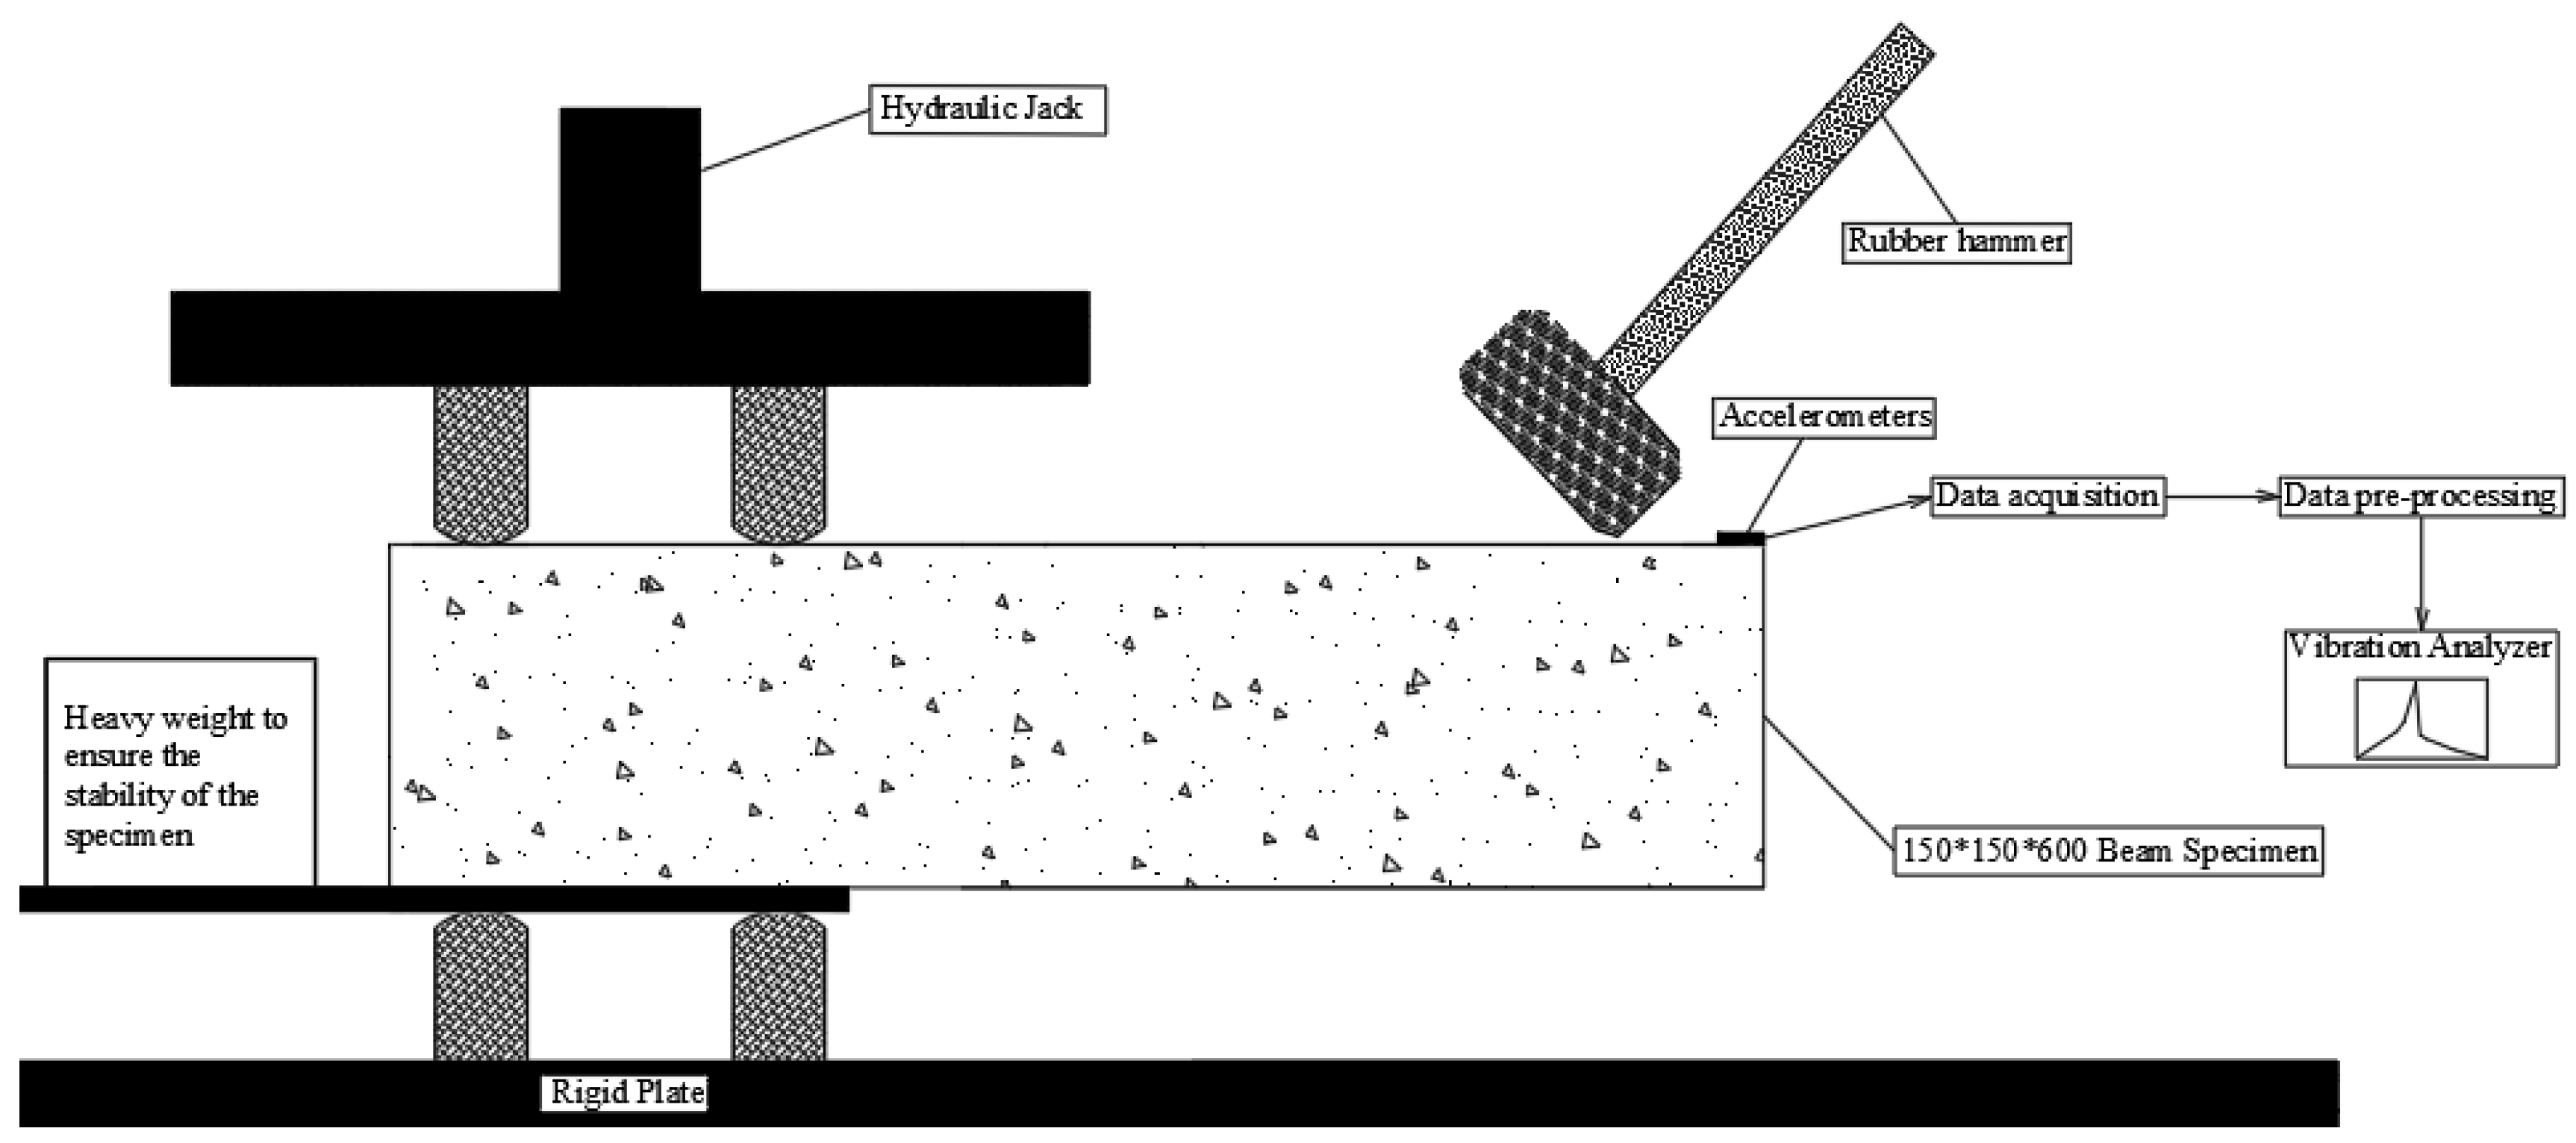
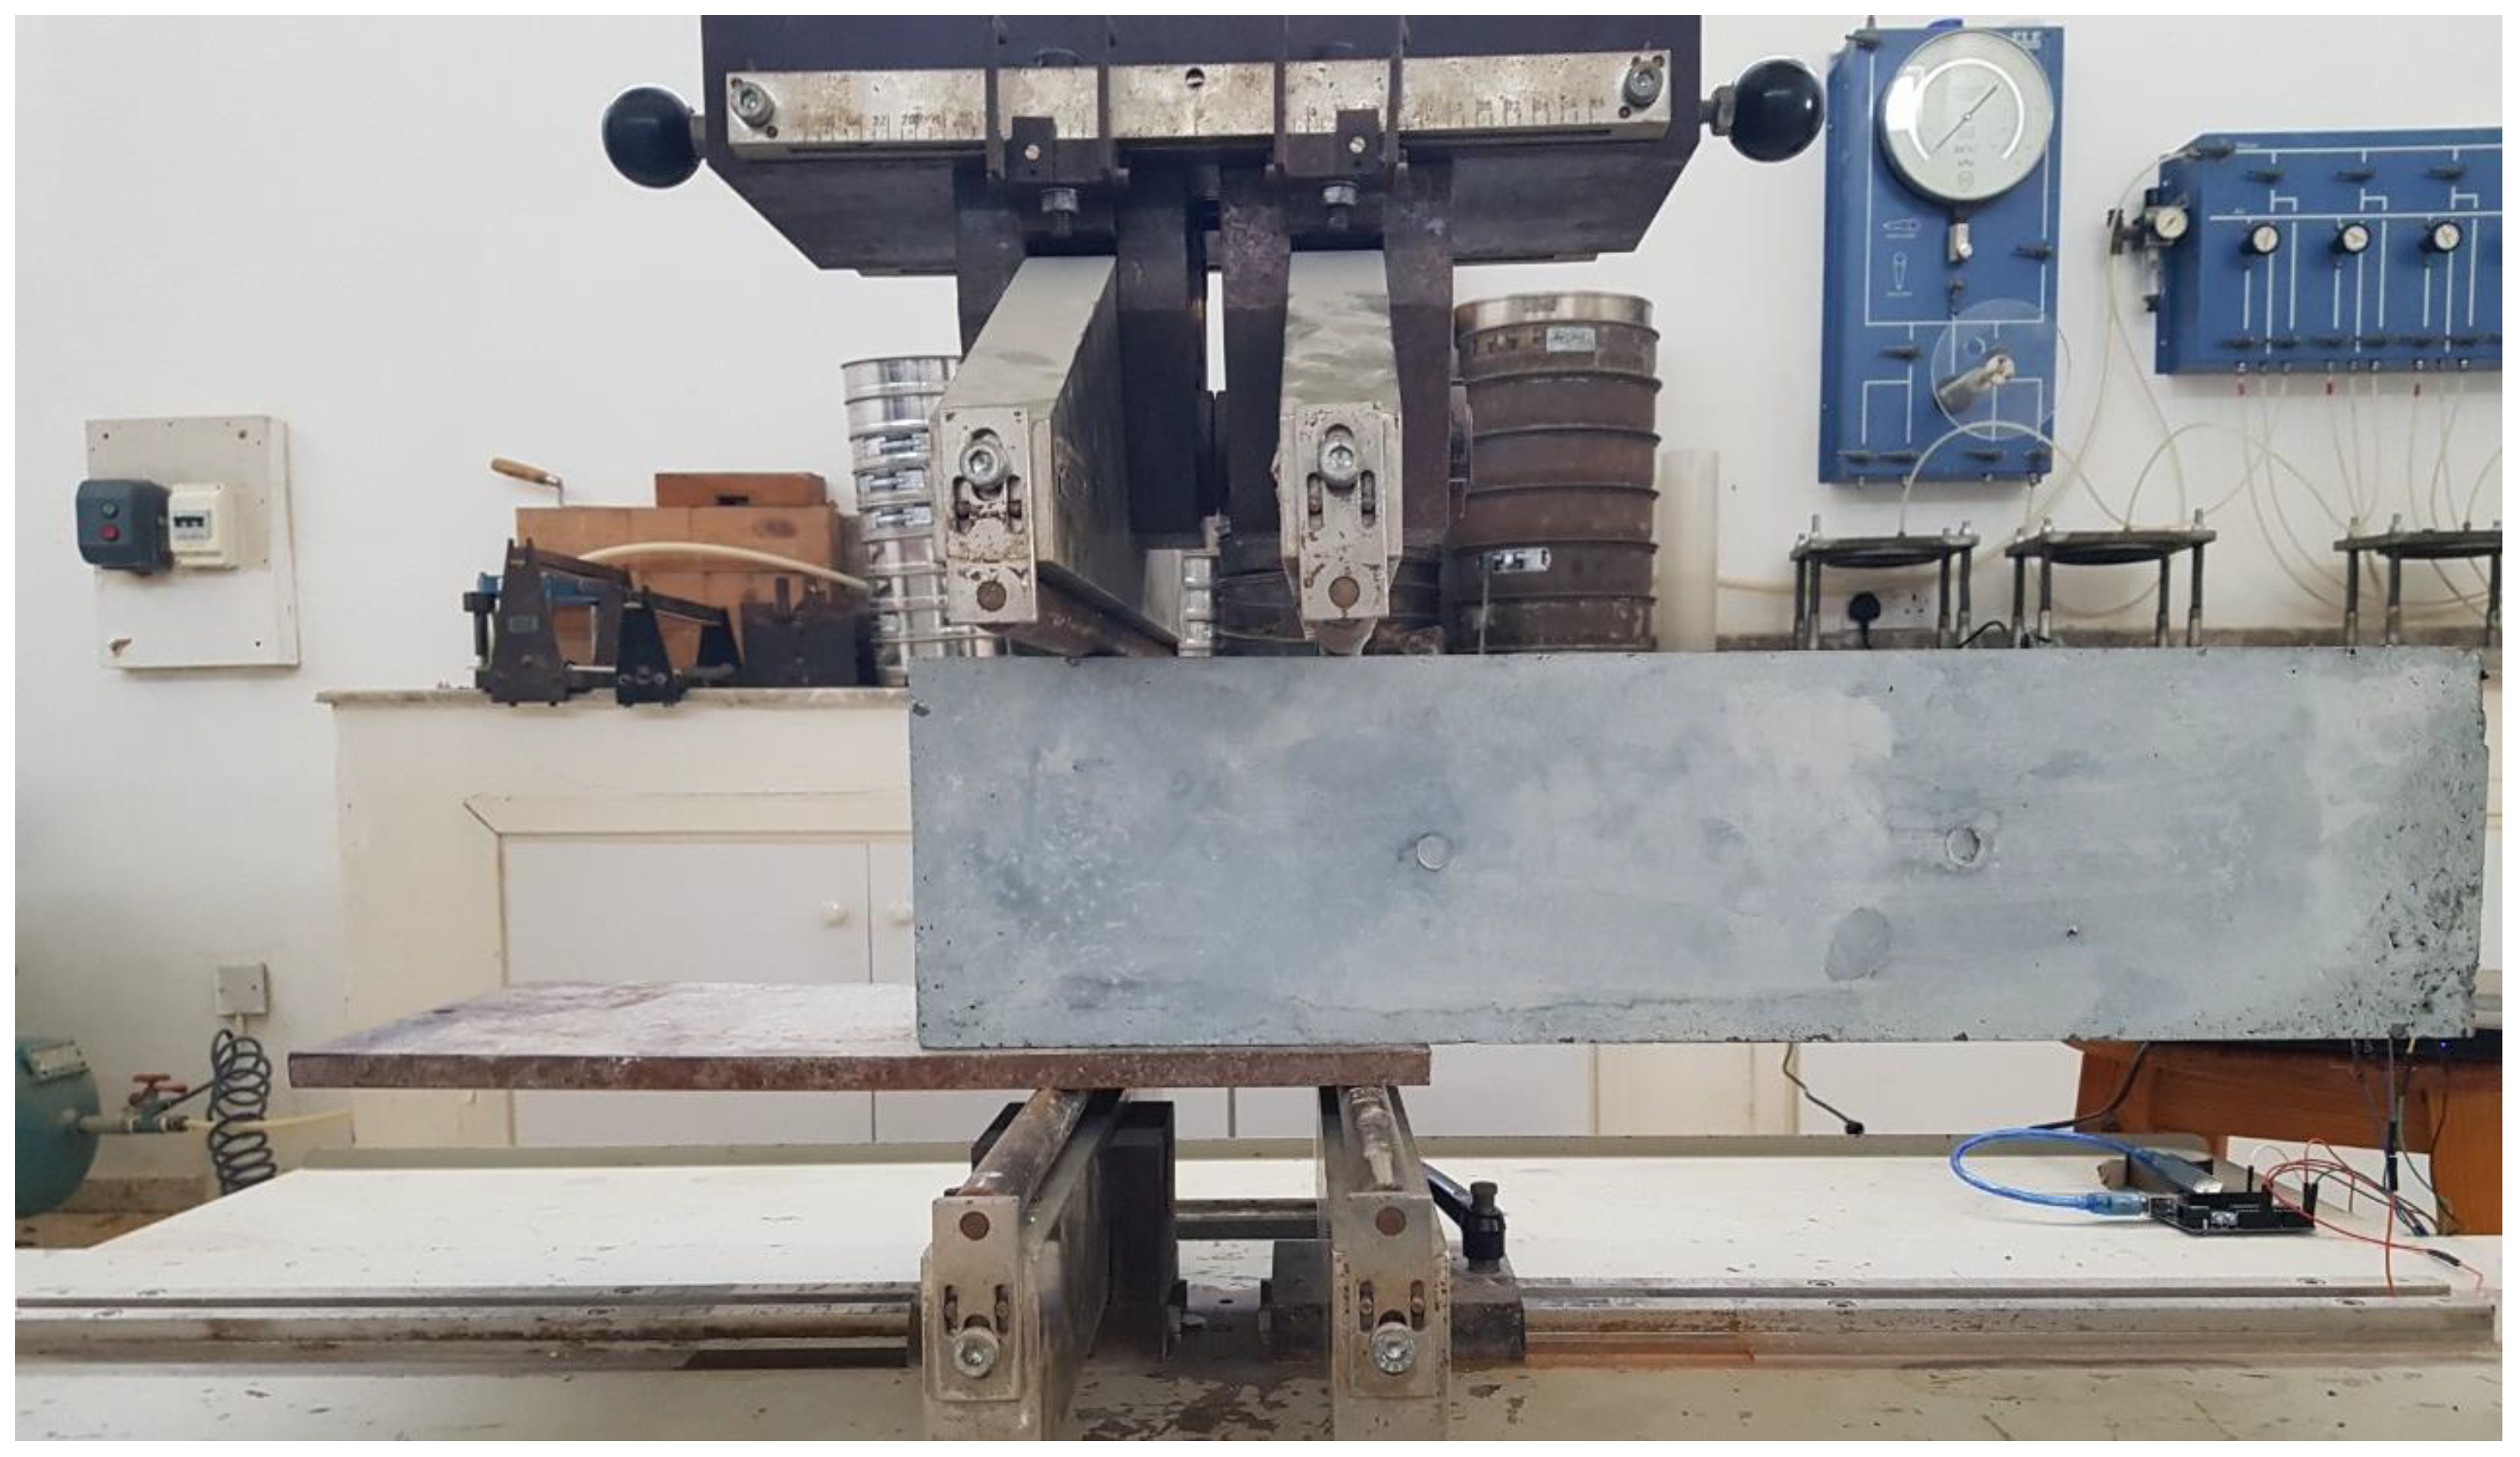
Previous studies were performed to assess the vibration performance of concrete including damping ratio, natural frequency and dynamic modulus of elasticity (Zheng et al., 2015). Available papers presented two main setups for conducting this test. The first one was by the simply supported beams setup used by both (Zheng et al., 2015; Moustafa et al., 2015) in Figure 8. The second one was adopted from the flexural strength testing machine as suggested by (Salzmann et al. 2003) in Figure 9.
In fact, both setups provides a good bases for measuring the vibration properties of concrete, while the first one is easy to be applied, the second one is possible to be used for large scaled beams mostly of reinforced ones as they needs more than two points of restrain to the beam that reduces the possibility of noise affecting the measured data.

2.4. Repair and Strengthening Using RC Jacketing: A Review

2.4.1. Introduction

Repairing of old structures is indeed one of the important activates in the construction industry (Ma et al., 2017). Nowadays, RC jacketing is considered one of the most commonly used techniques for structural repair and strengthening (Ong et al., 2004; Campione et al., 2014; Júlio et al.,2005; Júlio & Branco, 2008; Júlio et al., 2003; Júlio et al., 2004; Minafò, 2015). In general, it is a method of encasing an existing structural element (Woodson, 2009), mainly consisting of a concrete layer (jacket) reinforced with a longitudinal and transvers steels surrounding an old structural member (Campione et al.,2014; Minafò, 2015; Brena & Alcocer, 2009). With the ability of being applied to any columns cross-section (Brena & Alcocer, 2009) it is considered one of the good options to improve axial and bending strengths and stiffness of weak columns significantly (Júlio et al., 2005; Minafò, 2015). The benefits of this technique come from the enlargement of jacketed member cross section that provides higher load-carrying capacity and from the confinement pressure induced in the old element by the jacket that improves its behavior significantly (Minafò, 2015).

2.4.2. Terminologies

Repair
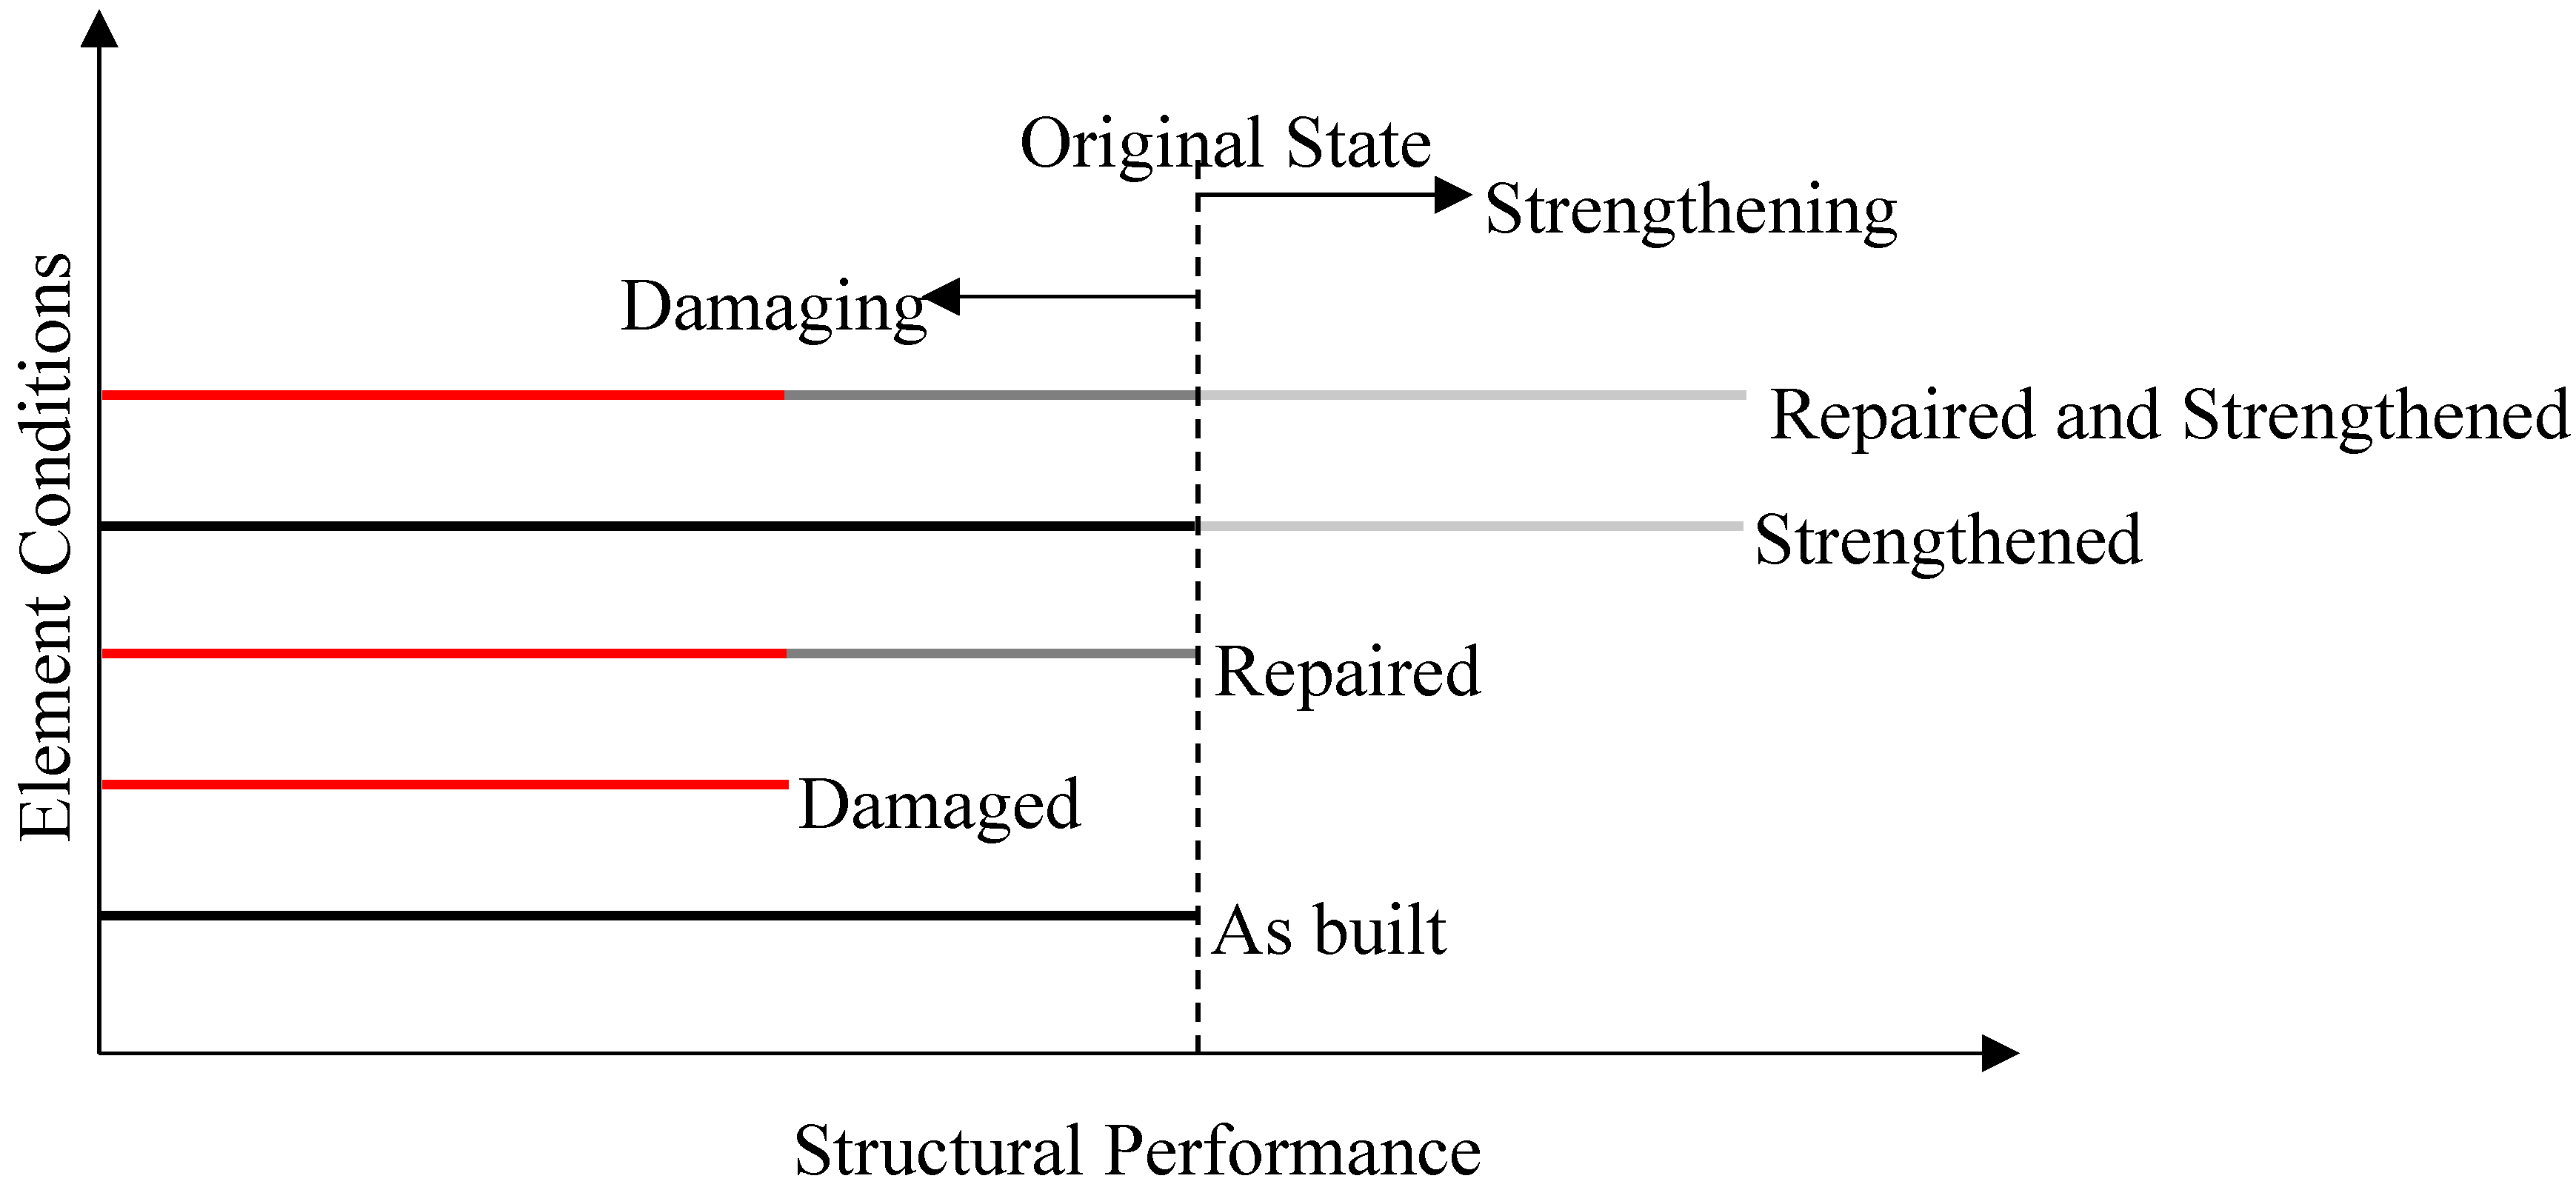
It refers to restoring original strength, stiffness, and ductility of damaged elements, Figure 10, the application of this process is considered as a local intervention (Penelis & Kappos, 1997). The need to apply this process arises on account of earthquakes, collisions, fire or explosions (Júlio et al.,2003).
Strengthening
It is the process of improving the original capacity of the structural element, Figure 10, when the current strength is insufficient to carry the future loads (Arya et al., 2014; Habib et al., 2020b). It is used in cases when design errors occur, changing the building functionality is required or development of more demanding code requirements (Rodrigues et al., 2018).
Repair and Strengthening
In some cases where an element is already damaged and / or deteriorated but enhancing the structural performance is required, Figure 10, the terms repair and strengthening need to be associated together which implies that the strengthening process is going to be preceded by the repairing operation (Júlio et al., 2003).

2.4.3. Types and Construction Procedure of Reinforced Concrete Jacketing

In fact, one of the advantages of this technique is its ease of apply which makes any company capable of handling this job (Júlio et al., 2003).
Types
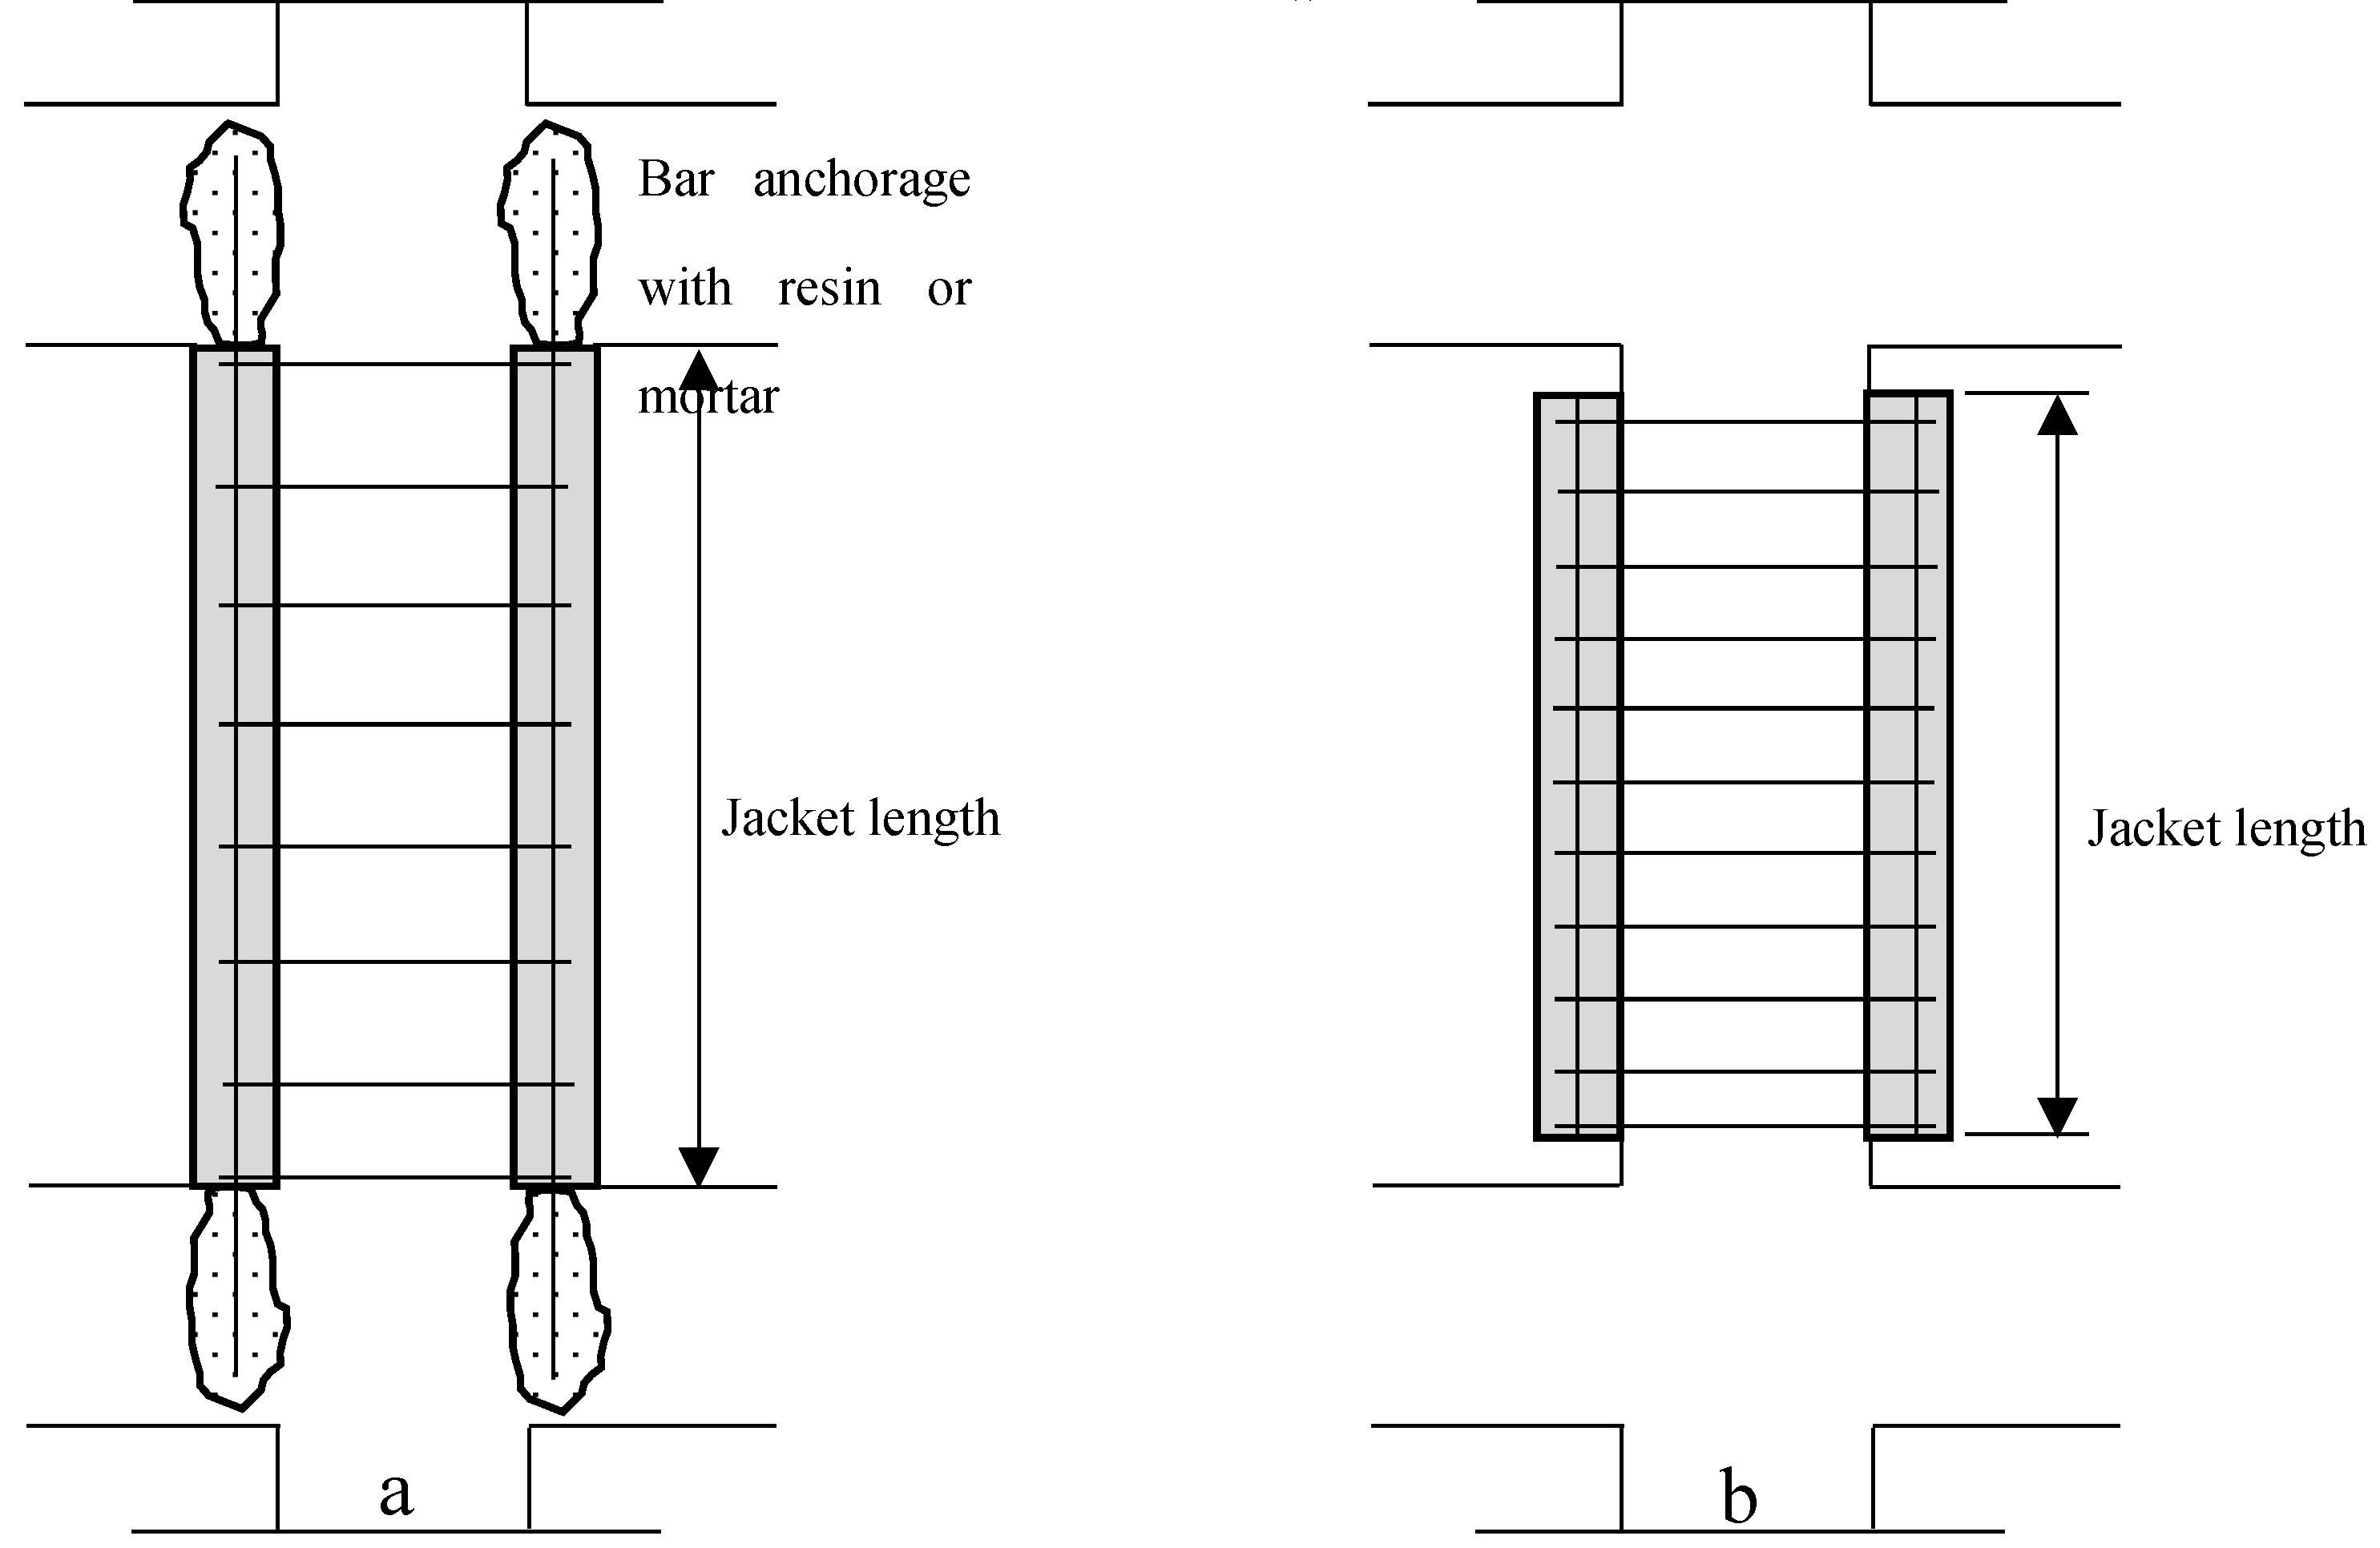
There is two different types of jacketing to be selected upon the intention of the designing engineer, Figure 11, the first type done by anchoring the the longitudinal bars to the adjacent slabs / footing in order to improve the flexural and shear behavior and confinement of the column while the other (Brena & Alcocer, 2009). On the other hand, the second type is designed in such a way that the longitudinal bars are stopped at the bottom and top of the columns when ehnacing the confinement and shear capacity of the column are the only concerns in the design stage (Campione et al., 2014). Previous studies (Júlio et al., 2005; Júlio & Branco, 2008; Rodrigues et al., 2018; Enuica et al., 2009) have used two-component epoxy resin to anchore the longitudinal bars, further attention must be taken to cleaning the drilled holes before anchoring the reinforcements as it changes the failure mode from slipping failure to flexural rupture one.
Construction Procedure
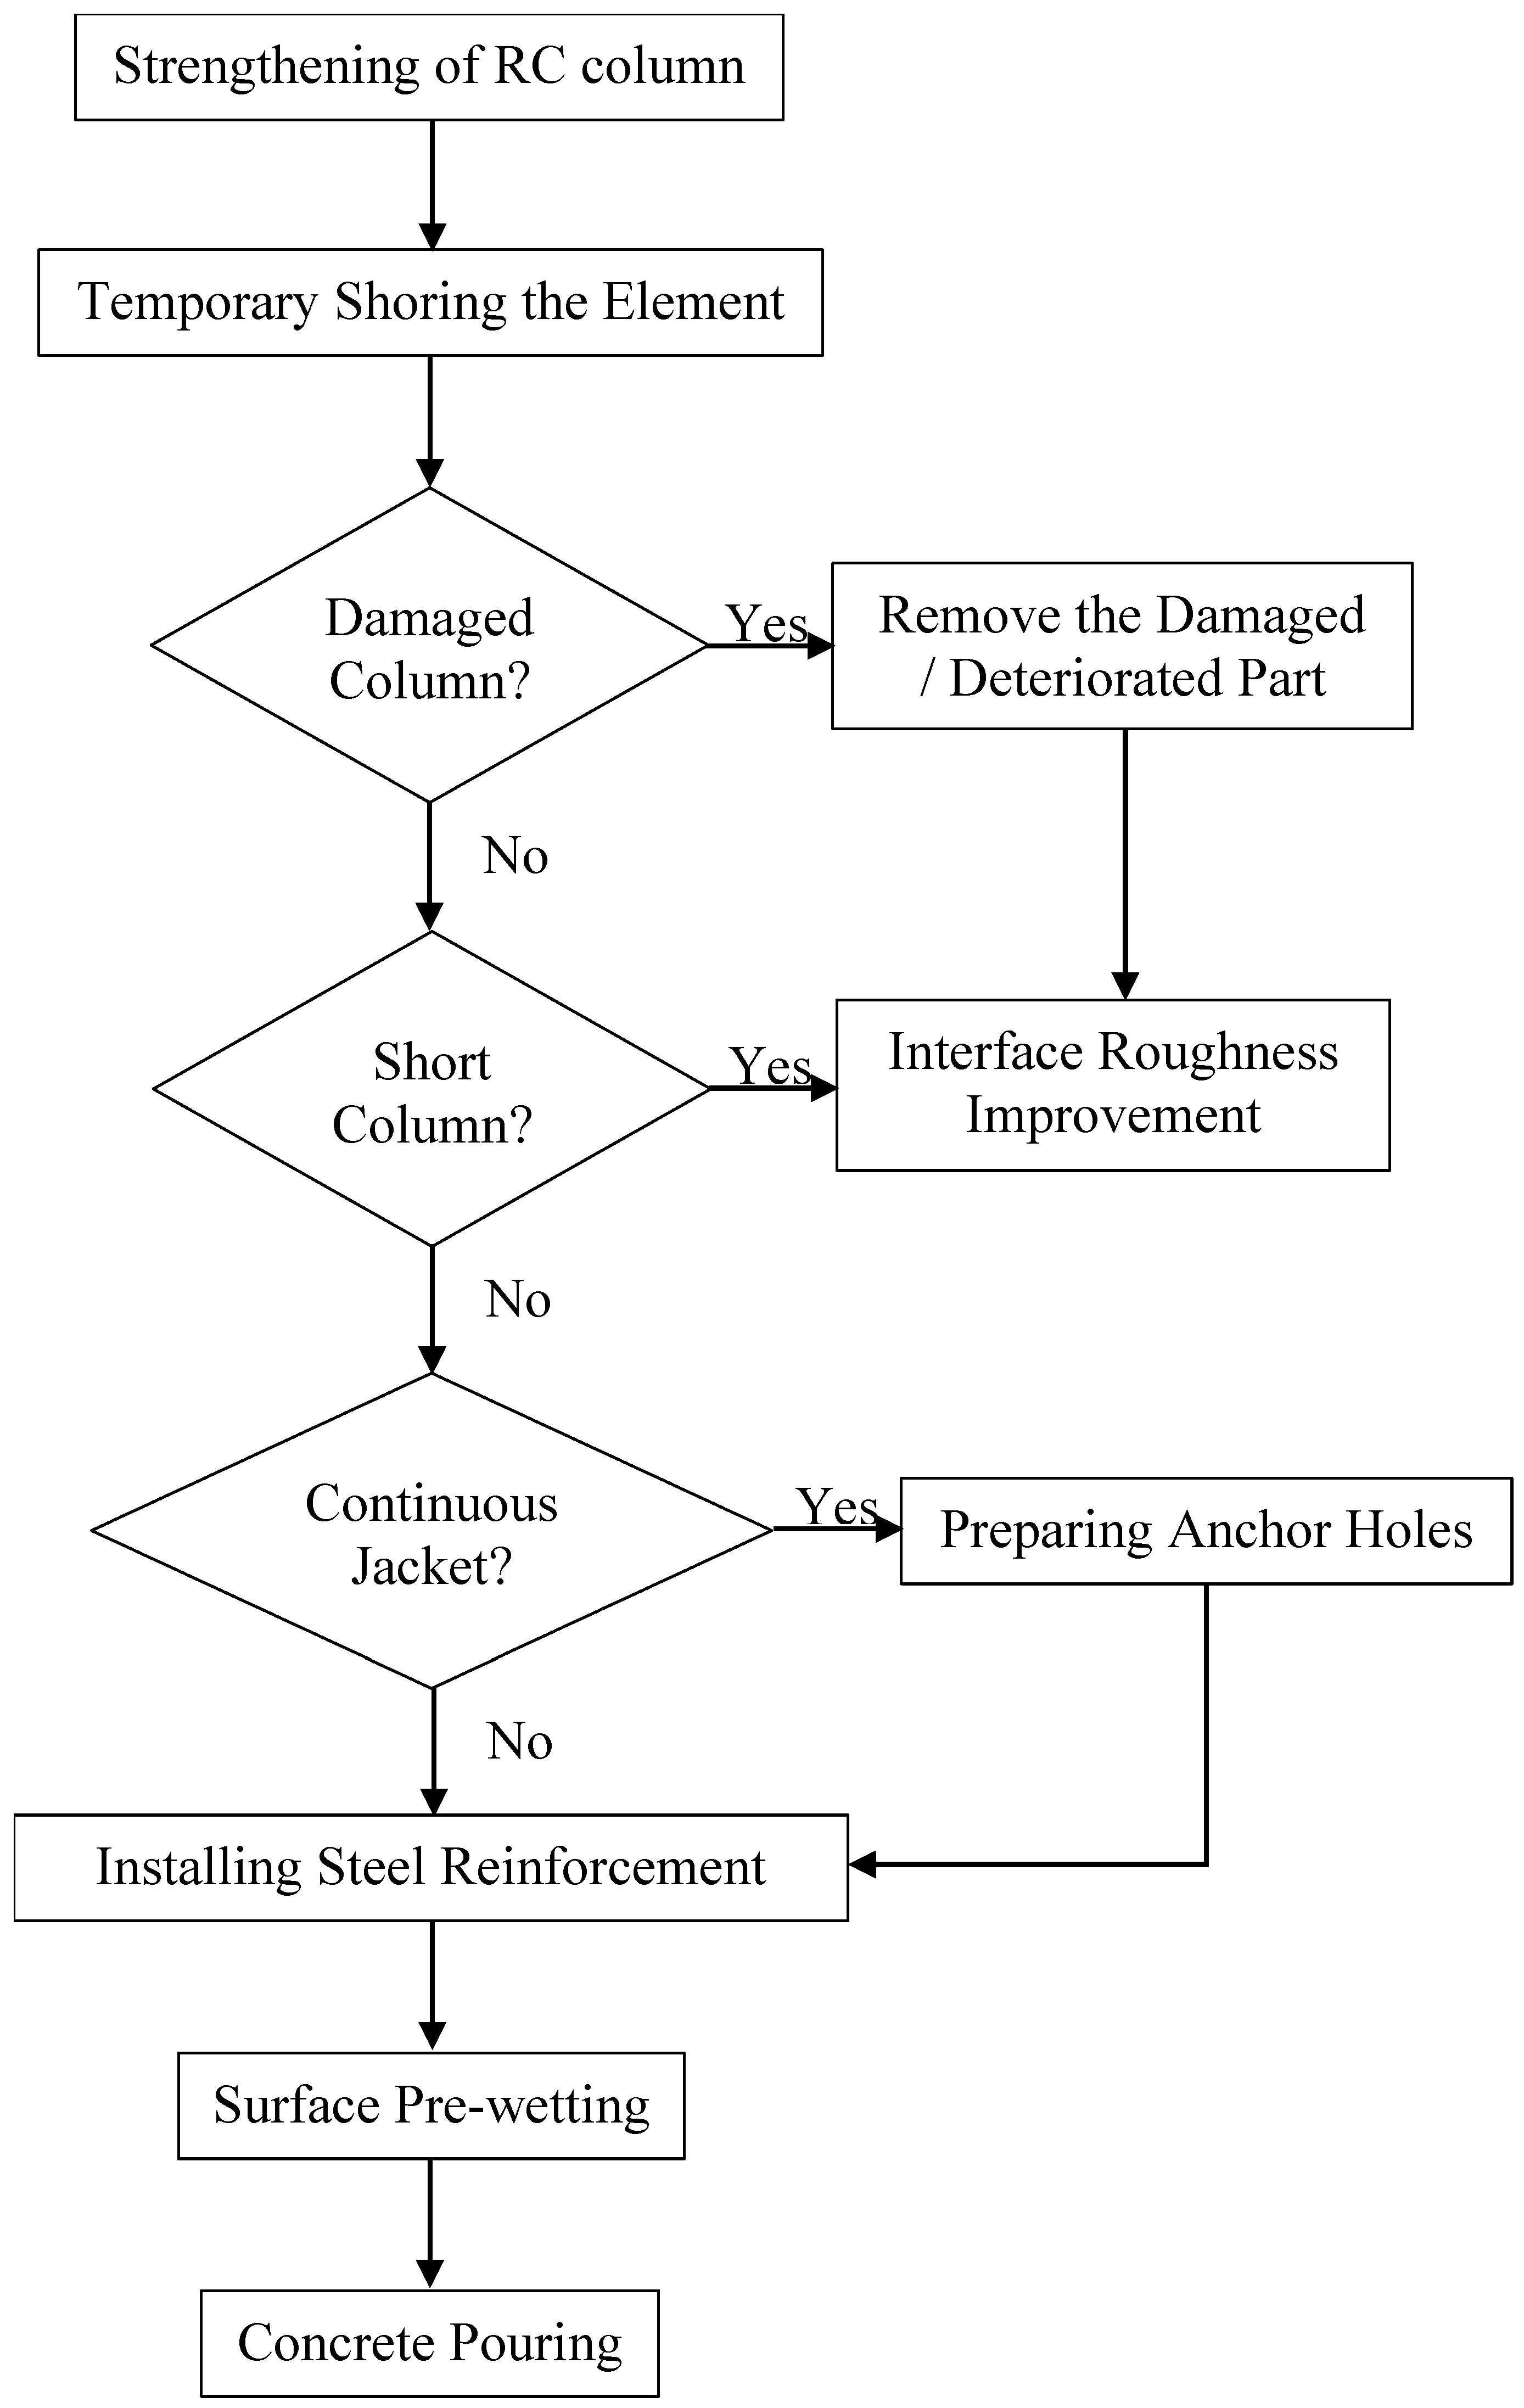
The steps of the construction procedure of this technique is provided in Figure 12 in addition some of that steps are described in Table 3.

2.4.4. Structural Behavior of Reinforced Concrete Jackets

In general, previous studies have concluded that this technique leads to a uniformly increase in the stiffness of retrofitted structure. In addition to the significant improving in the durability of the original element in terms of steel corrosion and fire protection in comparison to other techniques where steel is exposed or epoxy resins is being used (Júlio et al., 2003). Furthermore, this method is capable of improving the structural capacity and behavior of the strengthened building significantly (Júlio et al., 2018). Moreover, authors (Beschi et al., 2009) of concluded that RC jacketing using high performance fiber reinforced concrete is an effective way to increase the bearing capacity and ductility of the strengthened element where this technique is good for reducing the required jacketing thickness leading to a reduced element’s dimensions.

2.4.5. Numerical Modeling

Lampropoulos and Dritsos (Lampropoulos & Dritsos, 2011) concluded that the assumption of a perfect bond between the jacket and the core element results in overestimation of the response of the jacketed column and in order to get an accurate prediction of its behavior under the application of monotonic or cyclic loading the interface surface between old and new concrete must be simulated. Furthermore, modeling the effect of shrinkage by applying a volumetric strain to the elements of the jacket is highly important specially for jacket of 75 mm thickness as the section capacity were overestimated in comparison to the experimental data.

2.6. Nonlinear Response History Analysis: An Overview

Severe earthquake excitations often lead structures to exceed the yielding stresses of the structure material, causing the structure to behave in a nonlinear manner. Hence, more sophisticated analysis such as nonlinear time history analysis is required to accommodate the real nonlinear behavior of the structure which may result in large roof displacement and massive reduction in the structure integrity.

2.6.1. Procedure of Solution

The analysis is carried on the basis of the general equation of motion which is presented in Equation 2.1.
  M u ¨   ( t ) + C u ˙   ( t ) + K u   ( t ) = F ( t )
where K : structure stiffness matrix. C : Structure damping matrix. M : Diagonal mass matrix. u ( t ) : The structure displacements at a given time. u ˙ ( t ) : The structure velocities at a given time. u ¨   ( t ) : The structure accelerations at a given time. F ( t ) : The seismic driving force at a giving time.
Fast nonlinear analysis (FNA) and direct integration methods are usually used in order to evaluate the unknowns in the equation of motion. Both methods achieve similar solution for a given structure. However, direct integration methods are time consuming since it is an iterative based method. Ultimately, FNA method is more advantages in this aspect. Both of Ritz and Eigen modal can be used in order to evaluate the solutions. However, for nonlinear behavior of structure Ritz analysis is used where Eigen analysis cannot converge to the real modal solution of the structure.
Ground motion scaling methods
American standards (ASCE7-16) requires the ground motion to be scaled in accordance with a design spectrum of 1% exceedance within 50 years. Both frequency domain method and time domain method are used to scale the ground motion record which are listed below.
Scaling in Frequency Domain
This method is the simplest. However, it does not always converge to a solution that represent the design spectrum. Not to mention the fact that this method reassembles the time domain of the ground motion records. Hence, the real response of the building at a giving time is unrealistic. Where implementing this method often results in a higher energy delivered to the structure. Since, this method uses the ratio of the target response spectrum to the time series response spectrum while maintaining steady motion of the Fourier phase.
Scaling in Time Domain
This method results in a more convenient scaling where it matches the target response without affecting the frequency of the ground motion records. This method depends on modifying the acceleration of the records by using a wavelet. Where wavelets are function that oscillates for positive and negative values which will be added later to the ground motion records.

3. Research Methodology

3.1. Introduction

This chapter represents the experimental program that will be followed to carry out the investigations on RBC jacket from materials and structural aspects. As part of this chapter the methodology to develop a suitable RBC mix that can be used for retrofitting applications will be described then the method of testing this material in a full scale strengthened RC column will be investigated including required materials, designed specimens test setups and testing protocols in both stages.

3.2. Research Strategy

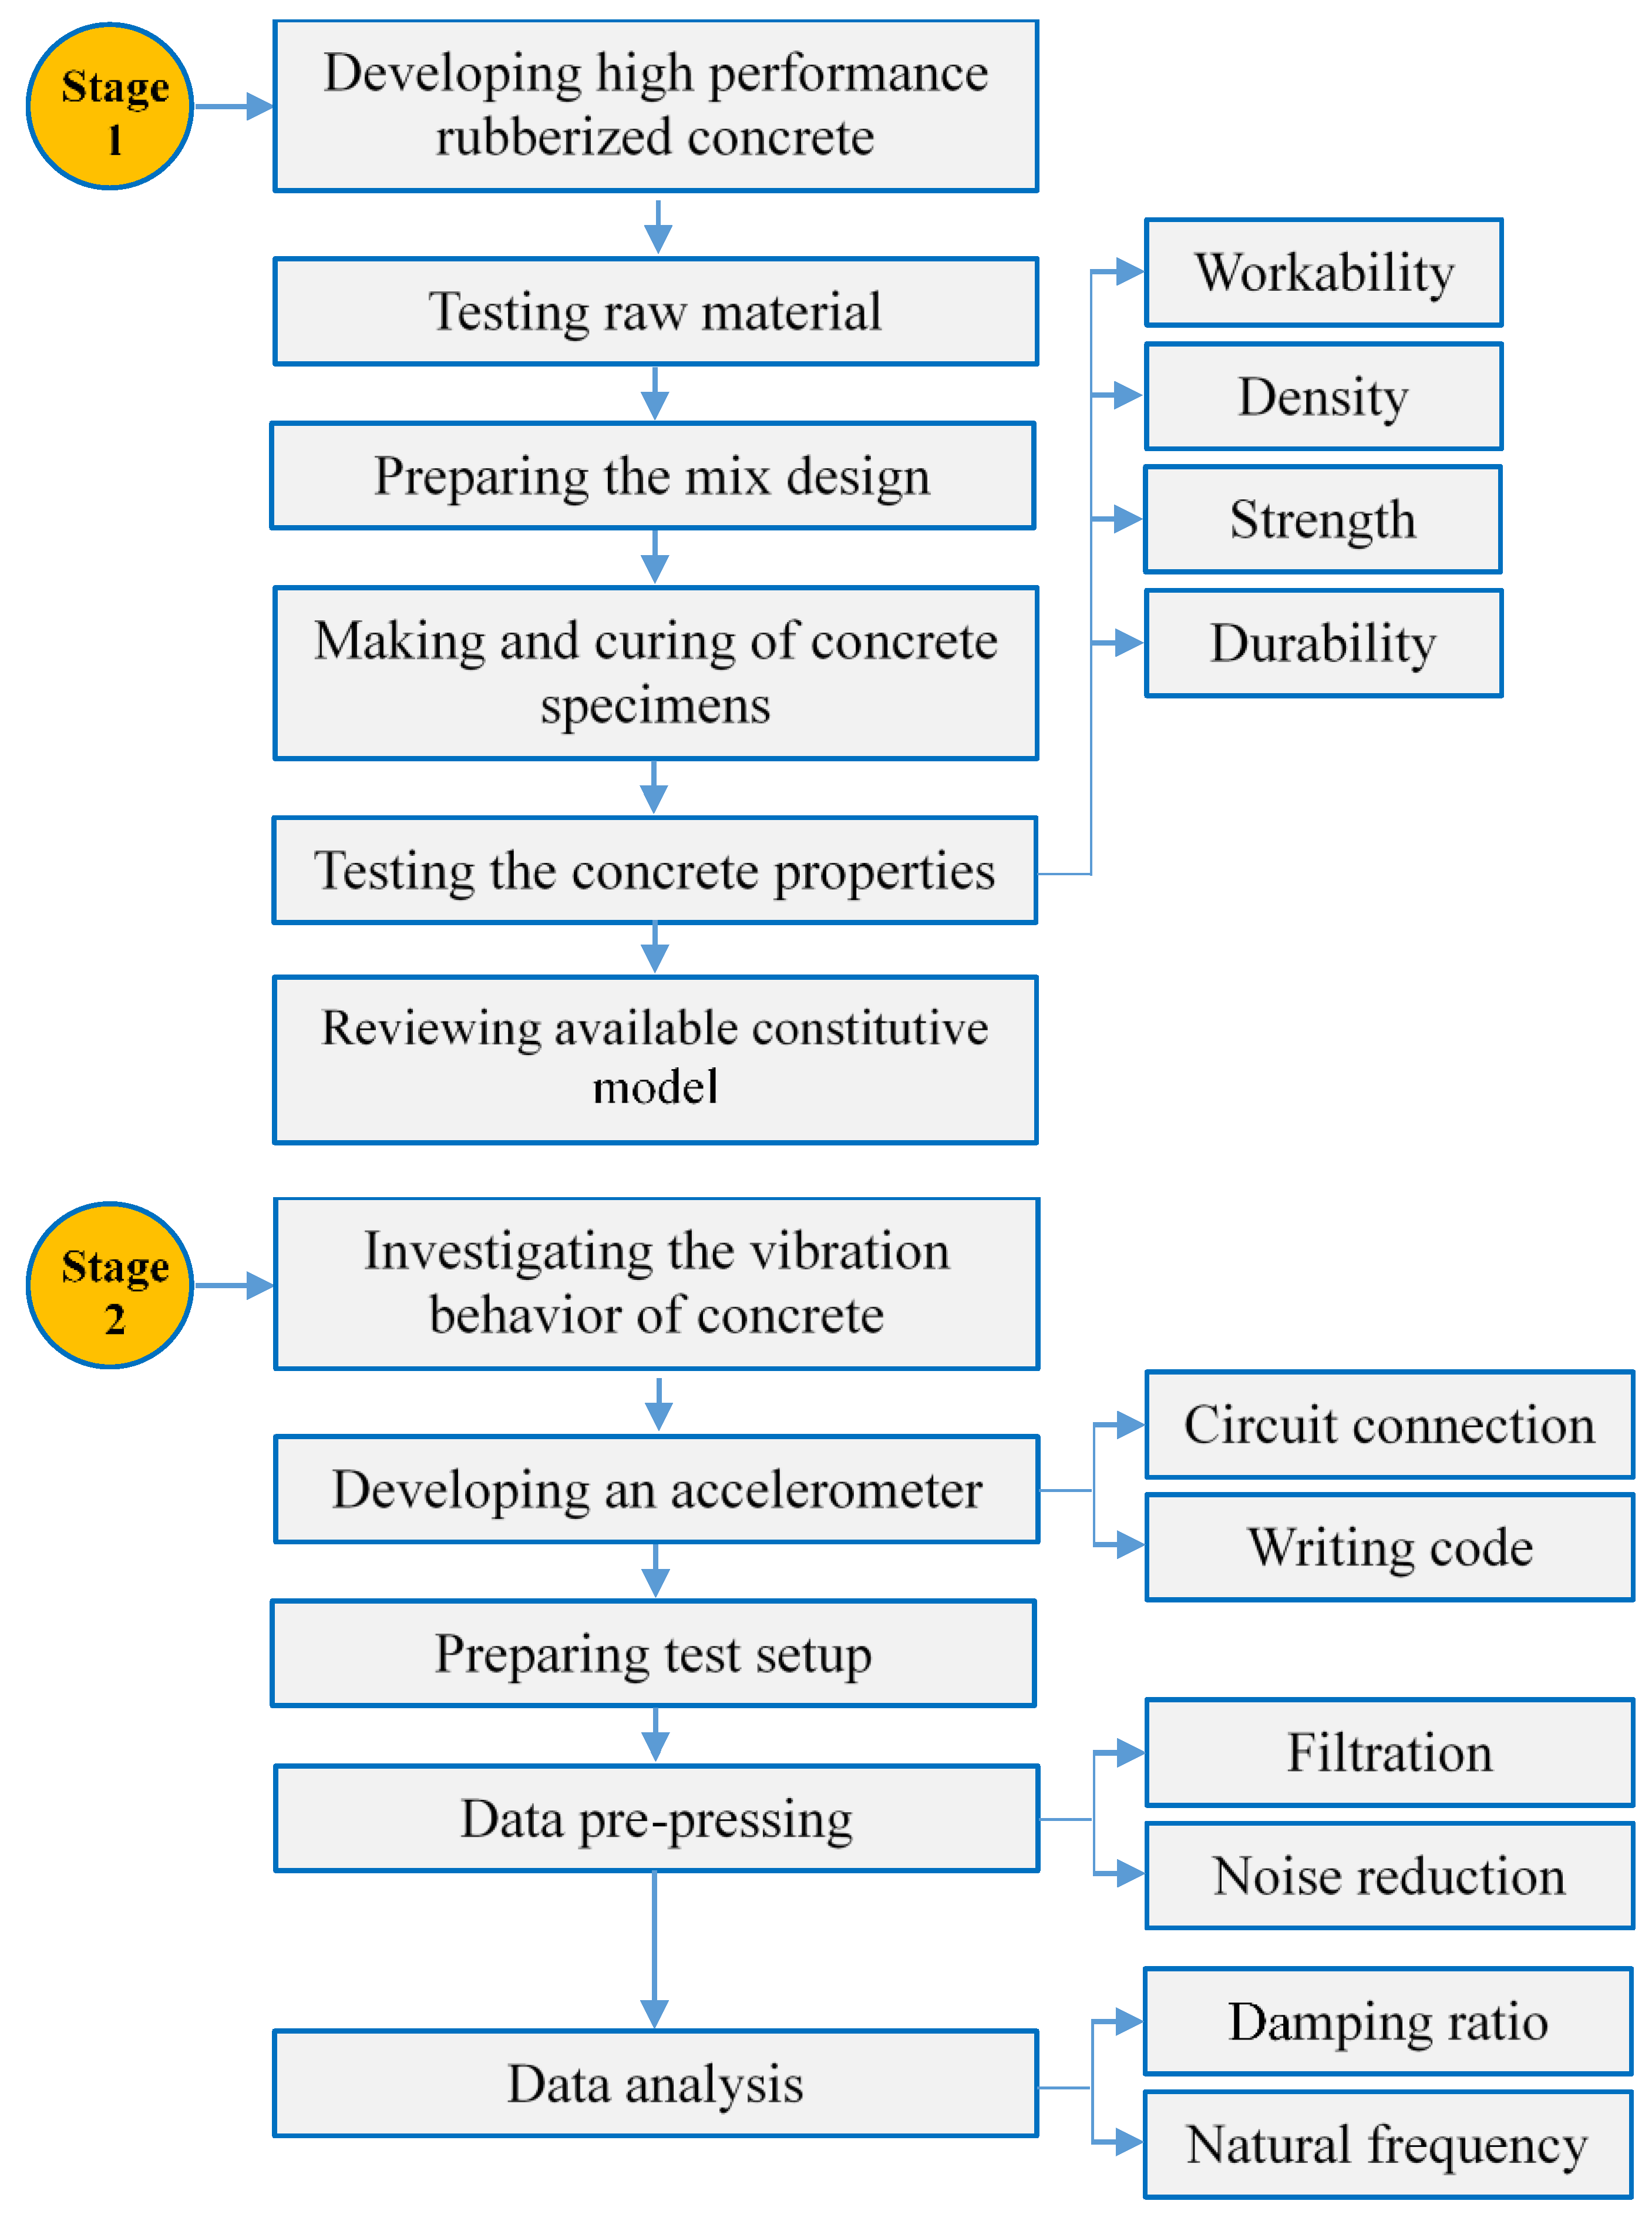
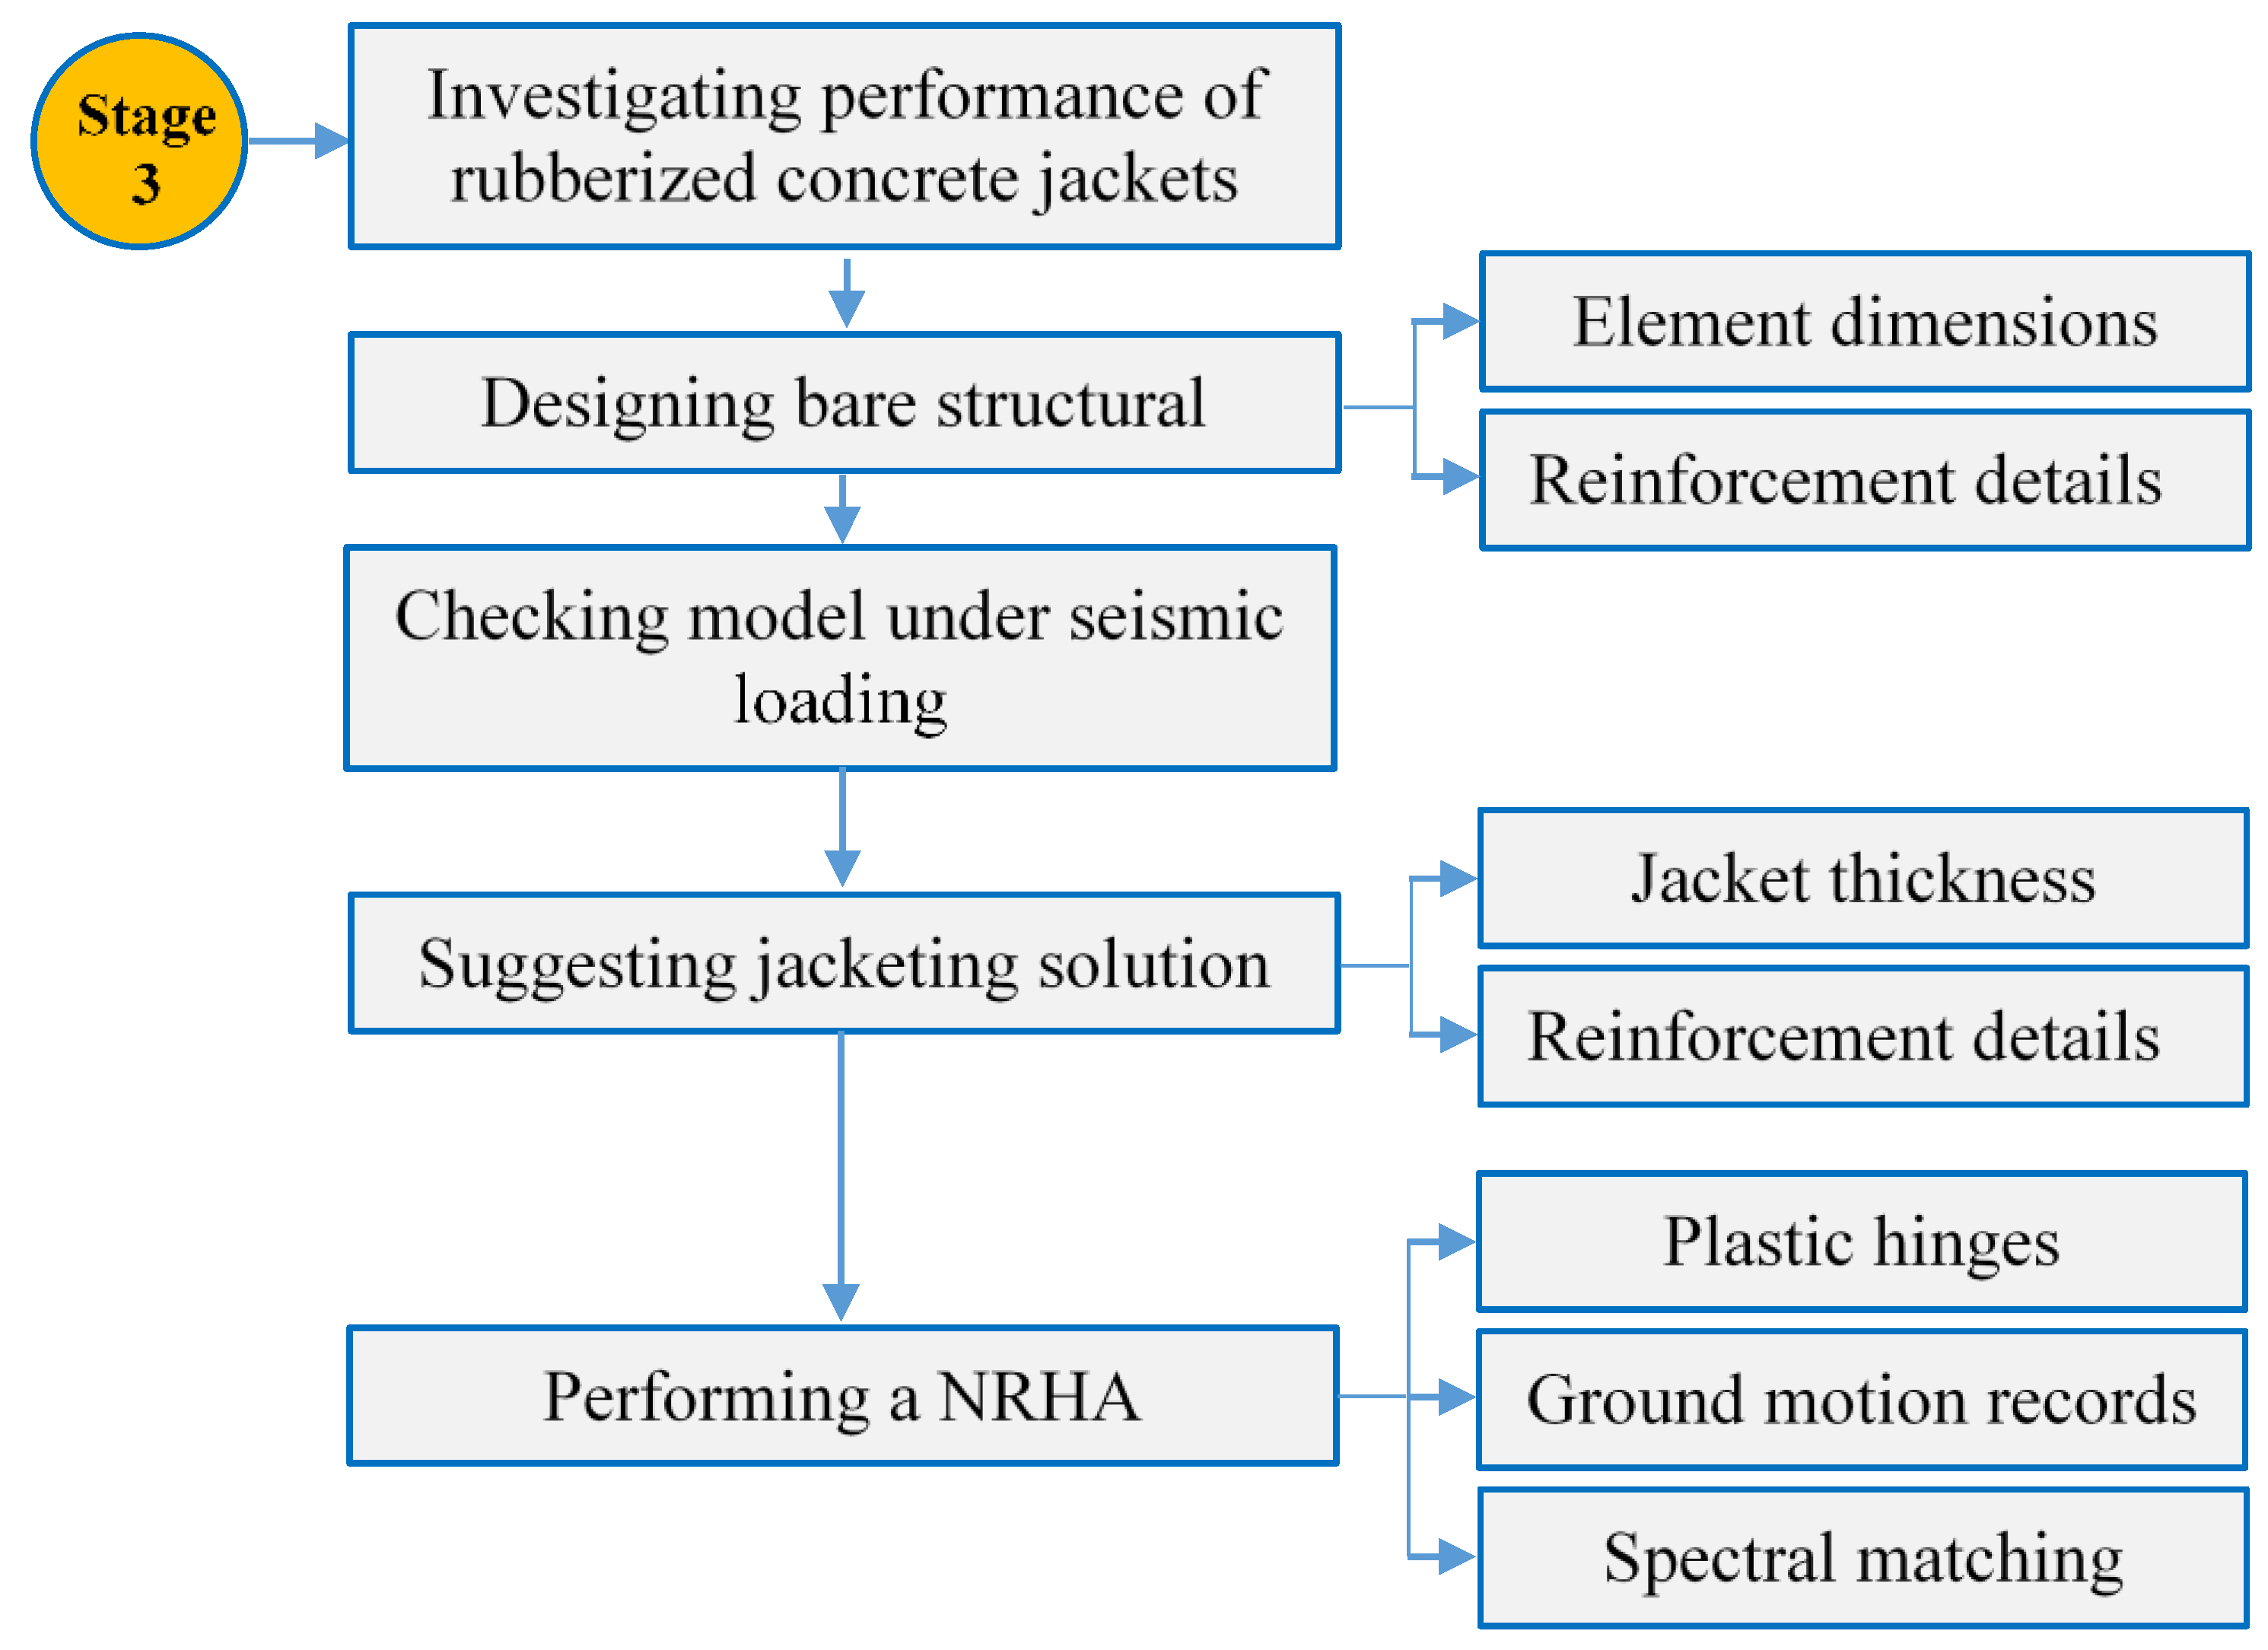
3.3. Developing a High-Performance Self-Compacting Rubberized Concrete

The intention in this section is to provide a methodology to develop a concrete that has the characteristics of self-compacting, high performance concrete to be used in a jacketing works. This will be done by brief describing firstly, the materials that will be used in this stage, secondly, the proposed materials proportions and process of concrete production and finally, the tests that will be carried out to study the characteristics of the designed concrete mixture.

3.3.1. Material Properties

Cement
Blast-furnace Slag Cement CEM II/B-S 42.5 N that that meets the requirements of ASTM C 595 standard with a specific gravity of 3.15 will be used in the test for the preparation of the specimens.
Silica Fume
The silica fume that will used in this test has a 95 % SiO2 content that meet the requirements of ASTM C1240 standards. This material will be used a mineral admixture because it increases the strength of the bond between the cement past and the aggregate Therefore, it is expected that the reduced in strength of concrete due to the addition of rubber aggregates will decrease.
Water
Tap water that meets the requirements of ASTM C1602 standard which is considered to be free from contamination was used to carry out the hydration process of the cement in the designed mixtures.
Admixtures
High range water reducer polycarboxylic ether-based superplasticizer GLENIUM 27 that meets the requirements for ASTM C 494 will be will be included in the concrete mixtures to achieve high workability. It has a specific gravity of 1.026 and brown color.
Steel Fiber
Hooked end steel fiber that meets the requirements of ASTM A820 with a length of 50 mm, slenderness of 80 and tensile strength of 1225 MPa were used in the mix design.
Fine Aggregate
Crushed stones that meets the requirements of ASTM C33 standard with a maximum particle size of 5 mm are to be used as a fine aggregates. Both specific gravity and percentage of water absorption were found based on ASTM C128 and results are shown in Table 4 and Table 5.
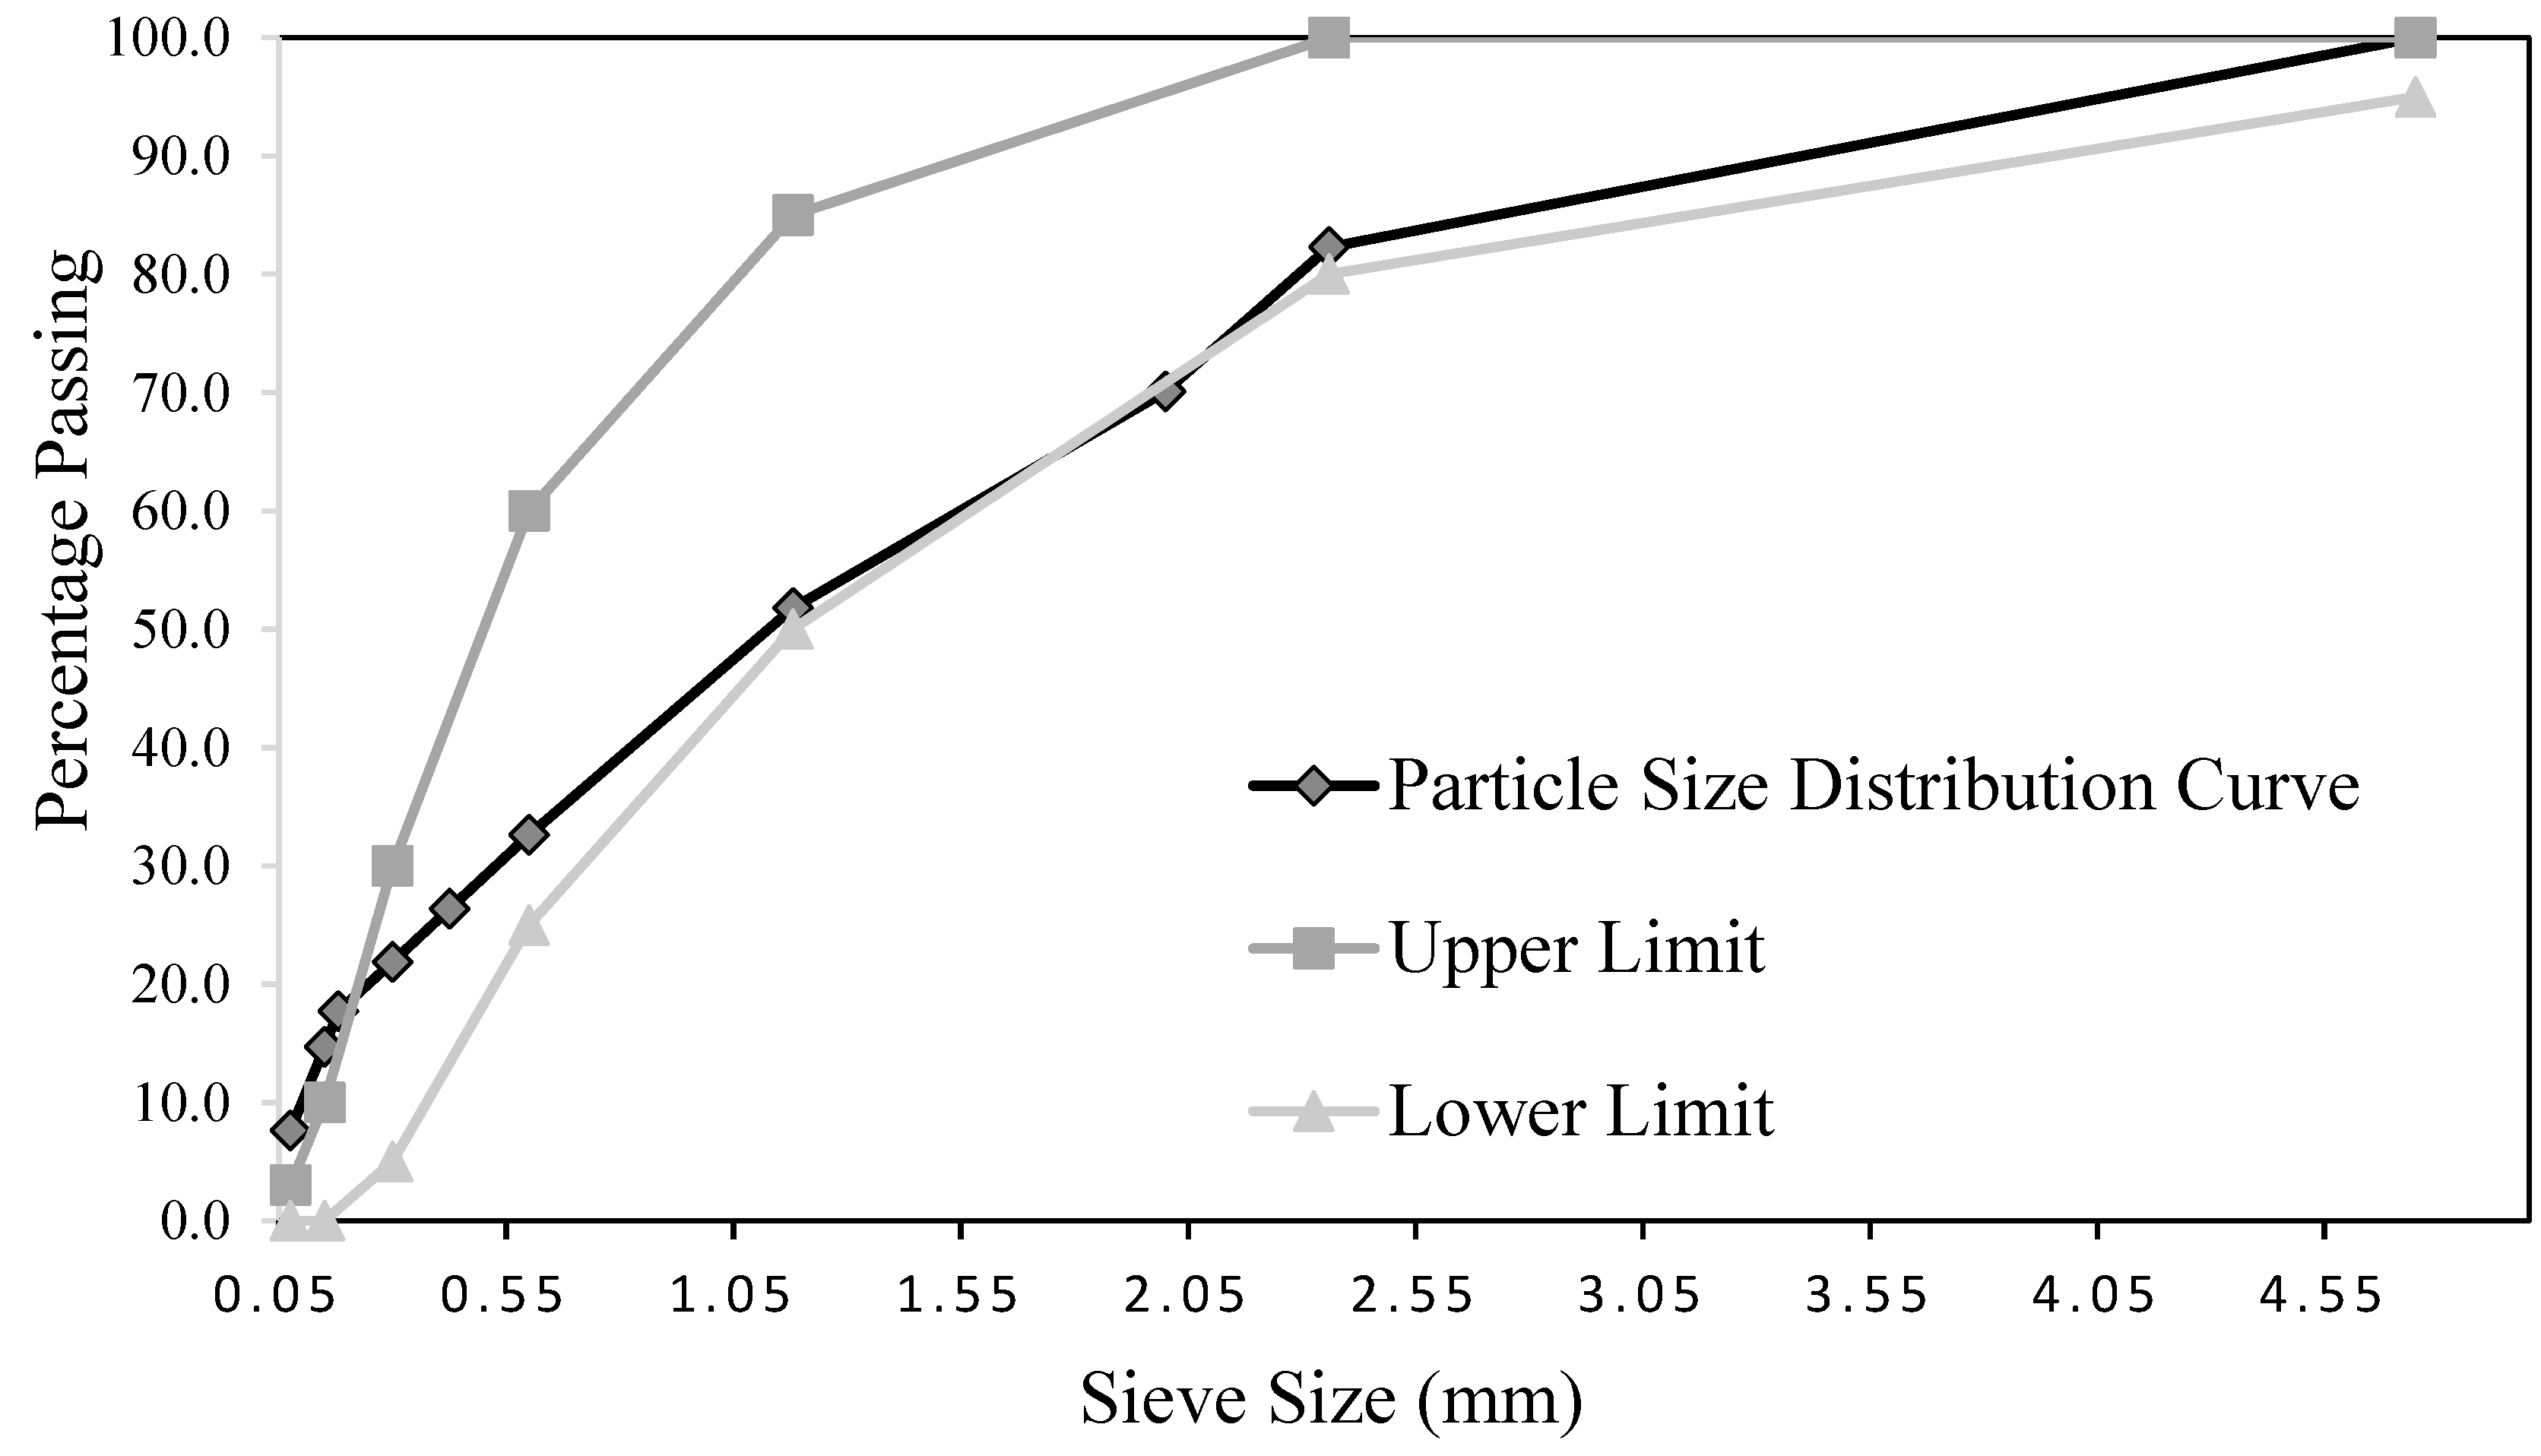
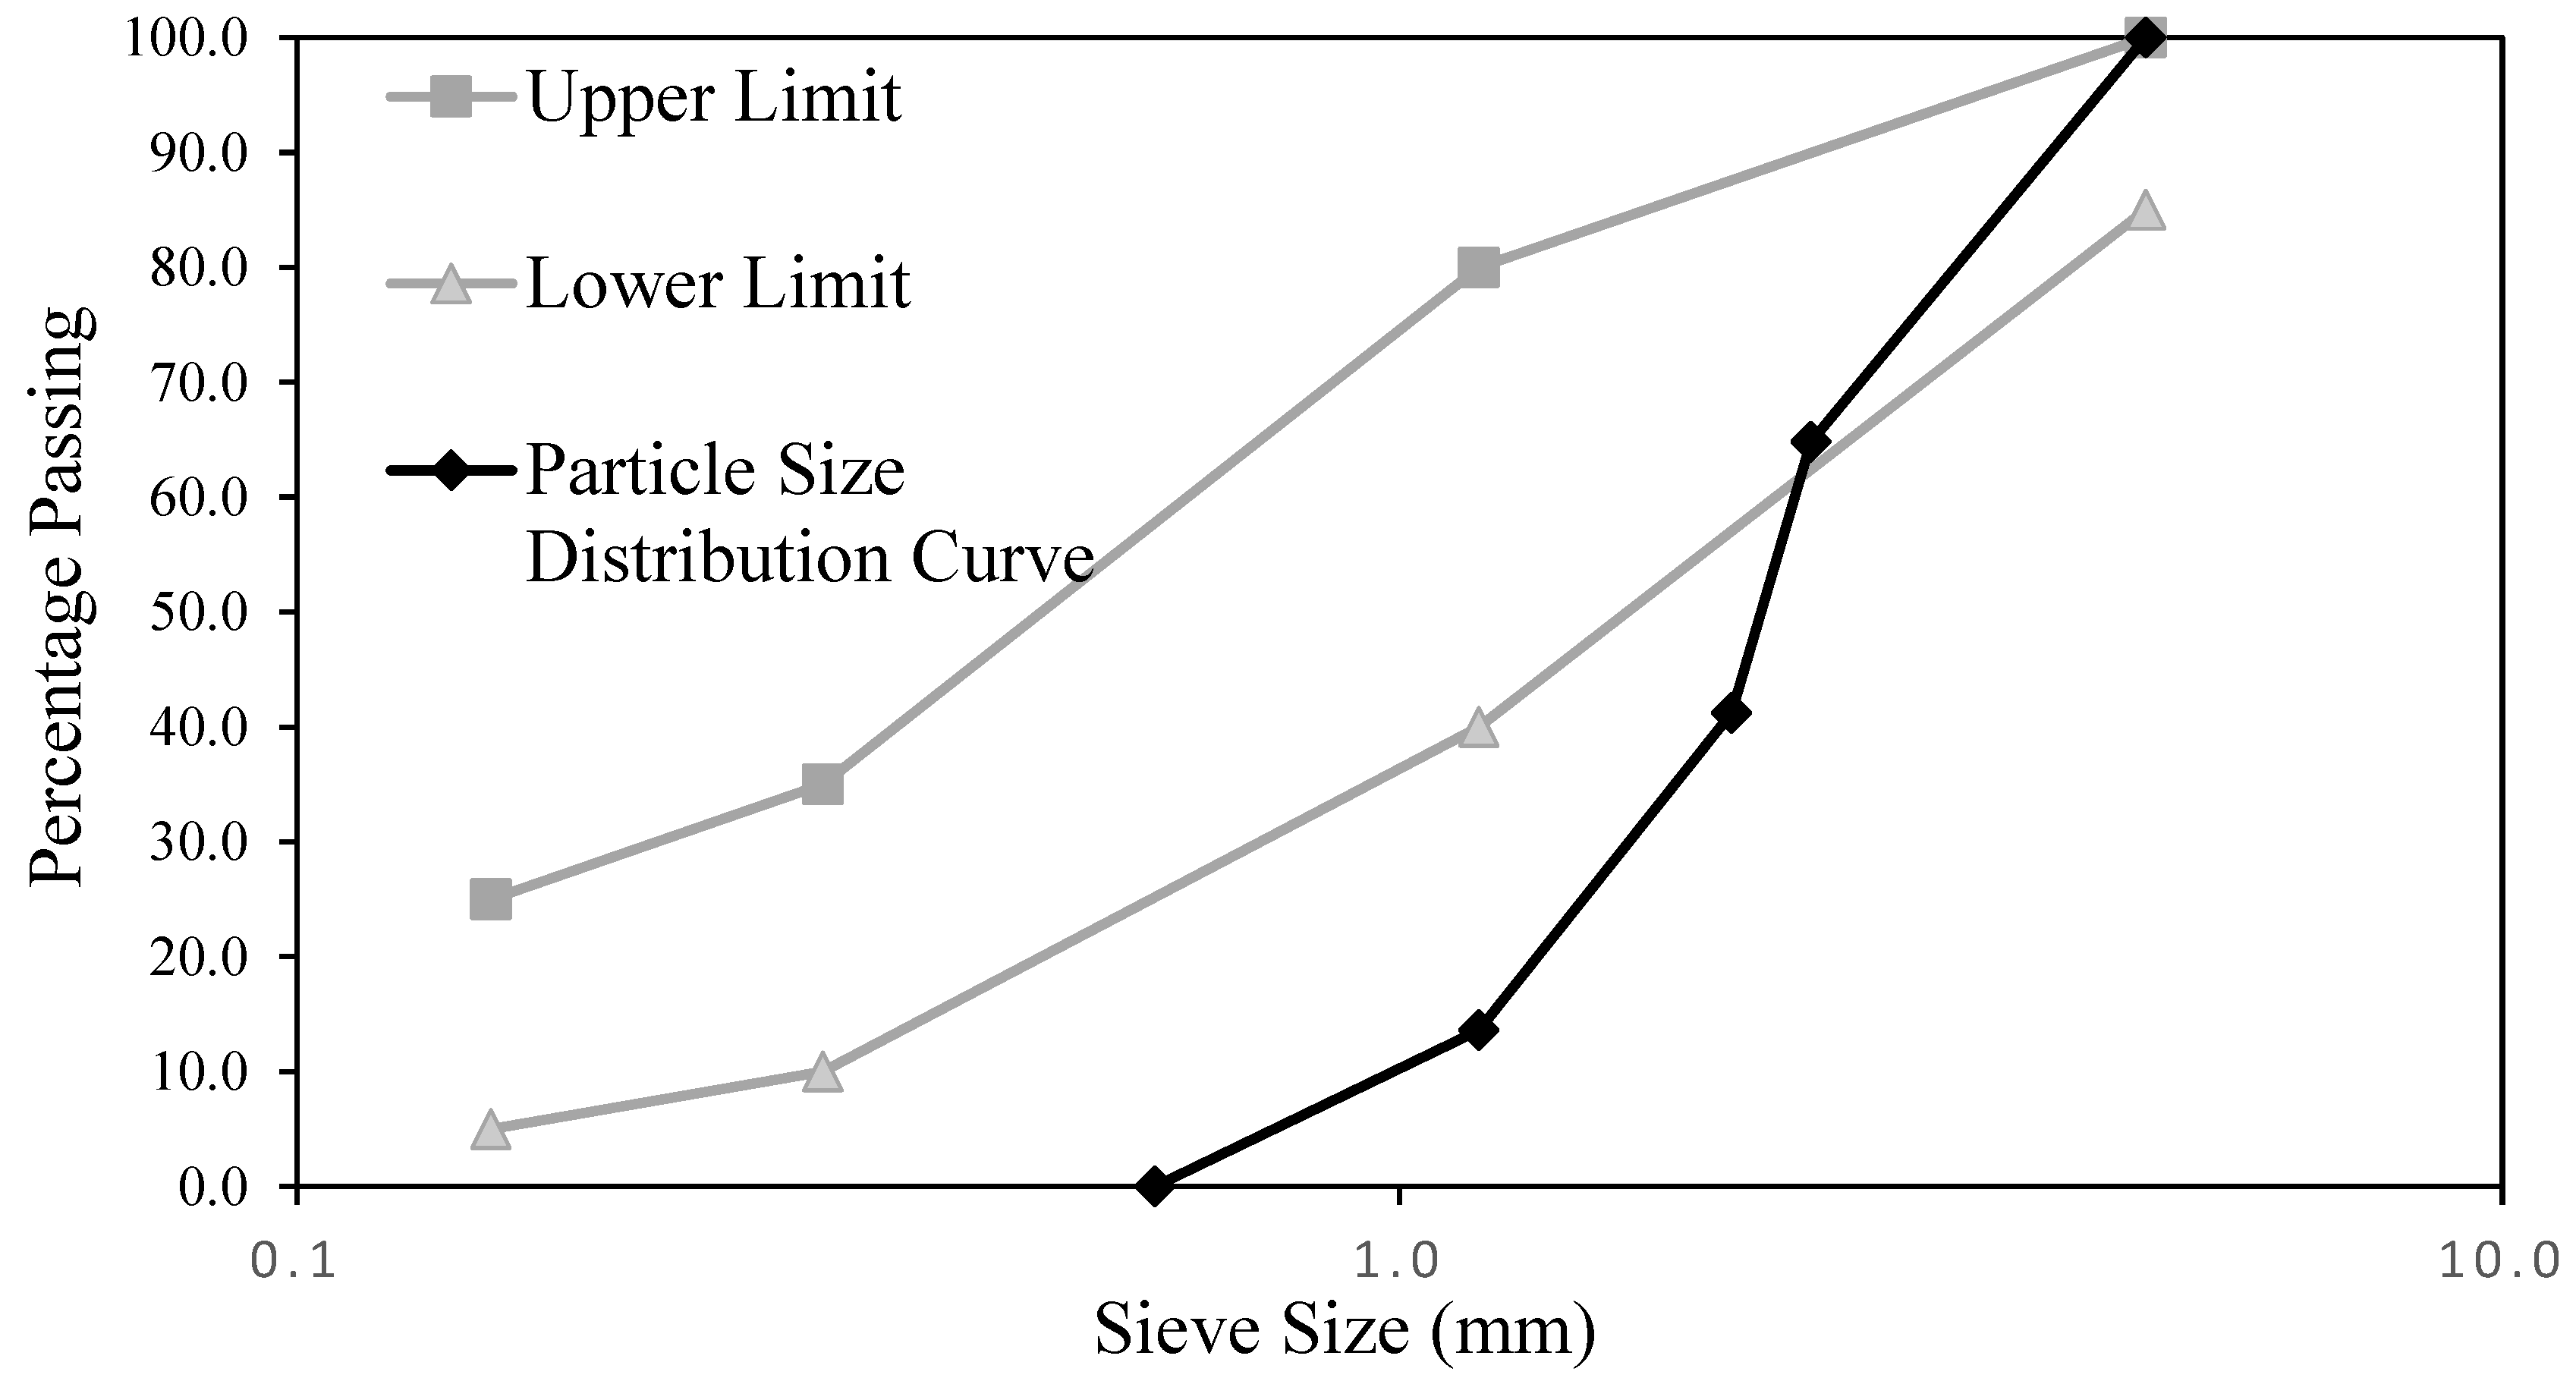
In addition, total evaporable moisture content of the fine aggregate was calculated based on ASTM C566 where mass of original sample was taken to be 500 g and mass of dried sample was measured as 483.3 g, then the total evaporable moisture content of the fine aggregate was calculated as 3.45%. Finally, a sieve analysis test based on ASTM C136 was done in order to find out the size distribution of the fine aggregate. The size distribution curve is presented Figure 14. In fact, Figure 14 shows three different graphs which are particles size distribution, upper limits and lower limits for the size distribution of fine aggregate as provided by ASTM C33, based on that figure it can be observed that the fines to be used herein are well graded with a fineness modulus calculated as 3.89.
Coarse Aggregate
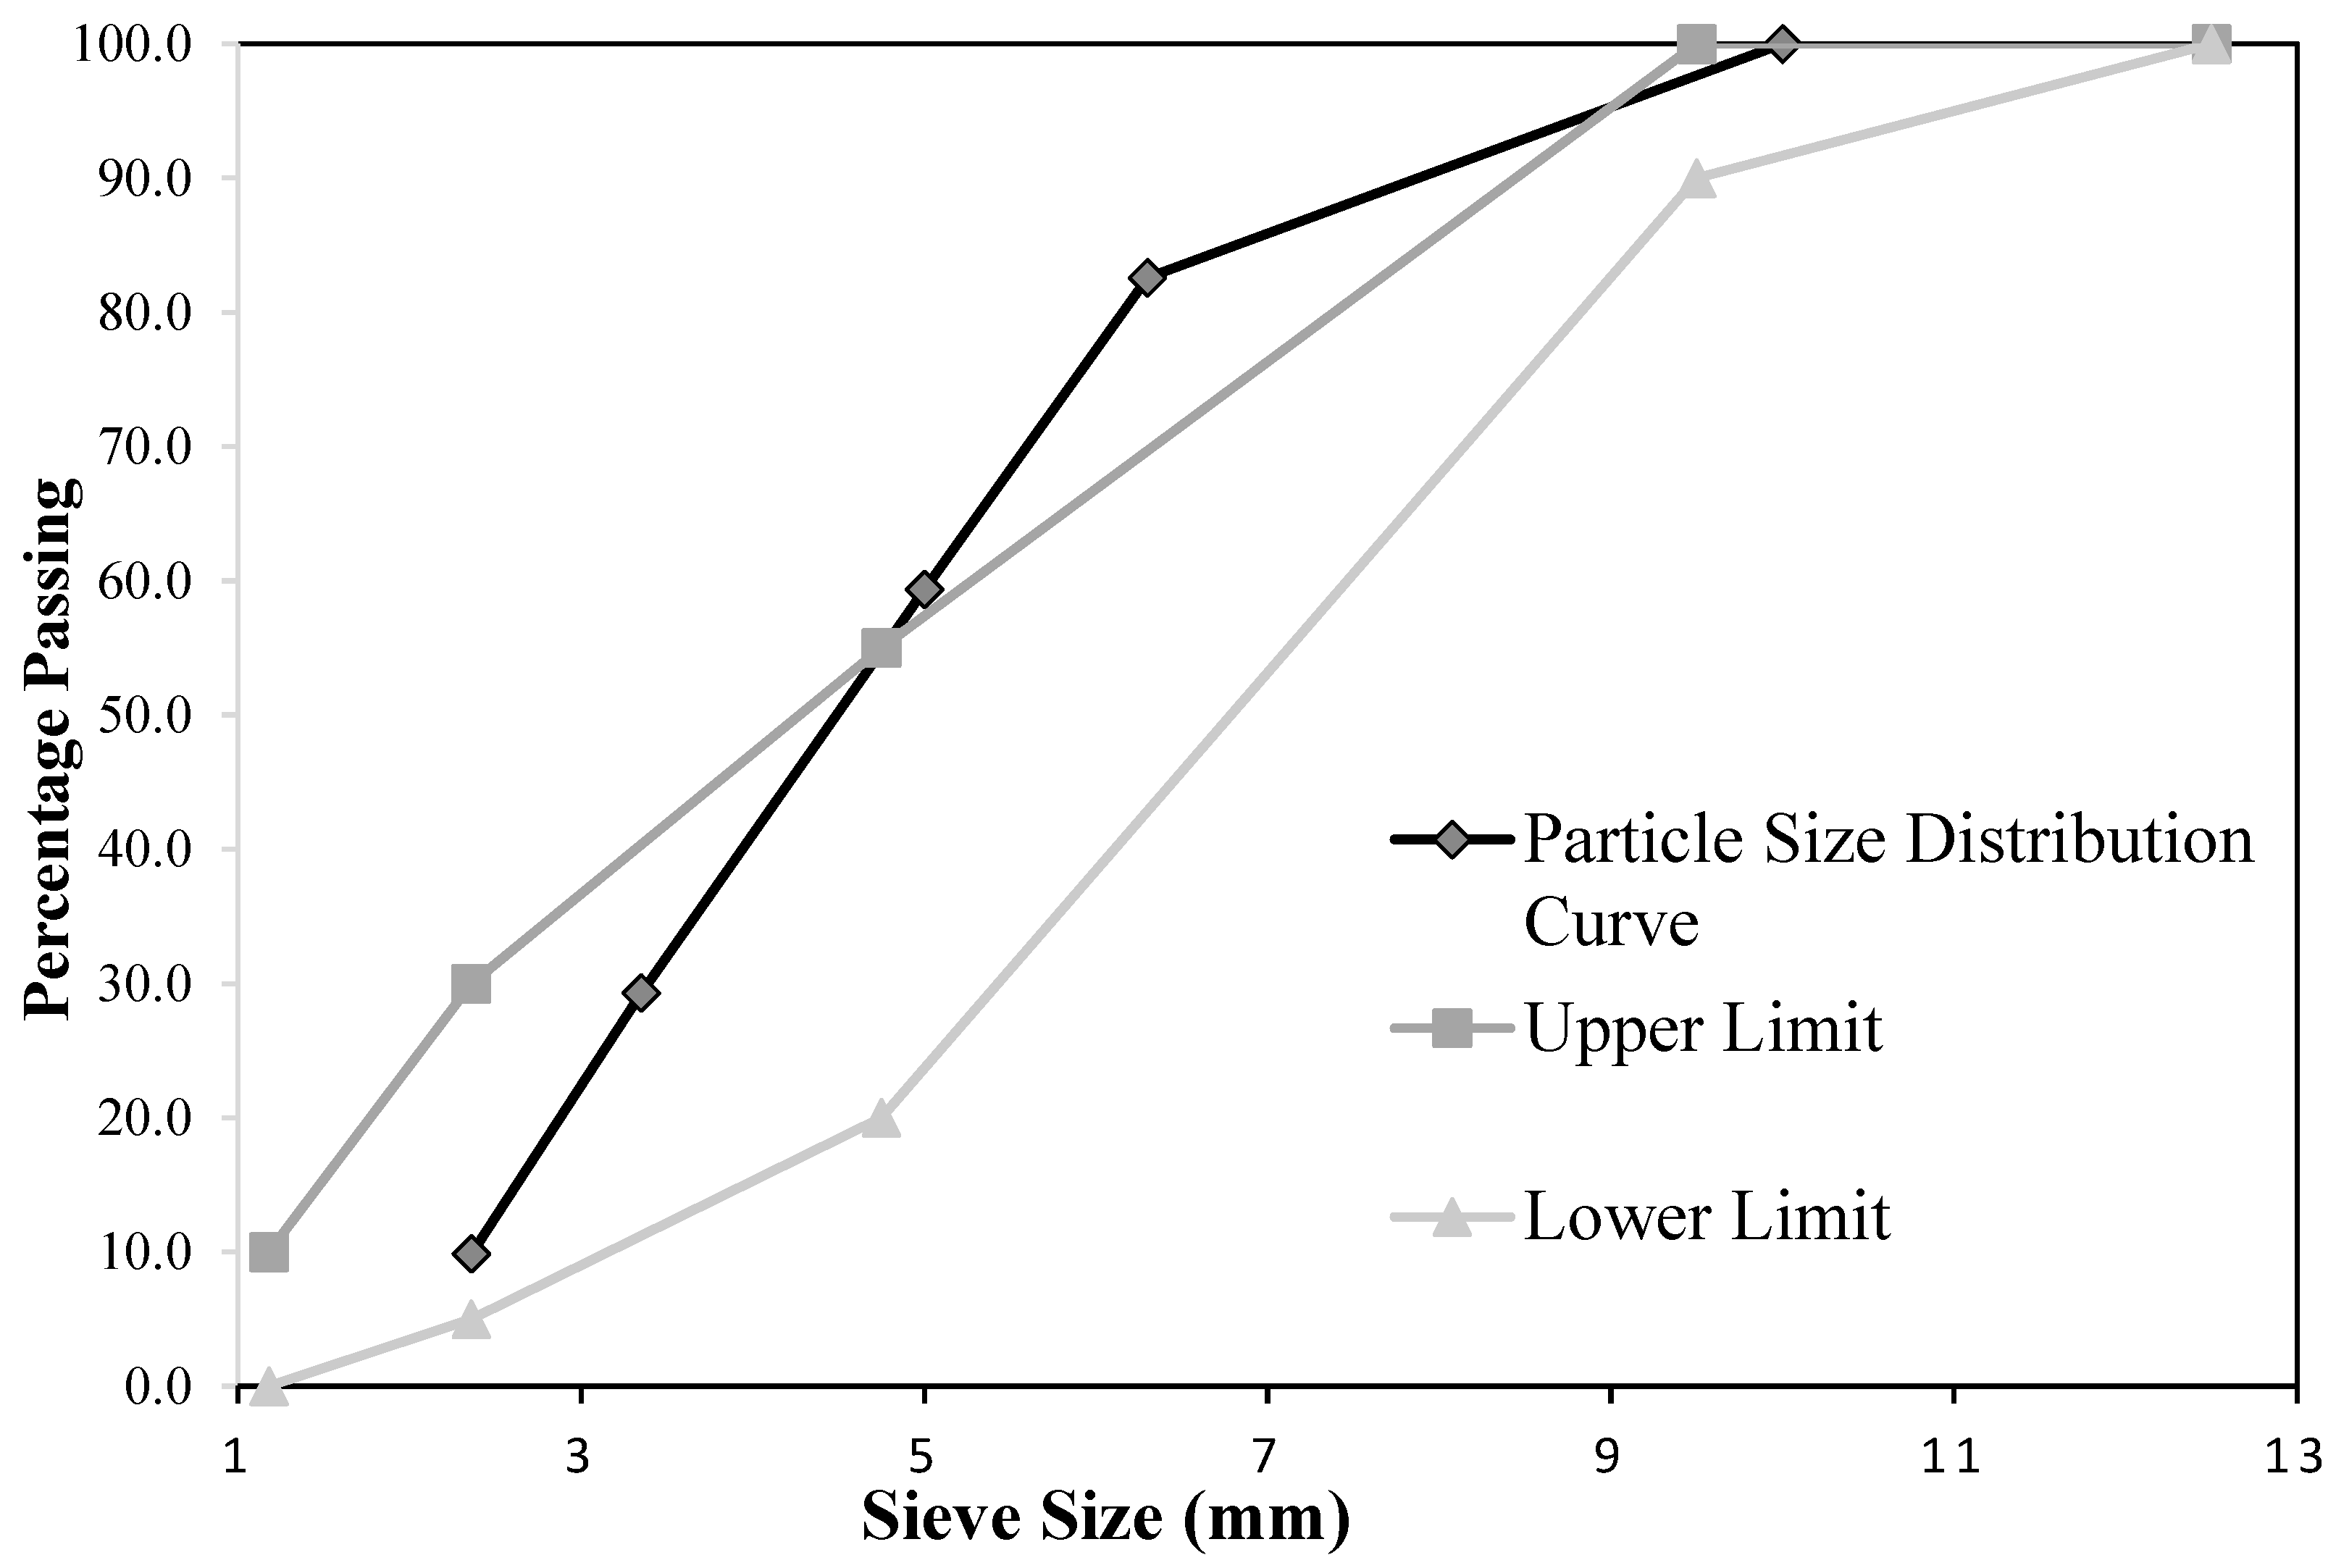
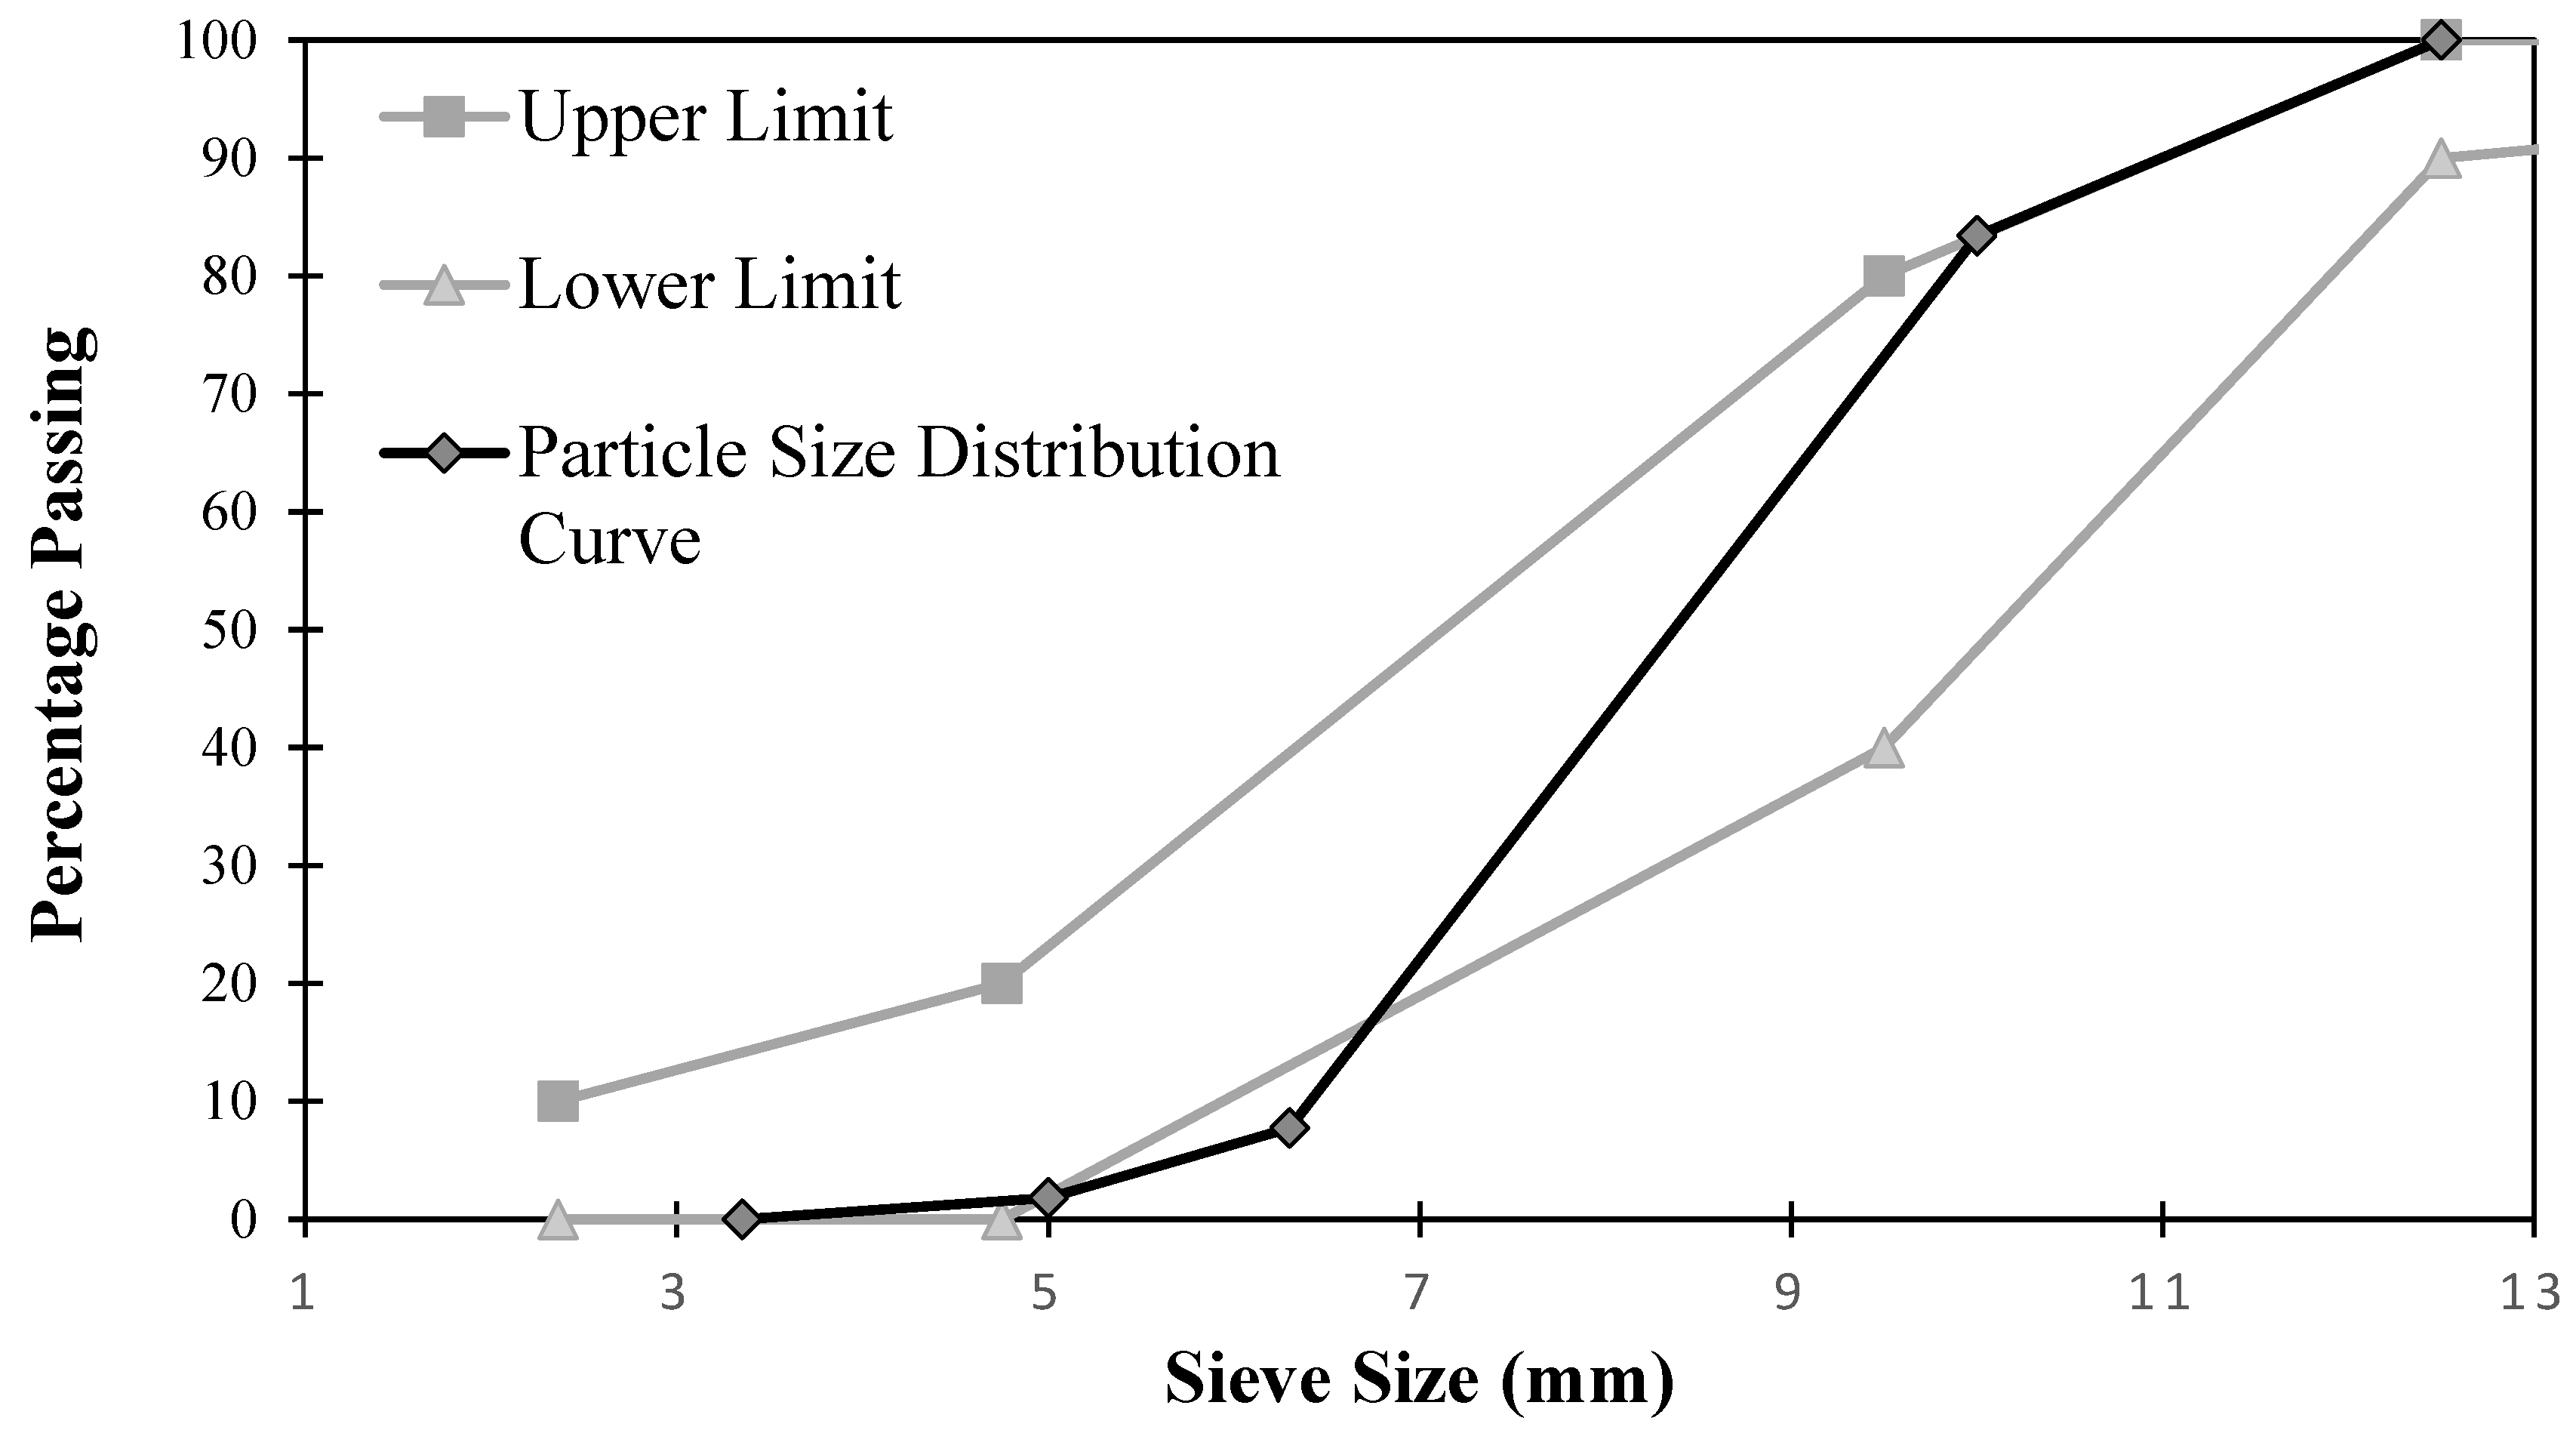
Crushed limestone rock that meets the requirements of ASTM C33 standard with two different nominal maximum size of 10 mm will be incorporated as the coarse aggregate for producing Ultra and normal strength concrete. Similar to fine aggregate specific gravity and percentage of water absorption for coarse aggregates were measured based on ASTM C127. The process of testing the properties of maximum size of 10 mm aggregates started by separating the coarse particles form those passing 4.75 mm sieve then each size was tested separately in which ASTM C127 was used for particles with a size above 4.75 mm and ASTM C128 was used for particles with a size smaller than 4.75 mm since the amount of fines were high in that aggregate. Results of those experiments are shown in Table 6, Table 7, Table 8 and Table 9. Furthermore, total evaporable moisture content of these aggregates was calculated based on ASTM C566 where mass of original sample was taken to be 2000 g and mass of dried sample was measured as 1992 g, then the total evaporable moisture content of the fine aggregate was calculated as 0.4%. At the end, a sieve analysis test based on ASTM C136 was done in order to find out the particle size distribution of these aggregate particles. The particle size distribution curve is presented Figure 15. In fact, Figure 15 shows three different graphs which are particles size distribution, upper limits and lower limits for the particle distribution of coarse aggregate with the range 4.75 – 12.5 as provided by ASTM C33. Based on that figure, it can be observed that the fine aggregates to be used in this study are considered to be well graded.
Rubber
Rubber particles from old car tiers with a specific gravity measured using the method provided in ASTM standard as 1.06 will be used in this study. Similar to traditional aggregates these particles were divided into two main parts according to their size. The first one is fine rubber particles and the second one is coarse rubber particles. However due to the low graded on this material it was decided to mix them and form a new distribution that satisfies the requirement of ASTM C330 lightweight aggregates for structural concrete.
Fine Rubber Particles
A sieve analysis test based on ASTM C136 was done in order to find out the size distribution of the fine rubber particles. The particle size distribution curve is presented Figure 16. Based on these the fineness modulus was calculated as 2.22. In addition, the limitation provided in ASTM C330 lightweight aggregates for structural concrete the upper and lower limited are drawn in Figure 16.
Coarse Rubber Particles
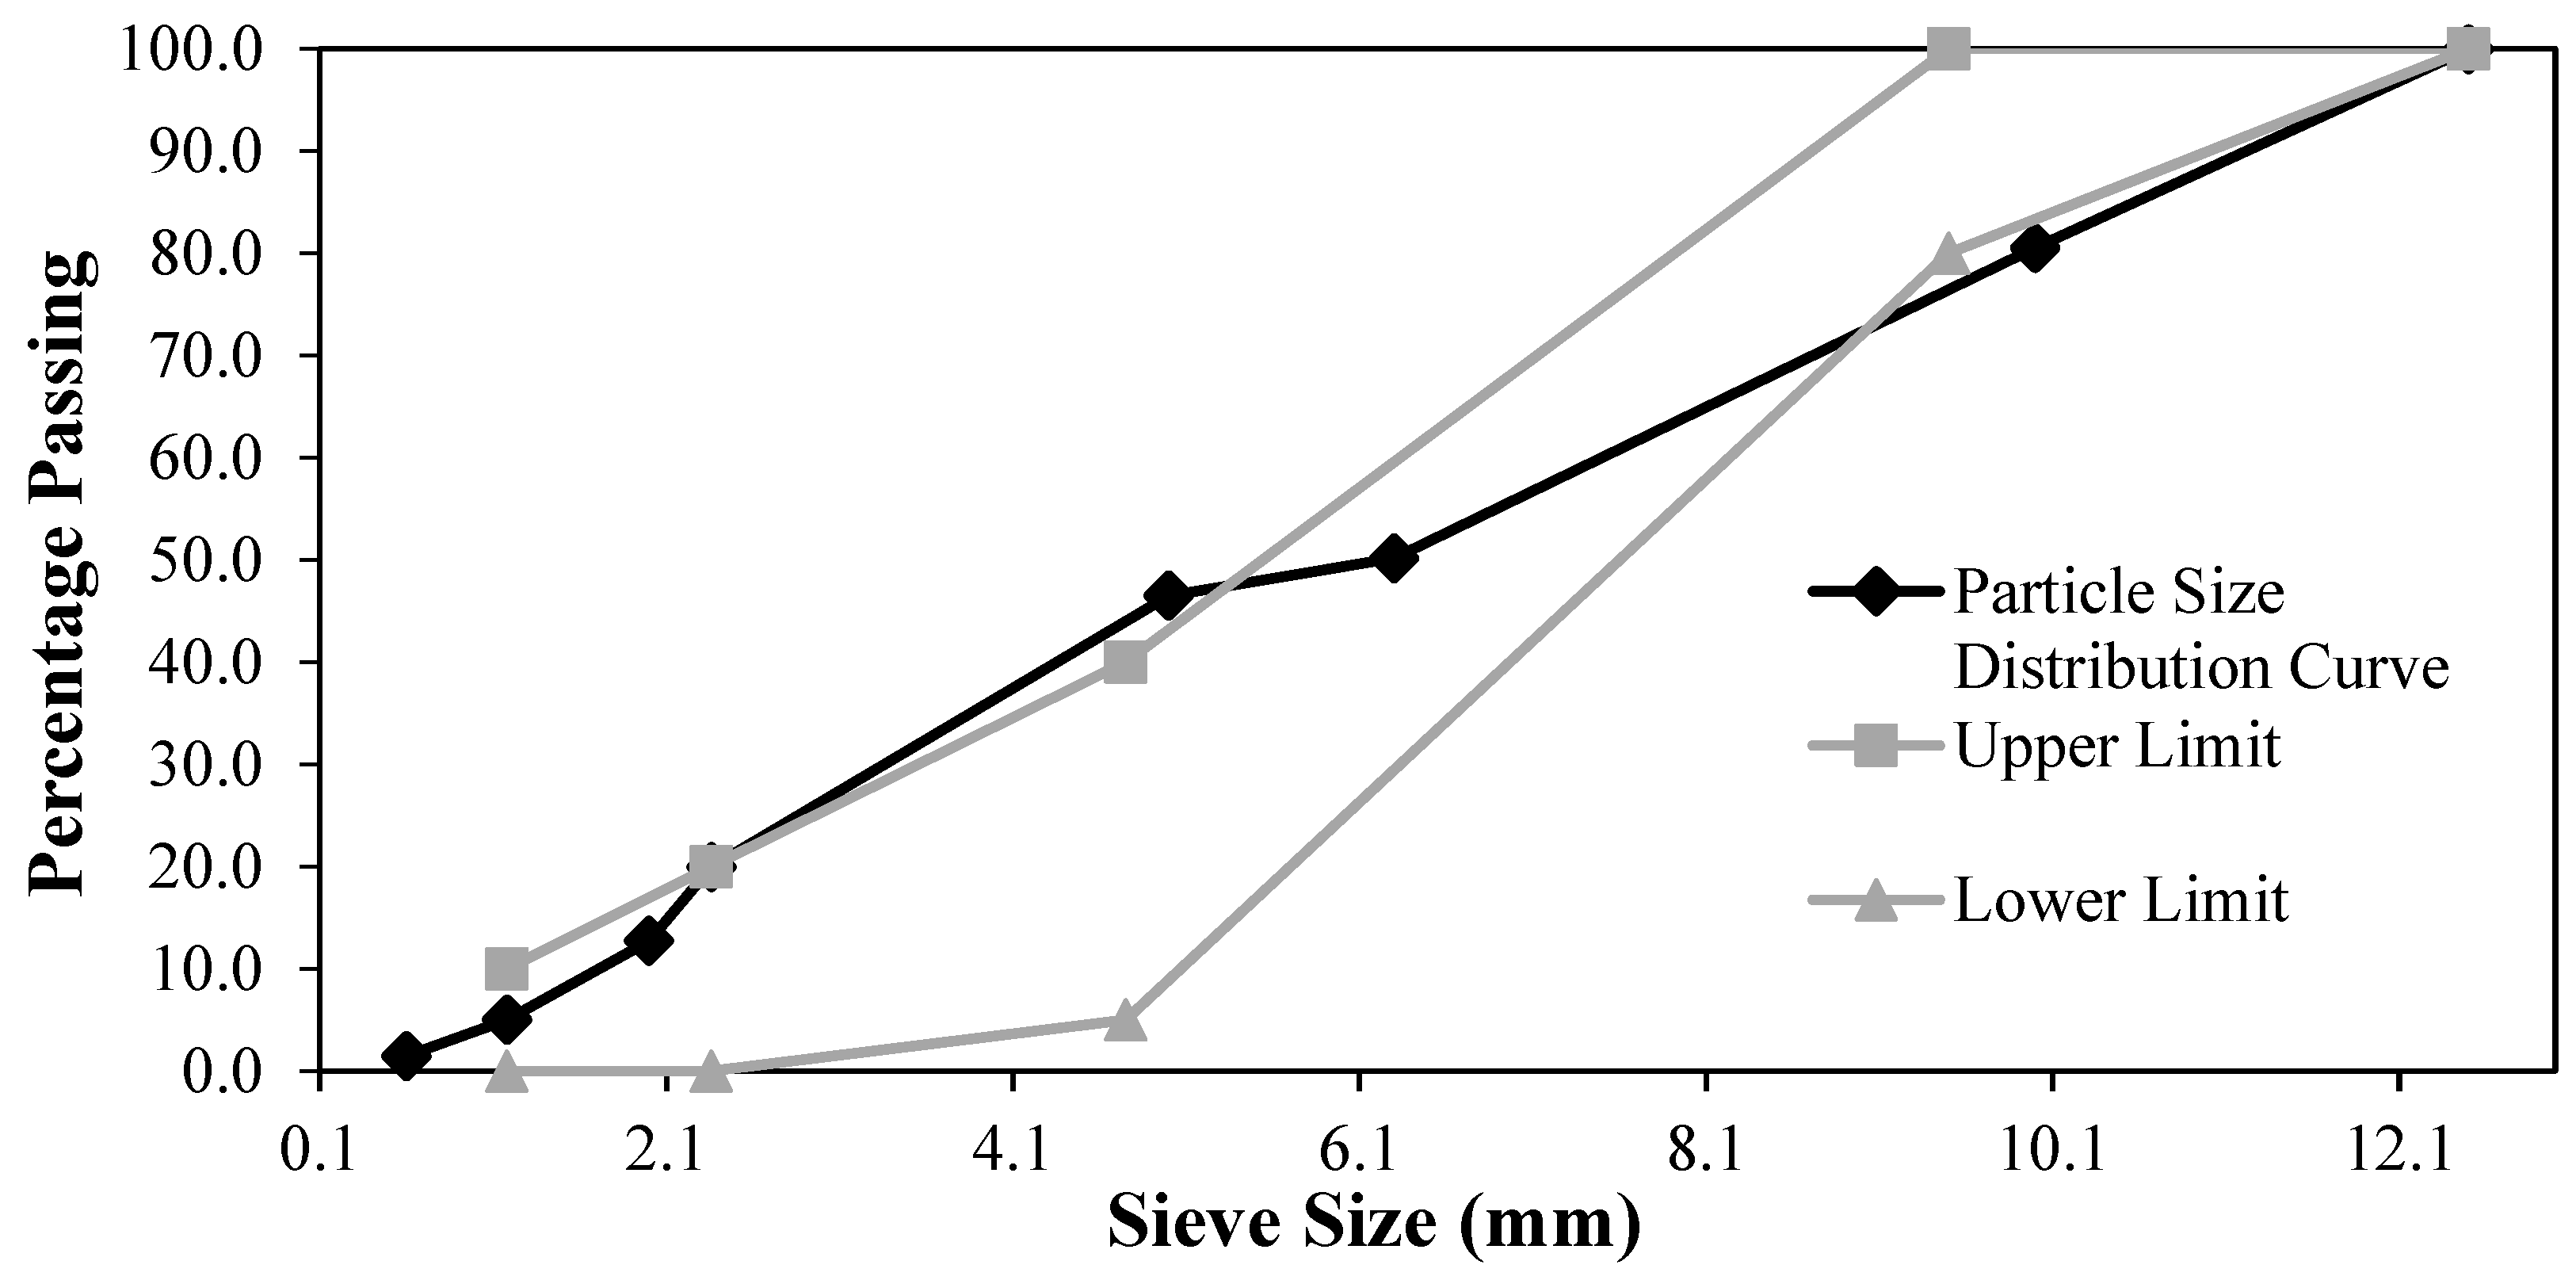
A sieve analysis test based on ASTM C136 was done in order to find out the particle size distribution of the coarse rubber particles. The particle size distribution curve is presented Figure 17. Furthermore, the limitation provided in ASTM C330 lightweight aggregates for structural concrete the upper and lower limited are drawn in Figure 17.
Modified Rubber Distribution
As mentioned previously the distribution of these rubber aggregates (specially the fine one) are not satisfying the requirements of the followed standard for lightweight aggregate. Therefore, to solve it is suggested to modify the distribution by mixing these sizes together at certain percentages to produce a satisfying distribution. This process started by testing different percentages of each rubber sizes until the standard distribution is satisfied Figure 18. Finally, after getting a good distribution for the rubber particles their specific gravity was calculated experimentally as 1.06.

3.3.2. Rubber Pre-Treatment Using NaOH Solution

The procedure used for applying this type of pre-treatment process stared by washing the rubber aggregates in tap water to remove any impurities and dust, soaking them in the 10% NaOH solution for half an hour, then the rubber were washed by water until their pH became 7 (to prevent any possible negative impact on the concrete durability), and finally, they were left away to get air-dried.

3.3.3. Concrete Mix Proportioning and Concrete Production

Mix Proportioning
Concrete proportioning of the control mix was undertaken based on the method provided by Building Research Establishment (BRE). Thereafter, the mineral and chemical admixtures were added based on specific percentages estimated from the information available in the current literature.
The second task after finding the mix proportion of the control concrete that satisfies the desired strength capacity and workability was to confirm its properties experimentally and then to calculate the amount of rubber to replace total aggregate (fine and coarse particles) by volume in concrete.
The rubber replacement percentages that will be used in this study are 15% and 25% with the codes 15RBC and 25RBC respectively which are based on the results of old researches that recommended a high amount of rubber aggregate in order to get a significant increase in the ductility, energy dissipation and damping ratio in comparison to the zero rubber concrete (ZRB). The material proportions for control and RBC mixes are shown in Table 10.
Concrete Production
Due to the high amount of binding materials required to produce high-performance RBC that includes significantly high amount of rubber aggregate the production stage followed the requirements of ultra-high-performance concrete standard ACI 239-18 in terms of mixing duration.
Therefore, concrete mixing procedure took in total 20 minutes. At the beginning it was started by dry mixing the fine material, for about 2 minutes to ensure distribution of the cement and silica fume and then the coarse particles were added to the mix and the materials was dry mixed for another 2 minutes. Thereafter the water was slowly added to the dry materials and the mixing continued for another 8 minutes, thereafter the superplasticizer with 25% of the water were and the concrete was mixed for 4 minutes and finally steel fibers were added to the mix and the concrete was mixed for 4 minutes until consistency was observed. Thereafter, workability was tested as suggested by ASTM C1611 for self-compacted concrete. Finally, ASTM C1758 standard practice was followed for making and curing of the concrete samples.

3.3.4. Testing the Fresh and Hardened Concrete Properties

The experimental tests that will be conducted to ensure the satisfactory of the properties of this concrete mix in the in fresh and hardened states together with the number of specimens to be tested are as shown in Table 11 including the standards that will be followed to conduct the experiment.
3.4.. Evaluating the Capability of Available Analytical Model in Predicting the Behavior of Rubberized Concrete
Since this thesis is proposing a new concrete mix with the use of coarse rubber particles for producing high strength concrete it is important to check the available constitutive models and to find out whether they can be used to predict the concrete behavior of not. In order to do this the expressions suggested by (Strukar et al., 2018) are going to be evaluated and check against the findings of the experimental study in this project. The selection of this model was based on the comparative study conducted by (Strukar et al., 2018) to review the capability of available models for predicting the behavior of RBC in compared to the suggested expressions.

3.4.1. Proposed Constitutive Model (Strukar et al., 2018)

In fact, Strukar et al. (Strukar et al., 2018) have proposed an improved constitutive model to the available ones for predicting the performance of RBC. In their study many data obtained from an experimental work and from different studies on properties of RBC that includes steel fiber with various percentages sswere analyzed and the following model was proposed for predicting the properties of RBC.
Input parameters:
f c : Compressive strength obtained on reference normal concrete cubic specimens.
ε e l : Proportionally limit at 0.4 f c obtained from a stress-strain curve of normal concrete without rubber aggregated.
ρ v r : Relative volumetric rubber ration.
d g , r e p l : Size of replaced mineral aggregate considered with factor λ . F a c t o r λ 2.43 d g , r e p l   ϵ   0,5 2.90 d g , r e p l   ϵ   0 , d g , m a x 2.08 d g , r e p l   ϵ   5 , d g , m a x Calculation of concrete properties:
  • Peak compressive stress:
f r c = 1 1 + 2 × 3 λ ρ v r 2 3 2   f c
  • Tangent elastic modulus:
E r c = 0.4 × f c ε e l × e x p ( λ ρ v r )  
  • Coefficient for calculating strain at peak stress:
ν = f r c 17 + 0.8
  • Strain at peak stress:
ε r c = f r c E r c υ υ 1
  • Secant modulus of elasticity:
E p = f r c ε r c
  • Coefficients of linear equation:
φ = 35 × ( 12.4 1.66 × 10 2 f r c ) 0.9
k = 0.75 e x p 911 f c
  • Modified material parameter:
ρ m = 1.02 1.17 ( E p / E r c ) 0.74 + φ + k ; 0 < ε < ε u
  • Stress factor to obtain the constitutive curve:
σ f r c = ρ m ( ε / ε r c ) ρ m 1 + ( ε / ε r c ) ρ m ; 0 < ε < ε u

3.5. Free Vibration Behavior of Concrete

The aim in this test is to measure the vibration properties of RBC mixes. The followed procedure was adopted from (Zheng et al., 2008) with some modifications on the supporting conditions of the specimens from simply supported beam to a cantilever beam for the sake of simplifying the analysis stage. The experimental setup is shown in Figure 22 and Figure 23. As part of this test an accelerometer was developed and coded in order to handle the vibration data sampling.

3.5.1. Accelerometer Development

The main configuration that was developed in this study for data sampling and real time interpretation of the results was done by using an Arduino based circuit that provides both an accurate and low-cost setup.
Developing an Arduino based circuit
In order to develop this circuit, the following parts were assembled together:
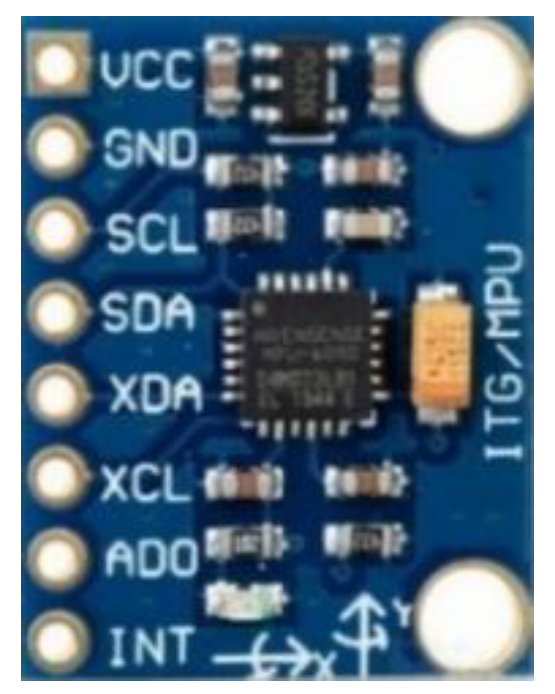
  • MPU-6050 Accelerometer with a range of ±2g and a sampling frequency of 200 Hz (Figure 19).
  • Arduino Uno R3 microcontroller (Figure 20).
  • Jumper wires to connect the sensor to the microcontroller using the configuration in Figure 21.
Communication between the sensor and the microcontroller:
Arduino IDE (Integrated development environment) was used to write the C++ program and dump into the Arduino board. The Arduino program contains two main parts the first one is related to the acceleration sensor and the second one is related to the data acquisition. Functions such as setup, loop and printData were used in the Arduino program. The name of the functions implies their purpose and activity where, setup () sets up the Arduino hardware, such as specifying which I/O lines that are planned to be use, and whether they are inputs or outputs, the loop () function is repeated endlessly when the Arduino runs and printData sends the sensor reading to the data acquisition tool implemented in Arduino IDE.

3.5.2. Data Filtering for Noise Reduction

In fact, the recorded data have undergone a pre-processing stage to reduce the noise emerged from the uncontrollable environment and improve their reliability. The followed method is called moving average filter which is composed of taking the average of a certain number of outputs and subtract that value from the readings of the sensor. Due to its simplicity this method is considered the most common digital filter (Smith, 1997).

3.5.3. Damping Ratio

The logarithmic decrement technique was followed by applying a small-amplitude free-vibrations on the beam to extract the inherent member damping capacity for ten times then the average of the values was taken for each mixture. The calculation of the damping ratio was done using the following formula (Chopra, 2001).
ζ = 1 2   π j l n u i u i + j
where j is number of cycles and u i and u i + j are the peaks at i and   i + j cycles.
In this test the number of cycles were taken as 10 for all cases to reduce the variation over the range of data.
Natural Frequency and Dynamic Modulus of Elasticity
In fact, Excel 2016 and SeismoSignal software package (Antoniou, Pinho, & Bianchi, 2018) were used to produce the fast Fourier transform (FFT) that converts the recorded data from the time domain to the frequency domain and to calculate the natural frequency of each specimen. Thereafter, a way to calculate the dynamics modulus of elasticity based on the obtained frequency was provided and compared to some prediction models shown in equations (3.13 to 3.15) for normal concrete to ensure the reliability of the collected data.
In fact, the dynamic modulus of elasticity will be calculated by rearranging the expression of the natural frequency below
f n = 1 2 π k M        
    E = 4 π 2 f n 2 q L 4 12 I
where k = 12   E I L 3   and M = q L   for cantilever beam with distributed mass q .
Selected prediction models for the dynamic modulus of elasticity:
Lydon and Balendran 1986:
E d = 1.2 E c
BS 8110-2:1995:
E c = 1.25 E d 19
Popovics 1975:
E c = 446.09   E d 1.4 ρ c

3.6. Investigating the Performance of Reinforced Rubberized Concrete Jacketing for Retrofitting RC Structures

This section will describe the methodology of investigating the use of RBC jackets and members for seismically retrofitting RC structures by studying its contribution to behavior of strengthened buildings. As part of the investigations finite element (FE) RC structural models will be constructed in ETABS and will be analyzed using NRHA procedure to assess the performance of the proposed model in comparison to the control model.

3.6.1. Selected Building

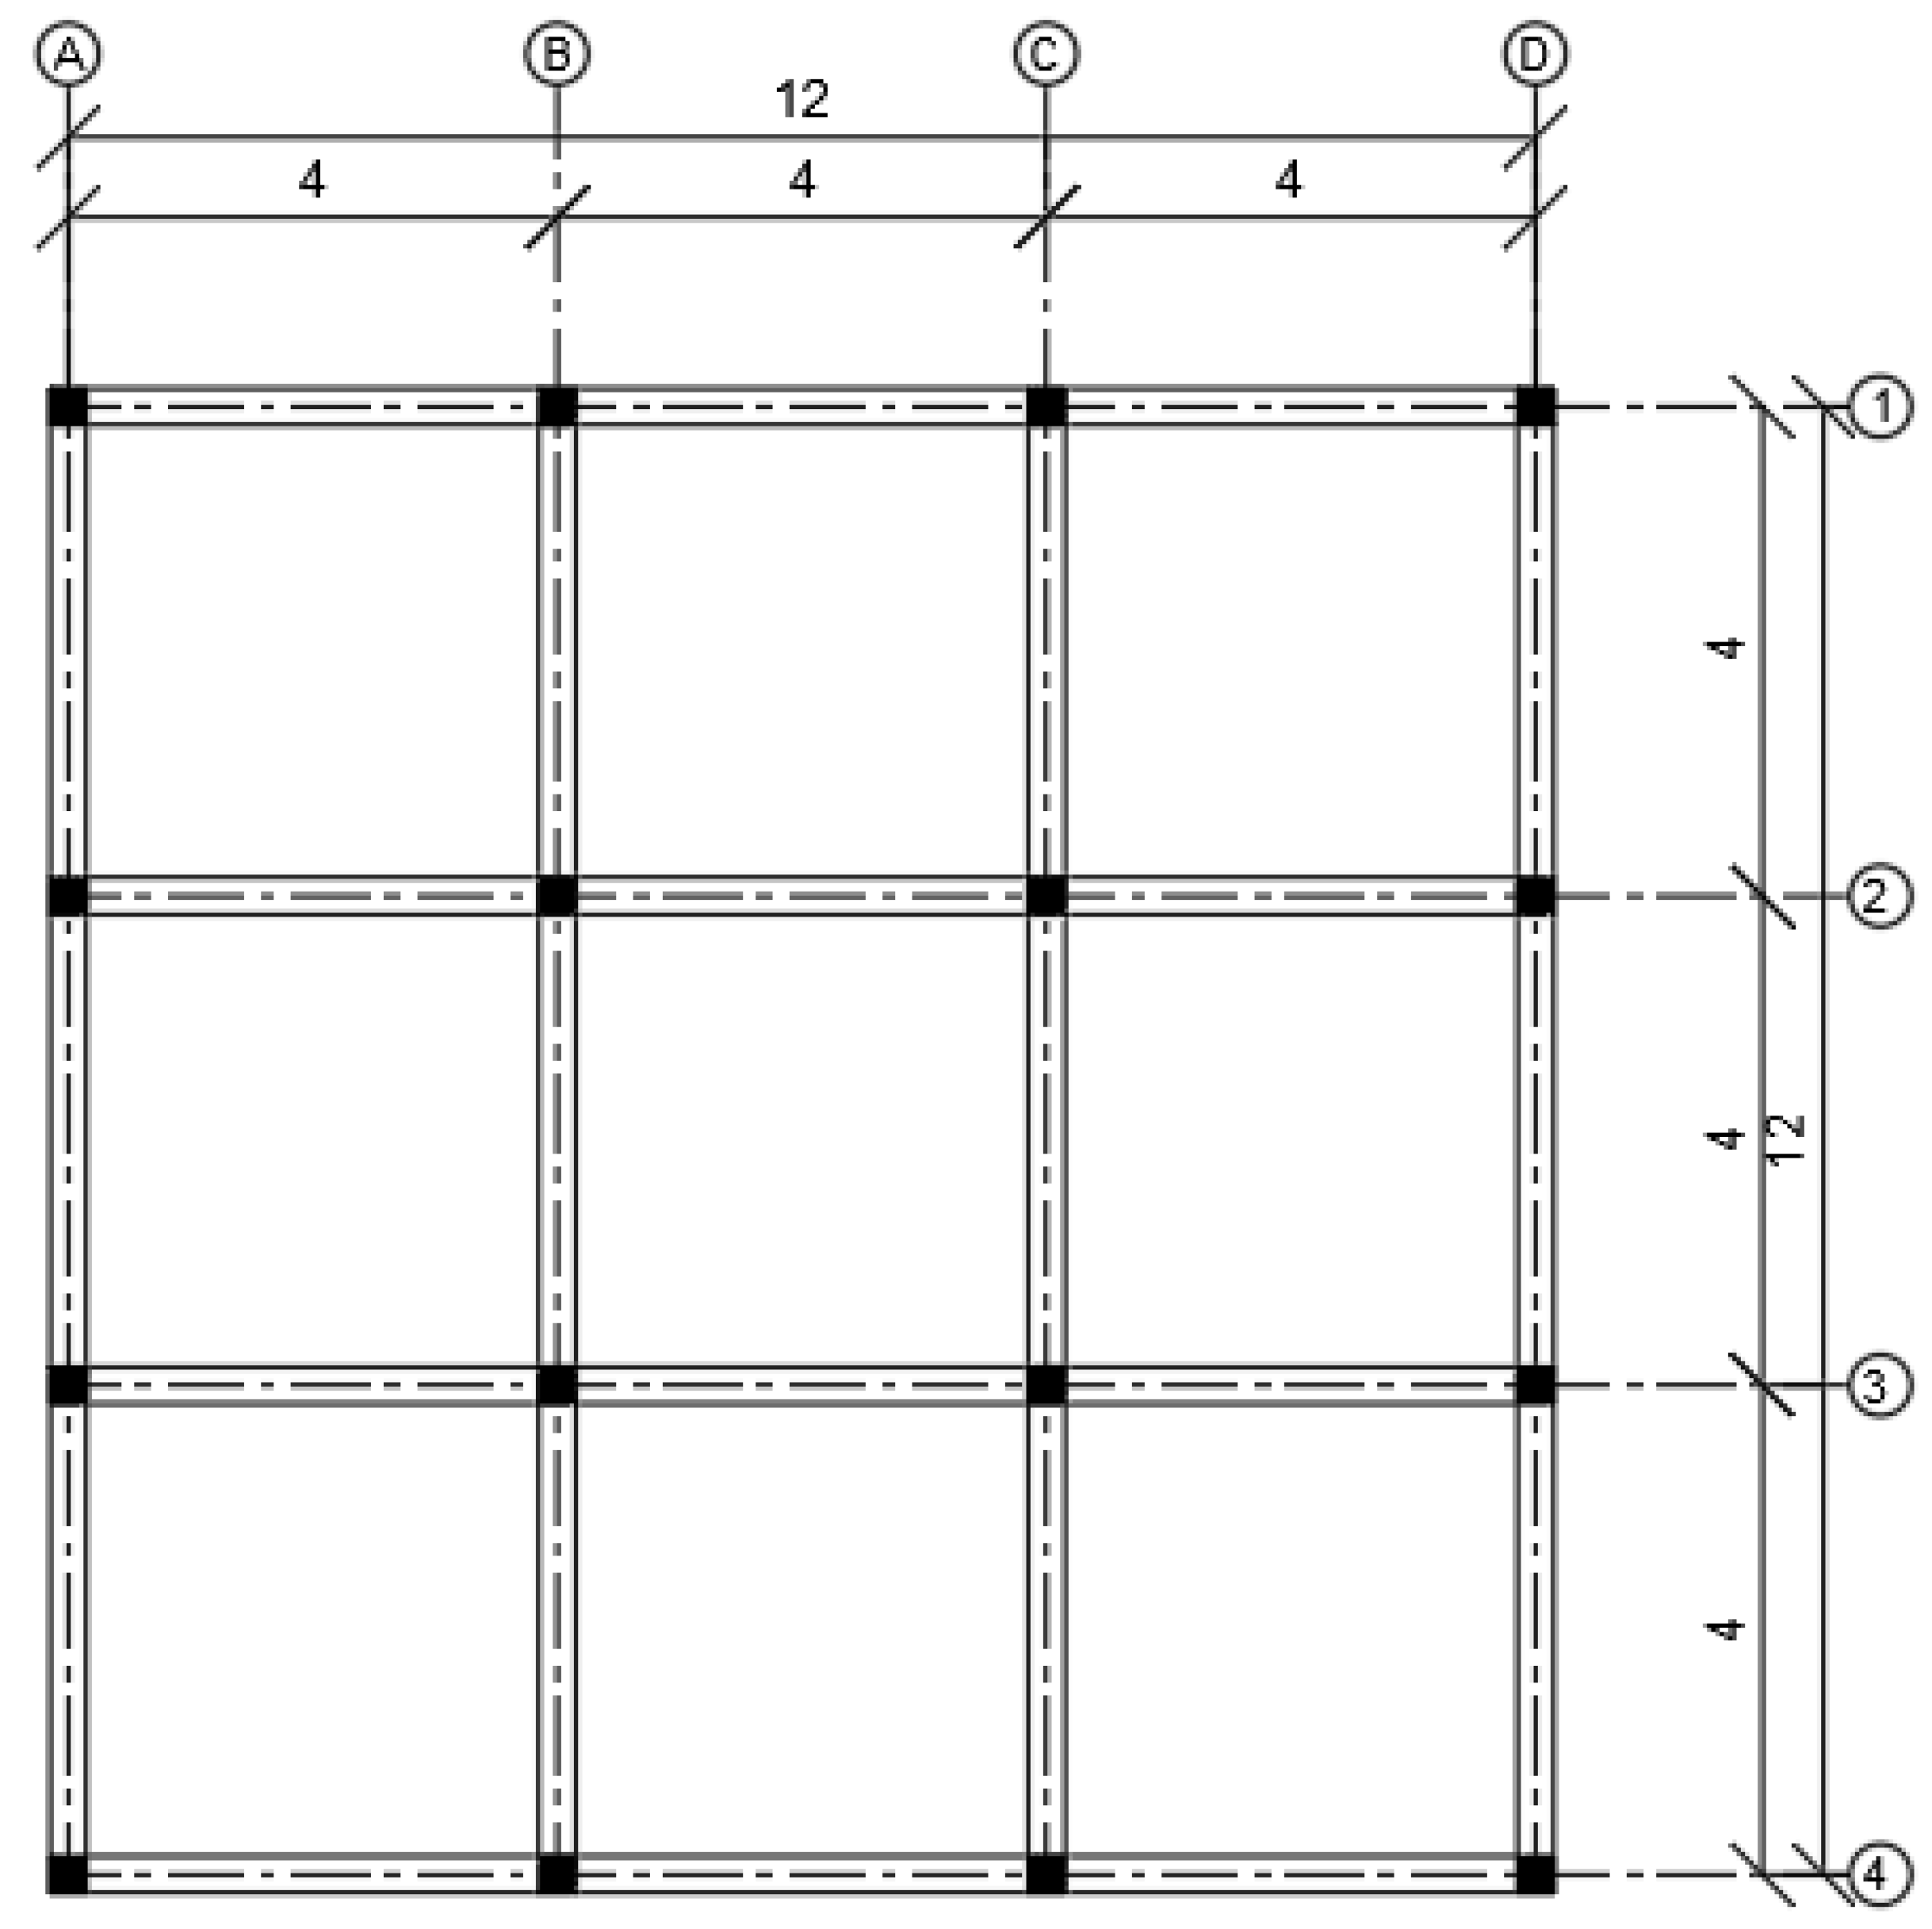
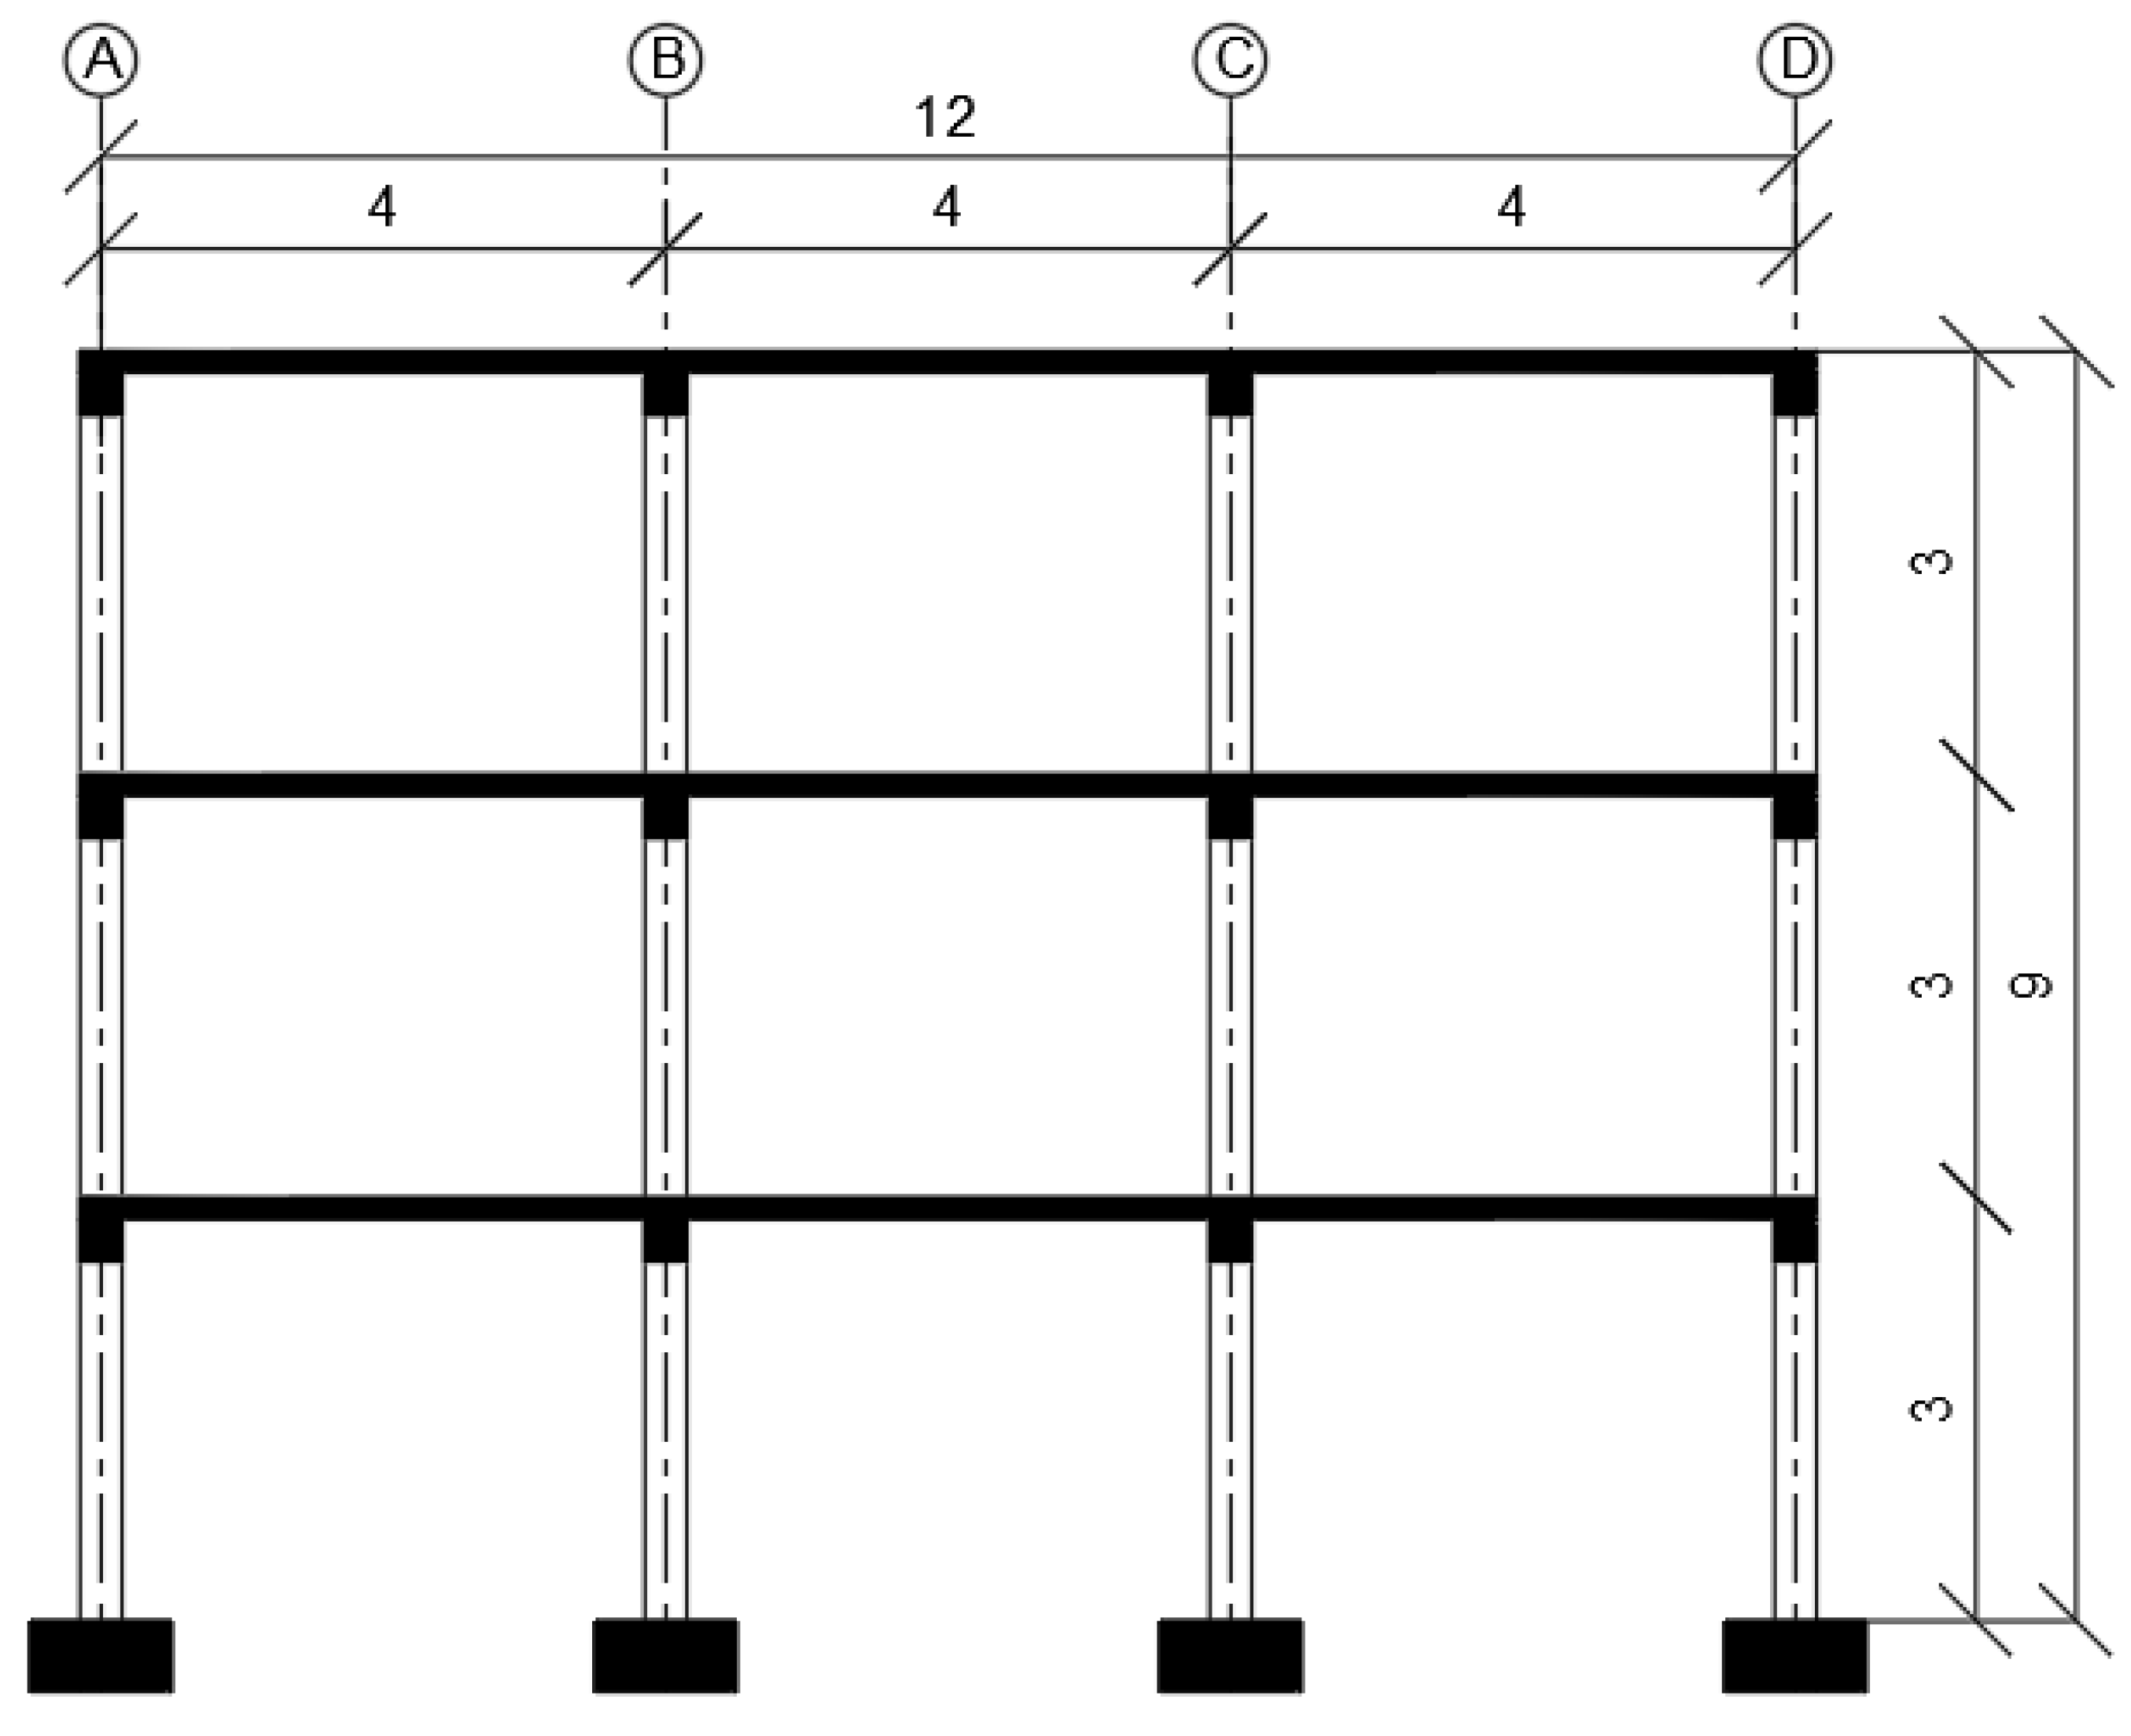
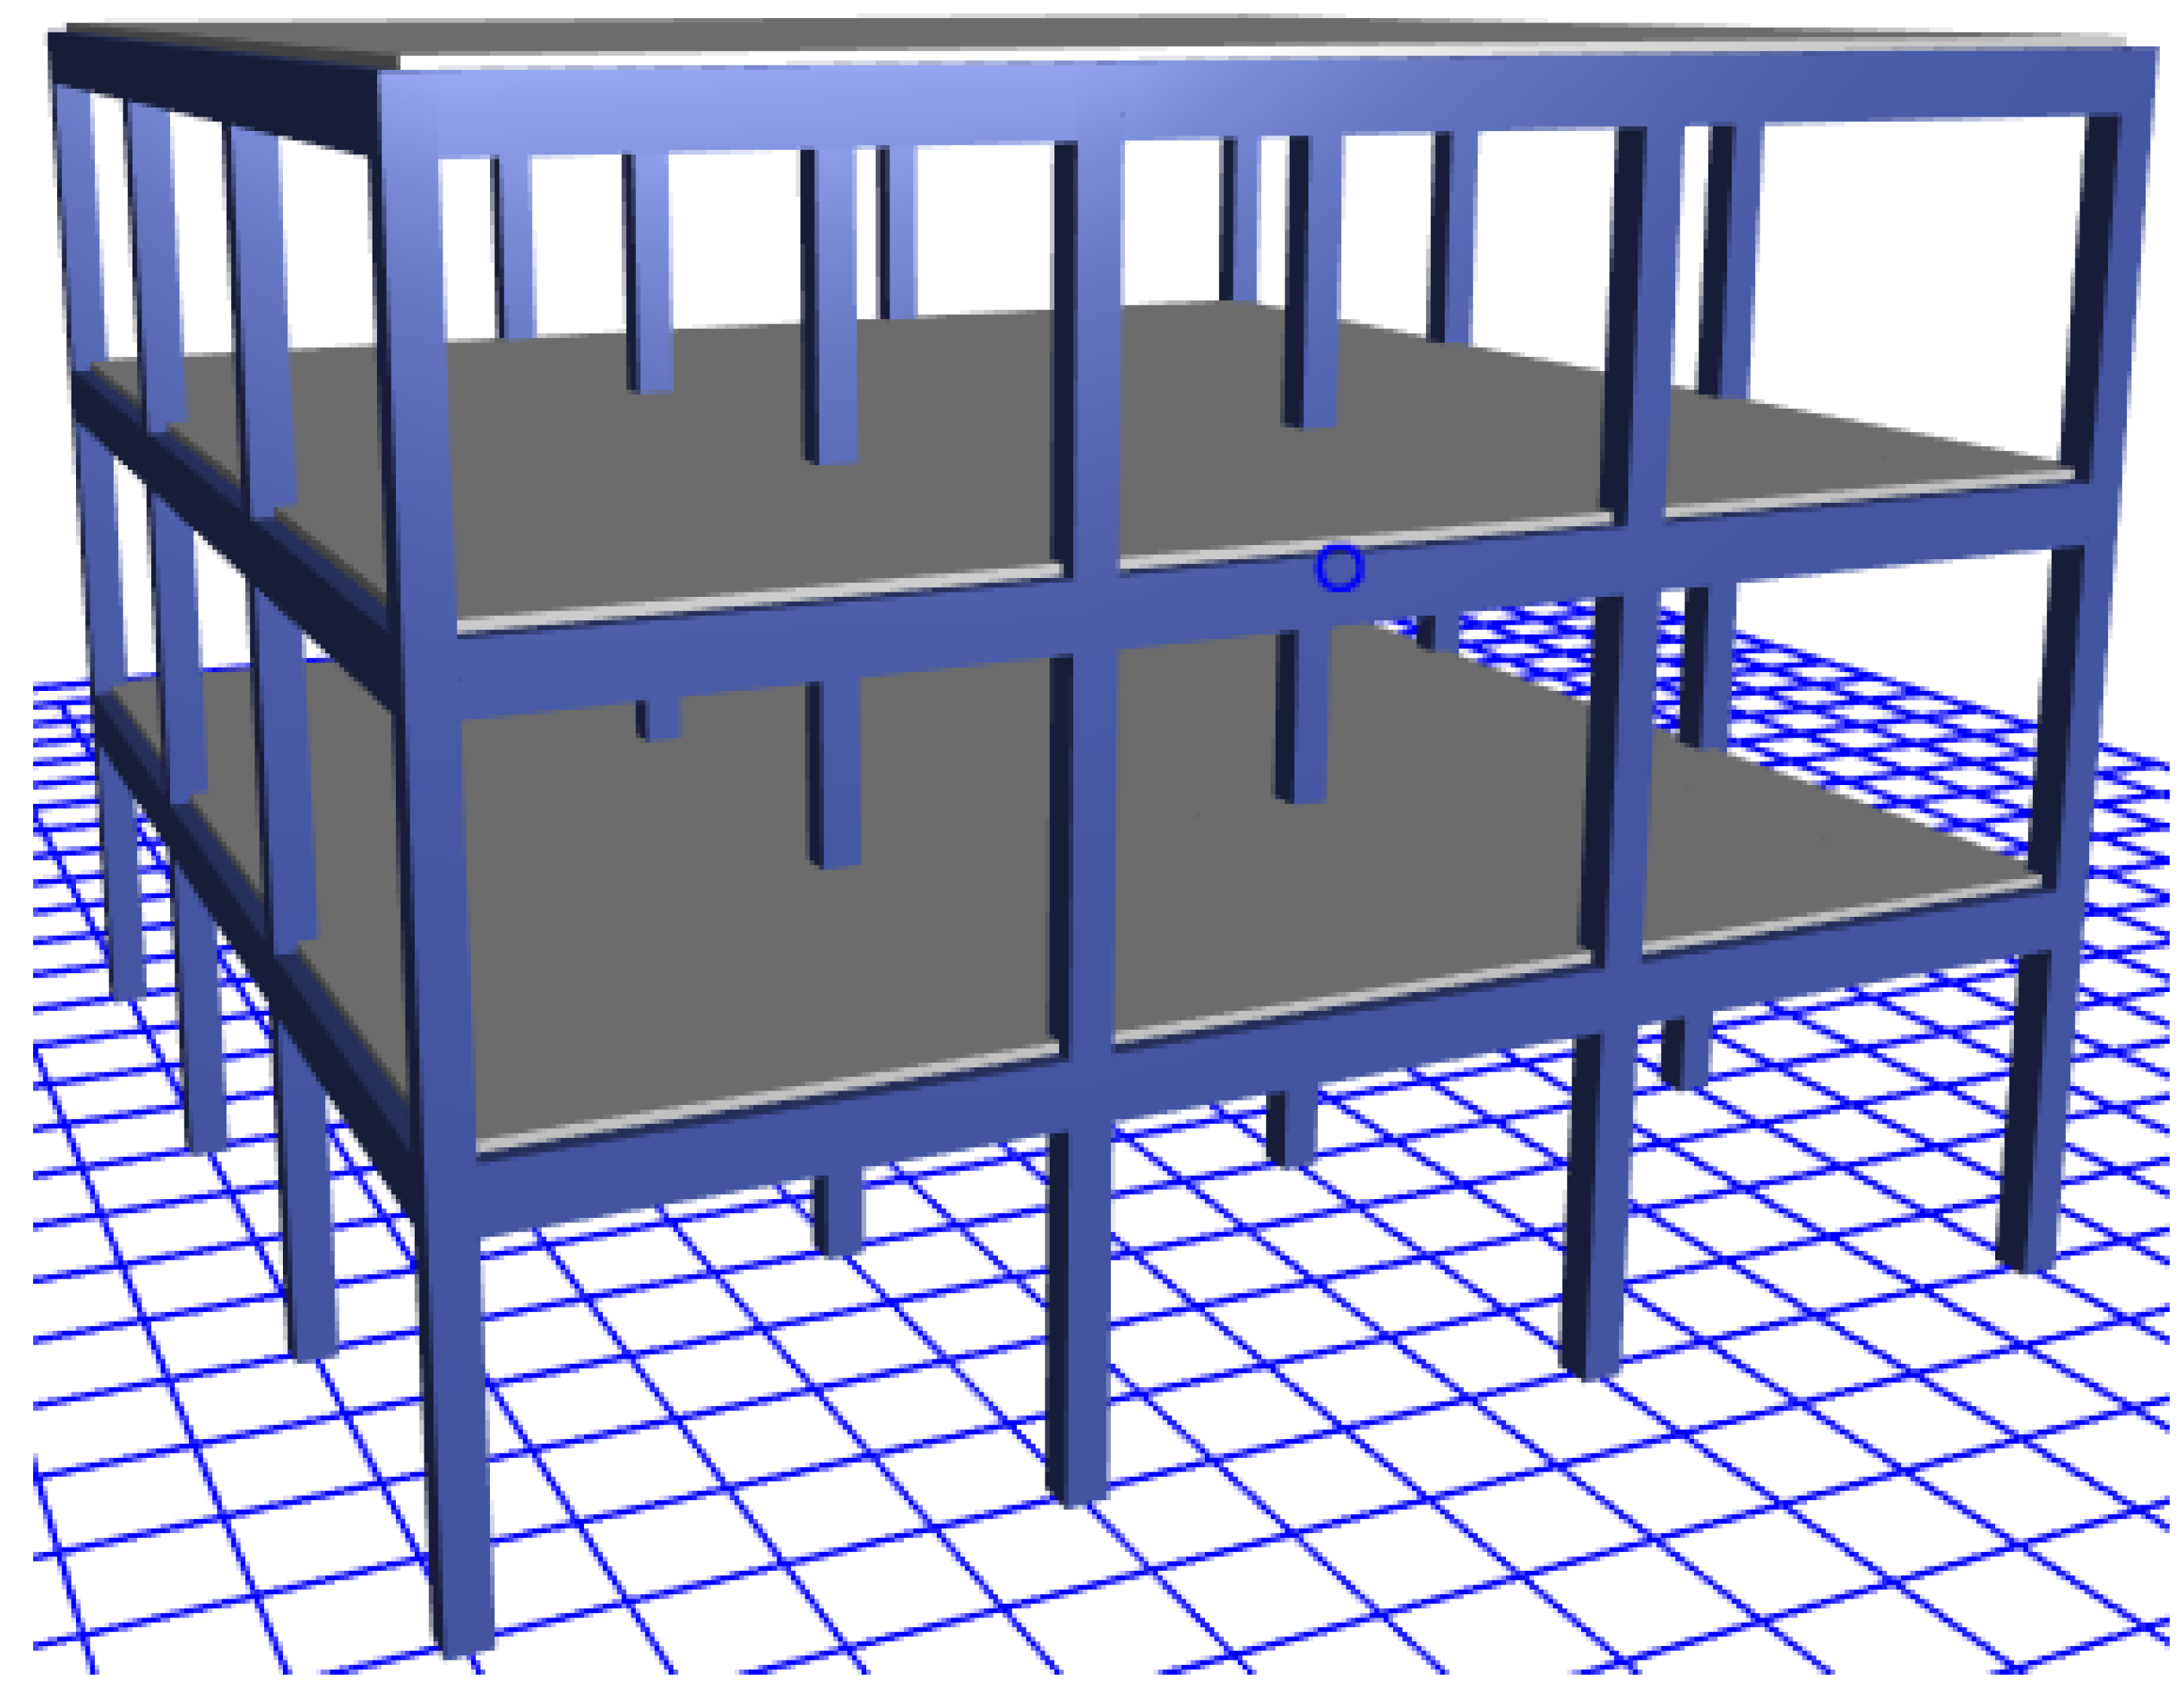
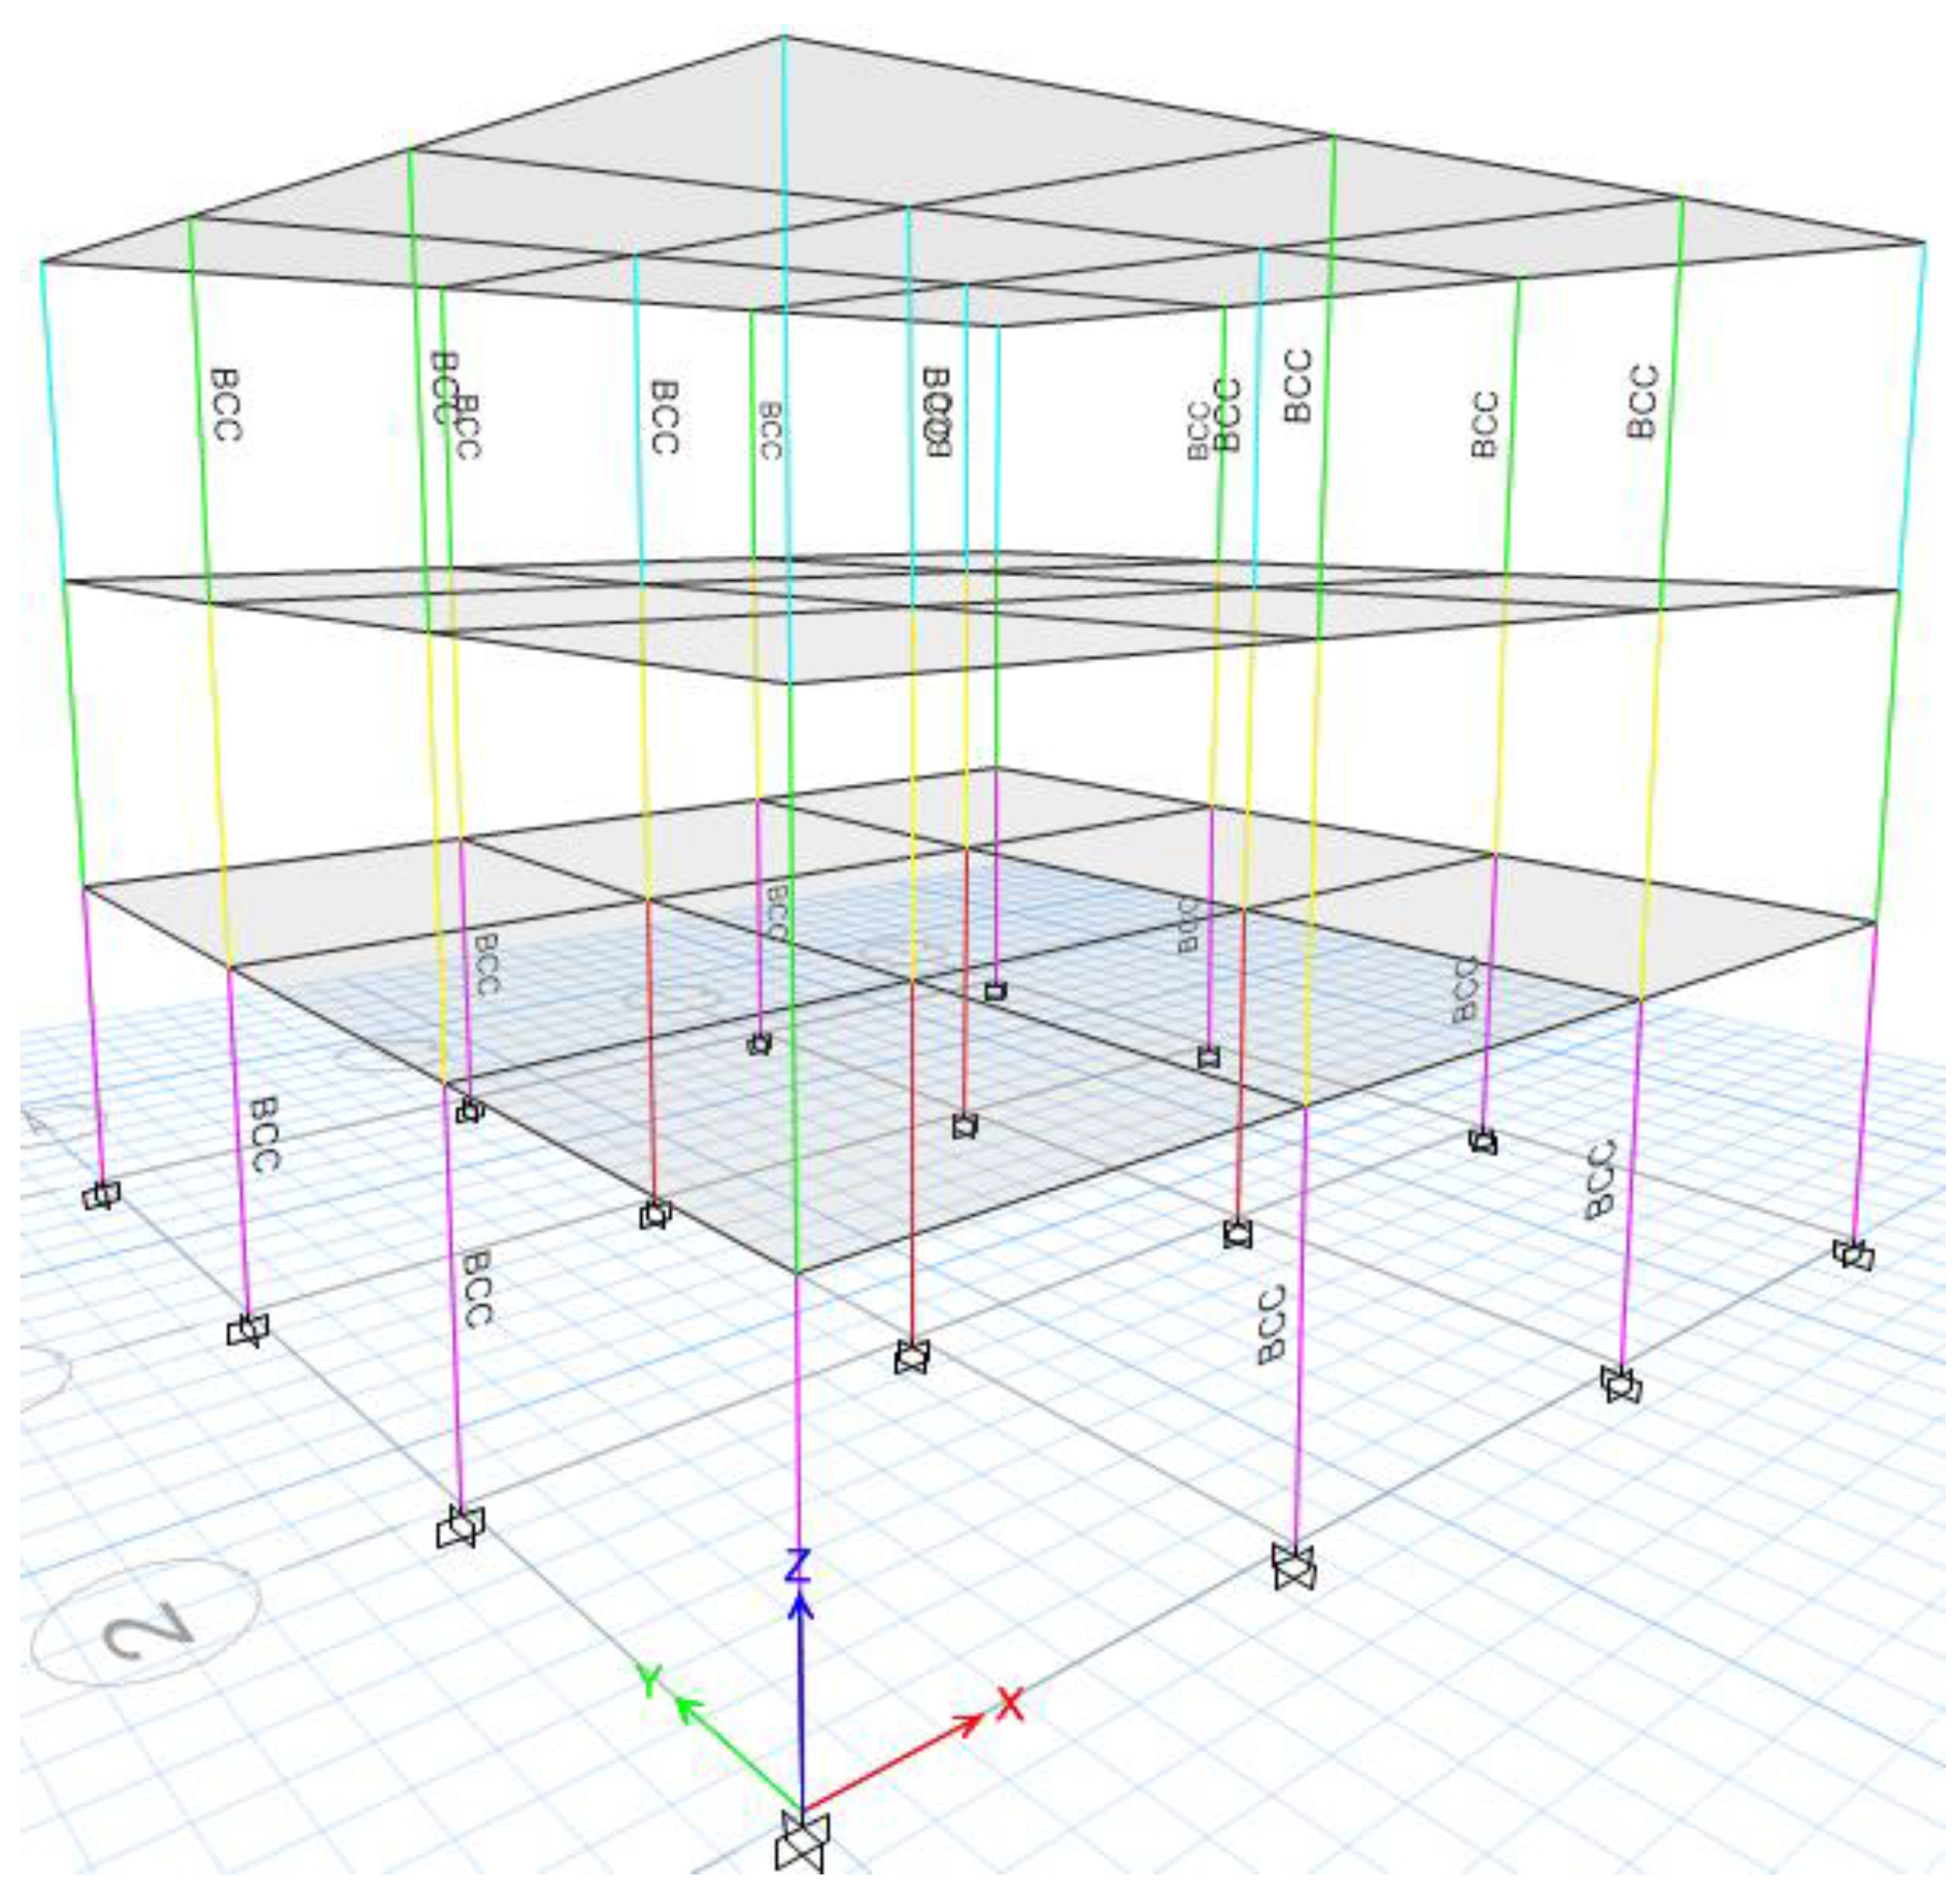
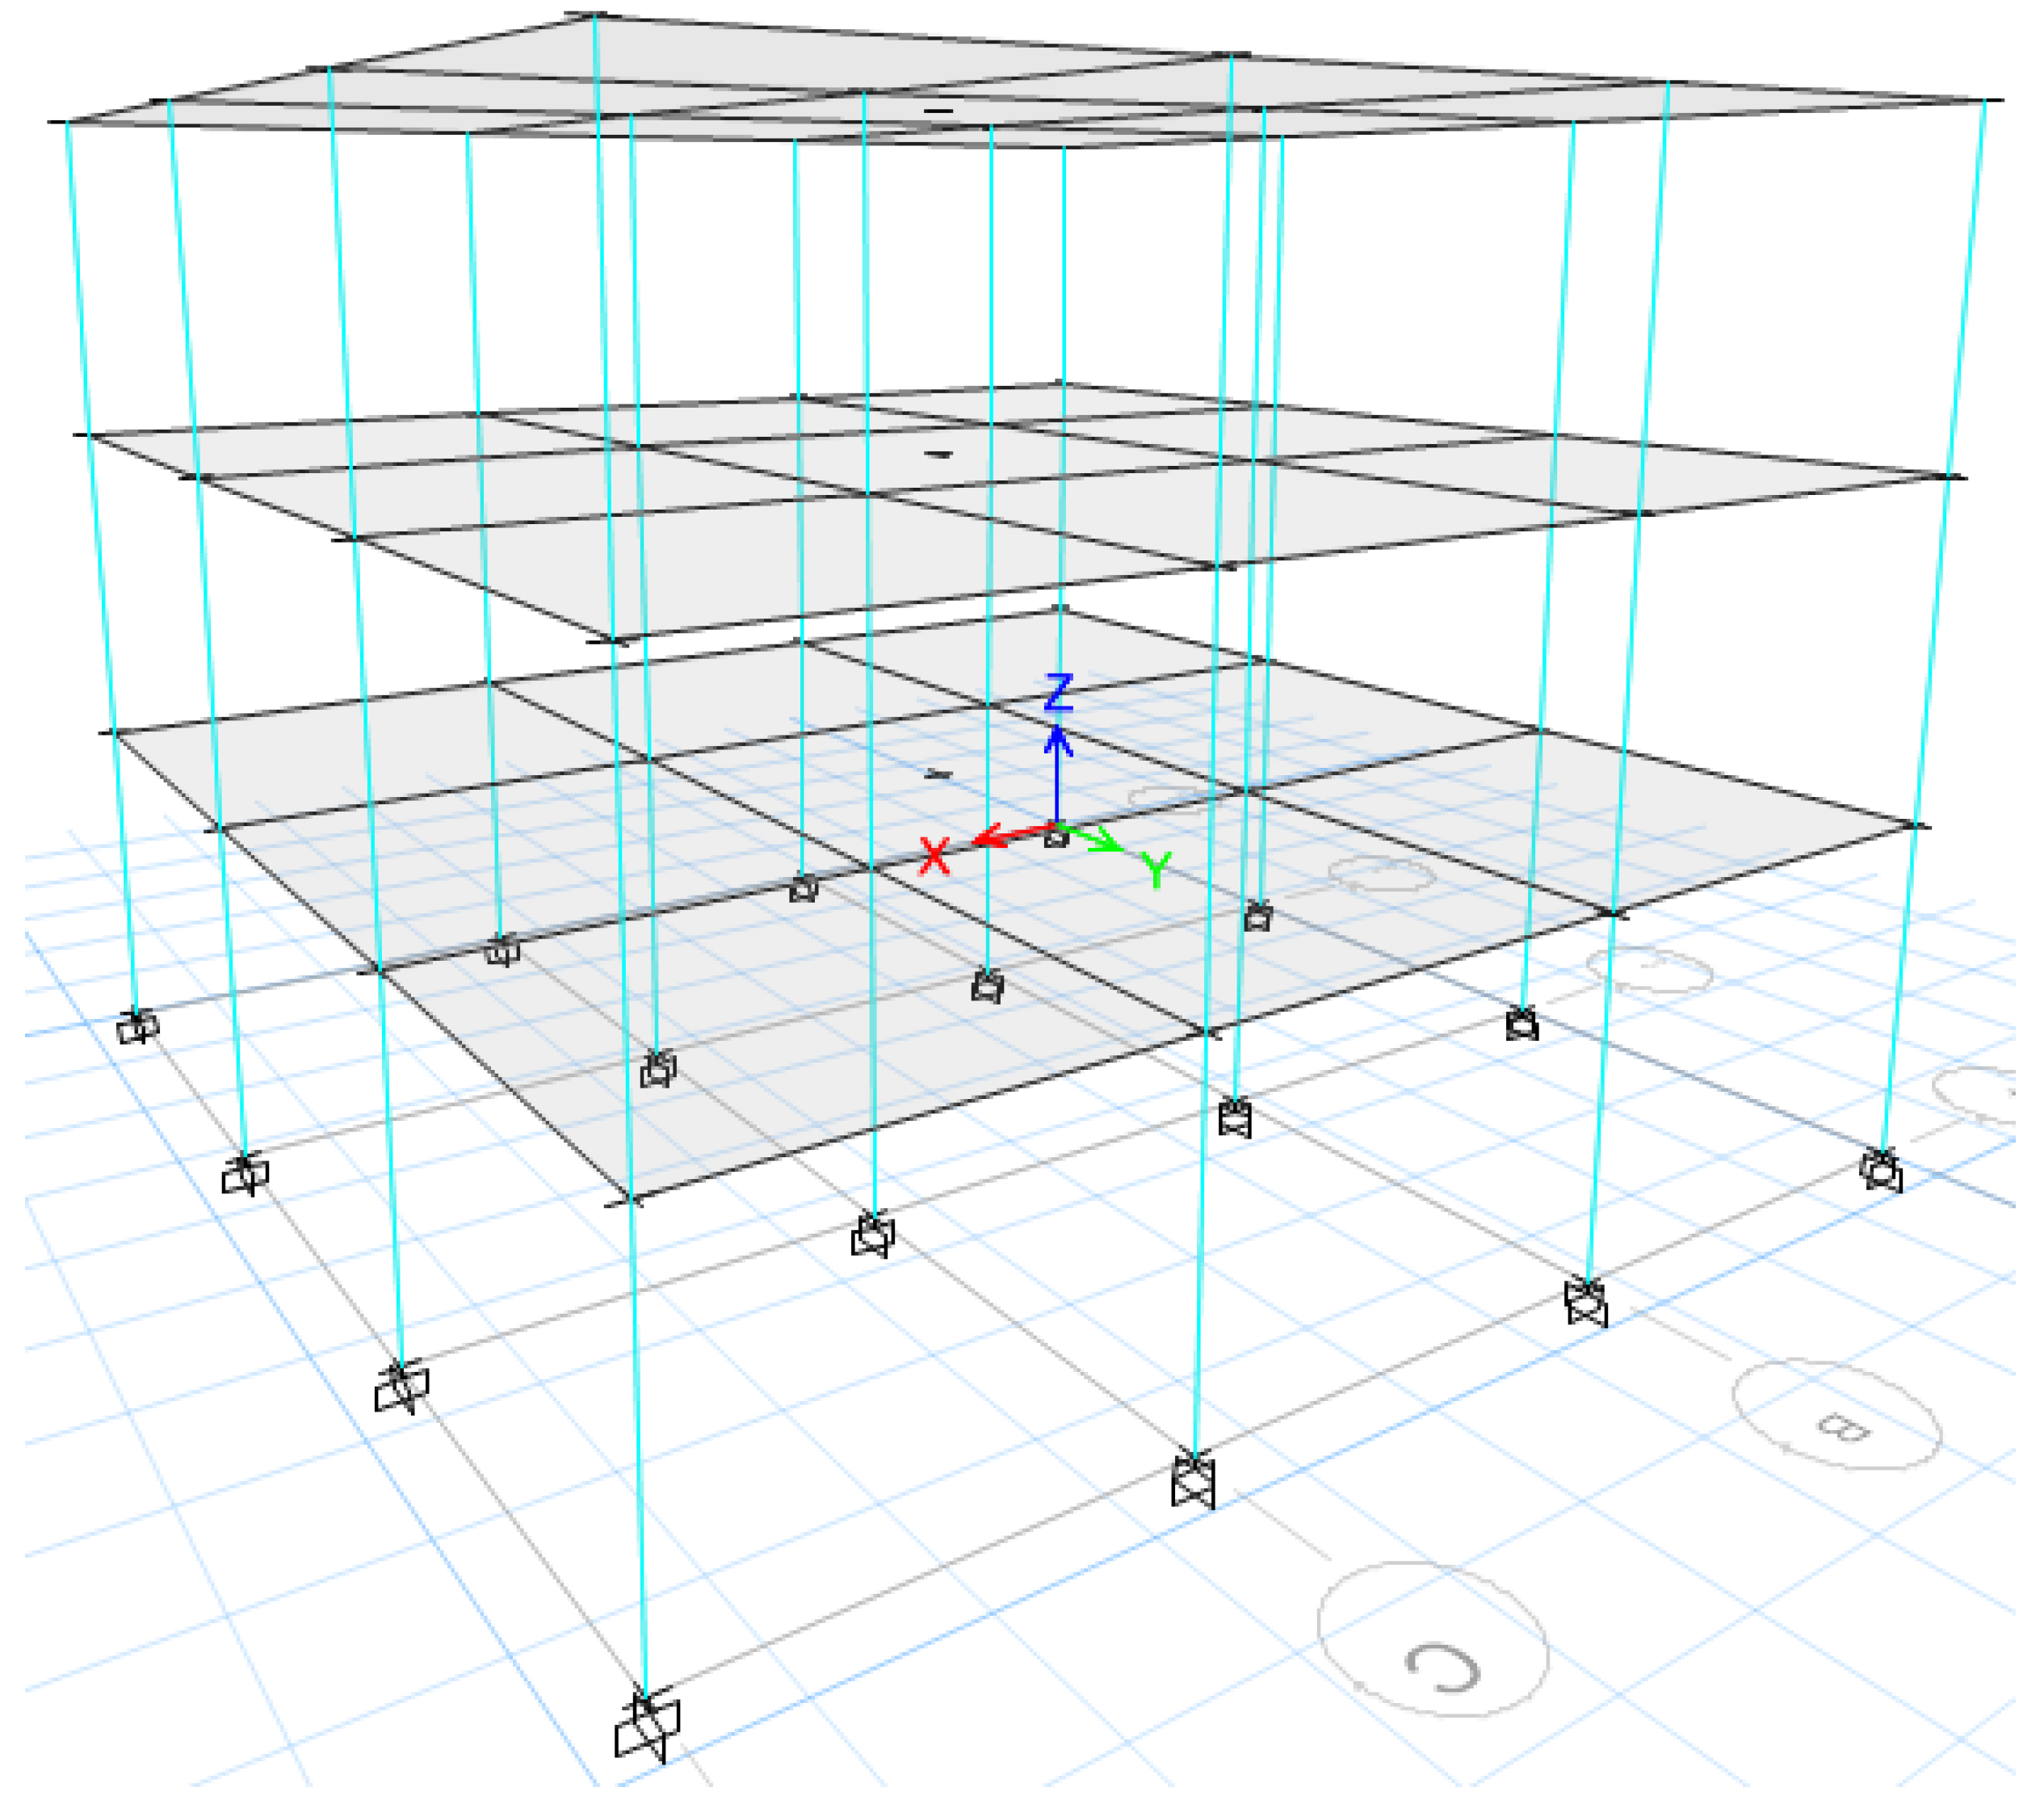
The studied model is a three-story low rise RC building composed of four moment resisting frames in each orthogonal direction as shown in Figure 24 and Figure 25. The length, width and height above the ground are 12, 12 and 9 m. respectively. It was assumed that the building was designed and constructed during the early 1970s under the applications of gravity loads only without applying any lateral loads to design the lateral resisting system. Furthermore, to the location of the building is selected to be in a high seismicity region which makes the building a vulnerable structure to many earthquake shaking intensities. Therefore, at the beginning the investigations will start by finding whether the building will meet the requirements of the current codes of practice for concrete ACI 318-14 and for seismic loads ASCE 7-16. Thereafter, the performance of the bare structure (BS) and the suggested retrofitting will be examined using nonlinear response history analysis approach to find out the effects of strengthening using RBC jacketing on solving the deficiencies of the building and to compare it to other concrete jacketing solutions.

3.6.2. Finite Element Modeling and Analysis Methods

As mentioned previously the FEM and analysis will be performed using ETABS. The modeling stage in this study was carried out using the criteria provided in section 12.7 of ASCE 7-16 (Figure 26). As part of the modeling stress-strain relation and damping ratio of normal and RBC for jacketing were specified to conduct the numerical investigations. Furthermore, column section and jacket reinforcements were modeled using a check-based approach so that the steel ratio will not differ from one case to another meaning that the section reinforcements were kept constant among all cases. Thereafter, both ELFM and NRHA methods were defined based on ASCE7-16 provisions where NRHA followed the (FNA) procedure.

3.6.3. Selected Models for Analysis

As part of the investigations, seven different models (Table 12) will be analyzed to assess the performance of the RBC from two different perspectives. The first one is to find whether jacketing using RBC is capable for improving the performance of the BS and removing the deficiency points in the frames. The second one is to find whether using RBC and facing some properties reduction is worth to be applied, this is going to be assessed by comparing the behavior of RBC models and the control concrete models using two criteria the constant jacketing thickness and the constant frequency to evaluate the effects of adding rubber to concrete on the stiffness and energy dissipation of the bare model respectively.

3.6.4. Definition of Frame Properties

This section will include properties of the frame sections and the structure in general that will directly affect the analysis such as material properties, frame section dimensions, seismic parameters and plastic hinge properties.

Material Properties

The building original structural system was assumed to be constructed using concrete class C16 and steel class S420 with the properties shown in Table 13. The results of the material tests described in the previous sections will be used to in defining the RC jacket. Furthermore, the default defined properties of concrete for the strengths similar to 15RBC and 25RBC will be used to investigate the performance of similar strengths jacketing models.
Structural Elements Dimensions
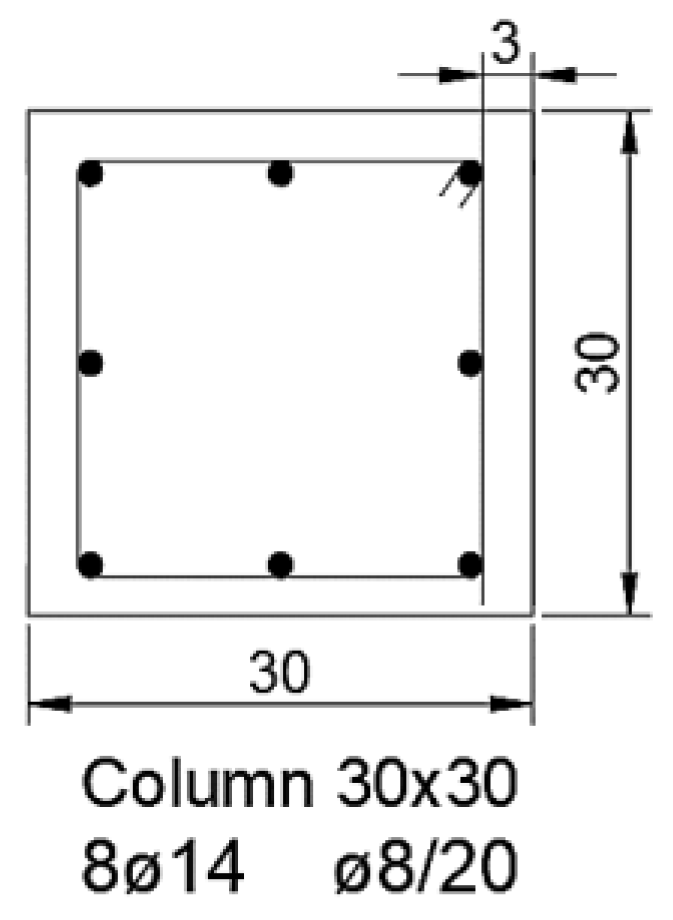
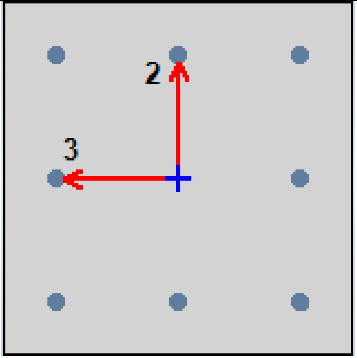
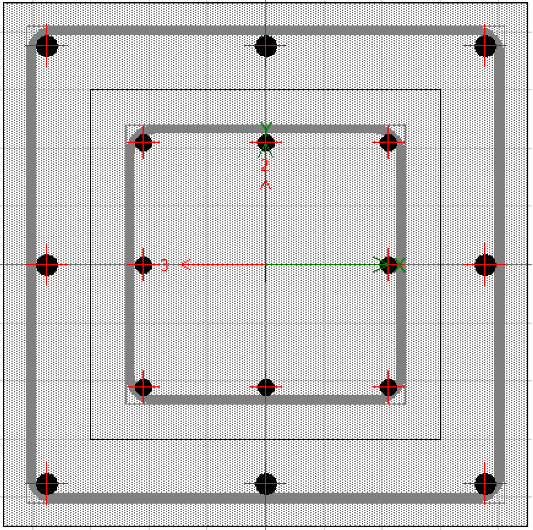
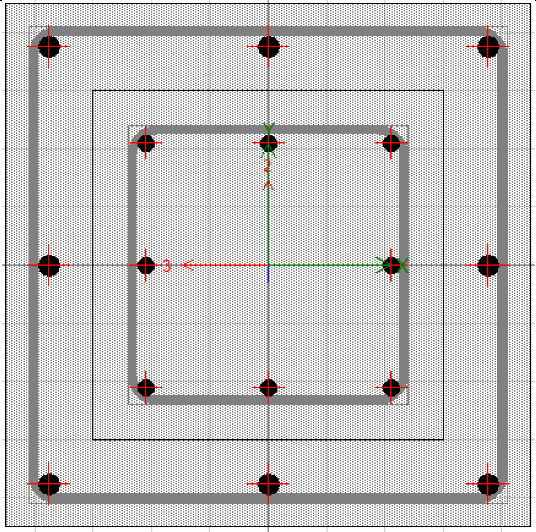
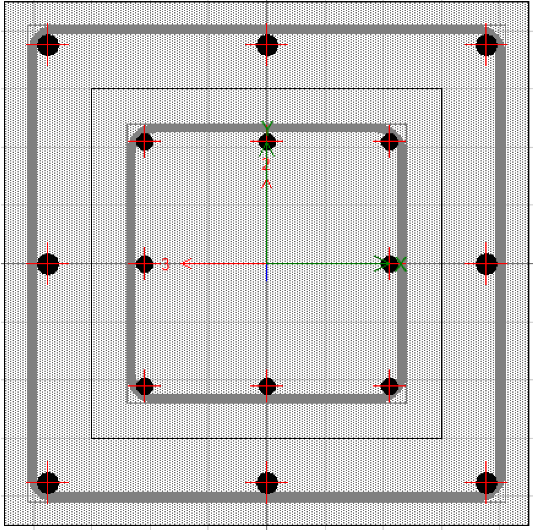
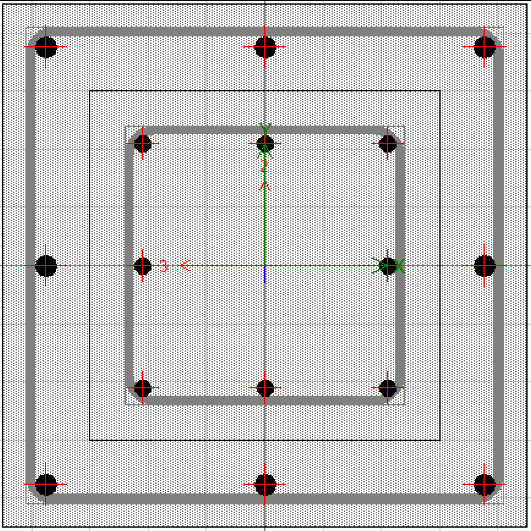
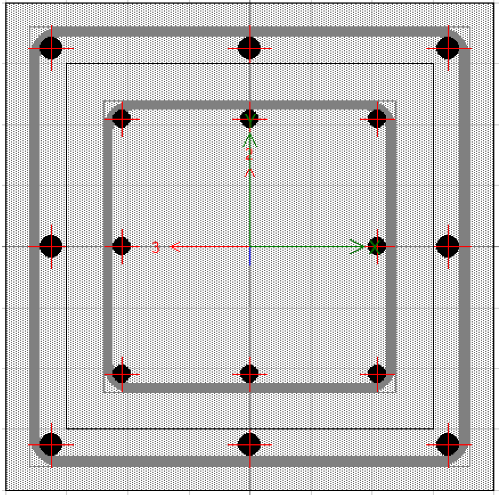
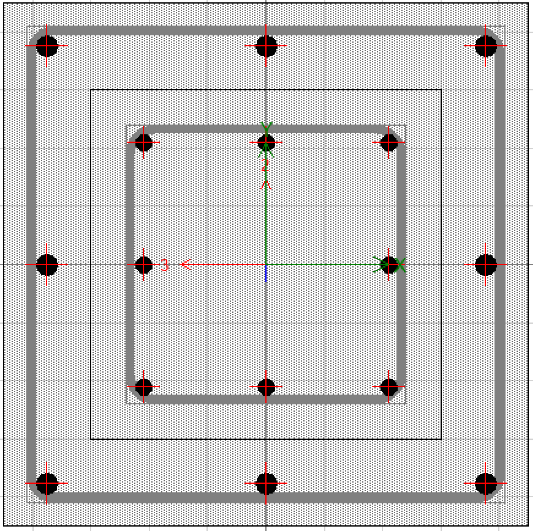
The structural system of the building consisted of columns and beams only assembled to form four frames each divided into three 4 m spans in each direction. The dimensions of the structural system are shown in Table 14 and the detailing of the column are shown in Figure 27.
Site Class
The site class of the building was assumed as site class D which means that the soil is stiff with a shear velocity between 183 m/sec and 366 m/sec.
Seismic Parameters
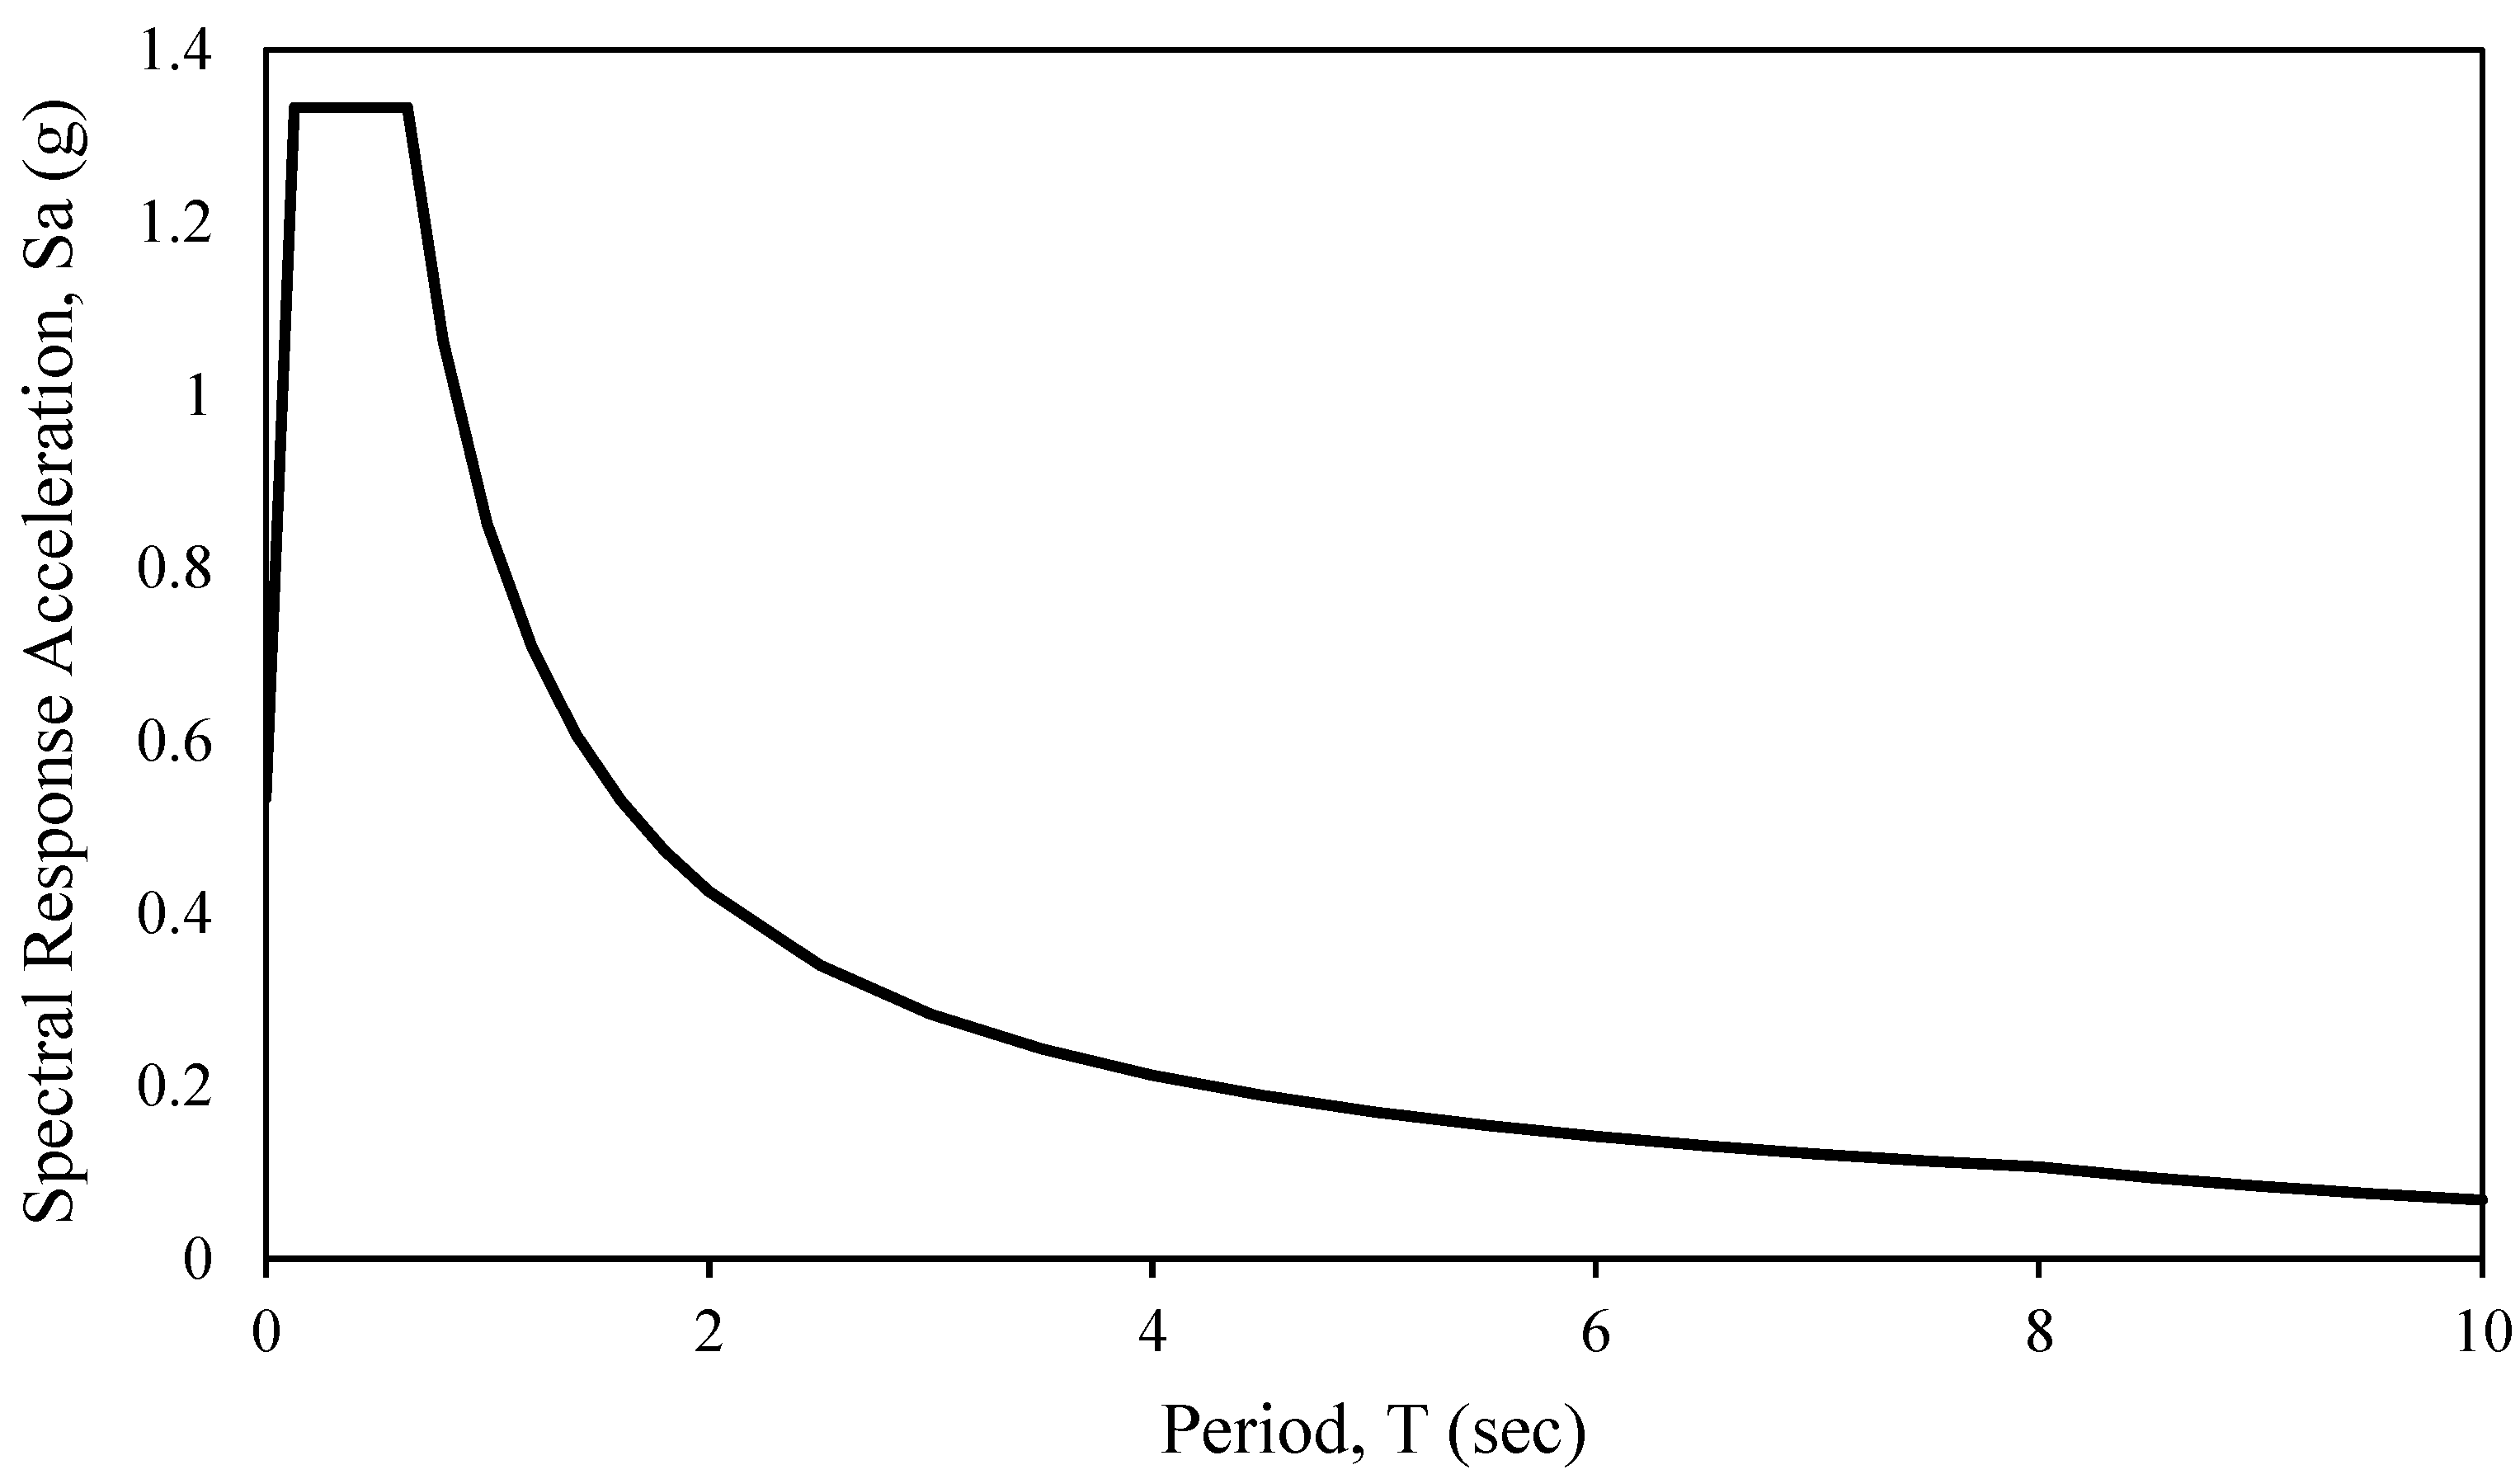
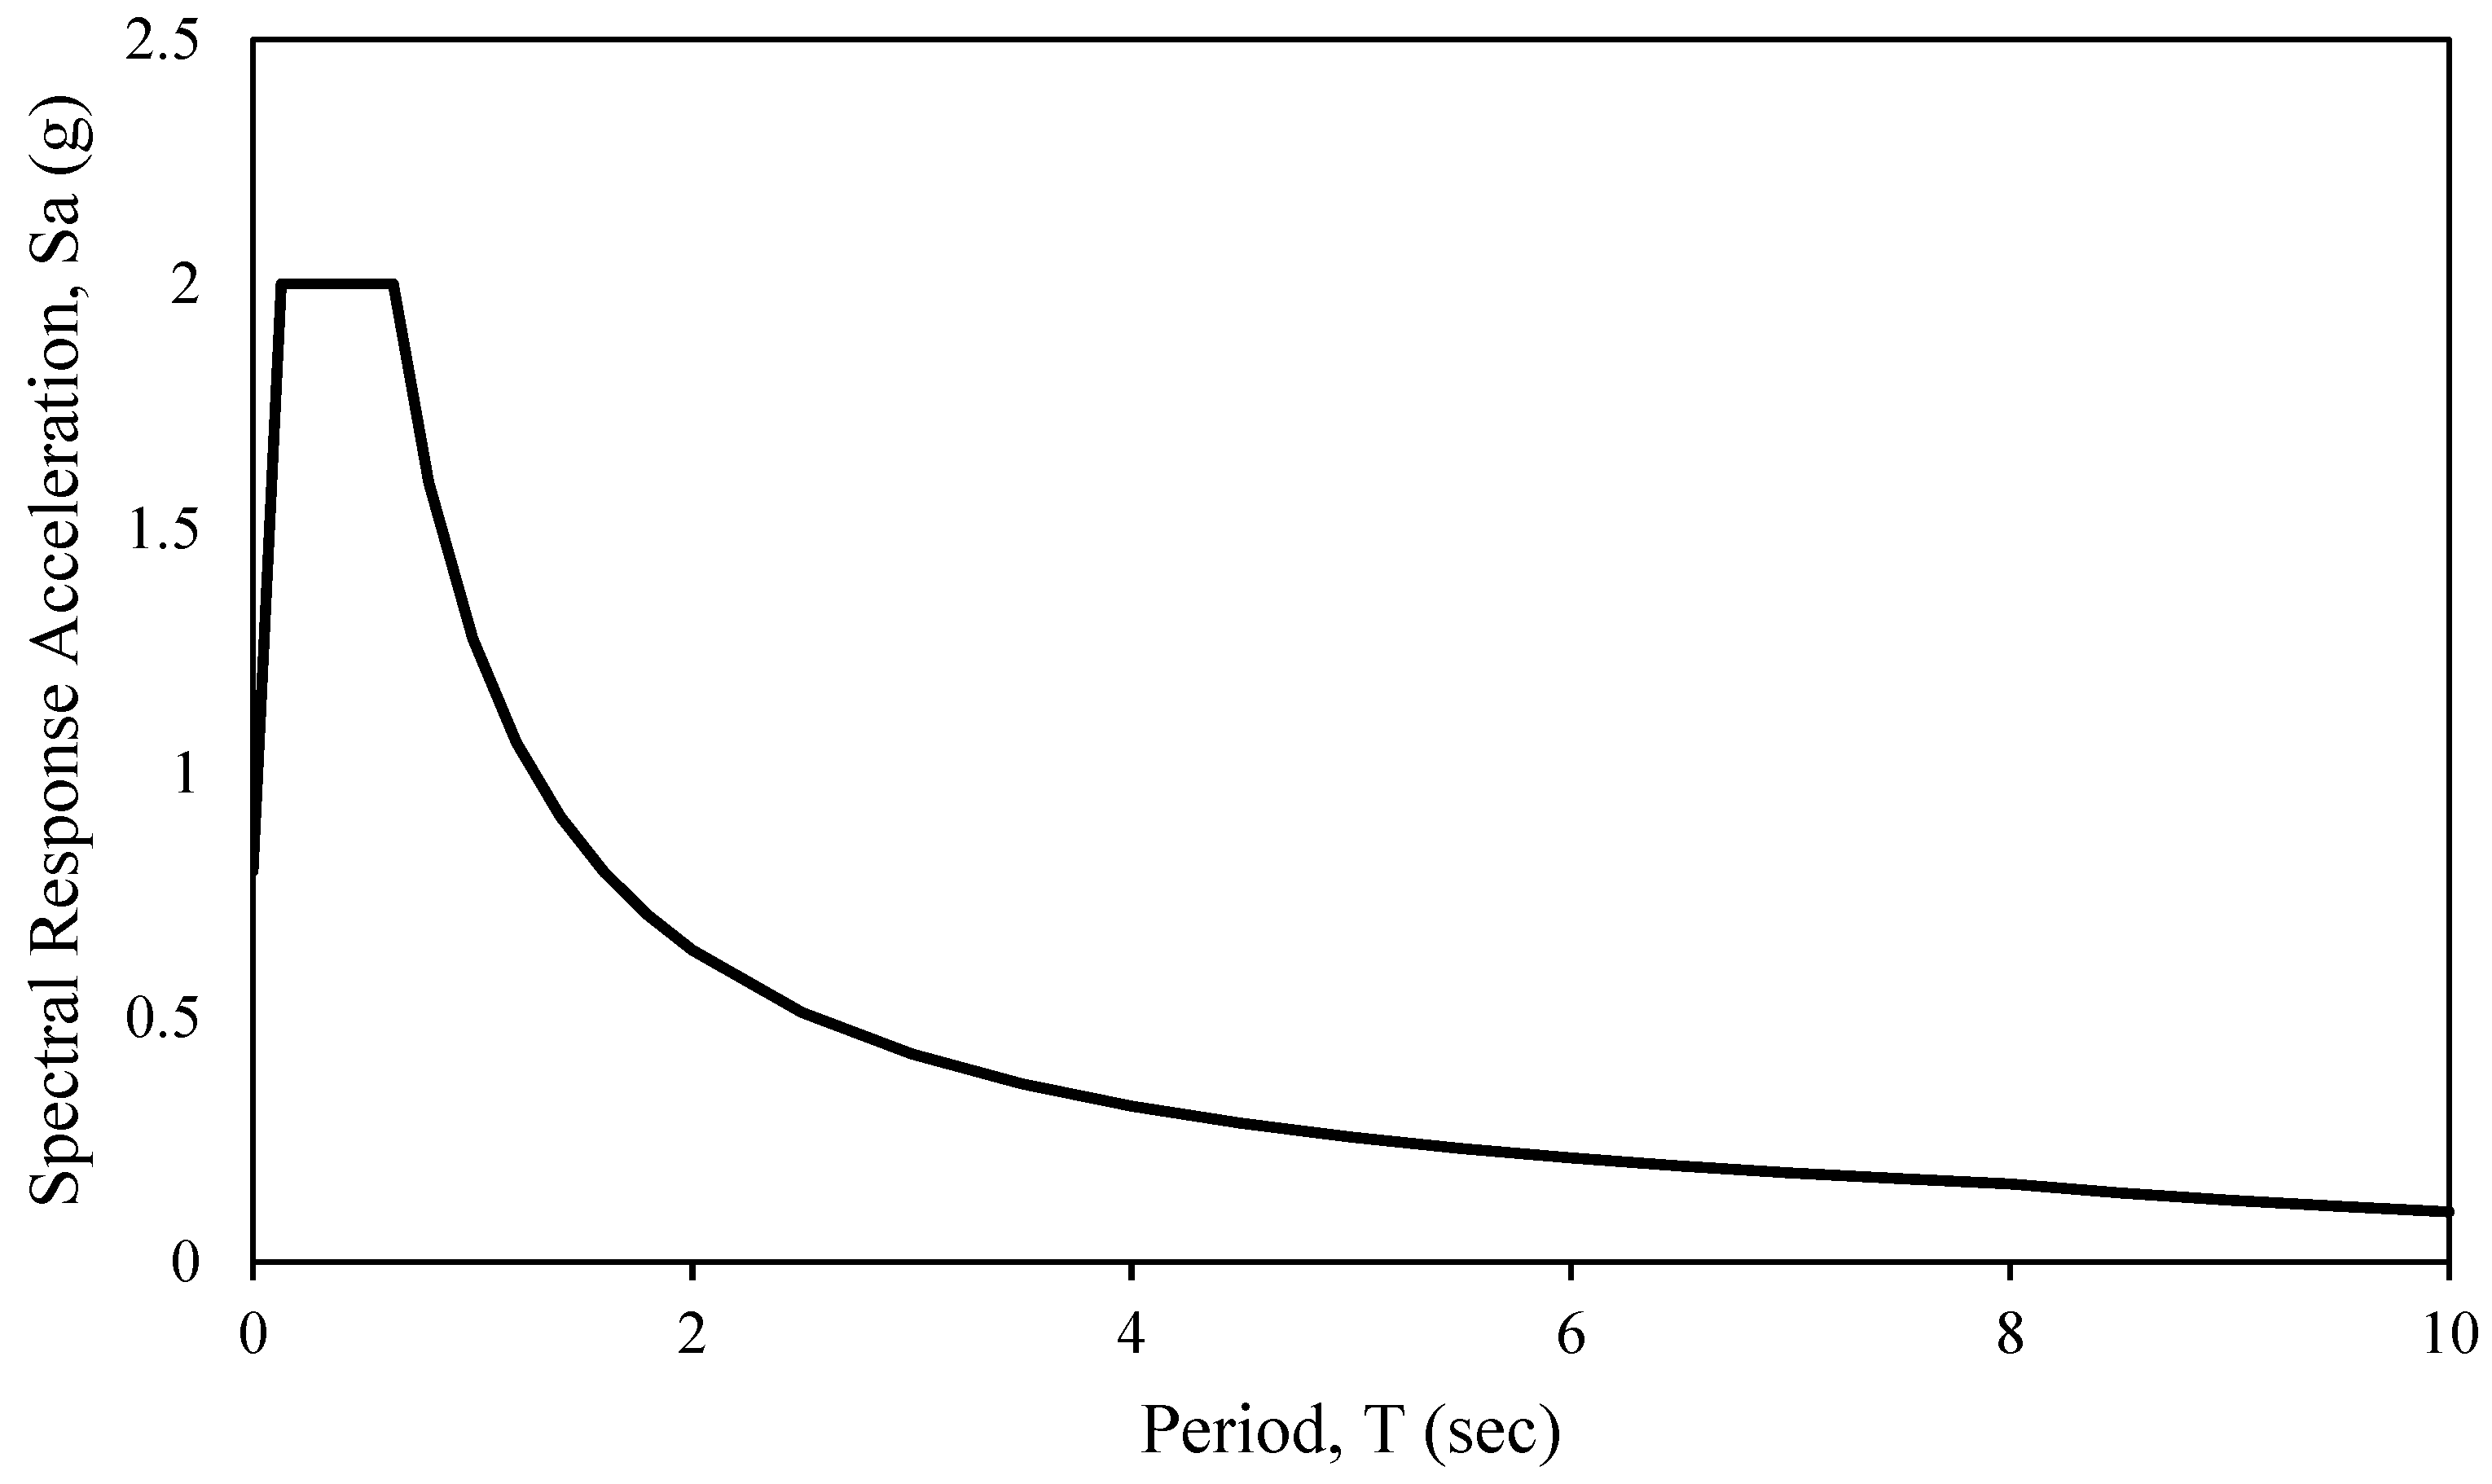
In this section, the major seismic parameters are defined according to ASCE 7-16, Table 15, furthermore, both the design and risk targeted response spectrum defined as explained in sections 11.4.6 and 11.4.7 respectively and are shown in Figure 28 and Figure 29 respectively.
Jacketing Thickness and Reinforcement Detailing
In general, a small jacketing thickness is usually preferred from an architectural perspective to not affect the design of the building and to not decrease the available renting area therefore, for these reasons many studies including (Sfakianakis 2002; Julio et al., 2005; Julio et al., 2008; Vandoros et al., 2008; Lampropoulos et al., 2011) have suggested the use of small thicknesses even to as low as 35mm. Furthermore, developing of high-performance concrete is giving the chance for using a thin jacket thickness. In order to make the comparative study more convenient as the strength of concrete is not similar in all models an iterative based approach was used to select the jacket thickness and reinforcement details in each model aiming to firstly ensure that retrofitting of the building with the proposed jacket will solve the problem of failed elements under the applications of ELFM and secondly fulfill the requirements in Table 12.
Plastic Hinge Properties
As a matter of fact, one of the main reasons of using ETABS is that it allows defining a lumped plasticity in beams and columns using the characteristics and limitations available in ASCE 41-17. Two plastic hinges were defined at 2% relative distance from both ends of each beam and column. Thereafter, the hinges were specified in a way that they don’t drop their loads at each stage and the applied stress will be considered as an initial stress.

3.6.5. Ground Motion Records

Ground Motions Selection
In fact, eleven pair of earthquake records in each orthogonal direction obtained from the Pacific Earthquake Engineering Research Center (PEER) and were selected to satisfy the requirement of section 2.4.3 in ASCE 41-17 standard. The selection of the ground motion records presented in Table 16 was based on the record’s magnitude, and soil class with different peak ground accelerations (PGA) and durations as this study is not intended for a specific site and directed for a specific location.
Ground Motions Modifications
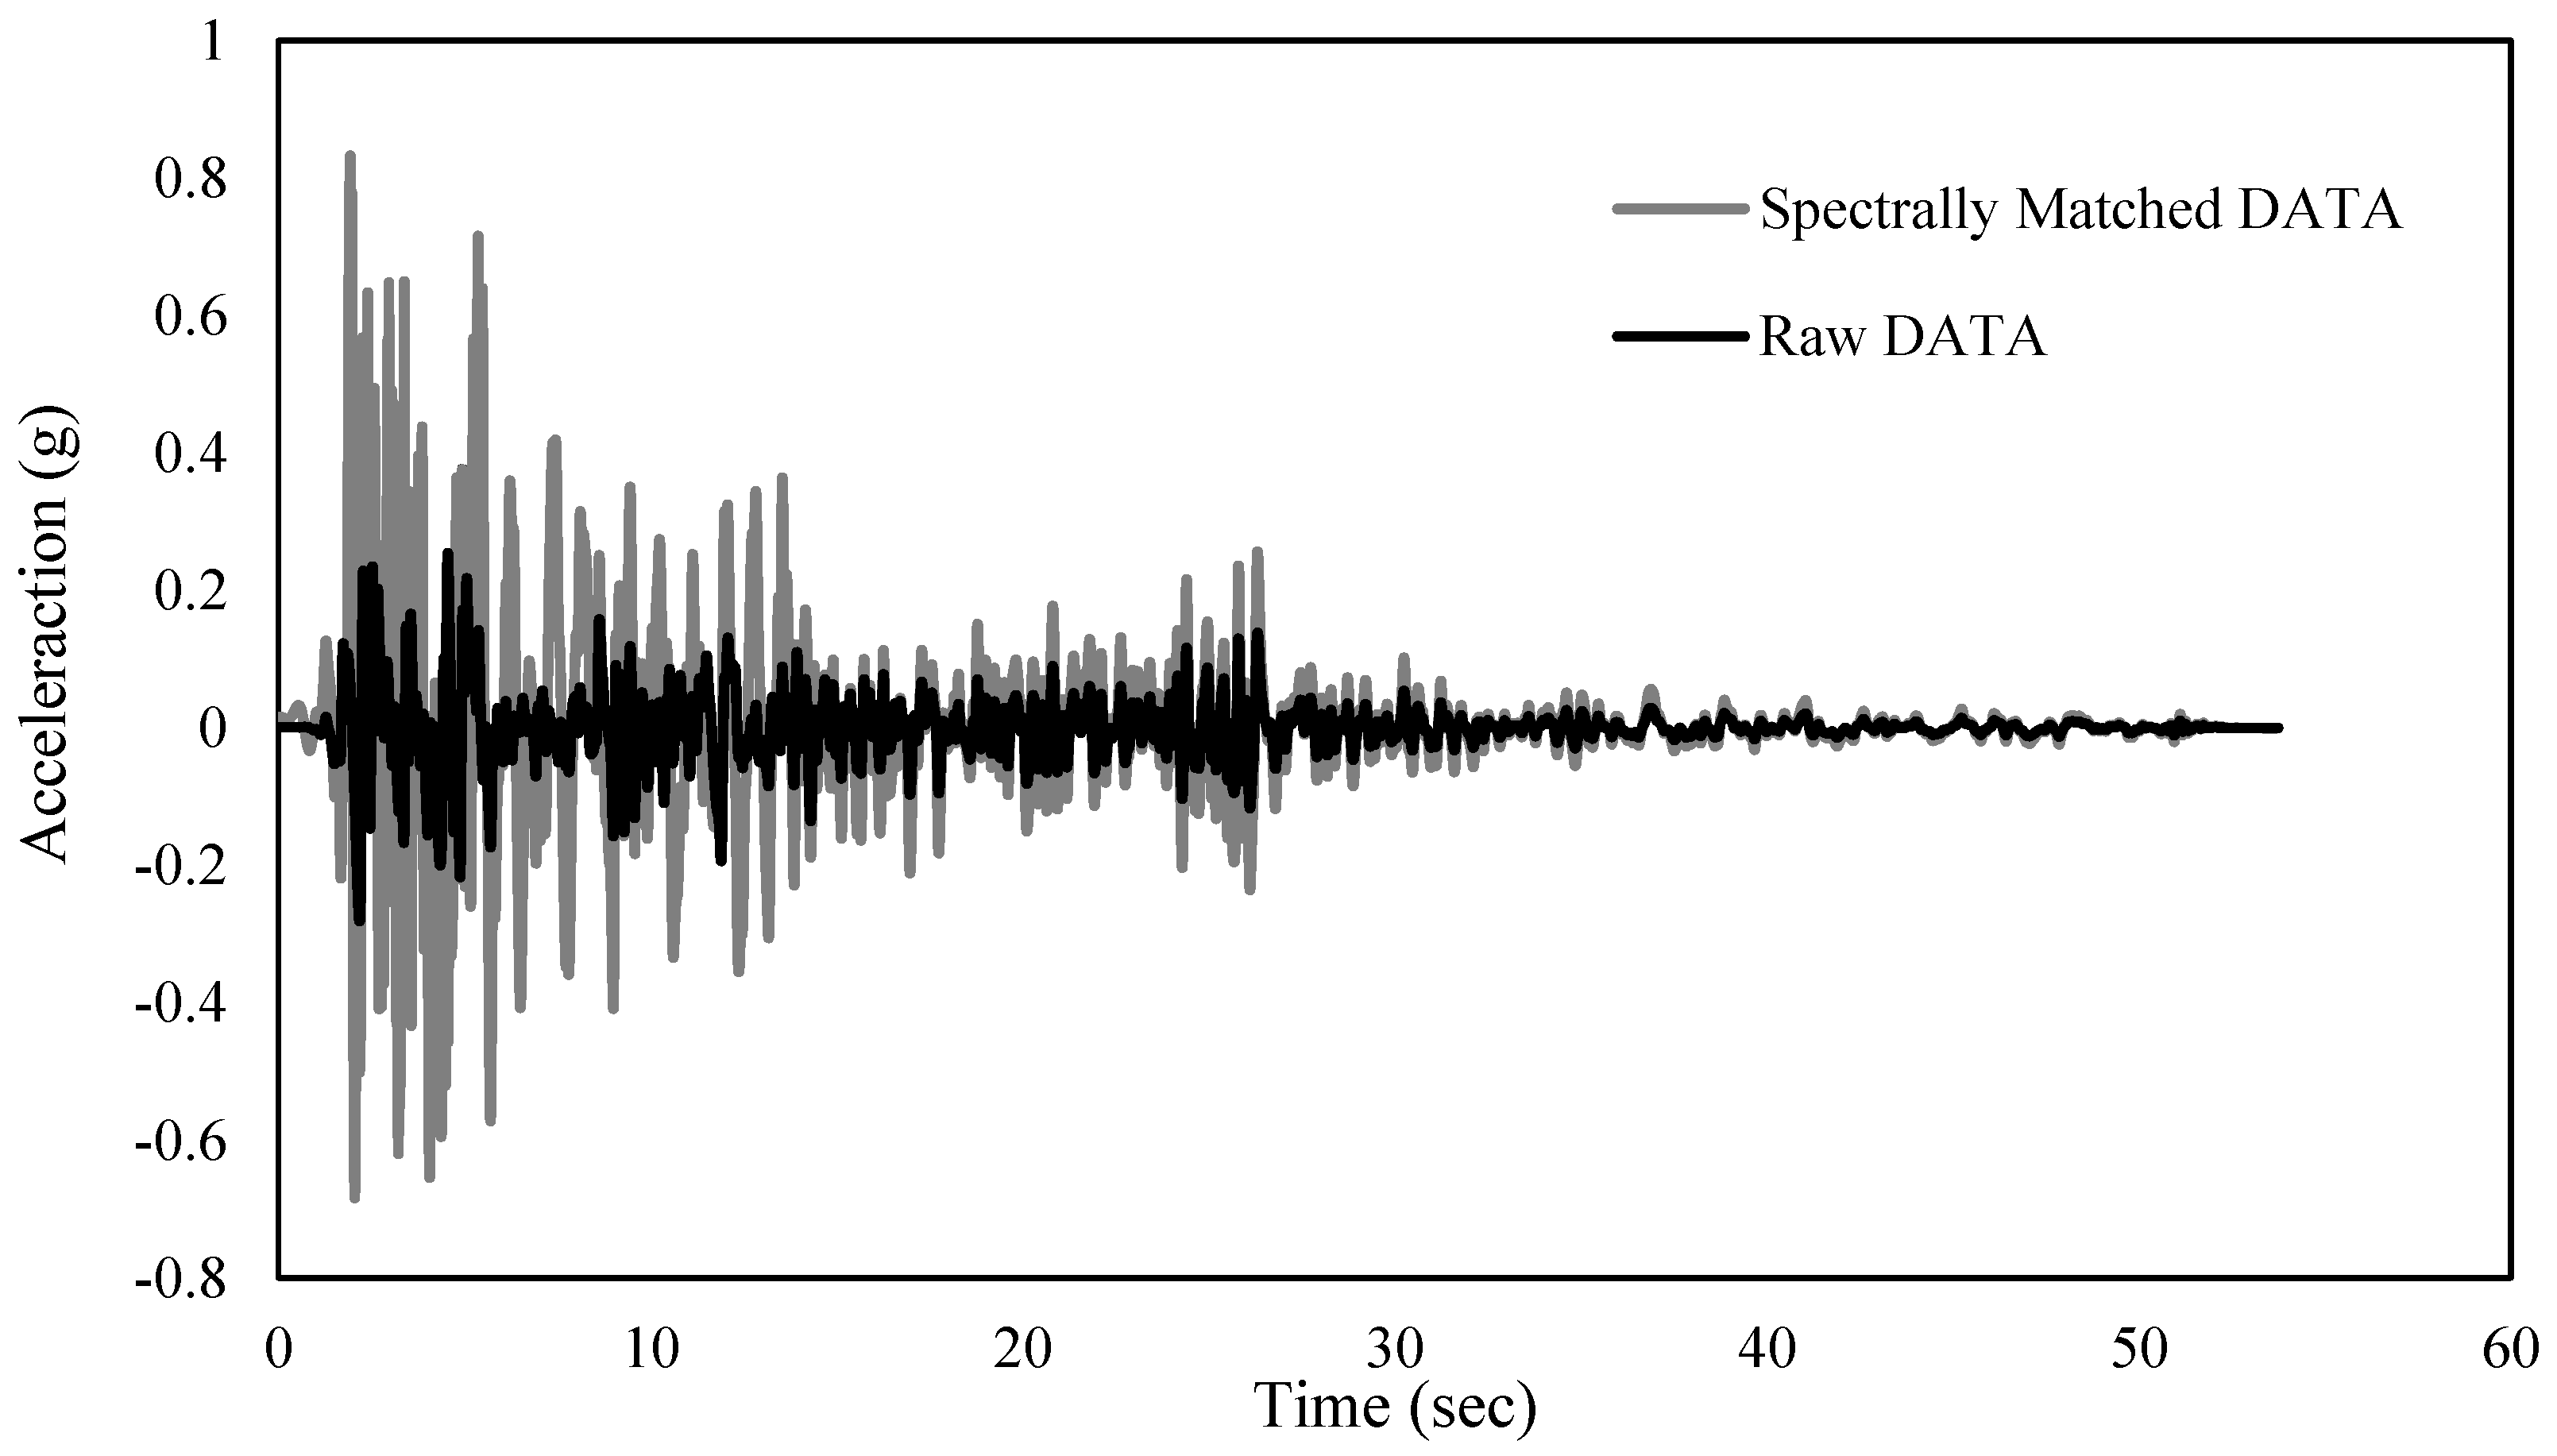
In order to make the NRHA more realistic it is important to modify the ground motion records so that they have a compatibility with the target spectrum, for this sake matching of the selected earthquake records were done in accordance with section 16.2.3 of ASCE 7-16 using the spectral matching method explained in section 16.2.3.3 of ASCE 7-16. Risk-Targeted response spectrum defined in the previous section were used for spectral matching and example of this process is shown in Figure 30. This task was handled using ETABS which gives the option of performing a reliable time domain matching.

4. Results and Discussions

4.1. Introduction

This chapter represents the results of the materials and structural investigations. As part of this chapter the experimental findings will be described and compared to the related studies in the literature and proposed constative model, thereafter, the results of the numerical study will be explained in a comparative way to highlight the effects of using RBC on the seismic performance of retrofitted structures.

4.2. Properties of High-Performance Self-Compacting Rubberized Concrete

Workability
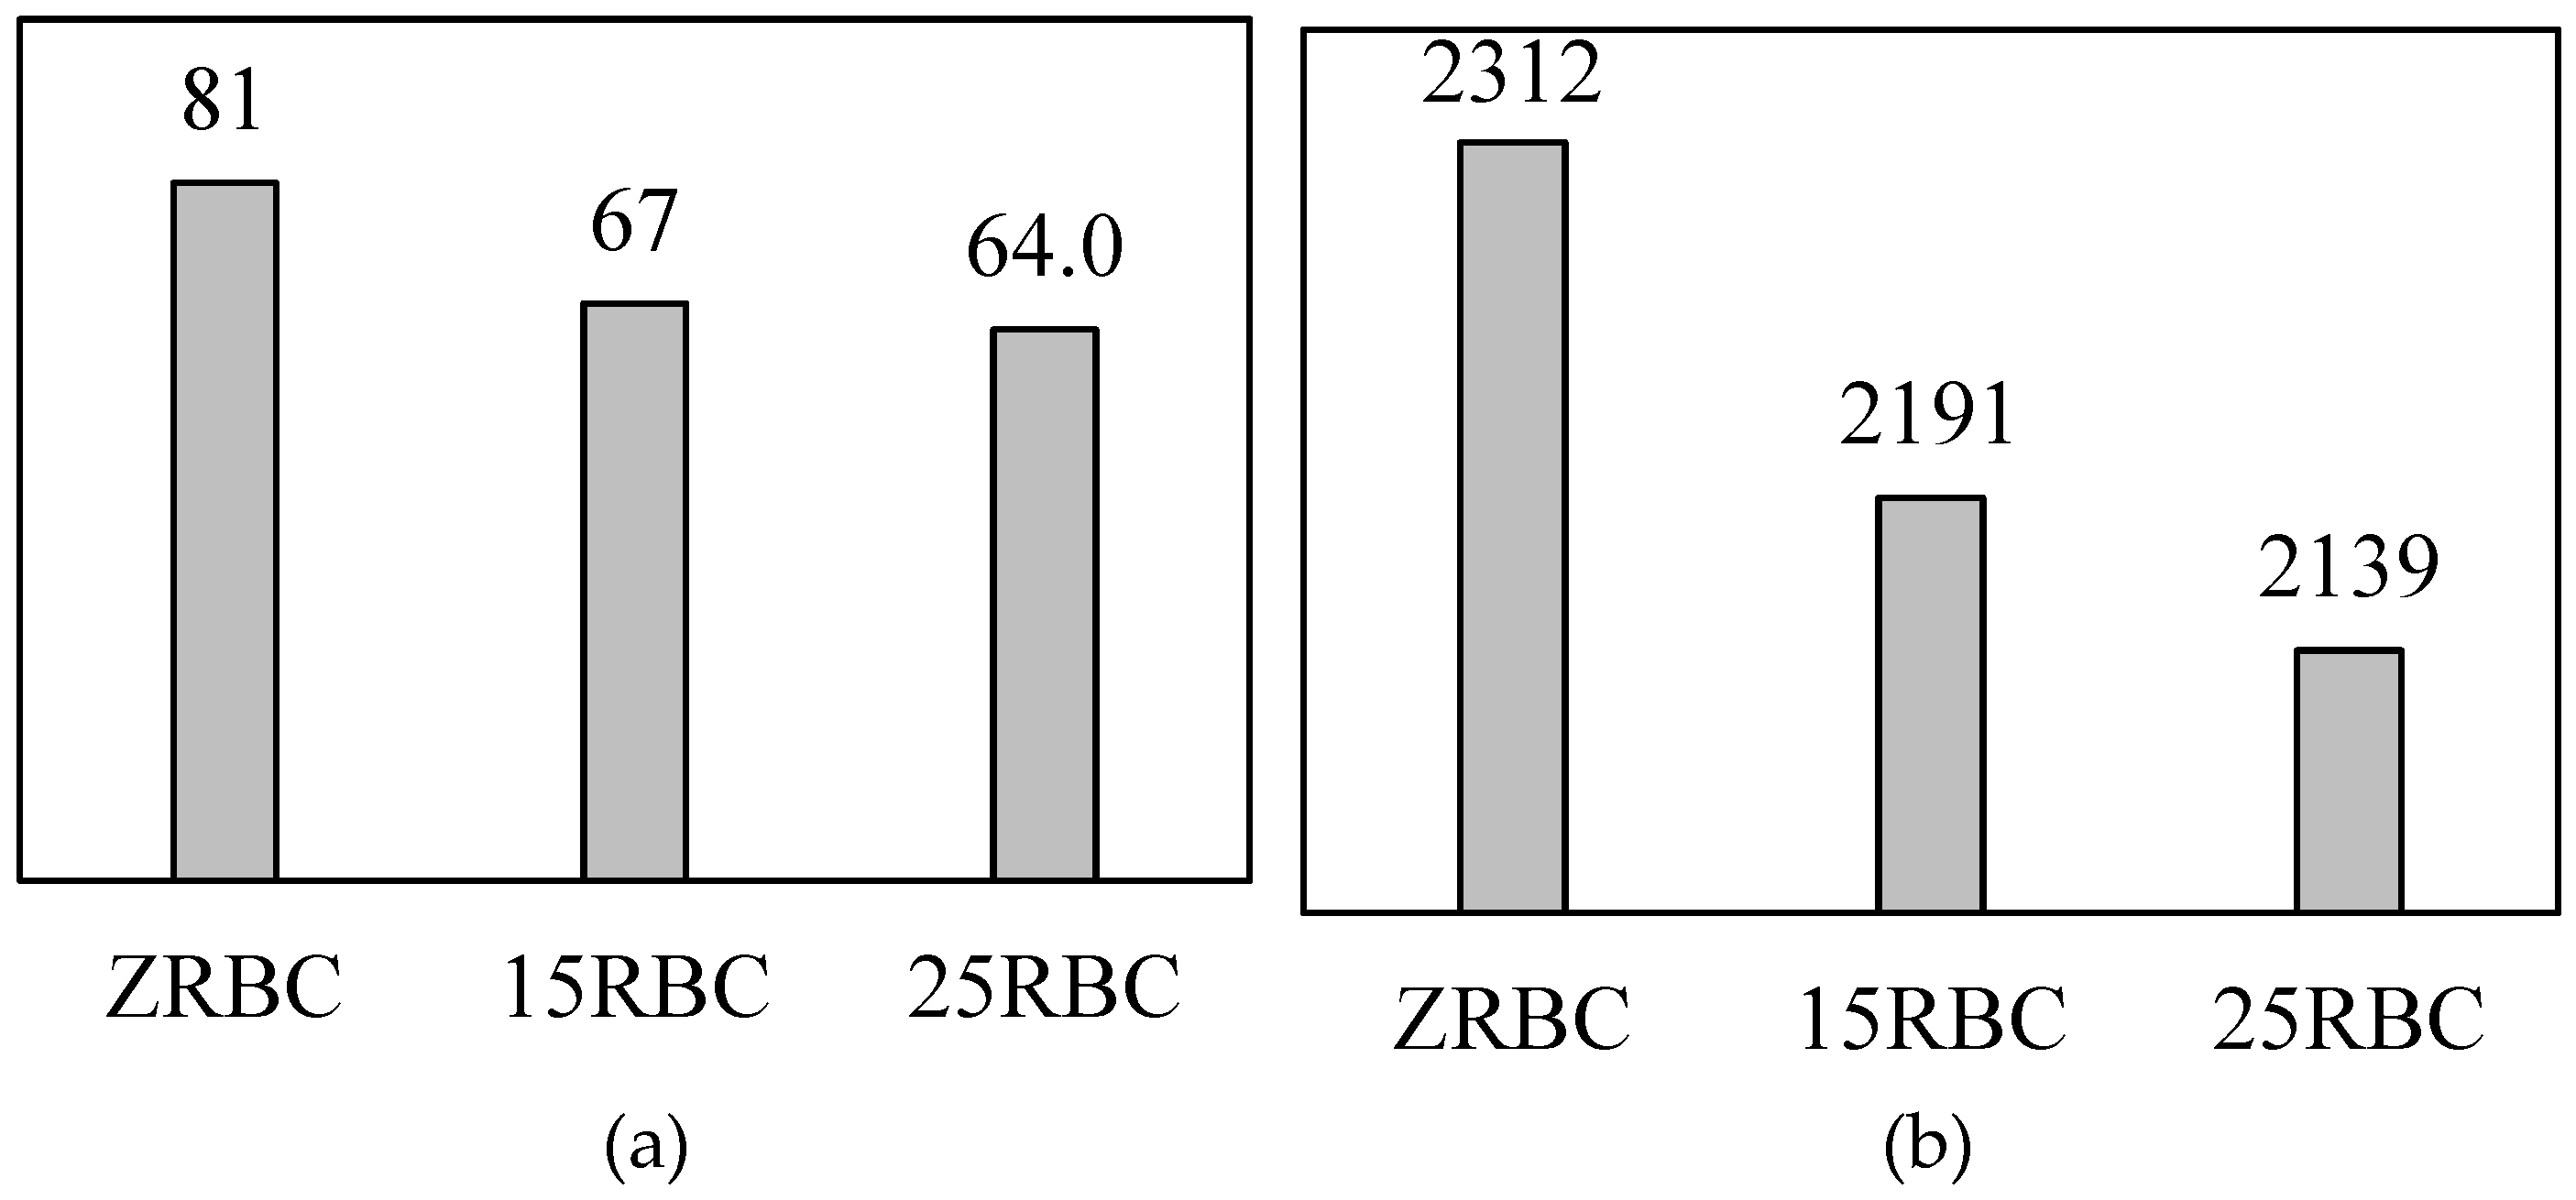
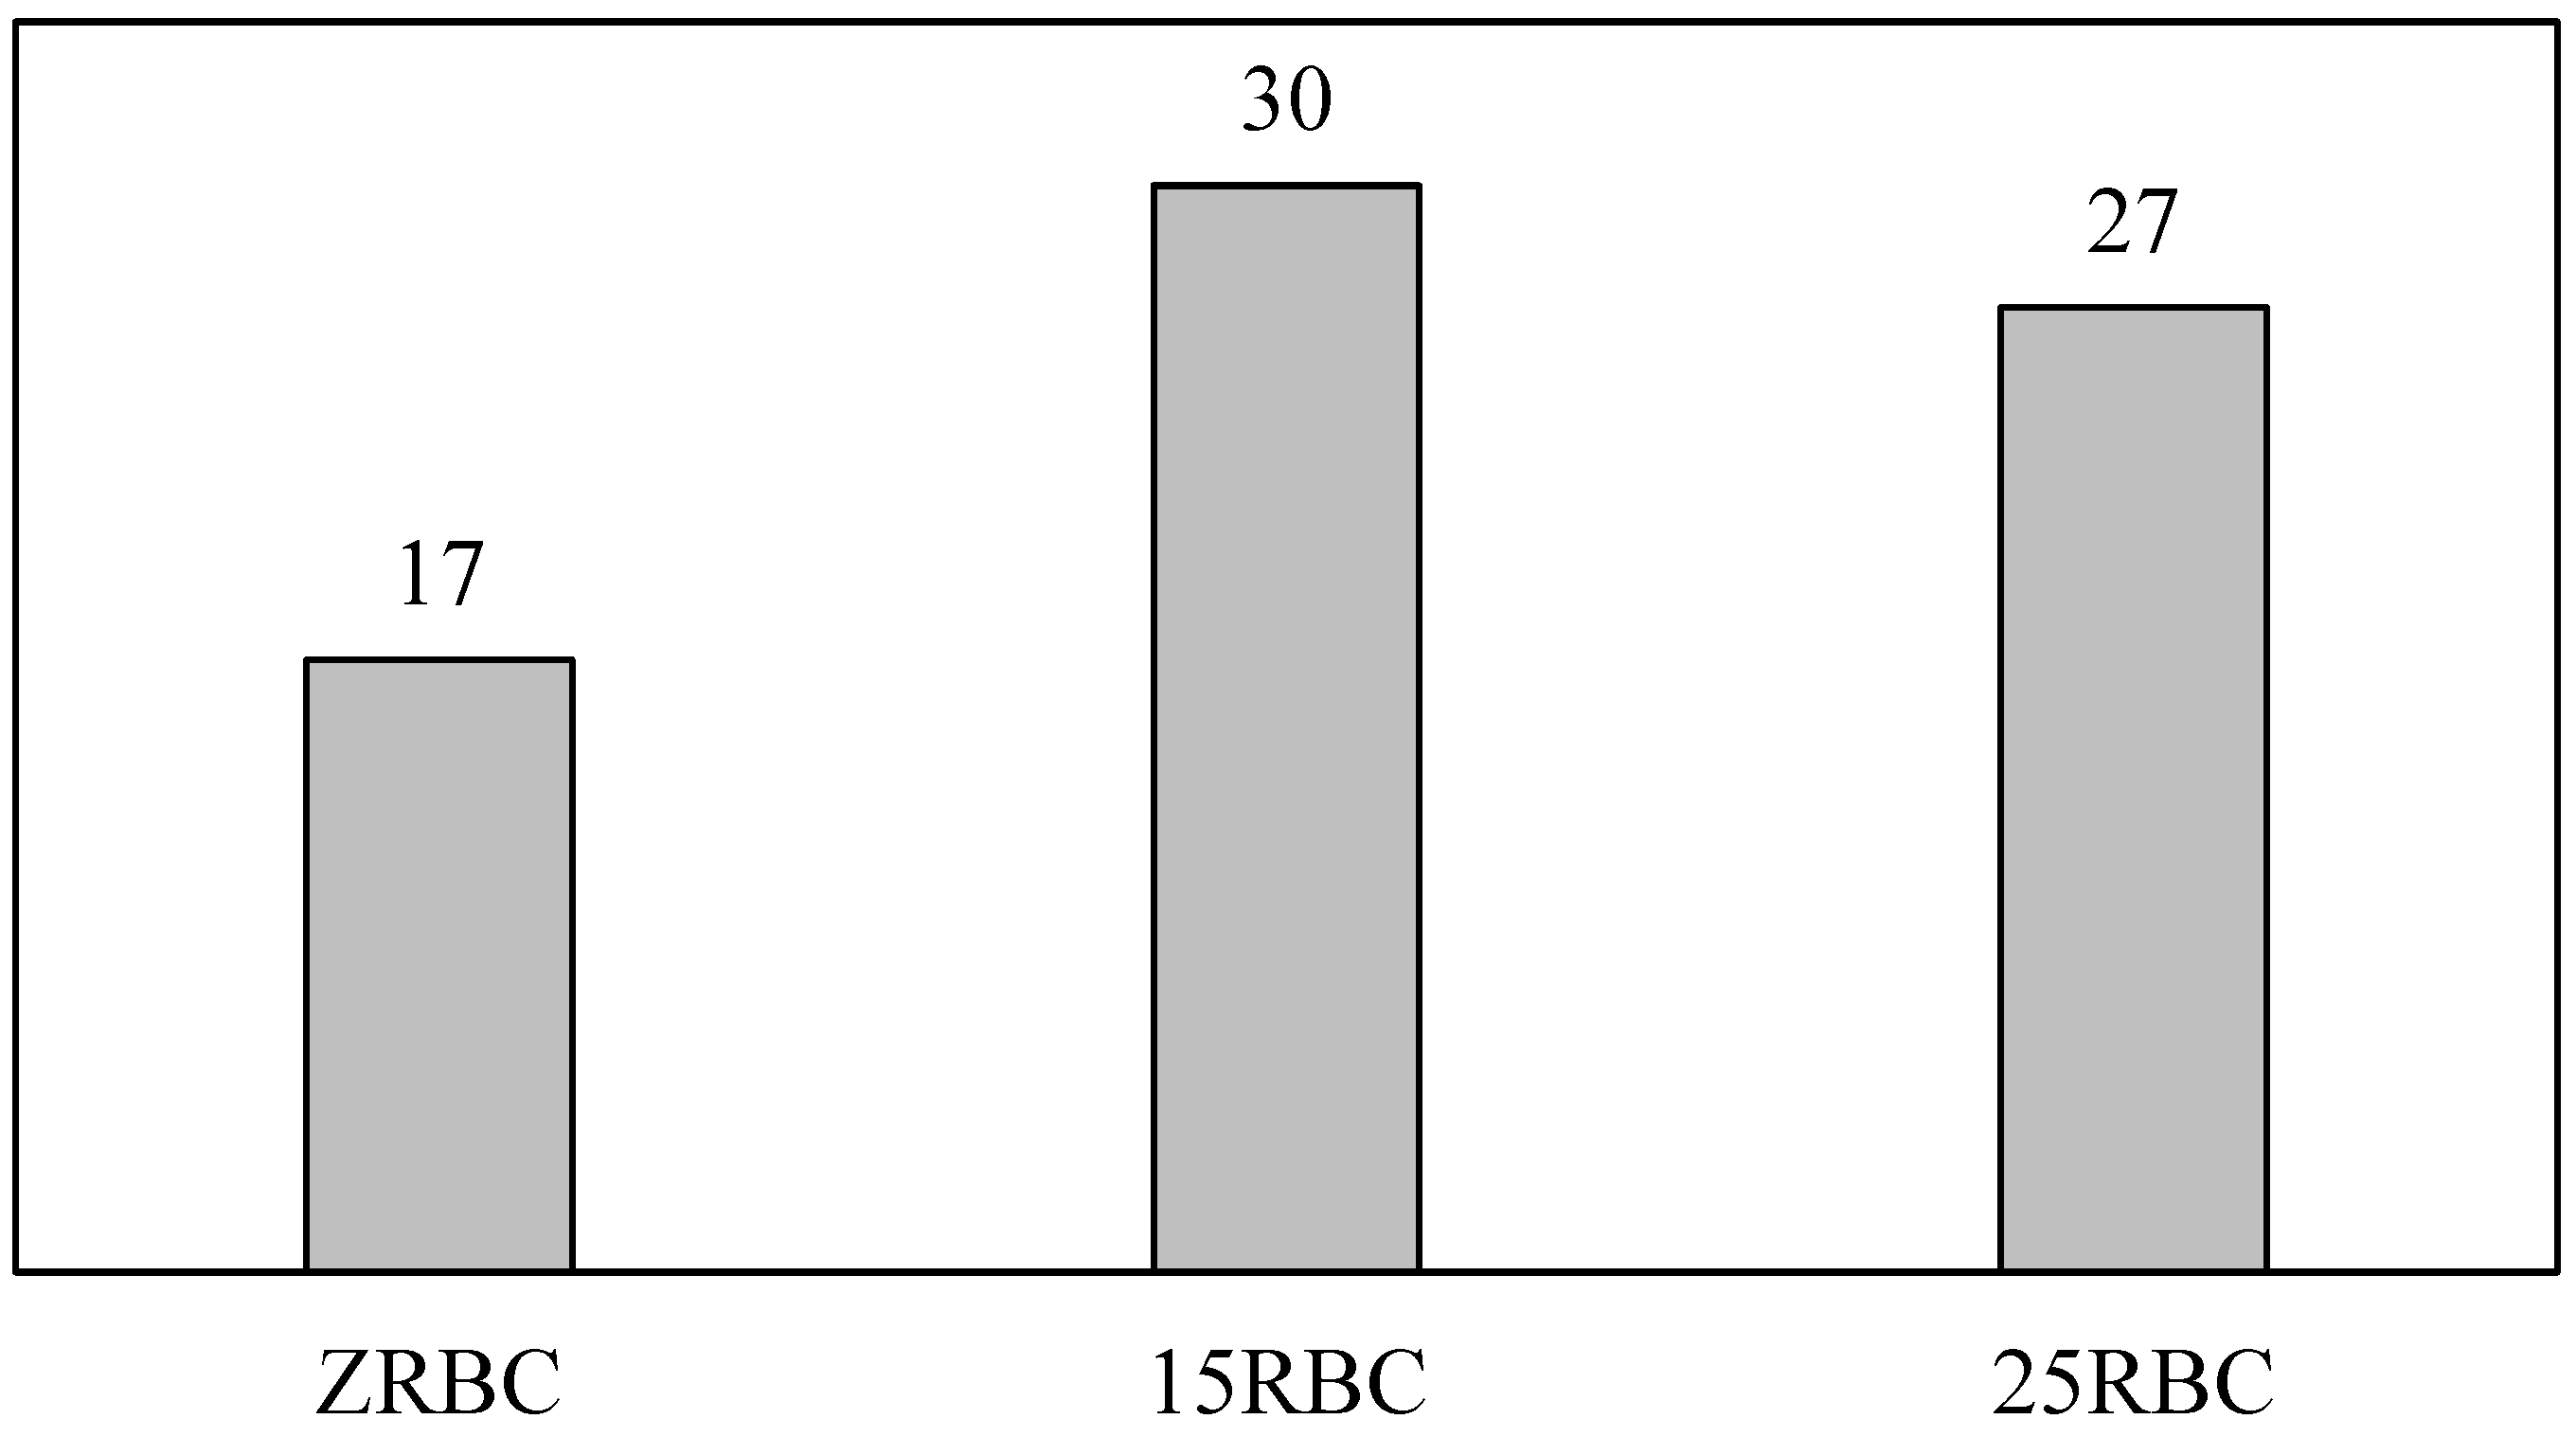
In fact, the workability of each mix was determined using the procedure provided in ASTM C1611 for slump flow of self-consolidating concrete. The results of the test, Figure 31a, showed a drop of 17% and 21% in the workability of concrete for 15RBC and 25RBC respectively which means that the workability decrease as the amount of rubber is increasing. This finding is in match with to the ones available in the literature and attributed to the difference in rubber shape and texture in comparison to the natural aggregate ones which slow down its movement in the fresh mix in addition to increasing the roughness of the rubber particles when it is being treated using NaOH.

4.2.1. Bulk Density

The bulk density for each concrete mix was calculated as provided in ASTM C642 by taking the mass of the specimen (in kg) divided by its volume (in m3). Thereafter, the average of six different specimens were calculated and presented in Figure 31b, as can be seen there, concrete faces a decrease in its density related directly to the increase in rubber content, this change is attributed to the significant difference between the specific gravity of rubber and natural stone particles.

4.2.2. Compressive Strength

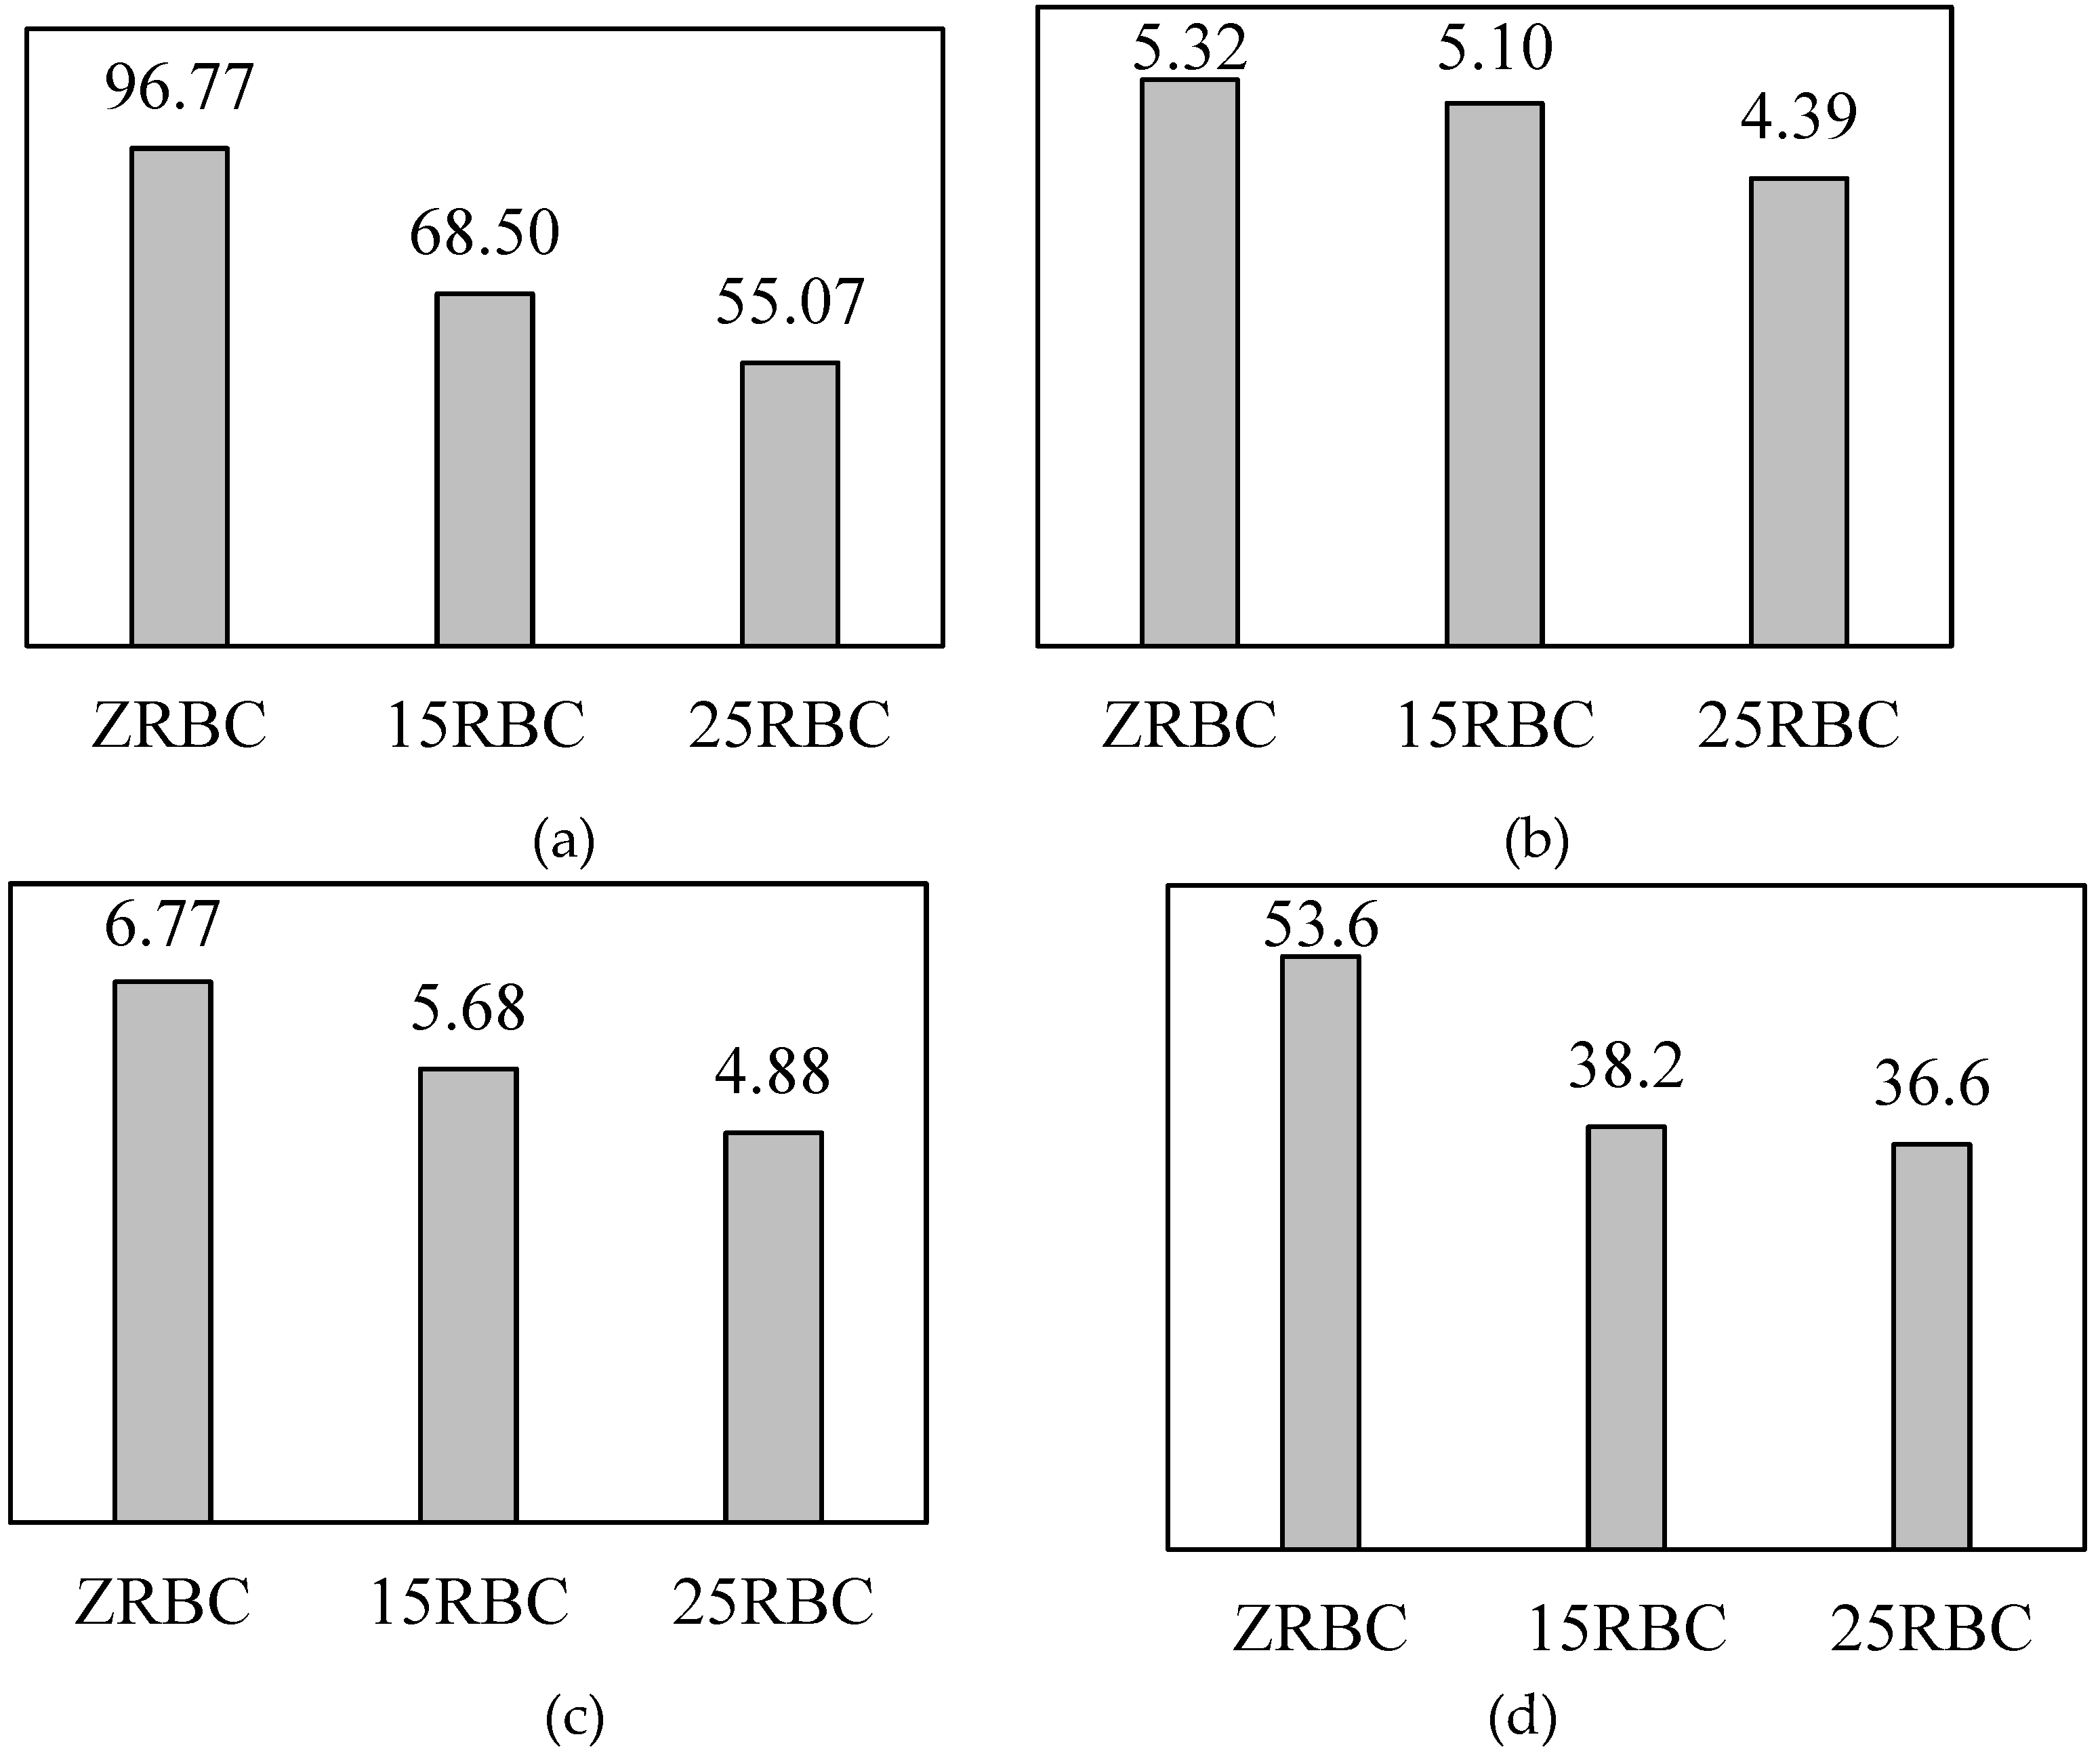
The average 28 days compressive strength of mixtures is shown in Figure 32a. In general, the results indicated a significant reduction in the strength corresponds to 29% and 43% for 15RBC and 25RBC respectively. This drop is attributed to many reasons including replacing higher strength and load-carrying capacity aggregate by lower one (Xue and Shinozuka, 2013) and the weaker bond between the rubber aggregates and cement past in comparison to the natural aggregate one which lead to rapid rupture of concrete (Bisht and Ramana 2017).

4.2.3. Splitting Tensile Strength

Similar to compressive strength the 28 days splitting tensile strength of concrete, Figure 32b, was affected by the rubber percentage, where the reduction was 4% and 17% for 15RBC and 25RBC respectively. The approach adopting during testing was explained by Al Horui et al. (2020).

4.2.4. Flexural Tensile Strength

Figure 32c shows the flexural tensile strength of each concrete mixture developed in this study. It is clear that the negative influence of rubber on strength of concrete includes the flexural tensile one with a similar reduction pattern to the compressive strength. As can be observed there the flexural strength reduces by 16% and 21% for 15RBC and 25RBC respectively, these findings are similar to the ones by Su et al. (Su et al., 2015).

4.2.5.. Static Modulus of Elasticity

The variation in the static elastic modulus of RBC with respect to control mixture is shown in Figure 32d. This difference is due to the reduction in the compressive strength of concrete when the recycled aggregates are added to the concrete.

4.2.6. Failure Pattern

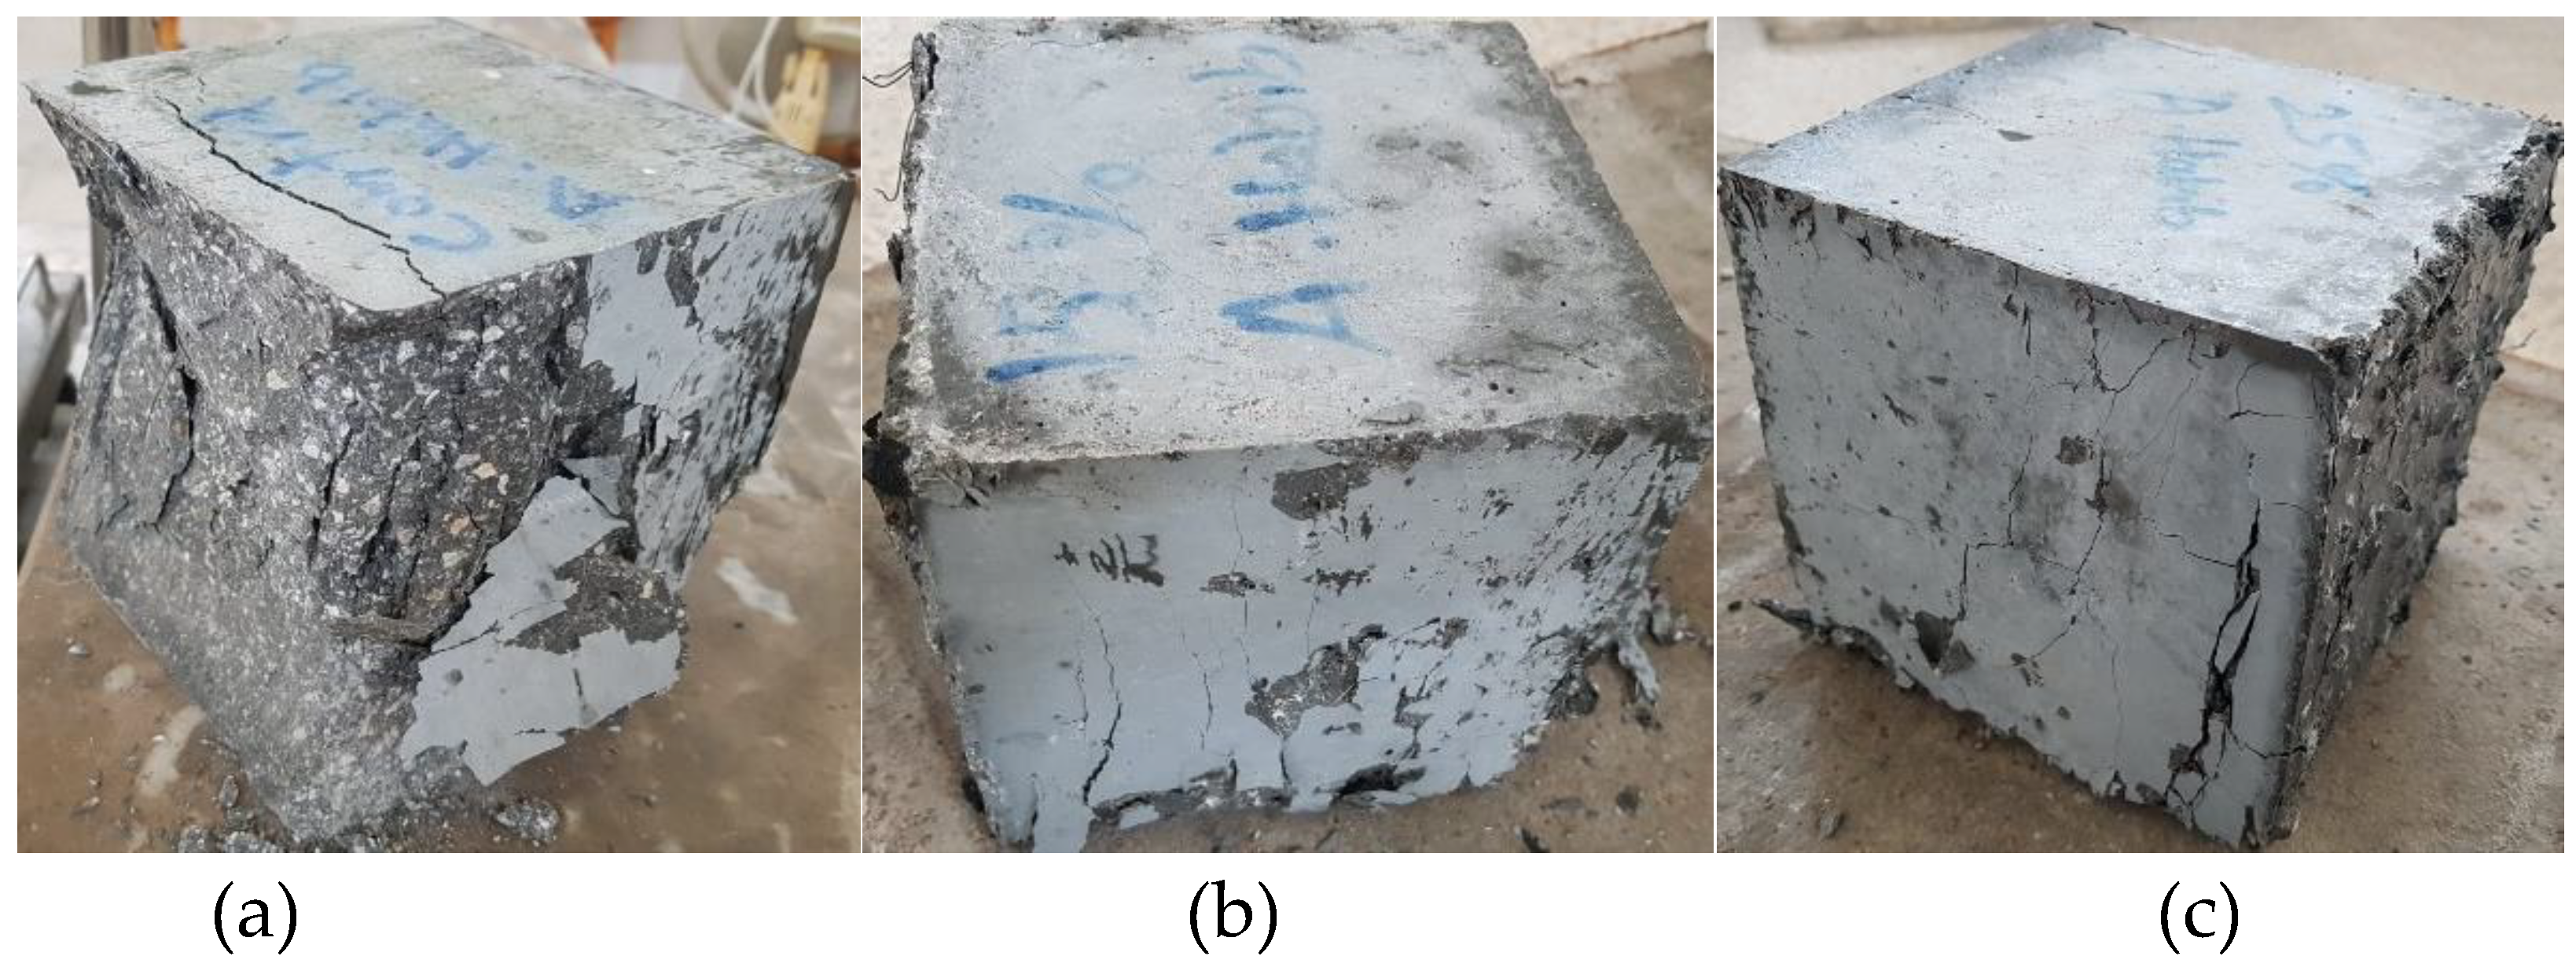
Although there is a significant drop in the carrying capacity of concrete in both tension and compression when rubber aggregates are added to the mix, it was possible to convert the failure pattern of high performance concrete from the brittle to the ductile behavior where the higher rubber content exhibits better failure pattern as can be seen in Figure 33.

4.2.7. Stress-Strain Behavior of Concrete

In order to conduct a comprehensive finite element study using the proposed concrete it is very important to define the stress-strain behavior of concrete experimentally, so the behavior of the mathematical model will not differ to the real case. As part of this study the full stress-strain behavior of concrete was obtained for each mixture using linear variable differential transformers (LVDT) placed near the specimen to measure the plate-to-plate deformations.
Stress-Strain Modification
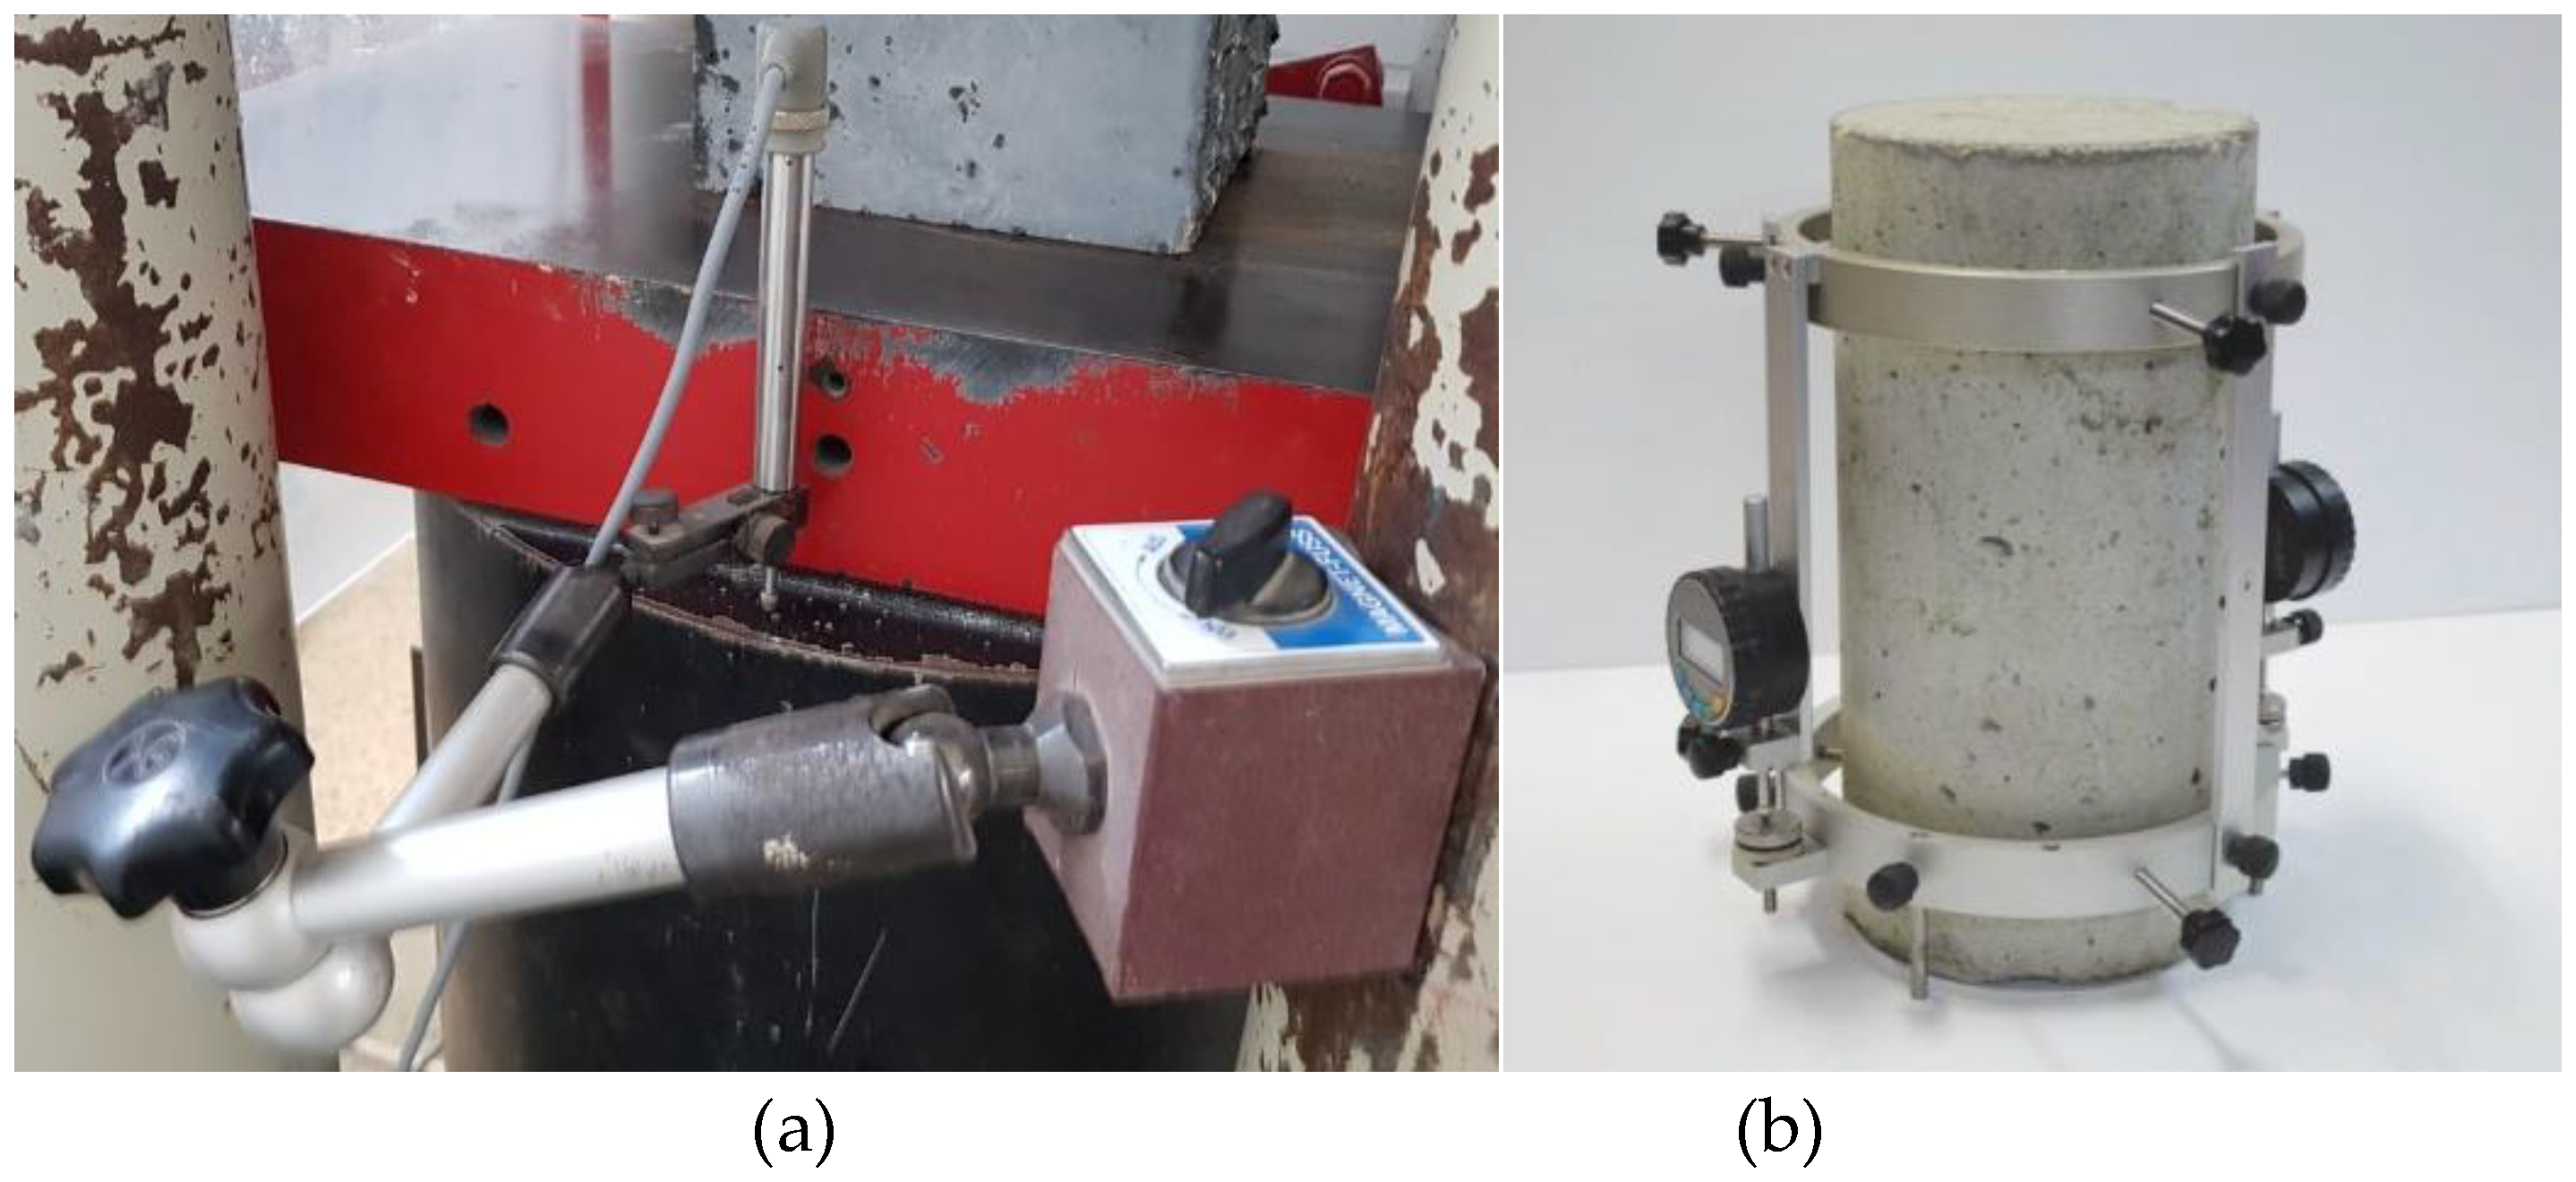
It is very obvious that the measured stress-strain curve must have similar initial tangent modulus of elasticity as the one calculated using ASTM C469. However, this fact was not applicable for the obtained stress-strain curves due to the use of LVDT transducer, Figure 34a, instead of compressometer, Figure 34b, that reads the true strain of the specimen.
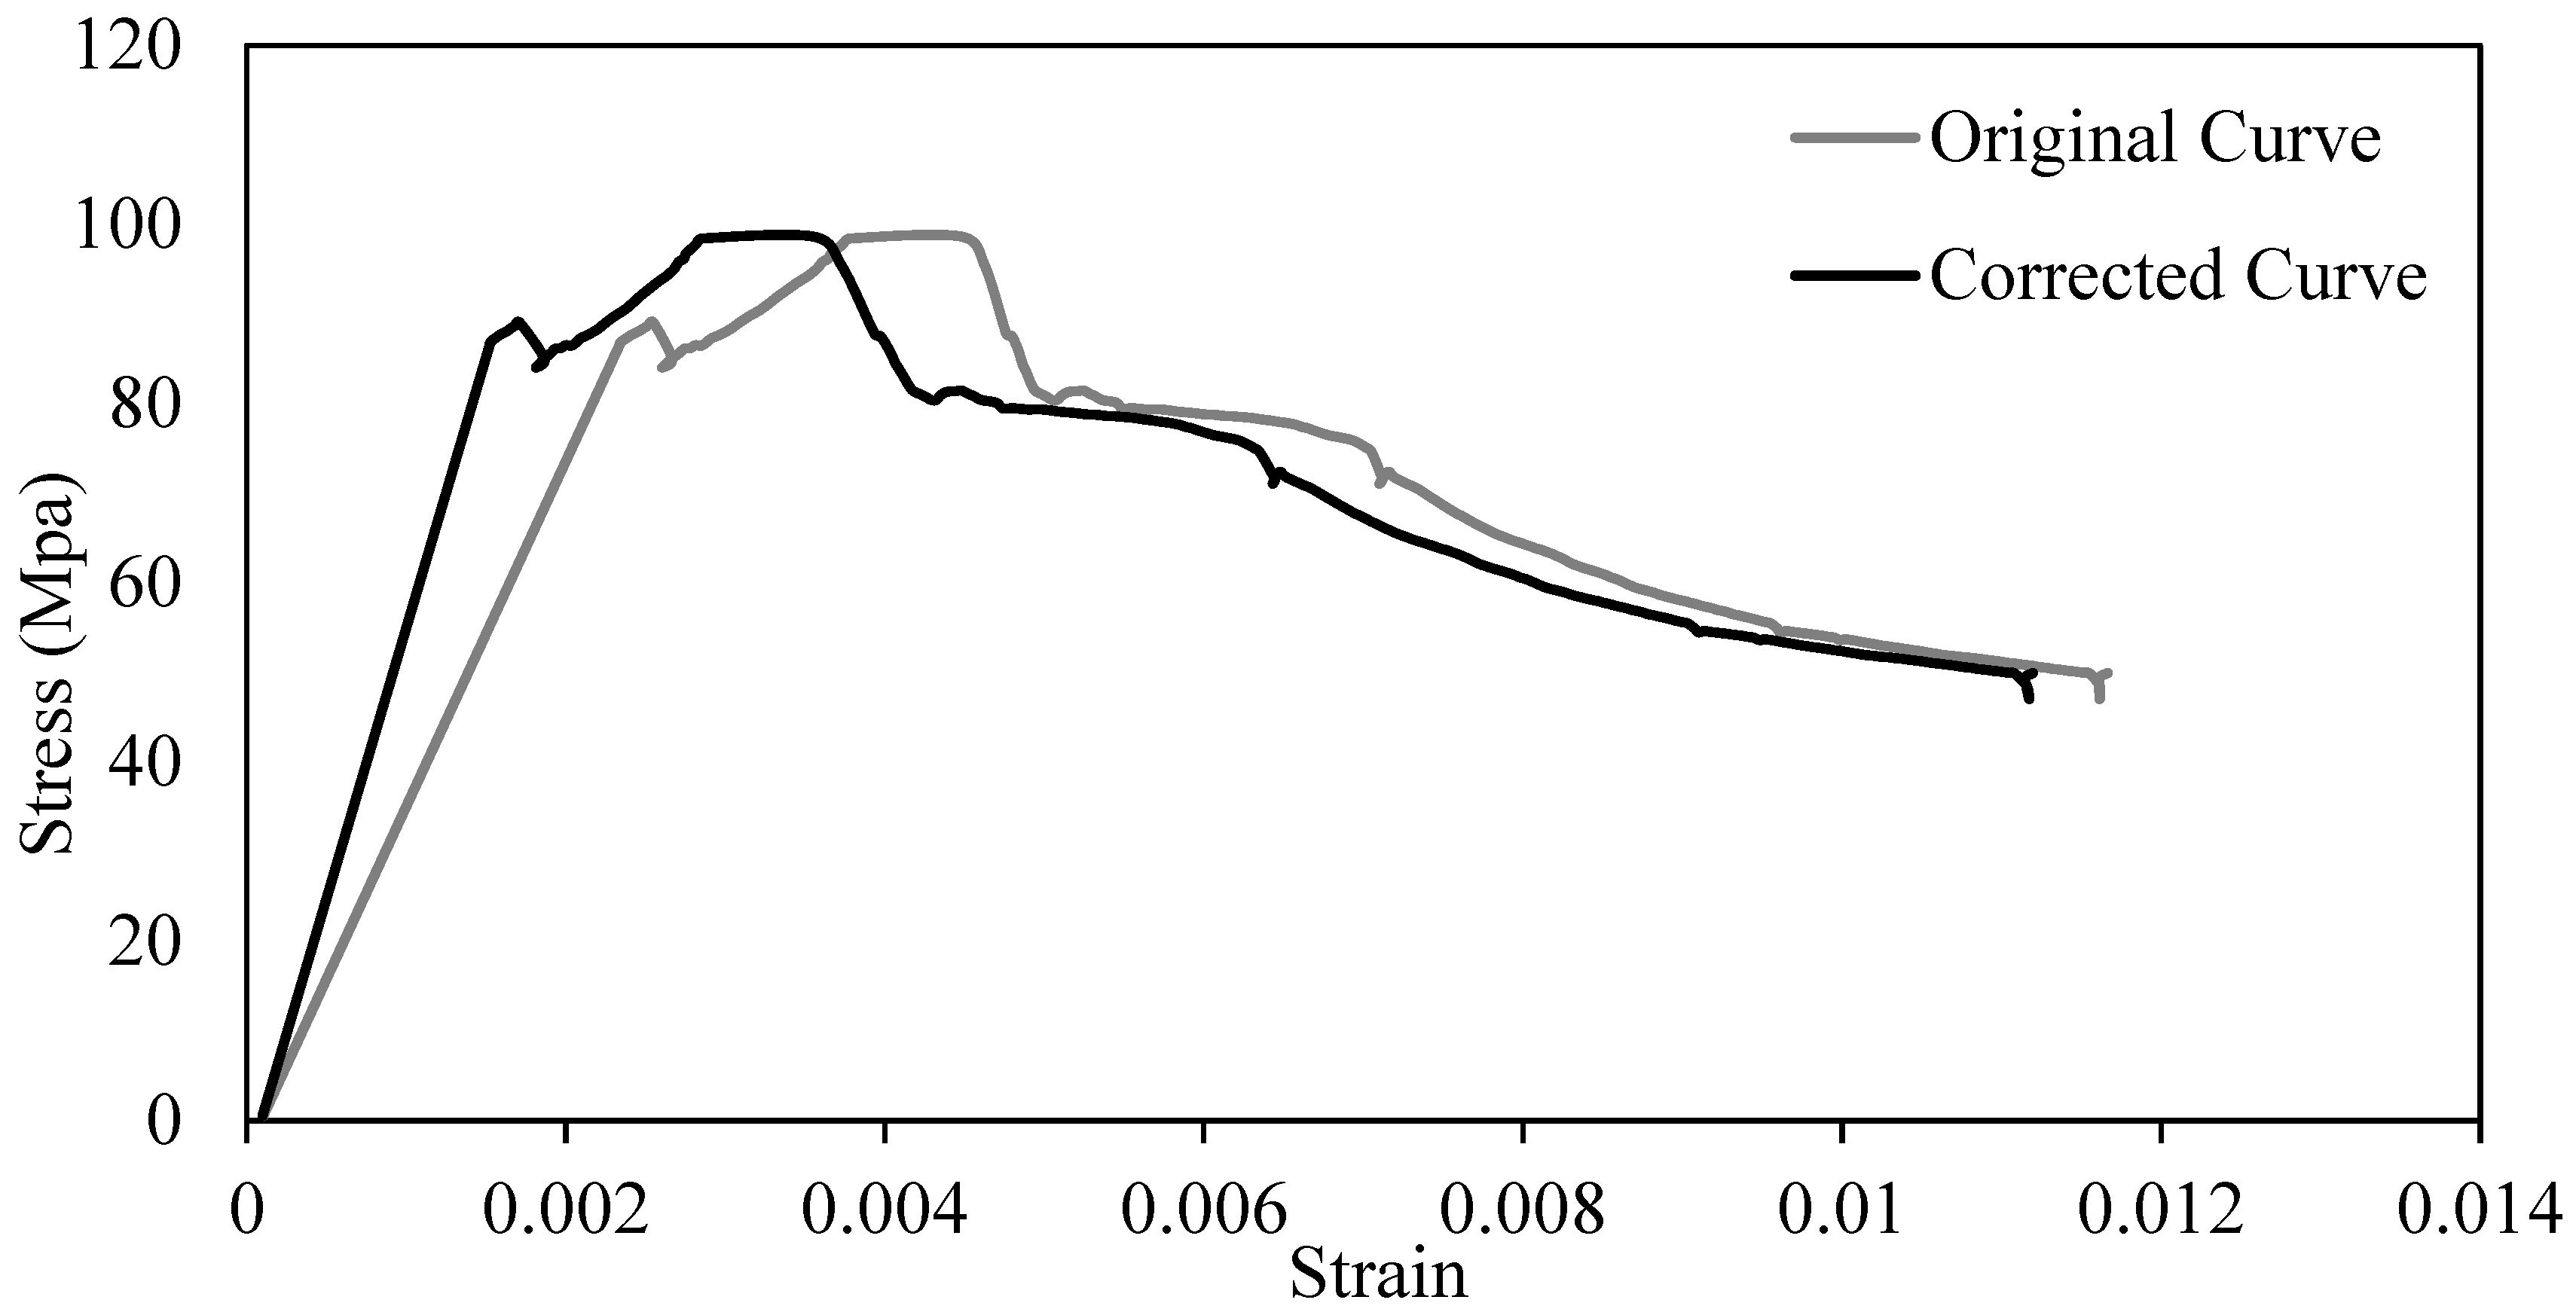
Therefore, to solve this problem the strain values of each mixture were modified using the correction equation proposed by Mansur et al. (Mansur et al., 1995).
ϵ c = ϵ t p 1 E t p 1 E c o σ
where ϵ c is the actual concrete strain at any stress level σ ,   ϵ t p is the corresponding strain measure by LVDT transducers placed between the machine platens, and E t p and E c o are the initial tangent moduli of concrete measured using LVDT transducer and compressometer respectively. Figure 35 shows a comparison between the original stress-strain curve obtained from LVDT transducer readings and the corrected curve using the above equation for ZRBC mixture, similar process was conducted to corrected the stress-strain curves of 15RBC and 25RBC mixtures.
Stress-Strain Behavior of Each Concrete Mixture
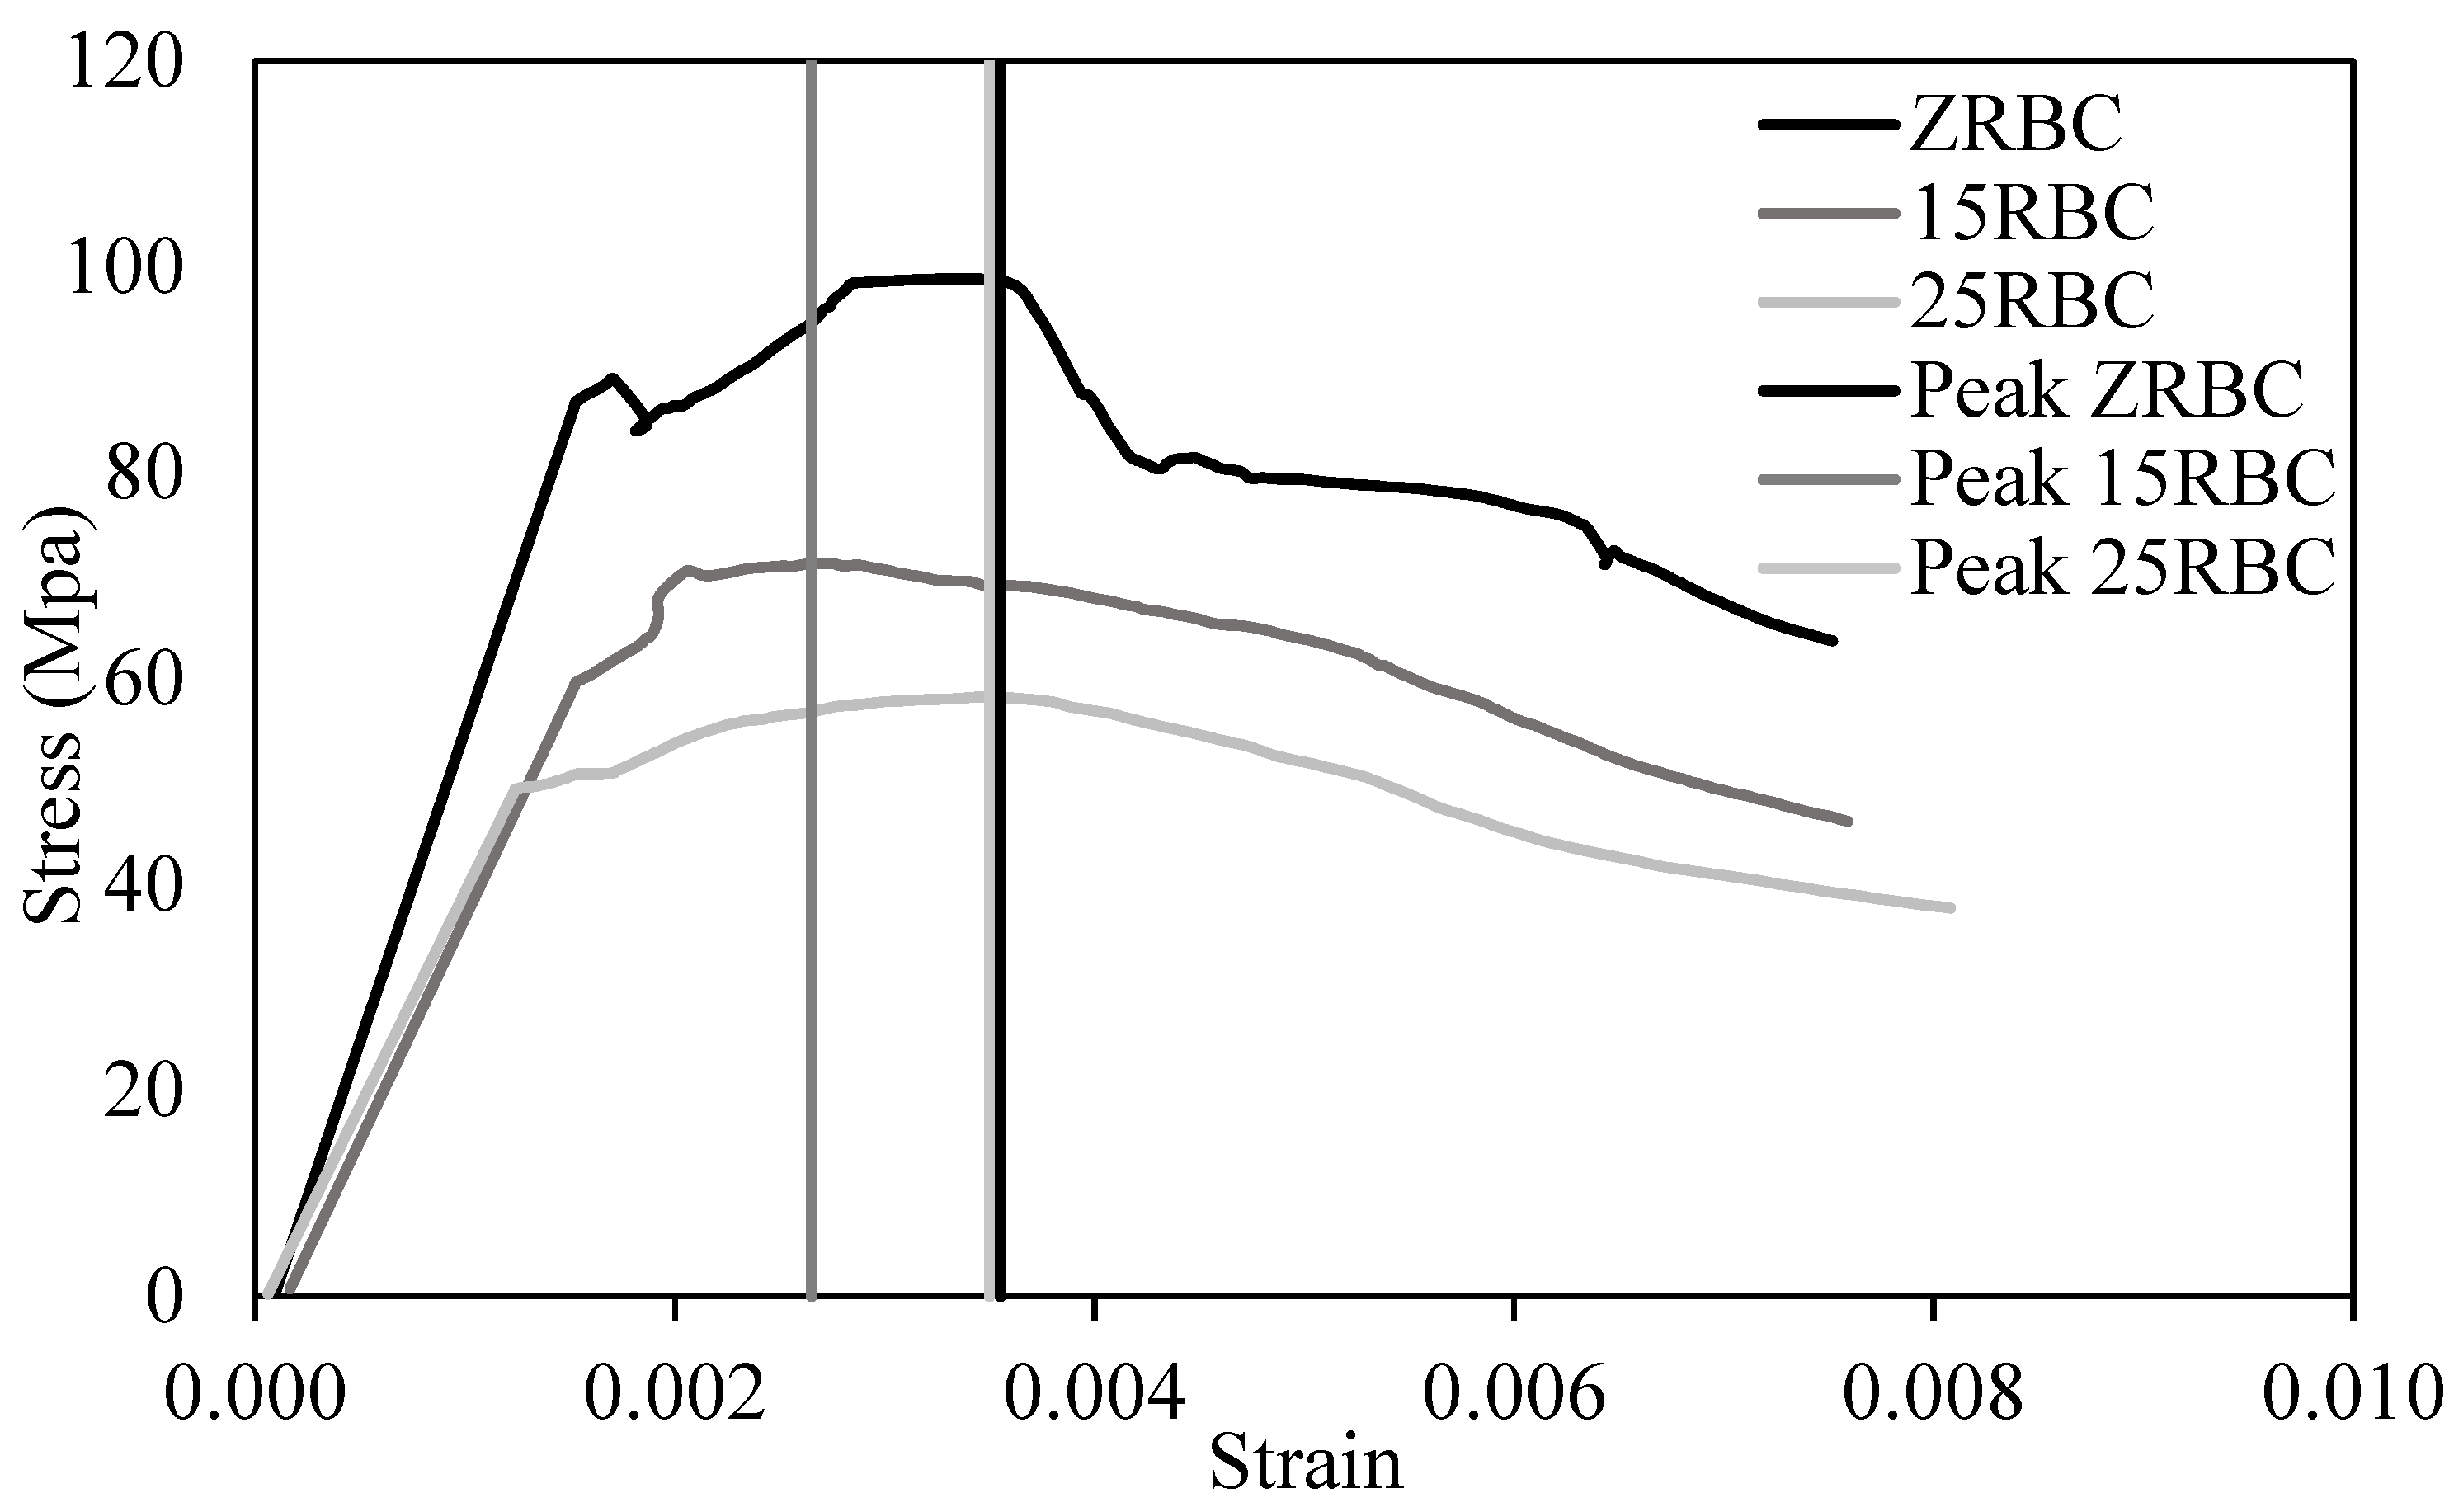
Figure 36 shows the stress-strain behavior of each concrete mixture. As can be seen there the peak strain value of both ZRBC and 25RBC was very closed while the final strain at 40% of the ultimate load was significantly increased in the case of 25RBC in comparison to ZRBC and 15RBC mixtures.

4.2.8. Flexural Toughness

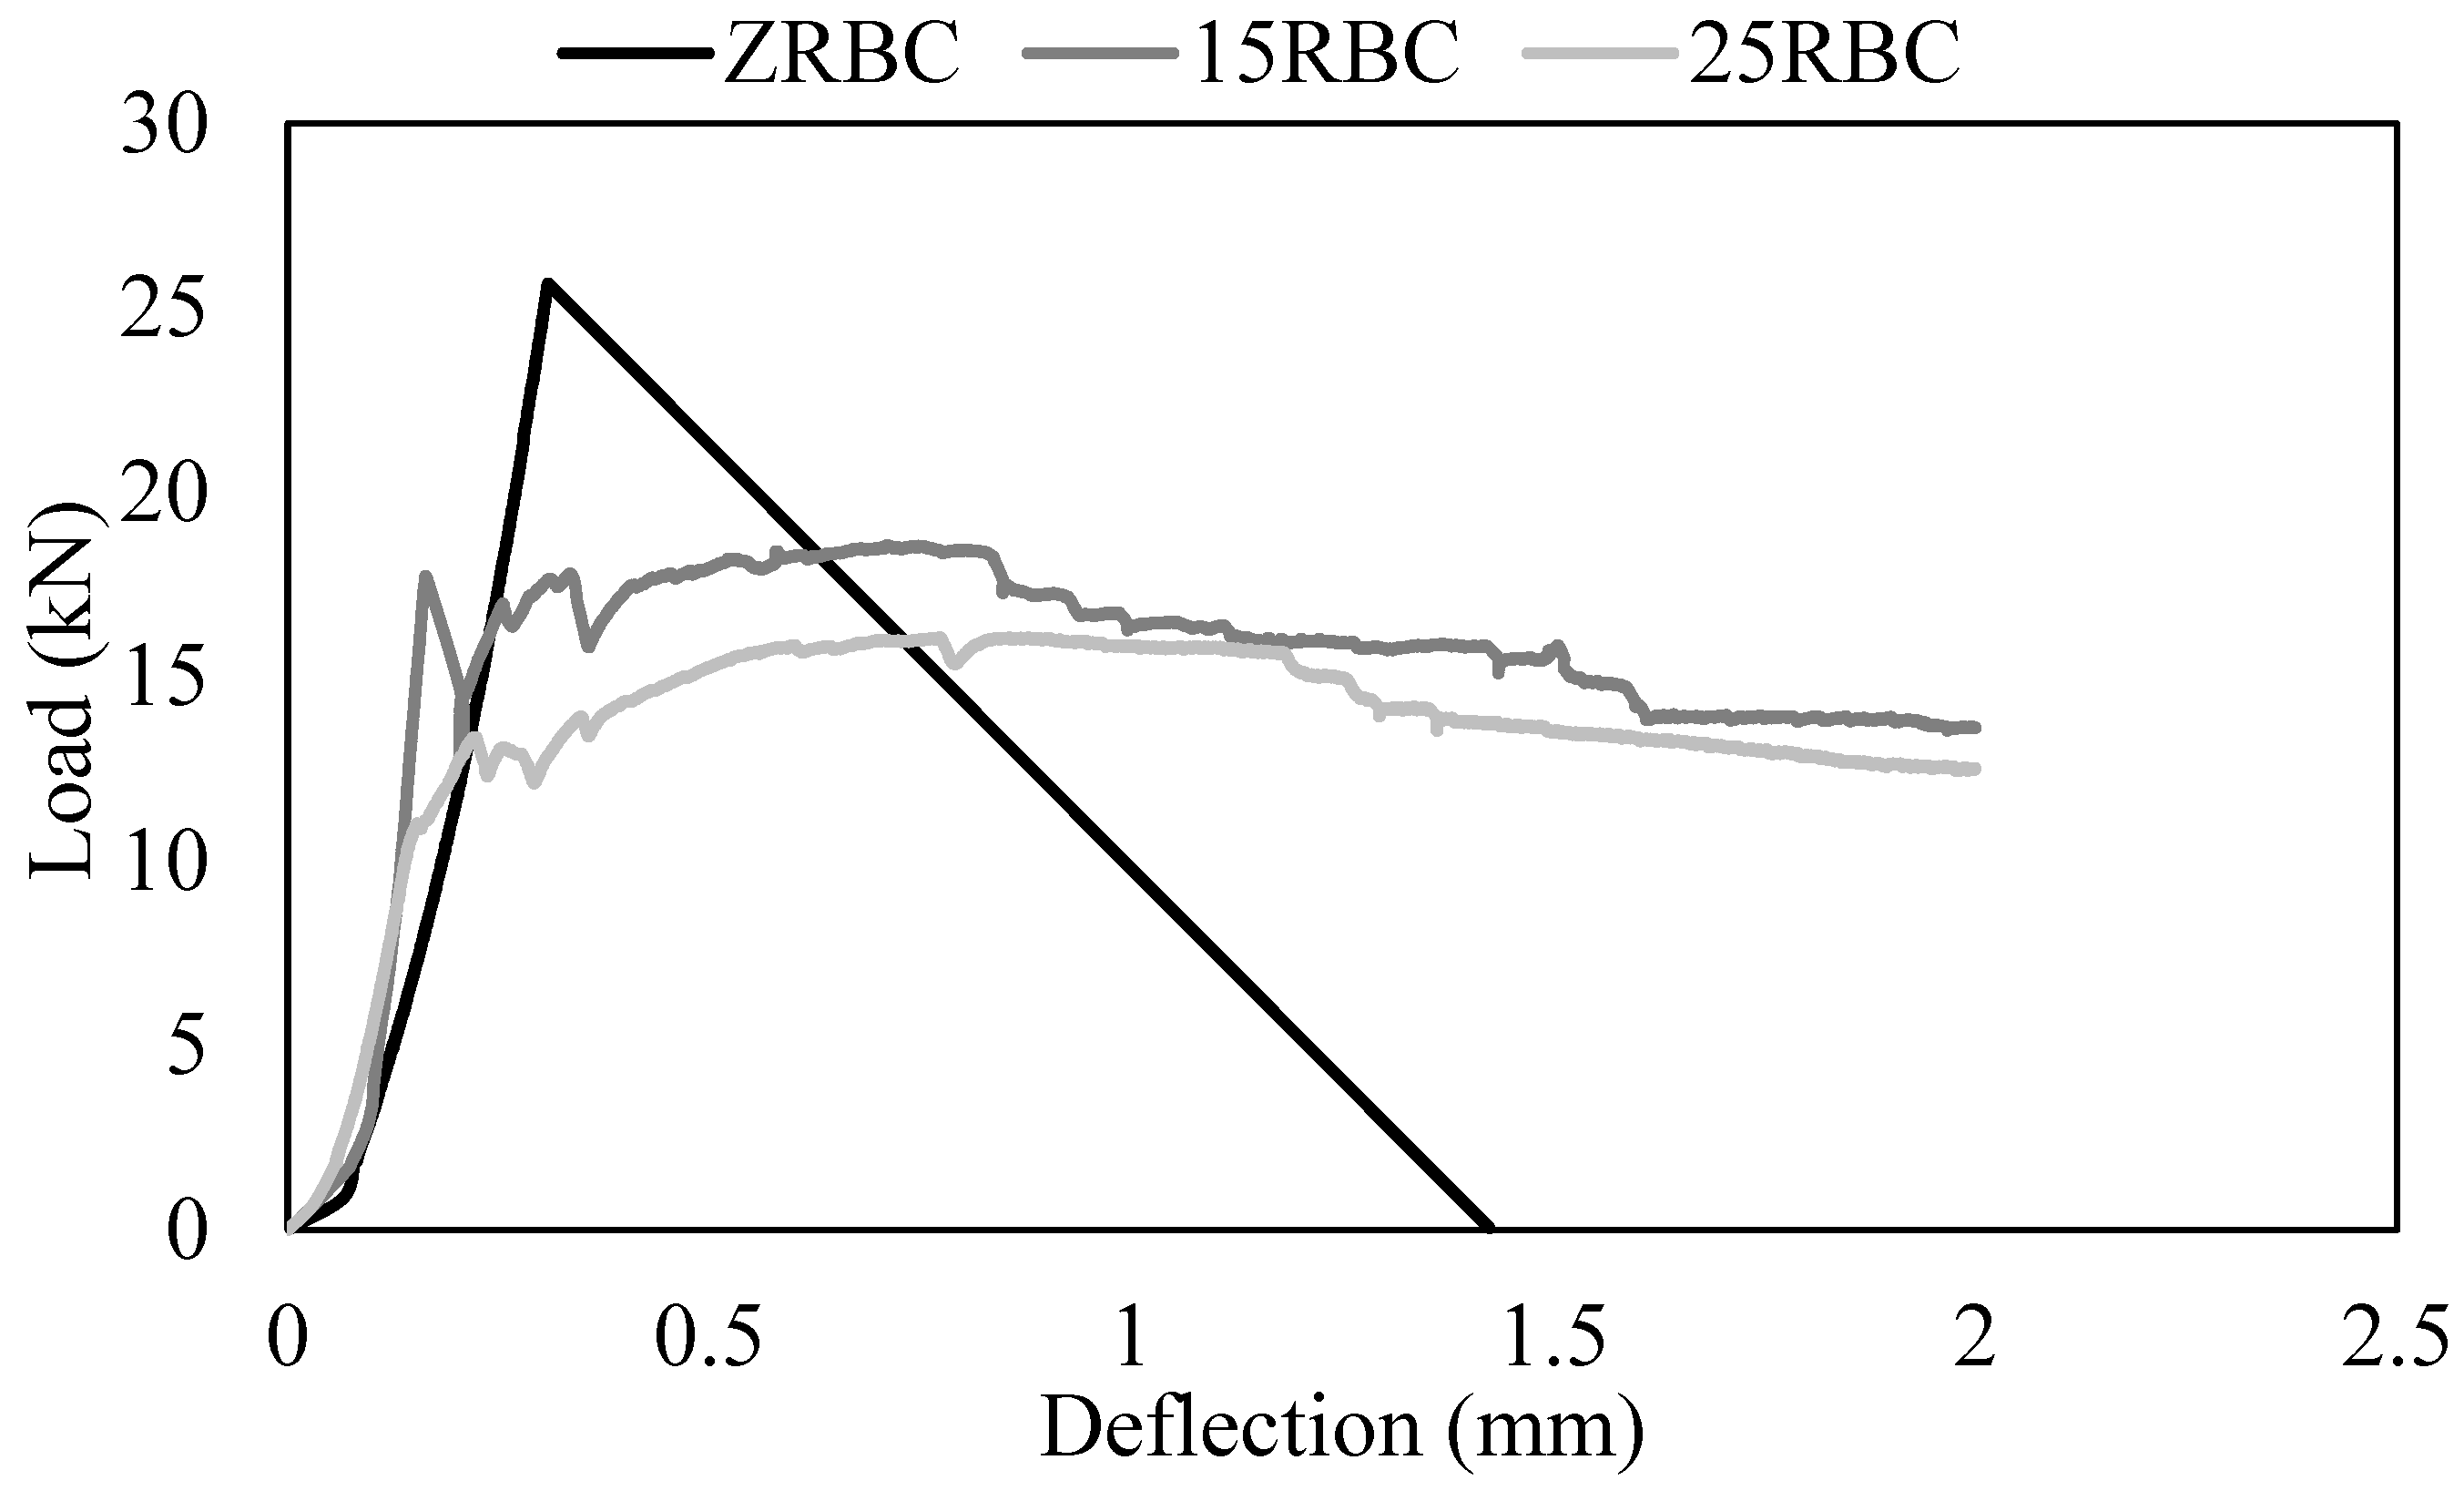
Toughness of concrete is a significant parameter as it represents the energy absorption capacity. As mentioned in the previous chapter ASTM C1609 was be used as a guideline for calculating this parameter. The calculation process composed of finding the area under the load-deflection curve for each concrete specimen shown in Figure 37. As can be seen in Figure 38 both types of RBC have provided a significant enhancement to the energy absorption capacity with a 77% and 59% increase for 15RBC and 25RBC specimens respectively in comparison to the normal mixture. In addition, it can be observed that the energy absorption of 15RBC specimen is higher compared to the 25RBC specimen which is attributed to its higher flexural strength and similar deflection capability.

4.2.9. Water Penetration Test

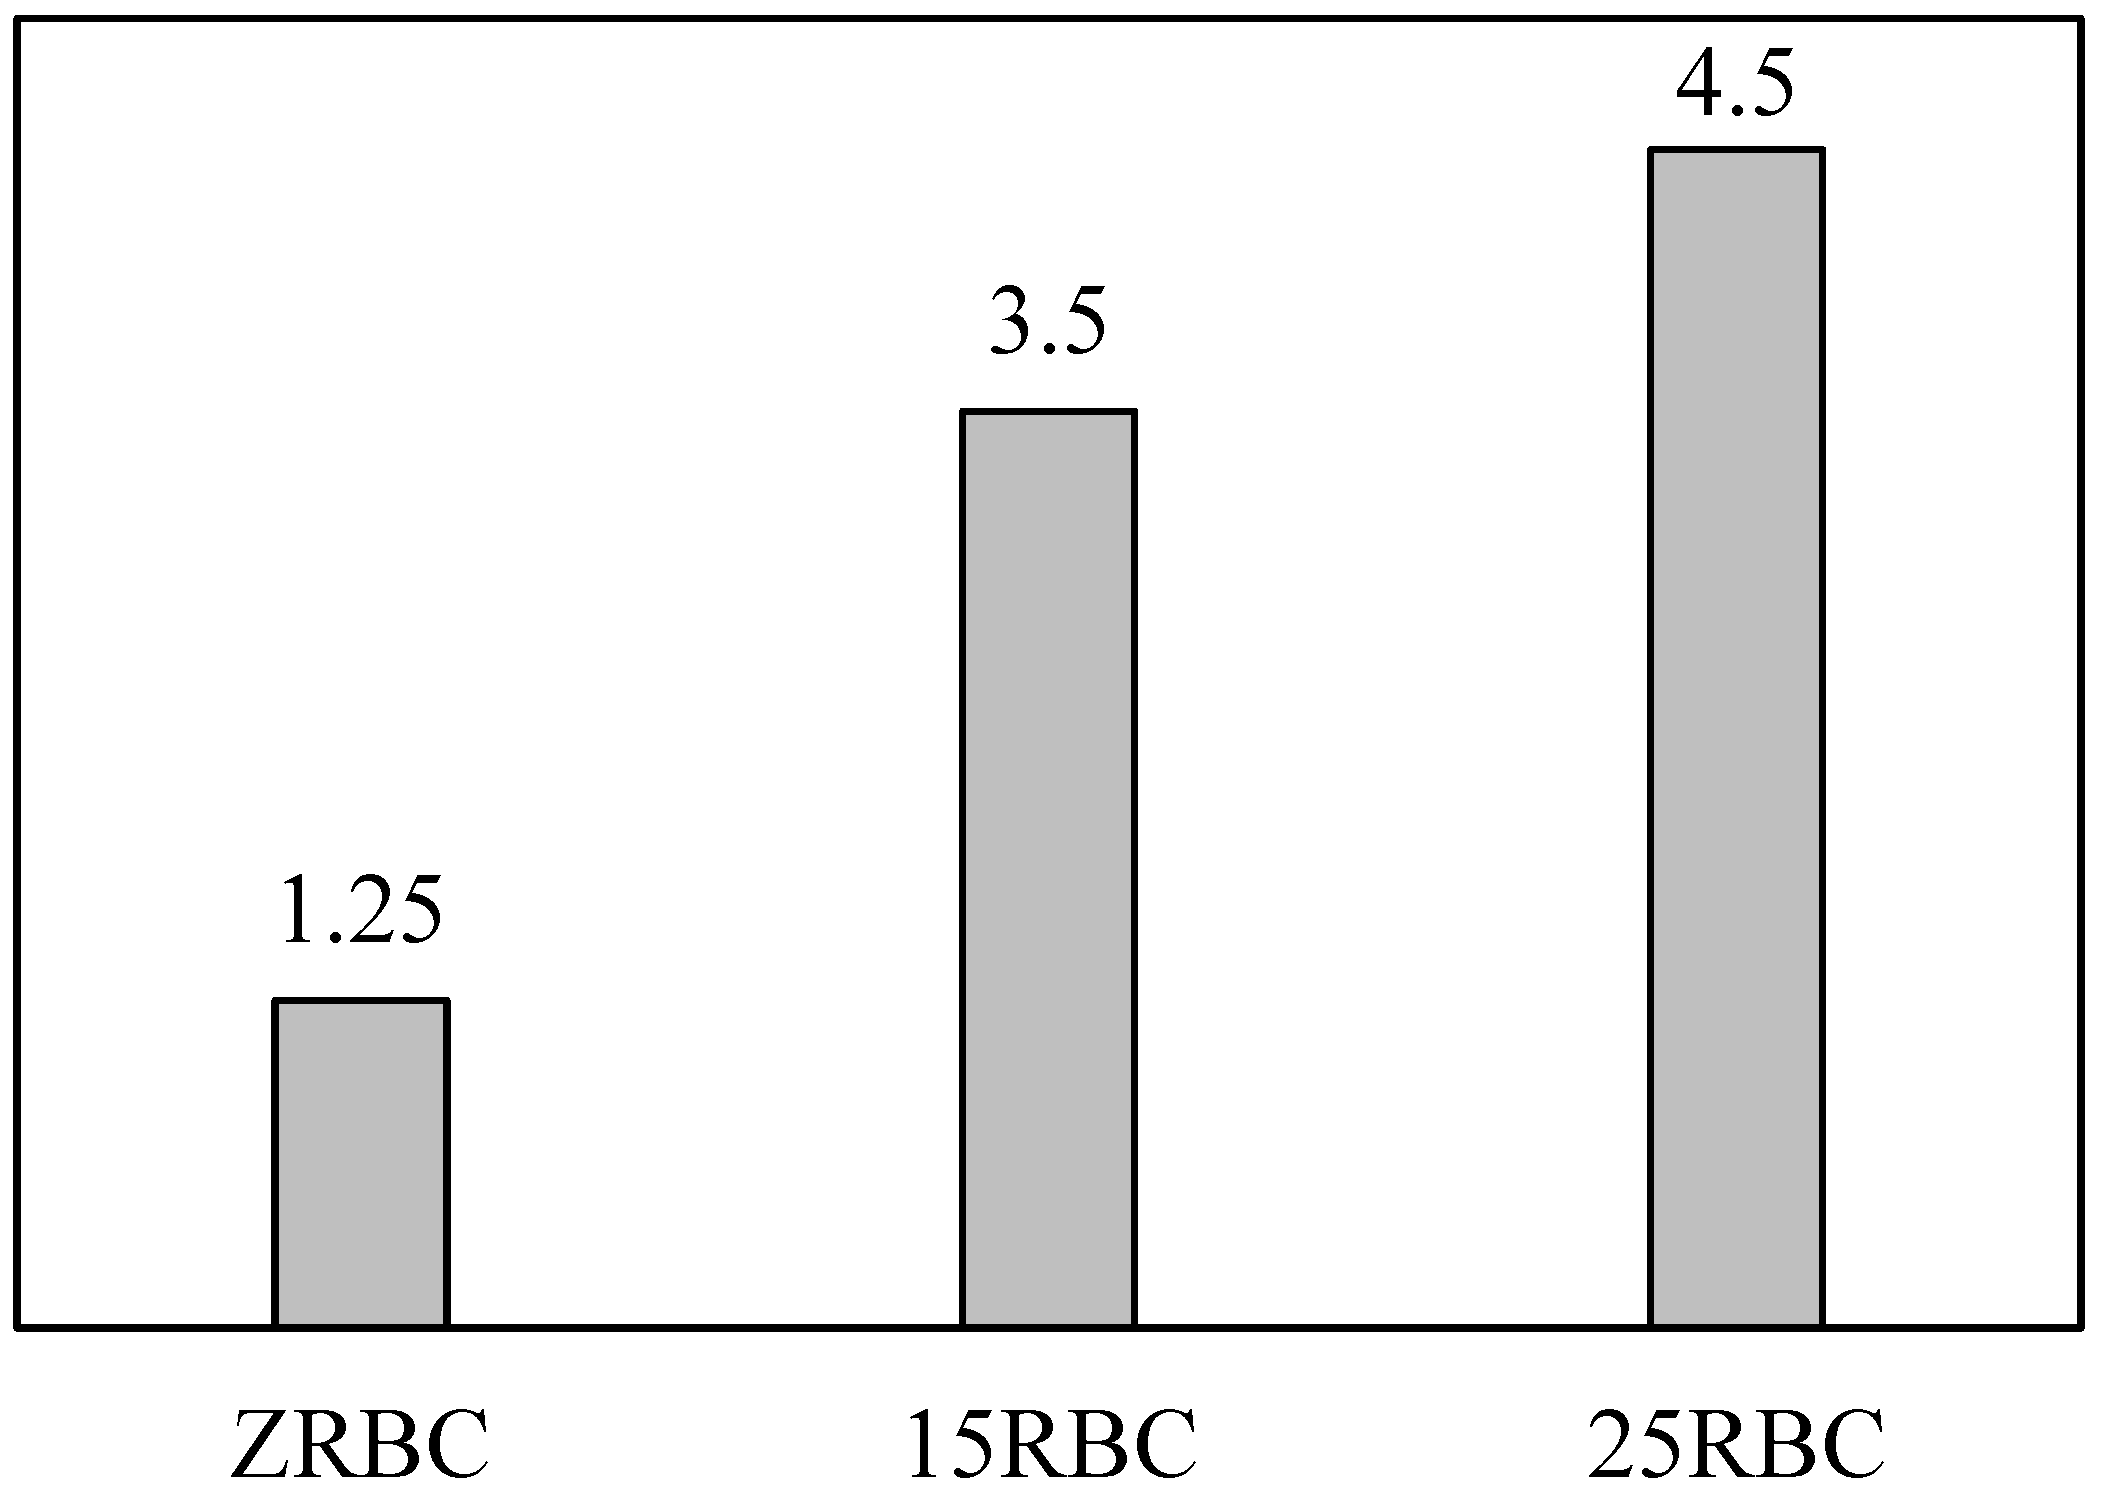
This test was conducted to examine the durability behavior of RBC in comparison to the control mixture. The depth of water penetration of the concrete specimens is shown in Figure 39. In general, the depth of water penetration was very small in all cases (below 5 mm) while the pattern of variation showed an increase with more rubber aggregates being added to the concrete.

4.3. Evaluating the Capability of Available Analytical Model in Predicting the Behavior of Rubberized Concrete

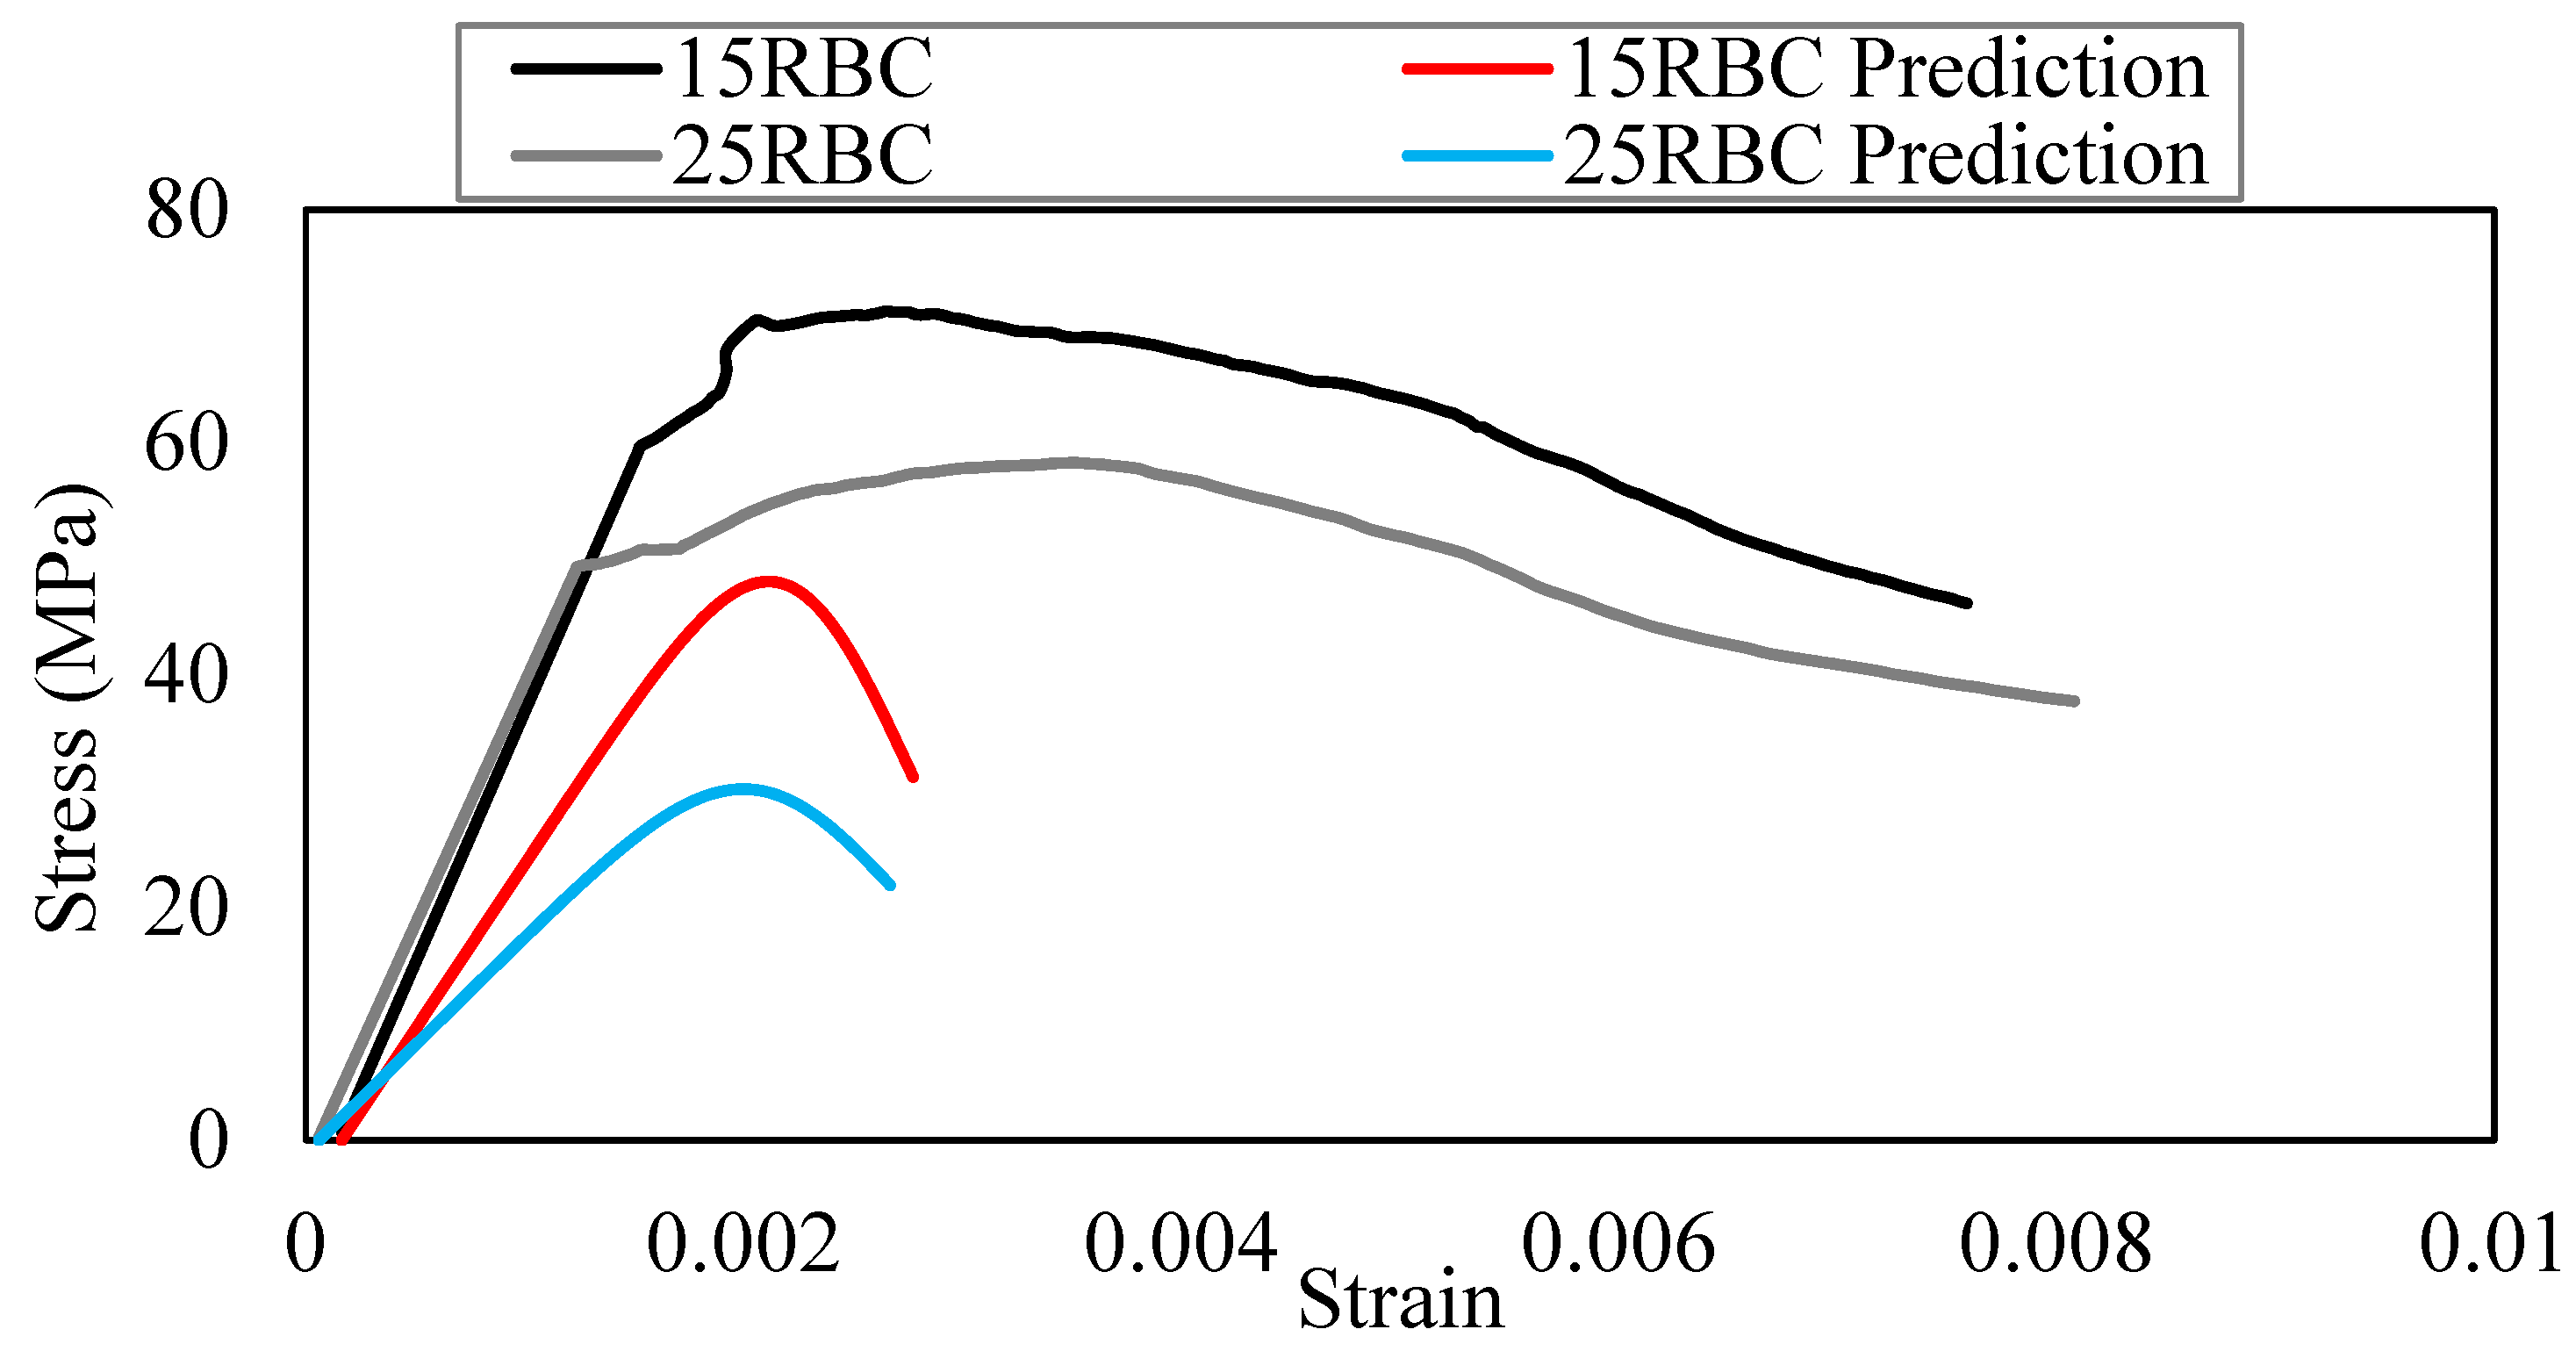
As mentioned in the previous chapter this study will check the capability of (Strukar et al., 2018) constitutive model in correctly predicting the concrete properties and its stress-strain behavior. Both Table 17 and Figure 40 show the results of the selected constitutive model. As can be seen there the model was capable of predicting in the properties of developed RBC, however, the results were very conservative and significantly low in comparison to the experimental ones. This is due to the use of high amount silica fume (30% of the cement) in the production of concrete that worked as a filler and enhanced the bonding between rubber aggregated and cement paste in comparison to other results available in the literature that used relatively low binders in the concrete mixture. Further, predicting the full stress-strain curve using this model is divided into two main regions, in which the first one represent the pre-peak part of the curve which seems to be good knowing that the model provides a conservative estimation and the second one is the post-peak region which was not very accurate as it simulated the behavior of high-strength concrete rather than RBC that has a wider strain range at a small decrement of load.

4.4. Free Vibration Behavior of Concrete

4.4.1. Damping Ratio

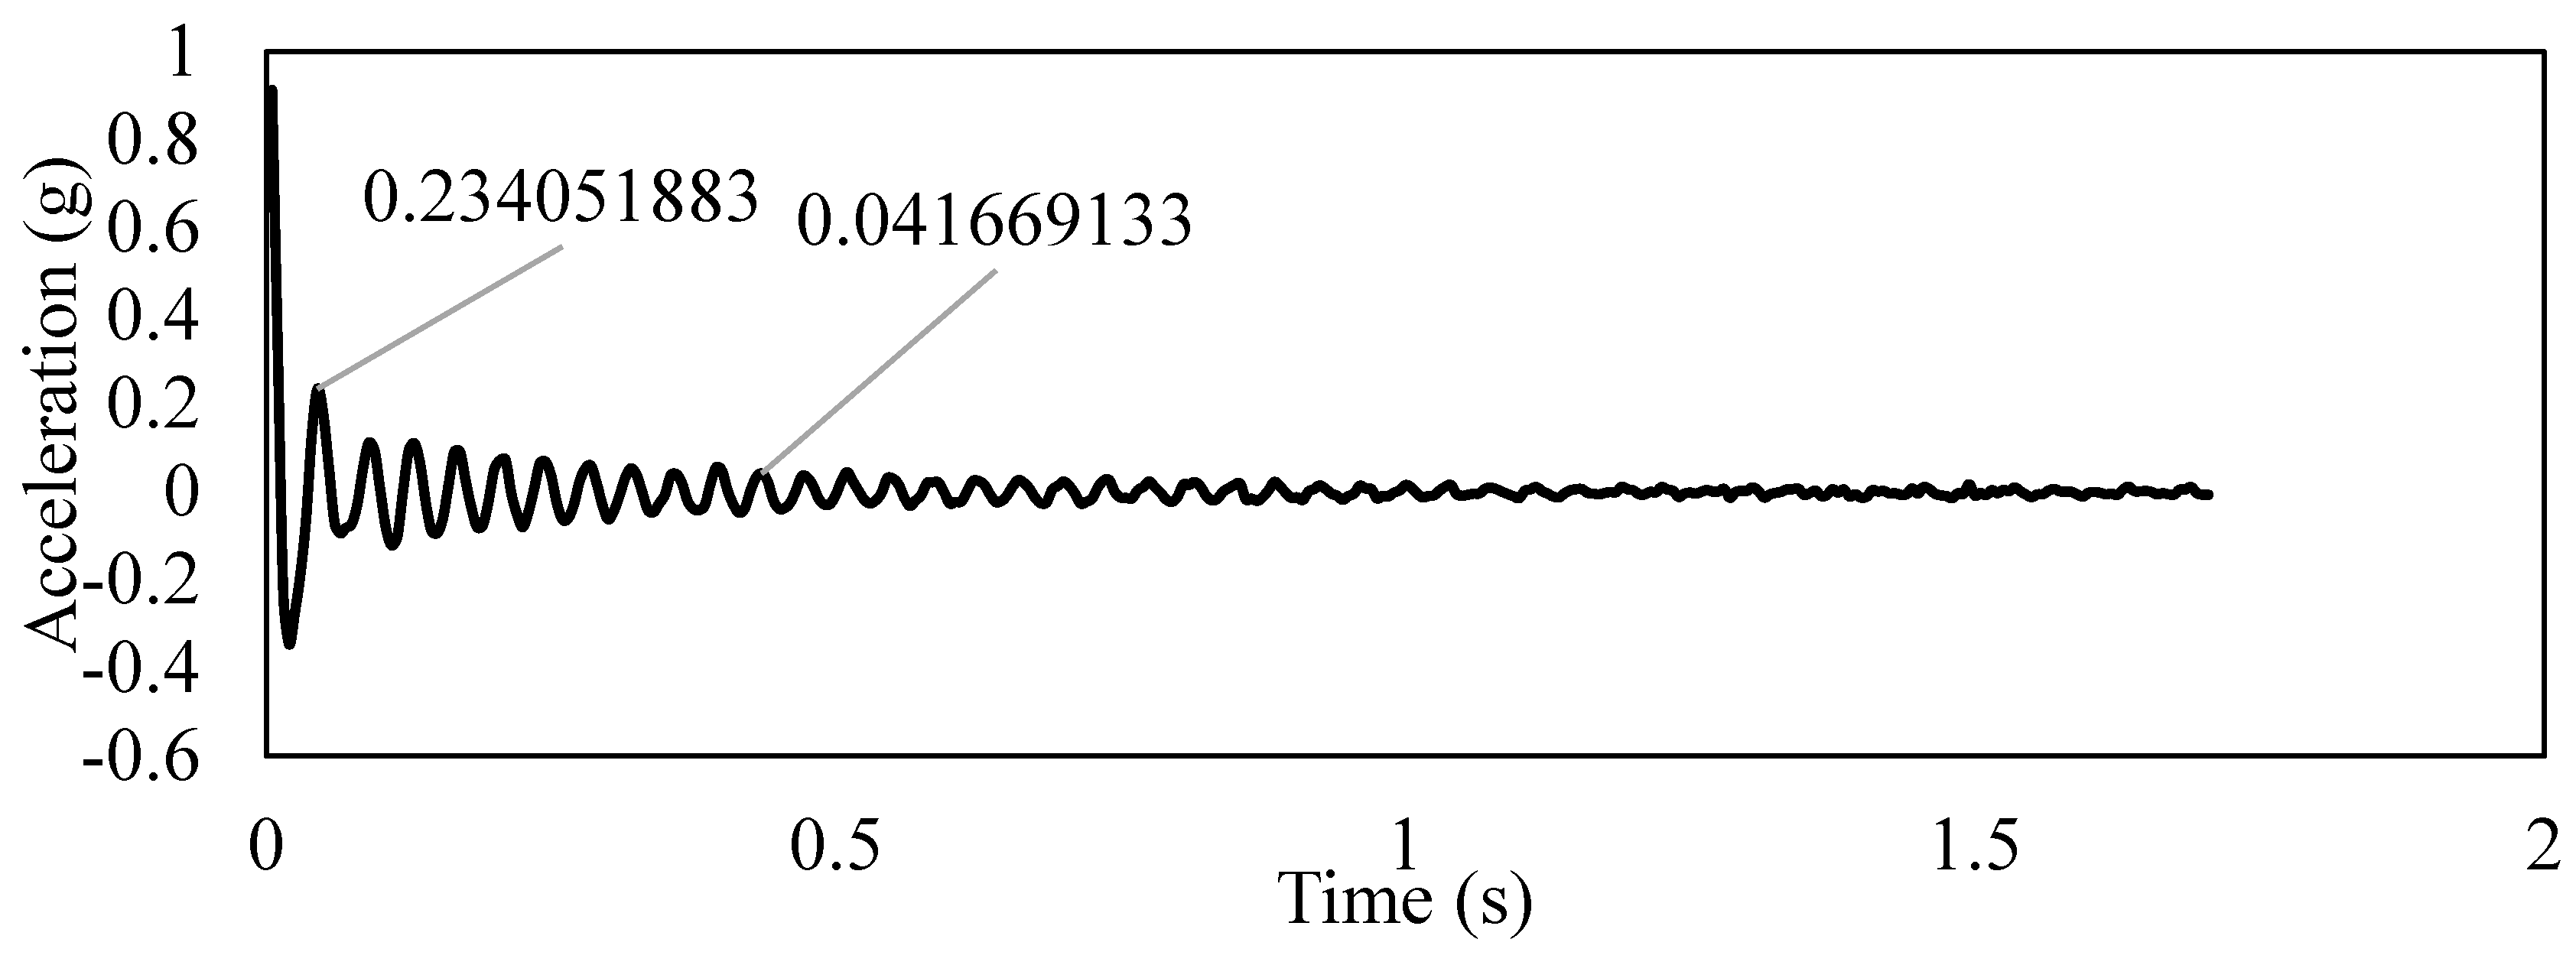
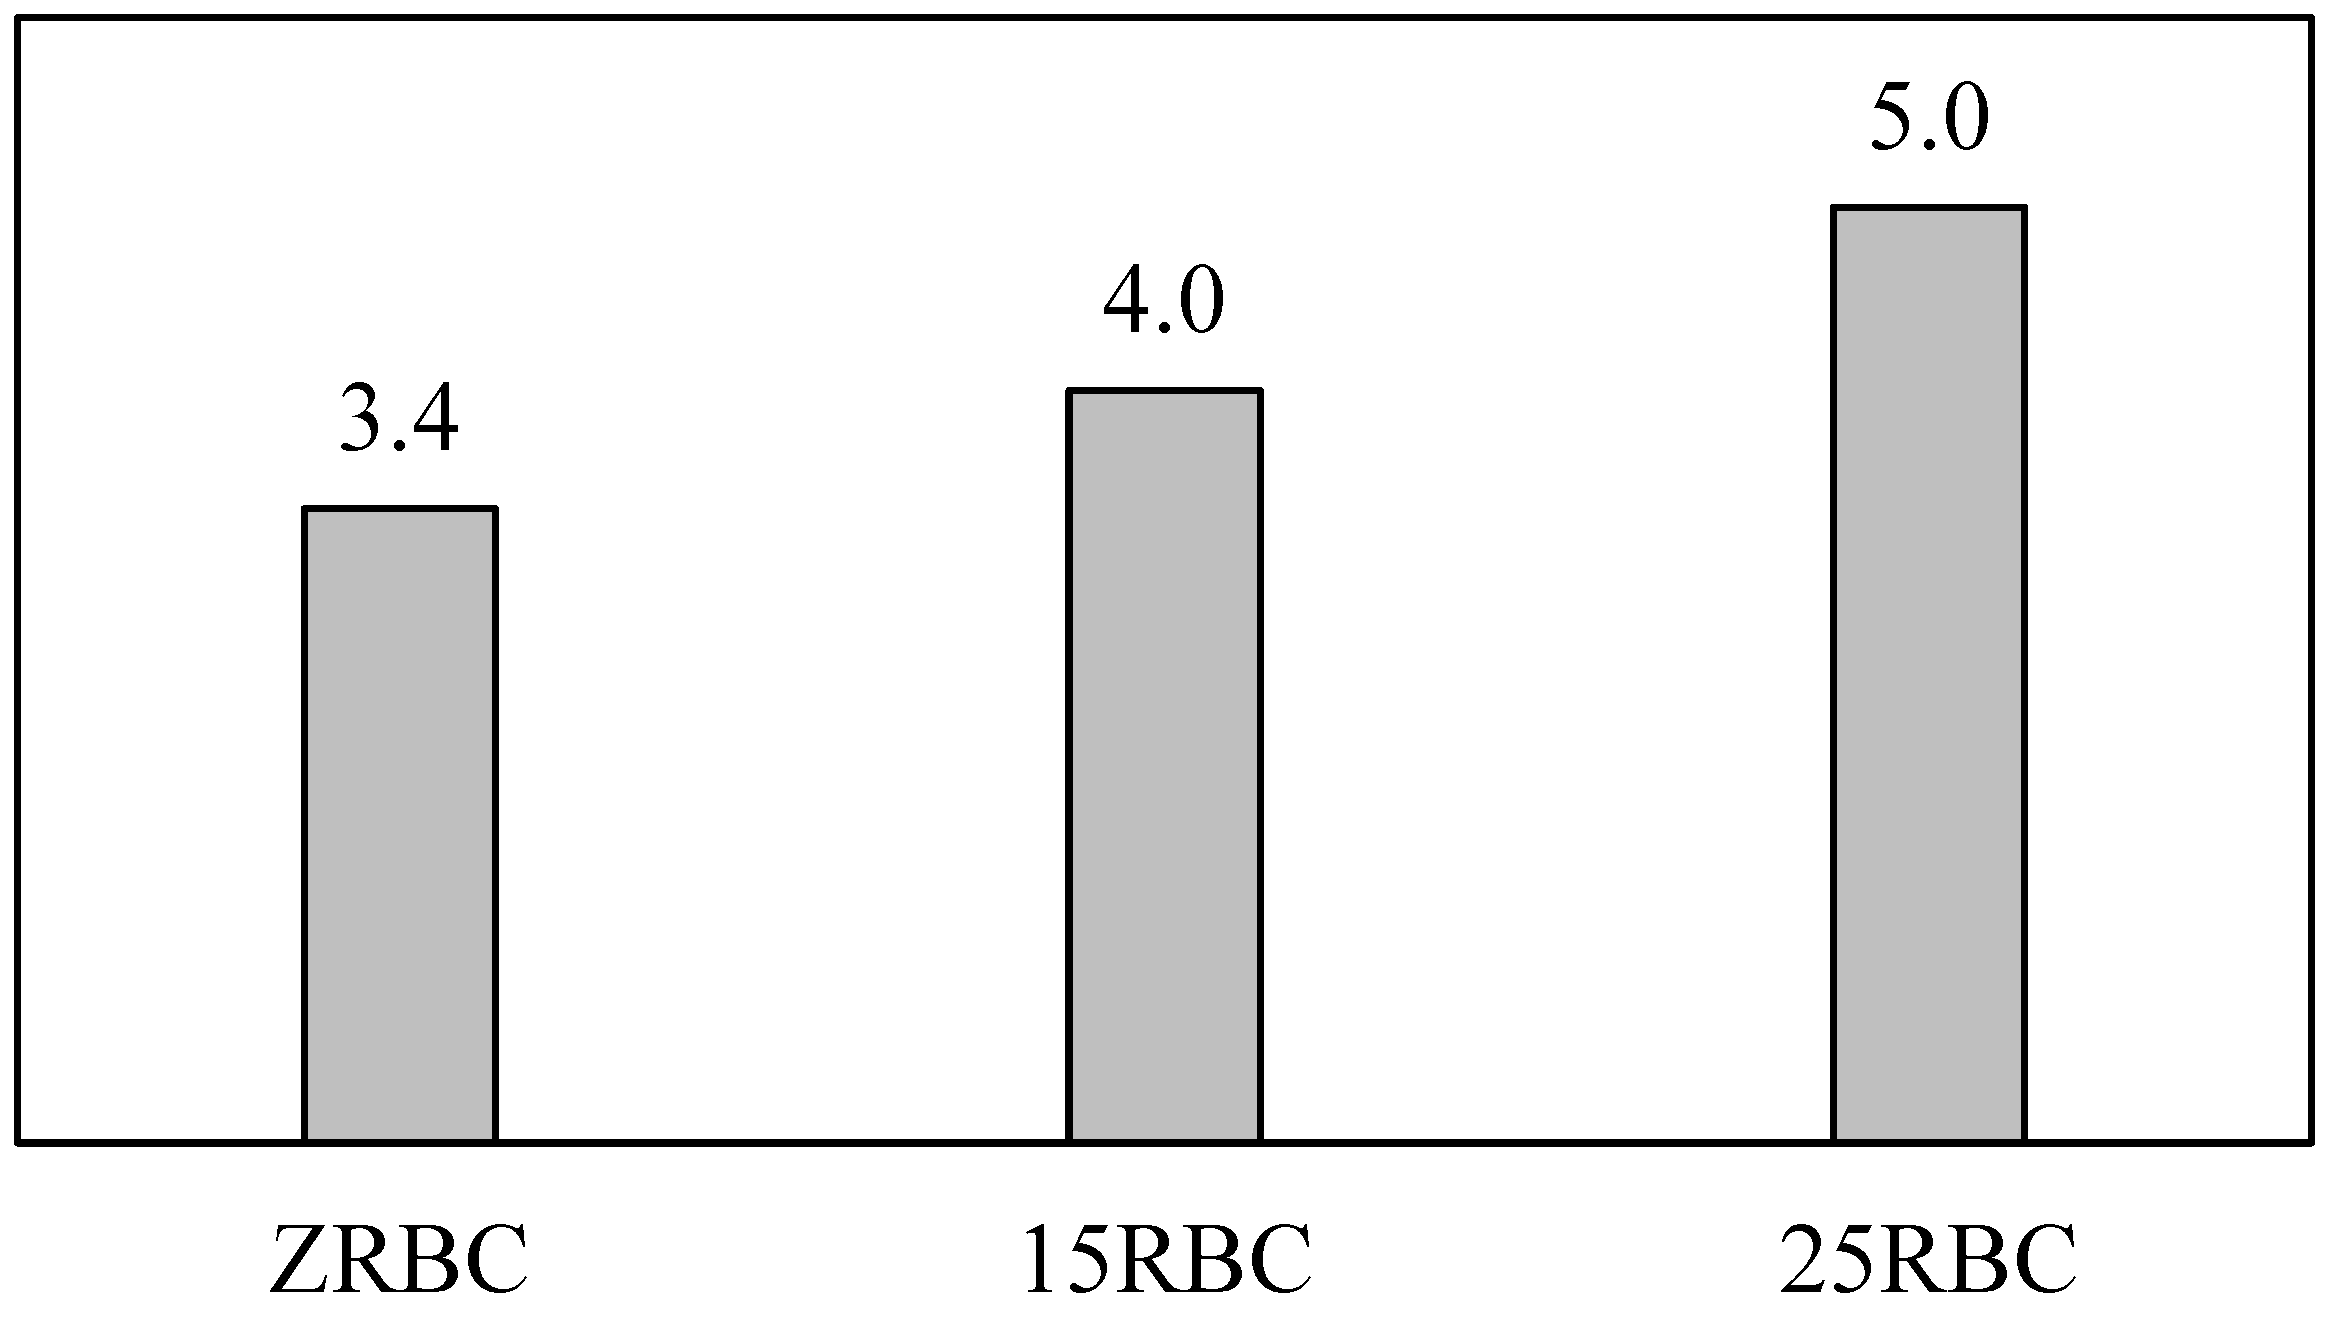
Figure 42 and Figure 43 shows the free vibration behavior of each concrete specimen for five repeated impact loading. Generally, the damping ratio of concrete was calculated using ten cycles as shown in Figure 44 for 15RBC specimen. Furthermore, as can be seen in Figure 45 results of the test showed that using rubber in concrete increases its damping ratio significantly with almost 18% and 47 % for 15RBC and 25RBC samples respectively. These enhanced vibration behaviors will considerably improve the damping energy of concrete structures in comparison to conventional concrete.

4.4.2. Natural Frequency and Dynamic Modulus of Elasticity

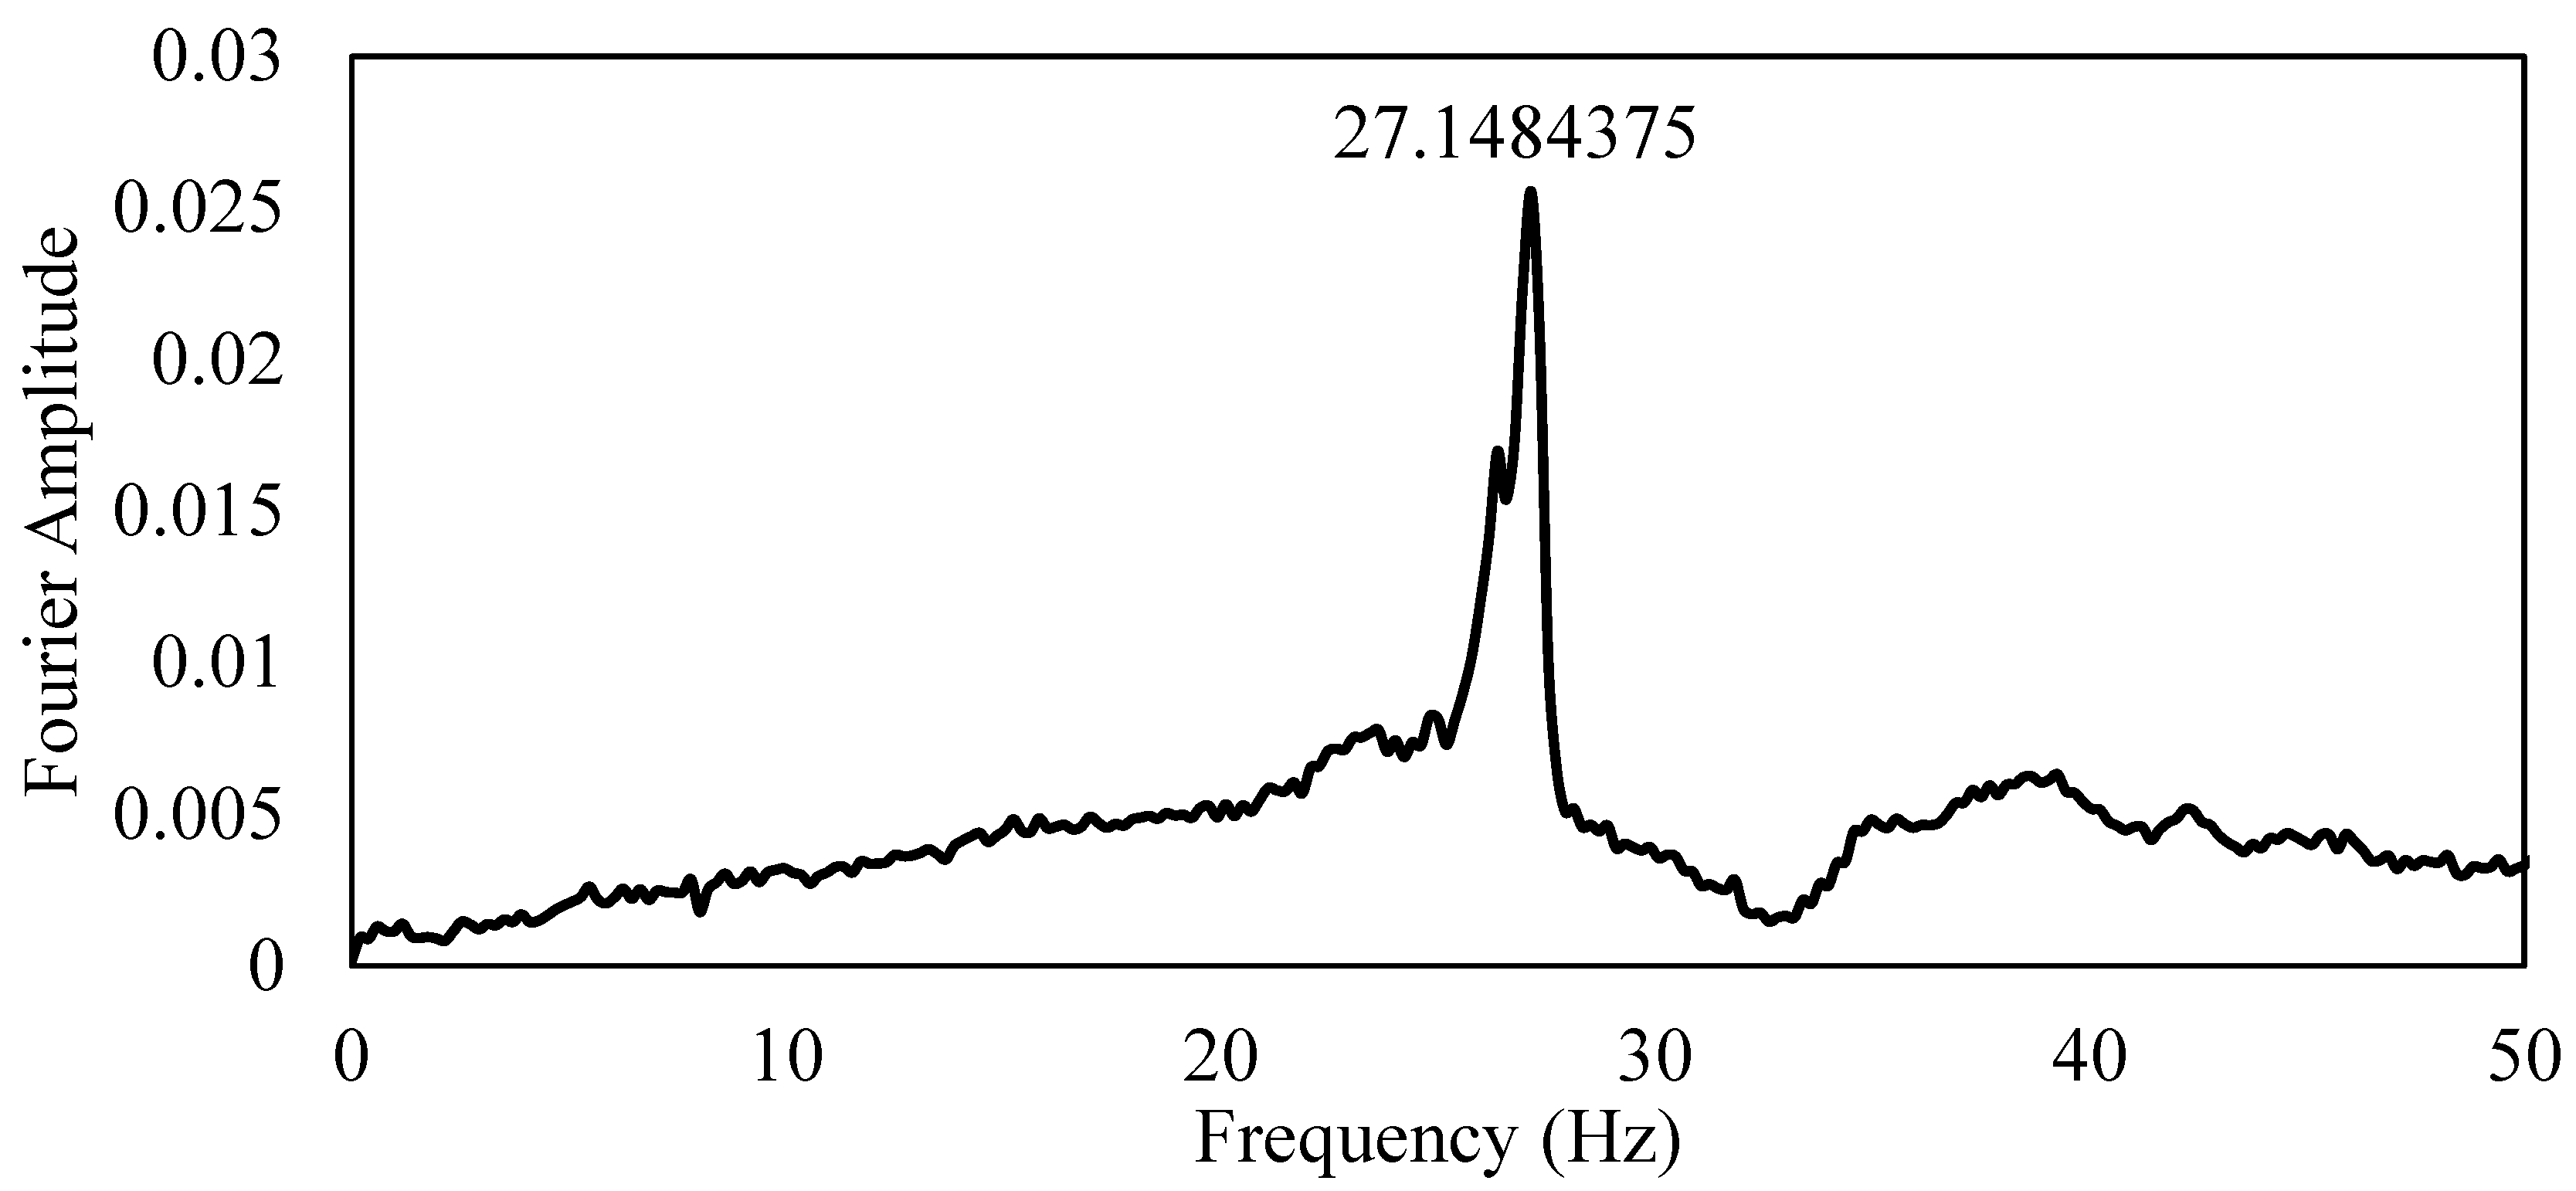
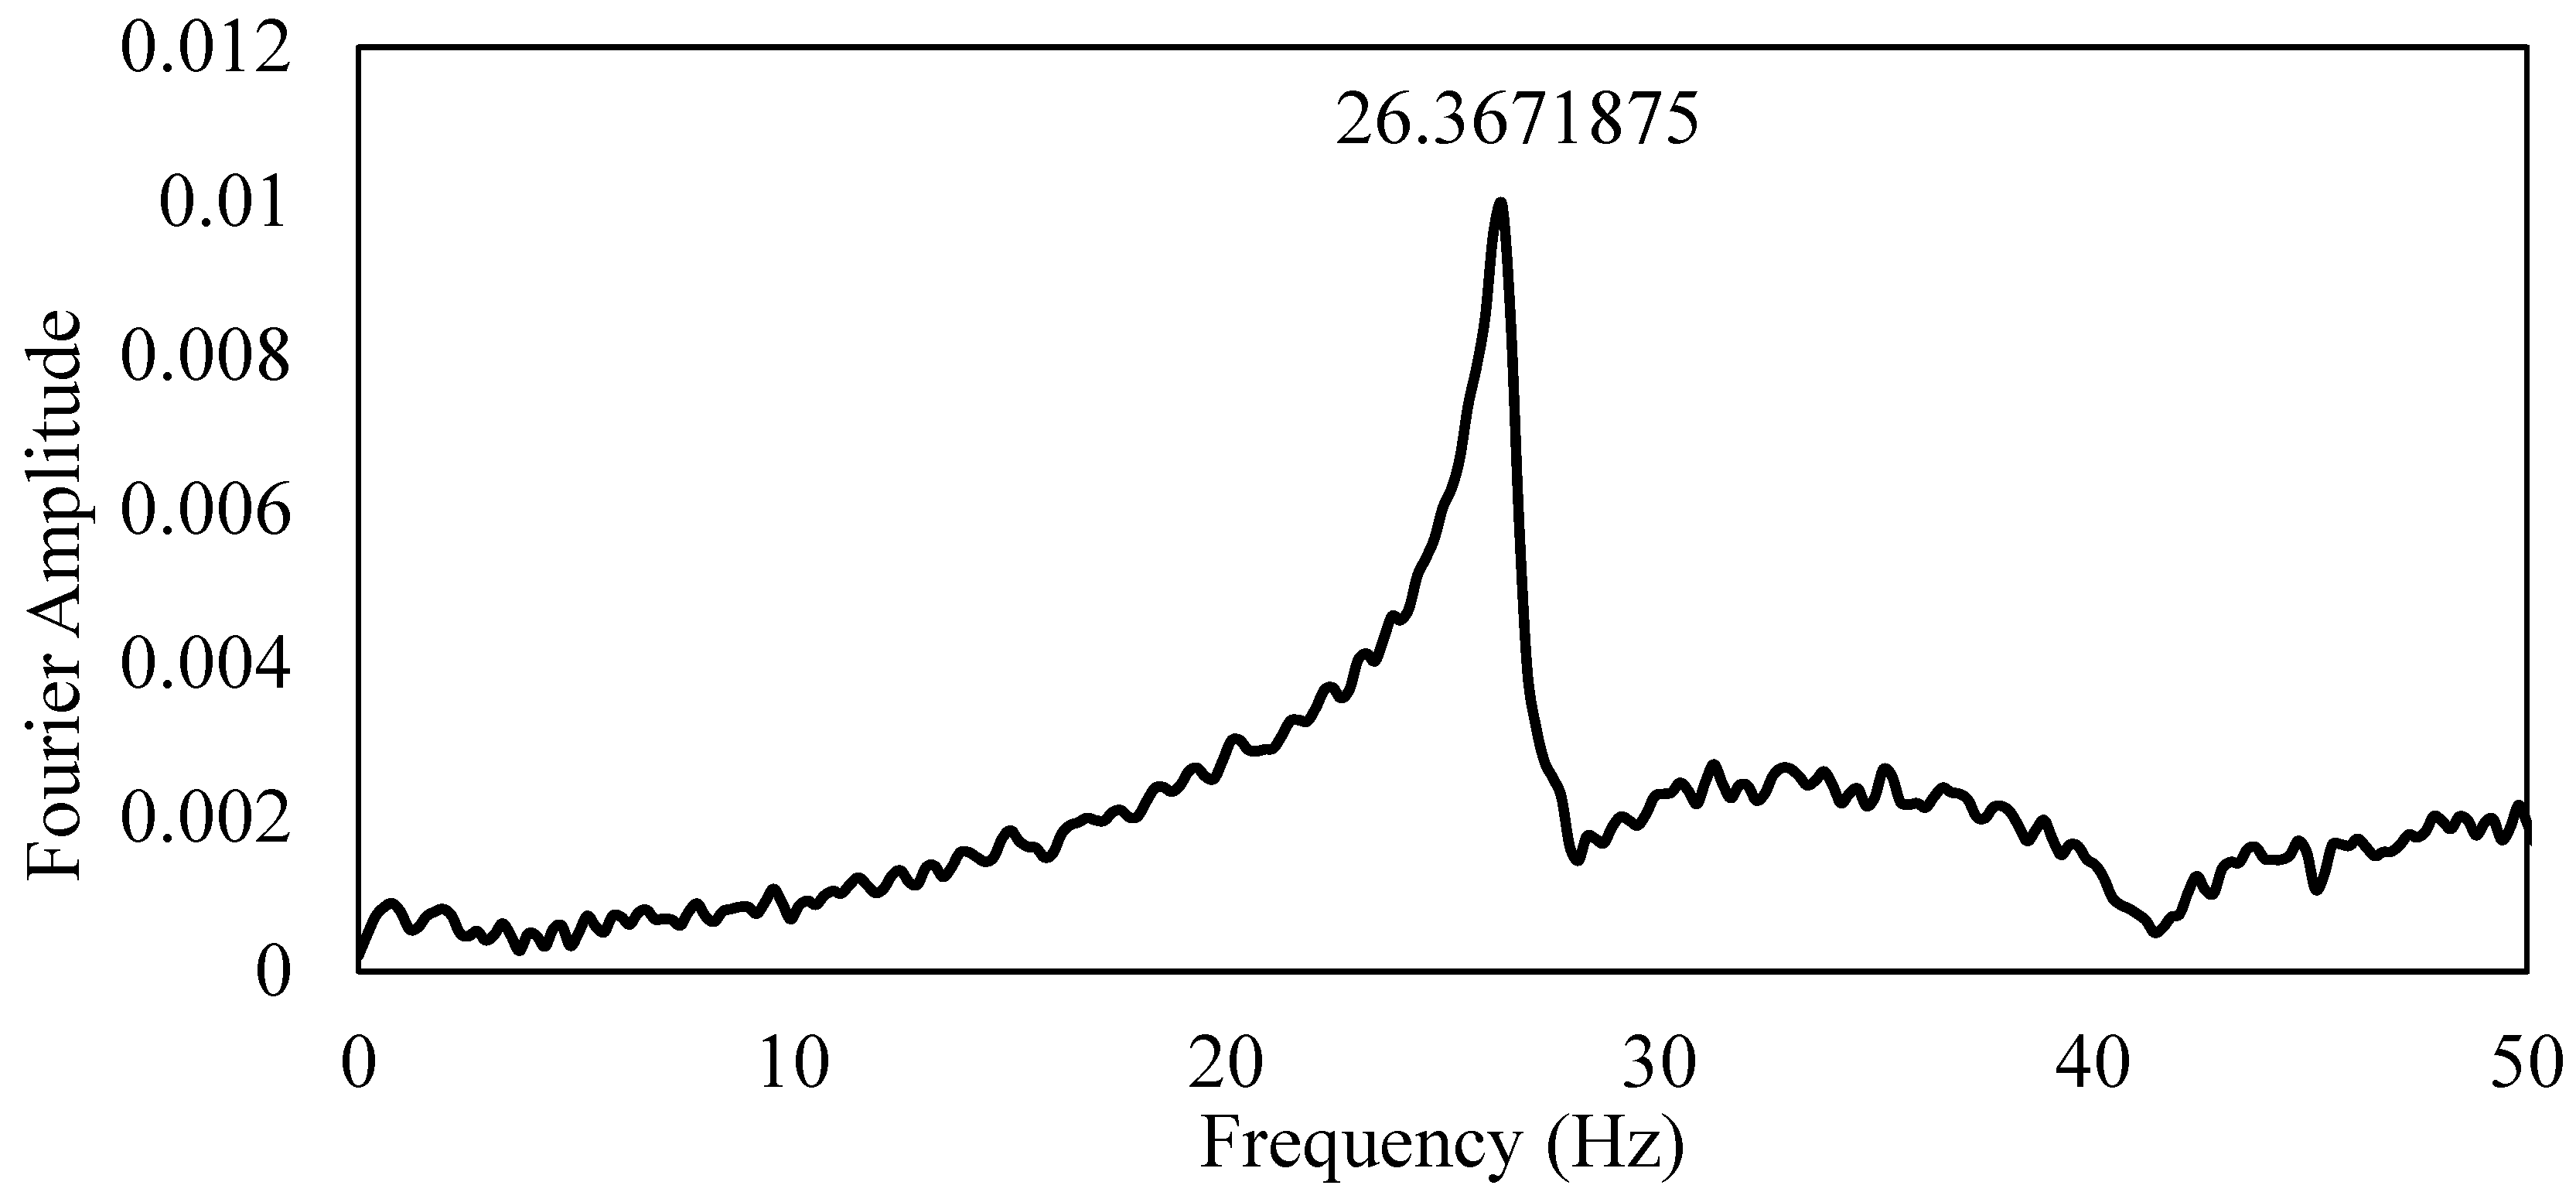
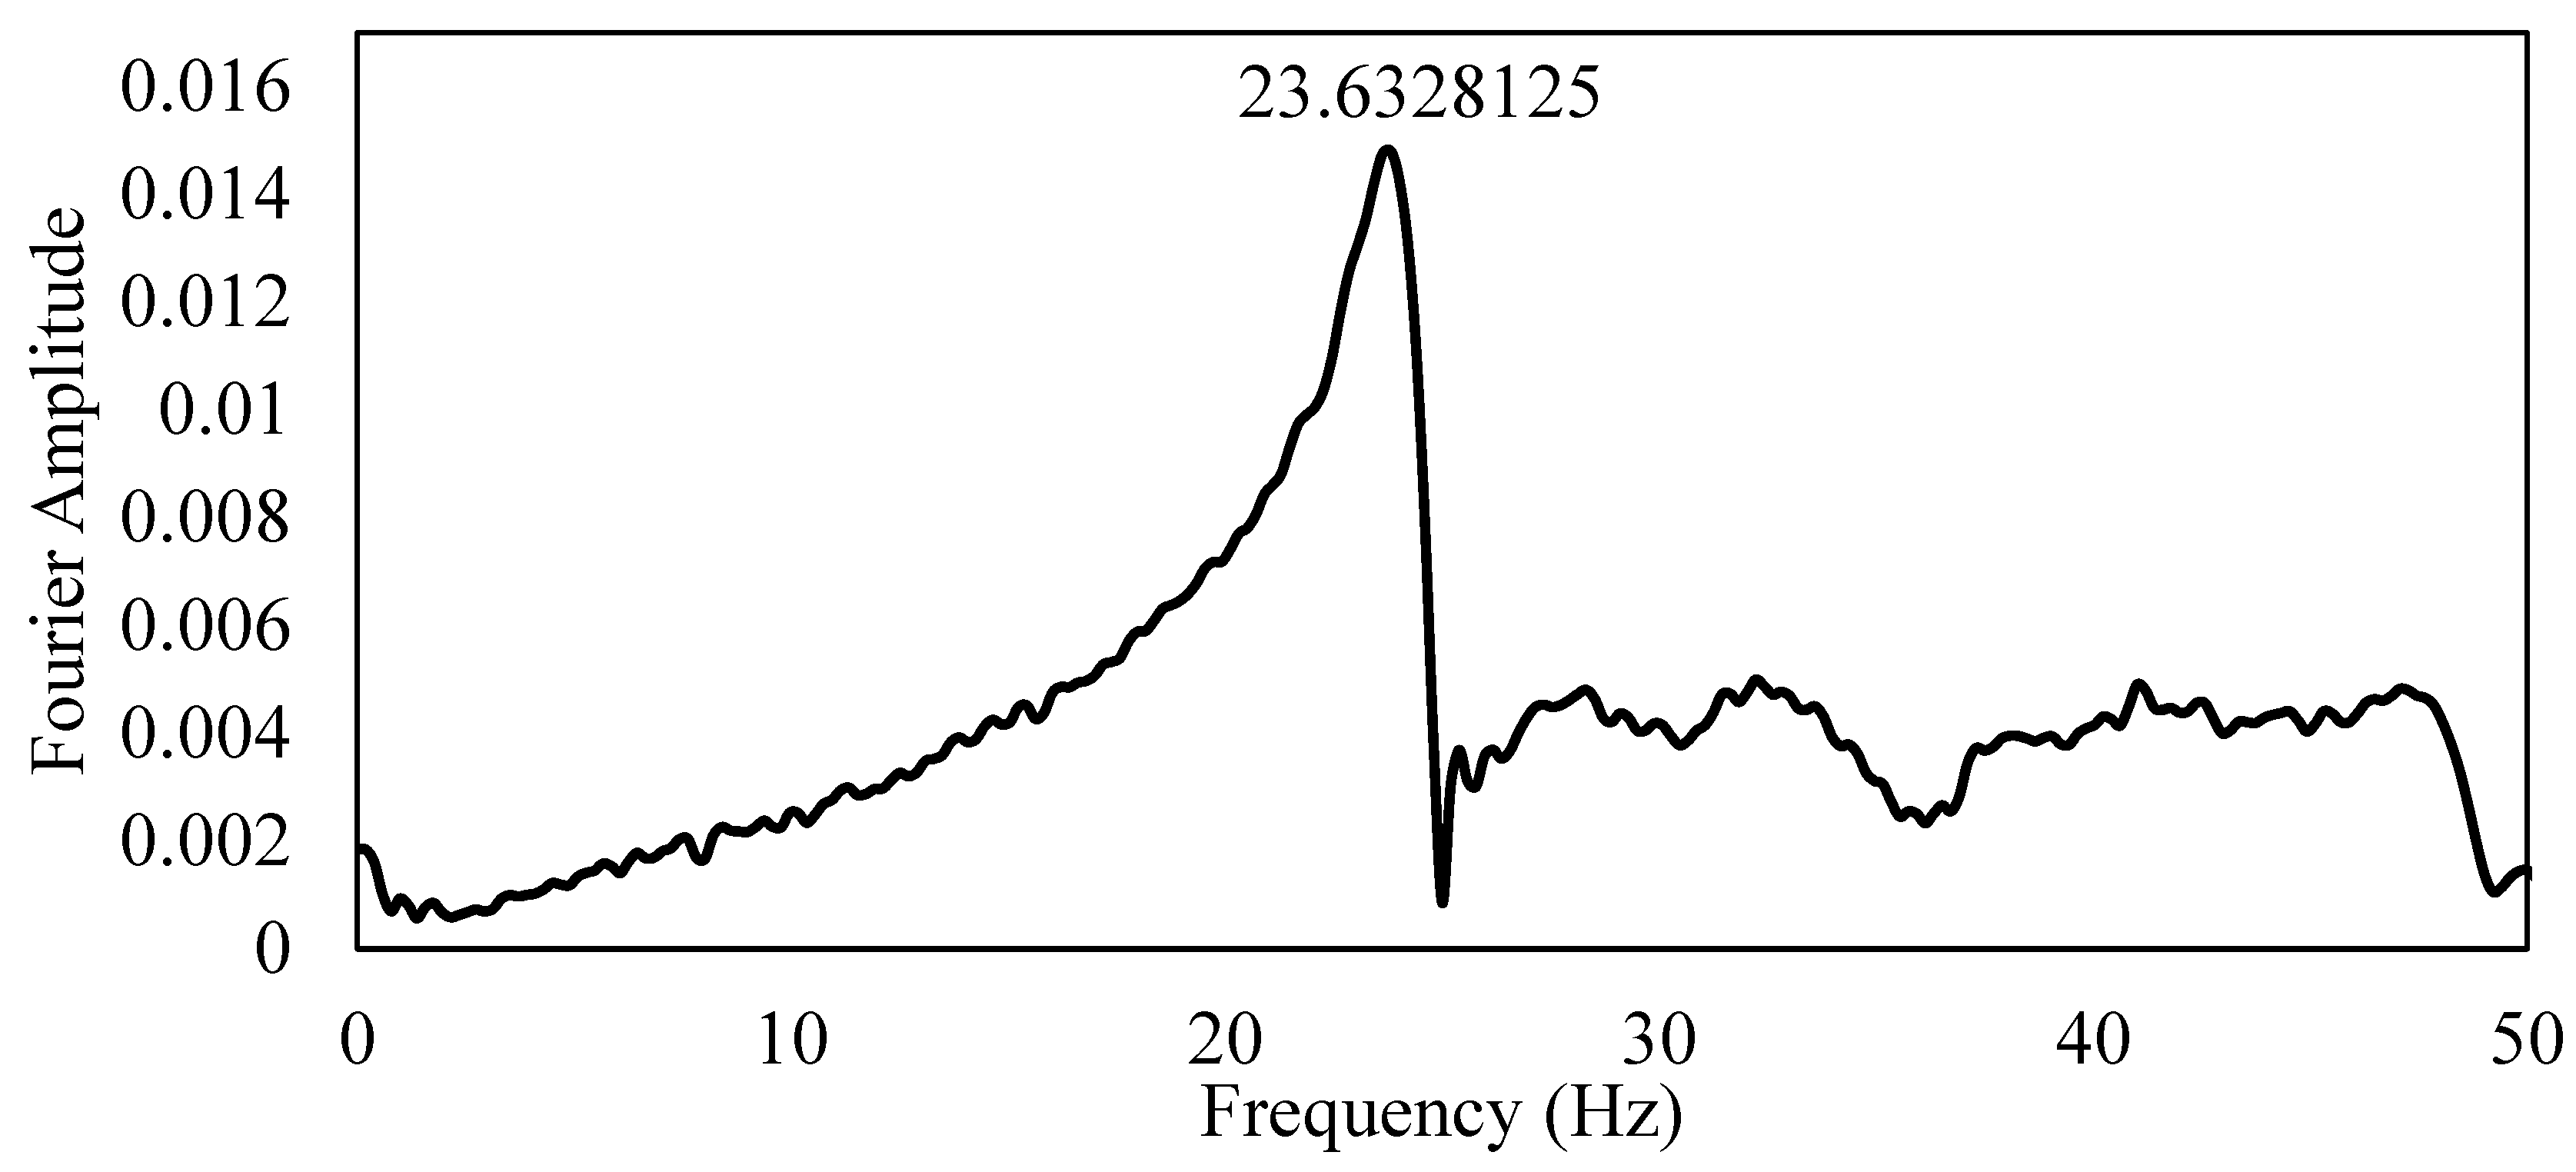
Figure 46, Figure 47 and Figure 48 shows the results of the Fast Fourier transform (FFT) and the natural frequency of each concrete mix. As can be seen there, the frequency of concrete was dropping as the rubber ratio is increasing due to the drop in its modulus of elasticity.
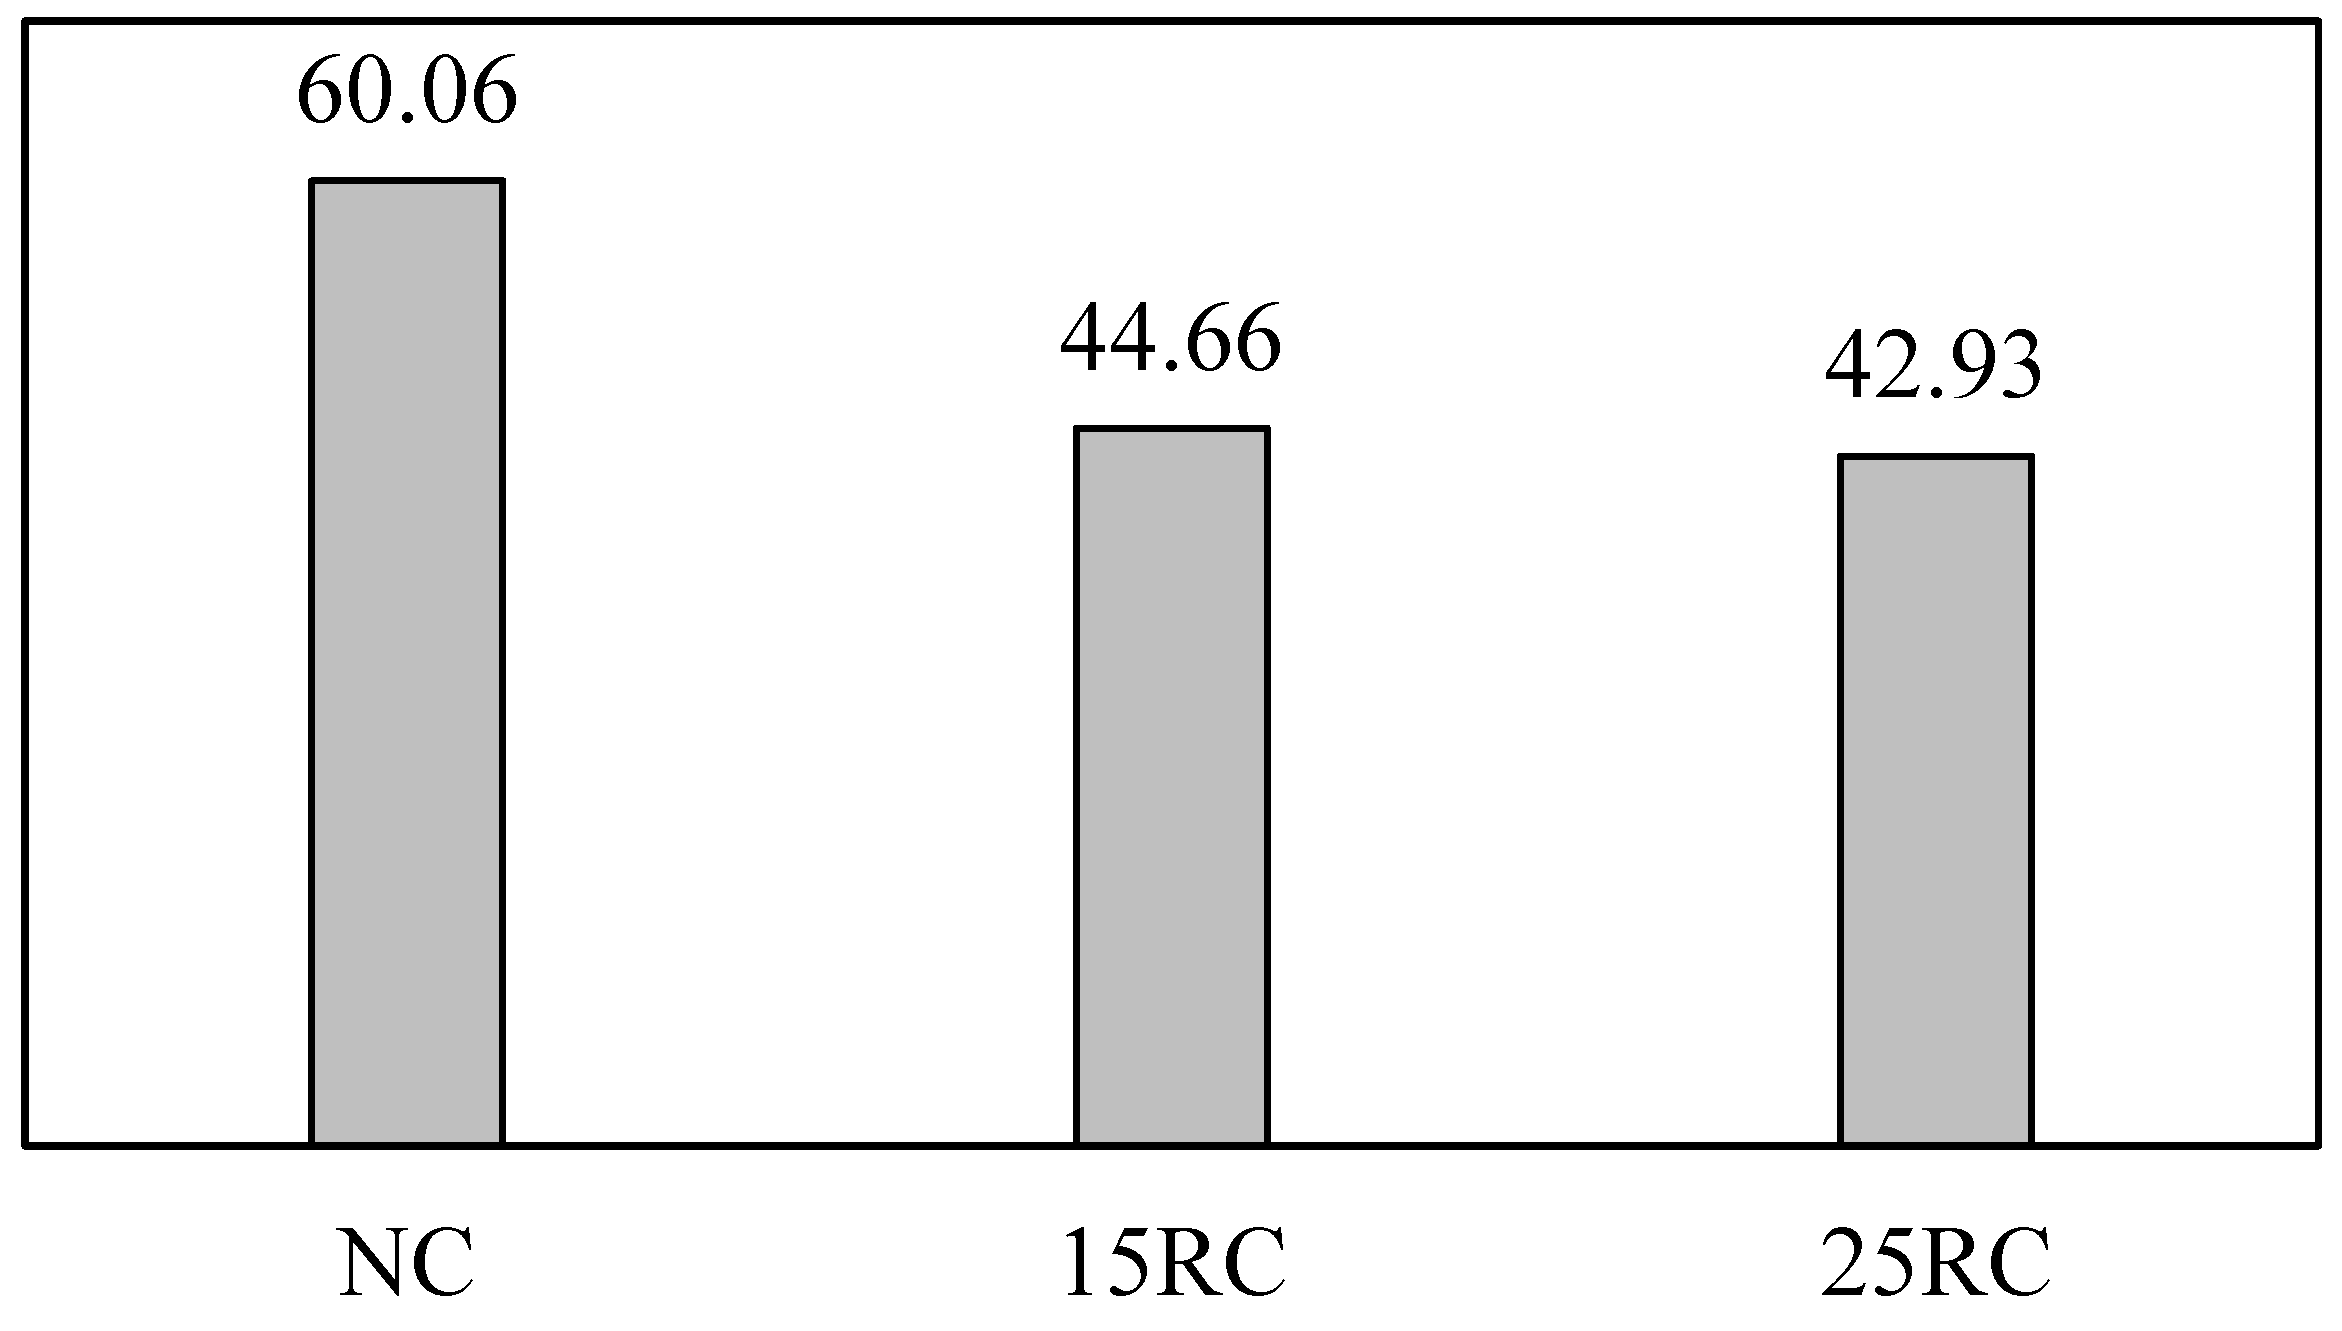
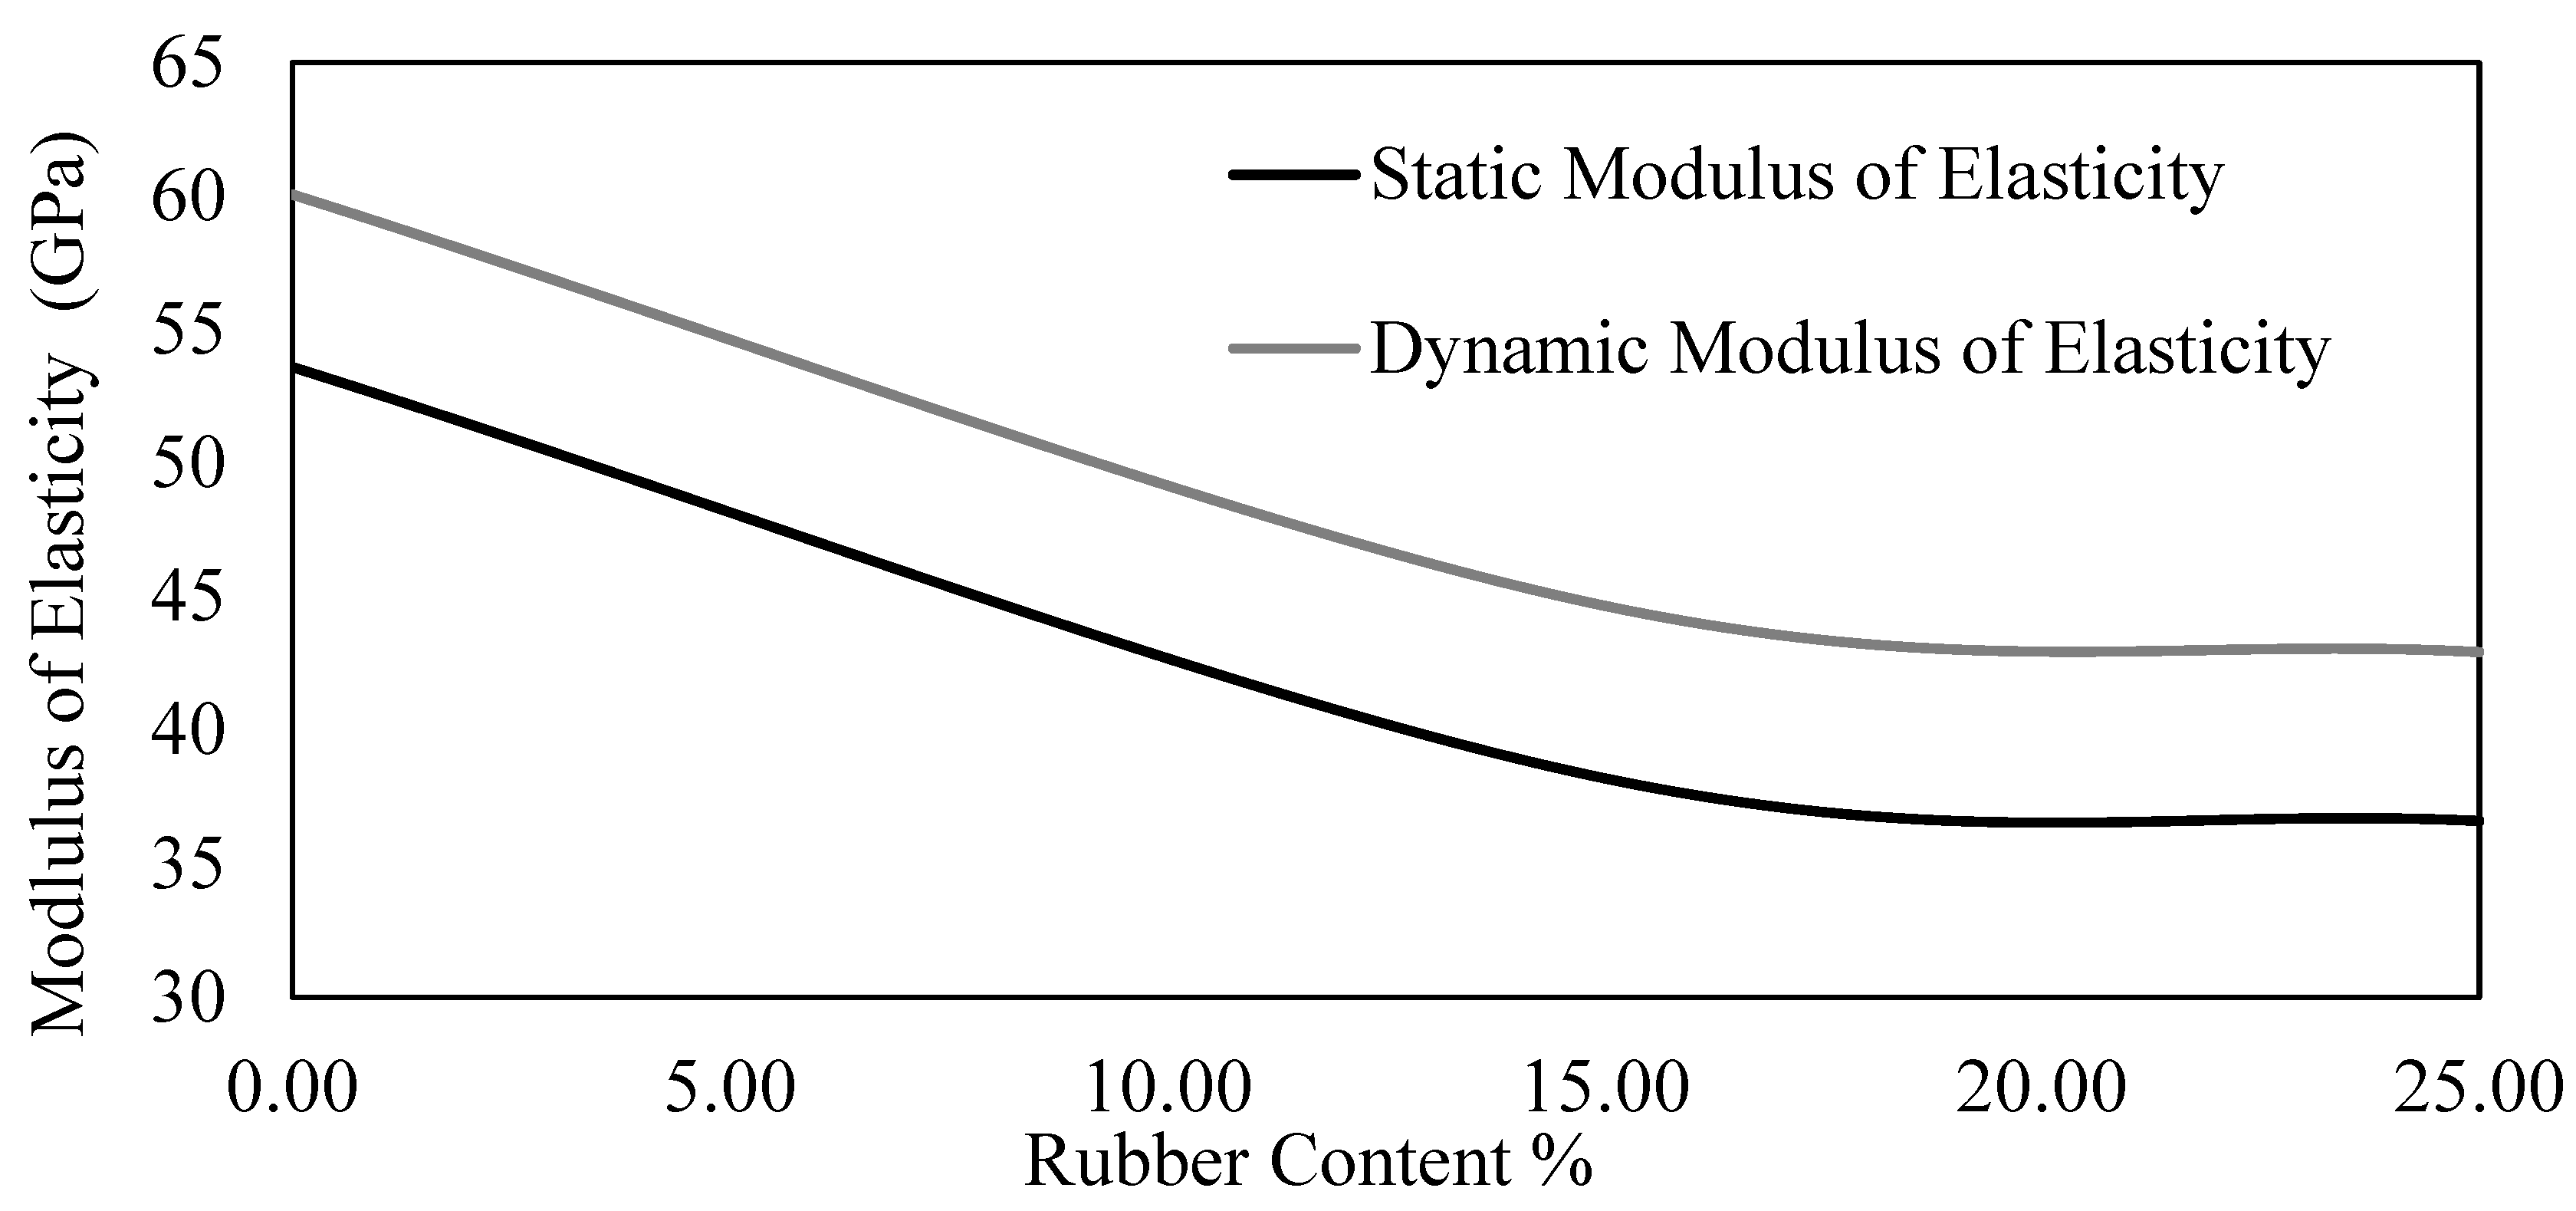
Furthermore, the dynamic modulus of elasticity for each specimen was calculated using the formula mentioned in the previous chapter and the results are shown in Figure 49. Moreover, the pattern of reduction in the dynamic modulus of elasticity is very close the one for static modulus of elasticity as shown in Figure 50 due to their direct relation.
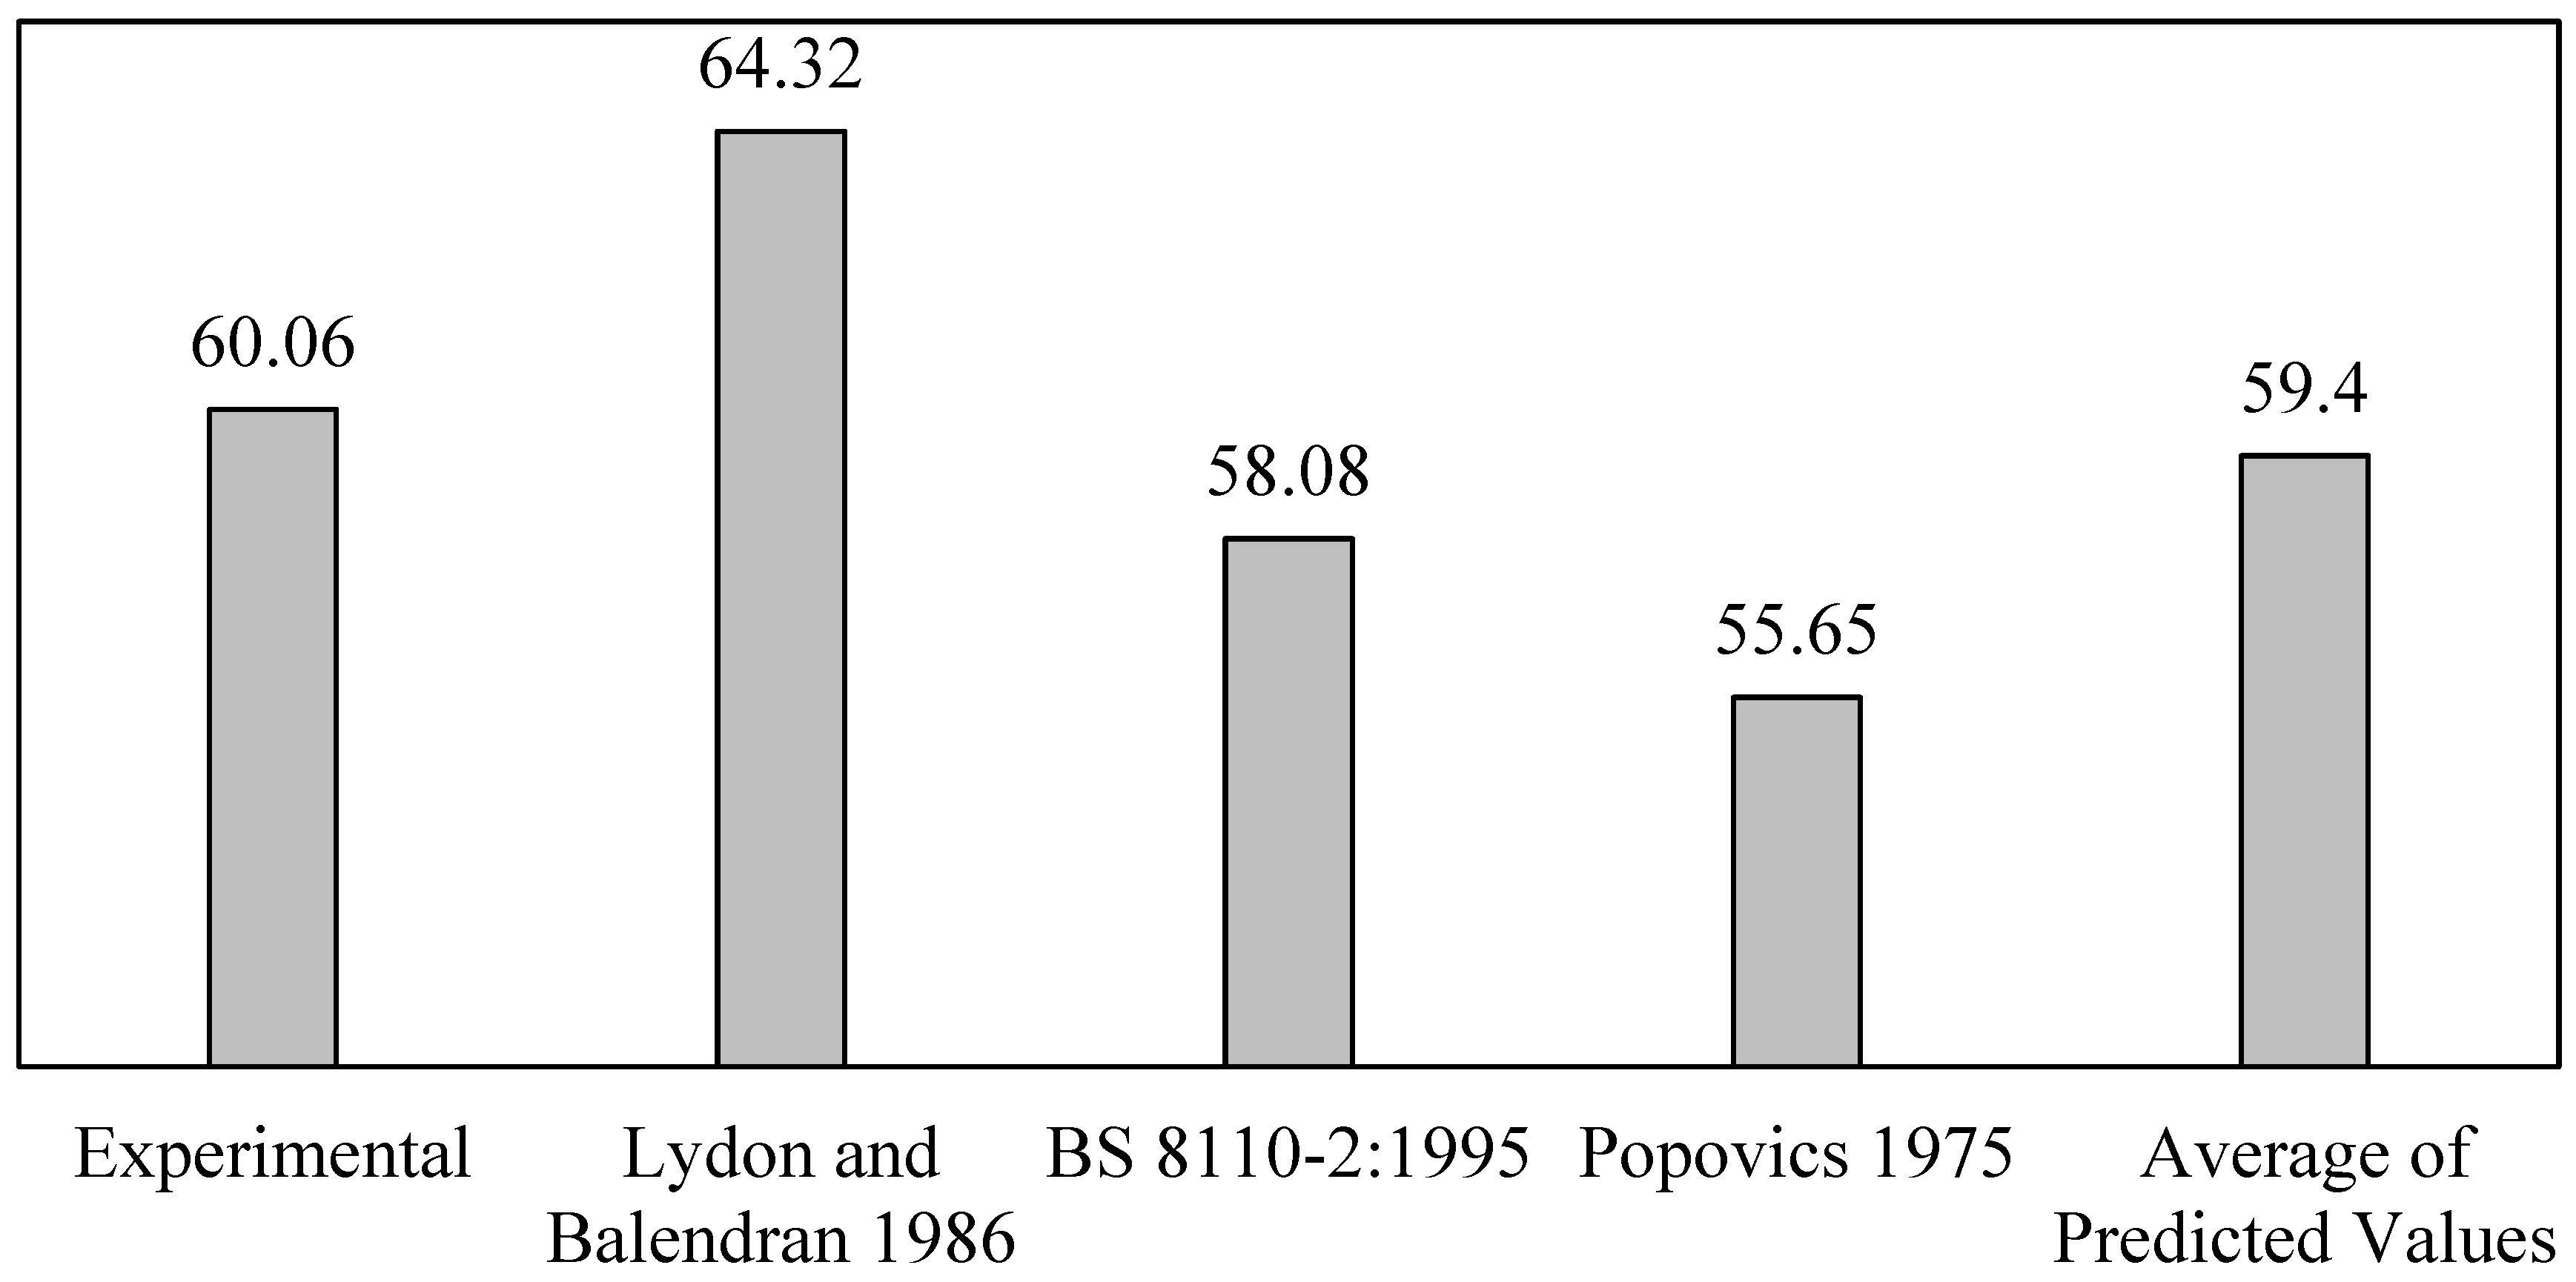
In addition, to ensure the reliability of the measured data using the develop tool selected predication models for calculating the dynamic modulus of elasticity were used to be compared to the one found from the experimental work as shown in Figure 51. This figure shows that the collected data are reliable and can be used in the structural investigations.

4.5. Investigating the Performance of Reinforced Rubberized Concrete Jackets for Retrofitting RC Structures

4.5.1. Equivalent Lateral Force Method

Bare Structural Model
The performance of the BS was first investigated using ELFM to identify the failing members and to produce a bases for the NRHA. As can be seen in Figure 52 four columns in the first story have been reported to be over stressed rising the need for a seismic retrofitting of the structure to improve its resistance against seismic induced loads.
Jacketed Structural Models
As mentioned previously in order to increase the resistance of the structure a retrofitting plan was proposed using the RC jacketing technique to encase all columns in all stories of the structure in order to ensure a regular behavior of the building. Therefore, to obtain the jacket thickness and required reinforcement configuration both ELFM and modal analysis procedures were performed to satisfies the model requirements in the previous chapter. Table 18 shows the required jacketing configuration to satisfies the frequency requirements for some models. As suggested by Sfakianakis (Sfakianakis 2002) this study has used a thin jacket thickness generally between 50 mm and 75mm to strengthen the bare columns as shown in Table 18 and to satisfy the requirements of ACI318-14 and ASCE7-16. Furthermore, Figure 53 shows that all problems in the BS model have been solved under the application of ELFM.

4.5.2. Nonlinear Response History Analysis

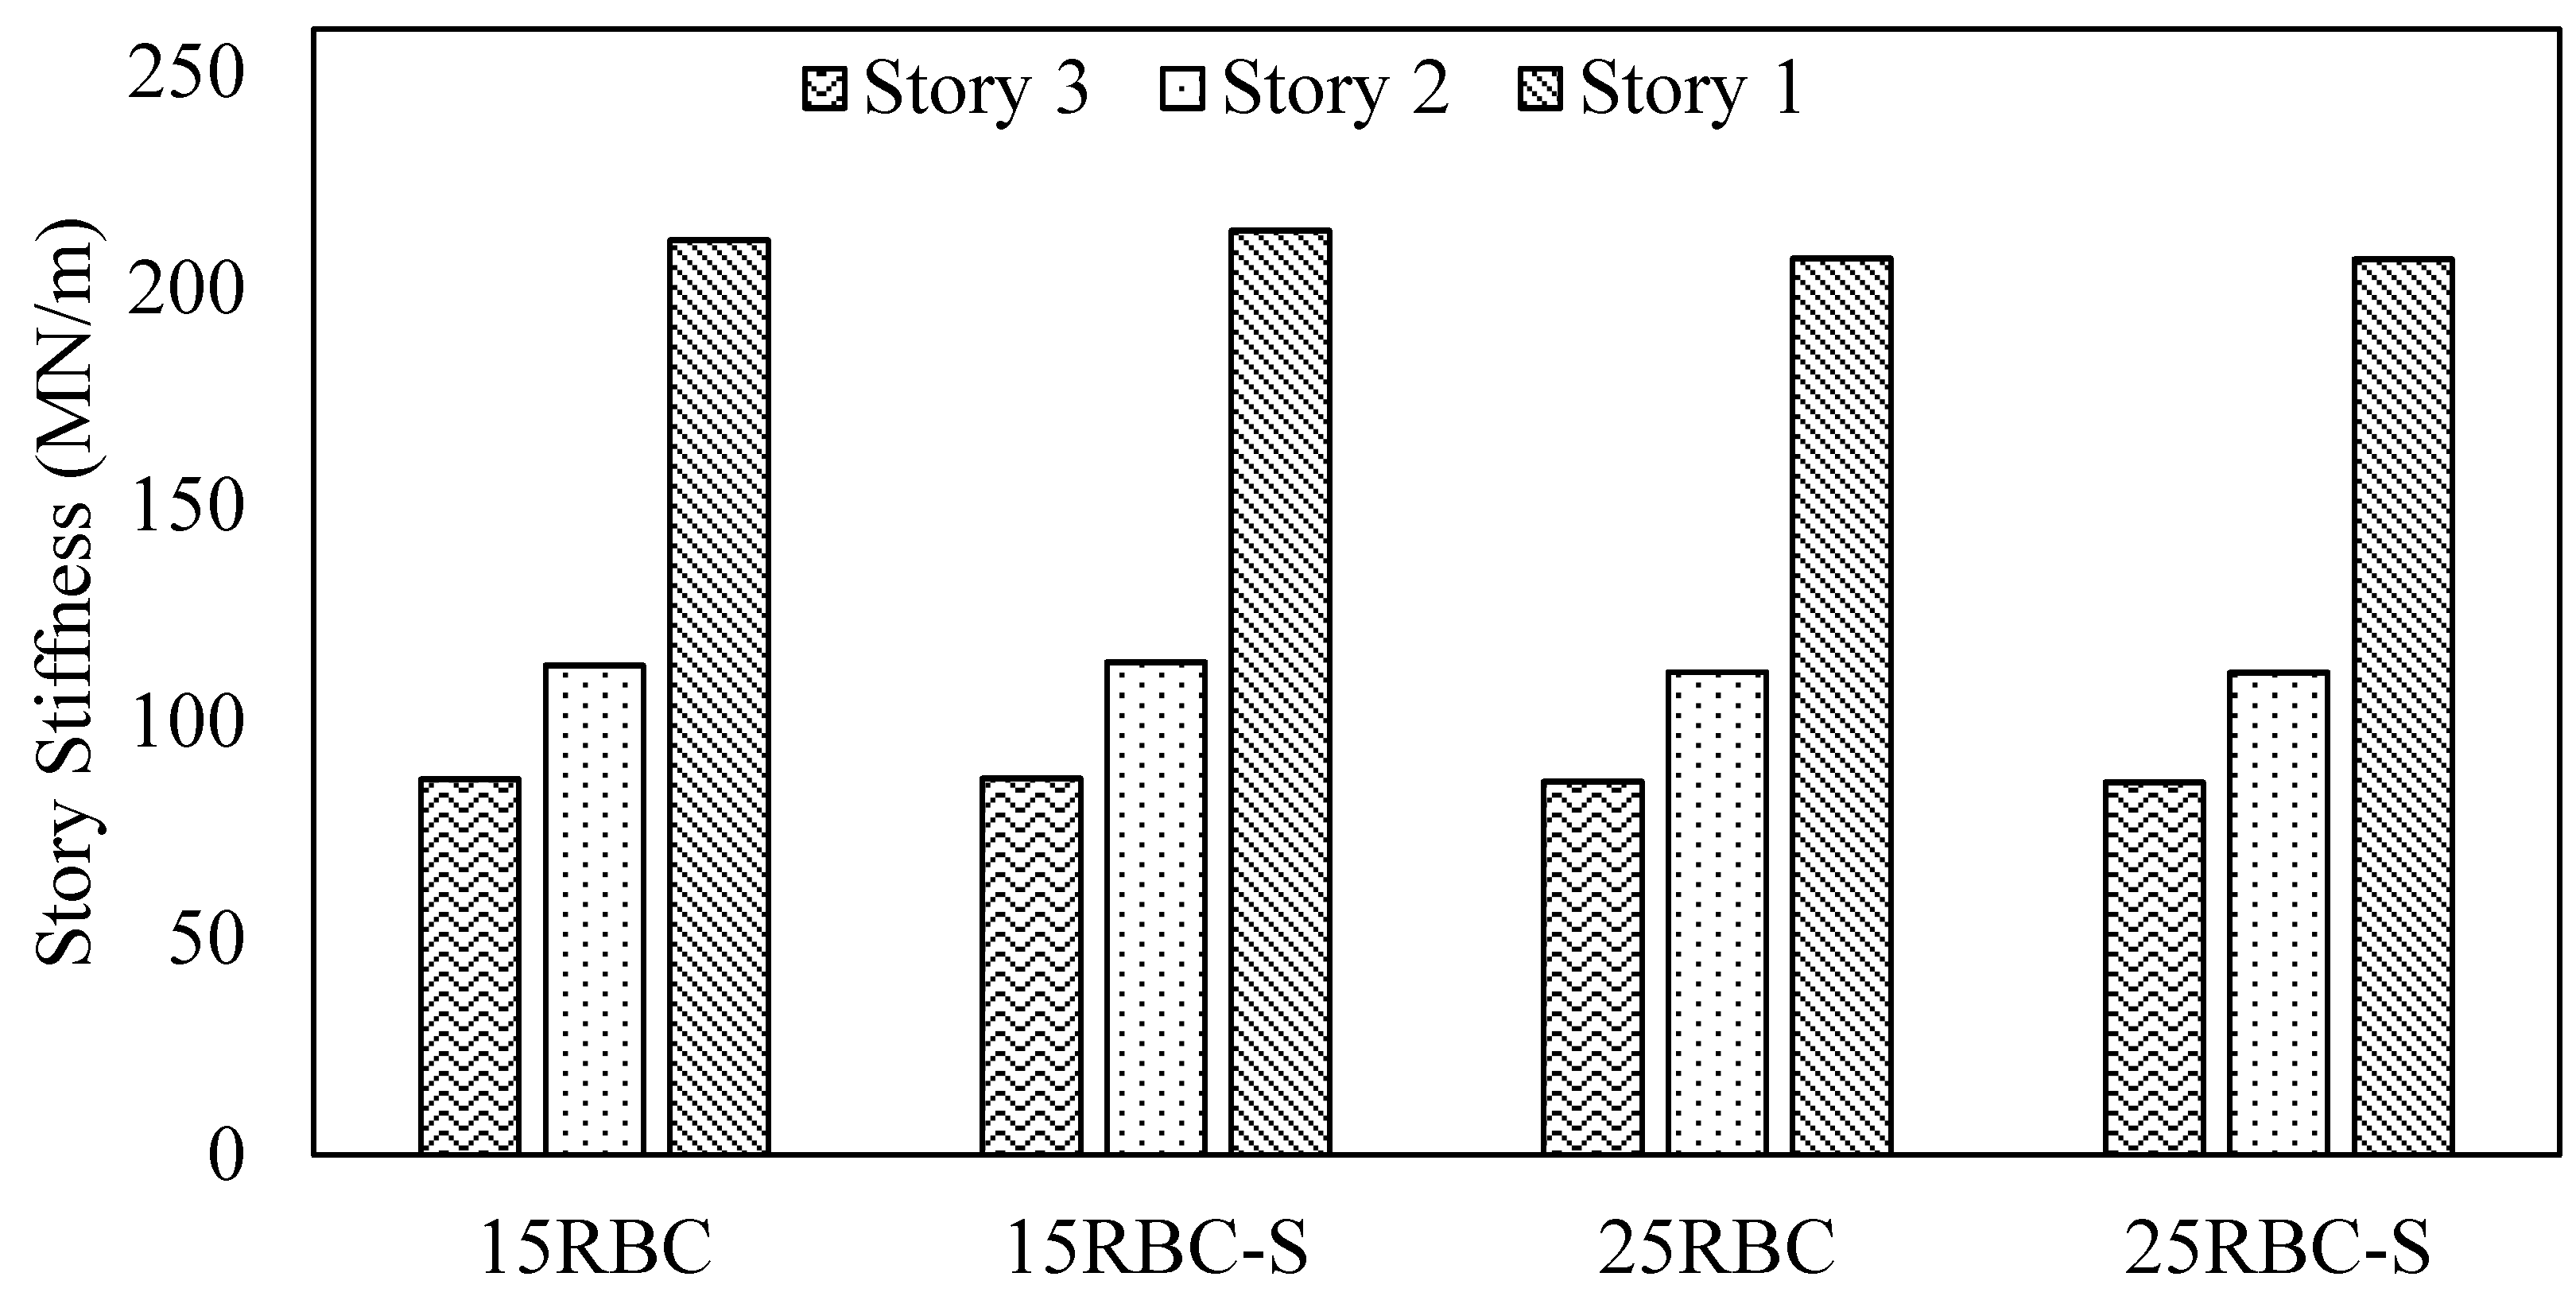
This section will include the results of the NRHA. As part of this study three different set of models were analyzed and compared to develop a clear decision on the performance of RBC jackets in comparison to control concrete ones. The first set of models is the similar frequency which was conducted to investigate the effect of RBC on the energy dissipation of the building under severe ground motion records since using the same model with the material properties being changed is not convenient as the significant increase in the modulus of elasticity and compressive strength of ZRBC in comparison to 15RBC and 25RBC leads to considerably different stiffness in the structure which gives a totally different performance. The second set of models is the similar thickness model which is mainly the same structural sections but with different material properties, this set is going to be used in comparing the effect of RBC on the seismic demand and its results on the performance of the structure. The last set is composed of four models two of which are the rubber models and other two are jacketed structural models using conventional concrete that has same compressive strength as the RBC to investigate the total performance of the building with improved energy dissipation and deformation capacity.
Similar Frequency Models
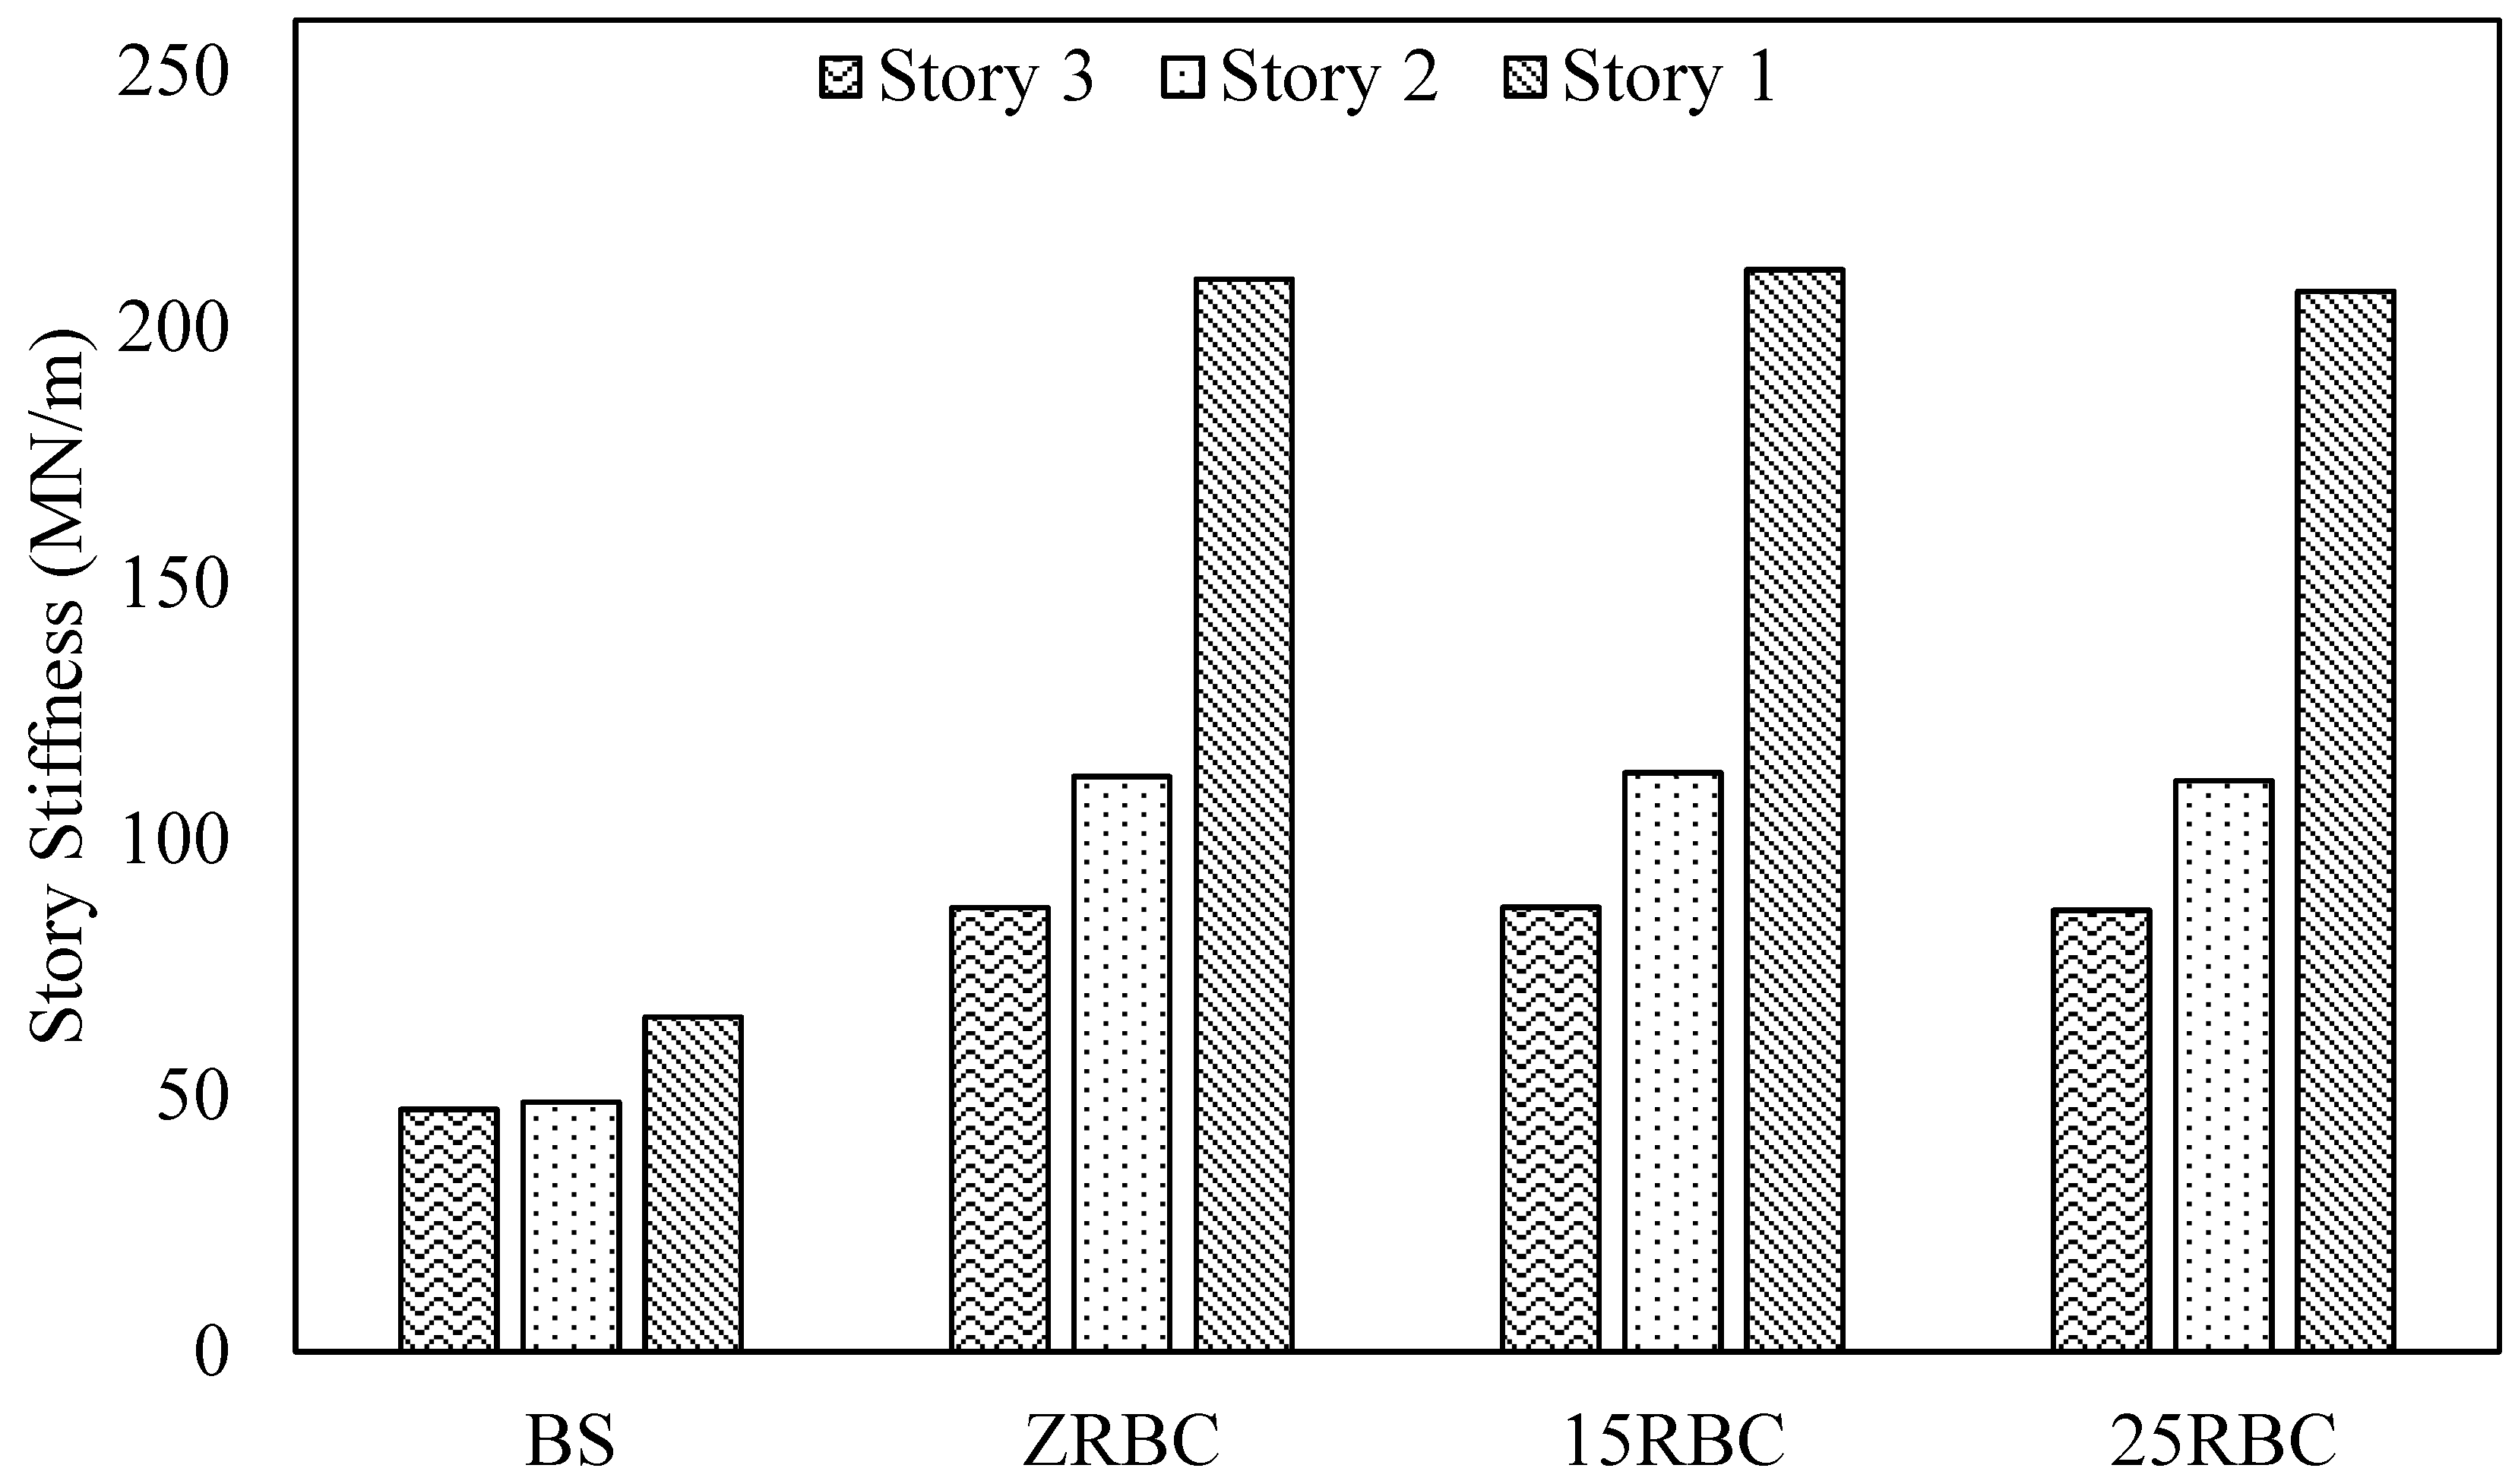
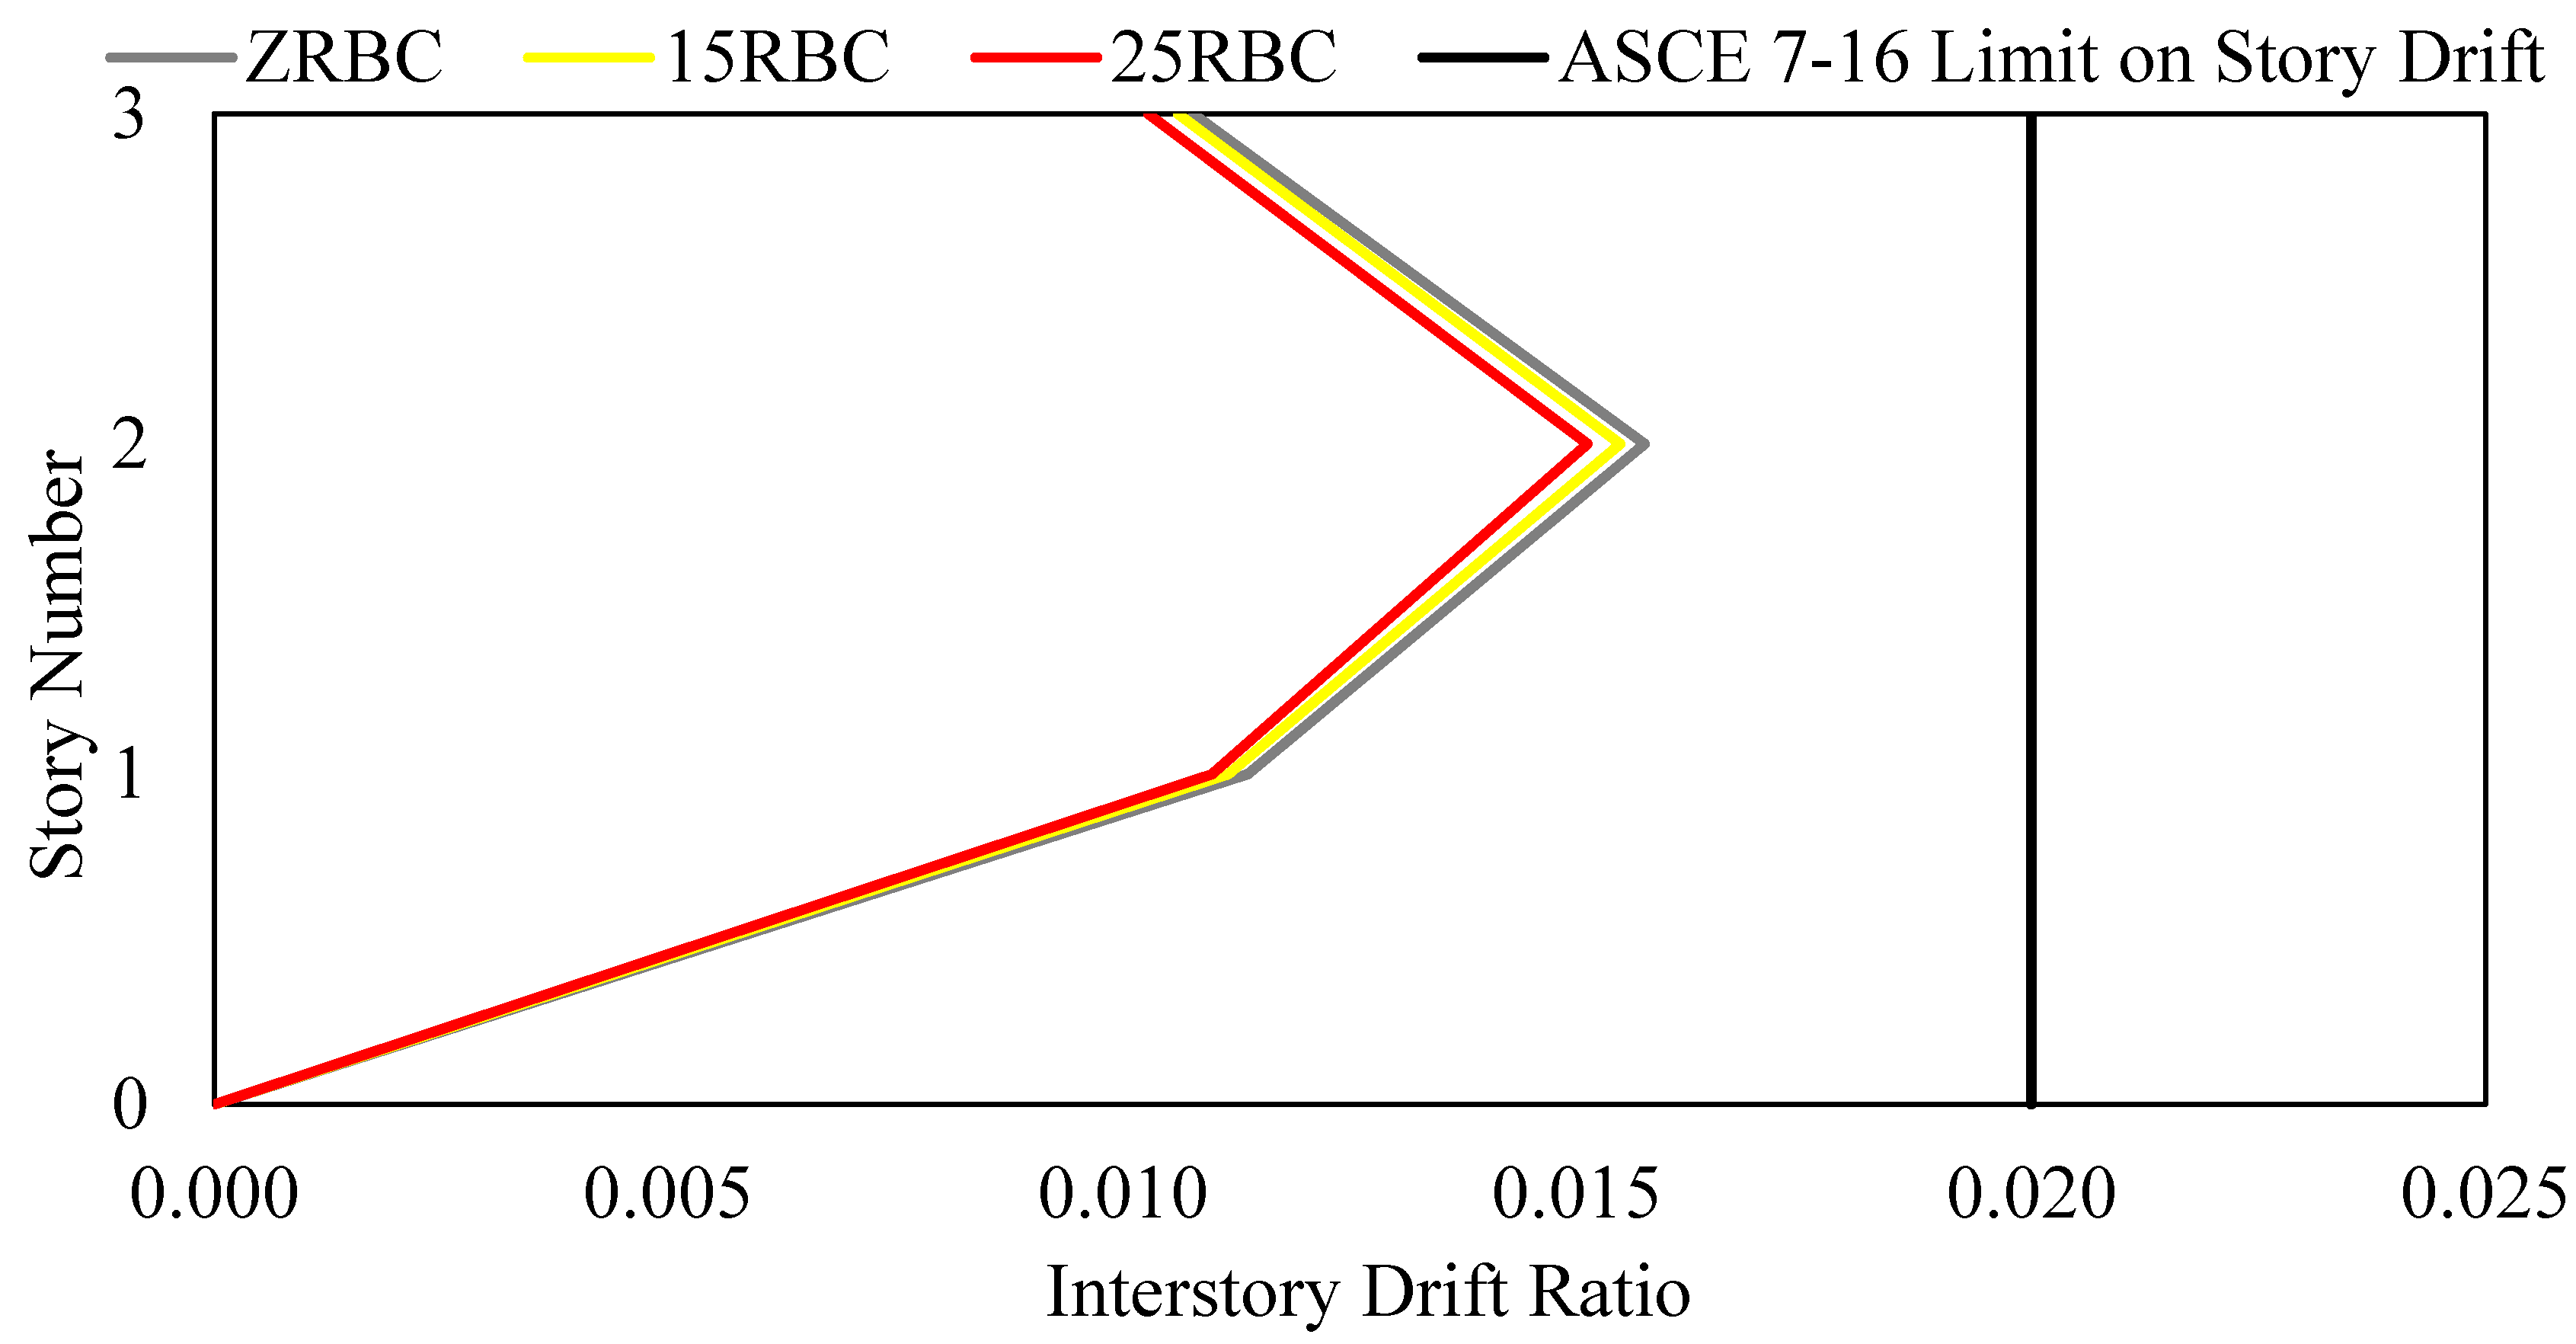
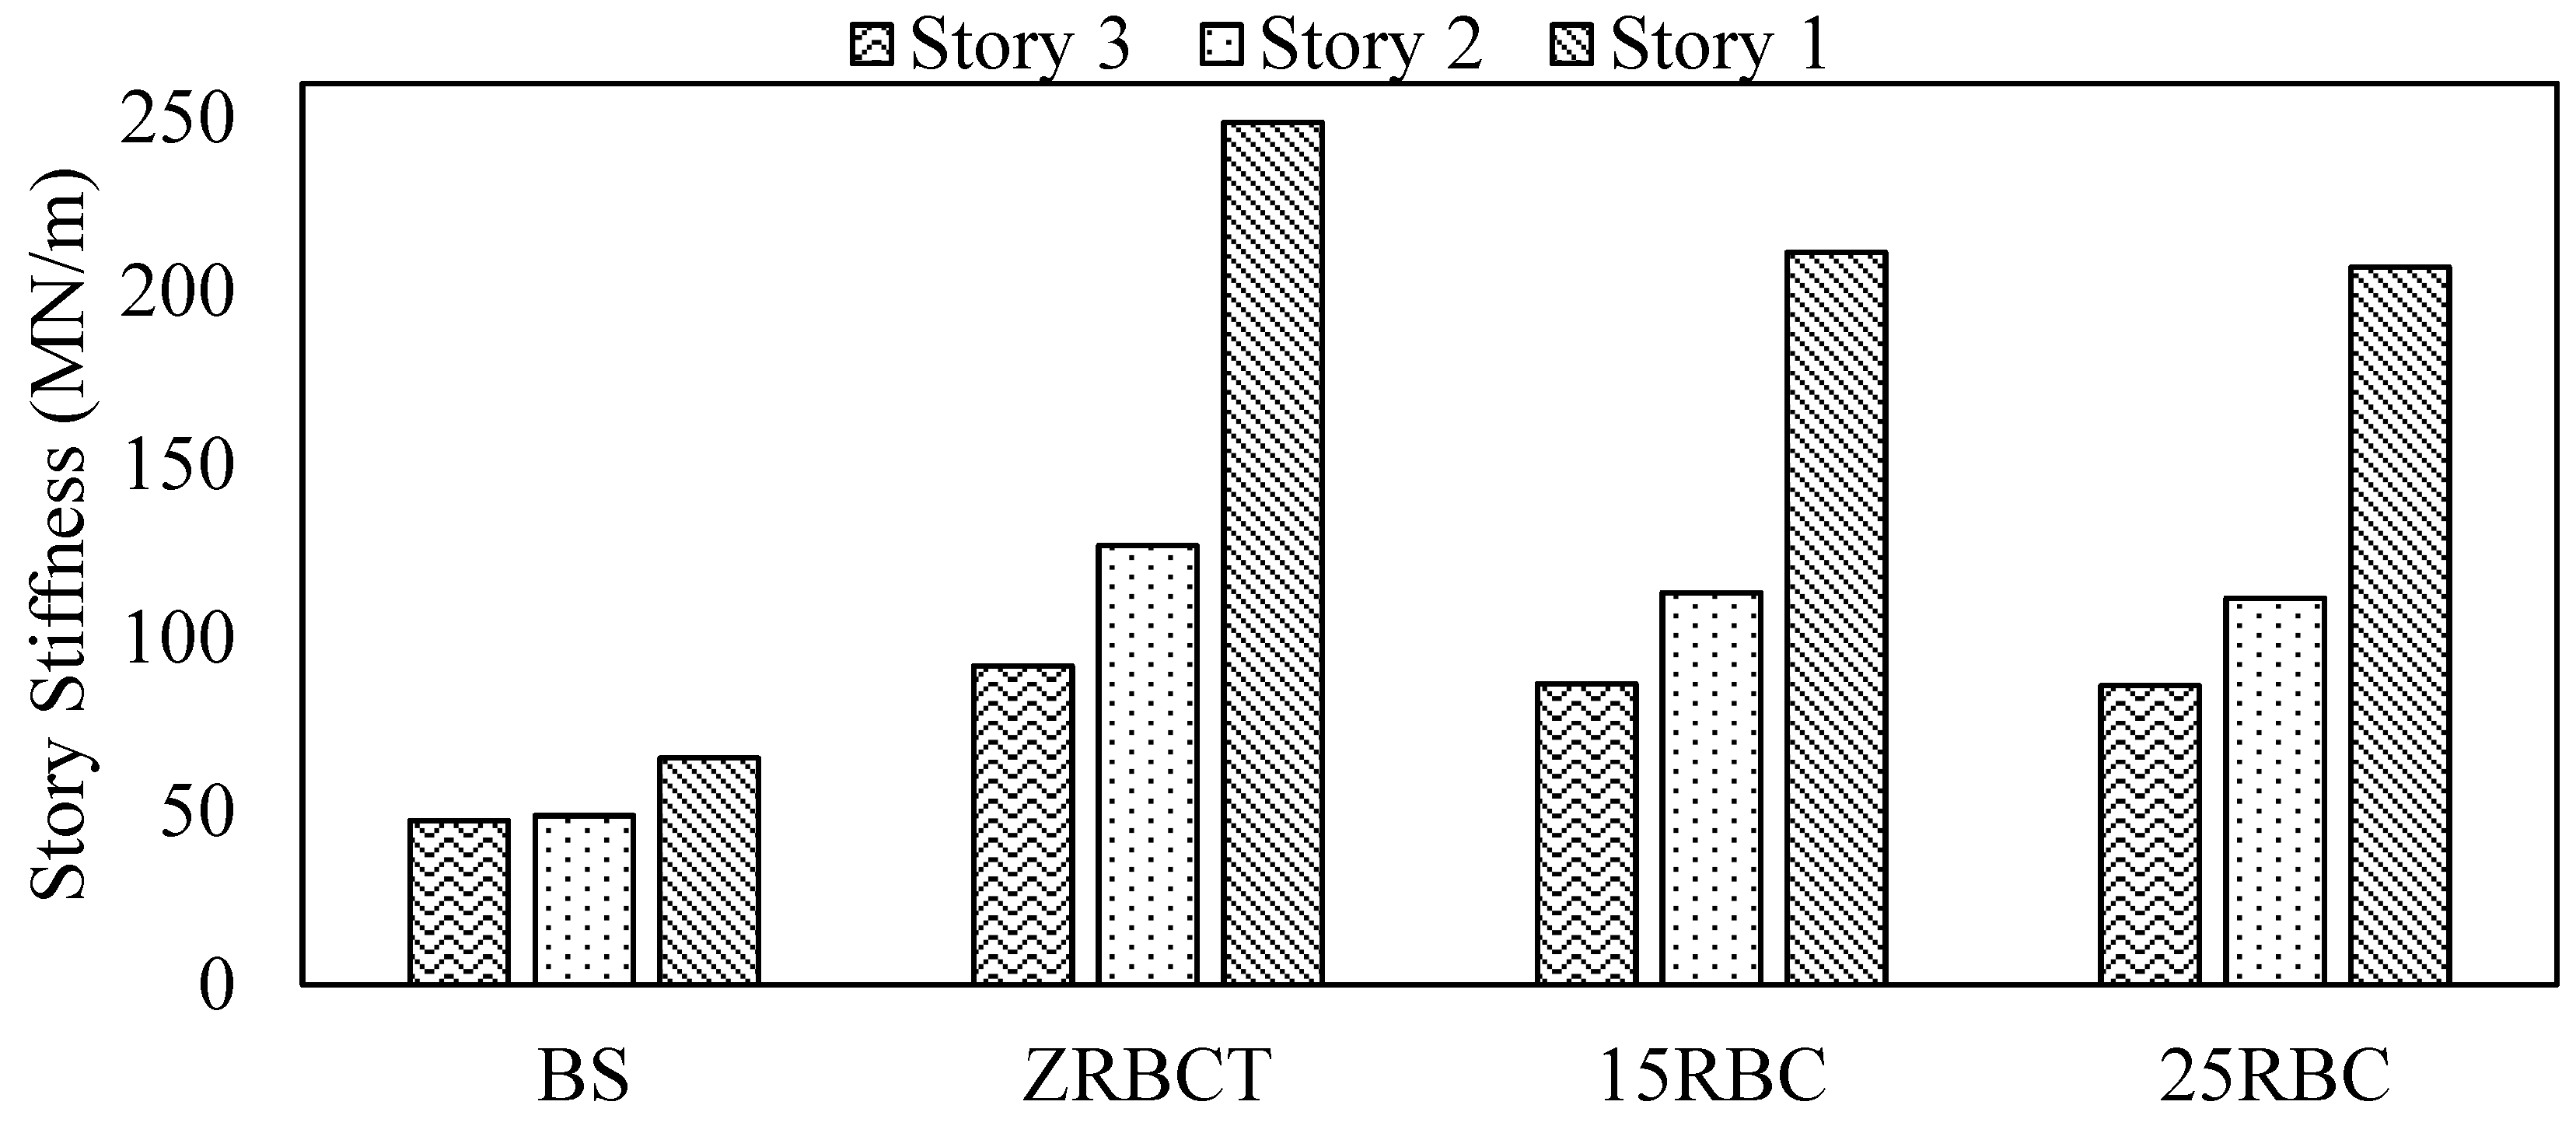
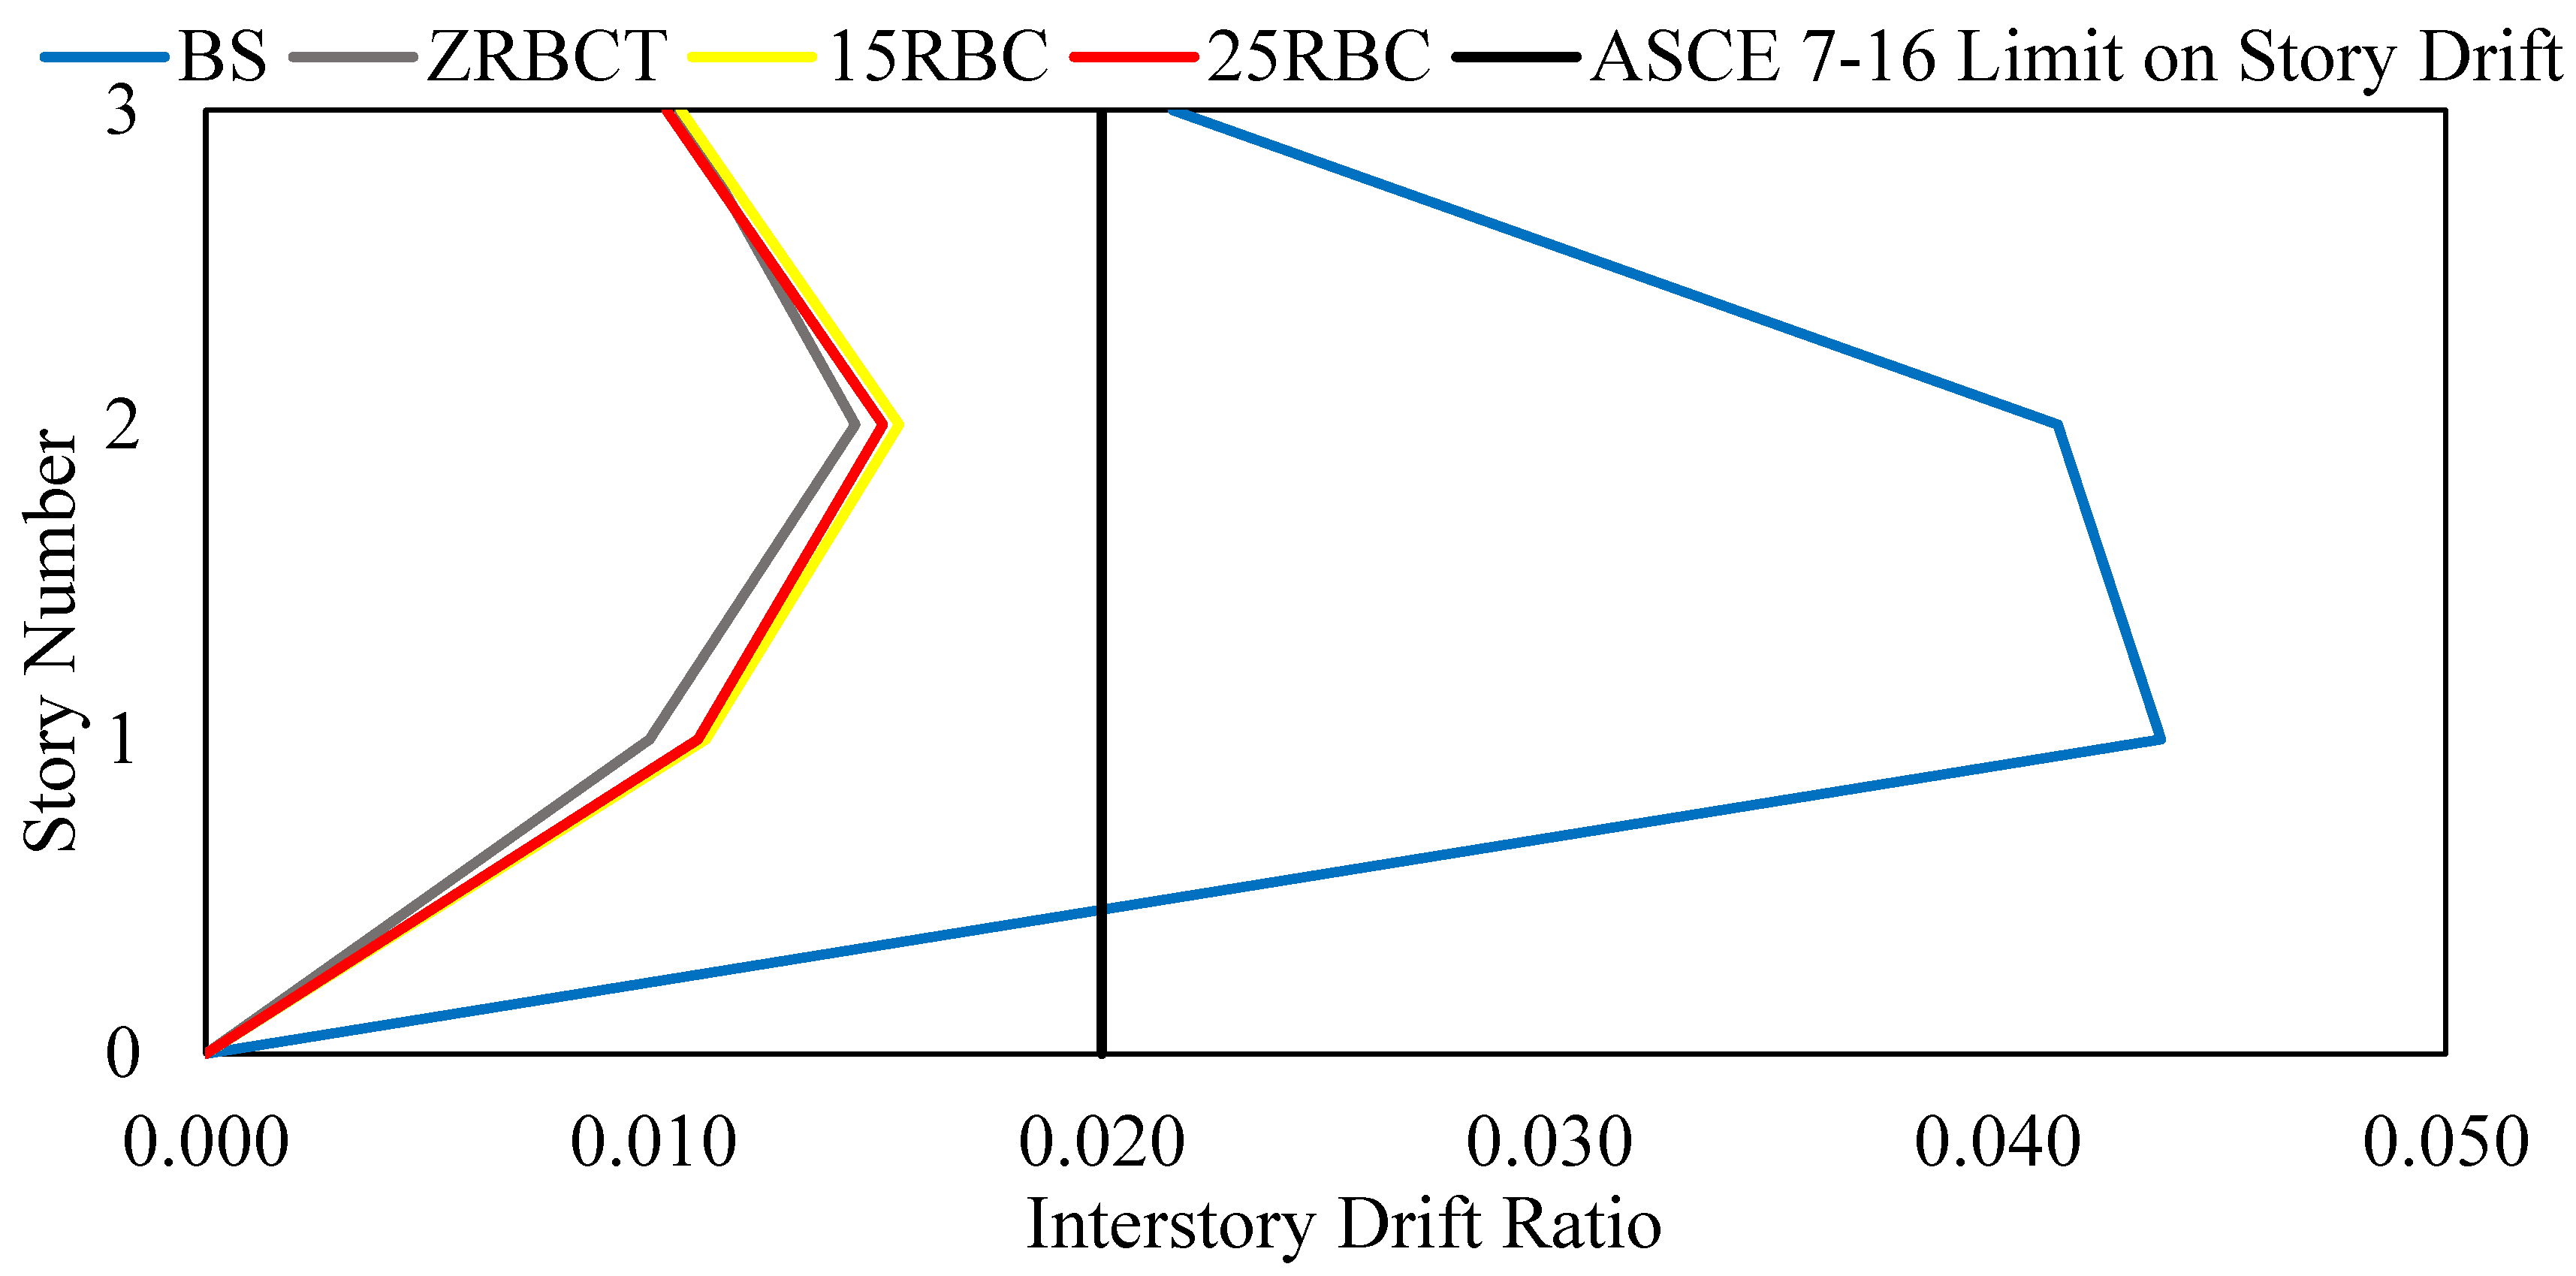
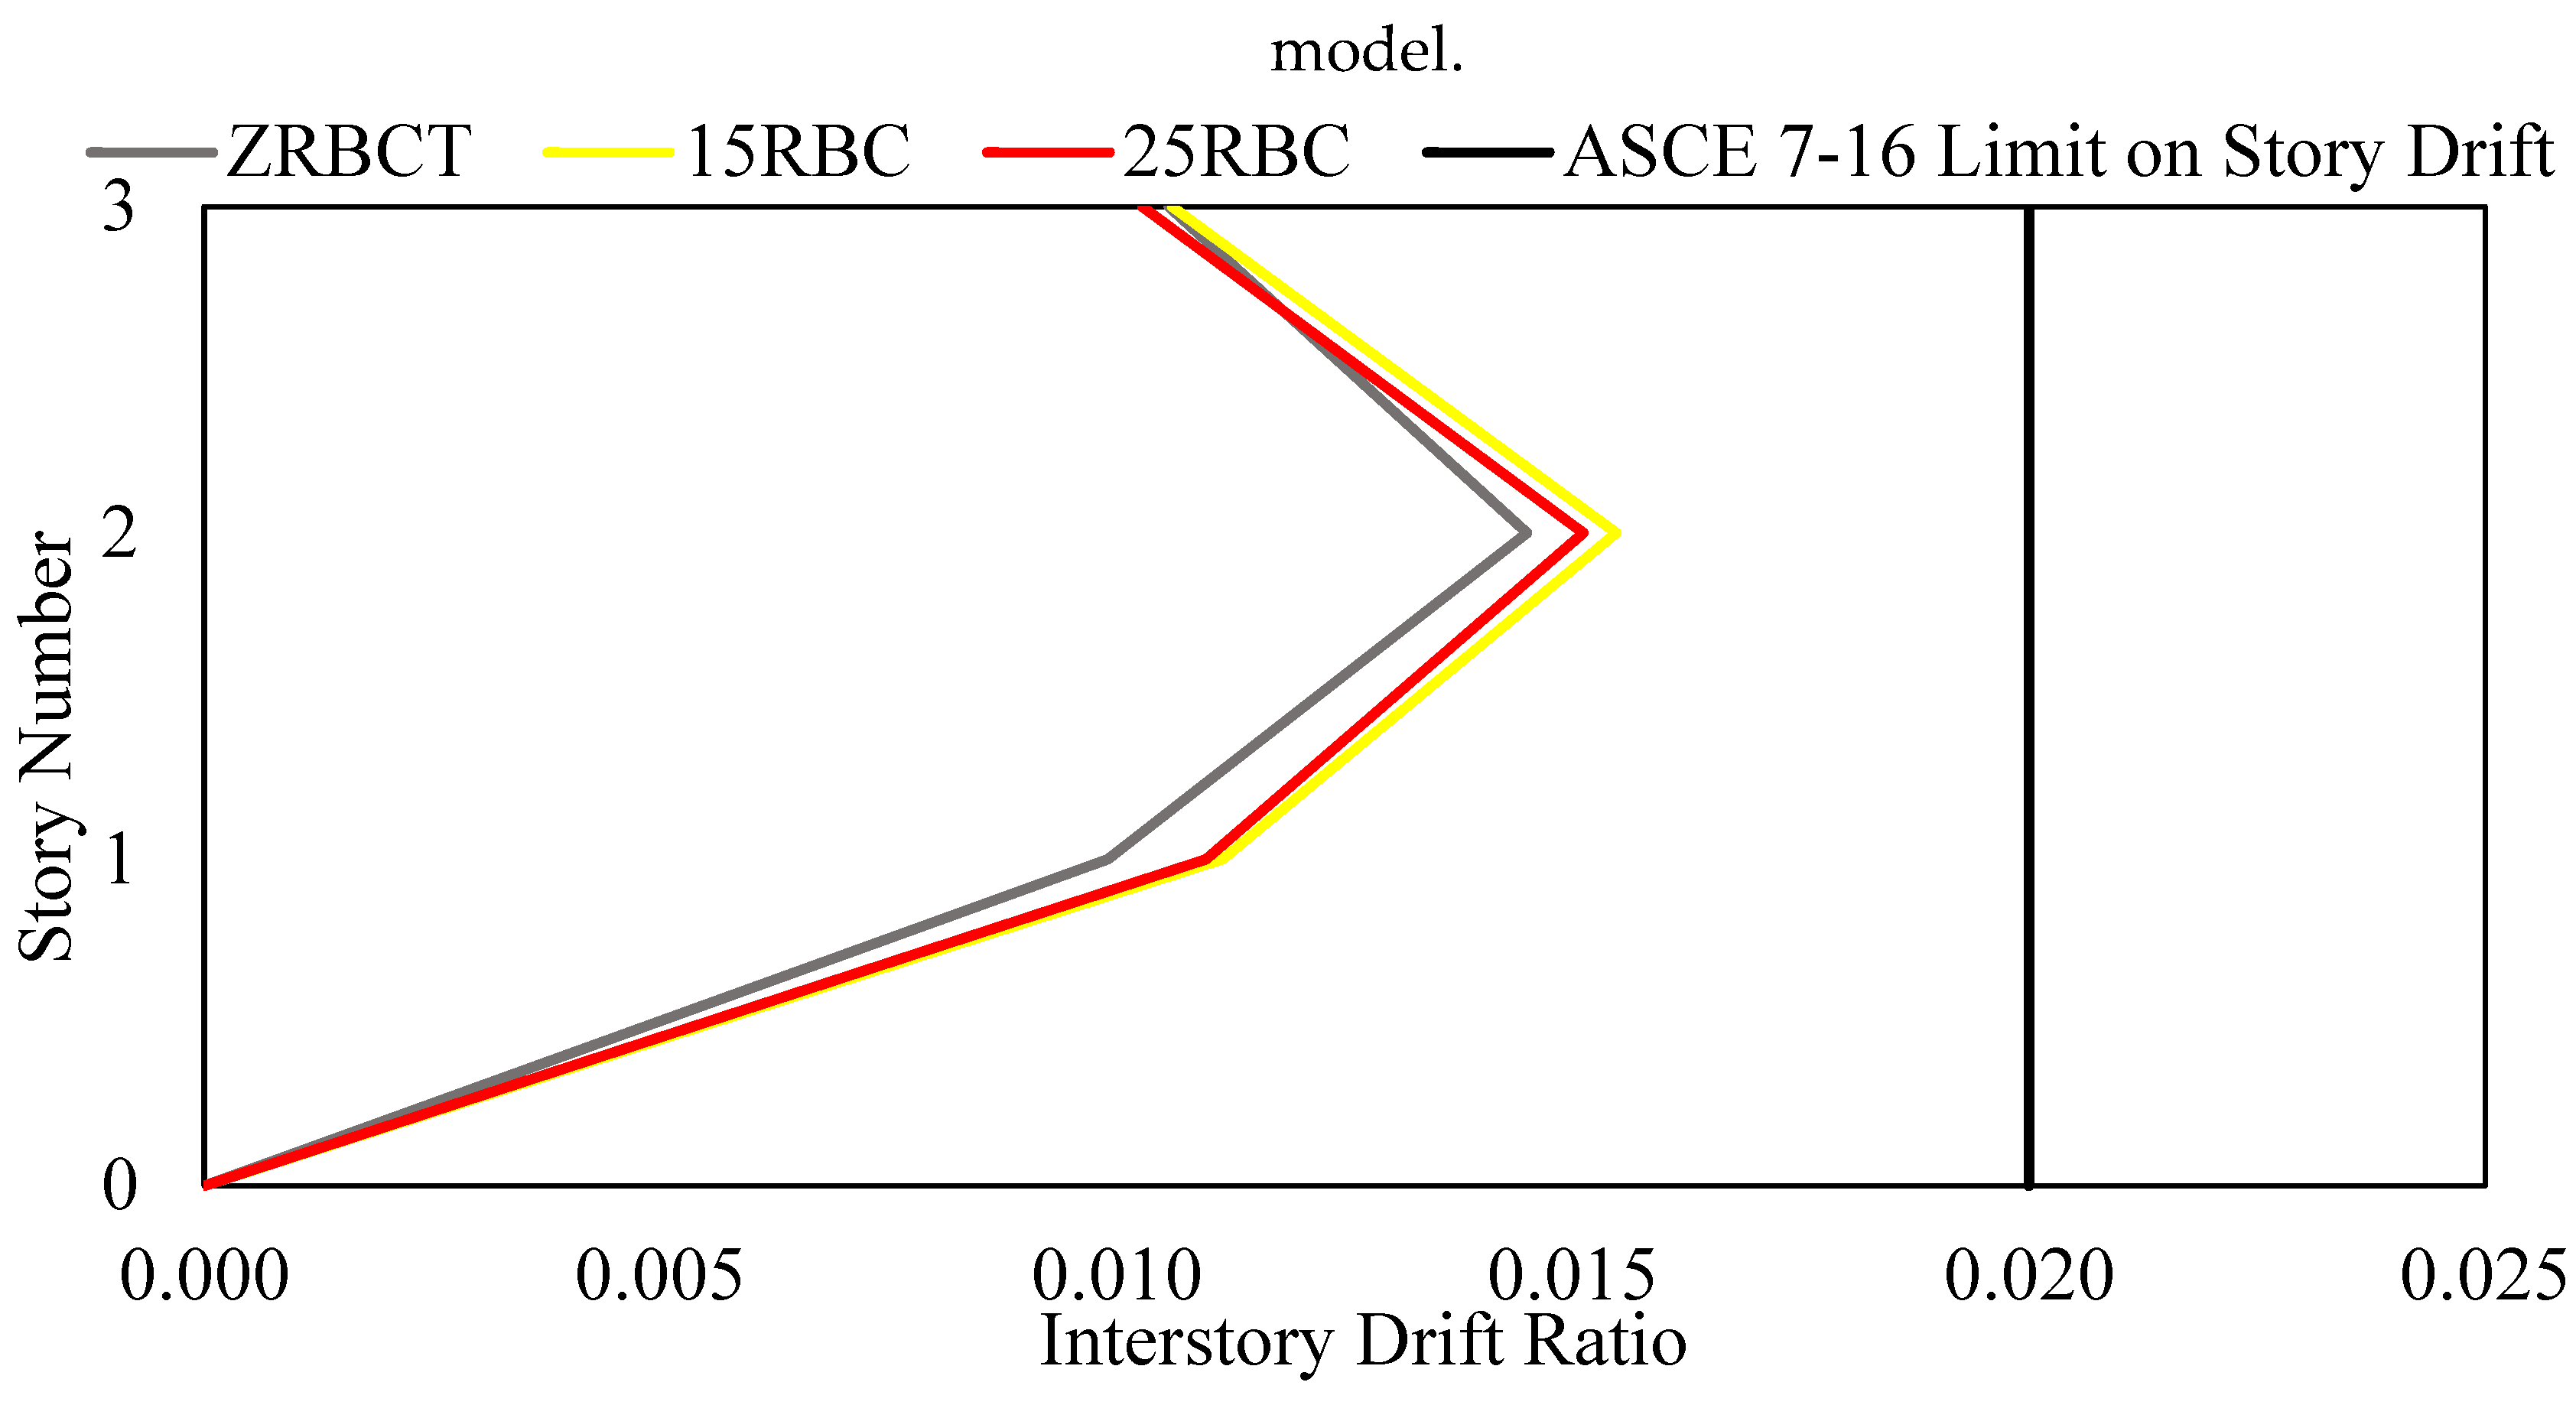
This set includes the models shown in Table 19. As can be seen there all retrofitted models have almost the same natural period which means that the added stiffness to the BS will be similar , Figure 54, and thus the seismic demand will be very close that allows highlighting the influence of the material’s deformability and its own damping ratio on the structure’s behavior.
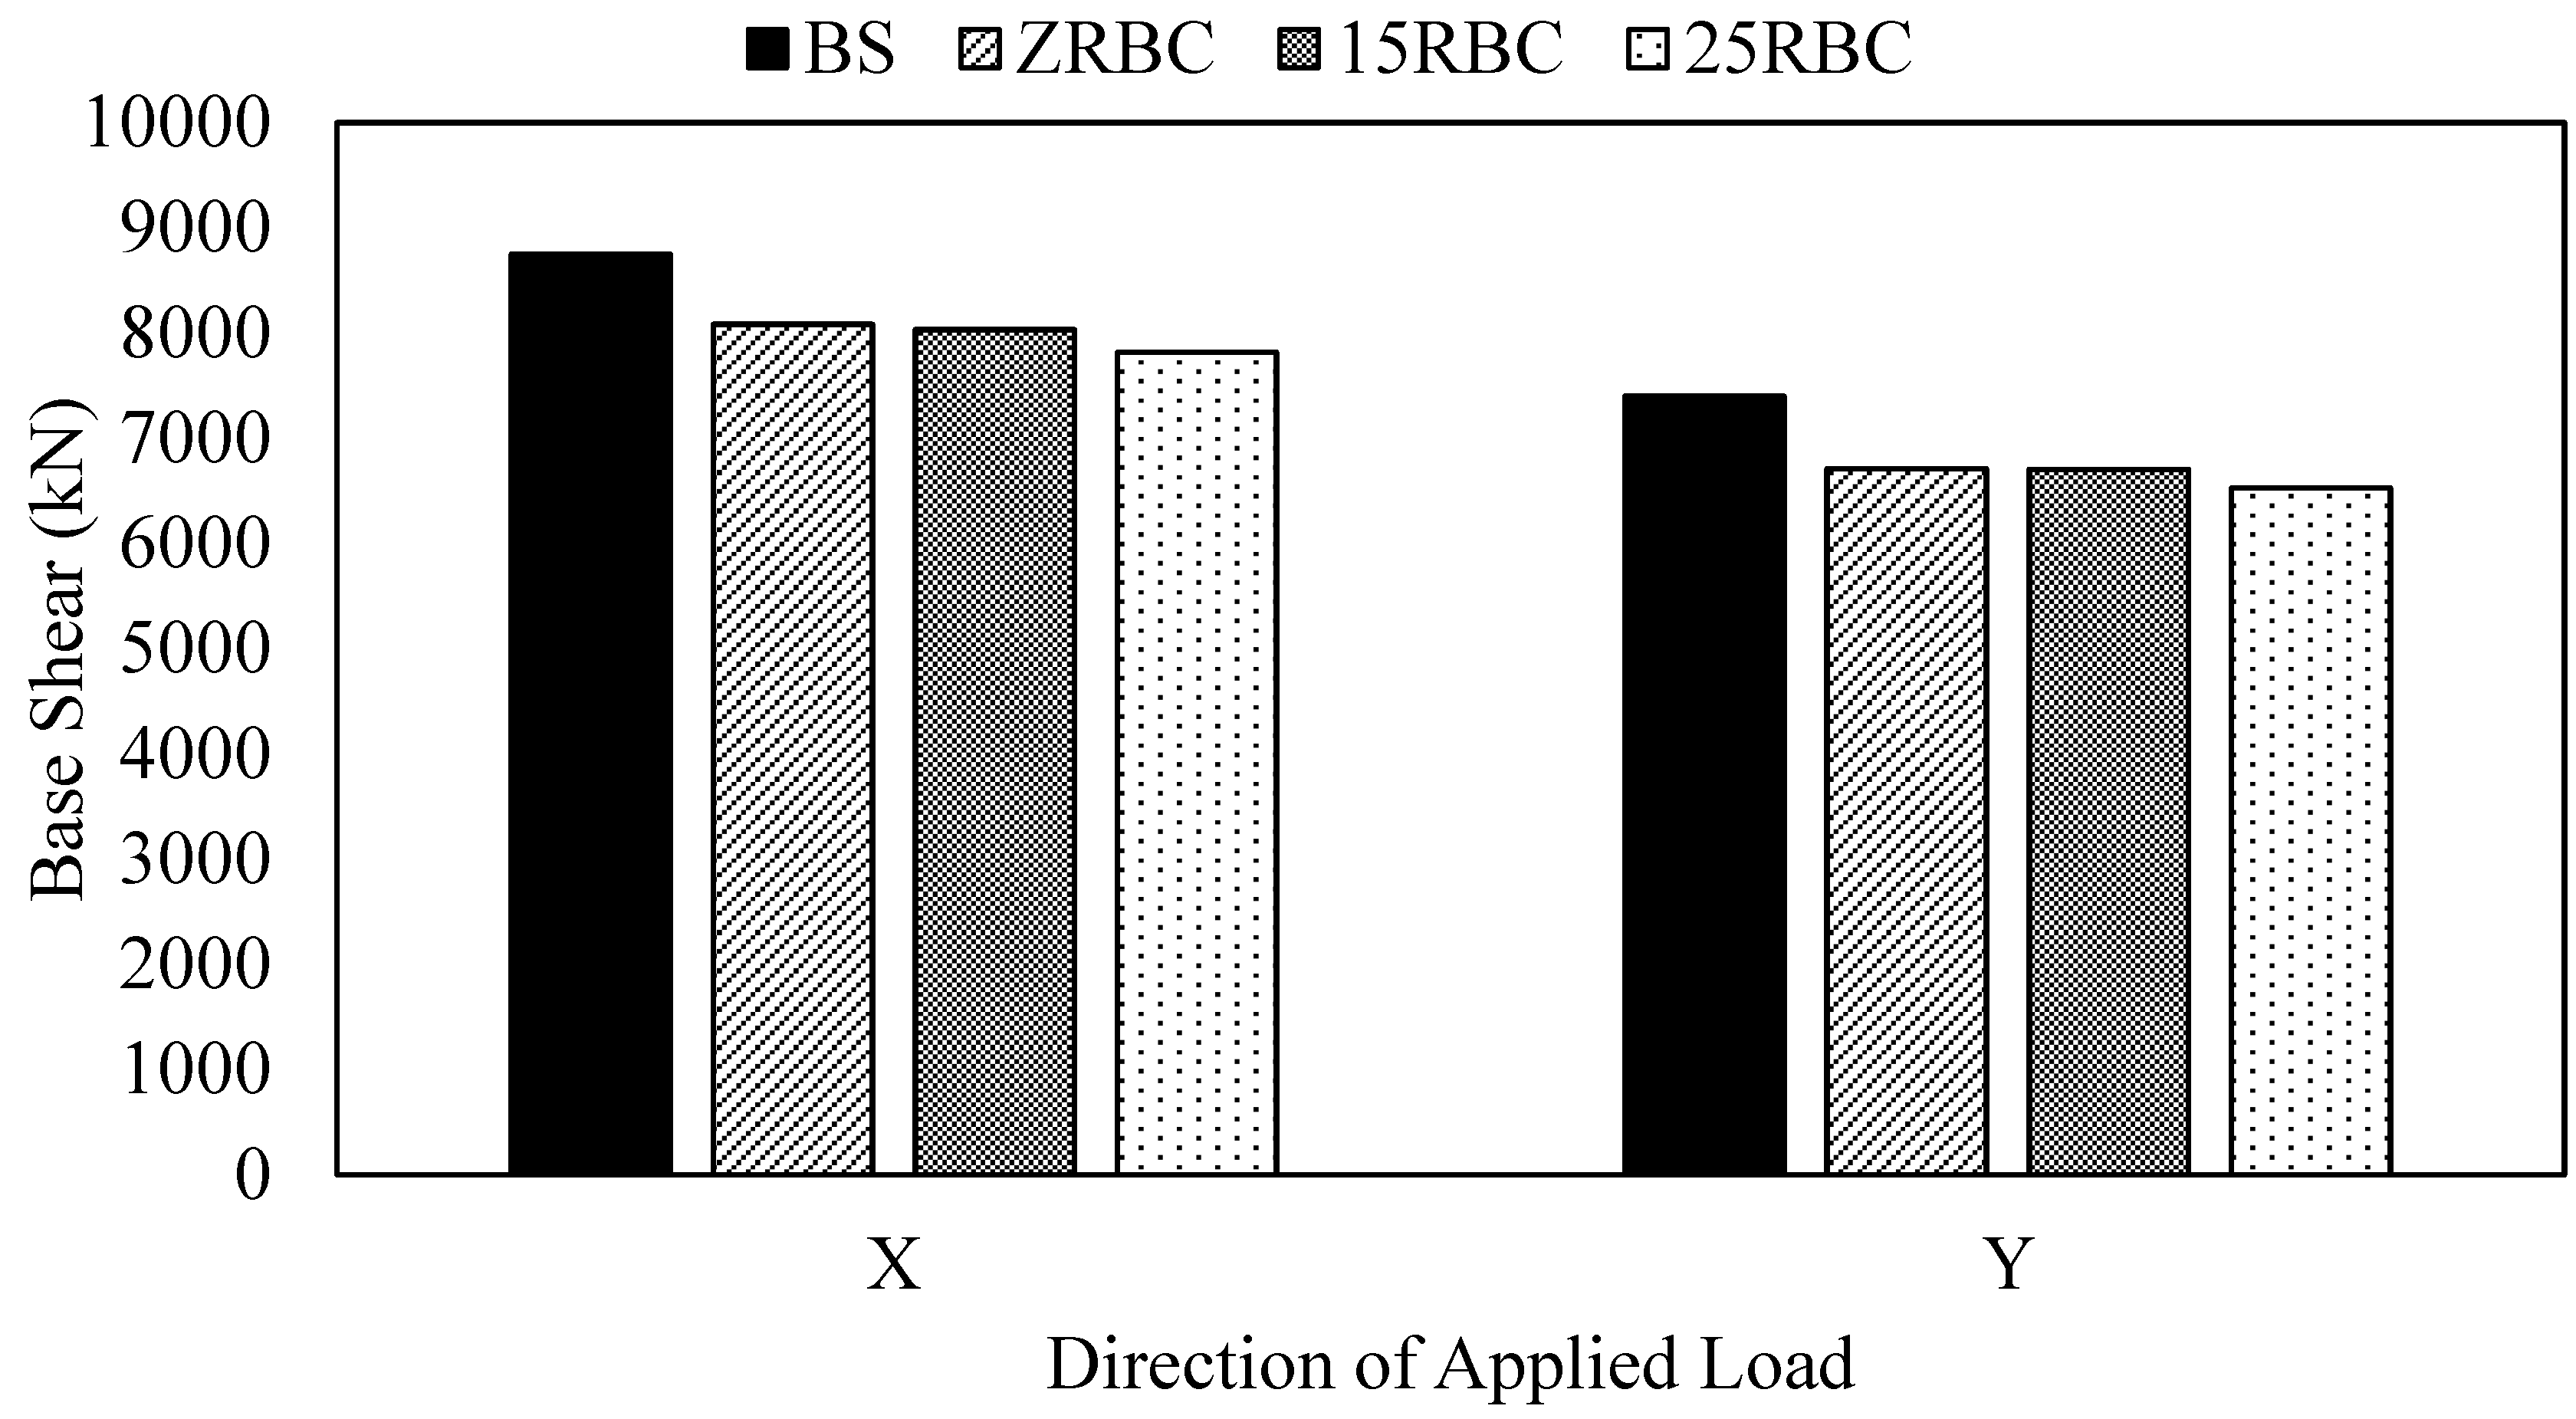
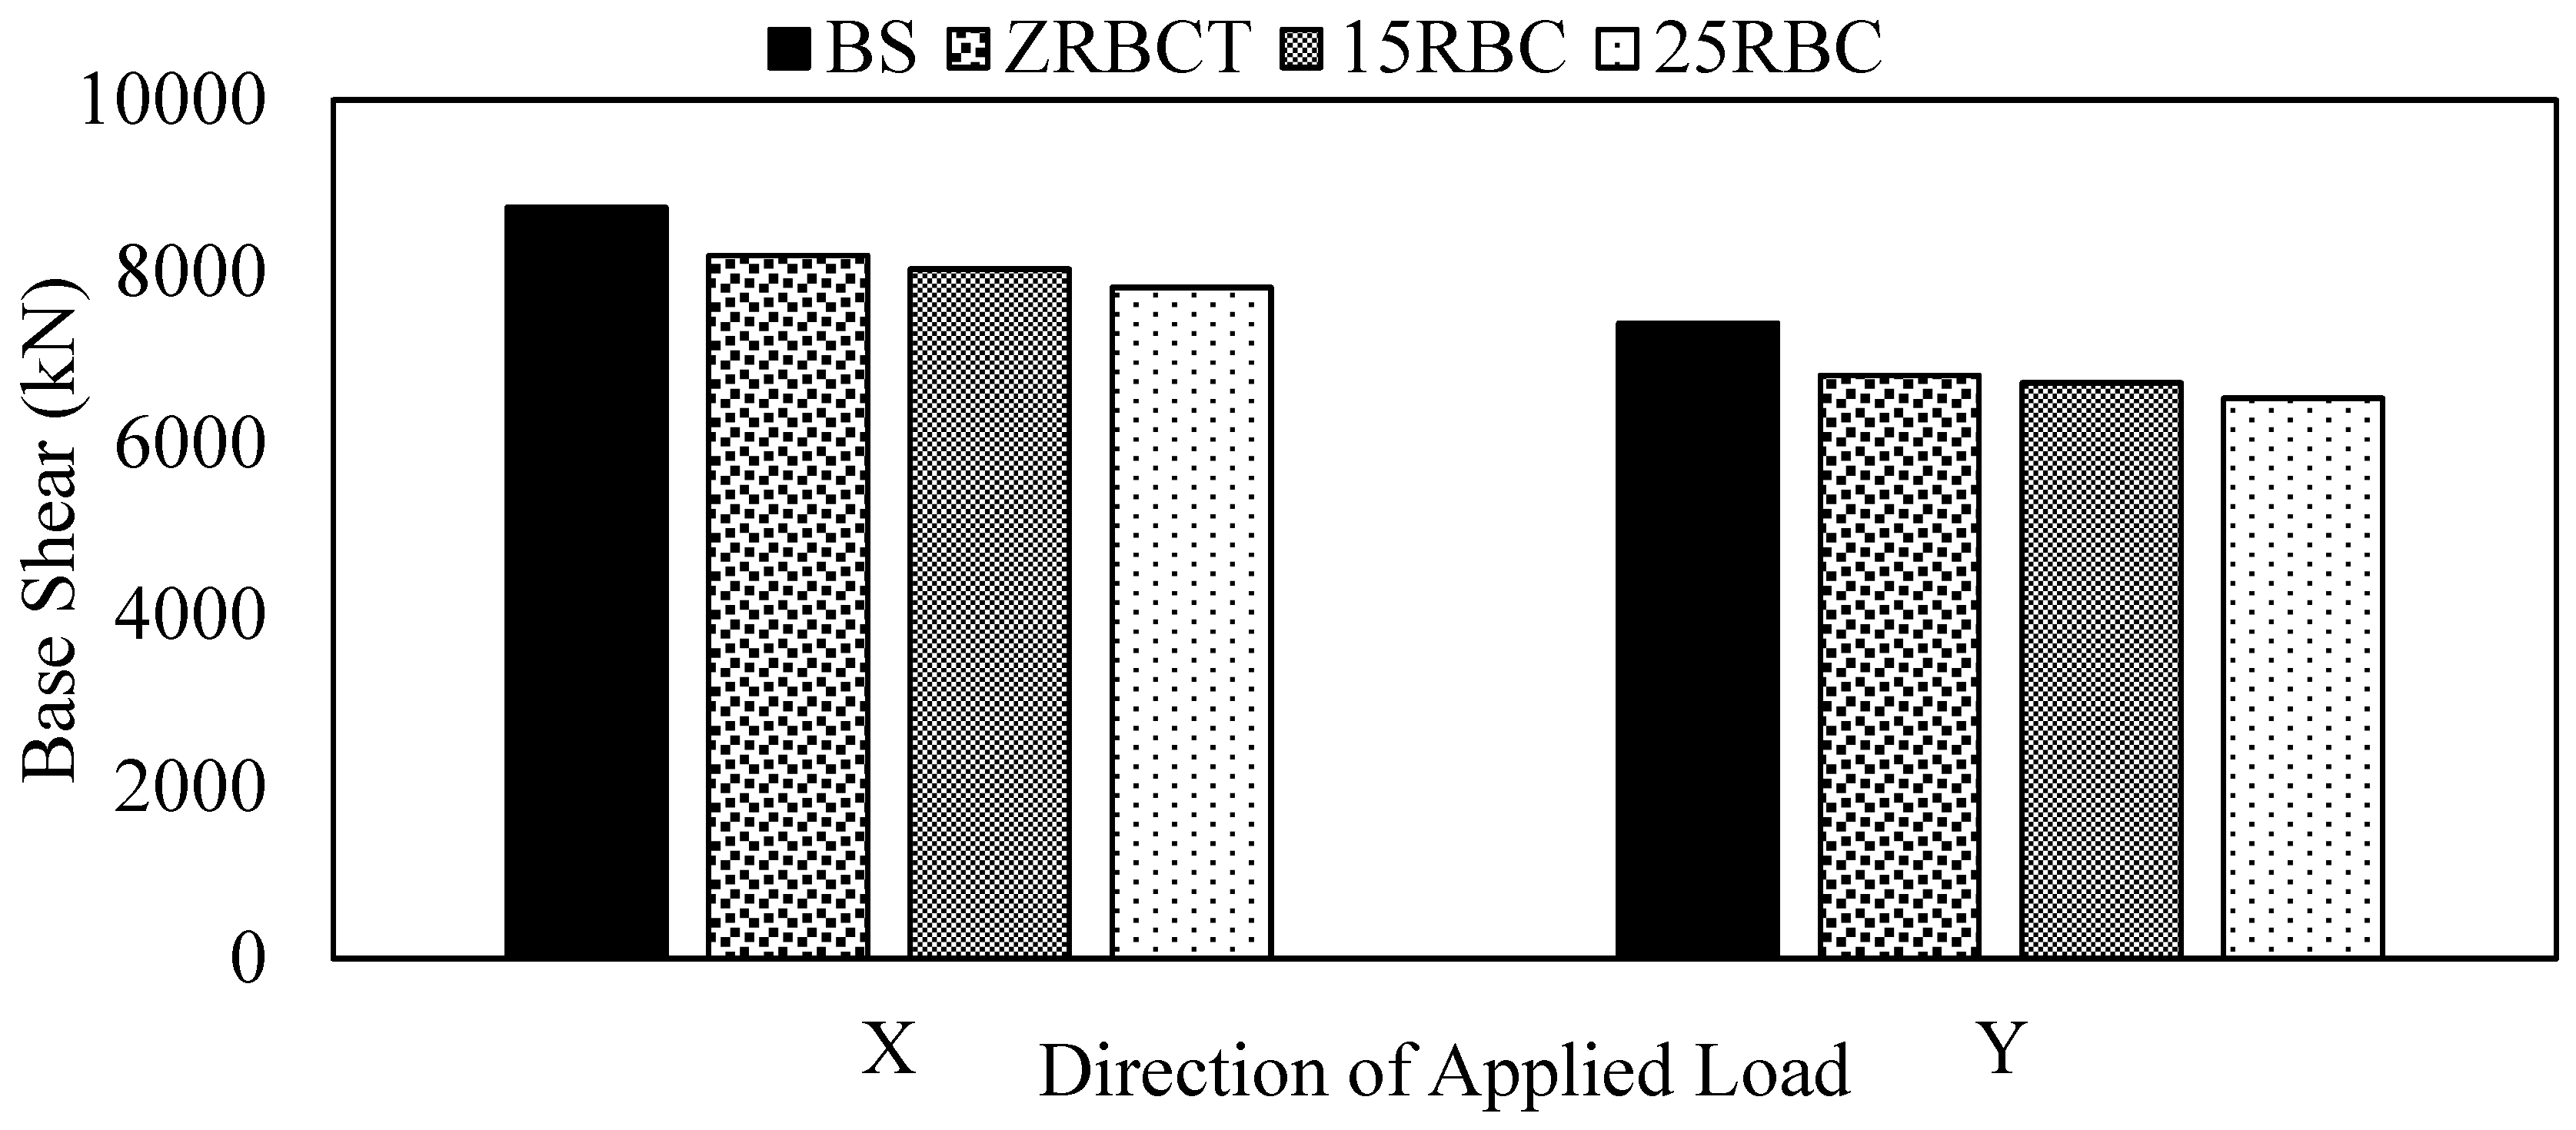
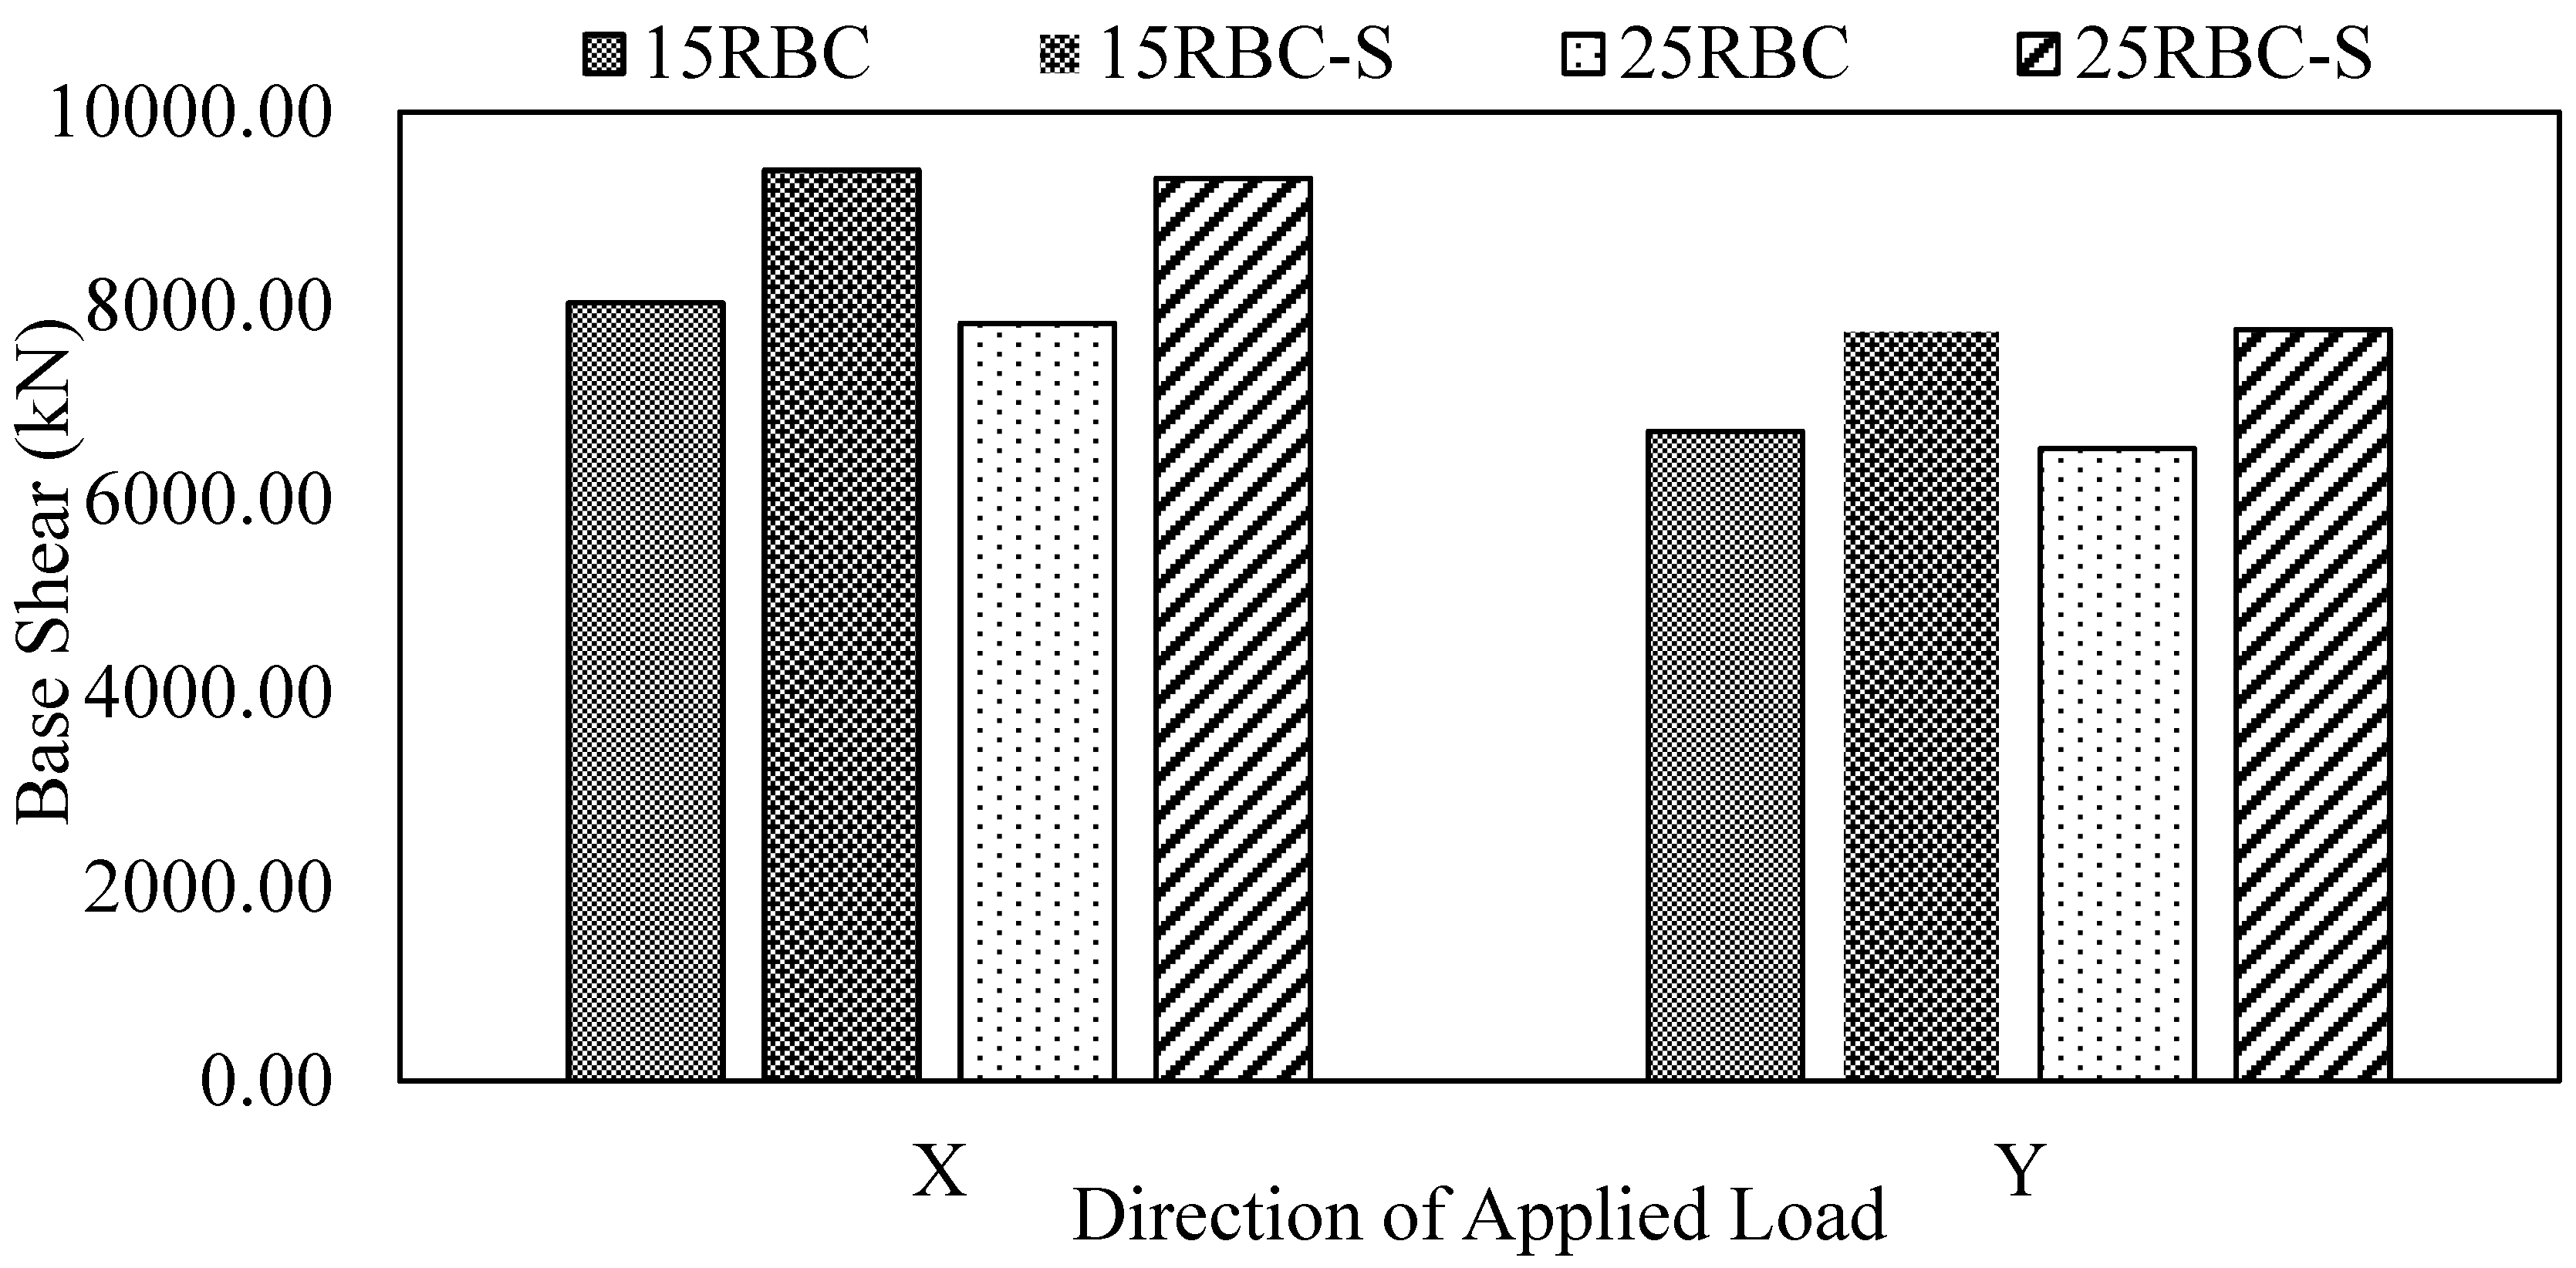
As expected in these models that the base shear, Figure 55 is going to be very similar as their natural frequency is almost identical. This fact allows as to reduce the number of variations between the models and highlight the pure effect of enhanced properties of RBC on the energy dissipation capability of the retrofitted building.
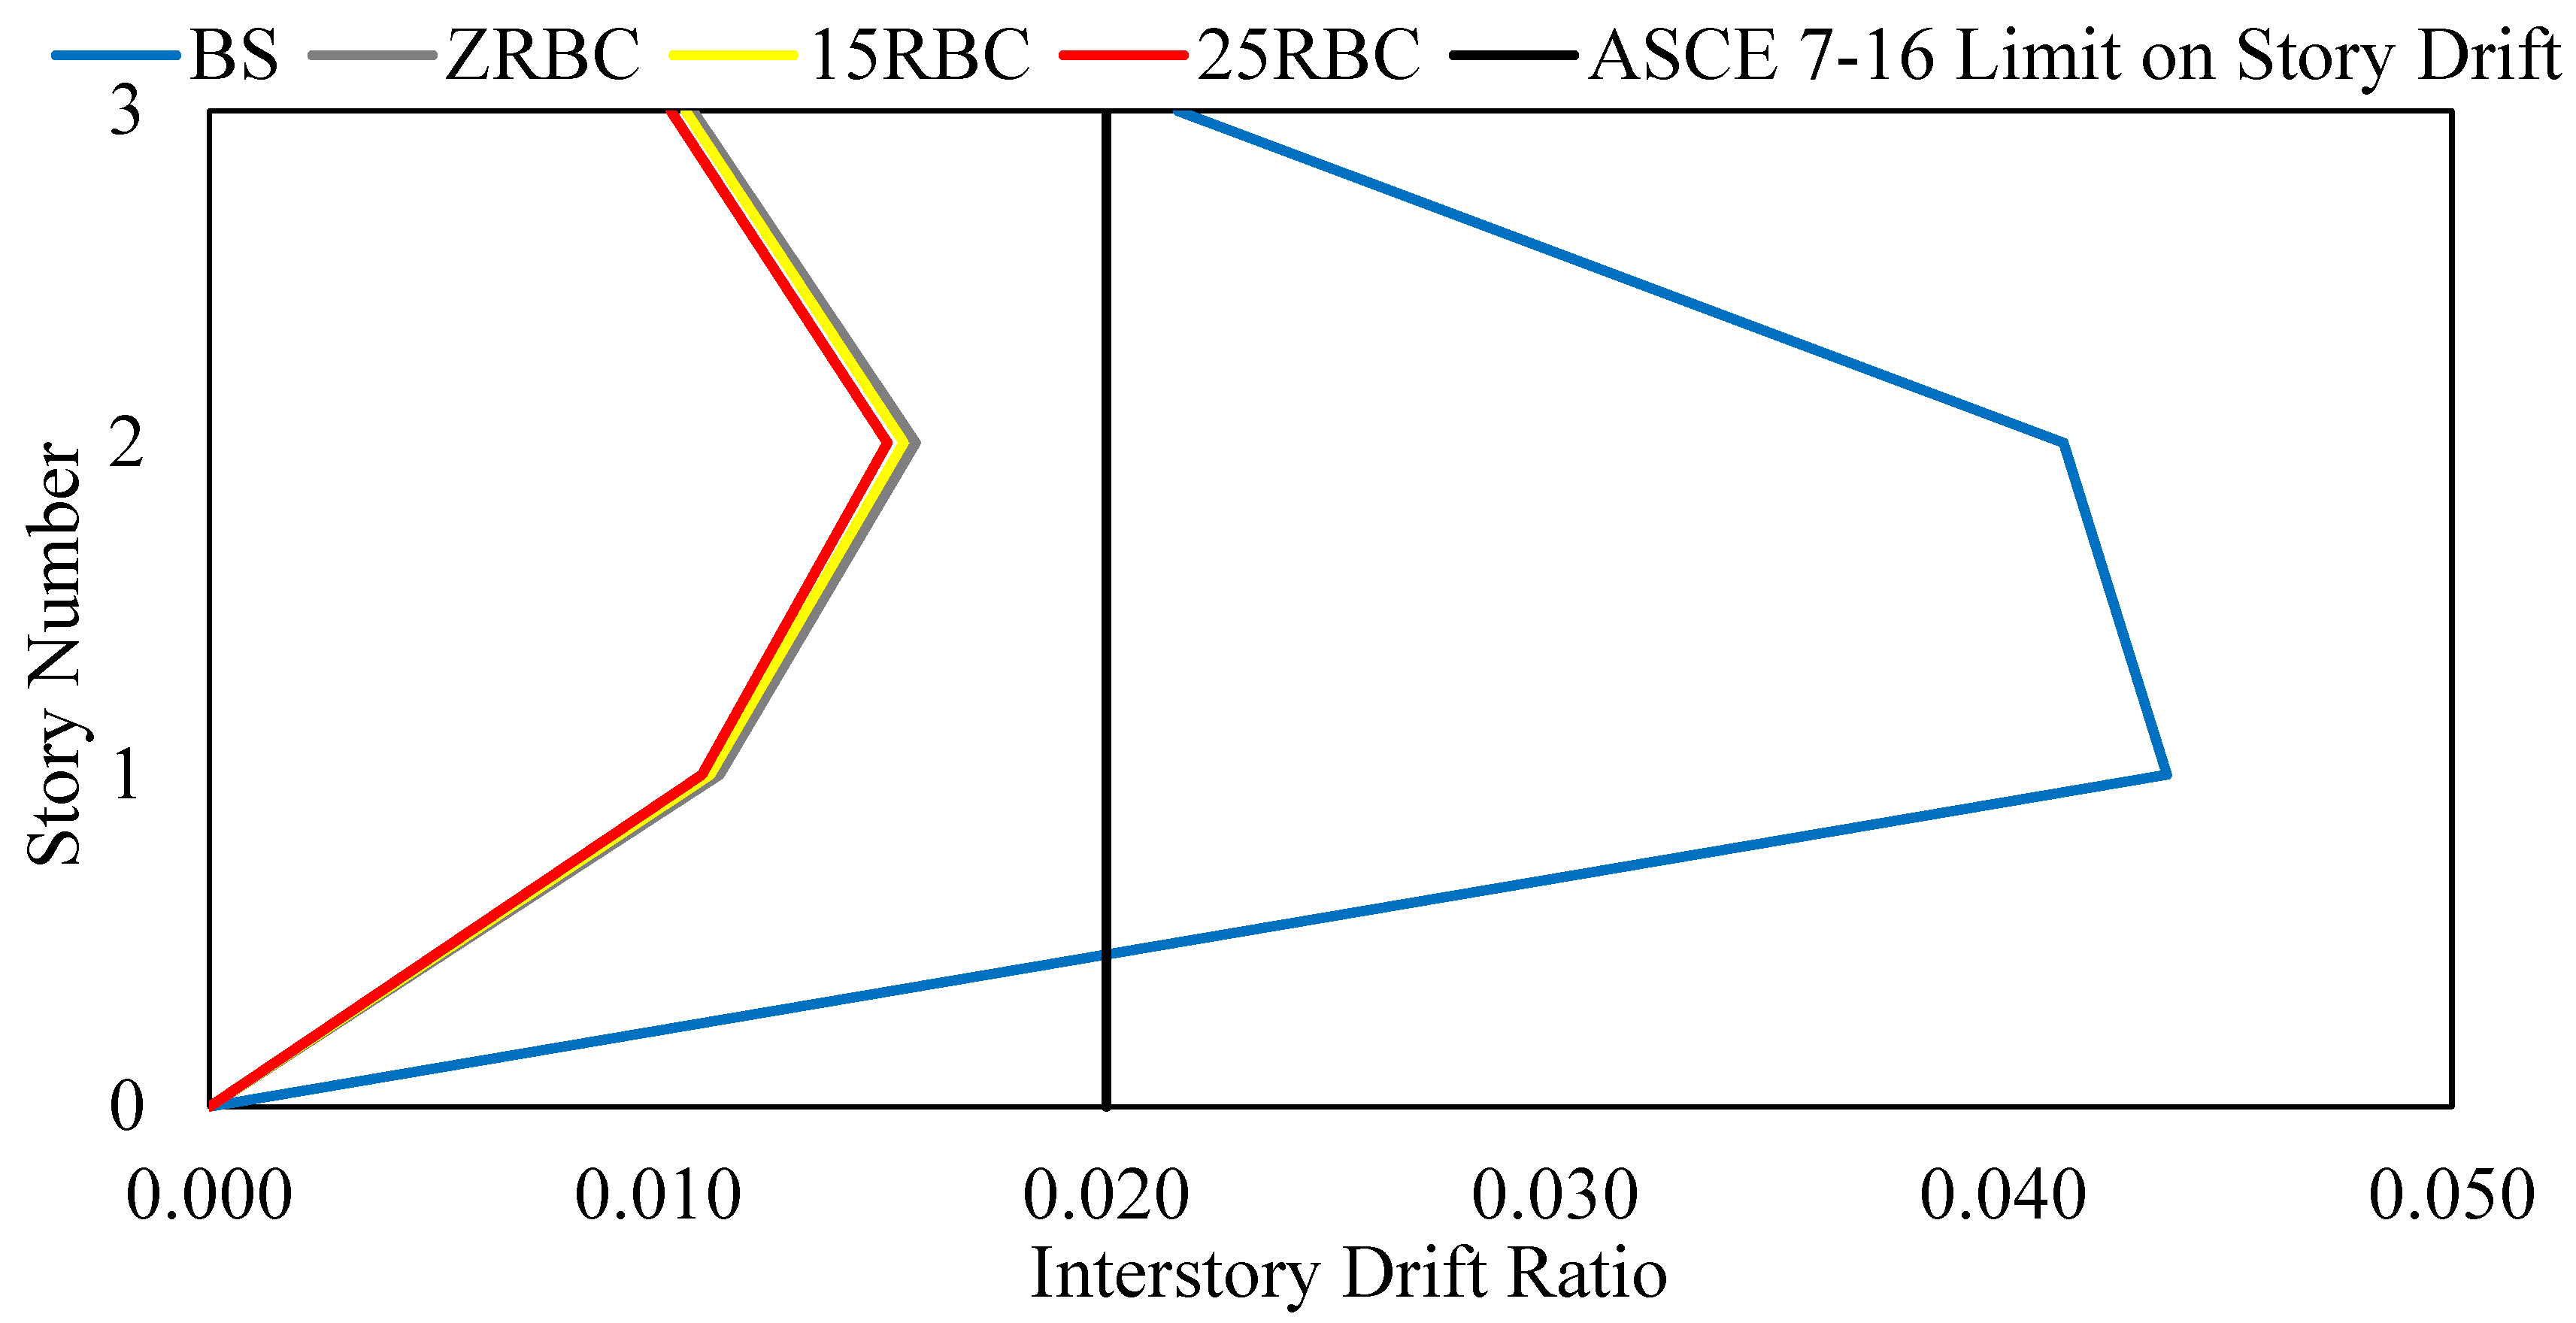
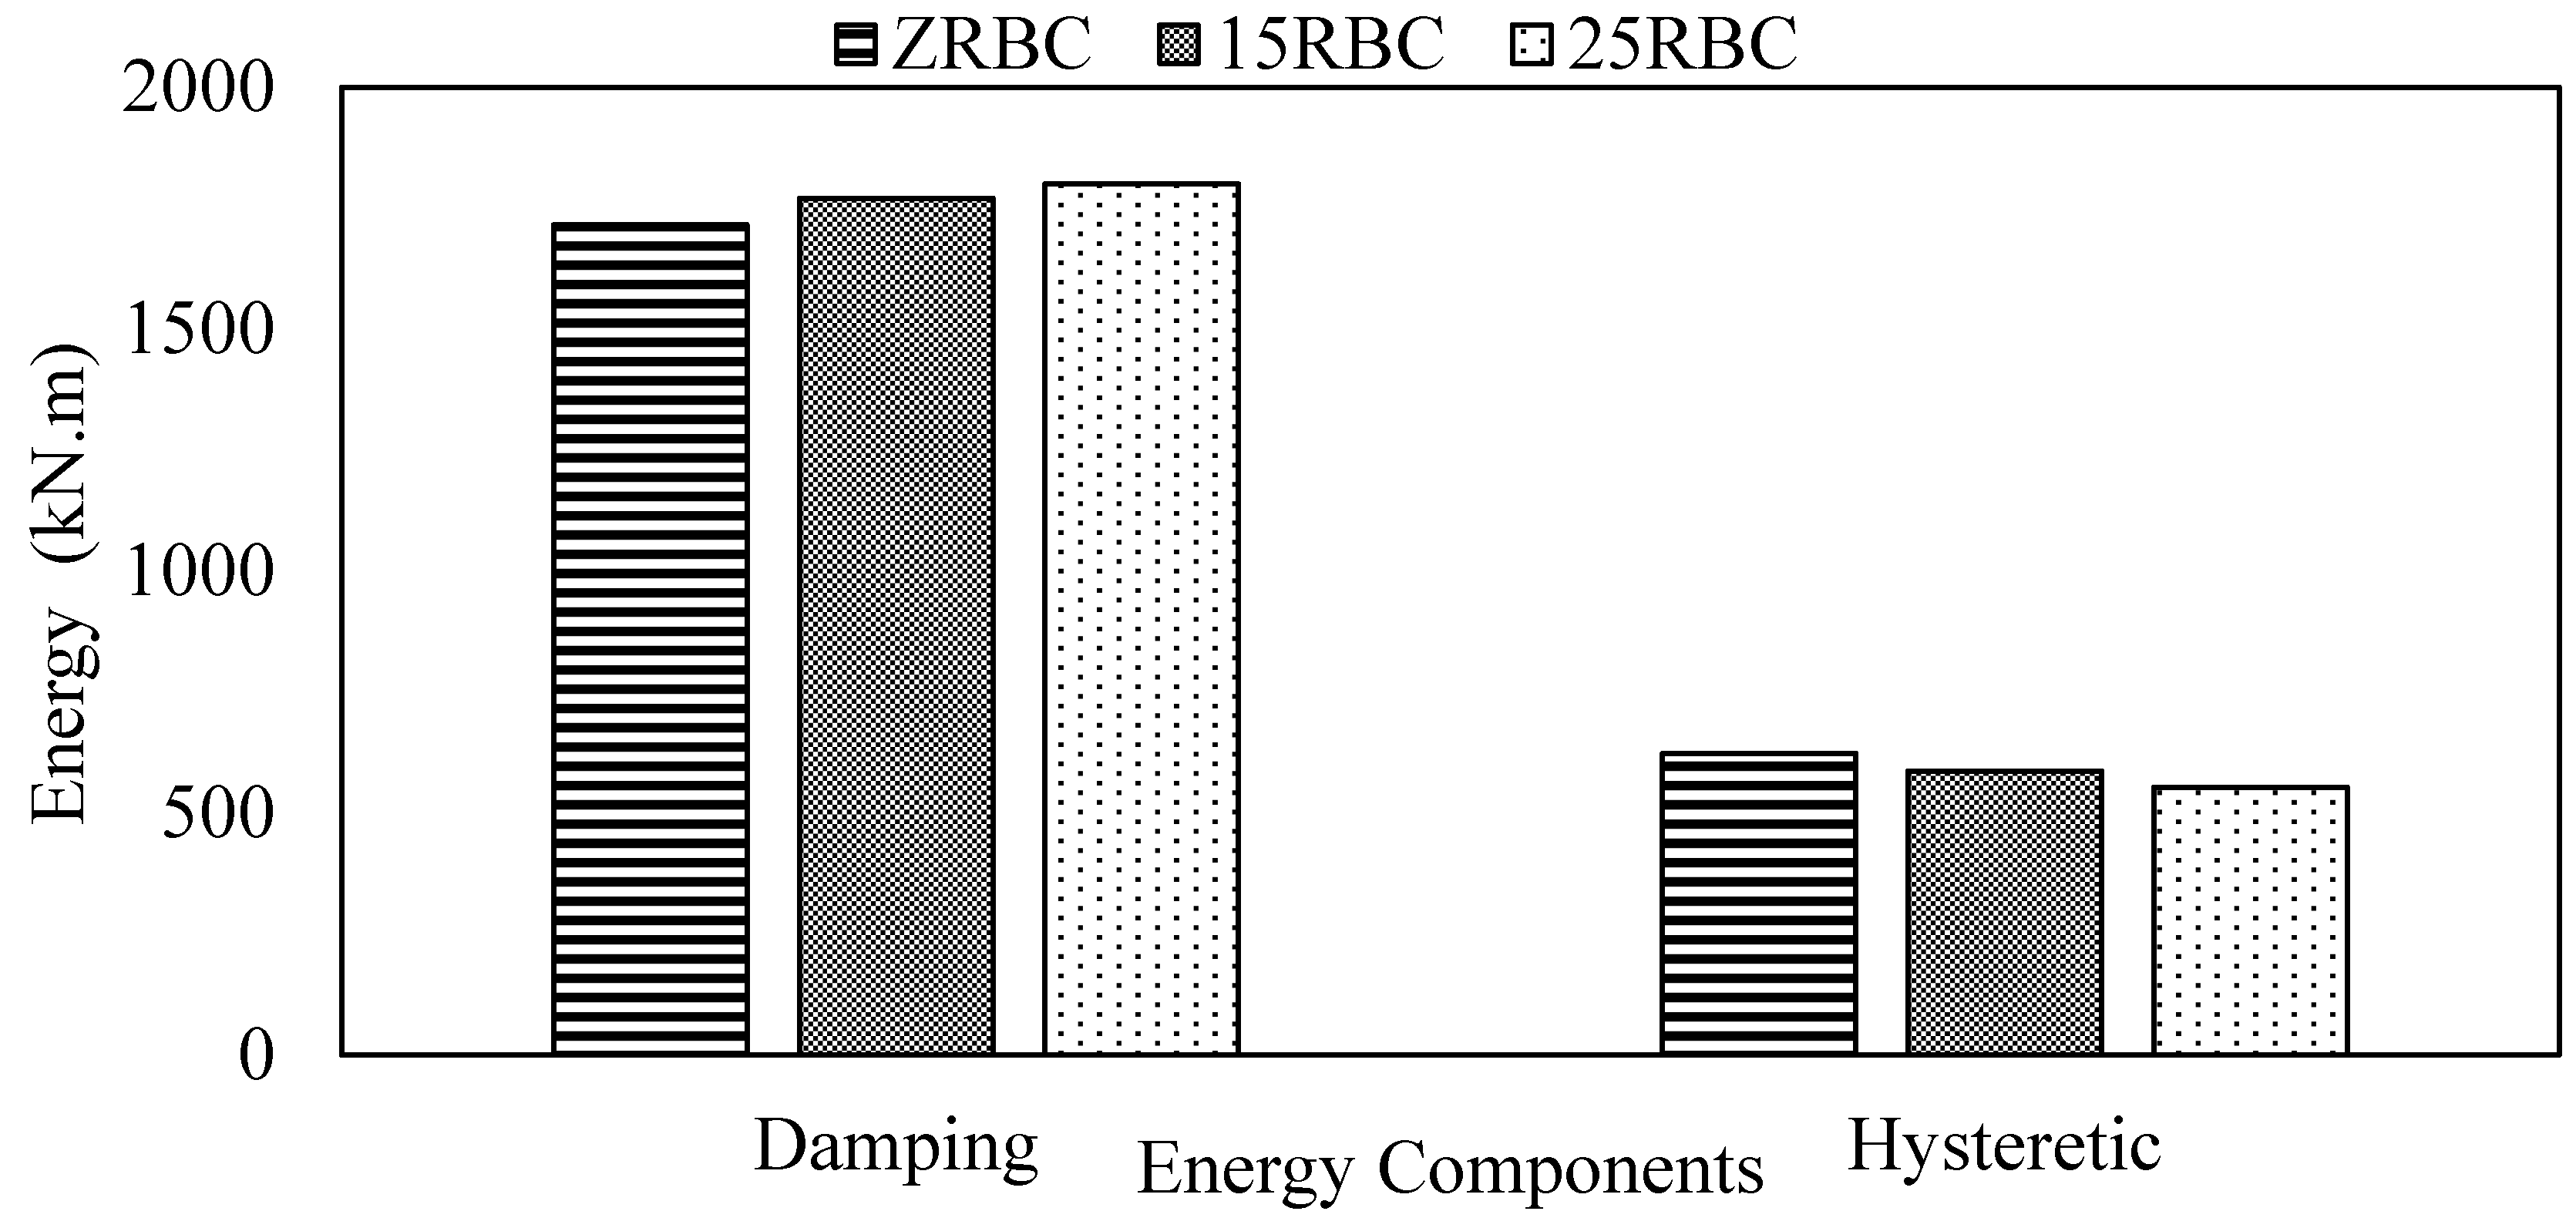
As can be seen in Table 19 both 15RBC and 25RBC models have improved the performance of the BS in terms of the number of developed plastic hinges with the 25RBC being the best solution among other models due to its enhanced damping ratio and energy absorption.
Figure 56 and Figure 57 shows the interstory drift ratio of each model. As can be seen there all retrofitting models have satisfied the allowable limit provided in ASCE 7-16. Moreover, interstory drift ratio in ZRBC, 15RBC and 25RBC were almost same due as the seismic demand is same and added stiffness is same which means that the rubber models provided a higher safe drift capacity that produced zero failure in the lateral resisting system.
In addition, Figure 58 shows that as rubber content increases in the structure the energy dissipated through damping increases and the one dissipated through hysteresis behavior decreases which means that the damage produces by the shaking intensity is lower in the case of RBC in comparison to conventional concrete.
Furthermore, the performance level of the BS was improved from collapsed state to life safety due to the hinger drifts and damping energy and lower hysteretic energy that lead to overall better performance in the 15RBC and 25RBC models in comparison to ZRBC model. Moreover, the performance of ZRBC model is inacceptable and did not solve the problem of the structure which means that the suggested configuration there cannot be used as a jacketing solution for the BS.
Similar Thickness Models
This set includes the models shown in Table 20. These models have the same retrofitting section configuration which allows a study on the effects of RBC on seismic demand of the structure. As expected ZRBCT will provided a significant increase in the story stiffness due to its higher modulus of elasticity which yielded to significantly lower period in comparison to other models.
Figure 60 shows that as rubber content is increasing the base shear is slightly decreasing which is due to the lower stiffness of the RBC models.
Figure 61 and Figure 62 shows the interstory drift ratio of each model. As can be seen there all retrofitting models have satisfied the allowable limit provided in ASCE 7-16. Moreover, drift ratios in the 15RBC and 25RBC were considerably higher than the ZRBC ones although lower number of plastic hinges were developed there this is attributed to the higher deformability and energy dissipation of RBC that increases structure displacement without causing any damage.
In addition, Figure 63 shows that RBC models significantly improved the damping energy that the higher energy will be dissipated without causing significant damage to the structure.
Furthermore, similar to the previous case study the performance level of the BS was improved from collapsed state to life safety due to the hinger drifts and damping energy and lower hysteretic energy that lead to overall better performance in the 15RBC and 25RBC models in comparison to ZRBCT.
Moreover, the performance of ZRBCT model is inacceptable and did not solve the problem of the structure which means that the suggested configuration there cannot be used as a jacketing solution for the BS, also it has considerably higher plastic hinges compared to 15RBC and 25RBC models.
Similar Strength Models
This section is going to investigate the effect of deformability and damping of RBC on the performance of structures in comparison to conventional concrete of the same compressive strength capacity as can be seen in Table 21.
As expect the stiffness of the retrofitted structures, Figure 64, are similar since their natural frequency and compressive strength and are same as can be seen in Table 21. However due to the significant difference in the material damping ratio the higher in 15RBC-S and 25RBC-S as seen in Figure 65.sss
Figure 66 and Figure 67 shows the interstory drift ratio in each model. In general, all models have provided a satisfying displacement to the limits in ASCE 7-16, however RBC models showed a lower value in comparison to the conventional concrete ones, this is attributed to the higher base shear and lower damping energy in 15RBC-S and 25RBC-S in comparison to 15RBC and 25RBC respectively.
Furthermore, the number of developed plastic hinges is reduced in the case of rubberized concrete which is in match with results in the previous sections and due to the higher damping energy and lower hysteresis energy, Figure 68, in the case of RBC that reduces the damage in the structure.

5. Conclusions

This study has focused on the performance of retrofitted structures using RBC in comparison to control and conventional concrete jackets. As part of this study, experimental, analytical and numerical investigation were conducted to comprehensively examine the effect of adding rubber on the properties of high-performance concrete and the structural behavior of retrofitted structures using RBC. On the basis of the above statements the following conclusions are drawn:
  • Adding rubber to concrete significantly reduces its mechanical properties in comparison to conventional concrete.
  • Rubberized aggregate can be classified as a light weight aggregate due to its lower specific gravity in comparison to the natural rocks.
  • Increasing the amount of rubber in concrete up to 25% reduces its workability by almost 20%.
  • Almost 40% decrease in the compressive strength of concrete where observed when 25% rubber aggregates replaced the natural ones.
  • Rubberized concrete is considerably better in ductility and absorption energy than normal concrete.
  • Adding rubber aggregates to concrete can change the failure pattern of concrete from brittle to ductile failure.
  • Incorporating rubber in a concrete mix reduces its resistance to water absorption in comparison to the normal one but in general the resistance of RBC is high enough to consider the produced concrete as high performance concrete.
  • Incorporating 25% rubber particles in concrete increased its damping ratio by about 30%.
  • Current available constitutive models are incapable of estimating the properties of RBC with coarse rubber particles.
  • RBC was capable of retrofitting the BS and improves its performance from the collapsed level to the life safety level while other models were incapable of solving this deficiency.
  • Higher damping energy and lower hysteresis energy is expected when RBC is used in comparison to the control mixture in the case of similar natural frequency buildings and similar jacketing thickness.
  • Regardless of the rubber content similar interstory drift ratio is expected in retrofitted structures with similar stiffnesses.
  • At the same jacketing configuration control mixture will provide a higher stiffness but will yield to higher number of hinges.
  • At the same compressive strength, structures retrofitted using RBC will behave better than the ones retrofitted using conventional concrete mixture in terms of seismic demand and energy dissipation.
Finally, further research is needed in this filed to address some of the missing points in the literature such as the contribution rubberized concrete to the reduction in base shear compared to control one in high rise buildings, and to come up with an optimized mix considering the cost of production and the difficulties of producing this type of concrete in premix plant.

Data Availability Statement

Some or all data, models, or codes that support the findings of this study are available from the corresponding author upon reasonable request.

Acknowledgments

The authors would like to gratefully acknowledge the financial support provided by Eastern Mediterranean University (BAP-C No: 02-19-01). Any opinions, findings, conclusions, or recommendations expressed in this material are those of the authors and do not necessarily reflect those of Eastern Mediterranean University.

Conflicts of Interest

All authors declare that they have no conflicts of interest.

References

  1. ACI (American Concrete Institute). (2014). ACI 318-14: Building code requirements for reinforced concrete. Farmington Hills, USA: ACI.
  2. Al Houri, A.; Habib, A.; Elzokra, A.; Habib, M. Tensile Testing of Soils: History, Equipment and Methodologies. Civ. Eng. J. 2020, 6, 591–601. [Google Scholar] [CrossRef]
  3. Alam, I. , Mahmood, A., & Khattak, N. (2015). Use of Rubber as Aggregate in Concrete: A Review.
  4. Albano, C.; Camacho, N.; Reyes, J.; Feliu, J.; Hernández, M. Influence of scrap rubber addition to Portland I concrete composites: Destructive and non-destructive testing. Compos. Struct. 2005, 71, 439–446. [Google Scholar] [CrossRef]
  5. Anmeeganathan, S. R. , Ravichandran, T., & Subramanian, S. (2018). Finite Element Analysis On Flexural Strength Of High Strength Rubberized Concrete. International Journal of Civil Engineering and Technology, 9(11), 990-996.
  6. Antoniou, S. , Pinho, R., & Bianchi, F. (2018). SeismoSignal. Seismosoft srl.
  7. Arya, A. S. , Boen, T., & Ishiyama, Y. (2014). Guidelines for earthquake resistant non-engineered construction. UNESCO.
  8. ASCE. (2016). ASCE/SEI 7-16 Minimum Design Loads For Buildings and Other Structures.
  9. ASCE. (2017). ASCE/SEI 41-17 Seismic Evaluation and Retrofit of Existing Buildings.
  10. Aslani, F. Mechanical Properties of Waste Tire Rubber Concrete. J. Mater. Civ. Eng. 2016, 28. [Google Scholar] [CrossRef]
  11. ASTM. (2013). ASTM C566 Standard Test Method for Total Evaporable Moisture Content of Aggregate by Drying.
  12. ASTM. (2013). ASTM C642 Standard Test Method for Density, Absorption, and Voids in Hardened Concrete.
  13. ASTM. (2014). ASTM C136 Standard Test Method for Sieve Analysis of Fine and Coarse Aggregates.
  14. ASTM. (2014). ASTM C469 Standard Test Method for Static Modulus of Elasticity and Poisson’s Ratio of Concrete in Compression.
  15. ASTM. (2015). ASTM C1240 Standard Specification for Silica Fume Used in Cementitious Mixtures.
  16. ASTM. (2015). ASTM C127 Standard Test Method for Relative Density (Specific Gravity) and Absorption of Coarse Aggregate.
  17. ASTM. (2015). ASTM C128 Standard Test Method for Relative Density (Specific Gravity) and Absorption of Fine Aggregate.
  18. ASTM. (2015). ASTM C1758 Standard Practice for Fabricating Test Specimens with Self-Consolidating Concrete.
  19. ASTM. (2016). ASTM A820 Standard Specification for Steel Fibers for Fiber-Reinforced Concrete.
  20. ASTM. (2017). ASTM C494 Standard Specification for Chemical Admixtures for Concrete.
  21. ASTM. (2017). ASTM C496 Standard Test Method for Splitting Tensile Strength of Cylindrical Concrete Specimens.
  22. ASTM. (2018). ASTM C1602 Standard Specification for Mixing Water Used in the Production of Hydraulic Cement Concrete.
  23. ASTM. (2018). ASTM C1611 Standard test method for slump flow of self-consolidating concrete.
  24. ASTM. (2018). ASTM C33 Standard Specification for Concrete Aggregates.
  25. ASTM. (2018). ASTM C39 Standard Test Method for Compressive Strength of Cylindrical Concrete Specimens.
  26. ASTM. (2018). ASTM C78 Standard Test Method for Flexural Strength of Concrete (Using Simple Beam with Third-Point Loading).
  27. ASTM. (2019). ASTM C1202 Standard Test Method for Electrical Indication of Concrete’s Ability to Resist Chloride Ion Penetration.
  28. ASTM. (2019). ASTM C595 Standard Specification for Blended Hydraulic Cements.
  29. Beschi, C.; Meda, A.; Riva, P. High Performance Fiber Reinforced Concrete Jacketing in a Seismic Retrofitting Application. ATC and SEI Conference on Improving the Seismic Performance of Existing Buildings and Other Structures. LOCATION OF CONFERENCE, United StatesDATE OF CONFERENCE; pp. 224–233.
  30. Bisht, K.; Ramana, P. Evaluation of mechanical and durability properties of crumb rubber concrete. Constr. Build. Mater. 2017, 155, 811–817. [Google Scholar] [CrossRef]
  31. Bompa, D.; Elghazouli, A.; Xu, B.; Stafford, P.; Ruiz-Teran, A. Experimental assessment and constitutive modelling of rubberised concrete materials. Constr. Build. Mater. 2017, 137, 246–260. [Google Scholar] [CrossRef]
  32. Bravo, M. , & De Brito, J. (2012). Concrete made with used tyre aggregate: Durability-related performance. Journal of Cleaner Production.
  33. Brena, S. F. , & Alcocer, S. M. (2009). Seismic Performance Evaluation of Rehabilitated Reinforced Concrete Columns through Jacketing. ATC & SEI 2009 Conference on Improving the Seismic Performance of Existing Buildings and Other Structures, 572-583.
  34. BS 8110-2. (1995). British Standard Institute., Structural Use of Concrete—Part 2: Code of Practice for Special Circumstance. London: British Standard Institute.
  35. Bunke, N. (1991). Prüfung von Beton. Empfehlungen und Hinweise als Ergänzung zu DIN 1048. Deutscher Ausschuss für Stahlbeton.
  36. C330, A. (2017). Standard Specification for Lightweight Aggregates for Structural Concrete. ASTM.
  37. Campione, G. , Fossetti, M., Giacchino, C., & Minafò, G. (2014). RC columns externally strengthened with RC jackets. Materials and Structures/Materiaux et Constructions, 47(10), 1715-1728.
  38. Chen, Z.; Li, L.; Xiong, Z. Investigation on the interfacial behaviour between the rubber-cement matrix of the rubberized concrete. J. Clean. Prod. 2018, 209, 1354–1364. [Google Scholar] [CrossRef]
  39. Chopra, A. K. (2001). Dynamics of structures: theory and applications to earthquake engineering. Prentice-Hall.
  40. Chou, L.H.; Lu, C.-K.; Chang, J.-R.; Lee, M.T. Use of waste rubber as concrete additive. Waste Manag. Res. J. a Sustain. Circ. Econ. 2007, 25, 68–76. [Google Scholar] [CrossRef]
  41. CSI. (n.d.). ETABS Integrated Analysis, Design and Drafting of Building Systems. California: Computers and Structures Inc.
  42. CSI. (n.d.). SAP2000 Integrated Software for Structural Analysis and Design. California: Computers and Structures Inc.
  43. Eldin, N.N.; Senouci, A.B. Engineering properties of rubberized concrete. Can. J. Civ. Eng. 1992, 19, 912–923. [Google Scholar] [CrossRef]
  44. Eldin, N. , & Senouci, A. (1993). Rubber-Tire Particles as Concrete Aggregate. Journal of Materials in Civil Engineering.
  45. Eldin, N.N.; Senouci, A.B. Measurement and prediction of the strength of rubberized concrete. Cem. Concr. Compos. 1994, 16, 287–298. [Google Scholar] [CrossRef]
  46. Elzokra, A.; Al Houri, A.; Habib, A.; Habib, M.; Malkawi, A.B. Shrinkage Behavior of Conventional and Nonconventional Concrete: A Review. Civ. Eng. J. 2020, 6, 1839–1851. [Google Scholar] [CrossRef]
  47. Emmons, R. H. (1993). Concrete Repair and Maintenance Illustrated: Problem Analysis; Repair Strategy; Techniques. RSMeans.
  48. ENUICA, C. , BOB, C., DAN, S., BADEA, C., & GRUIN, A. (2009). Solutions for Bond Improving of Reinforced Concrete Columns Jacketing. Proceedings of the 11th WSEAS International Conference on Sustainability in Science Engineering. Timisoara.
  49. Fattuhi, N.; Clark, L. Cement-based materials containing shredded scrap truck tyre rubber. Constr. Build. Mater. 1996, 10, 229–236. [Google Scholar] [CrossRef]
  50. Gintautas, S. , Gintautas, S., & Kęstutis, M. (2009). Damping properties of concrete with rubber waste additives. Materials Science (Medžiagotyra), 15(3), 266-272.
  51. Güneyisi, E. , Gesoǧlu, M., & Özturan, T. (2004). Properties of rubberized concretes containing silica fume. Cement and Concrete Research.
  52. Habib, A. , & Habib, M. (2020). Sustainable Recycling of Marble Dust as Cement Replacement in Concrete: Advances and Recent Trends. In Cement Industry-Optimization, Characterization and Sustainable Application. IntechOpen.
  53. Habib, A. , & Yildirim, U. ( 27(3), 185–197.
  54. Habib, A.; Yildirim, U. Estimating mechanical and dynamic properties of rubberized concrete using machine learning techniques: a comprehensive study. Eng. Comput. 2022, 39, 3129–3178. [Google Scholar] [CrossRef]
  55. Habib, A.; Yildirim, U. Simplified modeling of rubberized concrete properties using multivariable regression analysis. Mater. De Construccion 2022, 72, e289–e289. [Google Scholar] [CrossRef]
  56. Habib, A.; AL Houri, A.; Habib, M.; Elzokra, A.; Yildirim, U. Structural Performance and Finite Element Modeling of Roller Compacted Concrete Dams: A Review. Lat. Am. J. Solids Struct. 2021, 18. [Google Scholar] [CrossRef]
  57. Habib, A.; Yildirim, U.; Eren, O. Properties of high-strength concrete containing well graded rubber particles. IOP Conf. Series: Mater. Sci. Eng. 2020, 800. [Google Scholar] [CrossRef]
  58. Habib, A.; Yildirim, U.; Eren, O. Mechanical and dynamic properties of high strength concrete with well graded coarse and fine tire rubber. Constr. Build. Mater. 2020, 246, 118502. [Google Scholar] [CrossRef]
  59. Habib, A.; Yildirim, U.; Eren, O. Column repair and strengthening using RC jacketing: a brief state-of-the-art review. Innov. Infrastruct. Solutions 2020, 5, 1–11. [Google Scholar] [CrossRef]
  60. Habib, A.; Yildirim, U.; Eren, O. Seismic Behavior and Damping Efficiency of Reinforced Rubberized Concrete Jacketing. Arab. J. Sci. Eng. 2021, 46, 4825–4839. [Google Scholar] [CrossRef]
  61. Habib, A.; Yildirim, U.; Habib, M. Applying Kernel Principal Component Analysis for Enhanced Multivariable Regression Modeling of Rubberized Concrete Properties. Arab. J. Sci. Eng. 2022, 48, 5383–5396. [Google Scholar] [CrossRef]
  62. Habib, M.; Okayli, M. Evaluating the Sensitivity of Machine Learning Models to Data Preprocessing Technique in Concrete Compressive Strength Estimation. Arab. J. Sci. Eng. 2024, 1–19. [Google Scholar] [CrossRef]
  63. Hassanli, R.; Mills, J.E.; Li, D.; Benn, T. Experimental and Numerical Study on the Behavior of Rubberized Concrete. Adv. Civ. Eng. Mater. 2017, 6, 134–156. [Google Scholar] [CrossRef]
  64. Hassanli, R.; Youssf, O.; Mills, J.E. Experimental investigations of reinforced rubberized concrete structural members. J. Build. Eng. 2017, 10, 149–165. [Google Scholar] [CrossRef]
  65. Hellesland, J. , & Green, R. ( 69(12), 770–774.
  66. Hernández-Olivares, F.; Barluenga, G. Fire performance of recycled rubber-filled high-strength concrete. Cem. Concr. Res. 2004, 34, 109–117. [Google Scholar] [CrossRef]
  67. Institute), A. (. (2018). ACI 239R-18: Ultra-High Performance Concrete: An Emerging Technology Report. USA: Farmington Hills.
  68. Ismail, M.K.; Hassan, A.A. Shear behaviour of large-scale rubberized concrete beams reinforced with steel fibres. Constr. Build. Mater. 2017, 140, 43–57. [Google Scholar] [CrossRef]
  69. Julio, E.N.B.S.; Branco, F.A.B. Reinforced Concrete Jacketing--Interface Influence on Cyclic Loading Response. ACI Struct. J. 2008, 105. [Google Scholar] [CrossRef]
  70. Júlio, E. N. , Branco, F. A., & Silva, V. D. (2005). Reinforced concrete jacketing-interface influence on monotonic loading response. Aci Structural Journal, 102(2), 252-257.
  71. Júlio, E.S.; Branco, F.; Silva, V.D. Structural rehabilitation of columns with reinforced concrete jacketing. Prog. Struct. Eng. Mater. 2003, 5, 29–37. [Google Scholar] [CrossRef]
  72. Júlio, E.N.; Branco, F.A.; Silva, V.D. Concrete-to-concrete bond strength. Influence of the roughness of the substrate surface. Constr. Build. Mater. 2004, 18, 675–681. [Google Scholar] [CrossRef]
  73. Khatib, Z. , & Bayomy, F. (1999). Rubberized Portland Cement Concrete. Journal of Materials in Civil Engineering.
  74. Kumar Soni, A. , & Anne Mary, J. (n.d.). Literature Review On Partially Replaced Of Crumb Rubber By Fine Aggregate In Concrete.
  75. Kumaran, G.S.; Mushule, N.; Lakshmipathy, M. A Review on Construction Technologies that Enables Environmental Protection: Rubberized Concrete. Am. J. Eng. Appl. Sci. 2008, 1, 40–44. [Google Scholar] [CrossRef]
  76. Lampropoulos, A.; Dritsos, S. Concrete shrinkage effect on the behavior of RC columns under monotonic and cyclic loading. Constr. Build. Mater. 2011, 25, 1596–1602. [Google Scholar] [CrossRef]
  77. Lampropoulos, A. P. , Tsioulou, O. E. ( 109(3), 331–340.
  78. Lampropoulos, A.P.; Dritsos, S.E. Modeling of RC columns strengthened with RC jackets. Earthq. Eng. Struct. Dyn. 2011, 40, 1689–1705. [Google Scholar] [CrossRef]
  79. Li, D.; Mills, J.E.; Benn, T.; Ma, X.; Gravina, R.; Zhuge, Y. Review of the Performance of High-Strength Rubberized Concrete and Its Potential Structural Applications. Adv. Civ. Eng. Mater. 2016, 5. [Google Scholar] [CrossRef]
  80. Li, D.; Zhuge, Y.; Gravina, R.; Mills, J.E. Compressive stress strain behavior of crumb rubber concrete (CRC) and application in reinforced CRC slab. Constr. Build. Mater. 2018, 166, 745–759. [Google Scholar] [CrossRef]
  81. Li, W.; Wang, X.C.; Zhang, J.P. An Overview of the Study and Application of Rubberized Portland Cement Concrete. Adv. Mater. Res. 2012, 598, 374–378. [Google Scholar] [CrossRef]
  82. Lydon, F.; Balendran, R. Some observations on elastic properties of plain concrete. Cem. Concr. Res. 1986, 16, 314–324. [Google Scholar] [CrossRef]
  83. Ma, C.-K. , Apandi, N., Sofrie, C., Ng, J., Lo, W., Awang, A., & Omar, W. (2017, 2 15). Repair and rehabilitation of concrete structures using confinement: A review. Construction and Building Materials, 133, 502-515.
  84. Malkawi, A.B.; Habib, M.; Aladwan, J.; Alzubi, Y. Engineering properties of fibre reinforced lightweight geopolymer concrete using palm oil biowastes. Aust. J. Civ. Eng. 2020, 18, 82–92. [Google Scholar] [CrossRef]
  85. Malkawi, A. B. , Habib, M. ( 18(65), 132–139.
  86. Mansur, M.A.; Wee, T.H.; Chin, M.S. Derivation of the complete stress – strain curves for concrete in compression. Mag. Concr. Res. 1995, 47, 285–290. [Google Scholar] [CrossRef]
  87. Mendis, A.S.; Al-Deen, S.; Ashraf, M. Behaviour of similar strength crumbed rubber concrete (CRC) mixes with different mix proportions. Constr. Build. Mater. 2017, 137, 354–366. [Google Scholar] [CrossRef]
  88. Mendis, A.S.; Al-Deen, S.; Ashraf, M. Effect of rubber particles on the flexural behaviour of reinforced crumbed rubber concrete beams. Constr. Build. Mater. 2017, 154, 644–657. [Google Scholar] [CrossRef]
  89. Mendis, A.S.; Al-Deen, S.; Ashraf, M. Flexural shear behaviour of reinforced Crumbed Rubber Concrete beam. Constr. Build. Mater. 2018, 166, 779–791. [Google Scholar] [CrossRef]
  90. Minafò, G. A practical approach for the strength evaluation of RC columns reinforced with RC jackets. Eng. Struct. 2015, 85, 162–169. [Google Scholar] [CrossRef]
  91. Mohammed, B.S. Structural behavior and m–k value of composite slab utilizing concrete containing crumb rubber. Constr. Build. Mater. 2010, 24, 1214–1221. [Google Scholar] [CrossRef]
  92. Moo-Young, H.; Sellasie, K.; Zeroka, D.; Sabnis, G. Physical and Chemical Properties of Recycled Tire Shreds for Use in Construction. J. Environ. Eng. 2003, 129, 921–929. [Google Scholar] [CrossRef]
  93. Mousa, M.I. Effect of elevated temperature on the properties of silica fume and recycled rubber-filled high strength concretes (RHSC). HBRC J. 2017, 13, 1–7. [Google Scholar] [CrossRef]
  94. Moustafa, A.; ElGawady, M.A. Mechanical properties of high strength concrete with scrap tire rubber. Constr. Build. Mater. 2015, 93, 249–256. [Google Scholar] [CrossRef]
  95. Moustafa, A.; Gheni, A.; ElGawady, M.A. Shaking-Table Testing of High Energy–Dissipating Rubberized Concrete Columns. J. Bridg. Eng. 2017, 22. [Google Scholar] [CrossRef]
  96. Mushunje, K.; Otieno, M.; Ballim, Y. A review of Waste Tyre Rubber as an Alternative Concrete Consituent Material. MATEC Web Conf. 2018, 199, 11003. [Google Scholar] [CrossRef]
  97. Najim, K.; Hall, M. A review of the fresh/hardened properties and applications for plain- (PRC) and self-compacting rubberised concrete (SCRC). Constr. Build. Mater. 2010, 24, 2043–2051. [Google Scholar] [CrossRef]
  98. Noaman, A.T.; Abu Bakar, B.; Akil, H.M. Experimental investigation on compression toughness of rubberized steel fibre concrete. Constr. Build. Mater. 2016, 115, 163–170. [Google Scholar] [CrossRef]
  99. Noaman, A.T.; Abu Bakar, B.; Akil, H.M. The Effect of Combination between Crumb Rubber and Steel Fiber on Impact Energy of Concrete Beams. Procedia Eng. 2015, 125, 825–831. [Google Scholar] [CrossRef]
  100. Ong, K. C. , Kog, Y. P. ( 56(2), 89–98.
  101. Onuaguluchi, O.; Panesar, D.K. Hardened properties of concrete mixtures containing pre-coated crumb rubber and silica fume. J. Clean. Prod. 2014, 82, 125–131. [Google Scholar] [CrossRef]
  102. Pelisser, F.; Zavarise, N.; Longo, T.A.; Bernardin, A.M. Concrete made with recycled tire rubber: Effect of alkaline activation and silica fume addition. J. Clean. Prod. 2011, 19, 757–763. [Google Scholar] [CrossRef]
  103. Kappos, A.; Penelis, G. Earthquake Resistant Concrete Structures; Taylor & Francis Ltd.: London, United Kingdom, 2010. [Google Scholar]
  104. Pham, T.M.; Zhang, X.; Elchalakani, M.; Karrech, A.; Hao, H.; Ryan, A. Dynamic response of rubberized concrete columns with and without FRP confinement subjected to lateral impact. Constr. Build. Mater. 2018, 186, 207–218. [Google Scholar] [CrossRef]
  105. Popovics, S. Verification of relationships between mechanical properties of concrete-like materials. Mat Constr 1975, 8, 183–191. [Google Scholar] [CrossRef]
  106. Raghavan, D.; Huynh, H.; Ferraris, C.F. Workability, mechanical properties, and chemical stability of a recycled tyre rubber-filled cementitious composite. J. Mater. Sci. 1998, 33, 1745–1752. [Google Scholar] [CrossRef]
  107. Ramdani, S.; Guettala, A.; Benmalek, M.; Aguiar, J.B. Physical and mechanical performance of concrete made with waste rubber aggregate, glass powder and silica sand powder. J. Build. Eng. 2018, 21, 302–311. [Google Scholar] [CrossRef]
  108. Rodrigues, H. , Pradhan, P. M., Furtado, A., Rocha, P., & Vila-Pouca, N. (2018). Structural Repair and Strengthening of RC Elements with Concrete Jacketing. In Strengthening and Retrofitting of Existing Structures (pp. 181-198). Singapore: Springer.
  109. Salzmann, A., S. , & C., L. Y. (2003). The damping analysis of experimental concrete beams under free-vibration. Advances in Structural Engineering, 53-64.
  110. Segre, N.; Monteiro, P.J.; Sposito, G. Surface Characterization of Recycled Tire Rubber to Be Used in Cement Paste Matrix. J. Colloid Interface Sci. 2002, 248, 521–523. [Google Scholar] [CrossRef] [PubMed]
  111. Sfakianakis, M. Biaxial bending with axial force of reinforced, composite and repaired concrete sections of arbitrary shape by fiber model and computer graphics. Adv. Eng. Softw. 2002, 33, 227–242. [Google Scholar] [CrossRef]
  112. Si, R. , Guo, S., & Dai, Q. (2017). Durability performance of rubberized mortar and concrete with NaOH-Solution treated rubber particles. Construction and Building Materials.
  113. Siddique, R.; Naik, T.R. Properties of concrete containing scrap-tire rubber – an overview. Waste Manag. 2004, 24, 563–569. [Google Scholar] [CrossRef]
  114. Smith, S. W. (1997). The scientist and engineer's guide to digital signal processing.
  115. Strukar, K.; Šipoš, T.K.; Dokšanović, T.; Rodrigues, H. Experimental Study of Rubberized Concrete Stress-Strain Behavior for Improving Constitutive Models. Materials 2018, 11, 2245. [Google Scholar] [CrossRef] [PubMed]
  116. Su, H.; Yang, J.; Ling, T.-C.; Ghataora, G.S.; Dirar, S. Properties of concrete prepared with waste tyre rubber particles of uniform and varying sizes. J. Clean. Prod. 2015, 91, 288–296. [Google Scholar] [CrossRef]
  117. Sukontasukkul, P.; Tiamlom, K. Expansion under water and drying shrinkage of rubberized concrete mixed with crumb rubber with different size. Constr. Build. Mater. 2012, 29, 520–526. [Google Scholar] [CrossRef]
  118. Thomas, B.S.; Gupta, R.C. Properties of high strength concrete containing scrap tire rubber. J. Clean. Prod. 2016, 113, 86–92. [Google Scholar] [CrossRef]
  119. Thomas, B.S.; Gupta, R.C. Long term behaviour of cement concrete containing discarded tire rubber. J. Clean. Prod. 2015, 102, 78–87. [Google Scholar] [CrossRef]
  120. Thomas, B.S.; Gupta, R.C. A comprehensive review on the applications of waste tire rubber in cement concrete. Renew. Sustain. Energy Rev. 2016, 54, 1323–1333. [Google Scholar] [CrossRef]
  121. Thomas, B.S.; Gupta, R.C.; Kalla, P.; Cseteneyi, L. Strength, abrasion and permeation characteristics of cement concrete containing discarded rubber fine aggregates. Constr. Build. Mater. 2014, 59, 204–212. [Google Scholar] [CrossRef]
  122. Thomas, B.S.; Kumar, S.; Mehra, P.; Gupta, R.C.; Joseph, M.; Csetenyi, L.J. Abrasion resistance of sustainable green concrete containing waste tire rubber particles. Constr. Build. Mater. 2016, 124, 906–909. [Google Scholar] [CrossRef]
  123. Tian, S.; Zhang, T.; Li, Y. Research on Modifier and Modified Process for Rubber-Particle Used in Rubberized Concrete for Road. Adv. Mater. Res. 2011, 243-249, 4125–4130. [Google Scholar] [CrossRef]
  124. Topçu, B. (1995). The Properties Of Rubberized Concretes.
  125. Tsonos, A. G. (1999). Lateral load response of strengthened reinforced concrete beam-to-column joints. ACI structural journal, 96, 46-56.
  126. Wang, Y.; Chen, J.; Gao, D.; Huang, E. Mechanical Properties of Steel Fibers and Nanosilica Modified Crumb Rubber Concrete. Adv. Civ. Eng. 2018, 2018, 1–10. [Google Scholar] [CrossRef]
  127. WBCSD. (2010). End-of-Life Tires: A Framework for Effective Management Systems. World Business Council for Sustainable Development.
  128. Woodson, R. D. (2009). Concrete structures: protection, repair and rehabilitation. Butterworth-Heinemann.
  129. Xie, J.; Li, J.; Lu, Z.; Li, Z.; Fang, C.; Huang, L.; Li, L. Combination effects of rubber and silica fume on the fracture behaviour of steel-fibre recycled aggregate concrete. Constr. Build. Mater. 2019, 203, 164–173. [Google Scholar] [CrossRef]
  130. Xue, J.; Shinozuka, M. Rubberized concrete: A green structural material with enhanced energy-dissipation capability. Constr. Build. Mater. 2013, 42, 196–204. [Google Scholar] [CrossRef]
  131. Youssf, O.; ElGawady, M.; Mills, J. Experimental investigation of crumb rubber concrete columns under seismic loading. In Structures; Elsevier: Amsterdam, The Netherlands, 2015. [Google Scholar]
  132. Youssf, O.; ElGawady, M.A.; Mills, J.E. Static cyclic behaviour of FRP-confined crumb rubber concrete columns. Eng. Struct. 2016, 113, 371–387. [Google Scholar] [CrossRef]
  133. Youssf, O.; ElGawady, M.A.; Mills, J.E.; Ma, X. An experimental investigation of crumb rubber concrete confined by fibre reinforced polymer tubes. Constr. Build. Mater. 2014, 53, 522–532. [Google Scholar] [CrossRef]
  134. Youssf, O.; Mills, J.E.; Hassanli, R. Assessment of the mechanical performance of crumb rubber concrete. Constr. Build. Mater. 2016, 125, 175–183. [Google Scholar] [CrossRef]
  135. Yung, W.H.; Yung, L.C.; Hua, L.H. A study of the durability properties of waste tire rubber applied to self-compacting concrete. Constr. Build. Mater. 2013, 41, 665–672. [Google Scholar] [CrossRef]
  136. Zheng, L.; Huo, X.S.; Yuan, Y. Experimental investigation on dynamic properties of rubberized concrete. Constr. Build. Mater. 2007, 22, 939–947. [Google Scholar] [CrossRef]
  137. Zheng, L.; Huo, X.S.; Yuan, Y. Strength, Modulus of Elasticity, and Brittleness Index of Rubberized Concrete. J. Mater. Civ. Eng. 2008, 20, 692–699. [Google Scholar] [CrossRef]
  138. Zhu, X.; Miao, C.; Liu, J.; Hong, J. Influence of Crumb Rubber on Frost Resistance of Concrete and Effect Mechanism. Procedia Eng. 2012, 27, 206–213. [Google Scholar] [CrossRef]
Figure 1. Fine and coarse rubber particles (Mousa, 2017).
Preprints 107463 g001
Figure 2. Compressive strength of RBC with: (a) coarse rubber; (b) fine rubber (Eldin and Senouci, 1992).
Preprints 107463 g002
Figure 3. Tensile strength of RBC with: (a) coarse rubber; (b) fine rubber (Eldin and Senouci 1992).
Preprints 107463 g003
Figure 4. Results of the compressive strength test conducted (Thomas and Gupta, 2016).
Preprints 107463 g004
Figure 5. Stress–strain curves of normal concrete (NC) and RBC (CRC) at 5%, 10% and 15% replacements (Noaman et al., 2016).
Preprints 107463 g005
Figure 6. (a) water absorption of specimens with water-cement ratio 0.4, 0.45 and 0.5 (Thomas and Gupta2015); (b) depth of abrasion of specimens with water-cement ratio 0.3, 0.4, 0.45 and 0.5 (Thomas et al., 2016).
Preprints 107463 g006
Figure 7. Comparing RBC (CRC) slab tests and ABAQUS model results (Li et al., 2018).
Preprints 107463 g007
Figure 8. Setup for the free vibration test conducted by (Moustafa et al., 2015).
Preprints 107463 g008
Figure 9. Setup for the free vibration test conducted by (Salzmann et al. 2003).
Preprints 107463 g009
Figure 10. Schematic representation of structural element conditions.
Preprints 107463 g010
Figure 11. Concrete jacketing techniques; (a) jacket directly loaded; (b) jacket indirectly loaded (Campione et al., 2014).
Preprints 107463 g011
Figure 12. Work process of strengthening using RC jacketing.
Preprints 107463 g012
Figure 13. Adopted research methodology.
Preprints 107463 g013aPreprints 107463 g013b
Figure 14. Particle size distribution of fine aggregate.
Preprints 107463 g014
Figure 15. Particle size distribution of coarse aggregate 4.75 - 12.5 mm.
Preprints 107463 g015
Figure 16. Particle size distribution of fine rubber.
Preprints 107463 g016
Figure 17. Particle size distribution of coarse rubber.
Preprints 107463 g017
Figure 18. Particle size distribution of rubber aggregate.
Preprints 107463 g018
Figure 19. The chip of MPU 6050 sensor.
Preprints 107463 g019
Figure 20. The chip of Arduino Uno R3 microcontroller.
Preprints 107463 g020
Figure 21. Arduino to MPU 6050 connections.
Preprints 107463 g021
Figure 24. Typical story plan of the studied building (in meter).
Preprints 107463 g022
Figure 25. Elevation of the studied building (in meter).
Preprints 107463 g023
Figure 26. 3D finite element model of the BS using ETABS.
Preprints 107463 g024
Figure 27. Details of the BS column.
Preprints 107463 g025
Figure 28. Design Response Spectrum with 5% damping.
Preprints 107463 g026
Figure 29. Risk-Targeted Response Spectrum with 5% damping.
Preprints 107463 g027
Figure 30. An example of risk-targeted spectral matching in time domain using ETABS for Imperial Valley earthquake.
Preprints 107463 g028
Figure 22. A schematic for the free vibration test.
Preprints 107463 g029
Figure 23. Setup of the free vibration test.
Preprints 107463 g030
Figure 31. (a) Slump flow (cm), (b) Bulk density (kg/m3) for each concrete mixture.
Preprints 107463 g031
Figure 32. a) Compressive strength (MPa), (b) Splitting tensile strength (MPa), (c) Flexural tensile strength (MPa), (d) Static modulus of elasticity (GPa) for each concrete mixture.
Preprints 107463 g032
Figure 33. Failure pattern of (a) ZRBC, (b) 15RBC and (c) 25RBC.
Preprints 107463 g033
Figure 34. Deformation sensors (a) LVDT transducer and (b) compressometer.
Preprints 107463 g034
Figure 35. Corrected stress-strain curve for ZRBC mixture.
Preprints 107463 g035
Figure 36. Stress-Strain behavior of each concrete mixture.
Preprints 107463 g036
Figure 37. Load-Deflection curve for each mixture.
Preprints 107463 g037
Figure 38. Flexural toughness of each concrete mixture (in Joule).
Preprints 107463 g038
Figure 39. Depth of water penetration for each mixture (in mm).
Preprints 107463 g039
Figure 40. Results of the selected constitutive model.
Preprints 107463 g040
Figure 41. Acceleration amplitudes of ZRBC specimen under free vibration excitation.
Preprints 107463 g041
Figure 42. Acceleration amplitudes of 15RBC specimen under free vibration excitation.
Preprints 107463 g042
Figure 43. Acceleration amplitudes of 25RBC specimen under free vibration excitation.
Preprints 107463 g043
Figure 44. Vibration curve in time domain of 15RBC specimen at one impact applied load.
Preprints 107463 g044
Figure 45. Damping ratio (%) of each concrete mixture.
Preprints 107463 g045
Figure 46. Natural frequency of ZRBC specimen using FFT method.
Preprints 107463 g046
Figure 47. Natural frequency of 15RBC specimen using FFT method.
Preprints 107463 g047
Figure 48. Natural frequency of 25RBC specimen using FFT method.
Preprints 107463 g048
Figure 49. Dynamic modulus of elasticity (GPa) for each concrete mixture.
Preprints 107463 g049
Figure 50. Concrete modulus of elasticity (GPa) for different rubber replacement percentages.
Preprints 107463 g050
Figure 51. Dynamic modulus of elasticity (GPa) for ZRBC specimen in comparison to selected prediction models.
Preprints 107463 g051
Figure 52. Failed elements in the bare structural model where BCC stands for beam column capacity ratio deficiency.
Preprints 107463 g052
Figure 53. Elements passed the design checks all retrofitted models.
Preprints 107463 g053
Figure 54. Story stiffness of the similar frequency models.
Preprints 107463 g054
Figure 55. Base shear of the similar frequency models.
Preprints 107463 g055
Figure 56. Interstory drift ratio of the similar frequency models with BS.
Preprints 107463 g056
Figure 57. Interstory drift ratio of the similar frequency models.
Preprints 107463 g057
Figure 58. Energy components for the similar frequency models.
Preprints 107463 g058
Figure 59. Story stiffness of the similar thickness models.
Preprints 107463 g059
Figure 60. Base shear of the similar thickness models.
Preprints 107463 g060
Figure 61. Interstory drift ratio of the similar thickness models with BS.
Preprints 107463 g061
Figure 62. Interstory drift ratio of the similar thickness models.
Preprints 107463 g062
Figure 63. Energy components for the similar thickness models.
Preprints 107463 g063
Figure 64. Story stiffness of the similar strength models.
Preprints 107463 g064
Figure 65. Base shear of the similar strength models.
Preprints 107463 g065
Figure 66. Interstory drift ratio of the similar strength models.
Preprints 107463 g066
Figure 67. Interstory drift ratio of the similar strength models.
Preprints 107463 g067
Figure 68. Energy components for the similar thickness models.
Preprints 107463 g068
Table 1. Classification of rubber particles (Siddique and Naik 2004).
Class Size Range (mm)
Shredded 100 to 460
Chipped 13 to 76
Grounded 0.15 to 19
Crumb 0.075 to 4.75
Table 2. Specific Gravity and Water Adsorption of recycled rubber particles (Moo-Young et al., 2003).
Rubber particle size (mm) Specific gravity Water adsorption (%)
< 50 1.1 6.7
50 - 100 1.1 6.95
100 - 200 1.06 7.1
200 - 300 1.1 7.0
Table 3. Description of construction process steps.
Action Description
Temporary shoring the element The aim behind this step is mainly emerging from the need to allow the RC jacket to carry the applied load together with the old column such that they are working as a one element (Júlio et al., 2003).
Remove the damaged / deteriorated part In some cases, where strengthening is intended for a damaged / deteriorated member the process will first start by repairing the column and then apply this technique (Rodrigues et al., 2018). In such a situation the repair process is to chip out damaged concrete then straighten the longitudinal bars and replace old ties in that part of the column (Hellesland & Green, 1972).
Short column This term generally refers to the columns with a low bending moment/shear force ratio (below 1.0) (Júlio & Branco, 2008; Júlio et al., 2005). In this cases debonding of the jacket may occur which means that an interface roughness improvement is required (Rodrigues et al., 2018).
Interface roughness improvement Using sand blasting or other roughening techniques.
Steel reinforcement Normal steel reinforcements that are being used in structural works are permitted for this type of applications.
Surface pre-wetting Pre-wetting the column for 24 hours before the pouring the jacket to prevent any evaporation of concrete water during the casting.
Concrete pouring It is important to limit the max size of aggregate used in concrete mixes so it can meet the standard code of requirements based on the spacing between the steel rebars and the concrete cover used. In addition, in some cases it is required to use concrete with self-compacting characteristics since is not possible to vibrate the concrete due to the selected jacket thickness, for the same reason application of high strength concrete may take place to minimize the final dimension of the retrofitted element (Júlio et al., 2003). Furthermore, care must be taken to the shrinkage of the used concrete due to its effects on the strength capacity of the structural element (Enuica et al., 2009).
Table 4. Mass of fine aggregate at different states measured as recommended by ASTM C128.
Fine aggregate Test 1 Test 2
Mass of oven dry specimen (A), g 460 454
Mass of pyconometer filled with water to calibrated mark (B), g 1337.8 1337
Mass of pyconometer filled with specimen and water to calibrated mark (C), g 1646.2 1645
Mass of saturated surface-dry specimen (S), g 500 500
Table 5. Specific gravity and percentage of water absorption for fine aggregate.
Fine aggregate 1 2
Specific Gravity OD 2.40 2.36
SSD 2.61 2.60
Apparent 3.03 3.11
Absorption, % 8.70 10.13
Table 6. Mass of coarse aggregate 4.75 - 12.5 mm at different states measured as recommended by ASTM C127.
Coarse aggregate 4.75 - 12.5 mm Test 1 Test 2
Mass of oven dry specimen (A), g 1949 1975
Mass of saturated surface-dry specimen (B), g 1977 2000
Apparent mass of saturated test sample in water (C), g 1152.7 1174.3
Table 7. Specific gravity and percentage of water absorption for coarse aggregate 4.75 - 12.5 mm.
Coarse aggregate 4.75 - 12.5 mm Test 1 Test 2
Specific Gravity OD 2.36 2.39
SSD 2.40 2.42
Apparent 2.45 2.47
Absorption, % 1.44 1.27
Table 8. Mass of fine particles in coarse aggregate 4.75 - 12.5 mm at different states measured as recommended by ASTM C128.
Fine particles in aggregate 4.75 - 12.5 mm Test 1 Test 2
Mass of oven dry specimen (A), g 486 485
Mass of pyconometer filled with water to calibrated mark (B), g 1337 1337
Mass of pyconometer filled with specimen and water to calibrated mark (C), g 1651 1651
Mass of saturated surface-dry specimen (S), g 500 500
Table 9. Specific gravity and percentage of water absorption for fine particles in coarse aggregate 4.75 - 12.5 mm.
Fine particles in aggregate 4.75 - 12.5 mm Test 1 Test 2
Specific Gravity OD 2.61 2.61
SSD 2.69 2.69
Apparent 2.83 2.84
Absorption, % 2.88 3.09
Table 10. Mix proportions used in this study.
Material Control Mix (ZRBC) 15% Rubberized Mix (15RBC) 25% Rubberized Mix (25RBC)
Cement (kg) 1000 1000 1000
Water (kg) 180 180 180
Fine Aggregate (kg) 448 381 336
Coarse Aggregate (kg) 672 571 504
Rubber Aggregate (kg) 0 70 117
Admixture (kg) 50 50 50
Silica Fume (kg) 300 300 300
Steel Fiber (kg) 78 78 78
Table 11. Number of specimens for each test and corresponding standard to be followed in this research.
Test No. of Specimens Size of the Specimen Standard to be Used
Workability - - ASTM C1611
Density of Hardened Concrete 6 150*150*150 ASTM C642
Compressive Strength 3 150*150*150 ASTM C39
Splitting Tensile Strength 3 150*150*150 ASTM C496
Flexure Strength 3 100*100*500 ASTM C78
Static Modulus of Elasticity 1 200*100 ASTM C469
Water Penetration 2 150*150*150 DIN 1048
Flexural Toughness 1 100*100*500 ASTM C1609
Table 12. Properties of the structural models that will be used in this study.
Model Code Model Properties Descriptions
BS Bare frames Unretrofitted structure
15RBC 15% RBC Jacket Retrofitted frame using the 15% reinforced RBC jacket
25RBC 25% RBC Jacket Retrofitted frame using the 25% reinforced RBC jacket
15RBC-S 15% similar strength RBC jacket Retrofitted frame using a ZRBC with the same strength as the 15% RBC jacket
25RBC-S 25% similar strength RBC jacket Retrofitted frame using a ZRBC with the same strength as the 25% RBC jacket
ZRBC Zero rubber concrete Retrofitted frame using control concrete (0% rubber) jacket with the same frequency as the rubberized jacketing models
ZRBCT Zero rubber concrete Retrofitted frame using control concrete (0% rubber) jacket with the same thickness and reinforcements as the rubberized jacketing models
Table 13. Properties of the materials used to construct the structural system.
Concrete Steel
Unit weight (kN/m3) 25 77
Modulus of elasticity (MPa) 29000 200000
Poisson ratio 0.2 0.3
Thermal coefficient (1/C) 0.00001 0.0000117
Shear modulus (MPa) 12083.33 76923
Compressive strength (MPa) 16 420
Table 14. Dimensions of the structural system.
Width (cm) Height (cm)
Slab - 15
Beam 30 45
Column 30 30
Table 15. Seismic parameters as provided by ASCE 7-16.
Seismic parameters Value Reference in ASCE 7-16
Risk category II Table 1.5-1
Seismic design category E Section 11.6
Response Modification Coefficient, R 8 Table 12.2-1
Overstrength Factor, Ω0 3 Table 12.2-1
Deflection Amplification Factor, Cd 5.5 Table 12.2-1
Seismic Importance Factor, Ie 1 Table 1.5-2
Mapped MCER, 5% damped, spectral response acceleration parameter at a period of 1s, S1 2 Section 11.4.2
Mapped MCER, 5% damped, spectral response acceleration parameter at short periods, Ss 0.75 Section 11.4.2
Building period coefficient, Ct 0.03 Table 12.8-2
Table 16. Selected earthquake records for NRHA.
Year Earthquake Earthquake Magnitude (Mw) PGA (g) Site Class* Duration (sec)
1940 Imperial Valley 6.95 0.17814 D 54
1976 Caldiran, Turkey 7.21 0.054725 D 29
1989 Loma Prieta 6.93 0.55553 D 40
1992 Landers 7.28 0.020604 D 47
1992 Erzican, Turkey 6.69 0.23454 D 22
1994 Northridge USA 6.69 0.050132 D 40
1995 Kobe, Japan 6.90 0.28423 D 41
1995 Dinar, Turkey 6.40 0.14062 D 28
1999 Kocaeli, Turkey 7.51 0.2063 D 28
1999 Chi-Chi, Taiwan 7.62 0.15621 D 56
1999 Duzce, Turkey 7.14 0.34613 D 26
* Based on ASCE 7-16 Site Classification
Table 17. Results of the selected constitutive model.
Property Prediction Experimental Error (%)
15RBC 25RBC 15RBC 25RBC
Compressive strength (Mpa) 48.03 30.19 71.28 58.25 32.61 48.17
Static modulus of elasticity (GPa) 34.01 25.45 38.20 36.60 10.96 30.46
Strain at peak stress 0.00195 0.00194 0.00272 0.0035 28.32 44.60
Table 18. Column details for all structural models.
Model Code Column Section Thickness and Reinforcement Details
BS Preprints 107463 i001 Size: 30 × 30 Reinforcements: 8 ϕ 14   ( 1.7 % ) ϕ 8 / 20
15RBC Preprints 107463 i002 JacketThickness: 75 mmReinforcements: 8 ϕ 18   ( 1.77 % ) ϕ 8 / 10
25RBC Preprints 107463 i003 JacketThickness: 75 mmReinforcements: 8 ϕ 18   ( 1.77 % ) ϕ 8 / 10
15RBC-S Preprints 107463 i004 JacketThickness: 75 mmReinforcements: 8 ϕ 18   ( 1.77 % ) ϕ 8 / 10
25RBC-S Preprints 107463 i005 JacketThickness: 75 mmReinforcements: 8 ϕ 18   ( 1.77 % ) ϕ 8 / 10
ZRBC Preprints 107463 i006 JacketThickness: 60 mmReinforcements: 8 ϕ 16   ( 1.77 % ) ϕ 8 / 10
ZRBC-T Preprints 107463 i007 JacketThickness: 75 mmReinforcements: 8 ϕ 18   ( 1.77 % ) ϕ 8 / 10
Table 19. Similar frequency models.
Model Natural Period (s) Hinges Performance Level (ASCE 41-17)
>IO >LS >CP
BS 0.66 290 14 34 Collapsed
ZRBC 0.425 70 0 8 Collapsed
15RBC 0.426 56 0 0 Life safety
25RBC 0.429 49 0 0 Life safety
Table 20. Similar thickness models.
Model Natural Period (s) Hinges Performance Level
(ASCE 41-17)
>IO >LS >CP
BS 0.66 290 14 34 Collapsed
ZRBCT 0.402 64 0 13 Collapsed
15RBC 0.426 56 0 0 Life safety
25RBC 0.429 49 0 0 Life safety
Table 21. Similar strength models.
Model Natural Period (s) Concrete Class Hinges Performance Level(ASCE 41-17)
>IO >LS >CP
15RBC 0.426 C60 56 0 0 Life safety
15RBC-S 0.426 C60 46 0 3 Collapsed
25RBC 0.429 C50 49 0 0 Life safety
25RBC-S 0.431 C50 48 2 0 Life safety
Disclaimer/Publisher’s Note: The statements, opinions and data contained in all publications are solely those of the individual author(s) and contributor(s) and not of MDPI and/or the editor(s). MDPI and/or the editor(s) disclaim responsibility for any injury to people or property resulting from any ideas, methods, instructions or products referred to in the content.
Copyright: This open access article is published under a Creative Commons CC BY 4.0 license, which permit the free download, distribution, and reuse, provided that the author and preprint are cited in any reuse.
Alerts
Prerpints.org logo

Preprints.org is a free preprint server supported by MDPI in Basel, Switzerland.

Subscribe

© 2025 MDPI (Basel, Switzerland) unless otherwise stated