1. Introduction
The Lily is a large genus of Liliaceae. Most of them are cultivated in temperate areas of the northern hemisphere, such as East Asia, Europe and North America [
1], and more than 100 kinds of lilies have been identified [
2]. Lily not only has high starch content, but also contains a considerable amount of protein. In addition, Lily contains a variety of bioactive components, such as polysaccharides, steroidal saponins and colchicine. It is a traditional Chinese food and traditional Chinese medicine [
3]. Polysaccharide is one of the main active components of lily, which has the functions of immune regulation, antitumor, antioxidant and hypoglycemic [
4,
5,
6,
7].
Cyclophosphamide (CTX) is suitable for a variety of tumors, cancers and autoimmune diseases [
8], because of its stable effect, easy access and low cost. High dose CTX can increase the risk of immunosuppression and secondary infection [
9]. In addition, CTX can destroy the intestinal barrier, change the intestinal microbiota, and increase the number of potential pathogenic bacteria [
10]. A large number of studies have shown that natural polysaccharides can maintain the health of the host by regulating intestinal microbiota and immune function [
11,
12,
13]. Immune response and intestinal microorganisms interact. Immune response can detect and remove harmful intestinal microorganisms and determine the composition of intestinal microbiota of the host, while intestinal microorganisms can improve or destroy immune response [
14]. In this experiment, cyclophosphamide was used to establish an immunosuppressive mouse model to study the immunomodulatory effect of lily polysaccharide and the changes of intestinal flora, so as to open up a new prospect for lily polysaccharide to become a new immunomodulator in the field of functional food and drugs.
2. Materials and Methods
2.1. Materials
SPF male BALB / c mice, 7 weeks old, weighing 18.0 ± 2.0 g, were routinely fed, provided by Beijing weitonglihua Experimental Animal Technology Co., Ltd., production license No.: scxk (Beijing) 2016-0006.
Lily produced in Guyuan County, Hebei Province. In the previous experiment, lily polysaccharide was isolated by ultrasonic assisted hot water extraction and purified by impurity removal.
2.2. Animal Grouping and Intervention
Fifty SPF male BALB/c mice, 7 weeks old and weighing 18.0 ± 2.0 g, were randomly divided into 5 groups: blank group, model group (CTX), high concentration LP group (HLP), low concentration LP group (LLP) and positive control group (LH). According to the pre experimental results and previous studies [
15,
16], the administration scheme of mice in each group is given, as shown in
Table 1. The mice were treated by gavage for 7 days, and the mice were killed on the 11th day to detect relevant indexes.
2.3. Weight
After the beginning of the experiment, the mice were weighed once a day to observe the weight changes of mice during the experiment.
2.4. Organ Index Determination
At the end of the experiment, all animals fasted for 12 hours. After blood was collected from the orbit, the cervical vertebra was dislocated and killed. The weights of spleen, thymus and liver were weighed. The organ index was obtained by organ weight (mg) / body weight (g).
2.5. Histopathological Observation
Mice were killed by cervical dislocation. The spleen and liver tissues were harvested, washed with 0.9% saline, fixed in 4% paraformaldehyde and then embedded in paraffin. Paraffin-embedded tissues were cut into 5 μm sections, and deparaffinized in xylene and rehydrated with graded series of ethanol. After staining with hematoxylin (Solarbio, Beijing, China) for 5 minutes and washing with 0.9% saline, sections were incubated with eosin (Solarbio) for another 2 minutes. The histological morphology was observed under an optical microscope (Zeiss, Oberkochen, Germany).
2.6. Detection of Immunoglobulin Content and Hematological Indexes in Serum
At the end of the experiment, the mice took orbital blood, part of which was used to detect the content of immunoglobulin. The blood was placed in a 4 °C refrigerator for 4 hours, centrifuged at 3000 R / min for 15 minutes, the serum was taken, and the content of immunoglobulin (IgA and IgG) was measured by colorimetry; The other part uses automatic biochemical analyzer to detect blood routine indexes such as red blood cells.
2.7. Detection of Cytokines in Colon
Mouse colonic tissues were excised, frozen in liquid nitrogen and stored at -80℃. The frozen tissues were extracted were extracted as follows and the supernatant was used for ELISA of pro-inflammatory cytokines (TNF-α, IL-6 and IL-10) as instructed by the kit (Beijing). The absorbance was measured at 450 nm.
2.8. Determination of Liver Biochemical Parameters
The liver was taken, 5% tissue homogenate was prepared, centrifuged at 1000 g for 10 min, and the supernatant was collected. Liver function indexes, such as AST and ALT, as well as SOD and MDA, markers of oxidative stress, were determined by colorimetry.
2.9. Real-Time Fluorescence Quantitative Polymerase Chain Reaction (Q-PCR)
Spleen tissue was cut, Trizol reagent was added to split the tissue, RNA was extracted with chloroform, the same amount of isopropyl alcohol was added, RNA was precipitated, the upper liquid was d iscarded after centrifuge, 75% ethanol was added to remove chloroform and isopropyl alcohol, vortex shock; After centrifugation, the precipitate was retained and dried. Rnase-free water was added, and the rNASe-free water was added, and the rNASe-free water was added, and the rNASe-free water was added, and the rNASe-free water was added, and the Rnase-free water was added, and the Rnase-free water was added.
The concentration of total RNA extracted was measured by ultra-micro nucleic acid protein quantifier, and the purity of RNA and the content of impurities were determined according to the ratio of 260/280 nm. The impurities led to the deviation of the determination concentration, and then the cDNA was synthesized using reverse transcription kit.
TransStar® T Green qPCR SuperMix (AQ101) kit was used for fluorescence quantification of the cDNA of the reverse transcription products mentioned above. The reaction procedure was shown in
Table 2, and the primer sequences were shown in
Table 3.
2.10. 16S DNA Sequencing and Analysis of Intestinal Flora
The feces were weighed and put into the centrifuge tube, PBS buffer was added, and the mixture was blown and mixed, centrifuged at 1500 r/min at 4℃ for 5 min. Suction supernatant, do not absorb precipitated impurities, repeat the above centrifugal operation, pour out the supernatant, continue to add PBS buffer, continue to blow, centrifugation under the same conditions for 10 min, to obtain the pretreated sample.
DNA was extracted from the pretreated samples by bacterial metagenomic DNA kit, and each step was extracted strictly according to the requirements of the kit.
The extracted sample DNA was sent to Beijing Nuohe Zhiyuan Company for DNA quality identification and subsequent 16S DNA sequencing analysis. The sequencing data were processed, intra group sample complexity analysis, inter-group comparison analysis, community structure difference analysis (Heat Map analysis), etc., to analyze and compare the differences in intestinal flora species and abundance between groups.
2.11. Statistical Analysis
Statistical software SPSS 23.0 was used for statistical analysis, and the results were expressed as mean standard deviation. The significant difference between groups was calculated by one-way ANOVA. P <0.01 was extremely significant and was represented by "**" or "##"; P <0.05 was significant and was represented by "*" or "#".
3. Results
3.1. Effects of Lily Polysaccharide on Body Weight of Immunosuppressed Mice
The weight of mice was weighed every day and the data was recorded. The weight changes of mice in each group were shown in
Table 4. After starting intragastric administration, compared with the blank group, the weight of mice in the positive control group increased rapidly, the weight of mice in the low concentration LP group increased slowly, and the weight of mice in the high concentration LP group decreased. After 4 days of intragastric administration, the body weight of mice in high concentration LP group increased rapidly. After 7 days of intragastoral administration, the weight of mice in the high and low concentration LP groups and the positive control group increased significantly compared with the model group, suggesting that Lilium polysaccharide LP can improve the weight loss of immunosuppressed mice caused by cyclophosphamide CTX.
3.2. Effects of Lily Polysaccharide on Thymus, Spleen and Liver Indexes in Immunosuppressive Mice
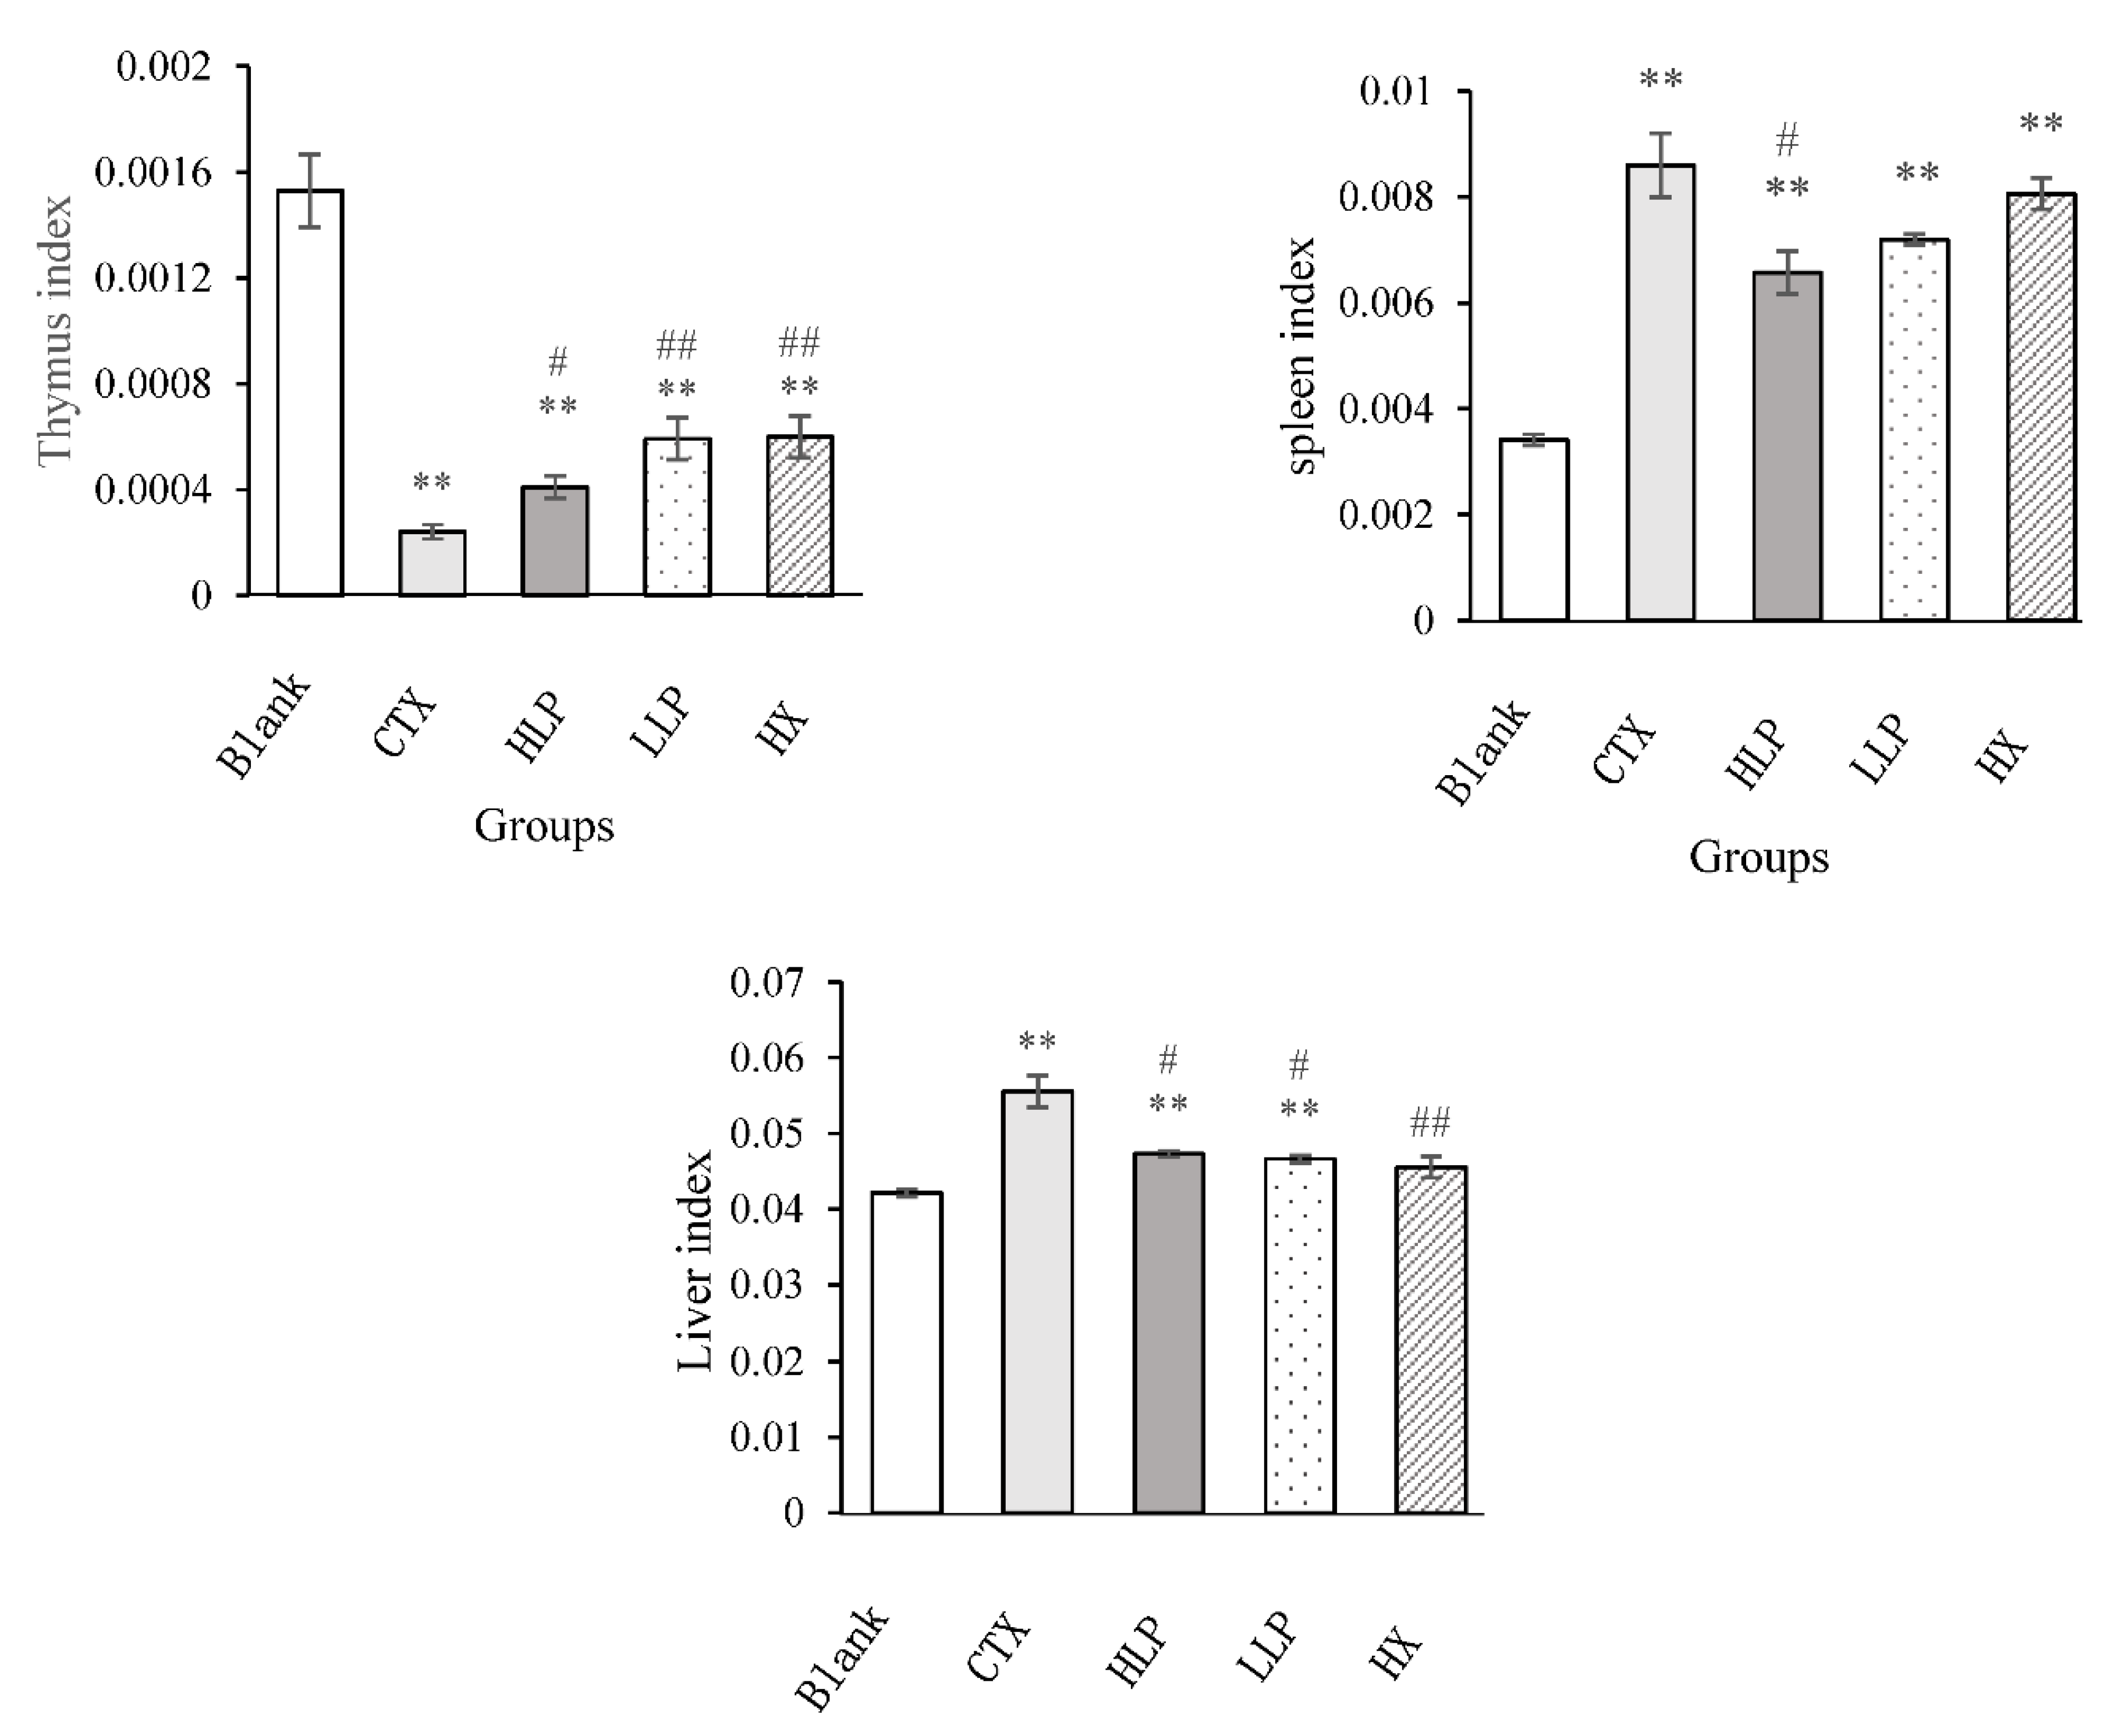
The organ indexes of mice in each group are shown in
Figure 1. The thymus index of the model group was significantly lower than that of the blank group (P < 0.01). Compared with the model group, the thymus index of mice in high and low concentration LP group and positive control group increased significantly (P < 0.05 or P < 0.01), which showed that lily polysaccharide LP could increase the thymus index of immunosuppressive mice, and the effect of low concentration LP was stronger than that of high concentration LP. The spleen index of mice in each group was significantly higher than that in the blank group (P < 0.01), which may be due to the proliferation of spleen fibrous tissue caused by intraperitoneal injection of CTX, resulting in splenomegaly [
17,
18], or the rapid weight loss of mice. Compared with the model group, the spleen index of mice in high concentration LP group decreased significantly (P < 0.05). The spleen index of mice in positive control group and low concentration LP group decreased, but the effect was not significant. This showed that LP can improve the splenomegaly of immunosuppressive mice and restore the spleen function of mice. For the liver, the liver index of model group and high and low concentration LP group was significantly higher than that of the blank group (P < 0.01). Compared with the model group, the liver index of mice in high and low concentration LP group and positive control group decreased significantly (P < 0.05 or P < 0.01).
Therefore, lily polysaccharide LP can improve the problem of liver enlargement and reduce liver injury in immunosuppressive mice.
3.3. Effects of Lily Polysaccharide on Histopathology of Liver and Spleen in Immunosuppressed Mice
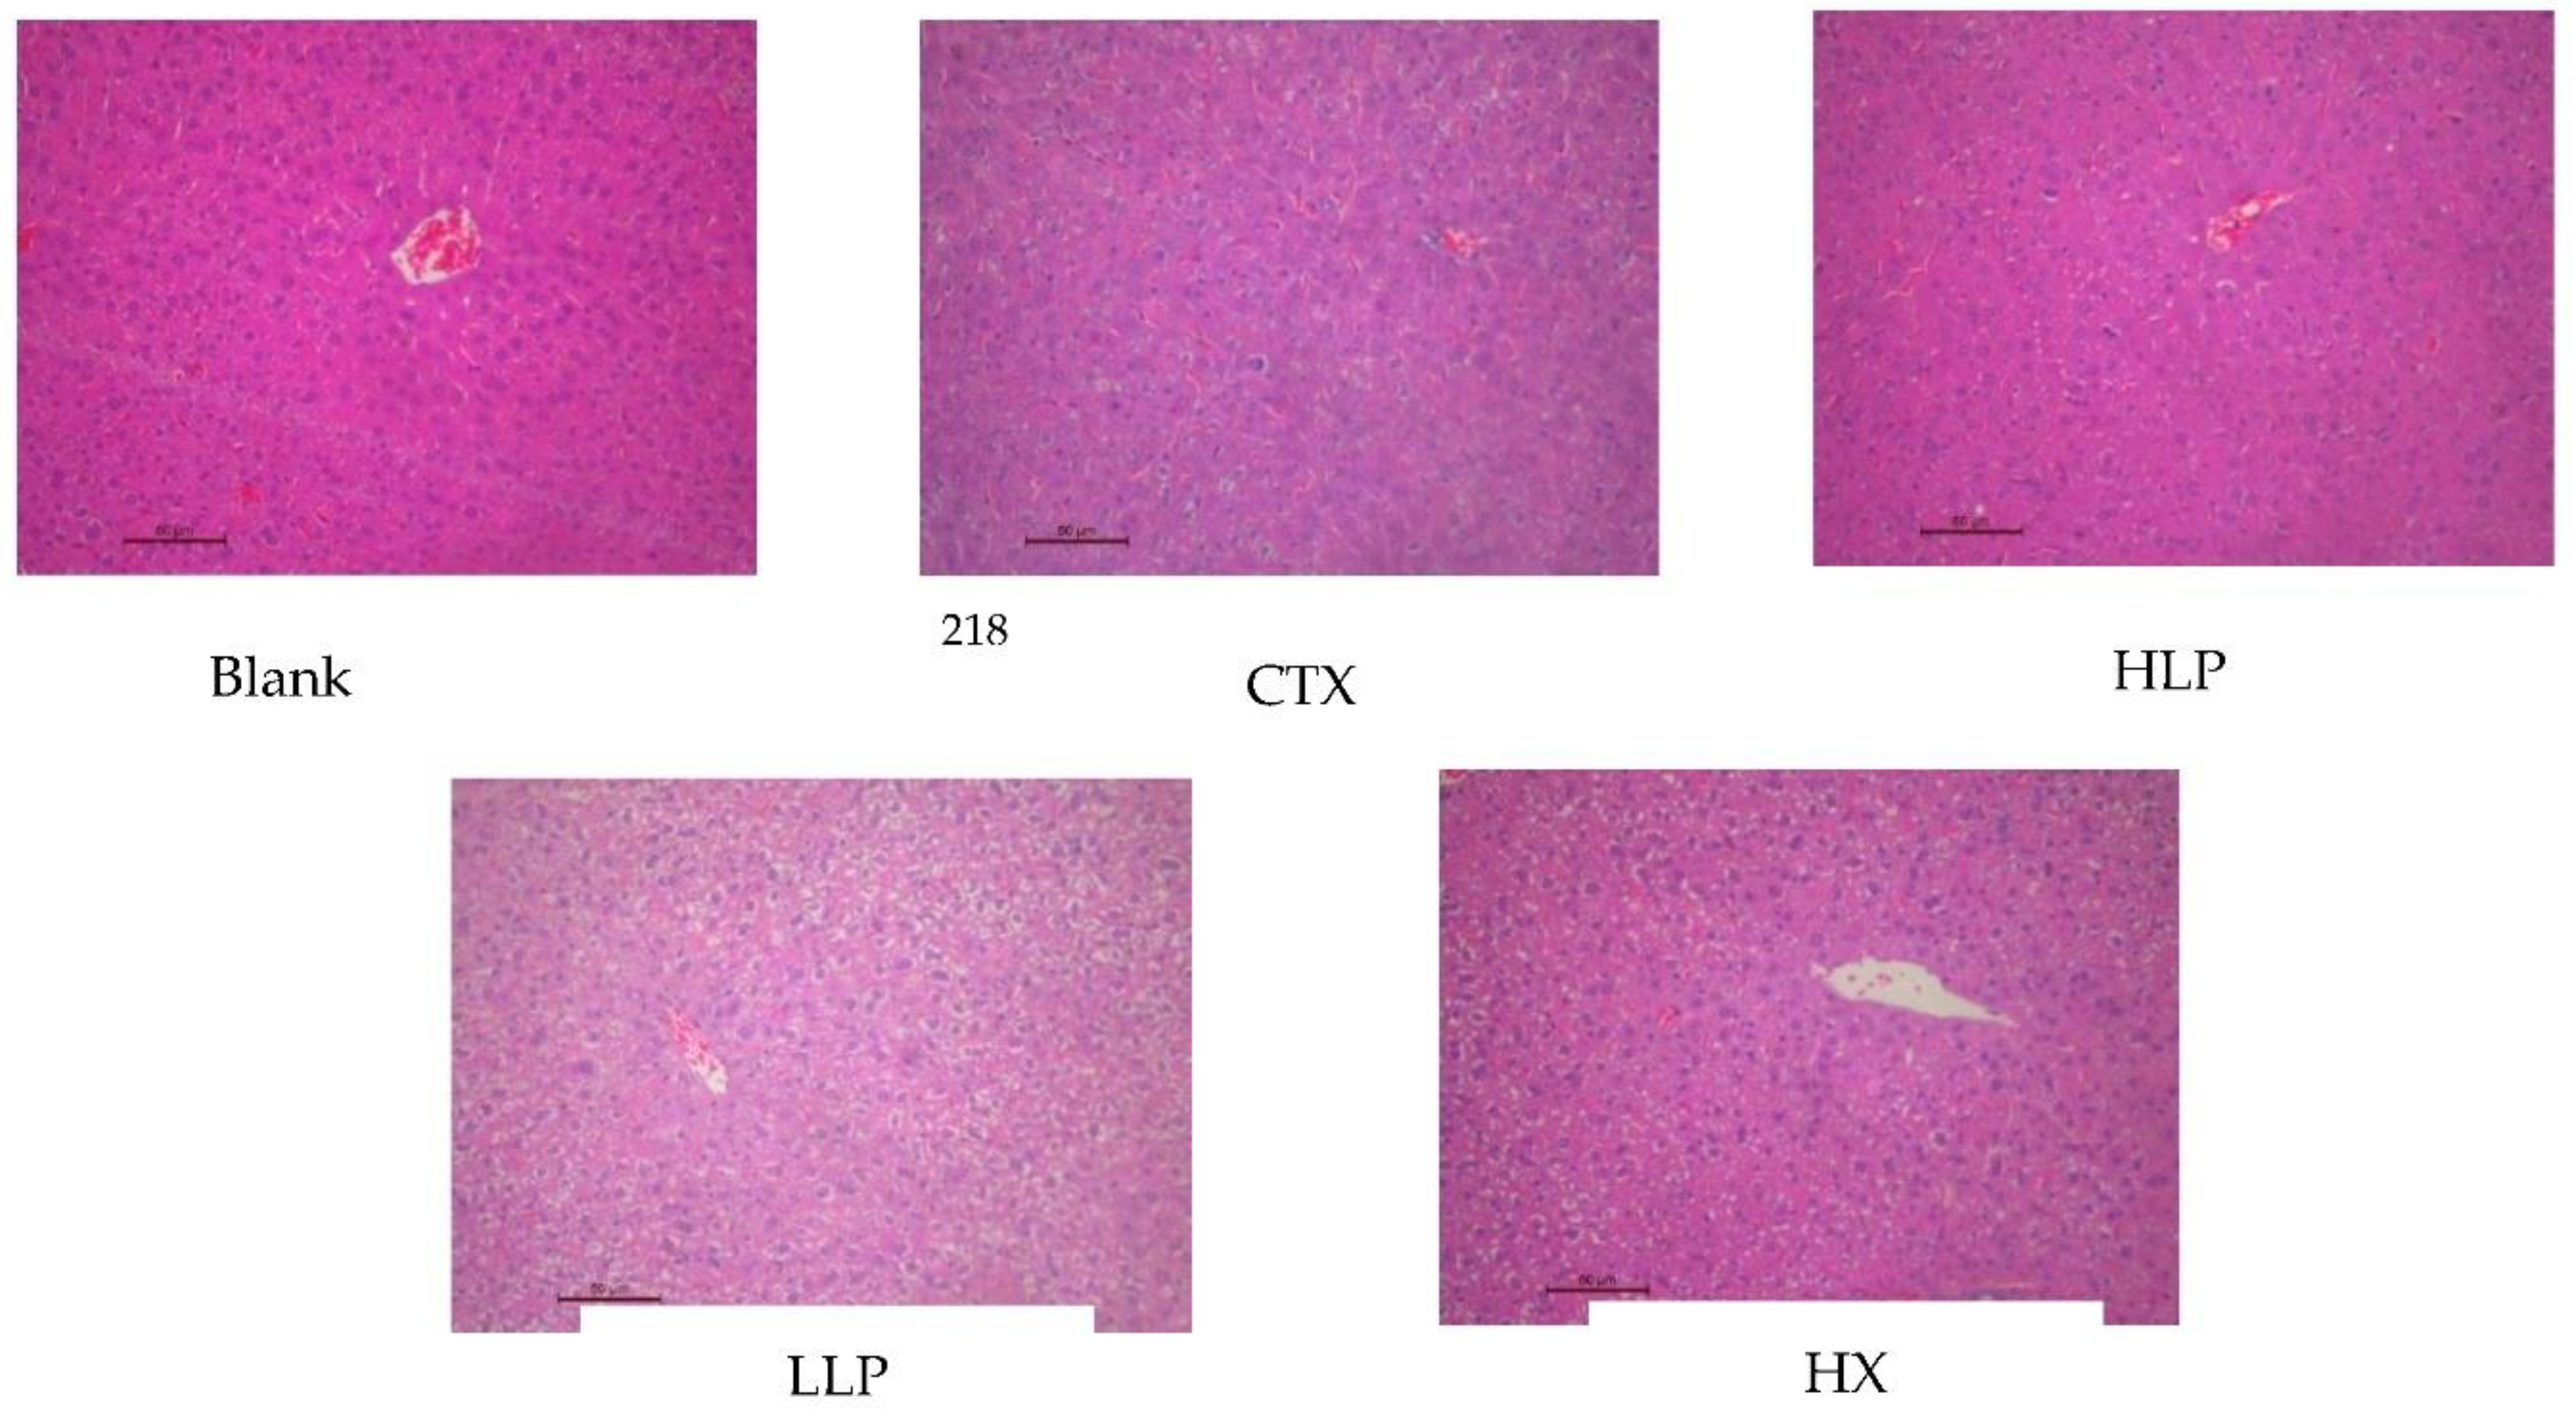
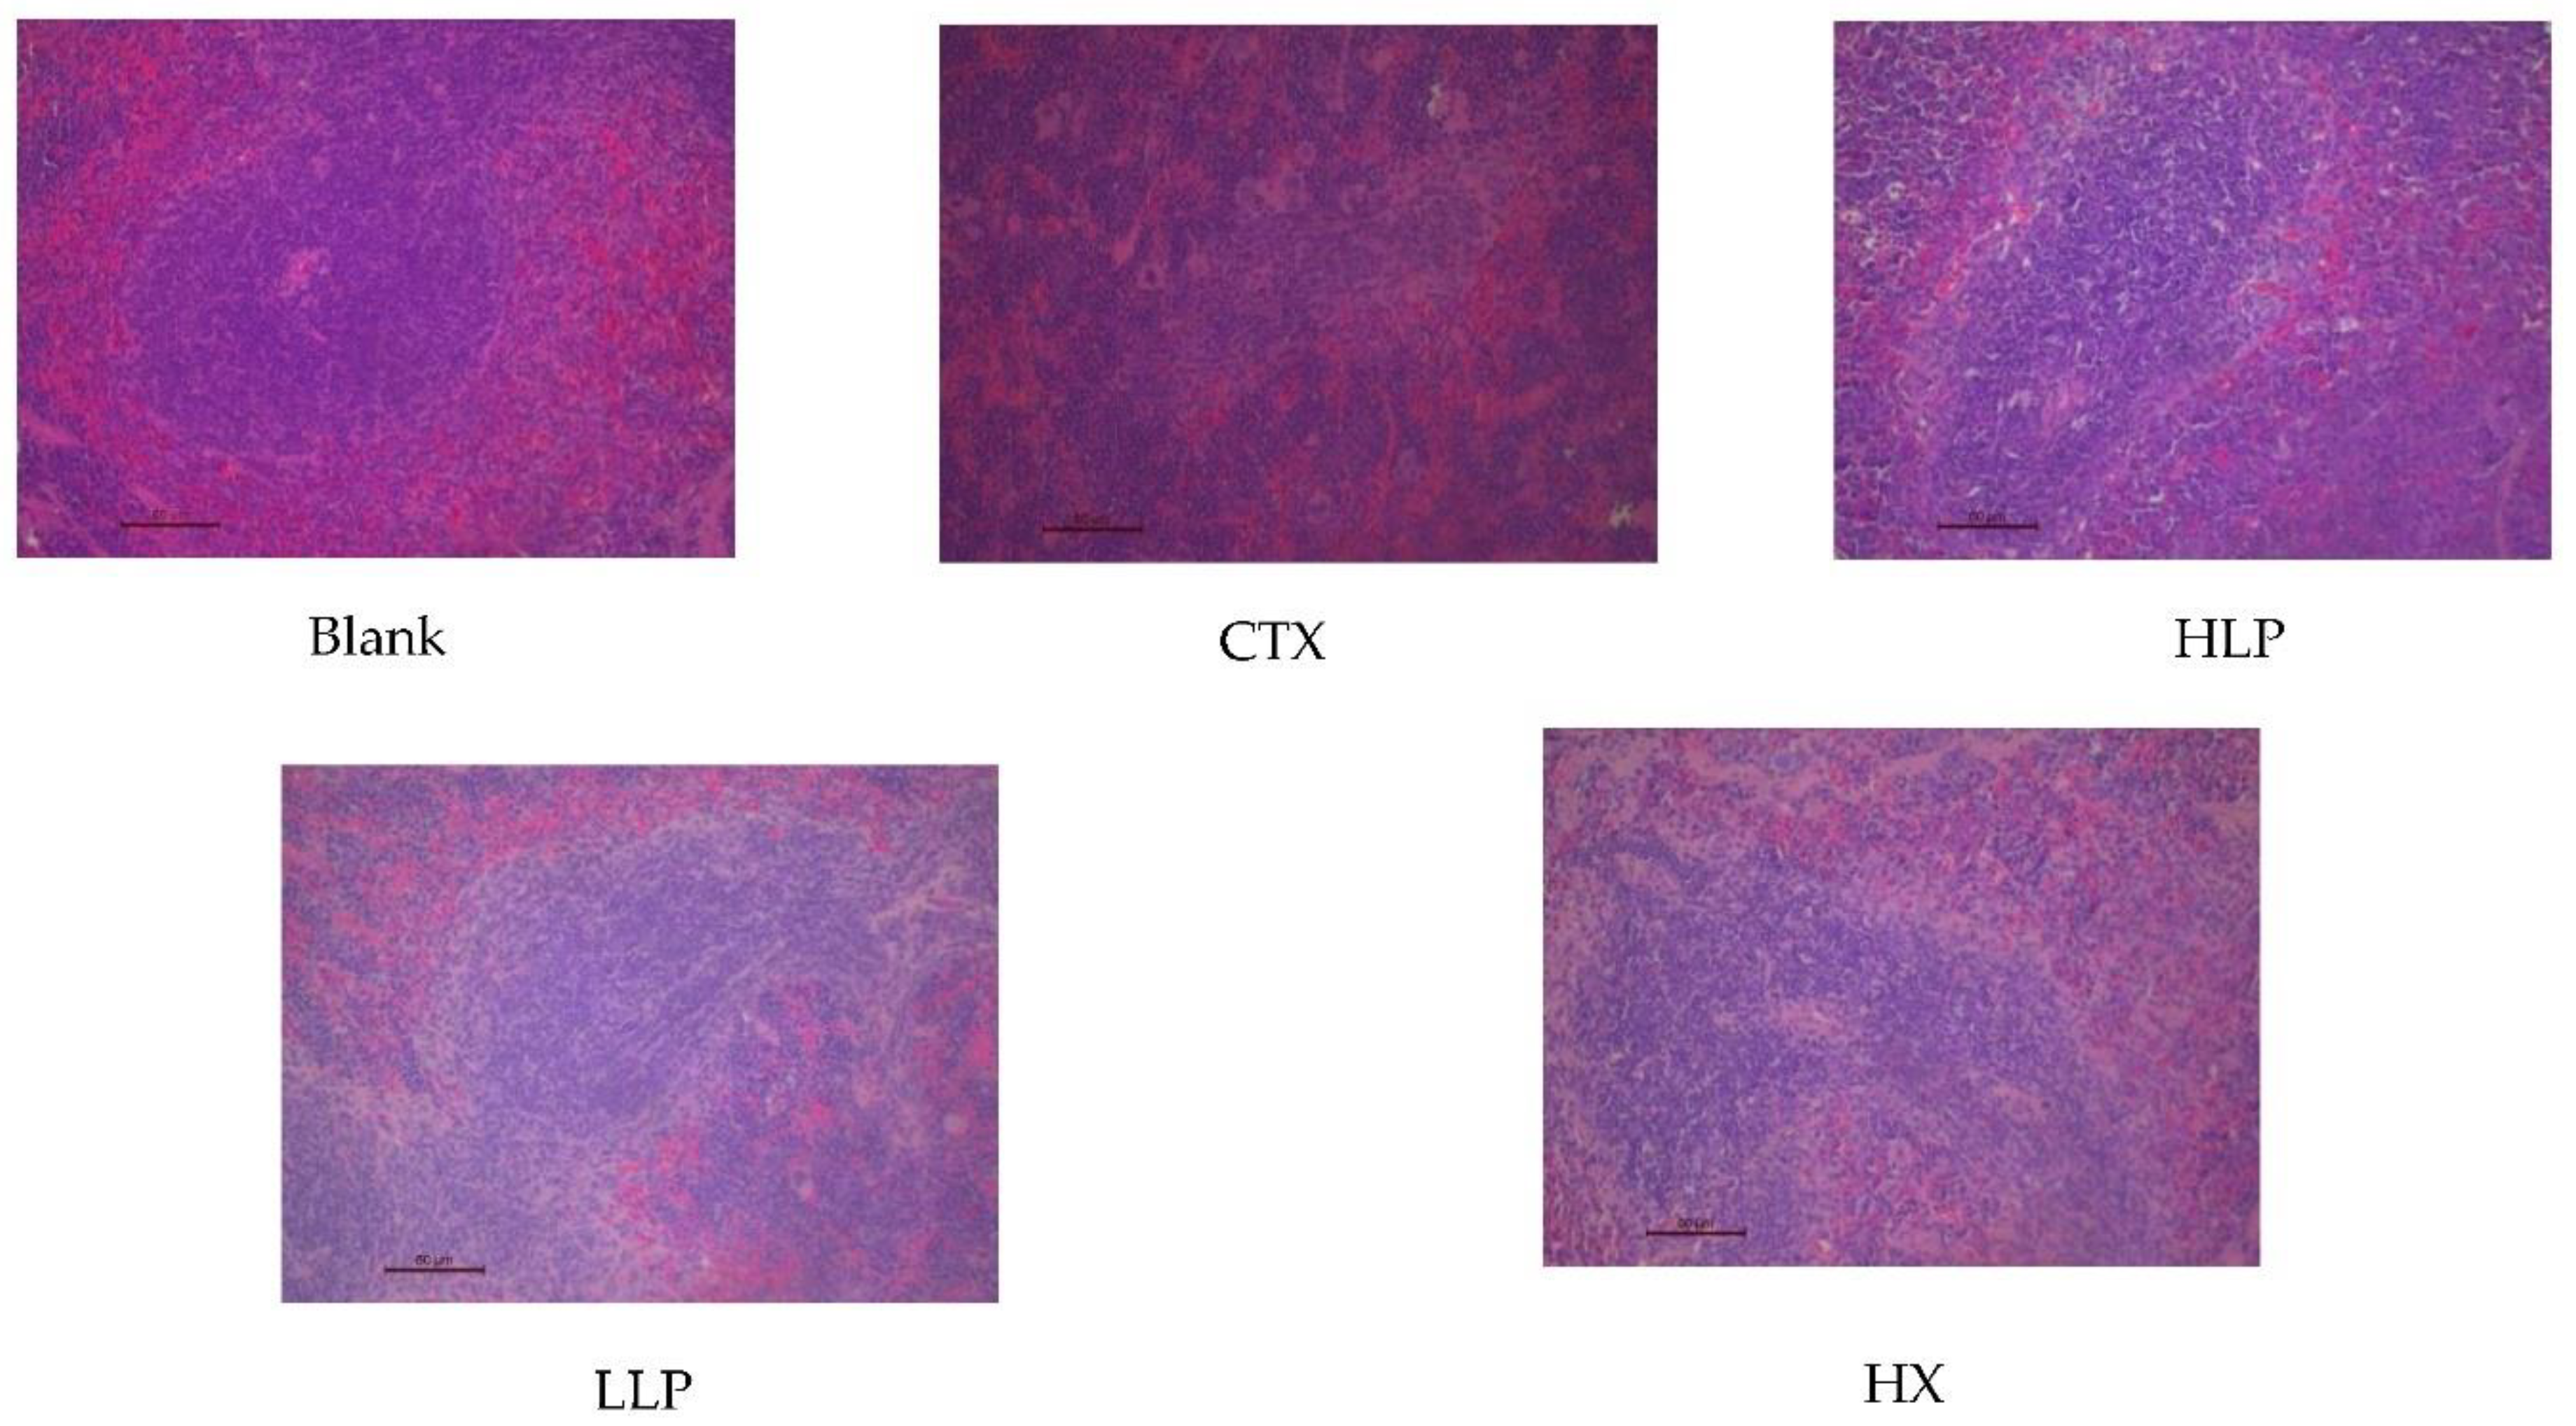
As shown in
Figure 2, the liver of mice in the blank group was intact, with large and round nuclei, and liver plates and hepatic sinuses were neatly arranged. In the model group, liver lesions were observed, including morphological changes of liver cells, destruction of nucleus, disordered arrangement of liver plate and hepatic sinuses, indicating that the immunosuppression model was established successfully and the liver was damaged. After lily polysaccharide and leomisole hydrochloride treatment, the hepatic cell morphology, hepatic plate and hepatic sinus arrangement of mice were alleviated to varying degrees compared with the model group, effectively alleviating the liver injury caused by CTX. As shown in
Figure 3, the red pulp and white pulp of spleen of mice in the blank group had obvious dividing line, and splenosomes were visible. However, the red pulp and white pulp of spleen of mice in the model group were mixed together, and splenosomes were destroyed and disappeared, indicating that the immunosuppressive model was successfully established. These features of red pulp, white pulp and splenic corpusculum were improved and easily observed after mice were given lily polysaccharide and Levamisole hydrochloride intragastric administration. These results suggest that lily polysaccharide LP can improve liver and spleen injury and immune function of ctX-induced immunosuppressed mice.
3.4. Effects of Lily Polysaccharide on Immunoglobulin Content and Hematological Indexes in Serum of Immunosuppressed Mice
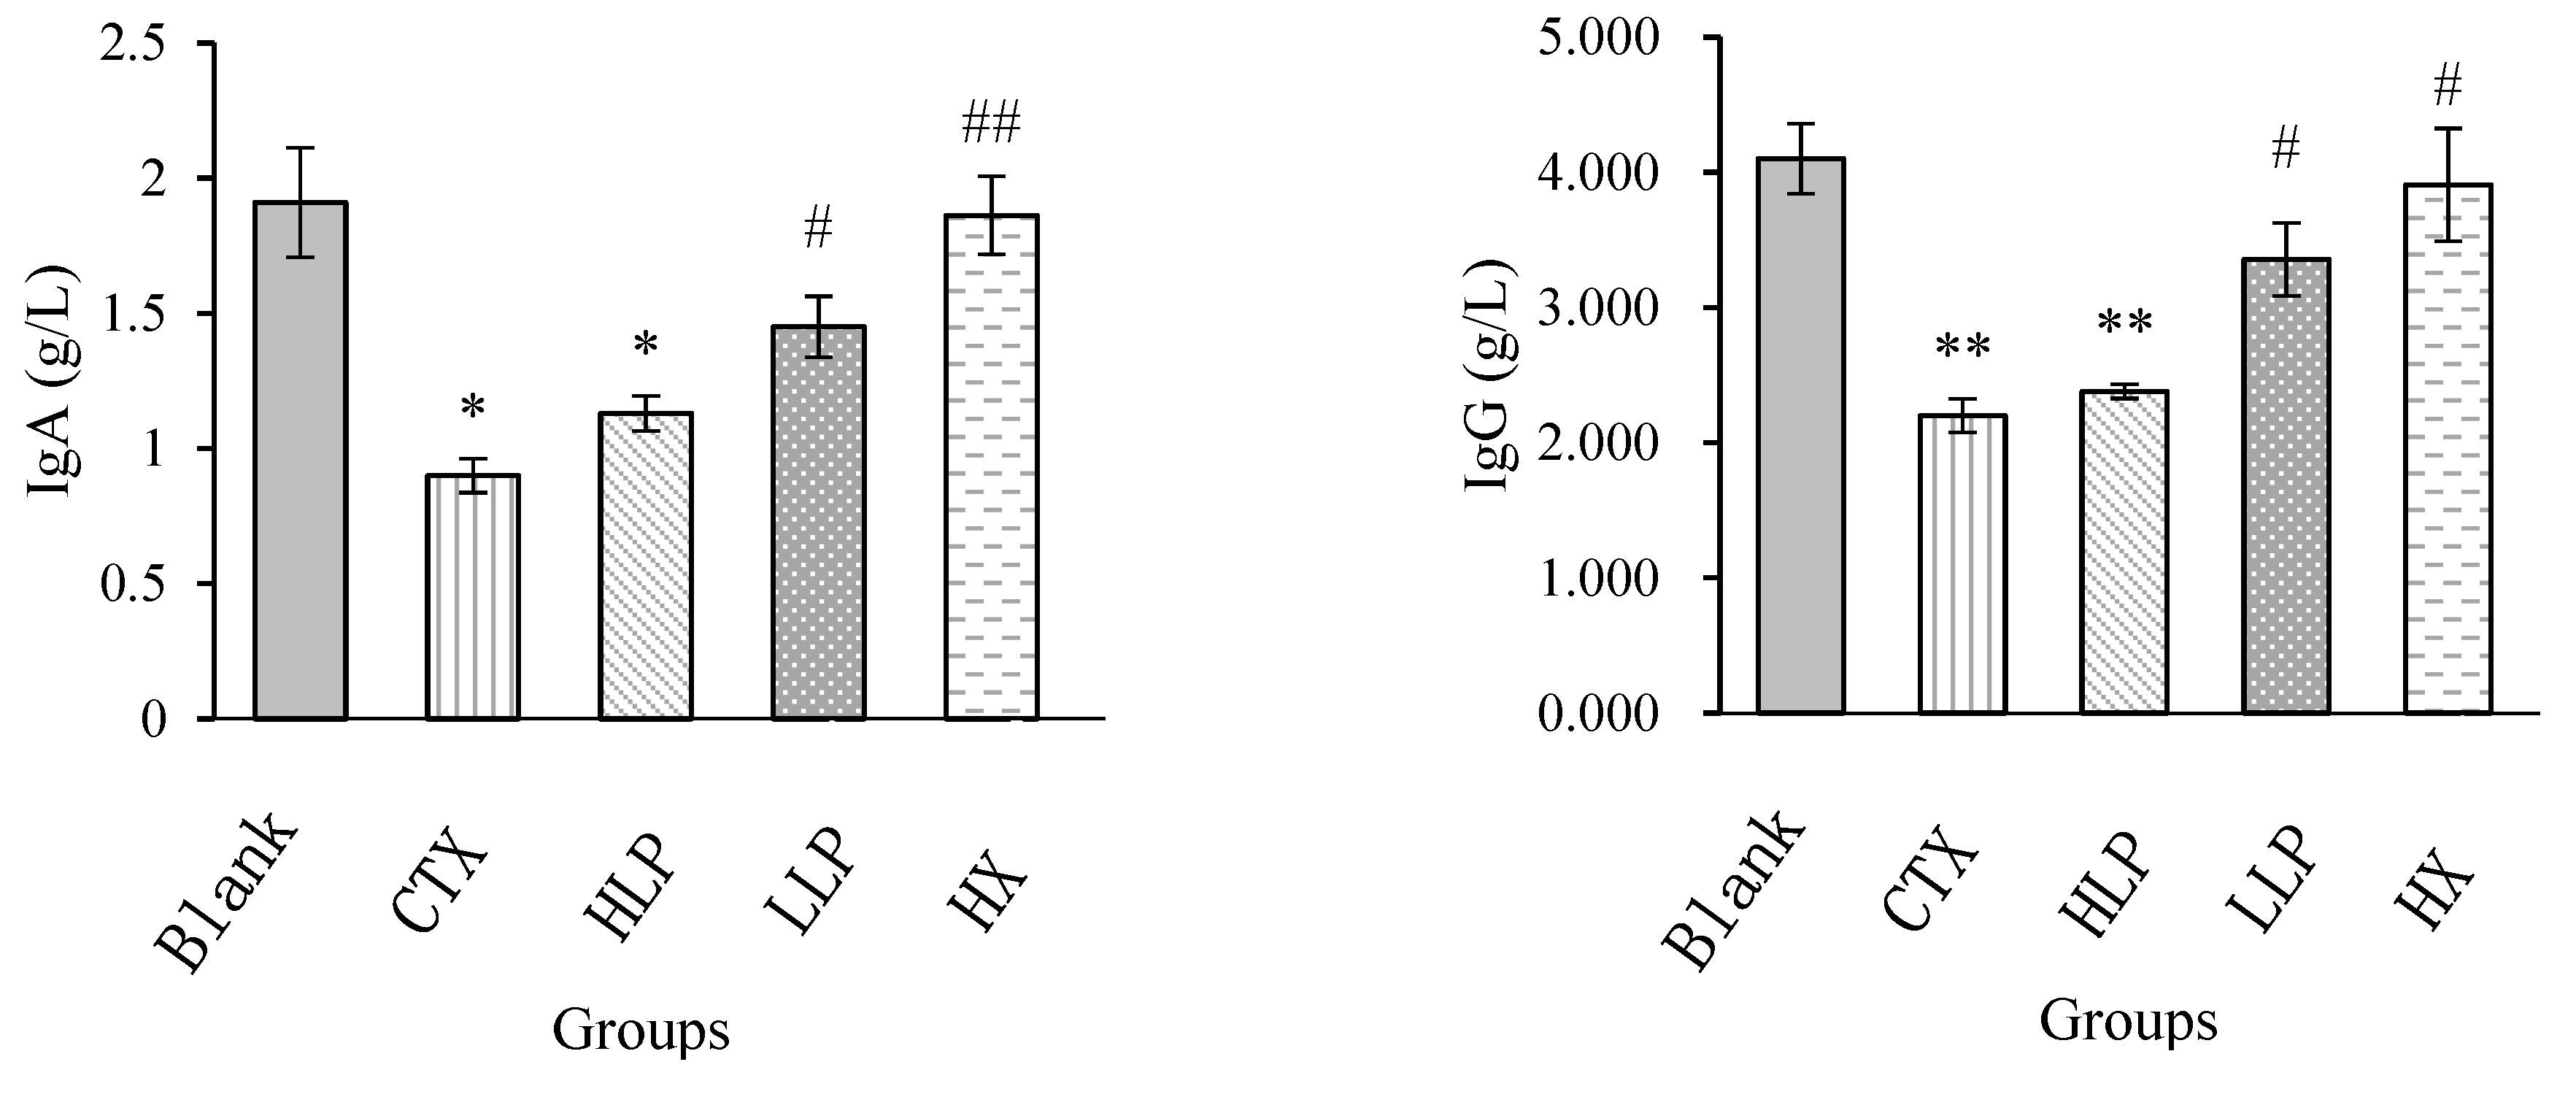
Results of immunoglobulin content of mice in each group were shown in
Figure 4. Compared with model group, IgA and IgG contents in serum of mice in high-concentration LP group and low-concentration LP group and positive control group all increased to a certain extent, but the increase effect of IgA and IgG contents in high-concentration LP group was not significant, while the increase effect of IgA and IgG contents in low-concentration LP group was significant (P <0.05). In conclusion, lily polysaccharide LP can increase the contents of IgA and IgG in serum of mice, thus enhancing the immune capacity of the body.
The test results of Blood Routine Indexes of experimental mice in each group were shown in
Table 5. Compared with the model group, the contents of WBC in leukocytes, RBC in erythrocytes, PLT in platelets and LY in lymphocytes in the high concentration LP group increased significantly (P < 0.05 or P < 0.01), and the percentage of neutrophils NE% increased, but there was no significant difference; In the low concentration LP group, the contents of RBC and PLT in erythrocytes and NE% in neutrophils increased significantly (P < 0.05). There was a certain difference in the contents of WBC in leukocytes and LY in lymphocytes, but there was no significant difference; In the positive control group, the contents of RBC and PLT in erythrocytes increased significantly (P < 0.05 or P < 0.01), but the content of WBC in leukocytes decreased significantly (P < 0.05). The specific reasons need to be further studied.
3.5. Effects of Lily Polysaccharide on Cytokine Content in Colon of Immunosuppressed Mice
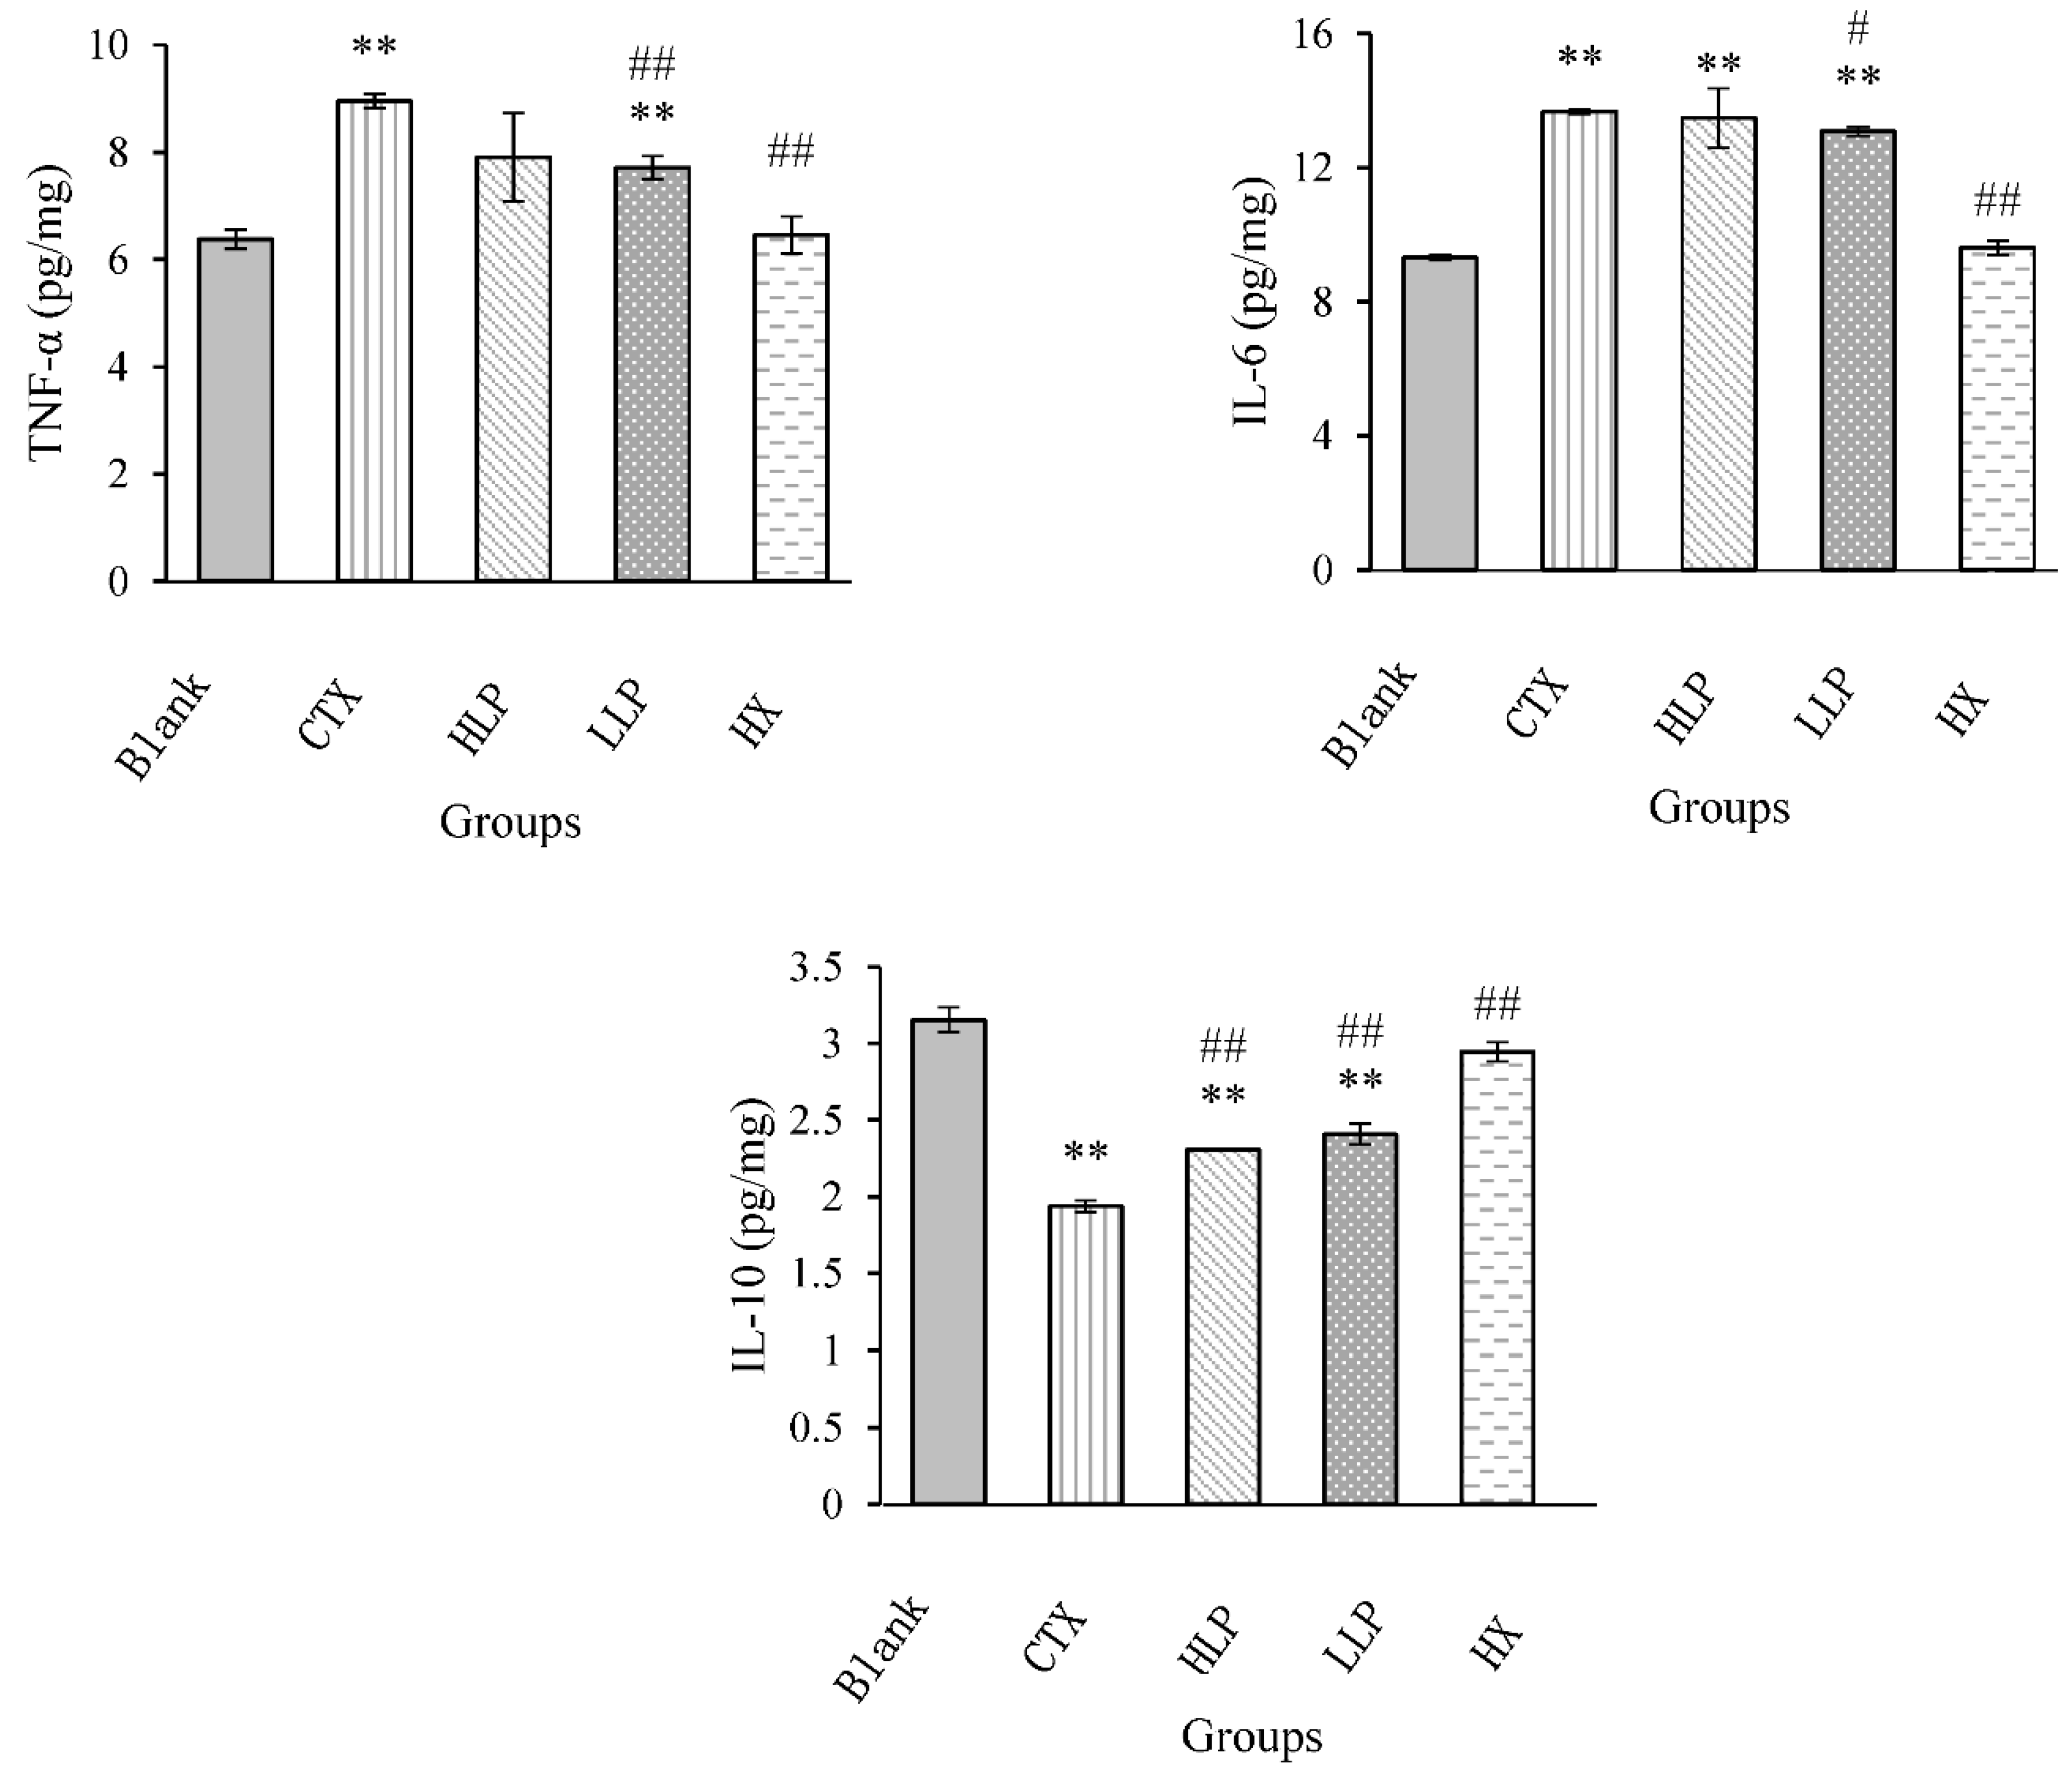
The contents of TNF-α, IL-6 and IL-10 in colon of each group were shown in
Figure 5. Compared with model group, the contents of TNF-α and IL-6 in colon of mice in all drug administration groups were decreased, but the decrease effect of TNF-α and IL-6 in high concentration LP group was not significant, and the decrease effect of TNF-α in low concentration LP group and positive control group was extremely significant (P <0.01). The il-6 content in low concentration LP group was significantly decreased (P <0.05), the IL-6 content in positive control group was extremely significantly decreased (P <0.01), and the IL-10 content in high, low concentration LP group and positive control group was extremely significantly increased (P <0.01). These results indicated that lilium polysaccharide can decrease the content of TNF-α and IL-6 in colon of immunosuppressed mice, and increase the content of IL-10, thus enhancing the body immunity.
3.6. Effects of Lily Polysaccharide on Liver Function and Oxidative Stress Markers in Immunosuppressed Mice
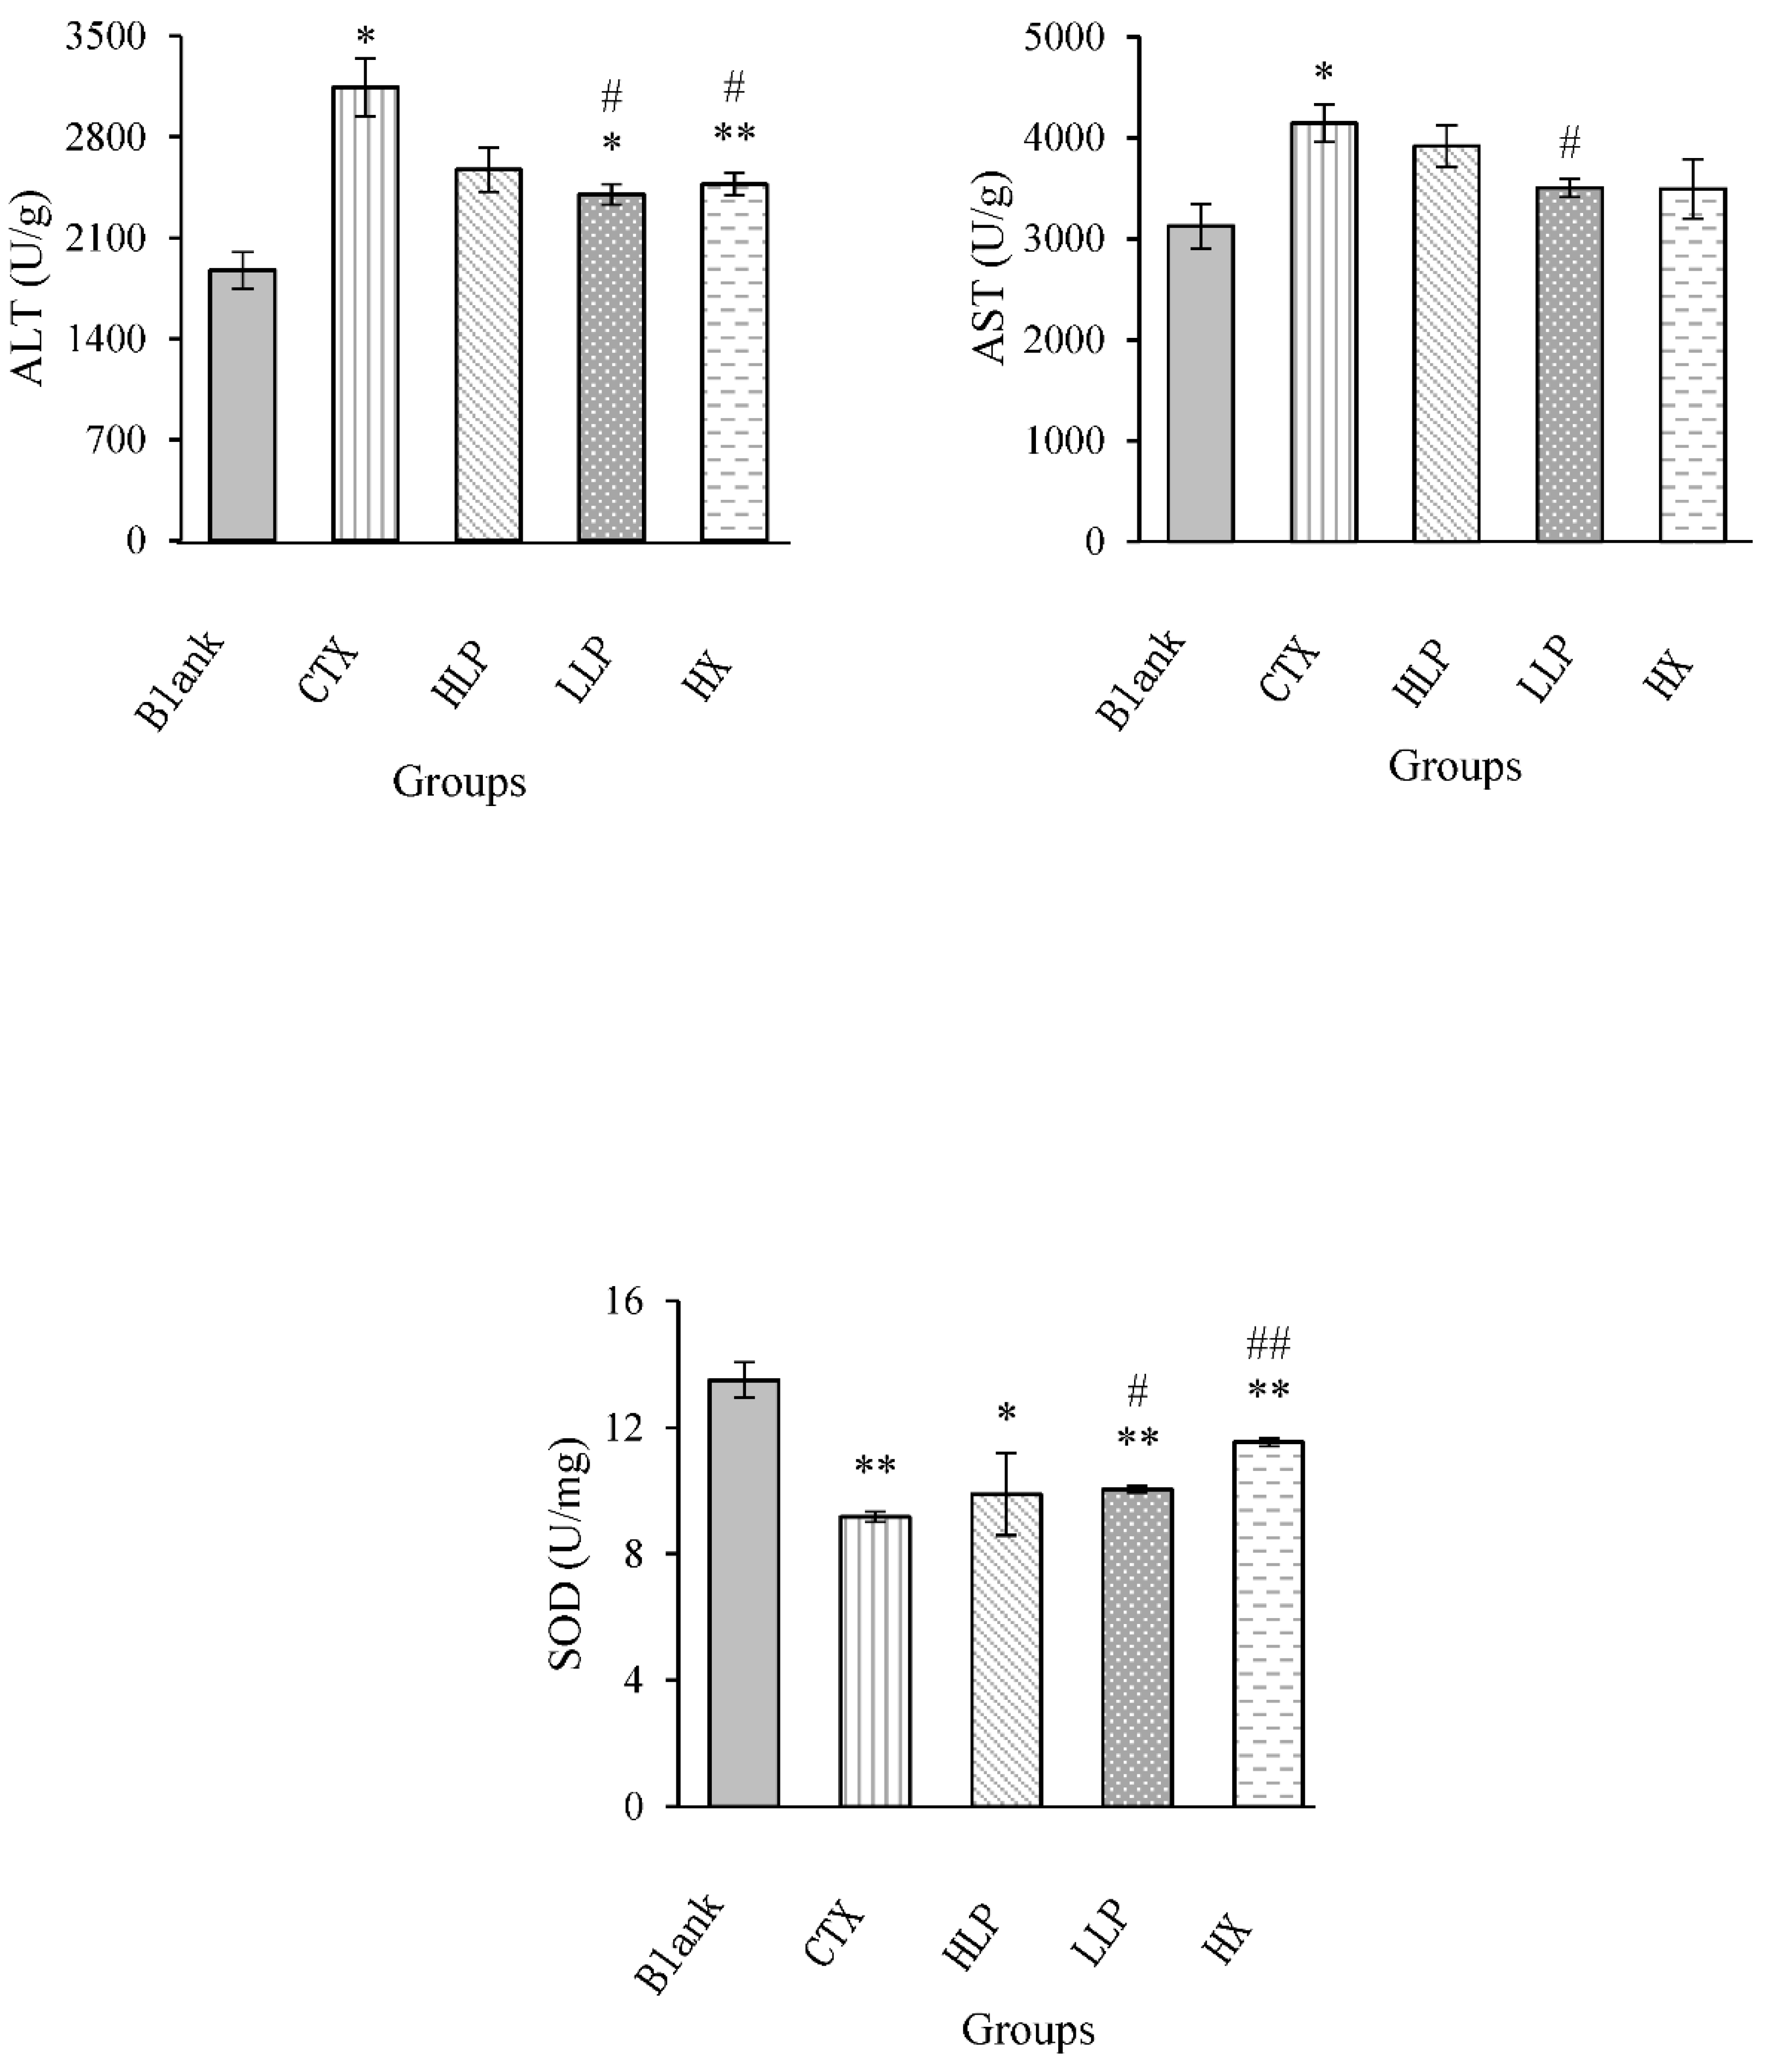
The effects of lily polysaccharide on liver function and oxidative stress markers in immunosuppressed mice were shown in
Figure 6. Compared with model group, AST and ALT contents in low concentration LP group were significantly decreased (P <0.05). These results indicated that lily polysaccharide can reduce liver injury caused by cyclophosphamide CTX in mice, and the effect of LP at low concentration was better than that of LP at high concentration. SOD was essential for defending cells against living free radicals. Compared with blank group, SOD content in liver of model group decreased significantly. Compared with model group, SOD content in liver of low concentration LP group and positive control group increased significantly (P <0.05 or P <0.01), but there was no significant difference in high concentration LP group. MDA can reflect the effect of lipid peroxidation on tissue damage and oxidative stress. Compared with the blank group, MDA content in liver of model group increased significantly (P <0.05). Compared with the model group, MDA content in all drug administration groups decreased, while MDA content in high concentration LP group did not decrease significantly, while MDA content in low concentration LP group decreased significantly (P <0.05). MDA content in positive control group decreased significantly (P <0.01). These results indicated that lily polysaccharide can improve the antioxidant function of the body, and the effect of LP at low concentration was relatively significant.
3.7. Effects of Lily Polysaccharide on Expression of Related Genes in Spleen of Immunosuppressed Mice
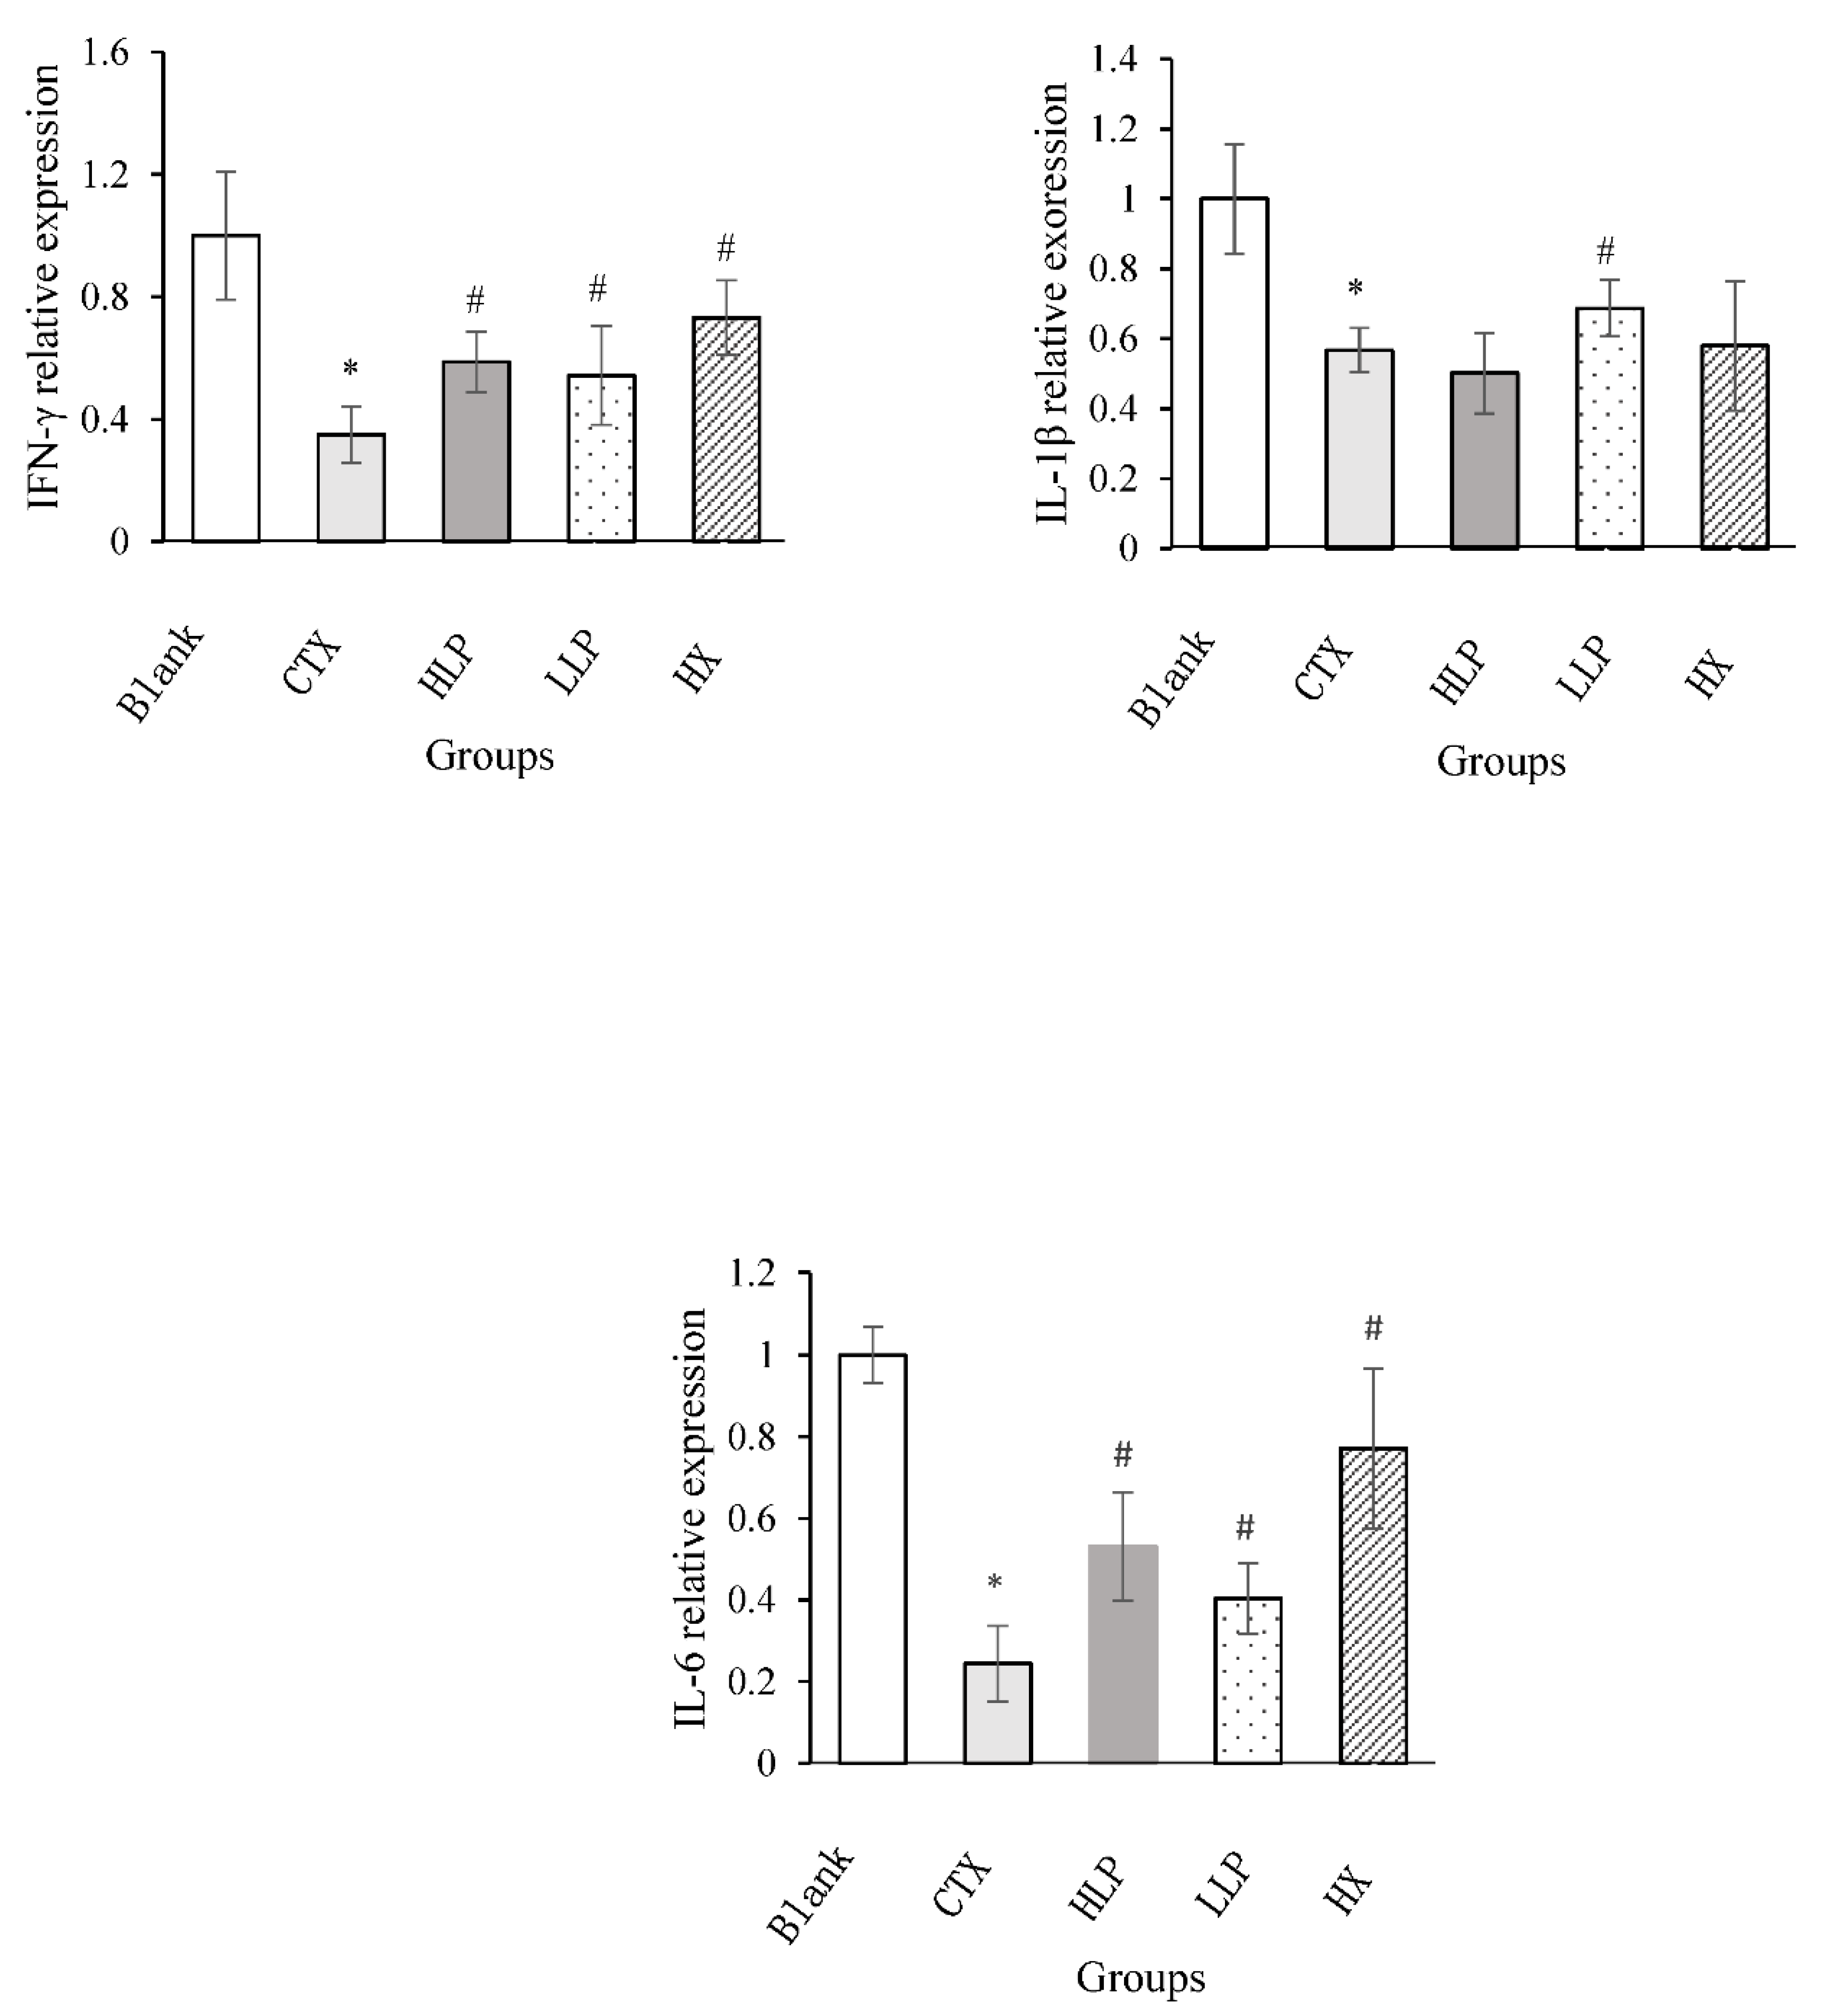
The effects of lily polysaccharide on the relative expression levels of IFN-γ, IL-1β and IL-6 genes in spleen of immunosuppressed mice were studied by real-time fluorescence quantitative polymerase chain reaction (Q-PCR). As shown in
Figure 7, the relative expression levels of IFN-γ, IL-1β and IL-6 genes in spleen of model group were significantly decreased compared with blank group (P <0.05). Compared with model group, lilium polysaccharide and Levamisole hydrochloride treatment significantly increased the relative expression levels of IFN-γ and IL-6 genes in spleen of mice (P <0.05), especially the expression level of IL-1β in spleen of mice in low concentration LP group was higher than that in positive control group.
3.8. Intestinal Flora of Immunosuppressed Mice
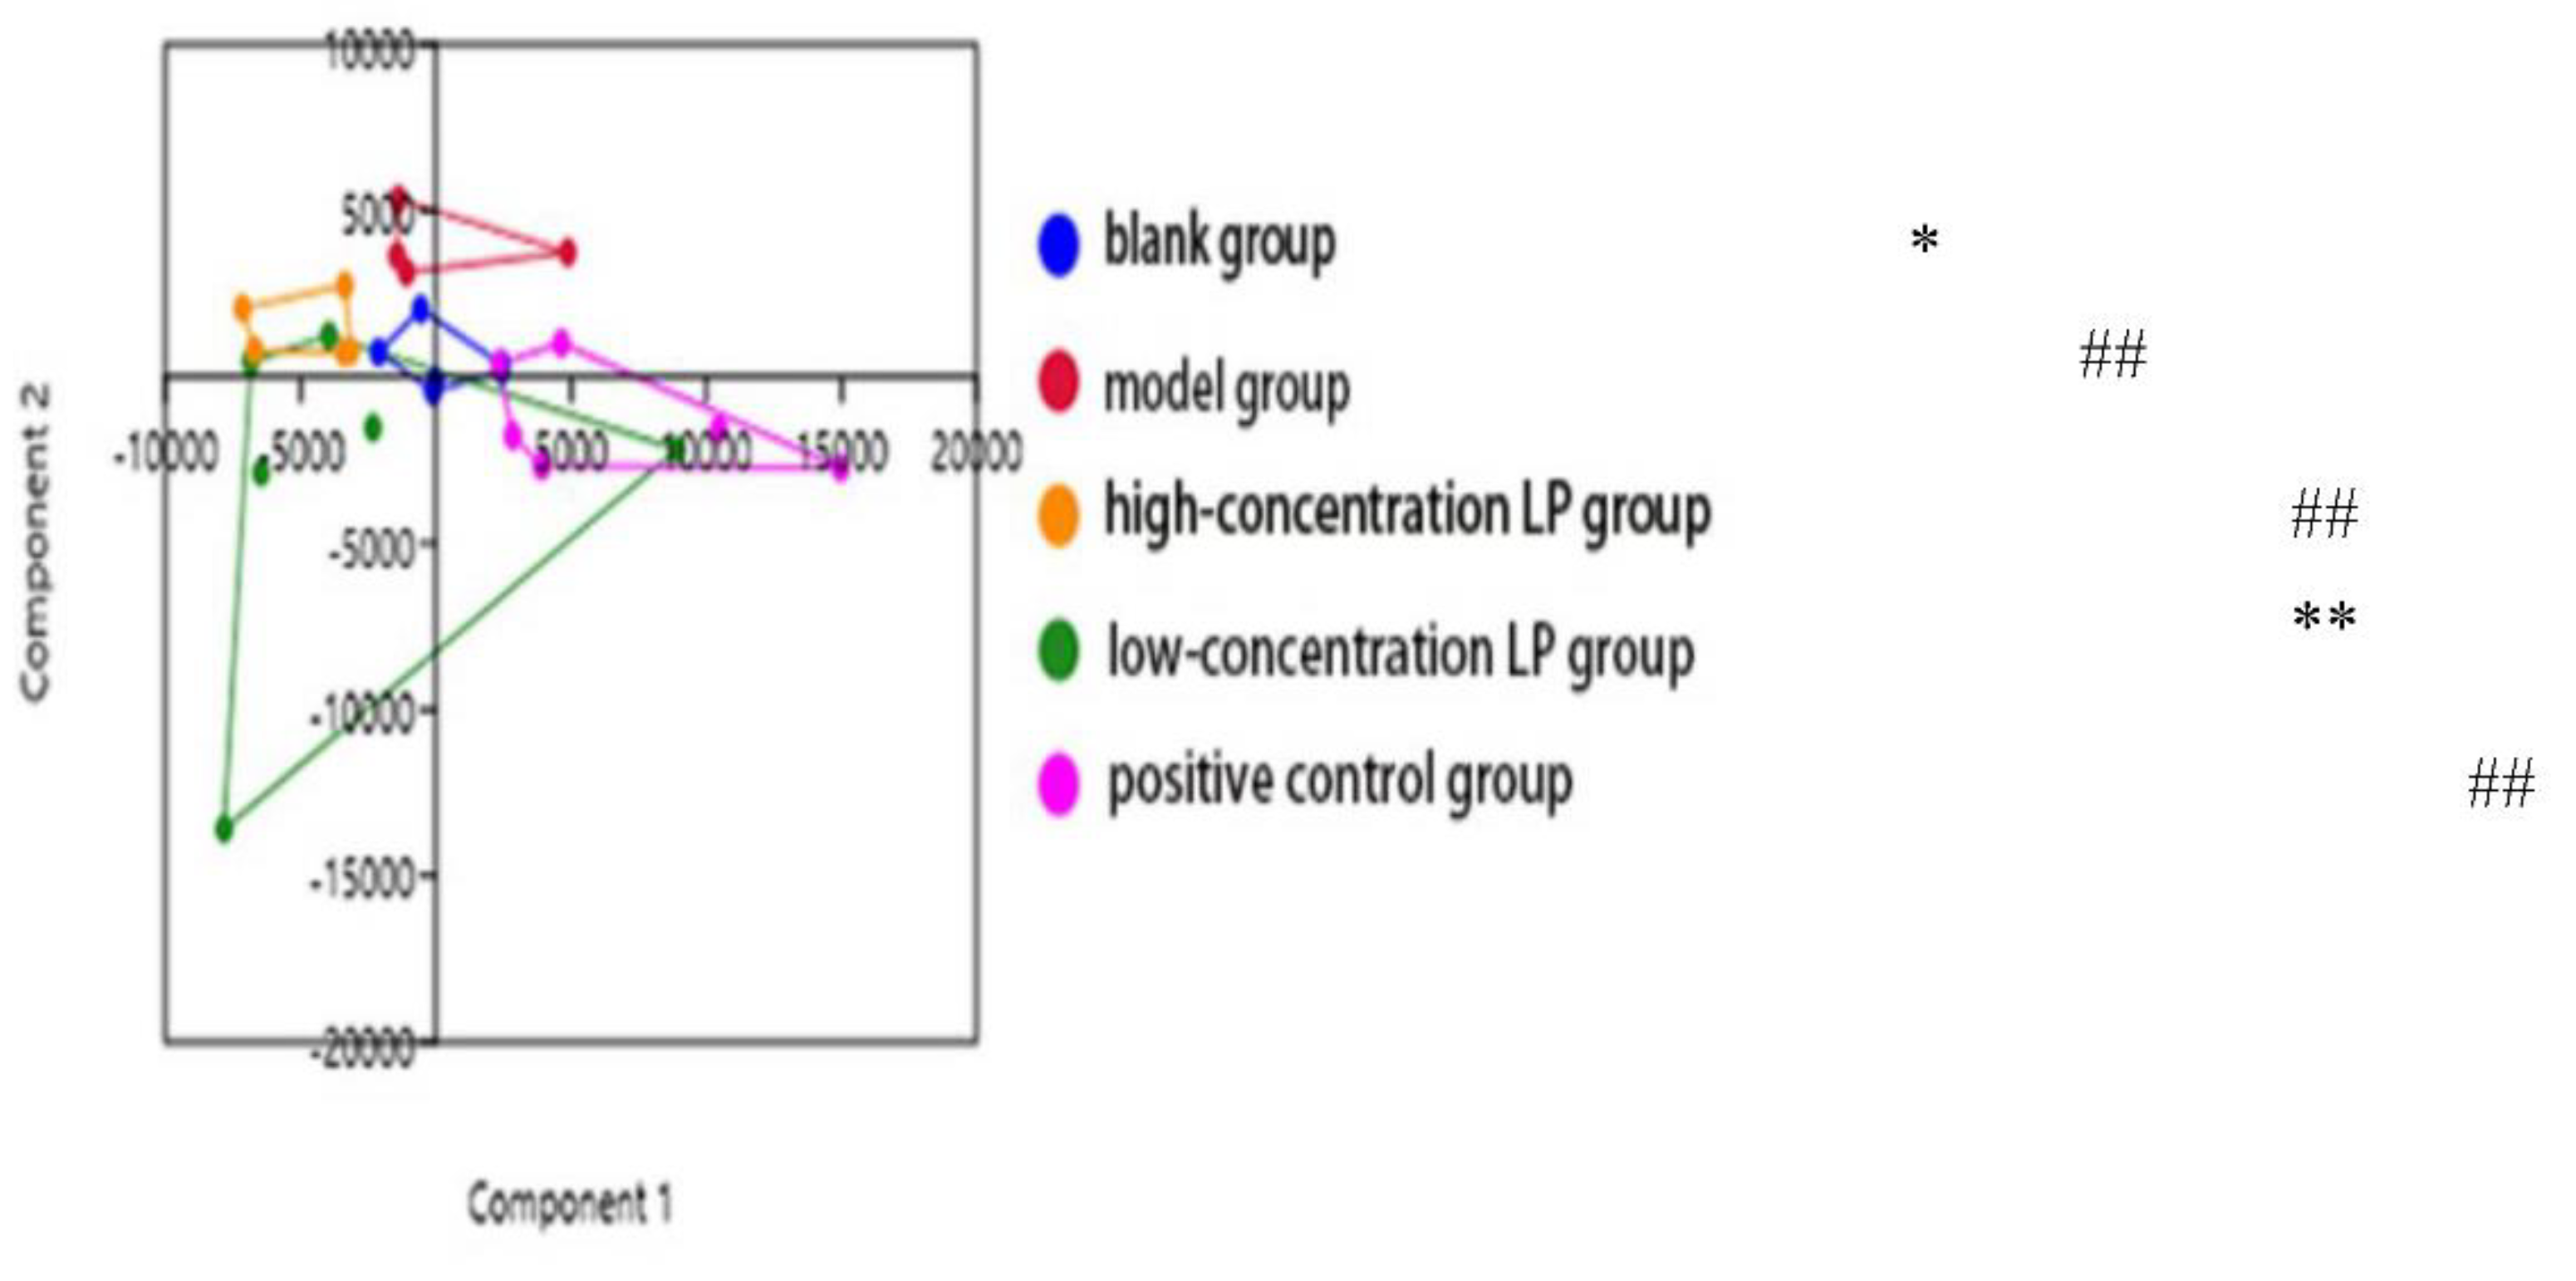
Nonmetric multidimensional scale analysis (NMDS) was used to analyze the intergroup differences of intestinal microflora in each group. The NMDS diagram showed the two-dimensional distribution of intestinal microflora in each group, the inter-group differences represented by β diversity.As shown in
Figure 8, the two-dimensional plane distribution distance between the model group and the blank group, the high-concentration LP group, the low-concentration LP group and the positive control group was far away, indicating that the intestinal flora of immunosuppressed mice induced by cyclophosphamide CTX was significantly different from that of normal mice and mice in each administration group. There was a large area of intersection between the low-concentration LP group and the positive control group, and a small area of intersection between the low-concentration LP group and the high-concentration LP group and the blank group, indicating that there was no significant difference between the low-concentration LP group and the positive control group, and the positions of these groups were relatively close, indicating that, Lilium polysaccharide can significantly affect the intestinal flora structure of cyclophosphamide CTX-induced immunosuppressed mice, and migrate to the intestinal flora structure of blank mice, and improve the intestinal flora of immunosuppressed mice on the whole level.
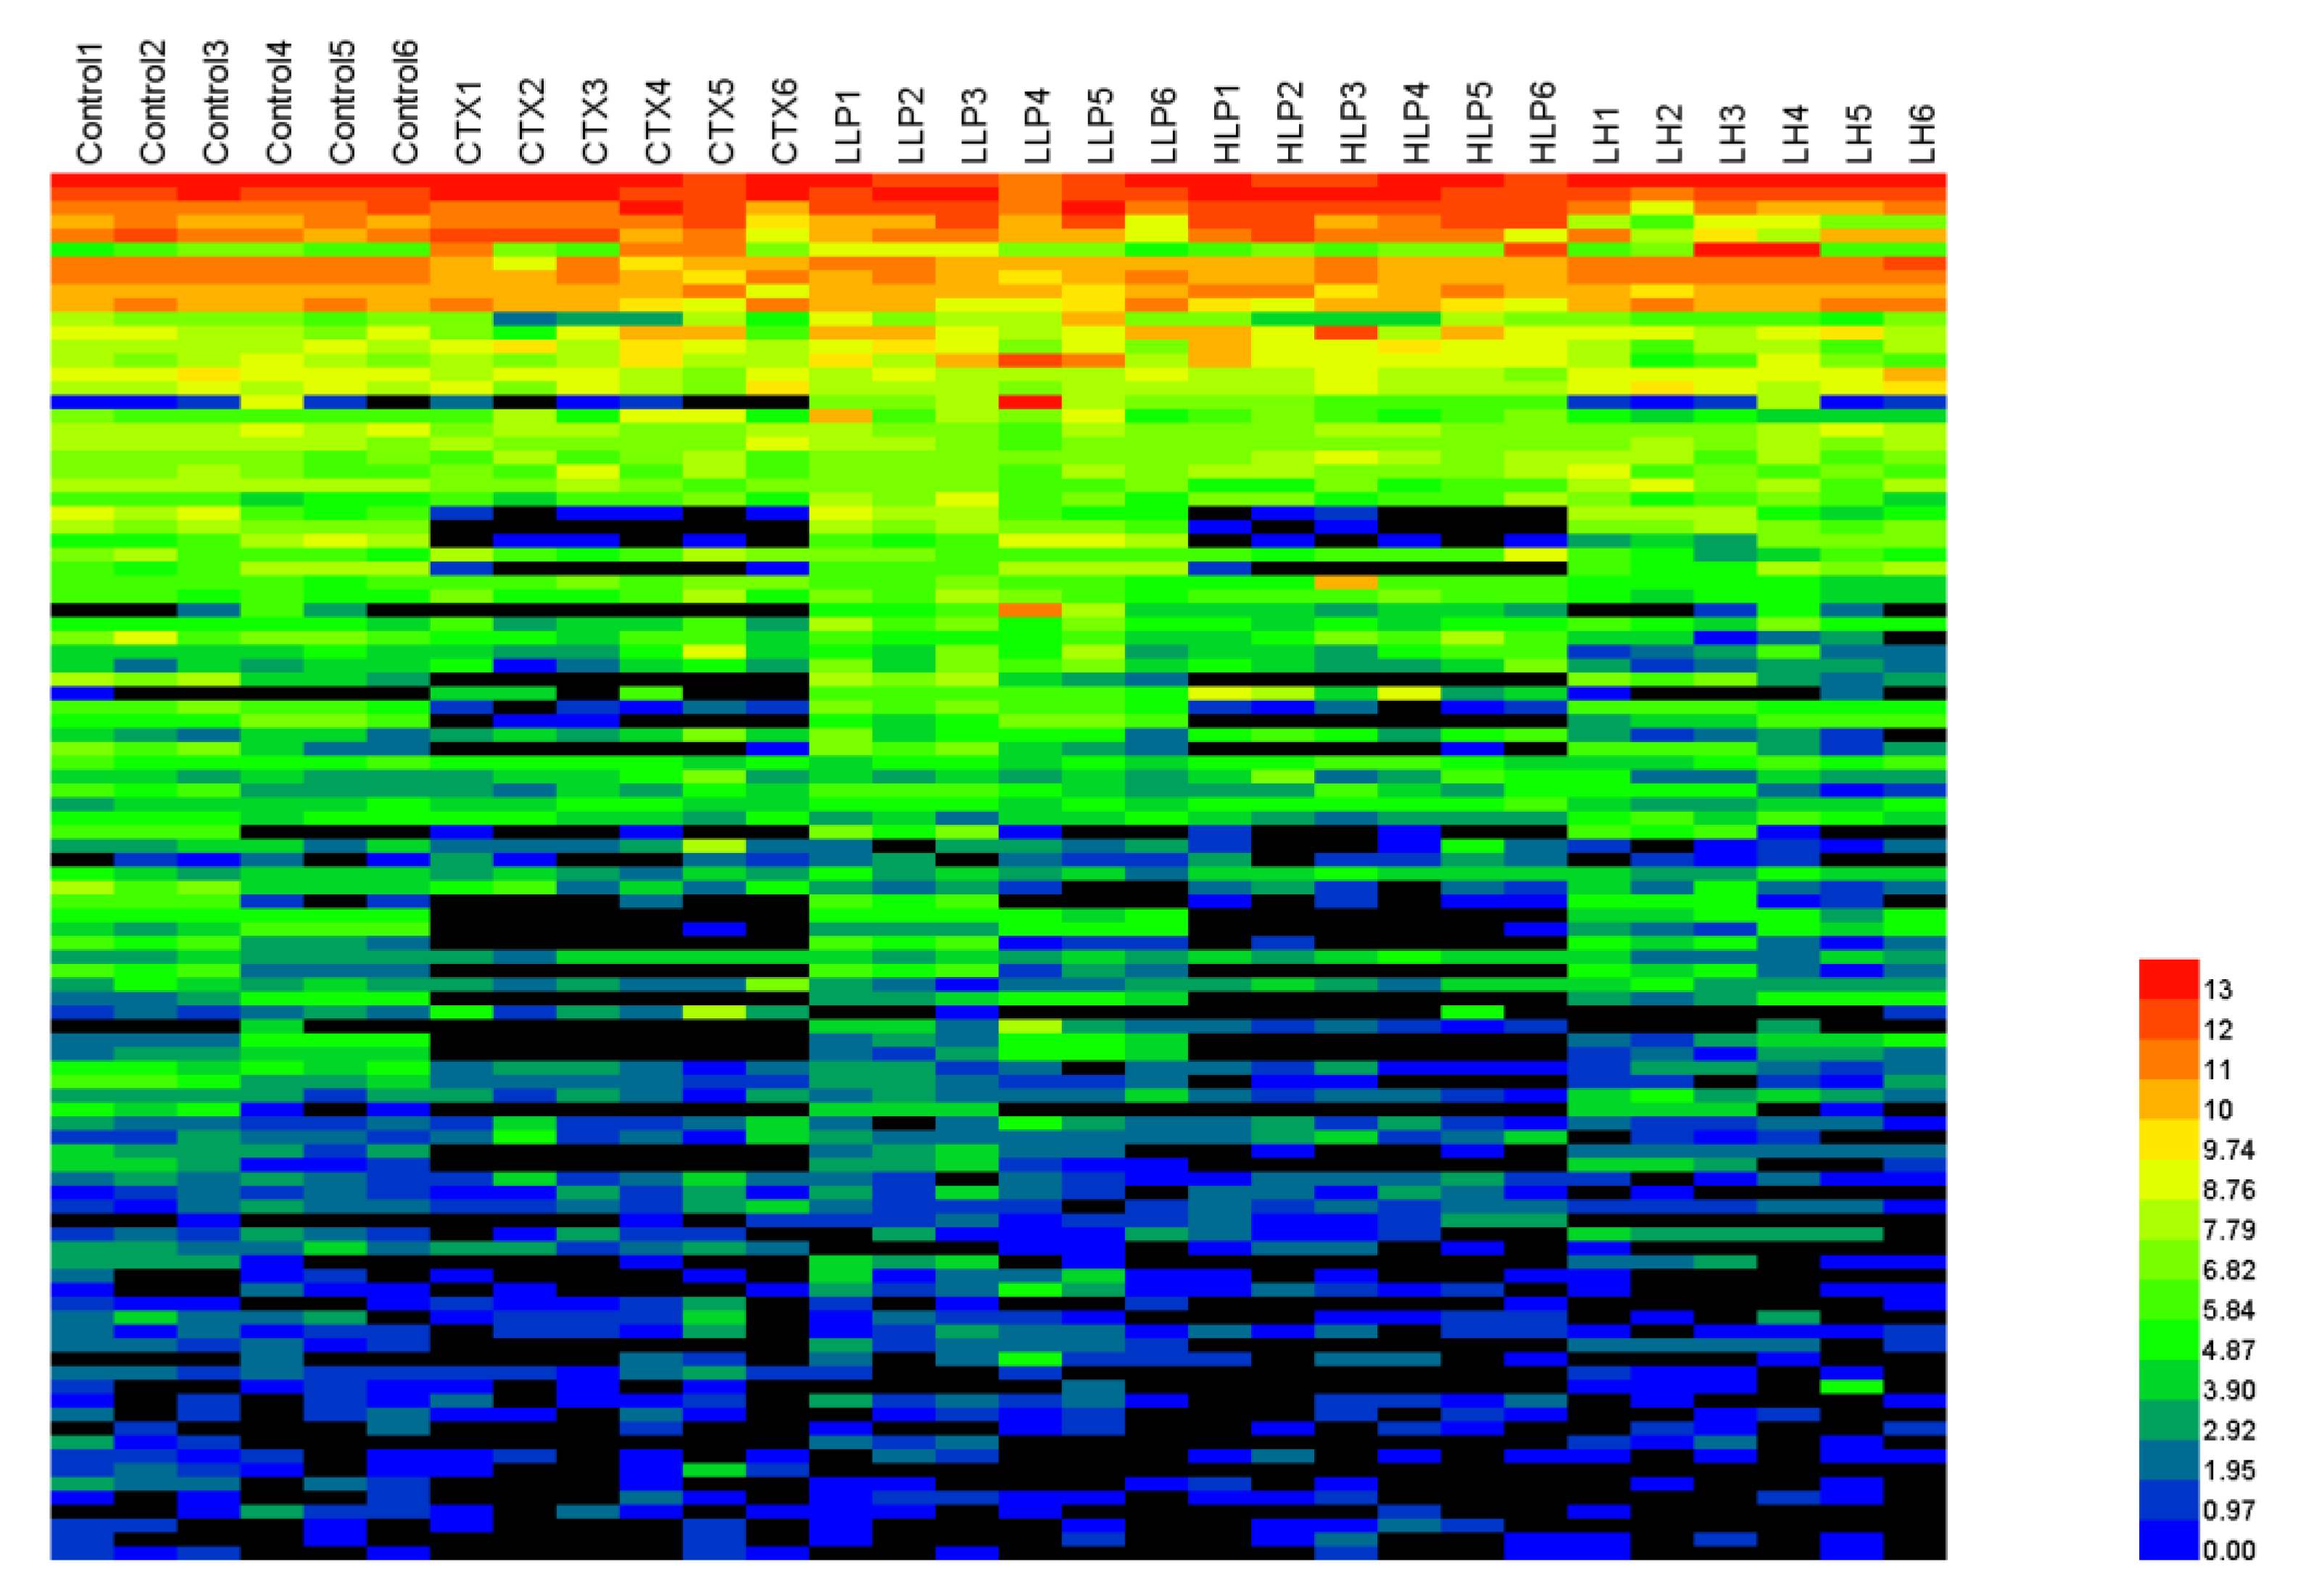
Heat map was used to analyze the intestinal flora of immunosuppressed mice, and the results were shown in
Figure 9. The colors of the heat map varied from dark blue to light blue to green to yellow to red to indicate that the OTUs quantity of the strain changed from small to large. Comparative dominance of gut microbiota at different classification levels is necessary to determine overall differences and similarities between groups. The results showed that the samples were mainly divided into six phyla: Bacteroidetes, Proteobacteria, Firmicutes, actinobacteria, deferrobacteriae and verrucomicrophyla, mainly bacteroidetes and firmicutes. Compared with the blank group, the intestinal flora of model group was significantly different, but lilium polysaccharide could restore most of the changed flora to a certain extent. Compared with blank group, the values of S24-7, Bacteroides and Butyricimonas in Bacteroides significantly decreased, while Prevotella significantly increased in model group. In Firmicutes, Ruminococcaceae, Eubacterium and Dehalobacterium significantly decreased, while Dorea significantly increased. Enterobacteriaceae, Mucispirillum and Akkermansia in Proteobacteria were significantly reduced. Adlercreutzia was significantly increased in actinomycetes. Lilium polysaccharide and levamisole hydrochloride significantly restored the number of probiotics. These results indicate that lilium polysaccharide can increase the number of beneficial bacteria and reduce the number of harmful bacteria in immunosuppressed mice, and greatly improve the intestinal flora structure of mice.
4. Conclusions
In conclusion, our results indicate that lily polysaccharide was isolated by ultrasonic assisted hot water extraction could significantly improve the above immune indexes, which indicated LP could alleviate immunosuppression induced by CTX. The study provided a theoretical basis for the development and application of LP as a novel functional food material. These results suggested that LP could potentially be used as a natural immunomodulator and as an alternative treatment to reduce chemotherapy-induced immunosuppression.
Author Contributions
R-JW conceived the project, contributed to experimental design; H-JQ, H-JM and Z-M performed experiments, interpreted the results, prepared the figures and wrote the manuscript; X-WT and H-XY conceived and supervised the project, interpreted the results; all authors discussed the results and approved the manuscript.
Funding
This research was funded by National Key Research and Development Program of China (Grant No. 2023YFD2201802); Forestry Science and Technology Promotion Project (Grant No. Jing [2023] TG 03).
Data Availability Statement
We encourage all authors of articles published in MDPI journals to share their research data. In this section, please provide details regarding where data supporting reported results can be found, including links to publicly archived datasets analyzed or generated during the study. Where no new data were created, or where data is unavailable due to privacy or ethical restrictions, a statement is still required. Suggested Data Availability Statements are available in section “MDPI Research Data Policies” at
https://www.mdpi.com/ethics.
Conflicts of Interest
The authors declare that they have no competing interests.
References
- Gao J, Zhang T, Jin Z Y, Xu X M, Wang J H, Zha X Q, Chen H Q. Structural characterisation, physicochemical properties and antioxidant activity of polysaccharide from Lilium lancifolium Thunb[J]. Food Chemistry, 2015, 169: 430-438.
- Hu Y, Du Y P, Zhang M,Zhang X H, Ren J W. Analysis and evaluation of main nutrients and active components in 12 Lilium species[J]. Natural Product Research and Development, 2019, 31(2): 292-298.
- Luo J, Li L, Kong L. Preparative separation of phenylpropenoid glycerides from the bulbs of Lilium lancifolium by high-speed counter-current chromatography and evaluation of their antioxidant activities[J]. Food Chemistry, 2012, 131(3):1056-1062.
- Sun X, Gao R L, Xiong Y K, Huang Q C, Xu M. Antitumor and immunomodulatory effects of a water-soluble polysaccharide from Lilii Bulbus in mice[J]. Carbohydrate Polymers, 2014, 102: 543-549.
- Wang F, Wang W, Niu X, Huang Y, Zhang J. Isolation and Structural Characterization of a Second Polysaccharide from Bulbs of Lanzhou Lily[J]. Applied Biochemistry and Biotechnology. 2018, 186(3): 535-546.
- Mirzadeh M, Arianejad M R, Khedmat L. Antioxidant, antiradical, and antimicrobial activities of polysaccharides obtained by microwave-assisted extraction method: A review[J]. Carbohydrate Polymers. 2020, 229: 115421.
- Zhang T, Gao J, Jin Z Y, Xu X M, Chen H Q. Protective effects of polysaccharides from Lilium lancifolium on streptozotocin-induced diabetic mice[J]. International Journal of Biological Macromolecules, 2014, 65: 436-440.
- Ahlmann M, & Hempel G. The effect of cyclophosphamide on the immune system: implications for clinical cancer therapy. Cancer Chemotherapy and Pharmacology, 2016, 78(4): 661-671.
- Yu Q, Nie S P, Wang J Q, Huang D F, Li W J, Xie M Y. Molecular mechanism underlying chemoprotective effects of Ganoderma atrum polysaccharide in cyclophosphamide-induced immunosuppressed mice[J]. Journal of Functional Foods, 2015, 15: 52-60.
- Yang J, Liu K X, Qu J M, Wang X D. The changes induced by cyclophosphamide in intestinal barrier and microflora in mice[J]. European Journal of Pharmacology, 2013, 714(1-3): 120-124.
- Tang C, Ding R, Sun J, Liu J, Kan J, Jin C. Impacts of natural polysaccharides on the intestinal microbiota and immune responses-A review[J]. Food & Function. 2019, 10(5): 2290-2312.
- Sun Y, Liu Y, Ai C, Song S, Chen X. Caulerpa lentillifera polysaccharides enhance the immunostimulatory activity in immunosuppressed mice in correlation with modulating gut microbiota[J]. Food & Function, 2019, 10(7): 4315-4329.
- Ying M, Yu Q, Zheng B, Wang H, Wang J, Chen S, Nie S, Xie M. Cultured Cordyceps sinensis polysaccharides modulate intestinal mucosal immunity and gut microbiota in cyclophosphamide-treated mice[J]. Carbohydrate Polymers. 2020, 235: 115957.
- Million M, Tomas J, Wagner C, Lelouard H, Raoult D, Gorvel J P. New insights in gut microbiota and mucosal immunity of the small intestine[J]. Human Microbiome Journal, 2018, 7: 23-32.
- Mi M, Ren L J, Mei Q B, Li F, Wang D N, Liu S G. Effects of Lilium polysaccharide on immune function in mice[J]. Journal of the Fourth Military Medical University, 2007, 28(22): 2034-2036.
- Miao M S, Yang L S. Immune excitatory effect of Lily polysaccharide[J]. Chinese Medicine Pharmacology and Clinic, 2003, 19(1): 15-16.
- Kumar V P, Venkatesh Y P. Alleviation of cyclophosphamide-induced immunosuppression in Wistar rats by onion lectin (Allium cepa agglutinin) [J]. Journal of Ethnopharmacology, 2016: 280-288.
- Shi H F, Ying J Y, Huang X J,Nie S P, Xie M Y. Effects of probiotic fermentation on immune function of water-soluble carrot polysaccharide in mice[J]. Journal of Nanchang University (Science Edition), 2019, 43(1): 53-58+64.
|
Disclaimer/Publisher’s Note: The statements, opinions and data contained in all publications are solely those of the individual author(s) and contributor(s) and not of MDPI and/or the editor(s). MDPI and/or the editor(s) disclaim responsibility for any injury to people or property resulting from any ideas, methods, instructions or products referred to in the content. |
© 2024 by the authors. Licensee MDPI, Basel, Switzerland. This article is an open access article distributed under the terms and conditions of the Creative Commons Attribution (CC BY) license (http://creativecommons.org/licenses/by/4.0/).
