Preprint
Article

The Effect of Indium Tin Oxide Nanoparticles (ITO NPs) Incorporated with ZnO NPs based on Structural, Optical and Flexible Dye Sensitized Solar Cells (FDSSCs) Application

Altmetrics

Downloads

86

Views

37

Comments

0

A peer-reviewed article of this preprint also exists.

Submitted:

25 May 2024

Posted:

27 May 2024

You are already at the latest version

Alerts
Abstract
This study aimed to investigate the impact of incorporating indium tin oxide (ITO) nan particles (NPs) with zinc oxide (ZnO) NPs into flexible dye-sensitized solar cells (FDSSCs). ZnO and ITO NPs were separately prepared using the sol-gel method, followed by hybridization of ZnO NP/ITO NP and characterization using techniques such as TEM, SEM, XRD, UV-Vis spectros-copy, PL spectroscopy and cyclic voltammetry (CV). TEM analysis showed hexagonal struc-tures and small sphere-like nanoparticles with mean diameters of 15.22 ± 11 nm for ZnO NPs and 14.54 ± 16 nm for ZnO NPs/ITO NPs. SEM images revealed uniform dispersion and smooth surface morphology, while XRD confirmed the crystalline nature of both ZnO and hybrid NPs, indicating specific crystallographic planes with consistent sizes. UV-Vis spectroscopy demonstrated a redshift in wavelength upon adding ITO NPs, suggesting an impact on the bandgap of ZnO NPs. PL spectra exhibited a broad visible emission peak at 535 nm. These findings enhance our understanding of the optical behavior and interaction between ITO and ZnO NPs in hybrid nanostructures. The study concluded that the ITO NPs improve FDSSC performance by enhancing charge separation and transport, leading to increased photocurrent production, with the characterization techniques providing valuable insights for future research and applications.
Keywords: 
Subject: Chemistry and Materials Science  -   Materials Science and Technology

1. Introduction

Flexible dye sensitized solar cells (FDSSCs) are a potentially more economical, clean, efficient, easy-to-fabricate, and environmentally friendly photovoltaic (PV) technology than traditional silicon-based ones [1,2]. It may also be used as flexible window or wall devices in building-integrated photovoltaic systems [3]. The majority of FDSSCs are composed of dye and semiconductor oxides. Numerous semiconductor oxides, including SnO2, TiO2, ZnO, and Nb2O5, have been used as an electron transport medium. Because of its special qualities, which include low cost, non-toxicity, and ease of synthesis, ZnO has proven to be an effective substitute for FDSSCs. Globally, nanotechnology is becoming more and more popular, finding utilizations in food, feed, pharmaceuticals, and personal hygiene products. [4] Nanoparticles are produced in comparatively high quantities using conventional procedures. [5] Due to their distinct characteristics, such particles have generated a lot of curiosity [6]. Nanoscale semiconductor materials [7] have novel properties because the quantum size effect or enormous surface area modifies their physical and chemical characteristics [8,9]. Of all the metal oxide nanomaterials currently accessible [9], zinc oxide Nanoparticles (ZnO NPs) [10] is an important material for research in a variety of applications. ZnO NPs hexagonal wurtzite structure [10] has garnered prominence as a luminescent material due to its structural [11], optical [12,13], thermal [13], electrical, and luminescence capabilities that can be used to make useful devices [14]. As nanomaterials’ shape, size, and distribution-dependent capabilities, structure [13,15], or morphology [10,13] management, ZnO NPs have long been a priority in nano research [16]. ZnO NPs are useful because it is non-toxic to the environment [17] and can withstand radiation. The features of ZnO NPs materials are known to be affected by the production method, growth conditions, and post-growth treatments [18]. To prepare the ZnO nanostructure [19], lots of methodologies have been adopted. Epitaxy, pulsed laser deposition, thermal evaporations, solvothermal method, vapor phase production [20], precipitation, sol-gel, and sonochemical method are just few of the methods used to create ZnO nanostructures [20,21].
Of all the methods mentioned above, sol-gel is an excellent choice for producing ZnO NPs [22] due to its ease of modification and affordability [23]. The use of this process for nanoparticle production offers several advantages, including shorter production times and lower operating temperatures compared to alternative methods. [24] The effect of annealing, ZnO NPs generated using the sol-gel technique was reported by Omri et al. [25] To investigate the formation of ZnO nanostructures, Kumar et al. [26] employed a sol-gel method involving zinc sulfate heptahydrate and NaOH as precursors. It was found that the bandgap of ZnO nanostructures can be lowered by increasing the calcination temperature, which in turn causes the maximum absorption to move to longer wavelengths. [25] The electrical and optical characteristics are highly correlated with the crystallite size and orientation, which are mostly influenced by the sizes of the NPs. There are still several challenges that must be overcome before effective ZnO NPs can be created. The first issue is characterizing the residual n-type conductivity of ZnO NPs that have been inadvertently doped. [27] Differences in hole concentrations and carrier mobility resulting from inconsistent doping types hinder the commercialization of ZnO homojunction systems. [28]
The most commonly used plastic substrates for conductive polymer substrates in DSSCs are polyethylene terephthalate (PET) and polyethylene naphthalate (PEN). Recently, coated ITO has also been added to both substrates. However, before using the non-flexible material in DSSCs, the anode and cathode films are heated for 30 minutes at 450 °C to eliminate any residues and solvents from the precursor. Fortunately, the thermal stability of PET and PEN polymer substrates is determined by the maximum temperatures used during processing. This means that if the maximum temperature of 150 °C is exceeded, the flexible electrode (ITO/PEN and ITO/PET substrate) may deform. It is therefore recommended to treat the polymer substrate at a temperature no higher than 150 °C. Unfortunately, due to the low-temperature treatment (low annealing) of the polymer substrate, which hampers efficient decomposition of precursor residues, the performance of DSSCs was poor.
In this study, we developed composite materials by combining ZnO nanoparticles (NPs) with ITO NPs. The purpose of this was to improve the power conversion efficiency (PCE) of ZnO NPs in FDSSCs, and to evaluate the impact of ITO NPs on ZnO NPs FDSSCs. To optimize the efficiency of the composites for FDSSCs, which were fabricated using di-tetrabutylammonium cis-bis-(isothiocyanato) bis (2,2′-bipyridyl-4,4′-dicarboxylato) ruthenium (II) (N719) dyes as sensitizers, we subsequently created composites of ITO NPs with ZnO NPs under appropriate conditions. This makes ITO NPs a potentially cost-effective addition. Metal oxide hybrids incorporating ITO NPs are appealing due to their ability to exhibit good optical performance (fluorescence emission) and their wide range of applications. Consequently, the addition of ITO NPs is advantageous for metal oxides. This perspective suggests that ITO NPs can enhance electron transport and reduce charge recombination by functioning as energy donors. The objective of this research is to modify the structure and optical properties of ZnO NPs, as well as improve FDSSCs performance, through hybridization with ITO NPs. We examined the formation of a ZnO NPs/ITO NPs hybrid connection and its impact on the composite. For ZnO NPs, we investigated the effect of ITO NPs on their structure, optical properties, and performance in FDSSCs.

2. Experimental Part

2.1. Reagents

From Across Organic, we obtained zinc acetate dehydrate (Zn (CH3COO) 2. 2H2O), sodium hydroxide (NaOH, 99%), indium (III) chloride (InCl3. 4H2O), tin (IV) chloride (SnCl4. 5H2O), ethylenediamine (EDA) (99%), ammonium hydroxide (NH3) solution, acetonitrile (99.5%), and ethyl alcohol (99.5%)

2.2. (A) Synthesized of ZnO NPs and ZnO NPS composite with ITO NPs

0.1 M of zinc acetate dehydrate (Zn (CH3COO)2.2H2O (99%) and 0.2 M of Sodium hydroxide (NaOH) dissolved separately in DI water (1:1 ratio Zn (CH3COO).2H2O: NaOH). Then NaOH added to Zn (CH3COO)2.2H2O slowly dropwise vigorously stirring at room temperature. Then waiting up to a white transparent solution is formed. After the white transparent ZnO precipitate was formed, insert it in an oven at 800C for 2hrs [29]. Centrifuge for 30 min at 3000rpm using ethanol and DI water. Then calcined at 3000C-5000C. Then using the sol-gel method ZnO NPs were prepared successfully.

2.2. (B) Preparation of ITO Nanoparticles by Sol-Gel Method

Indium(III) chloride (InCl3. 4H2O (2.6 g, 6.7 mmol) and Tin (IV) chloride (SnCl4. 5H2O (0.26 g, 0.74 mmol) was dissolved in 40 oC - 50 oC distilled water (10 mL) and the solution was stirred for 30 min. To regulate the dispersant, a 5% Ammonia solution (1.4 ml) was added to the mixture solution and stirred for 10 min. The PH-9 was checked for controlled acidity. Ethylene diamine (EDA) solution (0.76 ml) was added as the precipitant. The produced precipitant was washed with DI water and ethyl alcohol after being agitated for a set amount of time. After washing, the precipitant dried at 120 oC for 1hr. Then it was calcined at 450 oC -600 oC for 1hr to get ITO nanopowder.

2.3. Preparation of Electrode

Flexible electrodes of Polyethylene terephthalate (PET), measuring 1x1 cm2, were cut into pieces and pre-cleaned using acetone, ethanol, and DI water. Separately, dispersions of ZnO NPs and ZnO NPs/ITO NPs (40 mg each) in 200 μL of DI water were agitated for four hours. The dispersions were then coated onto the pre-cleaned PET electrodes using spin coating and annealed in an oven at 70 °C for 25 minutes. After the annealing process, the electrodes were submerged in an ethanol solution (5 mL) containing 0.5 mM N719 for 12 hours. The platinum (Pt)/PET counter electrode was constructed using the same PET electrode.

2.4. Measurements of Dye Adsorption Levels

In a separate process, the annealed electrodes were submerged in ethanol (5 mL) solutions of N719 (0.5 mM) for 12 hours. The electrodes coated with ZnO NPs and ZnO NPs/ITO NPs were immersed in a 1 M NaOH solution (5 mL) for 12 hours to extract the dye loaded on the electrodes. Any remaining dyes were removed using water. The amounts of dye in the extractants were calculated using calibration curves and the calorimetric method.

2.5. Electrochemical Measurements (I-V)

The PET flexible electrode substrate pre-cleaning process involved the use of acetone, water, and UV light irradiation in a vacuum for 5 minutes. The dispersions of ZnO NPs and ZnO NPs/ITO NPs were separately agitated in 200 μL of water for 4 hours. Using a spin coater at 2000 rpm, the dispersions were coated onto a 1x1 cm2 area of the pre-cleaned PET electrode and dried separately. The ZnO NPs and ZnO NPs/ITO NPs electrodes were then annealed in the oven at 70 °C for 25 minutes. After that, they were immersed in ethanol (5 mL) solutions of N719 (0.5 mM) dyes for 12 hours separately. The ZnO NPs and ZnO NPs/ITO NPs photo-cathode films, with a thickness of 0.144 mm, on the PET electrode were assembled with the platinum (Pt)/PET counter electrode. Redox electrolytes (0.3 M KI, 0.05 M I2, and 10 mL of acetonitrile solvent) were added between the two constructed film electrodes on PET. The I-V measurement was performed using a blue (430 nm) light-emitting diode (LED) light source with a ZAHNER, Xpot,26356 German instrument. The total PCE (Photovoltaic Conversion Efficiency) was calculated using the equation below, based on the intensity of the incident light.
η = J s c V o c P i n F F
where P i n is light incident power, V o c is the open-circuit voltage, J s c is the circuit current density and FF is the fill factor.

3. Results and Discussions

3.1. Characterizations of Composites

TEM images were used to characterize the size and shape of the created nanocomposites, specifically the nanograins of ZnO NPs and ZnO NPs@ITO NPs. The mean diameters measured for these nanograins were 15.22±11 nm and 14.54±16 nm, respectively, which align with previously published values [30]. These measurements can be found in Figure 1.
However, a ZnO NPs@ITO NPs (10 wt%) indicated the presence of smaller nanograins. The results suggest that the combination of ZnO NPs and ITO NPs of different sizes leads to attractive interactions between them. Evidence of the beneficial properties of these nanoparticles can be seen in TEM Figure 1(a) and (b), where the ZnO NPs have formed hexagonal structures, with sphere-like nanoparticles visible in certain areas. Across all particle categories, a range of dimension sizes can be observed, but the average size for composite ZnO NPs and ITO NPs is approximately 12-16 nm. The calculated sizes using TEM are 15.22±11 nm and 14.54±16 nm, respectively, which suggests the possible formation of a heterojunction between them.
Furthermore, Figure 1(a) and (b) reveal that the incorporation of ITO NPs on top of ZnO NPs appears to increase the surface roughness. Supporting this observation, the size distribution histograms shown in Figure 1(c) and (d) for ZnO NPs and ITO NPs confirm that the majority of the particles fall within the range calculated using TEM. In Figure 1(e) and (f) of ZnO NPs in SEM, the images show a uniform dispersion of hexagon-shaped nanoparticles. The SEM analysis also reveals the homogeneous and smooth surface morphology of the ZnO nanoparticles. In Figure 1(f), when the ZnO NPs are treated with ITO NPs, there is a noticeable change in morphology. This change can be attributed to surface interactions between the two types of nanoparticles. Interactions between ZnO NPs and ITO NPs may result in the adsorption or deposition of ITO NPs onto the surface of ZnO NPs, modifying their surface properties and altering their morphology. These interactions could involve chemical reactions at the nanoparticle surfaces, potentially leading to the formation of new compounds or surface modifications that impact the morphology of ZnO NPs. The specific reasons for these morphological changes depend on experimental conditions, nanoparticle characteristics, and interaction mechanisms between ZnO and ITO NPs in each study mentioned. Further analysis and characterization techniques are necessary to determine the exact mechanisms responsible for the observed changes.
The EDX pattern (Figure 1(g)) confirms the presence of zinc (Zn) and oxygen (O) as the only elements detected in the sample, suggesting that no other trace elements are present in the synthesized nanopowder. The atomic and weight percentages of the components in ZnO NPs reveal that the particles are composed entirely of Zn and O. This finding confirms the atomic ratio of Zn and O shown in Figure 1(g) to be almost equal, indicating that the quantities of these elements involved in the reaction or compound formation of ZnO are as shown. In Figure 1(h), the EDS analysis also shows the elemental components of the collective part to be oxygen (O), zinc (Zn), tin (Sn), and indium (In). This indicates the presence of ZnO and indium tin oxide (ITO). The weight percentage (wt%) and atomic percentage (At%) values of each element in Table 1 support this finding.
These values correspond to the expected elements for Figure 1(h). However, the presence of carbon (C) in Figure 1(h) is unexpected based on the composition in Table 1. The material of ZnO/ITO does not list carbon as an elemental component of the ZnO/ITO material. Therefore, the carbon detected in Figure 1(h) may be attributed to small impurities or contaminants. It is possible that trace amounts of carbon were present in the sample, resulting in its detection during the analysis.
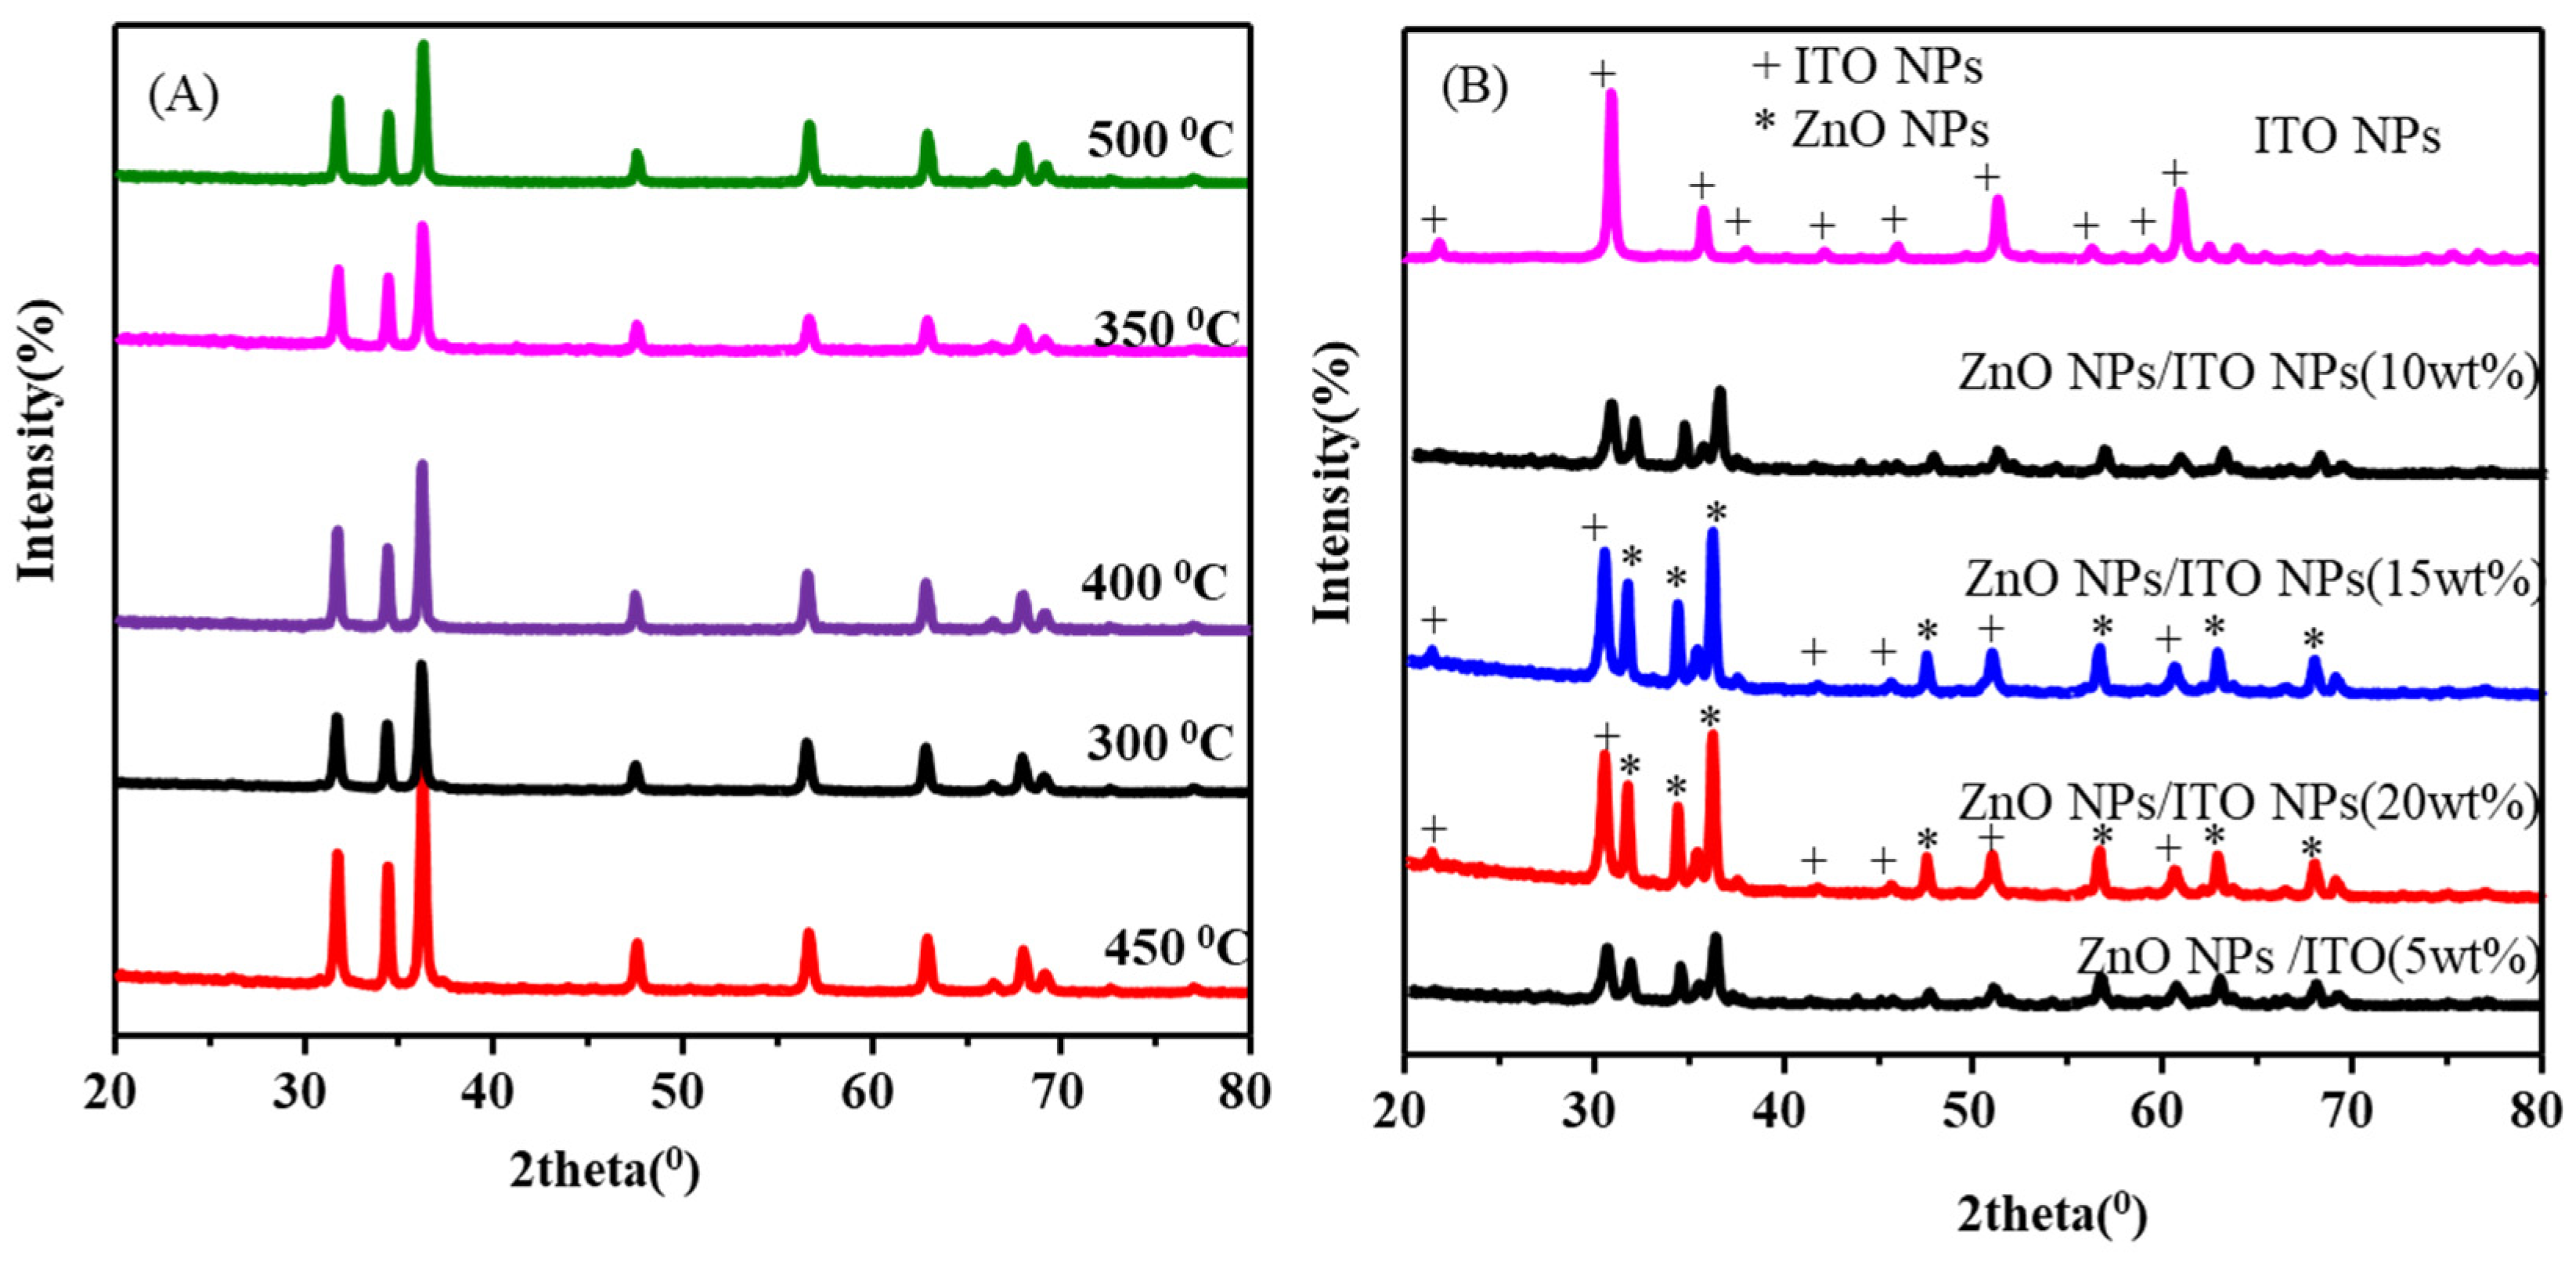
As shown in Figure 2(A) and Table 2(A), the XRD diffraction peak values correspond to the d-spacing, indices, and 2theta angles for ZnO NP samples obtained through the sol-gel synthesis method at different annealing temperatures. The subsequent sections of the table provide the same index information at 2θ = 31.73°C, 34.42°C, 36.26°C, 47.53°C, 56.53°C, 62.87°C, 66.35°C, 67.86°C, 69.04°C, respectively, for the (100), (002), (101), (102), (110), (103), (200), (112), and (201) planes for the ZnO NP obtained at annealing temperatures of 450°C. The same indices are also provided for 300°C, 350°C, 400°C, and 500°C, which is in agreement with the reported scholars [31]. This indicates that pure crystalline ZnO NPs have been prepared. The ideal levels of crystallinity and purity of a single phase of ZnO NPs were found using temperatures ranging from 300 to 500°C. However, at an annealing temperature of 450°C, it reveals almost the same d-spacing values and 2theta values as the standard reported values. When analyzing the diffraction patterns of ZnO NPs, certain characteristic peaks corresponding to specific crystallographic planes within the hexagonal structure of ZnO can be observed. These peaks can be indexed by JCPDS card No. 01-079-2205 [32], allowing researchers to identify and confirm the crystal structure of the ZnO nanoparticles. The cubic-like structure (JCPDS 06–0416) [33] of the ITO NPs XRD peak diffraction at 2θ = 21.77°C, 30.74°C, 35.72°C, 37.90°C, 42.21°C, 46.04°C, 51.35°C, 56.27°C, 59.55°C, and 60.91°C for the planes (211), (222), (400), (411), (332), (431), (440), (433), (611), and (622) has been observed, respectively. It is also observed that the degree of intensity of the ZnO NPs increases as the temperature rises to 450°C. In this case, as the temperature increases, the atoms within the ZnO NPs can rearrange themselves into a more ordered lattice, resulting in increased crystallinity. However, as the temperature continues to rise to 500°C, the intensity of all the diffraction peaks decreases. A decrease in peak intensity suggests a reduction in the scattering of X-rays, which could be attributed to a decrease in the crystalline quality of the ZnO nanoparticles. At higher temperatures, there might be factors such as grain growth, lattice defects, or even phase transformations that can lead to a decrease in the crystalline quality and, consequently, a decrease in peak intensity.
The details provided in Figure 2(A) would show the variation in peak intensities as a function of temperature, visually representing the changes in crystallinity and the decreasing peak intensities.
As can be seen in Figure 2(B) and Table 2(B), the XRD peaks and peak positions of ZnO NPs have changed in line with the addition of ITO NPs. This demonstrates that the structure of ZnO NPs is impacted by the ITO NPs. All the known ITO NPs XRD peaks with their respective induced planes can surely be found in the composite of ZnO NPs/ITO NPs. However, a shift in the peak positions of ZnO NPs has been observed after the addition of ITO NPs. For instance, the peak positions of 31.73 oC, 34.42 oC, and 36.26 oC for ZnO NPs were shifted to 31.70 oC, 34.37 oC, and 36.29 oC, respectively, after the addition of ITO NPs. This indicates that ITO NPs can impact the crystallography of ZnO NPs, which may be suitable for another application. The lattice parameters for ZnO NPs and ZnO NPs@ITO NPs, calculated from XRD peaks, are 3.124 Å and 4.642 Å, respectively, and 3.214 Å and 4.725 Å, respectively.

3.2. Optical Properties

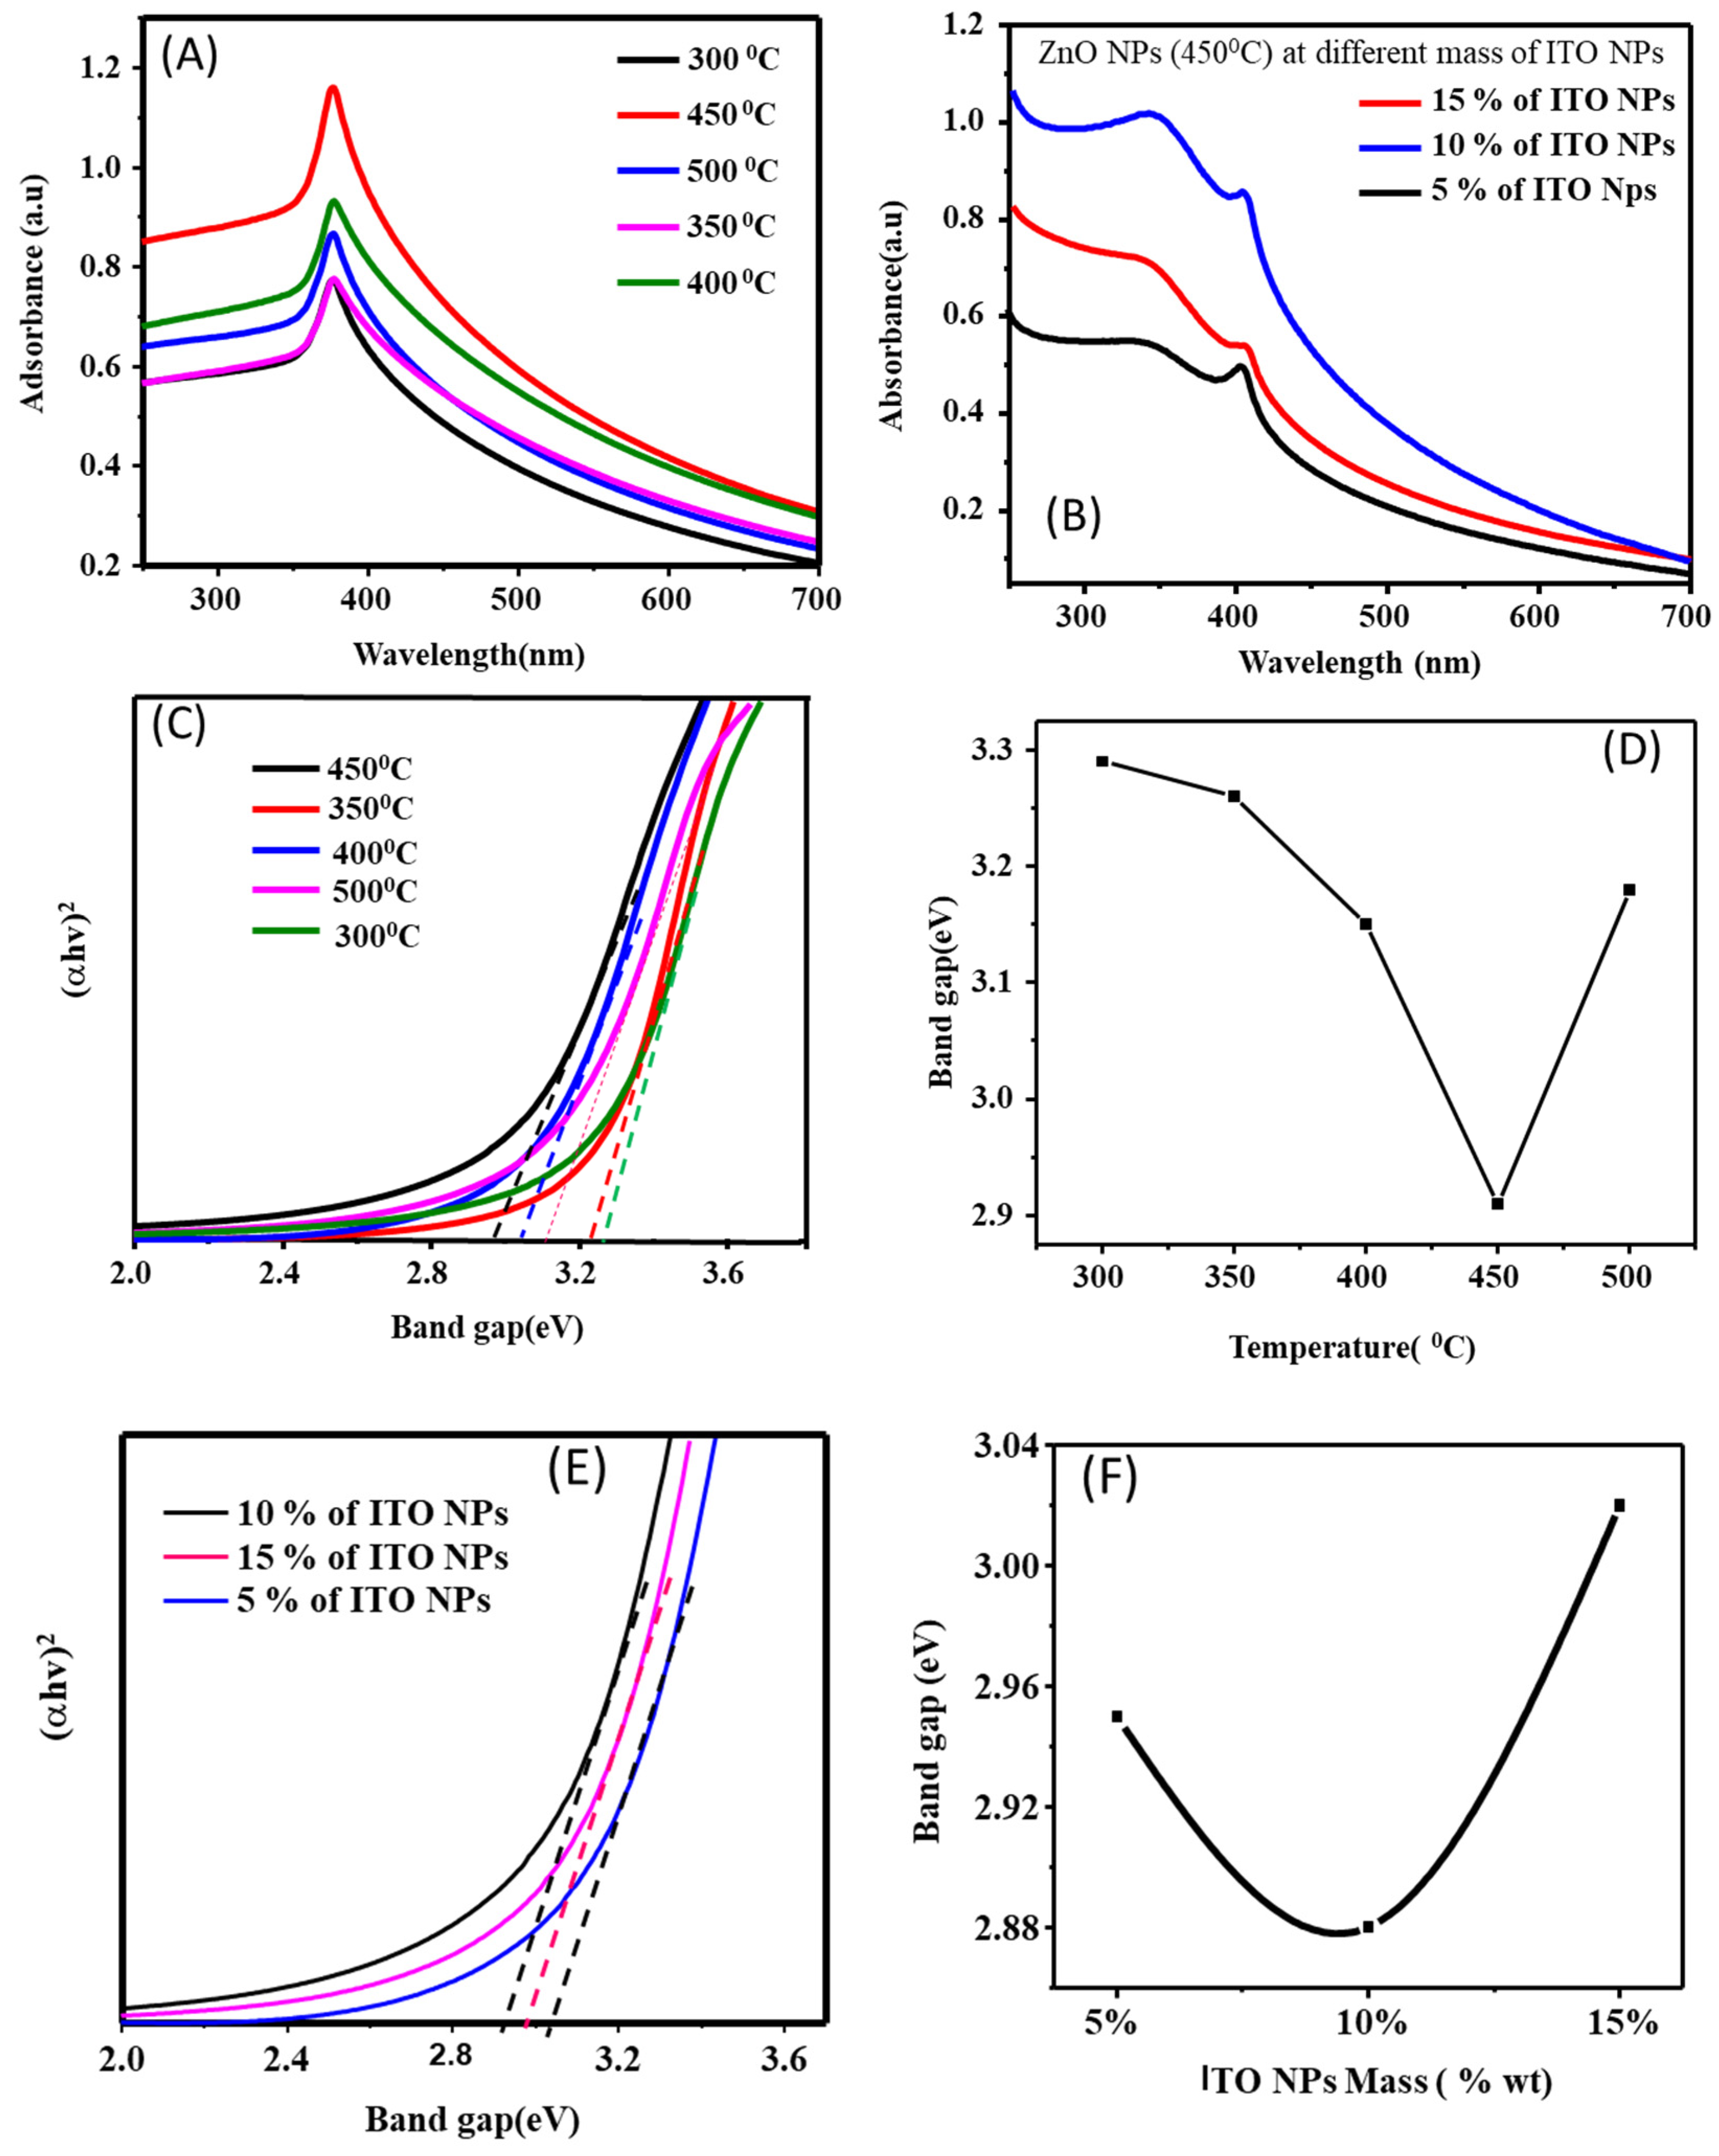
As can be seen in UV-Vis Figure 3 (A) and (B), the highest peaks in the spectra of ZnO NPs are located at 380 nm, regardless of the annealing temperatures that were used. The redshifted wavelength of ZnO NPs, on the other hand, only becomes noticeable at certain temperatures. The actual band gap shifts along with the temperature of the ZnO NPs as it goes through its range of different temperatures. However, the redshift wavelength with the new band spectra of ZnO NPs appeared at 428 nm after a 10 wt% mass of ITO NPs was added to ZnO NPs (seen in Figure 3 (B)). This can be attributed to the electron transition from the valence band (VB) to the conduction band (CB) of the energy level. The influence of ITO NPs on the shift of wavelength from the ultraviolet band of the spectra to the visible band (380 nm - 428 nm) is possible. Although exposure to visible light does not pose any danger to humans. Therefore, the composite of these materials may have several uses in various contexts. Examples include photocatalytic degradation, solar energy, and other similar processes.
The Tauc plots seen in Figure 3 (C), (E), and Table 1 of ZnO NPs and ZnO NPs/ITO NPs demonstrate, the variation of the band gap of ZnO NPs at different annealing temperatures and the band gap of ZnO NPs at different wt % of ITO NPs. Consequently, as temperature raised from 3000C-4500C the band gap of the shows decreasing, but after the 4500C to increase. Indicating the annealing temperature can influence the band gap of the materials which corresponded to the conductivity of the materials. As seen Figure 3(D) and Table 1, the small band gap seen at 4500C. In addition, when ZnO NPs treated by different wt% of ITO NPs, the change in band gap of ZnO NPs at 10 wt% of ITO NPs reduced to 2.88eV from 2.94eV (seen Figure 3(E) & (F) and Table 1,). The interaction between ZnO and ITO NPs can lead to chemical reactions or alloying at the interface. This can introduce new energy levels or modify the electronic structure of the ZnO NPs, affecting the band gap. The presence of ITO NPs, which typically have a lower band gap than ZnO, can influence the overall band gap of the nanocomposite. And dopants can create energy levels within the band gap, influencing its width. The nature and concentration of defects or dopants can vary with the annealing temperature or the weight percentage of ITO NPs, leading to changes in the band gap.

3.3. Photoluminescence Properties

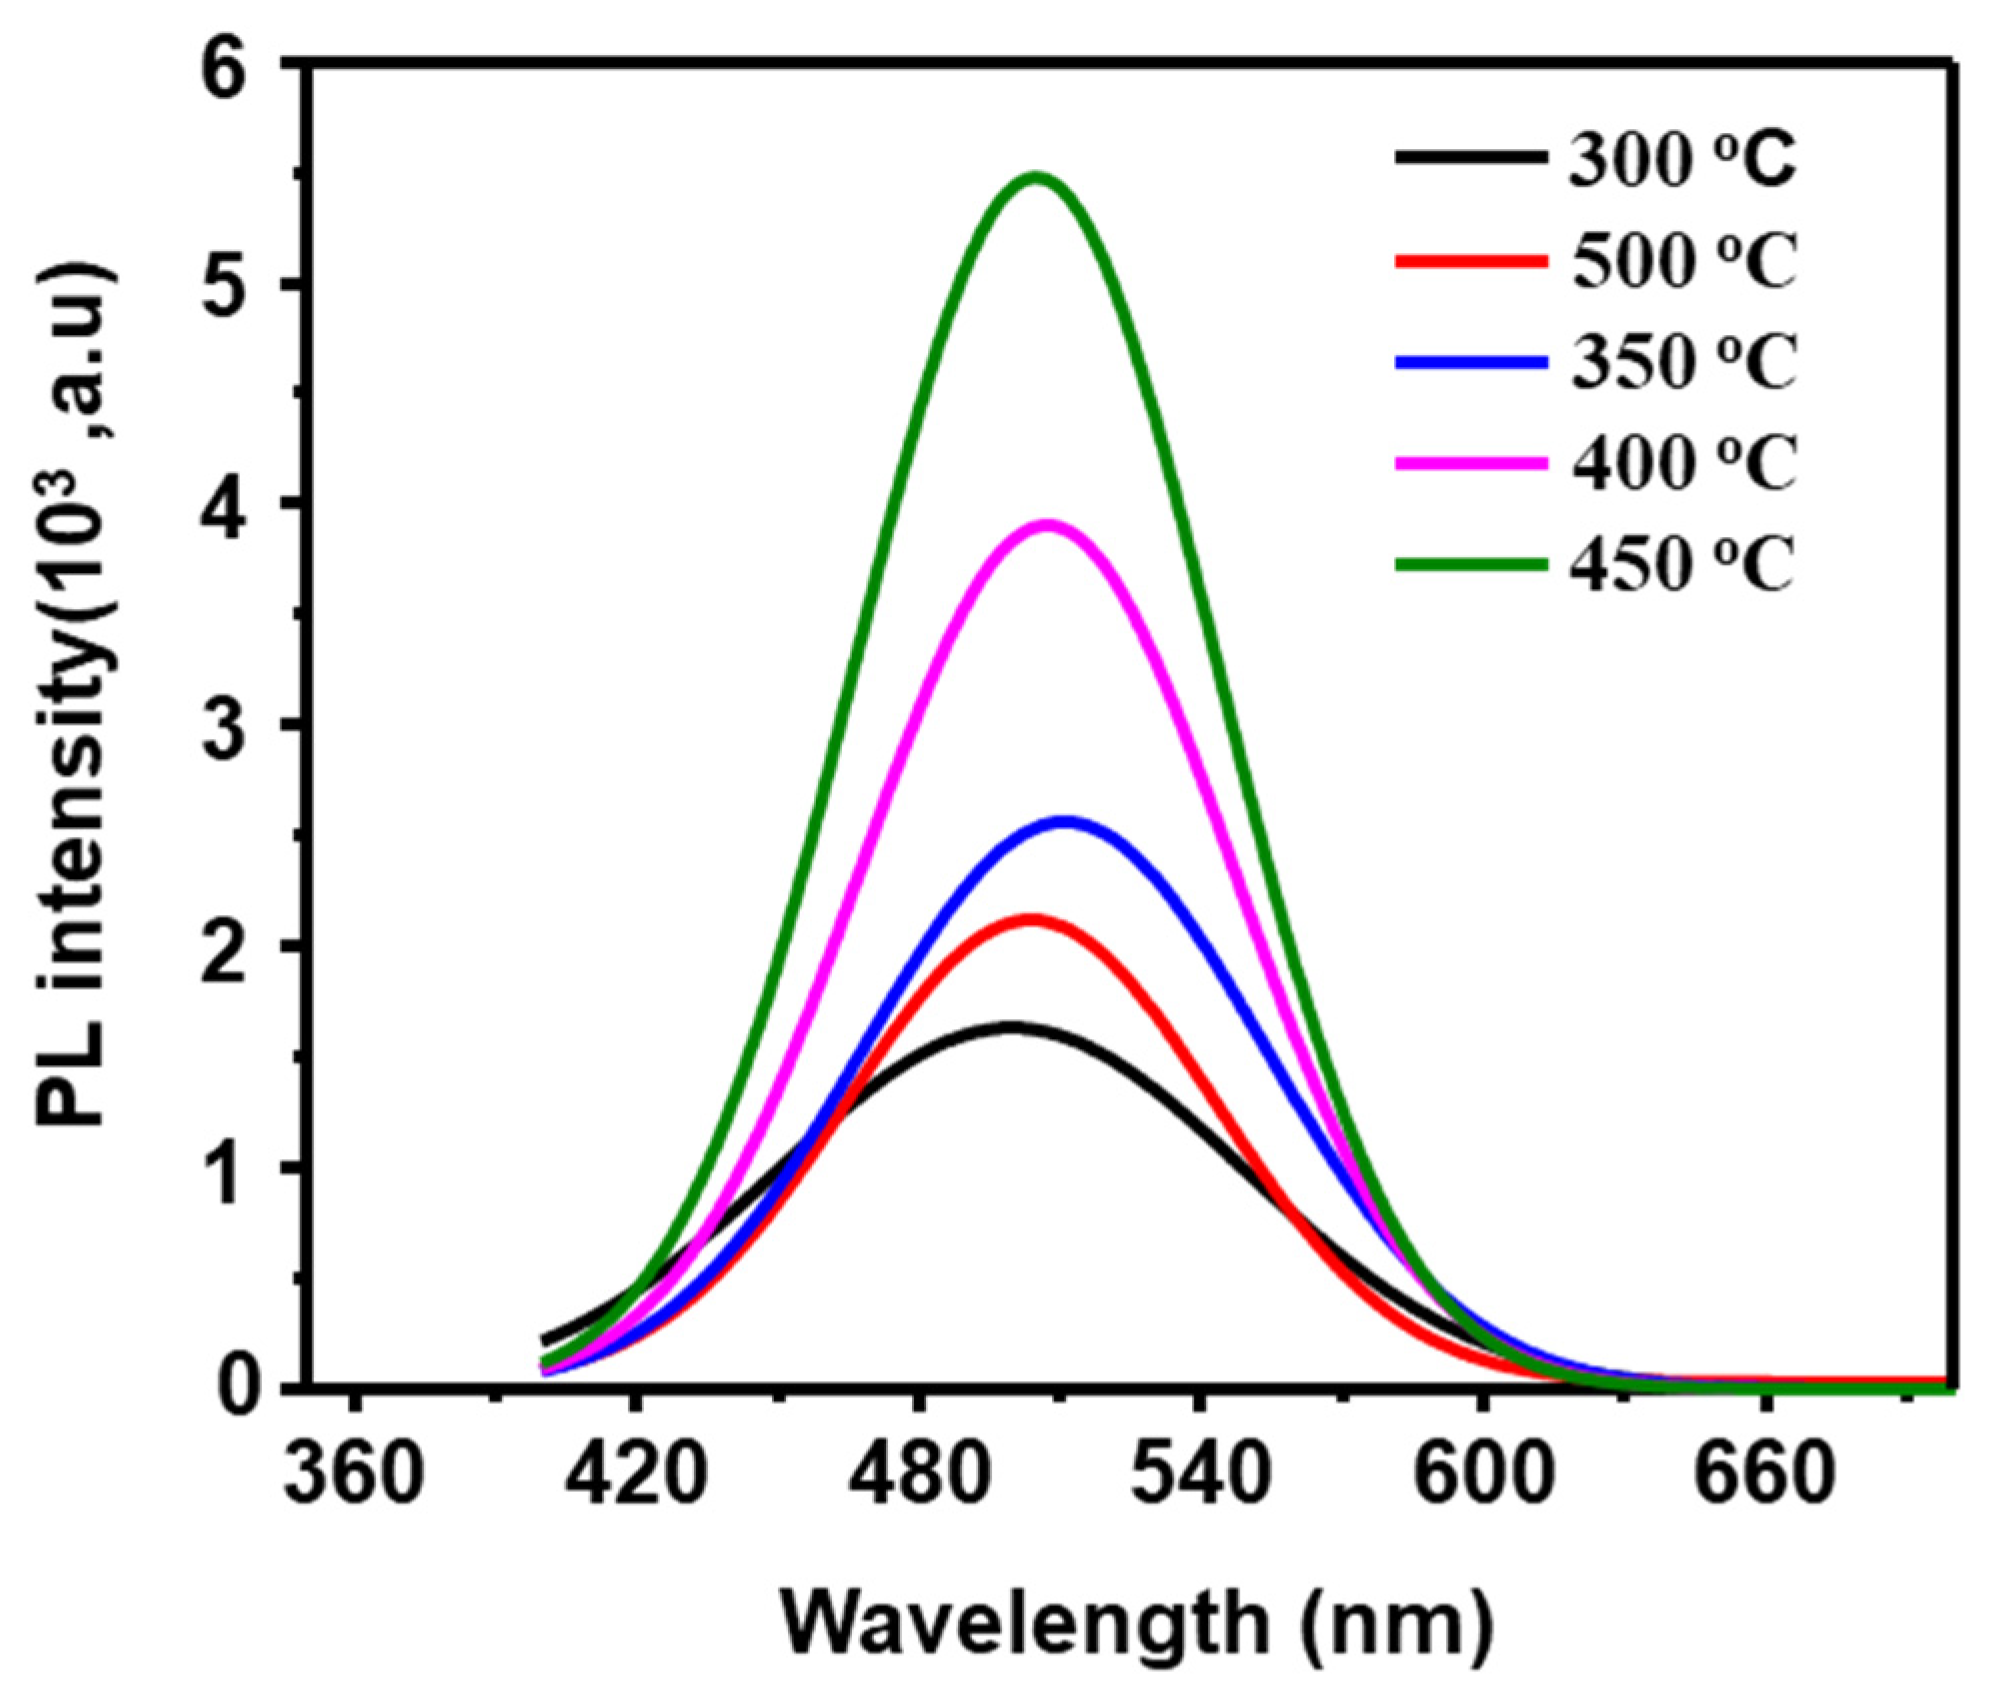
During the excitation process, a material absorbs photons of specific energy [9], causing electrons to move from the valence band to the conduction band or to higher energy states within the band gap. This process creates electron holes in the valence band. As a result, when a material emits light after absorbing photons, it is known as photoluminescence. Figure 4 displays the photoluminescence (PL) profiles of ZnO nanoparticles (NPs) at different temperatures: 300, 350, 400, 450, and 500 °C. These PL profiles provide information about the emission of light at specific wavelengths, revealing the presence of different energy levels and defects in the material. For the ZnO NPs, the broad emission band is a result of the superimposition of a major peak and a broad emission, with the peak occurring at approximately 524 nm when annealed at 450 °C. This indicates that the optical characteristics of photoluminescence can be affected by the annealing temperature. As seen in Figure 4, five clear peaks at 498 nm, 506 nm, 510 nm, 515 nm, and 523 nm for 300 0C, 500 0C, 350 0C, 400 0C, and 450 0C ZnO NPs respectively. Different flaws, including oxygen intermediate (Oi), zinc interstitial (Zni), oxygen vacancies (Vo), zinc vacancies (Vzn), and oxygen antistites (Ozn), were thought to be the possible causes of the deep-level emission seen in the visible range. Because according to Gaussian fitting [34], it was used to look at the broad spectrum in the visible region and study the blue (470 nm and 492 nm) and green (522 nm) emissions. The blue fluorescence at 498 nm was generated through the recombination of zinc interstitial (Zni ) energy level and zinc vacancy (VZn). The blue fluorescence peaks at 498nm were reported by Lakshi Saikia et al. to the transfer of electrons from the upper valence band to the zinc interstitial (Zni ) site [35]. Oxygen vacancies, created at the deep donor level in the material’s bandgap, are responsible for the 523 nm green emission peak. Whenever the temperature of the substrate rises, the visible light intensity falls, demonstrating that the substrate temperature plays a significant role in the creation of different defects throughout the lattice of ZnO NPs.
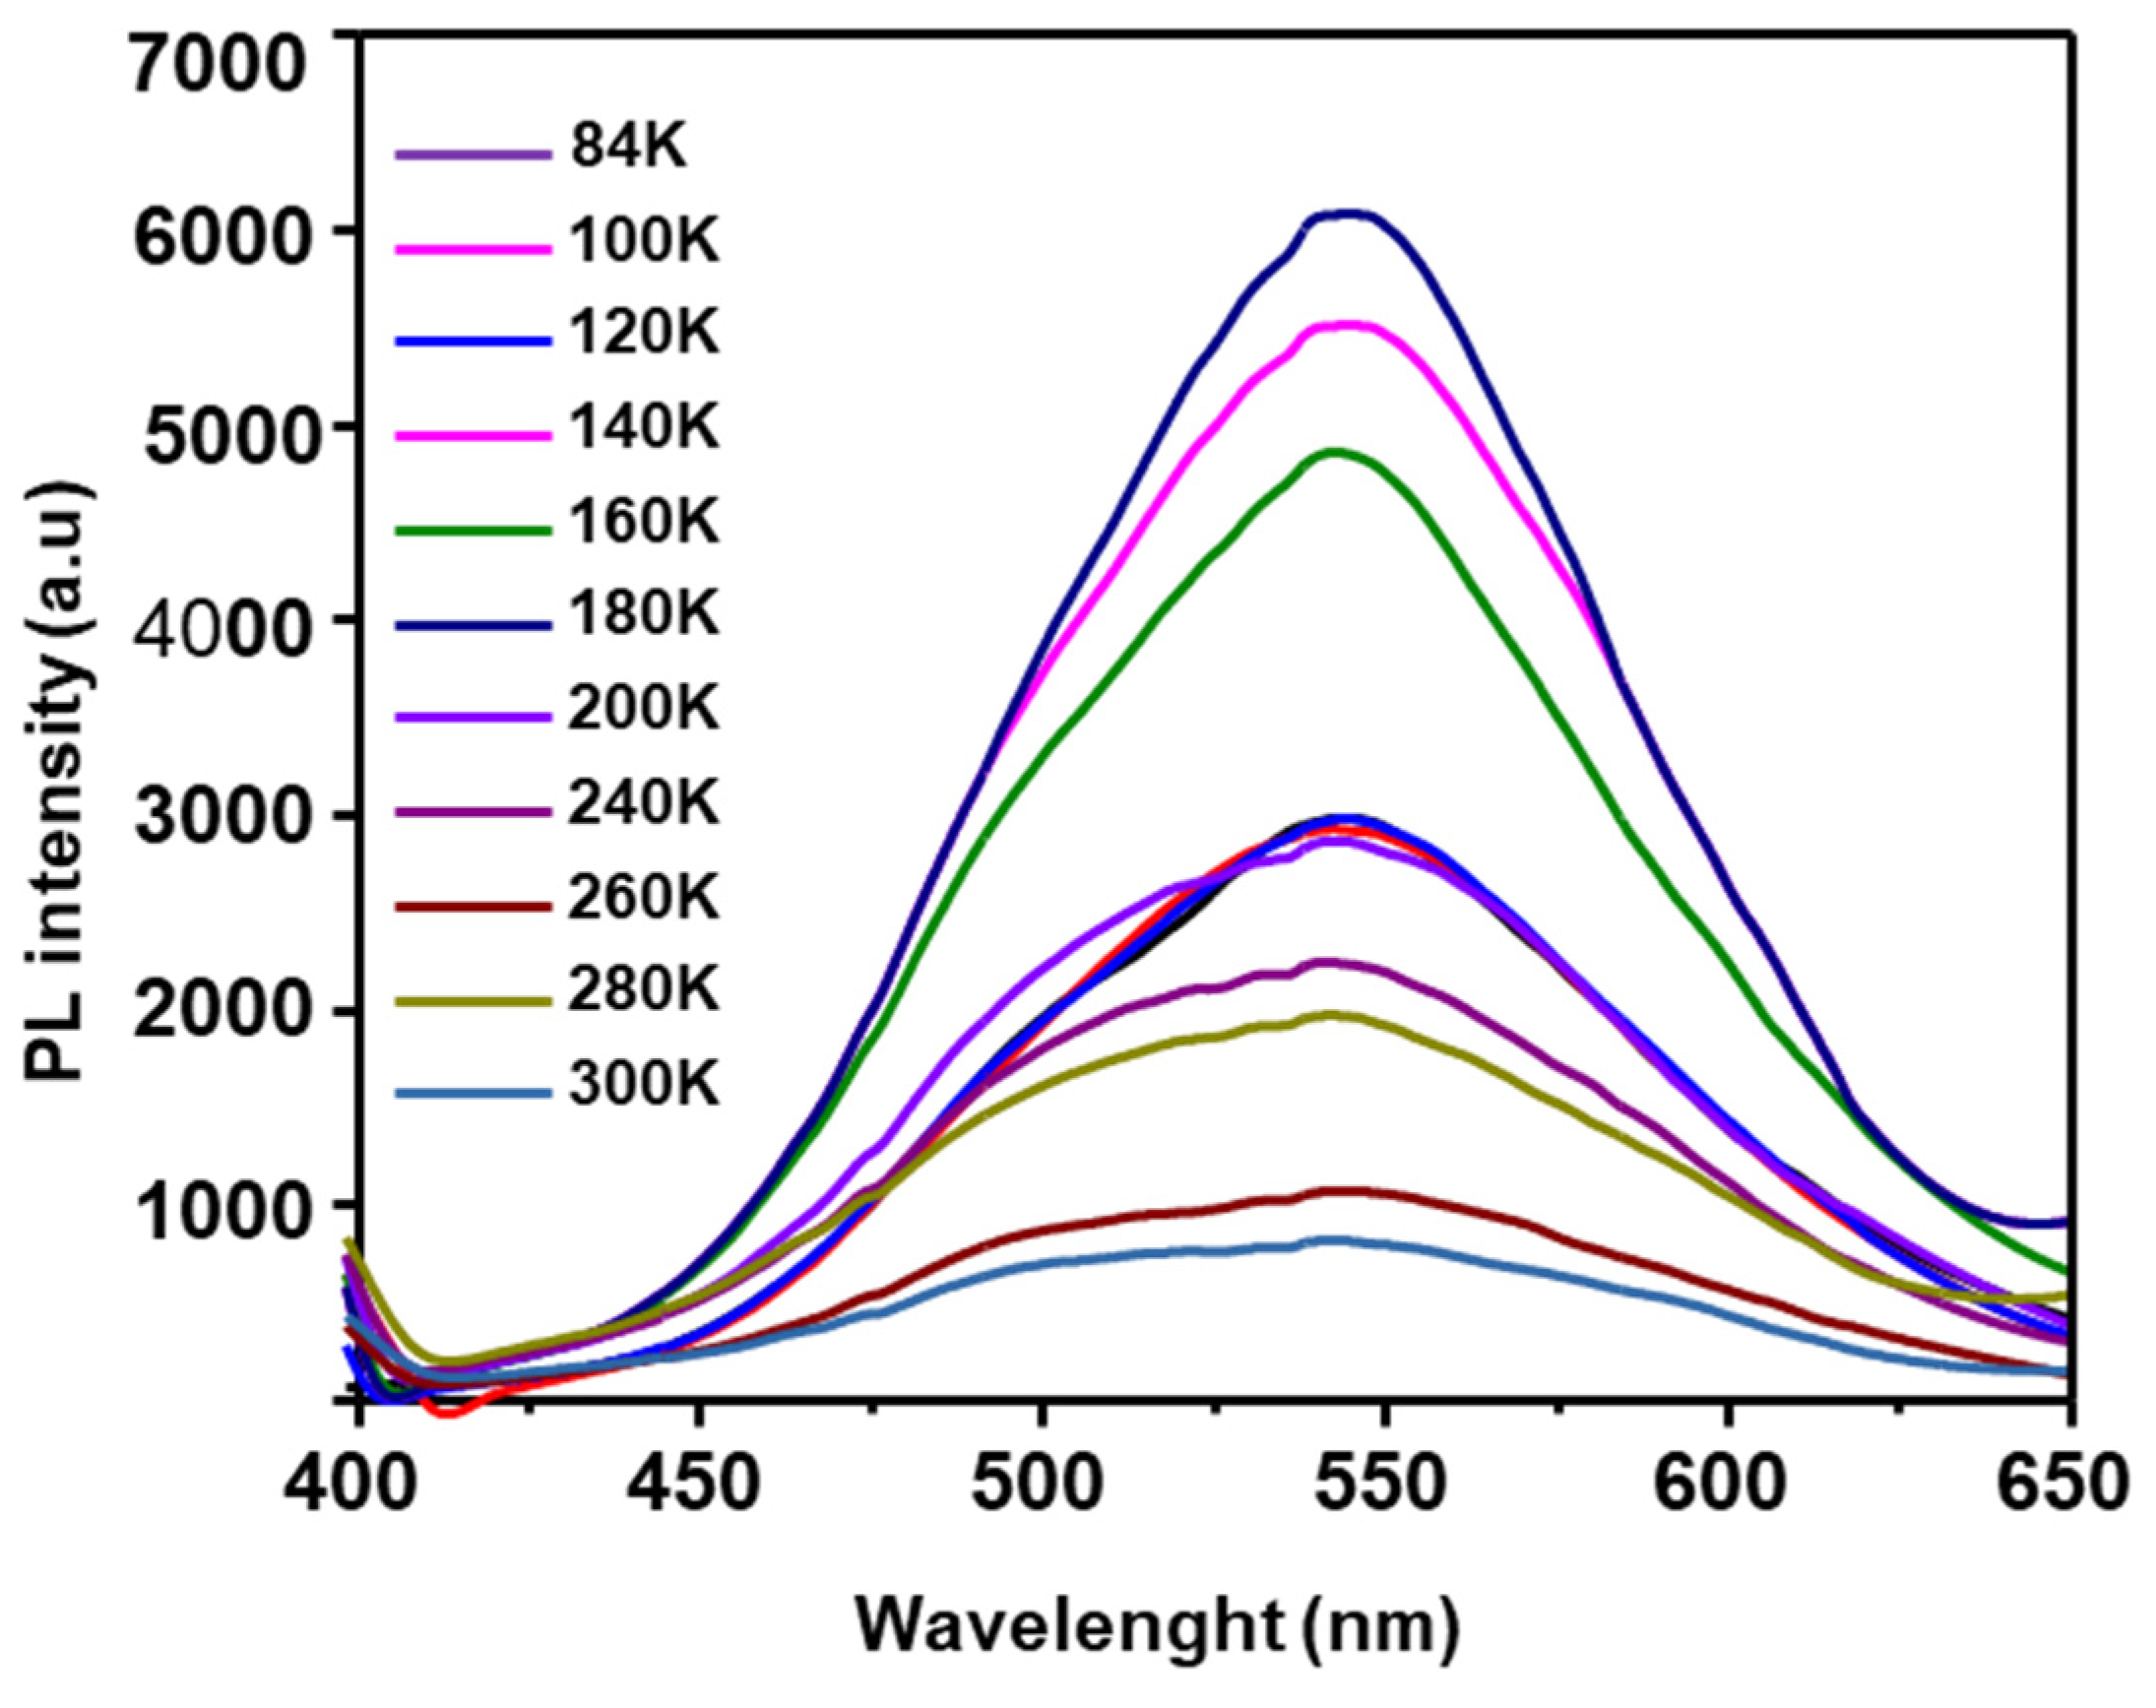
Figure 5 displays the PL spectra obtained from our experiments to examine the impact of ITO (indium tin oxide) nanoparticles on the optical characteristics of ZnO NPs/ITO NPs. We investigated using photoluminescence (PL) spectroscopy, which allows us to study light emissions from the materials under specific conditions. In this study, we recorded the PL spectra of a composite of ZnO NPs and ITO NPs (ITO NPs/ZnO NPs) materials at low temperatures ranging from 84K to 300K. The low-temperature photoluminescence measurements and optical transmittance analysis experiments were carried out at an optimized temperature of 450°C. In Figure 5, the low-temperature photoluminescence characteristics of the ZnO NPs@ITO NPs nanostructures, we observe a single emitting band, which corresponds to a broad visible emission peak centered around 535 nm. This emission is observed within the low-temperature range of 84K to 300K for the ZnO NPs@ITO NPs hybrid nanostructure. In summary, these findings provide valuable insights into the optical behavior of hybrid nanostructures and contribute to our understanding of the interaction between ITO NPs and ZnO NPs.
It is evident that the band edge emission increases in the 84K treated sample compared with 300K. This can be attributed to the lower temperature treatment reducing the impurities in the materials and revealing the semiconductor’s photoluminescence characteristics. On the other hand, the intensity of the broad emission decreases significantly from 84K to 300K. Thus, room temperature can affect the photoluminescence behavior of the materials. However, when the bare ZnO NPs@ITO NPs sample is excited by the laser source and its electrons are stimulated to the conduction band, only a small portion of these electrons return directly to the valence band, while most of them become trapped in the defect levels. As a result, the electron from the conduction band is easily trapped back into the defect states, causing a broad hump in the visible region.

3.4. I-V Performance of F DSSCs

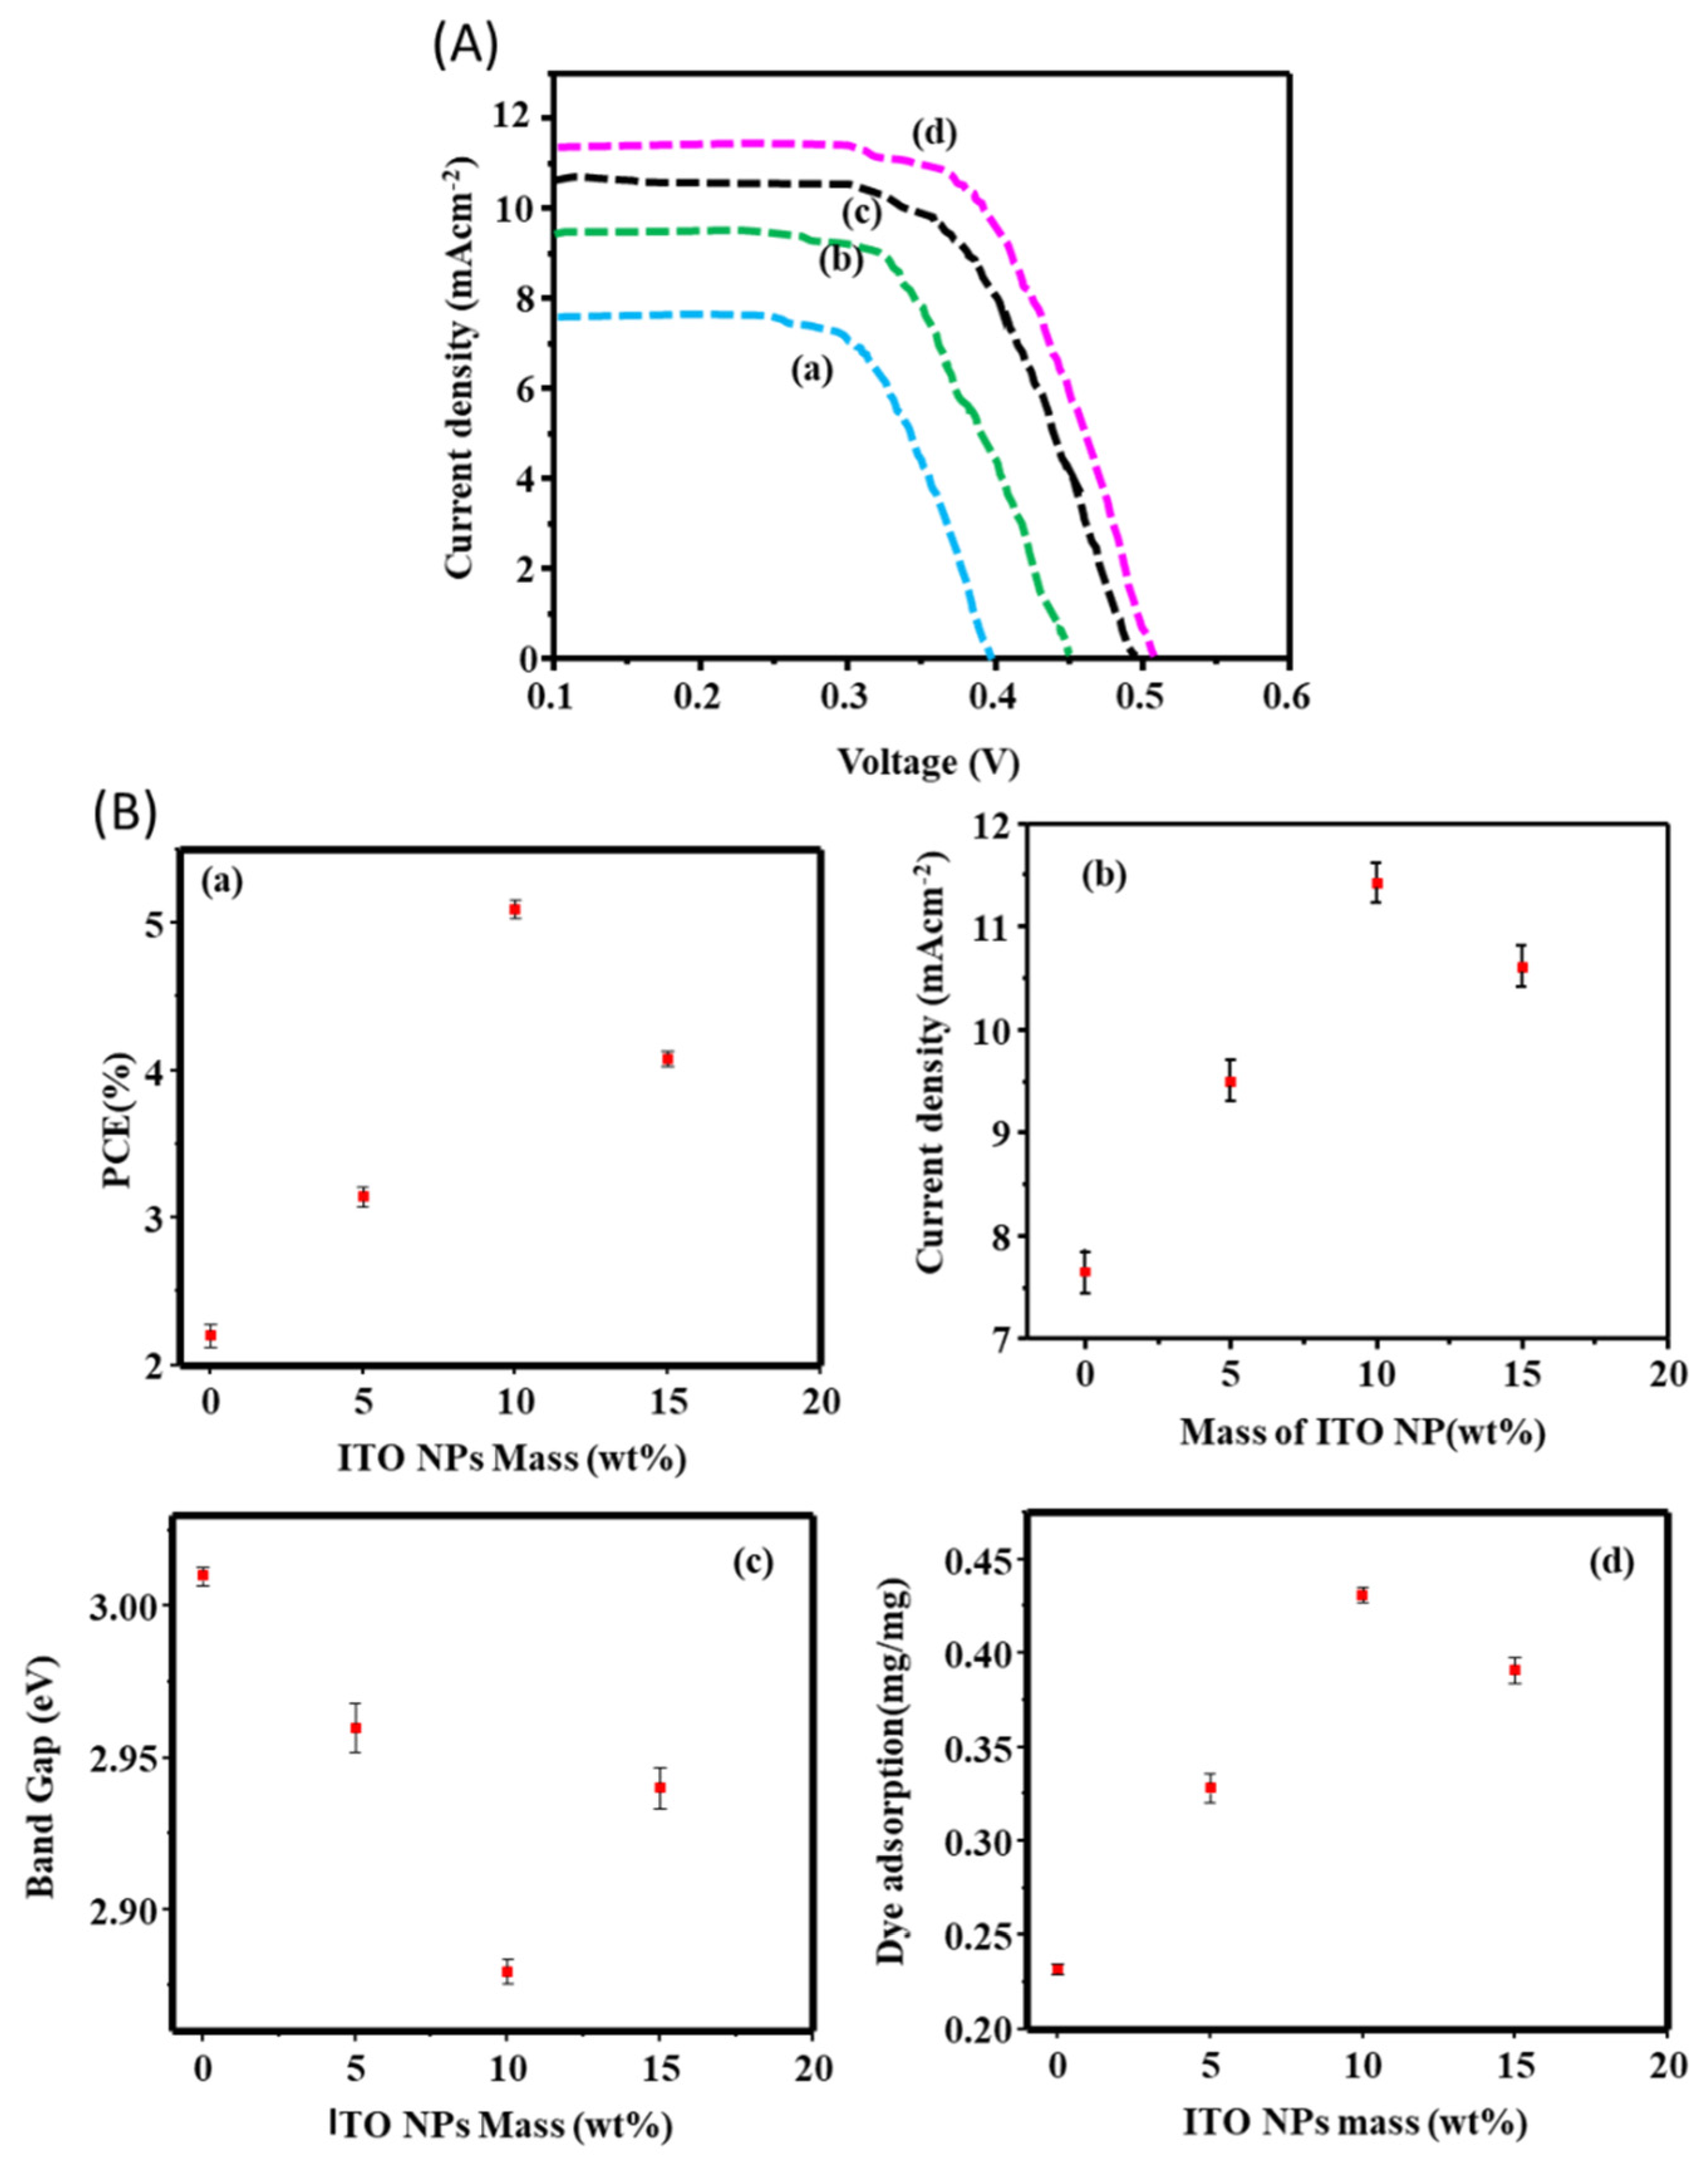
The impact of ITO NPs on FDSSC performance has not been assessed yet, but it effectively produces a quick photocurrent response. As shown in Figure 6 and Table 3, loading the optimized ITO NPs (10 wt%) onto the PEN/Pt substrate enhances the current density from 7.65+0.13 to 11.420±0.14 mA/cm2. As a result, the PCE increases from 2.198±0.14 to 6.680+0.12%. The interaction between ITO NPs and ZnO NPs augments charge separation decreases charge recombination, and boosts charge transport at ZnO NPs. These factors are deemed crucial for enhancing photocurrent production. Table 3 provides data on the I-V performance of FDSSCs with ZnO NP@ITO NP photocathodes at different weight percentages of ITO NPs loaded on ZnO NPs. This data reveals a trend where the photocurrent density (Isc) and efficiency (η%) increase with higher weight percentages of ITO NPs, up to a certain point. This indicates that the incorporation of ITO NPs enhances the performance of the solar cells, but there may be an optimal weight percentage beyond which further loading does not significantly improve performance. Figure 6(A) displays the power conversion efficiency (PCE) of FDSSCs with ZnO NPs at different weight percentages of ITO NPs. It shows that the PCE varies, indicating that the interaction between the surface of ZnO NPs and ITO NPs differs depending on the weight percentage of ITO NPs. This variation in interaction leads to differences in the performance of the FDSSCs, highlighting the importance of optimizing the weight percentage of ITO NPs for maximum efficiency.
Figure 6(B) (a), (b), (c), and (d) demonstrate the I-V parameters at different mass loadings of ITO NPs. It shows that at a ZnO NPs/ITO NPs ratio of 10 wt%, the dye loading performance is higher. This indicates that at this specific weight percentage, there is optimal light absorption and performance, leading to enhanced efficiency. Thus, the findings suggest that the performance of FDSSCs is influenced by the weight percentage of ITO NPs deposited on ZnO NPs. Optimizing this weight percentage is crucial for maximizing efficiency, as it affects the interaction between the nanoparticles and ultimately determines the overall performance of the solar cells. Overall, the results suggest that the incorporation of ITO NPs into FDSSCs leads to significant improvements in their performance, primarily through enhanced charge transport and reduced recombination, ultimately resulting in higher efficiency.
Table 4 presents a comparison of the performance of different flexible electrodes for DSSCs using various materials. The table includes information on the materials, deposition techniques, working electrode (WE), counter electrode (CE), power conversion efficiency (PCE) in %, and related references. The study reported a significant improvement in the performance of FDSSCs when ITO NPs were added to ZnO NPs, with the ZnO NPs/ITO NPs DSSC showing an approximate 6.680±0.12 nearly double improvement.
Furthermore, the combination of ZnO NPs solar cells, N719 dye, and ITO NPs had a synergistic effect, leading to improved performance of the DSSCs. ITO NPs are excellent electron donors and acceptors. This study clearly demonstrates the dual functionality of photo-excited ITO NPs as both electron donors and acceptors. ITO nanoparticles (NPs) are widely known for their remarkable abilities in photo-induced electron transfer and light harvesting, which enhance their photocatalytic and light-energy conversion capabilities. The presence of ITO NPs improves photocurrent production, dye adsorption, light harvesting, PCE efficiency, recombination reduction, and mobility enhancement. Lastly, the use of ITO NPs holds the potential for achieving photogenerated charge separation.

4. Conclusions

In conclusion, the comprehensive analysis of the ZnO NPs and ZnO NPs@ITO NPs nanocomposites reveals significant enhancements in structural, optical, and electronic properties upon the incorporation of ITO. TEM and SEM imaging confirm uniform dispersion and surface morphological changes indicative of potential heterojunction formation. EDX analysis validates the elemental composition, while XRD patterns illustrate increased crystallinity and structural modifications. UV-Vis spectra demonstrate a redshift, suggesting applications in photocatalysis and solar energy. Band gap analysis and PL spectra indicate the influence of ITO on optical properties, reducing the band gap and altering emission behavior. The incorporation of 10 wt% ITO NPs into ZnO NPs notably improves the performance of flexible dye-sensitized solar cells, with substantial increases in current density and power conversion efficiency. These findings highlight the critical role of ITO NPs in enhancing the functional properties of ZnO NPs, paving the way for their application in advanced optoelectronic devices.

Author Contributions

Conceptualization, H.F.E. methodology, F.B.D.; validation, H.F.E. and F.B.D formal analysis, H.F.T.; investigation, F.B.D.; resources, H.F.E, writing—original draft preparation; writing—review and editing, F.B.D; visualization, F.B.D.; supervision, F.B.D; project administration, F.B.D; funding acquisition. All authors have read and agreed to the published version of the manuscript.

Funding

This research received no external Funding.

Data Availability Statement

All the data used are confidentially included in the manuscript.

Acknowledgments

The authors are grateful to Walter Sisulu University (WSU) for its support.

Conflicts of Interest

The authors declare no conflicts of interest.

References

  1. G. Li, L. Sheng, T. Li, J. Hu, P. Li, K. Wang, Engineering flexible dye-sensitized solar cells for portable electronics, Solar Energy 177 (2019) 80-98. [CrossRef]
  2. D. Devadiga, M. Selvakumar, P. Shetty, M.S. Santosh, The integration of flexible dye-sensitized solar cells and storage devices towards wearable self-charging power systems: A review, Renewable and Sustainable Energy Reviews 159 (2022) 112252. [CrossRef]
  3. A.K. Shukla, K. Sudhakar, P. Baredar, A comprehensive review on design of building integrated photovoltaic system, Energy and Buildings 128 (2016) 99-110. [CrossRef]
  4. H.M. Ahmed, A. Roy, M. Wahab, M. Ahmed, G. Othman-Qadir, B.H. Elesawy, M.U. Khandaker, M.N. Islam, T.B. Emran, Applications of nanomaterials in agrifood and pharmaceutical industry, Journal of Nanomaterials 2021 (2021) 1-10. [CrossRef]
  5. J. Hänig, B. Weller, Experimental investigations and numerical simulations of innovative lightweight glass–plastic-composite panels made of thin glass and PMMA, Glass Structures & Engineering 6 (2021) 249-271. [CrossRef]
  6. H. Hassan, P. Sharma, M.R. Hasan, S. Singh, D. Thakur, J. Narang, Gold nanomaterials–The golden approach from synthesis to applications, Materials Science for Energy Technologies 5(2022) 375-390. [CrossRef]
  7. P. Pandey, Role of nanotechnology in electronics: A review of recent developments and patents, Recent Patents on Nanotechnology 16 (2022) 45-66. [CrossRef]
  8. A.H.H. Asal, S.N.T. Al-Rashid, Effects of Quantum Confinement Energy on the Transmittance of Cadmium Telluride (CdTe) Within the Near Infrared Region (700-2500nm), East European Journal of Physics (2023) 329-333. [CrossRef]
  9. H.F. Etefa, V. Kumar, Hybrid Photocatalyst Nanomaterials in Solar Cell Applications, Multifunctional Hybrid Semiconductor Photocatalyst Nanomaterials: Application on Health, Energy and Environment, Springer, Switzerland AG,2023, pp. 221-238. [CrossRef]
  10. D. Sudha, E.R. Kumar, S. Shanjitha, A.M. Munshi, G.A. Al-Hazmi, N.M. El-Metwaly, S.J. Kirubavathy, Structural, optical, morphological and electrochemical properties of ZnO and graphene oxide blended ZnO nanocomposites, Ceramics International 49 (2023) 7284-7288. [CrossRef]
  11. R. Suganya, A. Revathi, D. Sudha, V. Sivaprakash, E.R. Kumar, Evaluation of structural, optical properties and photocatalytic activity of Ag2O coated ZnO nanoparticles, Journal of Materials Science: Materials in Electronics 33 (2022) 23224-23235. [CrossRef]
  12. Z.M. Almarhoon, T. Indumathi, E.R. Kumar, Optimized green synthesis of ZnO nanoparticles: evaluation of structural, morphological, vibrational and optical properties, Journal of Materials Science: Materials in Electronics 33 (2022) 23659-23672. [CrossRef]
  13. B. Ranjithkumar, E.R. Kumar, M. Srinivas, H. Ramalingam, C. Srinivas, G. Magesh, A. Balamurugan, C.S. Rahale, B. ChandarShekar, Evaluation of structural, surface morphological and thermal properties of Ag-doped ZnO nanoparticles for antimicrobial activities, Physica E: Low-dimensional Systems and Nanostructures 133 (2021) 114801. [CrossRef]
  14. J. Sahu, S. Kumar, V. Vats, P. Alvi, B. Dalela, S. Kumar, S. Dalela, Lattice defects and oxygen vacancies formulated ferromagnetic, luminescence, structural properties and band-gap tuning in Nd3+ substituted ZnO nanoparticles, Journal of Luminescence 243 (2022) 118673. [CrossRef]
  15. T. Indumathi, C. Theivarasu, I. Pradeep, M.T. Rani, G. Magesh, C.S. Rahale, E.R. Kumar, Effects of Nd doping on structural, optical, morphological and surface-chemical state analysis of ZnO nanoparticles for antimicrobial and anticancer activities, Surfaces and Interfaces 23 (2021) 101000. [CrossRef]
  16. S.C.C. Arruda, A.L.D. Silva, R.M. Galazzi, R.A. Azevedo, M.A.Z. Arruda, Nanoparticles applied to plant science: a review, Talanta 131 (2015) 693-705. [CrossRef]
  17. A. Ali, A.-R. Phull, M. Zia, Elemental zinc to zinc nanoparticles: Is ZnO NPs crucial for life? Synthesis, toxicological, and environmental concerns, Nanotechnology Reviews 7 (2018) 413-441. [CrossRef]
  18. A.B. Djurišić, X. Chen, Y.H. Leung, A.M.C. Ng, ZnO nanostructures: growth, properties and applications, Journal of Materials Chemistry 22 (2012) 6526-6535. [CrossRef]
  19. G. Magesh, G. Bhoopathi, A. Arun, E.R. Kumar, C. Srinivas, S. Sathiyaraj, Study of structural, morphological, optical and biomedical properties of pH based ZnO nanostructures, Superlattices and Microstructures 124 (2018) 41-51. [CrossRef]
  20. R. Mahdavi, S.S.A. Talesh, The effect of ultrasonic irradiation on the structure, morphology and photocatalytic performance of ZnO nanoparticles by sol-gel method, Ultrasonics Sonochemistry 39 (2017) 504-510. [CrossRef]
  21. H.F. Etefa, D.J. Nemera, F.B. Dejene, Green Synthesis of Nickel Oxide NPs Incorporating Carbon Dots for Antimicrobial Activities, ACS omega 8 (2023) 38418-38425. [CrossRef]
  22. V. Kumar, H.F. Etefa, L.T. Jule, H.C. Swart, Mechanism, properties and applications of phosphors, Phosphor Handbook, Elsevier, 2023, pp. 33-45. [CrossRef]
  23. V. Kumar, H.F. Etefa, M.T. Efa, L.T. Jule, Hybrid 1D Semiconducting ZnO and GaN Nanostructures for Light-Emitting Devices, 1D Semiconducting Hybrid Nanostructures: Synthesis and Applications in Gas Sensing and Optoelectronics (2023) 205-216. [CrossRef]
  24. H.F. Etefa, V. Kumar, F.B. Dejene, M.T. Efa, L.T. Jule, Modification of Flexible Electrodes for P-Type (Nickel Oxide) Dye-Sensitized Solar Cell Performance Based on the Cellulose Nanofiber Film, ACS omega 8 (2023) 15249-15258. [CrossRef]
  25. A. Umar, R. Kumar, G. Kumar, H. Algarni, S. Kim, Effect of annealing temperature on the properties and photocatalytic efficiencies of ZnO nanoparticles, Journal of Alloys and Compounds 648 (2015) 46-52. [CrossRef]
  26. ] S. Azizi, R. Mohamad, A. Bahadoran, S. Bayat, R.A. Rahim, A. Ariff, W.Z. Saad, Effect of annealing temperature on antimicrobial and structural properties of bio-synthesized zinc oxide nanoparticles using flower extract of Anchusa italica, Journal of Photochemistry and Photobiology B: Biology 161 (2016) 441-449. [CrossRef]
  27. D.J. Nemera, H.F. Etefa, V. Kumar, F.B. Dejene, Hybridization of nickel oxide nanoparticles with carbon dots and its application for antibacterial activities, Luminescence 37 (2022) 965-970. [CrossRef]
  28. K. Thangavel, A. Balamurugan, T. Venkatachalam, E.R. Kumar, Structural, morphological and optical properties of ZnO nano-fibers, Superlattices and Microstructures 90 (2016) 45-52. [CrossRef]
  29. D.A.M. Osman, M.A. Mustafa, Synthesis and characterization of zinc oxide nanoparticles using zinc acetate dihydrate and sodium hydroxide, J. Nanosci. Nanoeng 1 (2015) 248-251. Available online: http://creativecommons.org/licenses/by-nc/4.0/.
  30. A. Rahman, M.H. Harunsani, A.L. Tan, M.M. Khan, Zinc oxide and zinc oxide-based nanostructures: biogenic and phytogenic synthesis, properties and applications, Bioprocess and Biosystems Engineering 44 (2021) 1333-1372. [CrossRef]
  31. V. Sabaghi, F. Davar, P. Rashidi-Ranjbar, A. Abdi, Synthesis and evaluation of pH-responsive mesoporous ZnO/PEG/DOX nanocomposite based on Zn-HKUST-1 MOF nanostructure for targeted drug delivery, Journal of Porous Materials 30 (2023) 201-209. [CrossRef]
  32. P. Rajiv, S. Rajeshwari, R. Venckatesh, Bio-Fabrication of zinc oxide nanoparticles using leaf extract of Parthenium hysterophorus L. and its size-dependent antifungal activity against plant fungal pathogens, Spectrochimica Acta Part A: Molecular and Biomolecular Spectroscopy 112 (2013) 384-387. [CrossRef]
  33. A.K.Q. Nguyen, T.T. Huynh, V.T.T. Ho, Preparation and characterization of indium doped tin oxide (ITO) via a non-aqueous sol-gel, Molecular Crystals and Liquid Crystals 635 (2016) 32-39. [CrossRef]
  34. A. Rasool, M. Santhosh Kumar, M. Mamat, C. Gopalakrishnan, R. Amiruddin, Analysis on different detection mechanisms involved in ZnO-based photodetector and photodiodes, Journal of Materials Science: Materials in Electronics 31 (2020) 7100-7113. [CrossRef]
  35. L. Saikia, D. Bhuyan, M. Saikia, B. Malakar, D.K. Dutta, P. Sengupta, Photocatalytic performance of ZnO nanomaterials for self sensitized degradation of malachite green dye under solar light, Applied Catalysis A: General 490 (2015) 42-49. [CrossRef]
  36. N. Li, T. Stubhan, N.A. Luechinger, S.C. Halim, G.J. Matt, T. Ameri, C.J. Brabec, Inverted structure organic photovoltaic devices employing a low temperature solution processed WO3 anode buffer layer, Organic Electronics 13 (2012) 2479-2484. [CrossRef]
  37. S. Padmanathan, A. Prakasam, Incorporation of carbon dots on the ZnO Nanosheets as metal–organic framework Photoanodes for high efficient dye sensitized solar cell applications, Journal of Cluster Science 32 (2021) 795-804. [CrossRef]
  38. X. Atanacio-Sánchez, W. Pech-Rodríguez, E. Armendáriz-Mireles, J. Castillo-Robles, P. Meléndez-González, E. Rocha-Rangel, Improving performance of ZnO flexible dye sensitized solar cell by incorporation of graphene oxide, Microsystem Technologies (2020) 1-9. [CrossRef]
  39. C. Bonilha, J.o.E. Benedetti, A.F. Nogueira, A. de Souza Gonçalves, Transparent conducting oxide-free dye-sensitized solar cells based solely on flexible foils, Industrial & engineering chemistry research 51 (2012) 9700-9703. [CrossRef]
  40. H. Abdullah, S. Mahalingam, K.J. Xian, A. Manap, M.H.D. Othman, M. Akhtaruzzaman, Impedance analysis of charge transfer upon nickel doping in Tio 2-based flexible dye-sensitized solar cell, Polymer Bulletin (2020) 1-14. [CrossRef]
  41. L. Zhang, A. Konno, Development of flexible dye-sensitized solar cell based on predyed zinc oxide nanoparticle, Int. J. Electrochem. Sci 13 (2018) 344-352. [CrossRef]
  42. G.F. Gemeda, H.F. Etefa, C.-C. Hsieh, M.A. Kebede, T. Imae, Y.-W. Yen, Preparation of ZnO/NiO-loaded flexible cellulose nanofiber film electrodes and their application to dye-sensitized solar cells, Carbohydrate Polymer Technologies and Applications 3 (2022) 100213. [CrossRef]
  43. M.T. Efa, T. Imae, Effects of carbon dots on ZnO nanoparticle-based dye-sensitized solar cells, Electrochimica Acta 303 (2019) 204-210. [CrossRef]
  44. M. Kumari, V.S. Kundu, S. Kumar, S. Siwatch, N. Chauhan, Nitrogen and silver codoped one-dimensional ZnO nanostructure for optoelectronic application, Journal of Sol-Gel Science and Technology 93 (2020) 302-308. [CrossRef]
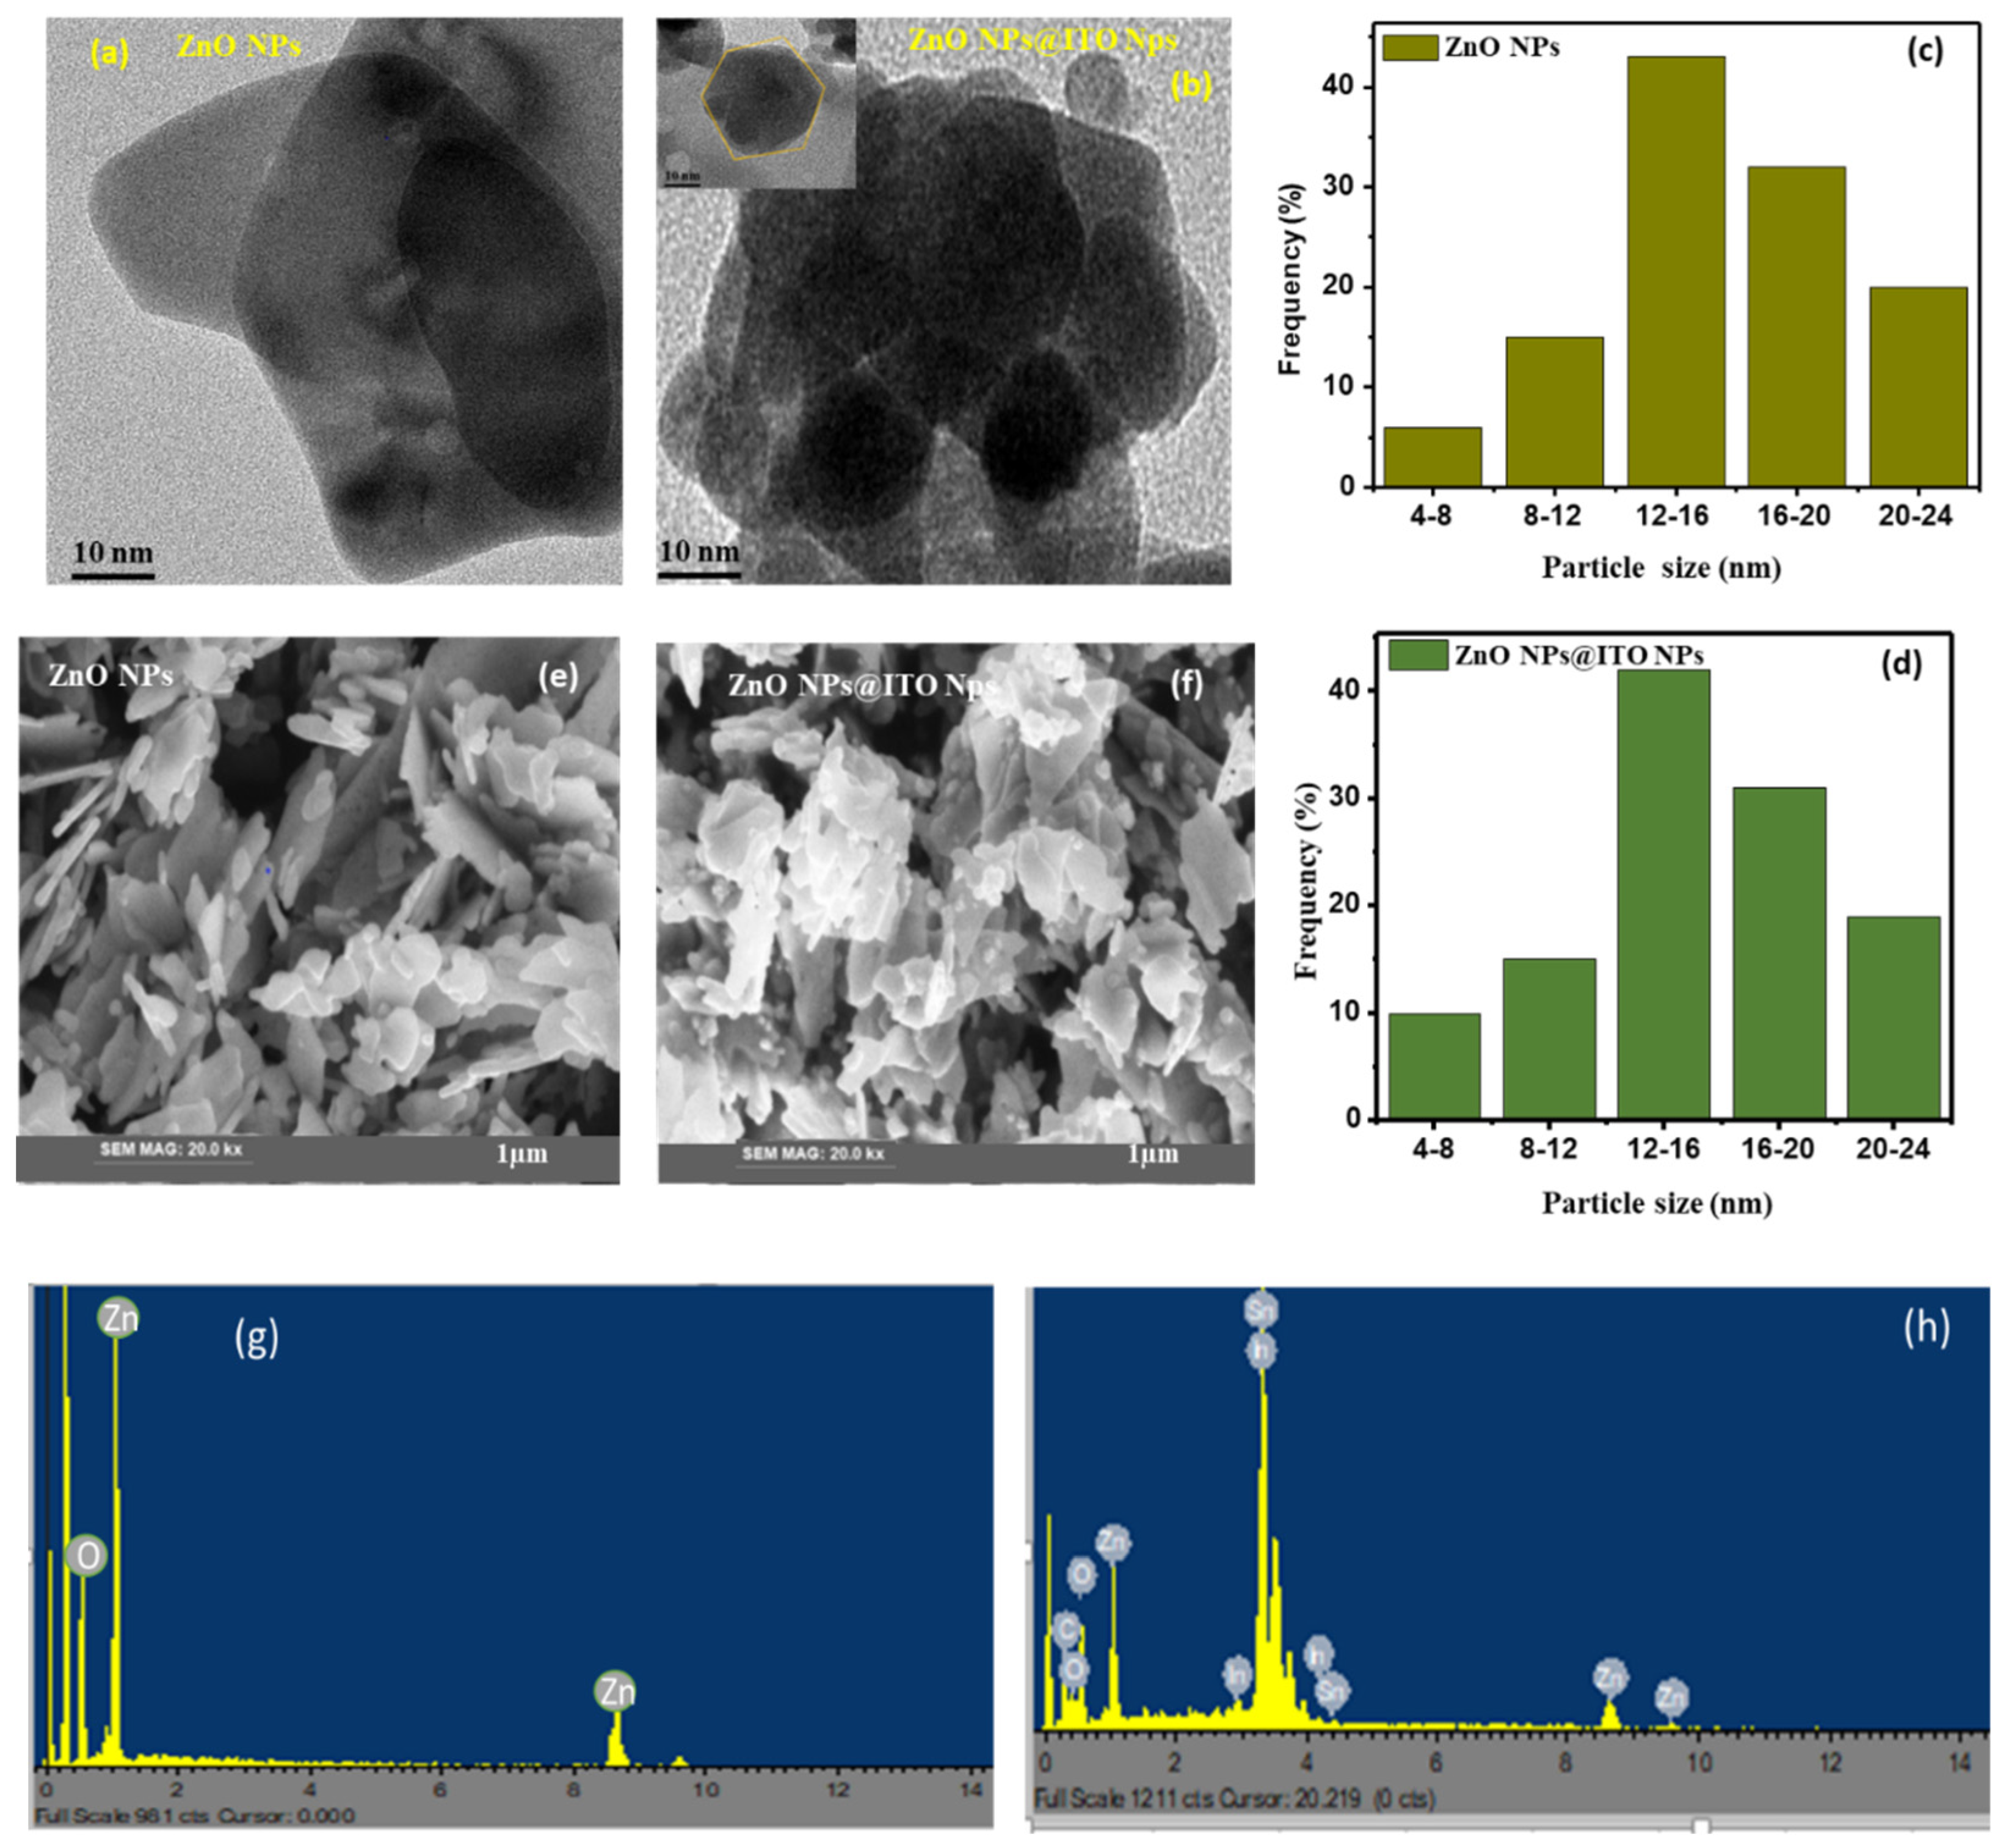
Figure 1. TEM image of (A) (a) ZnO NPs and (b) ZnO NPs@ITO NPs, SEM image of ) (c) ZnO NPs and (d) ZnO NPs@ITO NPs (e) size distribution histograms of ZnO NPs (f) size distribution histograms of ZnO NPs@ITO NPs (g) EDS of ZnO NPs (h) EDS of ZnO NPs@ITO NPs.
Preprints 107440 g001
Figure 2. XRD of (a) ZnO NPs at different temperature (b) ZnO NPs@ITO NPs at different doped mass of ITO NPs.
Preprints 107440 g002
Figure 3. Uv-Vis of (A) ZnO NPs at different temperature (B) ZnO NPs (4500C) at different doped mass of ITO NPs (C) Band gap of ZnO NPs at different temperature (D) Correlation of Band gap and temperature (E) Band gap of ZnO NPs at different doped mass of ITO NPs (F) Correlation of Band gap and mass doped.
Preprints 107440 g003
Figure 4. Room Temperature Photoluminescence (PL) spectra of ZnO NPs at different annealing temperature.
Preprints 107440 g004
Figure 5. Low-temperature Photoluminescence (PL) spectra of ZnO NPs/ITO NPs at 4500C annealing temperature.
Preprints 107440 g005
Figure 6. I-V performance of (A) (a) ZnO NPs (b) ZnO NPs/ITO NPs (5 wt %) (c) ZnO NPs/ITO NPs (15 wt %) (d) ZnO NPs/ITO NPs (10 wt %) (B) I-V parameters calculated.
Preprints 107440 g006
Table 1. EDS (elemental composition Wt % and At %) and band gap of ZnO NPs, ZnO NPs/ITO NPs.
Materials Elementa Wt% At%
ZnO Zn 59.99 63.24
O 48.01 36.76
ZnO/ITO Zn 34.19 37.25
O 29.14 21.23
Sn 5.15 13.51
In 30.02 26.20
C 1.5 1.81
Materials Annealing temperature Band gap(eV)
ZnO NPs 300 0C 3.24
350 0C 3.22
400 0C 3.09
450 0C 3.01
500 0C 3.12
ZnO NPs at different
wt % ITO NPs
At 450 0C
5 wt% 2.96
10 wt% 2.88
15 wt% 2.94
Table 2. XRD diffraction peaks values and d-spacing corresponding to its indices, of the ZnO NP obtained by the Sol-gel synthesis at the different annealing temperatures.
(A) ZnO NPs (d-spacing, indices, and 2theta) at the different annealing temperatures
300oC d-(Ȧ) 2.811 2.551 2.465 1.923 1.642 1.467 1.430 1.373 1.362
hkl 100 002 101 102 110 103 200 112 201
2θ(0) 31.72 34.44 36.25 47.55 56.51 62.85 66.34 67.87 69.02
350oC d-(Ȧ) 2.831 2.622 2.456 1.931 1.621 1.466 1.421 1.372 1.363
hkl 100 002 101 102 110 103 200 112 201
2θ(0) 31.74 34.45 36.24 47.54 56.56 62.85 66.33 67.88 69.06
400oC d-(Ȧ) 2.822 2.630 2.448 1.940 1.651 1.471 1.450 1.376 1.365
hkl 100 002 101 102 110 103 200 112 201
2θ(0) 31.71 34.48 36.27 47.56 56.55 62.84 66.42 67.83 69.12
450oC d-(Ȧ) 2.821 2.612 2.466 1.921 1.640 1.468 1.420 1.374 1.361
hkl 100 002 101 102 110 103 200 112 201
2θ(0) 31.73 34.42 36.26 47.53 56.53 62.87 66.35 67.86 69.04
500oC d-(Ȧ) 2.801 2.60 2.460 1.925 1.646 1.462 1.421 1.375 1.357
hkl 100 002 101 102 110 103 200 112 201
2θ(0) 31.69 34.38 36.27 47.60 56.55 62.82 66.41 67.91 69.30
ITO NPs d-(Ȧ) 4.079 2.906 2.511 2.372 2.139 1.969 1.777 1.633 1.551 1.519
hkl 211 222 400 411 332 431 440 433 611 622
2θ(0) 21.77 30.74 35.72 37.90 42.21 46.04 51.35 56.27 59.55 60.92
(B) ZnO NPs/ITO NPs (d-spacing, indices and 2theta)
ZnO NPs/
ITO NPs
d-(Ȧ) 4.124 2.924 2.820 2.607 2.473 2.387 2.156 1.981 1.906 1.786
hkl 211 222 100 002 101 411 332 431 102 440
2θ(0) 21.53 30.54 31.70 34.37 36.29 37.65 41.86 45.76 47.67 51.09
d-(Ȧ) 1.623 1.525 1.474 1.402 1.376 1.355
hkl 110 622 103 200 112 201
2θ(0) 56.66 60.65 62.98 66.65 68.04 69.28
Table 3. The I-V performance of ZnO NP@ITO NP based on the FDSSC substrate as the photocathode at different Wt% of ITO NPs deposited on ZnO NPs.
D/t Wt% of ITO NPs deposited on ZnO NPs Isc(mAcm-2) Vov(V) FF η% N719 adsorption (mg/mg)
0 7.65±0.13 0.395±0.0 0.291±0.03 2.198±0.14 0.232
5% 9.500±0.02 0.450±0.04 0.294±0.04 3.142±0.04 0.3281
10 wt% 11.420±0.14 0.52±0.0 0.450±0.02 6.680±0.12 0.431
15 wt% 10.610±0.02 0.4930±0.0 0.312±0.03 4.079±0.03 0.391
Table 4. Evaluation of the PCE effectiveness of flexible electrodes constructed of different materials for DSSCs with regards to substrates that are commercial and noncommercial.
Materials WE CE Method PCE (%) Reference
Zn2SnO4 StSta/Zn2SnO4 nanoparticle Pt-foil calcination 0.55 [36]
Polymer dye A (conc.) + ZnO ITO/Glass carbondust flamed/ITO glass doctor blade 3.5 [37]
ZnO ZnO/PET Graphite electrophoretic deposition 0.4499 [38]
TNPs
(TiO2)85-Ni15
StSta/TNPs
ITO/PET
StSt/Pt
Pt
deposition
Sol-gel
1.34
0.92
[39]
[40]
ZnO PET Graphite calcination 0.45 [41]
ZnONP@Cdot ZnONW/Cdot/TOCNF Pt-PPy/TOCNF 1.34 [42]
ZnO@C-dots ITO/PET Pt/FTO doctor blade 5.81 [37]
ZnO ITO/PET Pt/FTO doctor blade 2.45 [37]
ZnO NP ITO/glass Pt/glass Sola-gel 2.90 [43]
ZnO NP@C-dots ITO/glass Pt/glass Sola-gel 5.92 [43]
NiO/C-dots TOCNF/PPY Ni(OH)2/TOCNF deposition 1.3 [24]
ZnO S5-ZnO/ITO/glass Pt/ITO /glass Spin Caoting 5.105 [44]
ZnO NPs ZnO NPs /PET Pt /PET Spin coating 2.198 This work
ZnO NPs/ITO NPs ZnO NPs/ITO NPs /PET Pt /PET Spin Coating 6.680 This work
Disclaimer/Publisher’s Note: The statements, opinions and data contained in all publications are solely those of the individual author(s) and contributor(s) and not of MDPI and/or the editor(s). MDPI and/or the editor(s) disclaim responsibility for any injury to people or property resulting from any ideas, methods, instructions or products referred to in the content.
Copyright: This open access article is published under a Creative Commons CC BY 4.0 license, which permit the free download, distribution, and reuse, provided that the author and preprint are cited in any reuse.
Prerpints.org logo

Preprints.org is a free preprint server supported by MDPI in Basel, Switzerland.

Subscribe

© 2024 MDPI (Basel, Switzerland) unless otherwise stated