Preprint
Article

FCM-DETR: An Efficient End-to-End Fire Smoke and Human Detection based on Deformable DETR

Altmetrics

Downloads

182

Views

88

Comments

0

A peer-reviewed article of this preprint also exists.

This version is not peer-reviewed

Submitted:

27 May 2024

Posted:

28 May 2024

You are already at the latest version

Alerts
Abstract
Fire is a serious security threat that can lead to casualties, property damage, and environmental damage. However, despite the availability of object detection algorithms, challenges persist in detecting fires and smoke. These challenges include slow convergence speed, poor performance in detecting small targets, and high computational cost limiting deployments. In this paper, Fire smoke and human detection based on ConvNeXt and Mixed encoder (FCM-DETR), an end-to-end object detection algorithm based on Deformable DETR, is proposed. Firstly, we introduce ConvNeXt to take the place of Resnet, which greatly reduces the amount of computation and improves the ability to extract irregular flame features. Secondly, to effectively process multi-scale features, the original encoder is decoupled into two modules. Then Mixed encoder, an innovative encoder structure, is proposed, resulting in excellent performance of multi-scale fire and smoke features fusion. What can’t be overlooked is that the encoder block is compatible with any DETR-based models. Finally, the convergence speed is accelerated and the mean of average precision is improved by applying a novel loss function called Powerful IoU v2. The experimental results indicate that our model achieves the best detection accuracy compared to other models, with mAP reaching 66.7%, mAPs and Accuracyfire achieving impressive 50.2% and 98.05%, respectively.
Keywords: 
Subject: Computer Science and Mathematics  -   Computer Vision and Graphics

1. Introduction

Accidental fires in our daily lives can cause harm to personal and property safety. According to the National Fire Protection Association, in 2022, the US fire department responded to estimated 1.5 million fires, which resulted in 3,790 civilian deaths, 13250 civilian injuries, and an estimated $18 billion in property damage [1]. At the same time, the damage caused by fires to the natural environment cannot be ignored. In 2023, Canada’s wildfires burn total surpassed 156,000 square kilometers, exceeding the benchmark established in 1995. The record blaze released airborne pollutants and greenhouse gases, contributing significantly to climate alteration [2]. After a fire breaks out, time is crucial. Timely detection of a fire and victims can effectively reduce its harm. Traditional fire alarm systems, such as photoionization smoke detectors, infrared thermal imagers, flame gas sensors, and smoke gas sensors, have drawbacks such as delayed response time and restricted sensor density. Especially in open spaces, airflow and other conditions may impede accurate detection [3].
Early visualization-based systems for detecting fire and smoke involved techniques such as color detection, moving object detection, motion and flicker analysis using Fourier and wavelet transforms, among others [4]. B. Uğur Töreyin et al. based on color and motion analysis, implemented a real-time fire and flame detection method by conducting ripple domain analysis on flames and flame flicker in video data [5]. P. V. Koerich Borgesf et al. achieved fire detection by evaluating inter-frame variations of features such as color, area size, and texture in potential fire zones, and combining Bayesian classifiers [6]. Yusuf Hakan Habiboğlu et al. proposed a flame detection system using a spatiotemporal covariance matrix of video data, which effectively captured the flickering and irregular characteristics of flames by dividing the video into spatiotemporal blocks and calculating the covariance features extracted from these blocks [7]. Although numerous physical and mathematical methods have been used to extract features like color, texture, and flicker frequency contour of fire and smoke, these early methods have limited feature representation capability due to their manually designed feature extractors. In addition, they showed poor adaptability to complex scene changes, dynamic backgrounds, and lighting modifications, leading to high missed detection rates and weak generalization ability [8].
With the rapid development and increasing maturity of neural networks, Convolutional Neural Networks (CNNs) have distinguished themselves in the field of computer vision due to their capacity for extracting rich and discriminative features from extensive data [8,9,10], attracting attention from massive researchers. Object detection algorithms based on CNN are progressively applied for fire and smoke detection [3,8,9,10,11]. According to the different processing procedures and structures, they can be roughly divided into two categories: one-stage algorithms and two-stage algorithms. One-stage methods directly estimate target location and category from input images, eliminating the need for detecting potential target regions beforehand. These algorithms operate by dividing the image into grids, generating diverse bounding boxes based on anchor points in each grid, and employing non-maximum suppression (NMS) to eliminate redundant and overlapped bounding boxes. The representative of one-stage algorithms is the YOLO series [12,13,14,15,16,17,18]. Two-stage algorithms complete object detection tasks through two main stages: candidate box generation and object detection. Initially, by utilizing a component called candidate box generators (like Selective Search [19] or Region Proposal Network [21]), potential target-containing candidate boxes are produced in the input image. Then, these candidate boxes undergo filtering and feature extraction using NMS, followed by classification and regression within classification and regression heads. Algorithms such as Faster R-CNN [20], Faster R-CNN [21], Cascade RCNN [22] and Sparse R-CNN [23] exemplify this category. Although two-stage algorithms exhibit superior accuracy relative to one-stage methods, they often have higher hardware requirements due to their high computational complexity and are challenging to meet real-time requirements [24].
A novel detection method, DETR, has recently emerged for object detection, achieving excellent results comparable to the mature Faster R-CNN on the COCO dataset [25]. Inspired by the transformer, this technology was initially adopted in fields like natural language processing and speech recognition, showcasing substantial advancements. Subsequently, it was introduced to the field of computer vision. DETR firstly enables end-to-end object detection, meaning it directly predicts the bounding box coordinates and class labels without relying on anchor boxes or region proposal techniques. This simplifies the object detection pipeline and eliminates the need for complex components like NMS, anchor generation, and anchor matching. The end-to-end nature of DETR makes it more efficient and easier to implement compared to traditional algorithms. Zhu, X. et al. have made improvements to DETR and proposed a new model called Deformable DETR. Compared with DETR, Deformable DETR has better detection performance, lower computational complexity, and faster convergence. It’s worth noting that Deformable DETR performs exceptionally well in detecting small target objects [26]. In the early stages of a fire, smoke and fire tend to be concentrated in a small area [27]. The advantage of Deformable DETR in detecting small objects is helpful in the timely detection of small flames and smoke, which can prevent the fire from spreading. Additionally, Deformable DETR introduces the concept of Deformable Convolution [28], which selects only a few points near the reference point as k in self-attention calculation. This approach not only speeds up the convergence of the model but also improves its computational efficiency, allowing it to detect irregular flames and smoke more effectively.
However, using Deformable DETR for object detection still faces substantial challenges. Even though Deformable DETR shows excellent prediction accuracy on the COCO dataset, its huge amount of computation and slow inference time are significant disadvantages that cannot be neglected. This makes it difficult to deploy the model on resource-constrained devices and meet the requirements of real-time detection. To address these issues, several improvements have been made to the model. First and foremost, the original ResNet is replaced by an advanced ConvNeXt, improving the network’s ability to extract complex features related to fire and smoke. Considering the high computational complexity of the encoder part of Deformable DETR, it is not conducive to deploying the model to resource-constrained detection devices. Some improvements are made to the encoder part, simplifying its structure and enhancing the detection accuracy. Third, the use of GIoU in Deformable DETR limits the convergence speed and detection accuracy, thereby PIoU v2 is introduced as a new loss function. Finally, we innovatively use human as the detection target, which will help firefighters develop response strategies to assist victims in fires. Our contributions can be summarized in the following several points:
(1)
In response to complex and dynamic fire environments, ConvNeXt is applied as a backbone to enhance algorithm’s ability to extract features of different scales.
(2)
While introducing CCFM, SSFI is proposed. The combination of these modules forms the Mixed encoder, which improves detection accuracy and greatly reduces the amount of computation.
(3)
The loss function is modified to PIoU v2, which solves the slow convergence issue and improves the model’s stability in complex fire scenarios.
(4)
Human is considered as a detection class, which helps firefighters identify potential victims in fires and improve the practical value of the model.
This paper is structured as follows. In Section 2, we review related works and discussed their strengths and limitations. Section 3 details the overall architecture and improvement methods of our proposed model. Section 4 introduces the experimental setup, including the dataset used, evaluation methods, and experimental environment. In Section 5, to demonstrate the detection performance and characteristics of our model, visual examples, qualitative analysis, and comparison with other methods are provided. Particularly in Section 5.3, we conduct a series of ablation experiments to explore the impact of different components and design choices of the proposed model on its performance. Section 6 summarizes the entire study and provides prospects for future work.

2. Related Works

In recent years, there have been significant advancements in the field of object detection. We will now introduce the relevant work based on the different algorithms used in fire and smoke detection.
One-stage algorithms: Given the fast inference speed and low hardware requirements of one-stage algorithms, most fire and smoke detection tasks prefer this type of algorithm. Lei Zhao et al. proposed the Fire YOLO model, an adaptation of YOLO-V3 that incorporates the EfficientNet technique and mobile inverted bottleneck convolution (MBConv) to boost the sensitivity of the feature extraction network and enhance the detection efficiency of small targets [24]. Xin Geng et al. proposed an improved fire and smoke target detection algorithm called YOLOFM based on YOLO-V5. Using technologies like FocalNext network, QAHARp-FPN, NADH, and Focal SIoU Loss, the accuracy and recall of the baseline network were improved, resulting in a more reliable and precise solution for fire and smoke detection tasks [29]. Hu et al. proposed a new model called MVMNet, which is based on YOLO-v5 and employs a novel detection method called multioriented detection. During the data training process, a parameter describing the angle was added to solve the problems of tilted smoke and misdetection of similar objects in forest fire smoke detection. At the same time, the SPP module in YOLO-v5 was replaced by the Soft-SPP module, and a value conversion attention mechanism module (VAM) was created to specifically extract smoke color and texture. Finally, a mixed non-maximum suppression method comprising DIoU-NMS and Sketch NMS was employed to address false alarms and missed detections in smoke detection [27]. Gong Chen et al. proposed a lightweight forest fire smoke detection model based on YOLOv7. Firstly, Ghost Shuffle Convolution (GSConv) was used to replace standard convolution to reduce the model size and improve deployment on edge devices. Then, coordinate attention (CA) was embedded in the backbone to improve its ability to extract smoke information and reduce background interference. Then, Content-Aware Reassembly of Features (CARAFE) substitutes the nearest neighbor interpolation upsampling in YOLO-v7, expanding the receptivity of the feature fusion network. Finally, the SIoU loss function is employed [30]. Although one-stage algorithms are simple, fast, and can achieve real-time object detection, their detection accuracy is still not as good as some two-stage algorithms [31]. Meanwhile, the YOLO series is not ideal for detecting small target objects [32], making it naturally disadvantageous in detecting early fire characteristics.
Two-stage algorithms: P Barmpoutis et al. introduced a fire detection approach integrating deep learning networks and linear dynamic systems (LDS) for multi-dimensional texture analysis. Initially, the Faster R-CNN network detects potential fire regions within the image. The regions are then projected onto the Grassmannian space. A vector of indigenous aggregated descriptors (VLAD) is used to group Grassmannian points based on local standards on the manifold. Finally, SVM is applied to categorize the results [33]. Chaoxia et al. advanced the anchor formulation strategy of Faster R-CNN using the color-guided anchoring strategy, while simultaneously constructing a Global Information Network (GIN) to obtain global image information, enhancing the efficiency and accuracy of flame detection [34]. Pan J et al. used a knowledge distillation process to make Faster R-CNN lightweight and proposed a weakly supervised fine-segmentation method for detection and classification. A fuzzy system was introduced to construct a fire and smoke rating framework [31]. Nevertheless, mainstream two-staged methods show low accuracy in small object detection [32]. More critically, anchor-based methods like Faster RCNN face challenges in locating objects with diverse shapes [35], which is a drawback for detecting amorphous fire and smoke.
DETR-based algorithms: One-stage and two-stage algorithms are anchor-based methods. According to recent research, the detection performance of anchor-based algorithms depends to some extent on the initial value of the set number of anchors [36]. Both too many and too few anchors can lead to poor results, and excessive anchors can also increase computational complexity. Unfortunately, these algorithms use NMS during the detection process, rather than all edge devices supporting NMS (such as edge computing devices that only support integer operations) [37]. In order to solve the above problems and abandon manual intervention and the application of prior knowledge, researchers have begun to turn their attention to transformer-based DETR. Li, Y. et al. applied lightweight DETR in fire and smoke detection, reducing the number of encoder layers and incorporating a multi-scale deformable attention mechanism. They also used ResNeXt50 as the backbone and added the normalization-based attention module (NAM) to improve the model’s feature extraction ability [39]. Mardani, K. et al. simplified DETR by removing unnecessary components such as binary matching and bounding box heads, and added masked or linear layers composed of Multi-head attention layers to complete different tasks, achieving optimal accuracy performance on specified datasets [38]. Huang, J. et al. used Deformable DETR as the baseline and combined Multi-scale Context Controlled Local Feature Module (MCCL) and Dense Pyramid Pooling Module (DPPM) to improve the ability of small smoke detection [40].
Recent improvements to DETR have mainly focused on improving the decoder section. For instance, Conditional DETR decouples the cross-attention function of the DETR decoder and proposes conditional spatial embedding, which accelerates the model’s convergence speed [41]. DAB-DETR uses dynamically updated box coordinates as queries in the decoder, achieving the goal of improving model accuracy and convergence speed [42]. New research indicates that low-scale features account for 75% of all tokens in the encoder, but they make a small contribution to the overall detection accuracy [43]. Therefore, we focus on improving the rarely studied encoder block in this article. Compared with the baseline, Deformable DETR, we reduce the number of encoder layers from 6 to 2, decreasing the computational complexity. Simultaneously, Separate Self-Attention and CCFM are employed to substitute the Multi-scale Deformable Attention function in the encoder block. Finally, we replaced the backbone with ConvNeXt, a more advanced architecture with stronger feature extraction capabilities than the traditional Resnet. Overall, the result is a model with good performance and reduced computational burden.

3. Methodology

3.1. Overall Architecture of FCM-DETR
FCM-DETR is a transformer-based fire and smoke detection algorithm. As shown in Figure 1, FCM-DETR shares a similar network structure with DETR, comprising three main components: a backbone for feature extraction, an encoder-decoder transformer, and a feed-forward network (FFN). Upon entering the model, the image undergoes initial feature extraction via the backbone, followed by advanced feature extraction via our proposed Mixed Encoder. The Mixed Encoder module consists of a Separate Single-scale Feature Interaction Module (SSFI) and a CNN-based Cross-scale Feature Fusion Module (CCFM), designed to progressively extract and encode feature information through stacked encoder layers, capturing semantic information across various scales and levels. The encoded features are then fed into the decoder layers, using two attention mechanisms, Multi-head attention [44] and Multi-scale deformable attention [26], to iteratively extract contextually relevant information related to the target position and category. The final component of FCM-DETR is the FFN, which outputs a set of predicted boxes and corresponding category probabilities. In the following sections, a detailed explanation of the structure of FCM-DETR is provided.
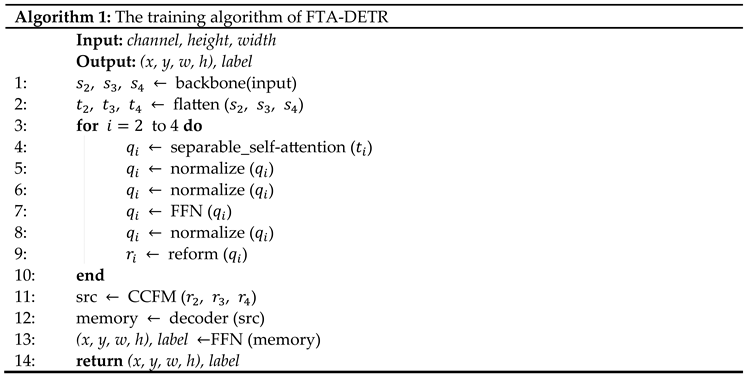
When an image is input into FCM-DETR, the features extracted through different stages of the backbone will be flattened and sequentially entered into SSFI and CCFM. Then, results of the decoder will be fed into FFN, which is composed of several fully connected layers and ReLU activation functions. The final output is the center coordinates, width and height of the bounding box. Category labels are predicted using the softmax function. Here is the training process of the algorithm.
Preprints 107596 i001

3.2. ConvNeXt Backbone

ResNet [45] has been widely used as the backbone for various image recognition models due to its exceptional performance. Recently, Liu et al. have introduced an improved version of ResNet, called ConvNeXt [47], after analyzing the structure of Swin Transformer. The modifications made in ConvNeXt are divided into two levels: macro and micro.
In terms of macro design, ConvNeXt changed the stacking times of blocks in each stage to 1:1:3:1 and replaced the stem cells in ResNet with the same patchy layer as Swin Transformer. Additionally, ConvNeXt introduced the concept of group convolution and expanded the basic number of channels. By dividing the input feature map into multiple subgroups and performing independent convolution operations on each subgroup, the features of different subgroups were fused. This strategy allows the backbone to better model multi-scale features, helping to capture different scale features of targets like fire and smoke. Subsequently, ConvNeXt adopted the Inverted Bottleneck module to effectively avoid information loss in the feature extraction process. Finally, a larger convolution kernel was selected to obtain a wider receptive field, thus improving the ability to perceive global and larger-scale features.
In terms of micro design, ConvNeXt changed the activation functions ReLU and Batch Normalization (BN) to GELU and Layer Normalization (LN), while reducing the number of activation functions and normalization layers. In ResNet, 1 × 1 or 3 × 3 convolutions with a stride of 2 are commonly used for downsampling, whereas ConvNeXt replaces them with 2 × 2 convolutions. Moreover, ConvNeXt adds a LN before and after downsampling to maintain model stability. After the above improvements, ConvNeXt maintains the simplicity of ConvNeXt while having faster inference speed and more outstanding practical performance than the Swin Transformer. Fire and smoke are diverse, with varied flame colors resulting from different fire sources. The size of a fire can also affects the transparency of smoke, while scene variances such as interference, concealment, and lighting conditions can heighten recognition. Most network structures overlook this point. ConvNeXt increased the base channel count from 64 to 96. More channels enable the model to better extract and represent abstract features in fire and smoke, identify complex fire scenarios, and enhance the accuracy and robustness of fire and smoke detection tasks. From the above improvements, it can be seen that ConvNeXt has a natural advantage in fire and smoke detection tasks. Designing a network based on the characteristics of the detected object can often achieve excellent results. Therefore, in response to the irregular shape and transparency of flames and smoke in the actual detection process, we propose FCM-DETR, an adaptation of Deformable DETR.

3.3. Mixed Encoder

When analyzing the structure of Deformable DETR, it is apparent that the encoder component plays two roles: implementing Deformable attention and feature fusion. This opinion is supported by the experiment of adding FPN without effect [26]. The dual role inherently leads to inadequate performance in both tasks. Our solution is the Mixed encoder that decouples the original encoder into two modules: Separate Single-scale Feature Interaction (SSFI) and CNN-based Cross-scale Feature Fusion Module (CCFM). They perform self-attention and multi-scale feature fusion respectively.

3.3.1. Separable Single-Scale Feature Interaction

In order to prevent feature fusion from occurring in the encoder, we have developed an enhanced encoder called SSFI. The process of SSFI is illustrated in Figure 2. Typically, the original Deformable DETR would flatten and concatenate features from various scales before the encoder to form a token, and then work alongside Multi-Scale Deformable Attention to standardize the reference points of features from different scales, resulting in the fusion of features from different scales. To avoid this kind of feature merging during the encoder stage, we flatten the features at different scales and feed them directly into the encoder without concatenating them. This approach makes it easier to recover tokens later. In addition, given that fire and smoke detection models are usually deployed on hardware with limited resources, a streamlined method is specifically adopted for feature interaction at the same scale. Separate self-attention [48] is chosen by us to replace Multi-scale Deformable Attention [26] in DETR. As an efficient variant of the self-attention mechanism, Separate self-attention has the characteristics of low time complexity and latency compared to Multi-head attention in DETR [44], making it easy to deploy on resource-limited hardware. By combining these operations, it is possible to enable features to interact only within a single scale within SSFI, without causing features from different scales to interact in advance, creating the possibility for subsequent CCFM to achieve feature interaction between different scales. Below, we will provide a more detailed introduction to Separable self-attention within SSFI.
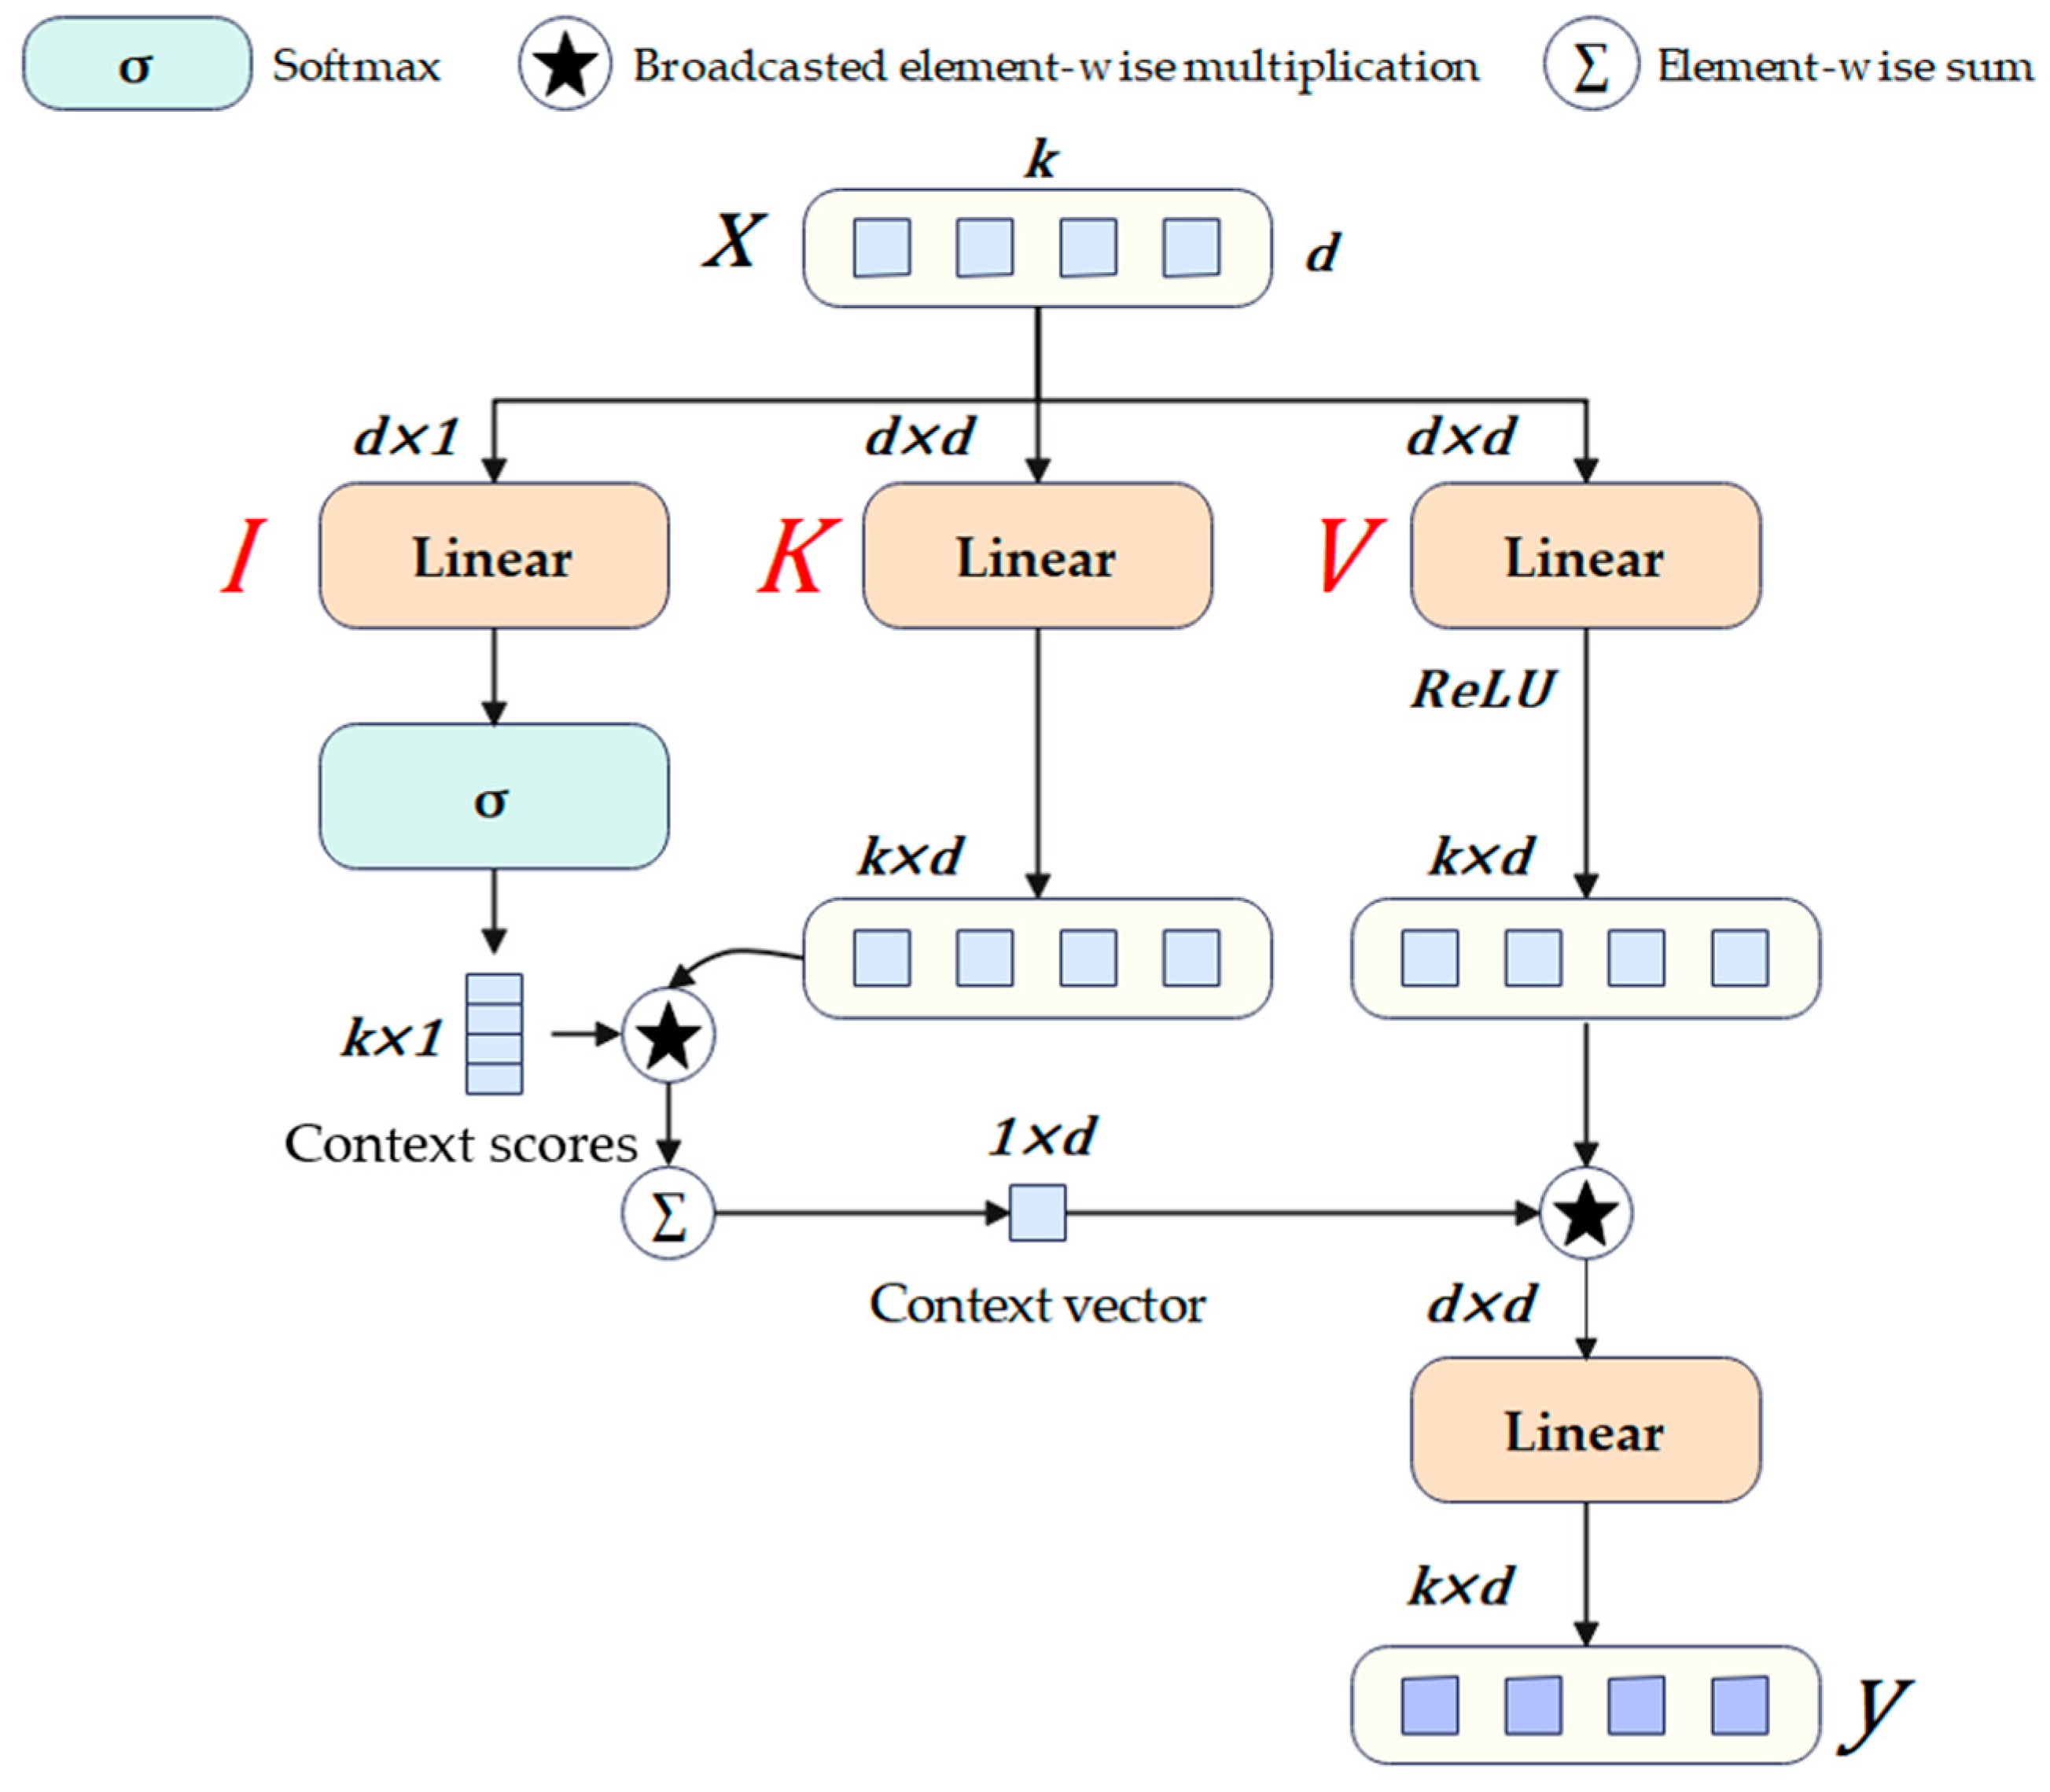
The specific workflow of Separate self-attention is shown in Figure 3. When an input x R k × d enters the module, it is directed to three different branches: input I   , key K , value V . To convert the k   d -dimensional tokens into k scalars, a linear layer is used in the branch I , which essentially multiplies the input x by a weighted matrix W I R d × 1 and adds the corresponding bias. The weights W I serves as a latent node L and will be used in subsequent processes. Afterwards, scalars will be used to form an intermediate variable called context scores through the softmax function. It is worth noting that in the Multi-head attention of the transformer, each input query will calculate a self-attention score with the key, while in the Separable self-attention, the key will only calculate the context score with the corresponding latent node L . This crucial operation accounts for the reduction in time complexity of Separate Self-attention from O ( k 2 ) to O ( k ) , accompanied by a slight decrease in detection accuracy and a significant decrease in latency. Next, the Context score is broadcasted element-wise multiplication with k   d -dimensional vectors that pass through the branch K with a weight of W K R d × d , followed by summation to obtain a d -dimensional vector termed the context vector. This process can be expressed as Equations ( = 1 \ * A r a b i c 1 ) .
c v = i = 1 k c s i x K i
Similarly, after passing through branch V , the input x is immediately followed by a ReLU activation function to obtain an intermediate variable x V R d × d . The x V then perform broadcasted element-wise multiplication with the context vector and is further processed by a linear layer with a weighted matrix W O R d × d to get the final result y R k × d . The entirety process of separable self-attention can be expressed mathematically as Equation ( 2 ) .
y = σ x W I c s R k × 1 * x W K c v R 1 × d * R e L U x W V W O
Here σ represents the softmax function, * represents the broadcasted element-wise multiplication operation.

3.3.2. CNN-Based Cross-Scale Feature-Fusion Module

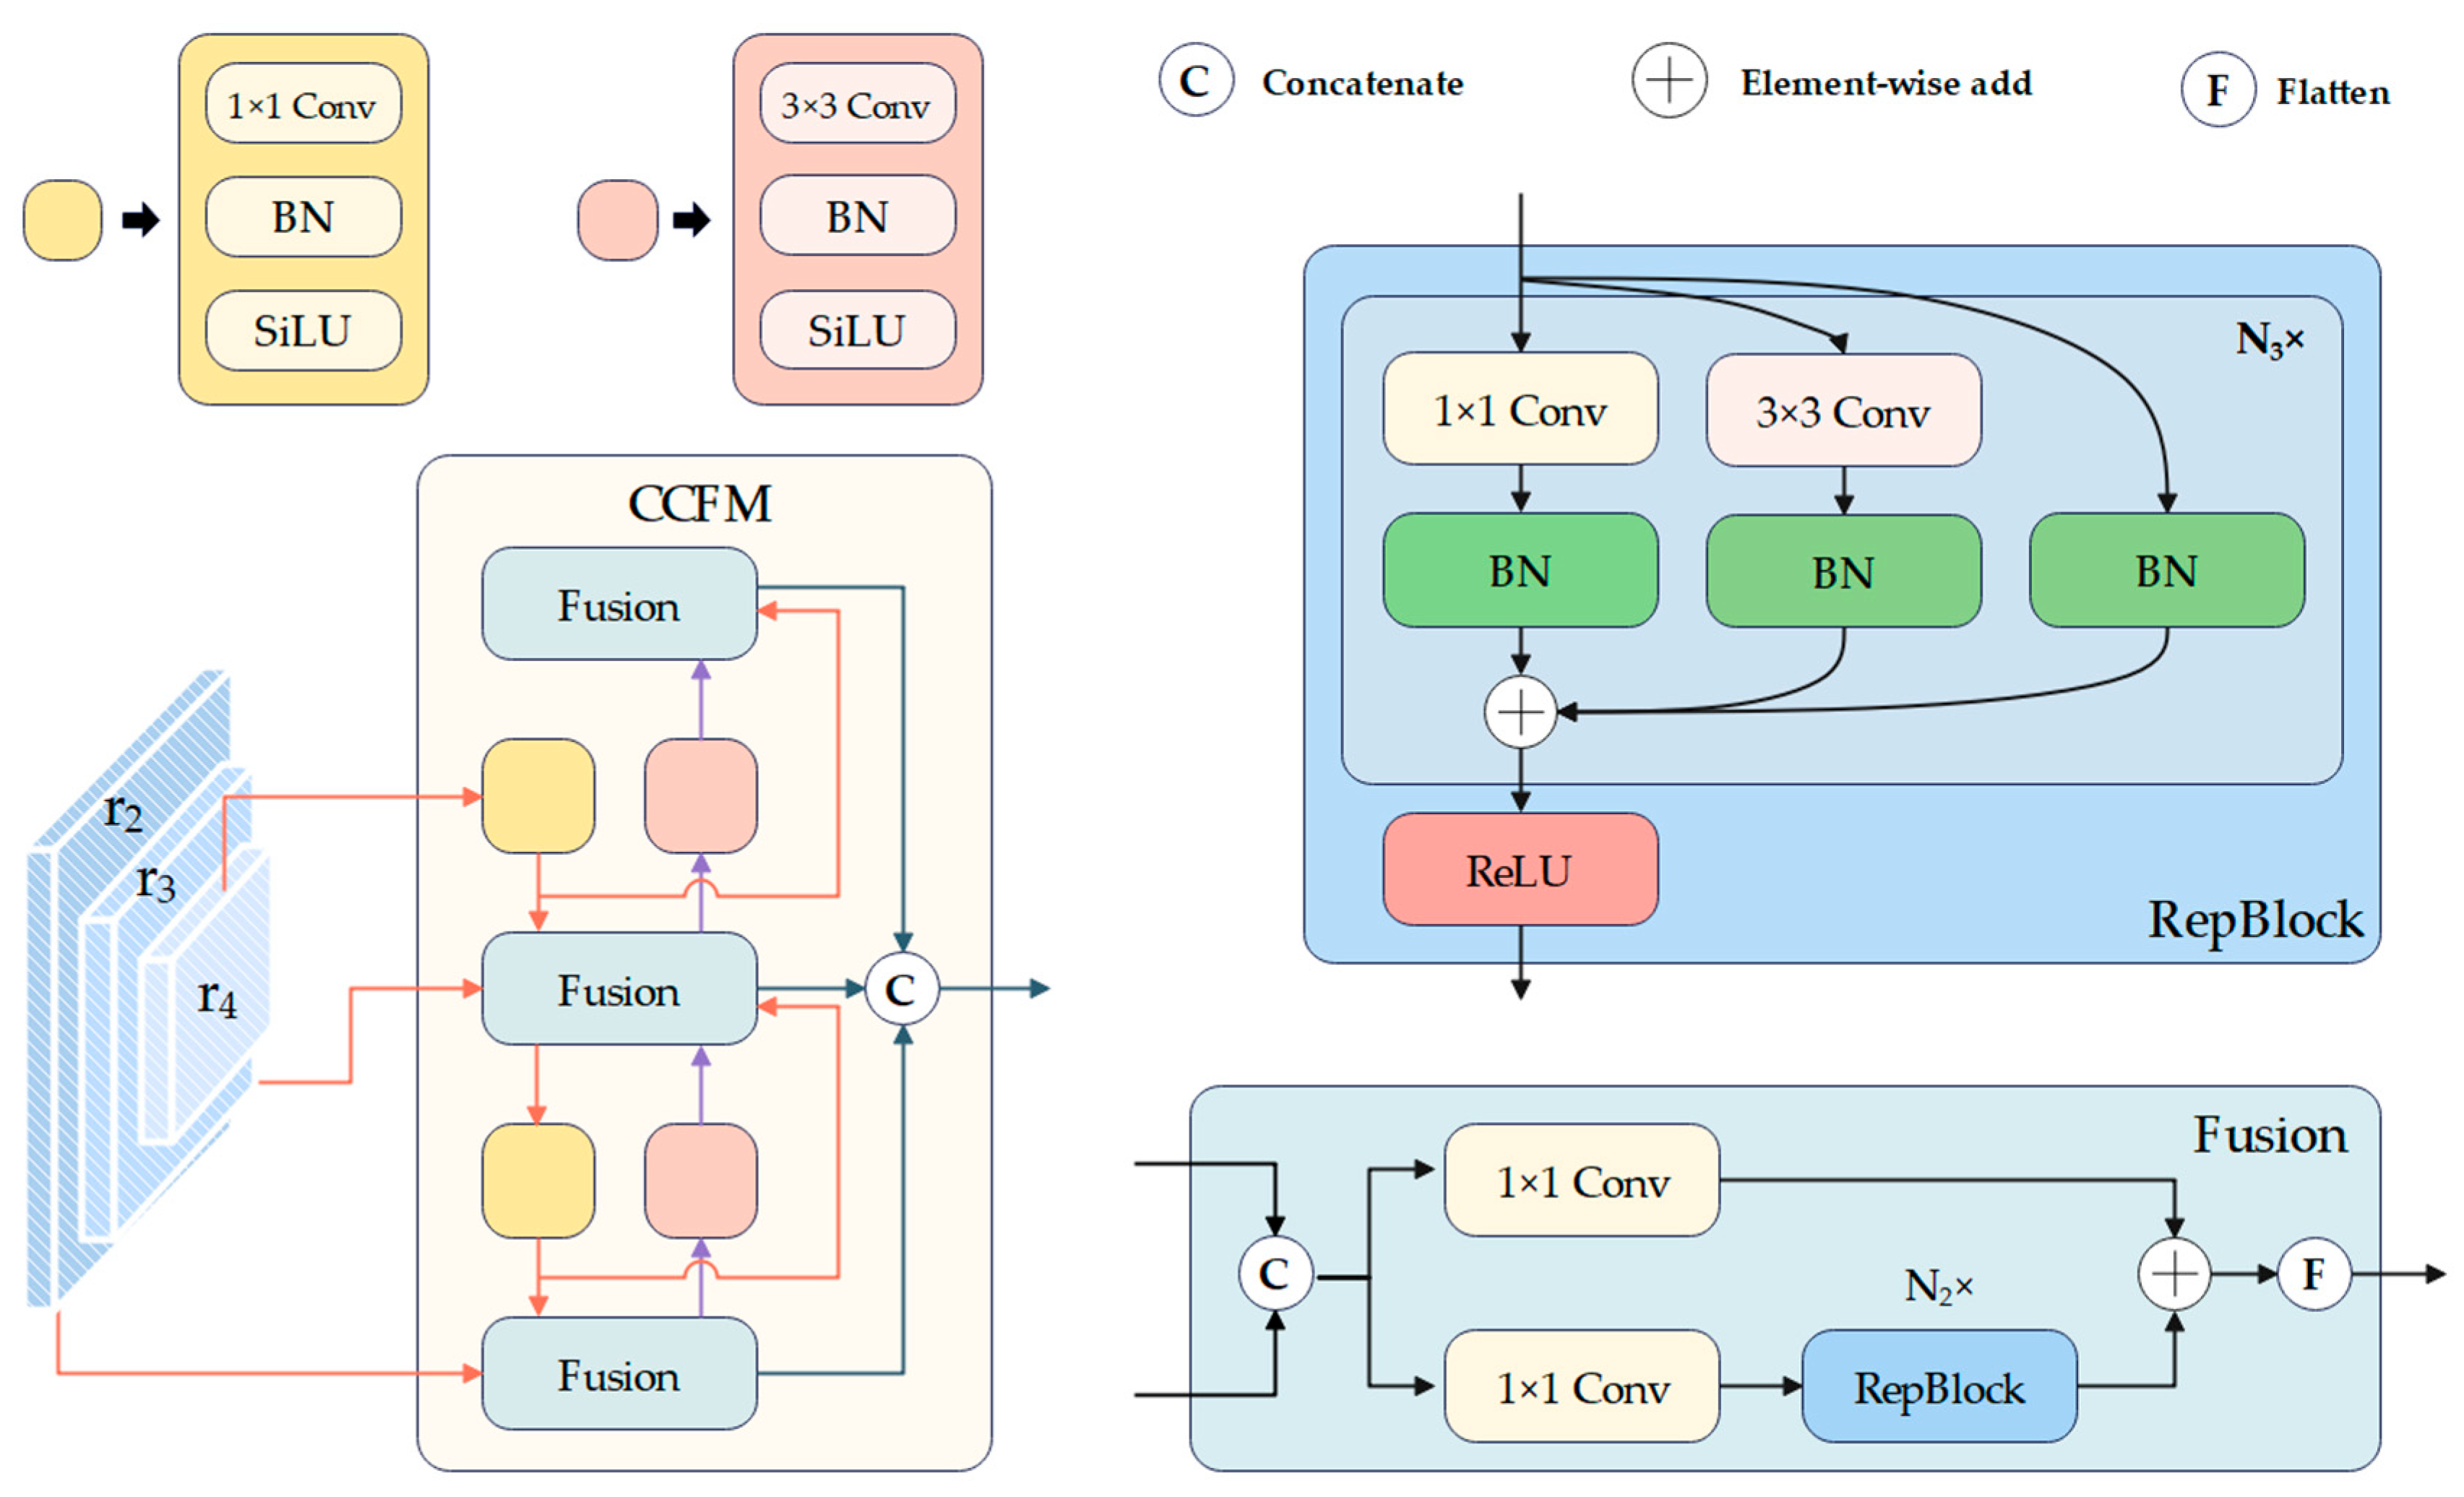
Inspired by RT-DETR [49], we introduce the CCFM module to achieve feature fusion between different scales. The specific structure of this module is shown in Figure 4. The CCFM module consists of several Fusion modules, each of which is composed of multiple convolutional layers and RepBlocks. These Fusion modules can help fuse features between different scales, with low-scale features typically capturing local details and texture information, while high-scale features focus more on global structure and semantic information. With such feature fusion, it is possible to make full use of this contextual information, thereby improving the understanding of complex fire and smoke and the accuracy of object detection.
Different from RT-DETR, we first perform feature interaction on the input of stages 2-4 in the backbone at the same scale, followed by multiscaled feature interaction. This process fosters an accurate understanding of feature structures and dependencies within each scale, contributing more comprehensive feature information for cross-scale feature interactions.
Outputs from different stages s 2 , s 3 , and s 4 are processed by SSFI to form r 2 , r 3 and r 4 , respectively. After entering CCFM, r 4 initially passes through the yellow module shown in Figure 4 and undergoes an upsampling procedure. Subsequently, it enters the Fusion module with r 3 . The result of fused features passes through the yellow module again and undergoes upsampling. Finally, it performs feature fusion with r 2 . Similarly, we replace the yellow module and upsampling operation with the red module and downsampling operation, repeating the above operation from bottom to top. In the end, the results of feature fusion are concatenated to obtain the final result.

3.4. IoU-Based Loss Function

IoU-based loss functions are commonly used in object detection, measuring overlap between predicted and ground truth boxes. Fire and smoke have intricate texture and color attributes, as well as special shapes with unpredictable transformations. Flaming and smoking from different combustible materials display varying hues and shapes within the same scene, which makes it challenging for the model to detect them accurately and slows down model convergence. Thus, an appropriate IoU-based loss function is crucial. A superior IoU-based loss function helps to align the predicted box with the ground truth box quickly, expediting model convergence. Typically, IoU-based loss functions can be defined as:
L = 1 I o U + R A , B
I o U = A B A B
where A and B represent the predicted box and ground-truth box, respectively. R ( · ) represents the penalty function.

3.4.1. GIoU

The traditional IoU loss function has several limitations. When there is no overlap between the predicted box and ground truth, IoU becomes zero, which results in the gradient of model parameters not being updated. Moreover, when different predicted boxes and the same ground truth have the same IoU, it is hard to measure the quality of the two predicted boxes. Therefore, most object detection models will use Generalized IoU (GIoU) [50] as the IoU loss function, and deformable DETR is no exception. Unlike the traditional IoU calculation method, GIoU introduces a minimum closing interval containing two bounding boxes to obtain the proportion of predicted and true boxes in the minimum closing region. In this way, even when the IoU is the same, the quality of different predicted boxes can be measured by their proportion in the minimum closure region. The formula for calculating GIoU is as follows:
R G I o U = A c A B A c
where A c represents the minimum closure interval containing two bounding boxes. However, when the two boxes are in an inclusive state or in special cases as shown in Figure 5a, A c A B = 0 , which means that GIoU will degenerate into IoU.

3.4.2. DIoU

To address the issues of slow convergence and imprecise regression of GIoU in the above exceptional cases, Zheng, Zhaohui et al. introduced Distance IoU (DIoU) [51]. As illustrated in Figure 5b, DIoU maintains the essence of GIoU and directly uses the distance between the predicted box and ground truth box as a target for optimization, further accelerating the convergence speed. R D I o U can expressed using the following formula:
R D I o U = ρ 2 a , b c 2
Here, a and b represent the center points of predicted boxes A and ground truth box B respectively. Additionally, ρ 2 ( · ) represents the Euclidean distance, and c 2 represents the square of the diagonal length of the minimum closure interval between predicted boxes A and ground truth B .

3.4.3. CIoU

Zheng, Zhaohui et al. argued that an effective IoU-based loss function needs to consider three aspects: overlapping area, center point distance, and consistency of the aspect ratio between the predicted box and the target box [51]. DIoU only considers the factors of overlapping area and center distance, so based on DIoU, Complete IoU (CIoU) [51] was proposed. R C I o U can be expressed by the following formula:
R C I o U = ρ 2 a , b c 2 + α v
α = v 1 I o U + v
v = 4 π 2 ( a r c t a n w g t h g t a r c t a n w h ) 2
Here, w g t and h g t represent the width and length of ground truth, respectively, while w and h represent the width and length of the predicted box, respectively. By analyzing the formula, it is found that v is an important factor in measuring the consistency between the predicted box and the ground truth aspect ratio. The importance of the aspect ratio is indicated by the variable α . With the predicted box distant from the ground truth box and other factors maintained, the value of α will be relatively small, which means that the importance of the aspect ratio between the two is low. On the contrast, with the prediction box closing to the ground truth box, the value of α will escalate, which means that the importance of the aspect ratio between the two is high.

3.4.4. SIoU

Considering the importance of consistency in the overlap area, center point distance, and aspect ratio, Gevorgyan et al. also included the direction of the predicted box moving towards the ground truth box as part of the penalty term of the loss function, thus proposing SCYLLA IoU (SIoU) [52]. During the model training process, predicted boxes are unrestricted, potentially leading to continuous wandering. SIoU significantly accelerates the convergence speed of the mode by adding angle cost to the penalty term, thereby limiting the degree of freedom of the predicted box. The angle cost can be expressed by the following formula:
Λ = 1 2 s i n 2 arcsin θ π 4
θ = c h ρ 2 a , b
c w = m a x b x ,   a x m i n b x ,   a x
c h = m a x b y ,   a y m i n b y ,   a y
Here, b x and a x represent the x-axis coordinates of the center points of the ground truth box and predicted box, respectively, while b y and a y represent the y-axis coordinates of the center points of the ground truth box and predicted box, respectively. Additionally, ρ 2 a , b represents the Euclidean distance. By analyzing the formula, it is found that when the center point of the predicted box coincides with the center point of the ground truth box on the x-axis or y-axis, the angle cost Λ = 0 . This penalty term can guide the predicted box to move to the nearest x-axis or y-axis to the ground truth box, reducing the degree of freedom of the bounding box regression. SIoU also redefined distance cost and shape cost. The formula for distance cost is:
Δ = t = x , y 1 e γ ρ t
ρ x = ( b x a x c w ) 2 , ρ y = ( b y a y c h ) 2 , γ = 2 Λ
By analyzing the above formulas, we can find that when the center point of the predicted box coincides with the center point of the ground truth box on the x-axis or y-axis, γ = 2 . This means the importance of distance cost Δ decreases. Conversely, when the line connecting the center point of the predicted box to the center point of the ground truth box forms a 45-degree angle with the coordinate axis, the importance of distance cost Δ is at its peak. The formula for shape cost is:
Ω = t = w , h ( 1 e ω t ) θ
ω w = | w w g t | m a x ( w , w g t ) , ω h = | h h g t | m a x ( h , h g t )
Here, θ is a hyperparameter that represents the degree of attention to shape cost. Based on the above formula, R S I o U can be ultimately expressed as:
R S I o U = Δ + Ω 2

3.4.5. PIoU

Recently, studies by Liu, C. et al. indicated that anchor boxes are prone to expand during the regression process, which seriously affects the convergence speed of the model. Therefore, they proposed Powerful IoU (PIoU) [53]. The formula for R P I o U is:
P = ( d w 1 w g t + d w 2 w g t + d h 1 h g t + d h 2 h g t ) / 4 ,
f ( x ) = 1 e x 2 ,
R P I o U = f ( P )
Here, w g t and h g t represent the width and length of ground truth box, respectively. The distance between the predicted box and the ground truth box is measured by d w 1 , d w 2 , d h 1 and d h 2 , and their specific meanings are shown in Figure 5b. During the training process, the penalty term P remains constant even if the anchor box expands. This prevents excessive anchor box expansions during regression. Furthermore, the penalty function selected generates an appropriate gradient based on the quality of predicted boxes.
PIoU v2 is an extension of PIoU v1, incorporating a non-monotonic attention layer controlled by a single hyperparameter. The mathematical formula is as follows:
q = e P ,   q 0 , 1 ,
u x = 3 x e x 2 ,
L P I o U _ v 1 = 1 I o U + R P I o U ,
L P I o U _ v 2 = u λ q L P I o U _ v 1
Here, u λ q is an attention function. λ is a hyperparameter and P is the penalty term in PIoU v1. The original penalty term P is replaced by q in PIoU v2. Additionally, the newly introduced attention mechanism helps the model focus more on medium-quality anchor boxes, reducing the negative impact of low-quality anchor boxes on gradients. By comparing with multiple IoU loss functions, we ultimately chose PIoU v2 as the IoU loss function for the proposed model, because the traditional IoU loss function treats all anchor boxes equally regardless of their quality. This can lead to suboptimal learning of bounding boxes with different qualities. PIoU V2 is a novel approach that combines the strengths of EIoU [54], SIoU [52] and WIoU [55]. It generates a small but increasing gradient for low-quality anchor boxes, allowing them to slowly improve during regression. For medium-quality anchor boxes, it generates a large gradient, enabling them to quickly become high-quality anchor boxes. Medium-quality bounding boxes often have some overlap with the target, but are not perfectly aligned. By paying more attention to these bounding boxes, PIoU v2 helps the model better learn the position shift and shape change of the target. This improves the accuracy of target localization, resulting in detection boxes that are more closely aligned with the true position of the target. Moreover, PIoU v2 not only reduces the number of hyperparameters but also solves the problem of easily expanding during the regression process, which helps to enhance the performance and robustness of the model.

4. Experiment Settings

To further demonstrate the excellent performance of our proposed model in fire and smoke detection tasks, a series of experiments were conducted. The following sub-sections provide more information about the image dataset, evaluation metrics, experimental environment, optimization method and other implementation details employed in our experiments. These settings were carefully designed to ensure the effectiveness and superiority of our proposed model.

4.1. Image Dataset

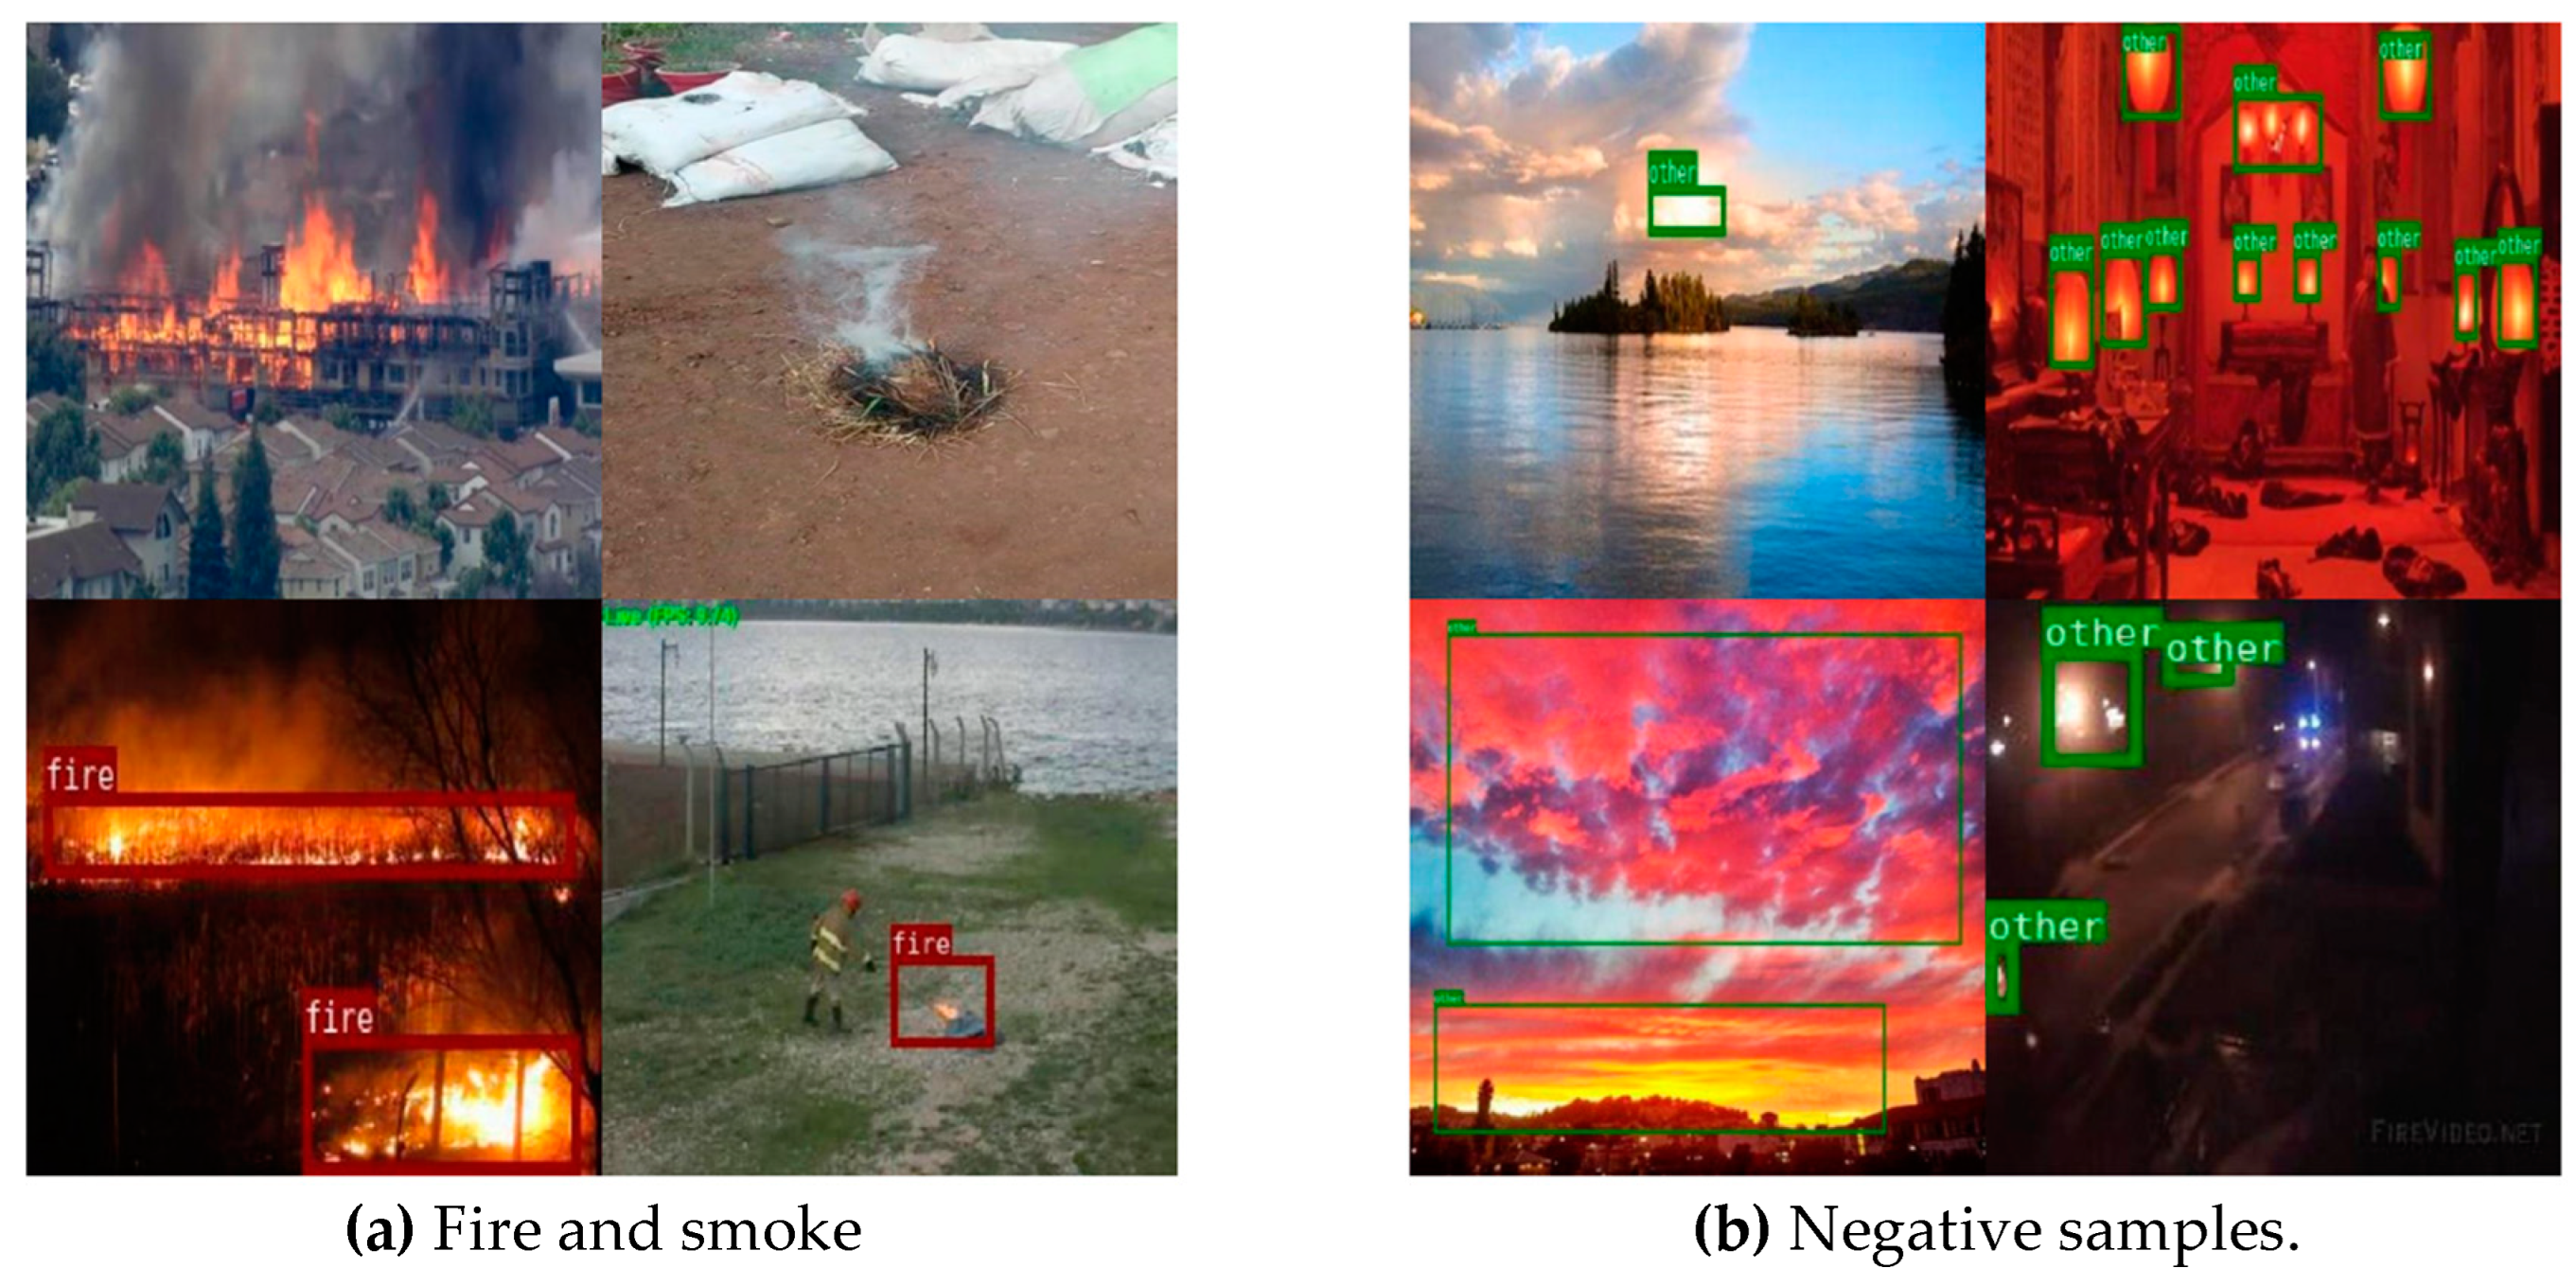
The selection of a diverse and representative dataset plays a significant role in evaluating the performance of fire and smoke detection methods. All data in the dataset are obtained from the network, including images captured from various sources, such as surveillance cameras, public repositories, and real-world scenarios. It encompasses different fire types, smoke patterns, lighting conditions, and environmental settings. At the same time, in order to accurately simulate real-world scenarios and prevent false positives in the model, the dataset used in this experiment includes a large number of negative samples. Some of the images in the dataset are shown in Figure 6. To ensure consistency, all images were resized to 640 x 640 and then subjected to various data augmentation techniques, such as horizontal and vertical flips, 90-degree rotations, Salt and Pepper noise, and more. As a result, over 25000 images were obtained for this experiment.

4.2. Evaluation Metrics

Accurate and reliable evaluation metrics are essential for assessing the effectiveness of fire and smoke detection methods. In terms of detection accuracy, the mean of Average Precision (mAP) is employed as a measure of model performance in object detection. Predictions labeled as True Positive (TP) are instances where the confidence level of the predicted box surpasses the threshold and the category matches the true one. Predictions labeled as False Negative (FP) occur when no predicted box meets the matching rules with a ground truth box. When multiple predicted boxes match the ground truth box, except for the result called TP, all other results are called False Positive (FP). These metrics allow us to calculate Precision and Recall, with their respective formulas:
P r e c i s i o n = T P T P + F P
R e c a l l = T P T P + F N
Here P r e c i s i o n denotes the actual number of target instances identified in the sample being detected as targets. In addition, we can use 1 P to represent the missed detection rate in fire and smoke detection. R e c a l l represents how many targets have been correctly detected by the algorithm among all real targets. To be more straightforward, it represents accuracy in fire and smoke detection. Choosing different confidence thresholds can result in obtaining different P r e c i s i o n and R e c a l l . Using these values, a PR curve can be plotted, where R e c a l l is on the horizontal axis and P r e c i s i o n is on the vertical axis. The area under the PR curve is known as the Average Precision ( A P ), and the average A P value for all categories is called m A P . The formula to calculate these values is as follows:
A P = 0 1 P ( r ) d r
m A P = i = 1 N A P i N
Here P ( r ) represents the PR curve, and N represents the predicted category. Based on the different IoU thresholds, m A P is divided into m A P 50 and m A P 75 . Based on the size of detected targets, it can be divided into m A P s , m A P m and m A P l .
In terms of model complexity, we use floating-point operations ( F L O P s ) and parameter quantities ( P a r a m s ) to measure. The larger F L O P s and P a r a m s , the higher the hardware requirements. When calculating convolutional layers, we have:
F L O P s C K = 2 H W C i n K 2 + 1 C o u t
P a r a m s C K = ( C i n K 2 + 1 ) C o u t
Here, C i n and C o u t represent the number of channels in the input and output feature maps. H and W represent the height and width of the input feature maps. K represents the width of the convolution kernel. When calculating fully connected layers, we have:
F L O P s ( F C ) = ( 2 I 1 ) O
P a r a m s F C = ( I + 1 ) O
Here I represents the dimension of the input vector, and O represents the dimension of the output vector. Based on the above two different levels of calculation methods, we can roughly calculate the F L O P s and P a r a m s of the model as:
F L O P s = N C K F L O P s C K + N F C F L O P s F C
P a r a m s = N C K P a r a m s C K + N F C P a r a m s F C
Here N C K and N F C represent the number of convolutional layers and the number of fully connected layers, respectively.
In terms of model detection speed, Frame Per Second ( F P S ) is selected to evaluate the model. A larger F P S means that the model can process more frames per second, and the real-time monitoring effect of the model is better.

4.3. Experimental Environment

In this section, we describe the experimental environment used in our study to evaluate the performance of the proposed method for fire and smoke detection. The experiments were conducted in the same hardware and software environment as shown in Table 1.

4.4. Optimization Method and Other Details

Intending to save memory, the gradient accumulation method is adopted in the experiments. This method does not update the parameters immediately after calculating the gradient of a batch, but instead stores accumulated gradients from multiple batches, and the updating parameters and resetting the gradient. The specific parameter configurations are presented in Table 2. The batch size is set to 4 and updated every 4 times, equating to set batch size to 16. Besides, the AdamW algorithm [56], with a base learning rate of 0.0002 and weight decay of 0.0001, is used to configure the optimizer. After the 40th iteration, the learning rate will be adjusted to 0.1 times the original.

5. Result Analysis

This section presents a comprehensive and reliable analysis of the results obtained from our experiments on fire and smoke detection. By analyzing the effectiveness of some blocks in the model, visualizing the results, conducting ablation experiments, and comparing them with other models, the superiority of our proposed model is demonstrated.

5.1. Effectiveness of Backbone

The backbone architecture acts as a feature extractor, and its ability to capture discriminative features directly influences the model’s ability to detect fire and smoke instances accurately. To demonstrate the effectiveness of the backbone, we considered several popular backbone architectures, including ResNet [45], EfficientNet [57] and ConvNextv2 [58], to extract features from the input images for fire and smoke detection. Each backbone architecture has its unique characteristics and capabilities in capturing and representing visual patterns. We trained and evaluated our fire and smoke detection models with different backbone architectures while keeping other hyperparameters and training procedures consistent. The detection results of baseline under different backbones are shown in Table 3. According to the results, it is evident that using different backbones can affect the detection accuracy of the model. Additionally, implementing ConvNeXt-tiny as a backbone not only reduces the parameters and computation complexity but also significantly enhances the detection accuracy for fire and smoke.

5.2. Effectiveness of PIoU v2

In this subsection, we conducted experiments to verify the effectiveness of PIoU v2 by comparing it with other IoU-based loss functions. The experimental results are presented in Table 4. It can be observed from these results that PIoU v2 can improve the detection accuracy and significantly reduce the training time of the model, even with the same epoch of training.
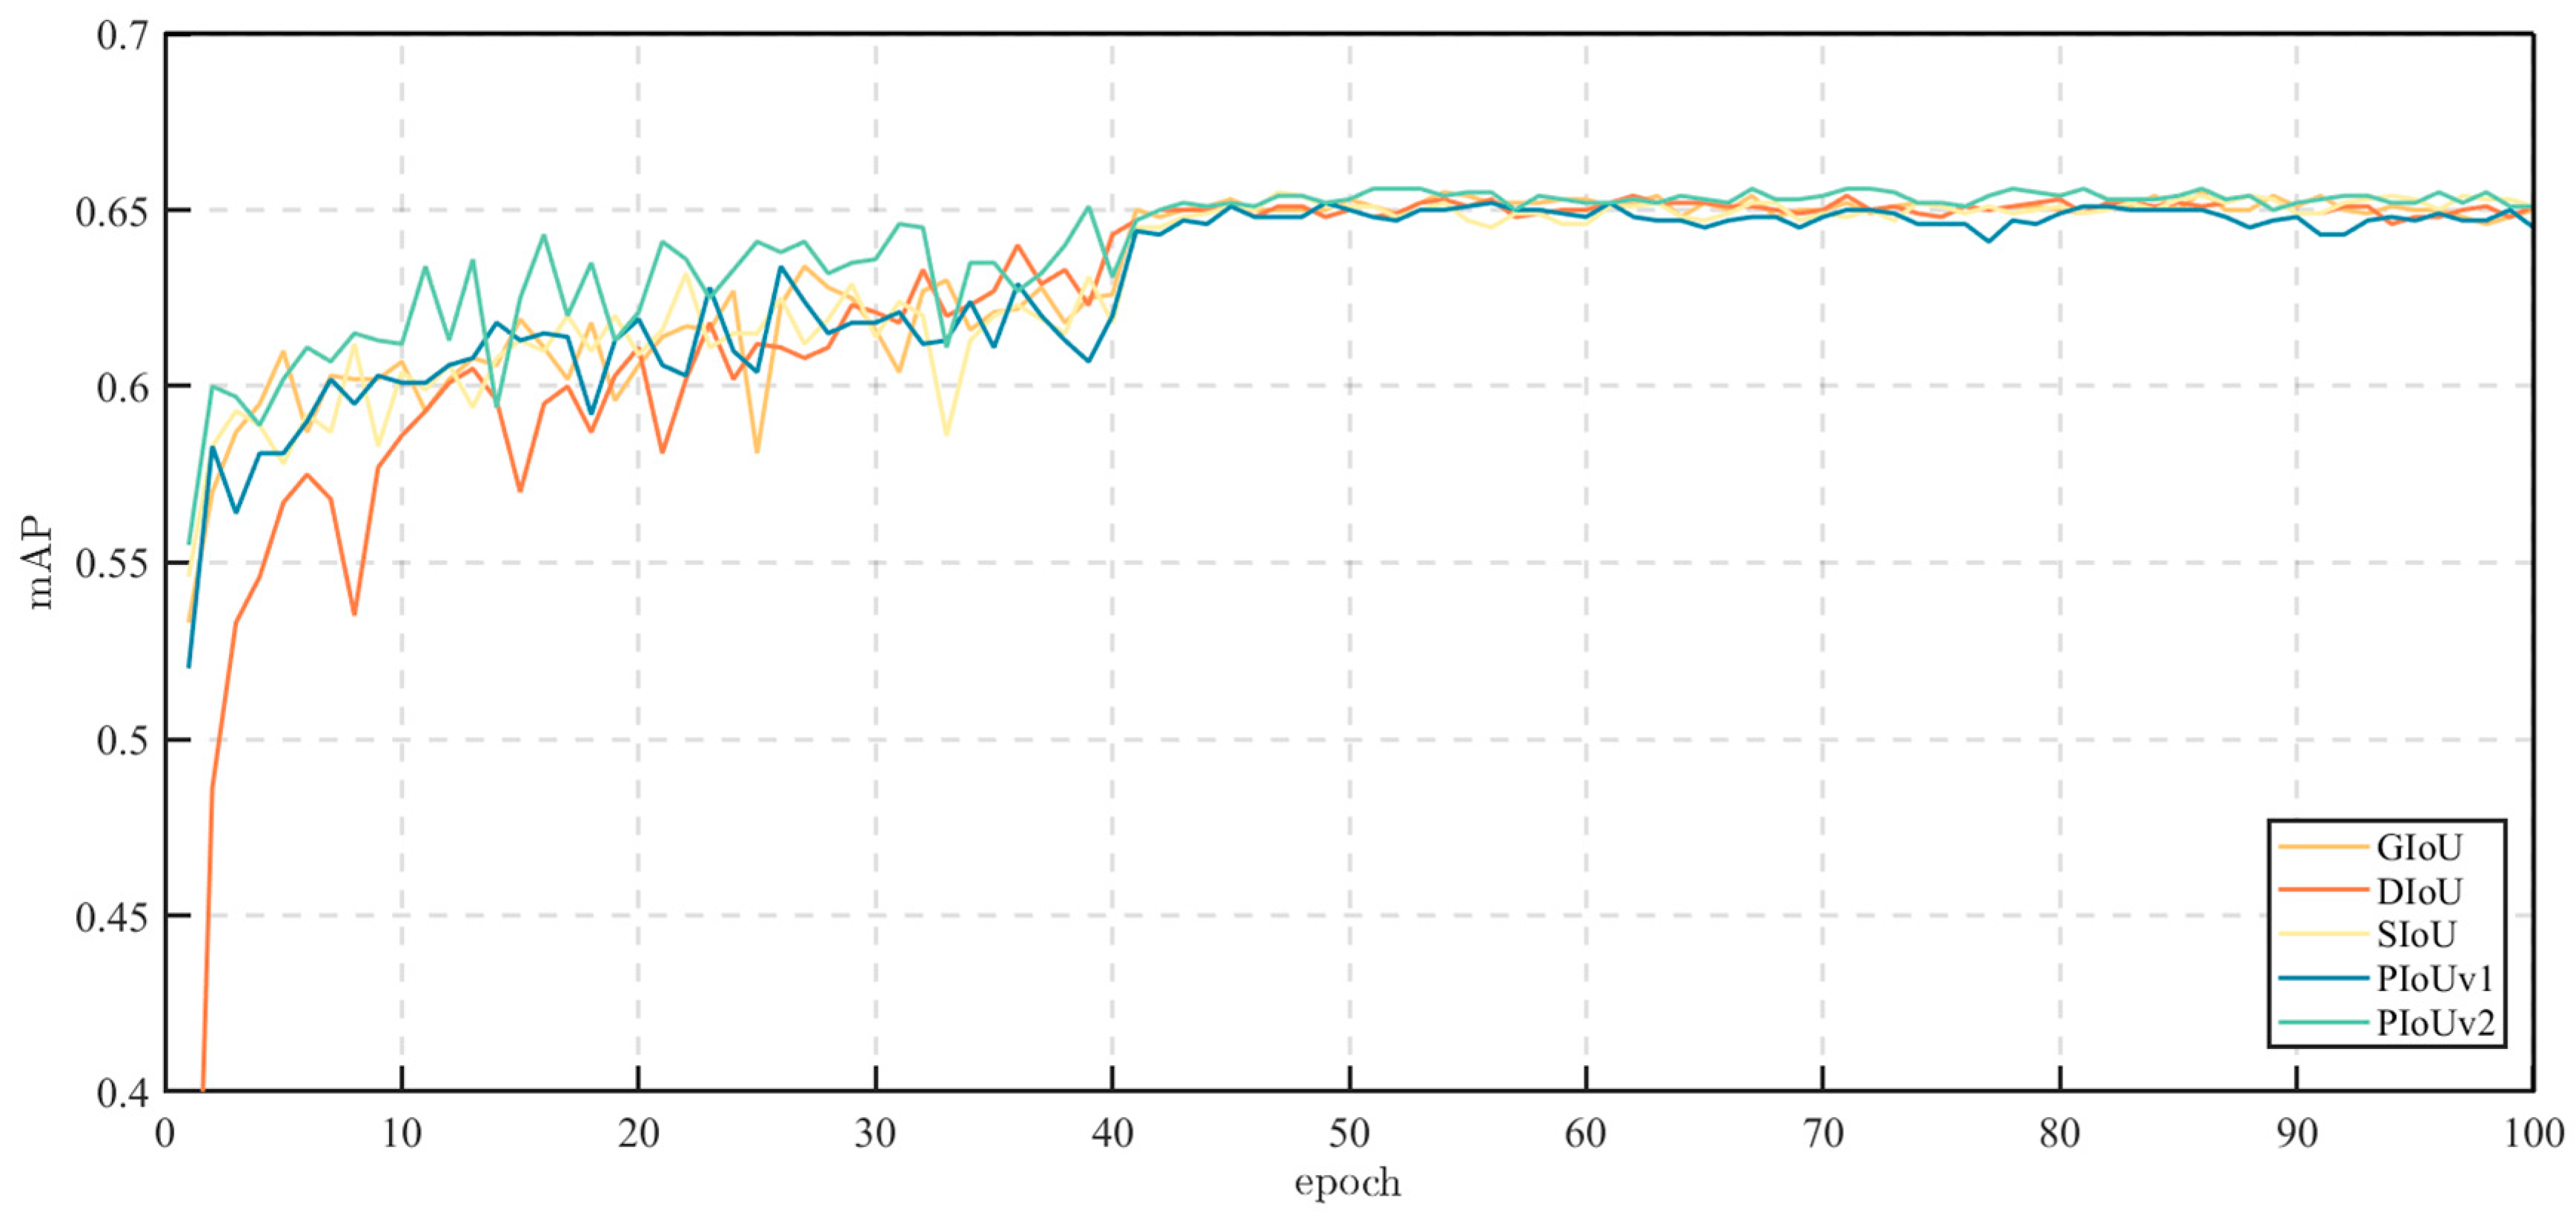
To better understand the effectiveness of PIoU v2, we decide to visualize the training process using different IoU loss functions. It is worthy noting that the pre-trained model provided by mmdetection is used for parameter initialization. Therefore, the m A P of the model does not increase from 0 in the early stages of training. From Figure 7, it is evident that the model using PIoU v2 as the loss function has a faster convergence speed, while DIoU has the slowest convergence speed. After 50 epochs, all IoUs tend to converge and have roughly the same accuracy. However, PIoU v2 achieves a slightly higher mAP than other models.

5.3. Ablation Experiments

In the field of object detection, ablation experiments are a widely used evaluation method aimed at analyzing the significance and mutual influence of different components in model design. Through ablation experiments, researchers gradually eliminate or modify different components of the model, observe the impact of these changes on the performance, and gain a deeper understanding of the working mechanism and key factors.
This subsection aims to comprehensively analyze and evaluate the remarkable performance of our proposed model through a series of ablation experiments. We will focus on studying the contribution of different components to the model’s performance and exploring their role in the object detection process. Table 5 displays the results of multiple ablation experiments, where √ denotes that relevant improvement methods have been applied to the baseline, while × denotes that no relevant improvement methods have been applied.
Compared with the first and fourth experimental groups, the result shows that using PIoU v2 as the loss function slightly improves the detection precision of the algorithm, but has almost no effect on the parameter and computational complexity.
Compared with the first and second experiments, the result reveals that ConvNeXt significantly reduced the number of parameters while improving A c c u r a c y f i r e , A c c u r a c y s m o k e   A c c u r a c y h u m a n and m A P .
Compared with the first and third groups of experiments, it is found that upgrading the original encoder to the Mixed encoder reduces the computational complexity but increases the number of parameters and reduce A c c u r a c y s m o k e and A c c u r a c y h u m a n slightly.
Compared with the experiments of the sixth and seventh groups, it can be found that although the Mixed encoder is the main reason for the increase in model parameter count, but it also ensures the improvement of the model’s accuracy in detecting fires and humans, as well as m A P .
(1)
Compared with the first and fourth experimental groups, the result shows that using PIoU v2 as the loss function slightly improves the detection precision of the algorithm, but has almost no effect on the parameter and computational complexity.
(2)
Compared with the first and second experiments, the result reveals that ConvNeXt significantly reduced the number of parameters while improving Accuracyfire, Accuracysmoke Accuracyhuman and mAP.
(3)
Compared with the first and third groups of experiments, it is found that upgrading the original encoder to the Mixed encoder reduces the computational complexity but increases the number of parameters and reduce Accuracysmoke and Accuracyhuman slightly.
(4)
Compared with the experiments of the sixth and seventh groups, it can be found that although the Mixed encoder is the main reason for the increase in model parameter count, but it also ensures the improvement of the model’s accuracy in detecting fires and humans, as well as mAP.

5.4. Comparison with Other Models

In addition to evaluating the performance of our method, we compare it with existing representative object detection algorithms, such as YOLO v7, YOLO v8, DAB-DETR, and so on. By benchmarking our results against these approaches, we gain insights into the advancements achieved by our proposed method. We discuss the performance of different methods under multiple indicators, emphasizing our model’s potential for outperforming existing methods. All the experiments are performed on the dataset that is introduced in Section 1. The results are presented in Table 6, with the best results highlighted in bold. According to the results, FCM-DETR achieved the highest m A P among all the algorithms. Moreover, the remaining indicators of this algorithm also exceed other DETR series algorithms. In small-scale object detection, it delivers impressive results that are only second to RTMDet [59]. Additionally, in large-scale object detection, its m A P l reaches astonishing 71.6%, which is much higher than the one-stage algorithm.
To provide a more intuitive demonstration of the superiority of our algorithm, we have selected detection results from various scenarios and presented them in Figure 8. When flames are detected, chartreuse is used for identification, while Shenbulun yellow and Royal blue is used for smoke and human detection, respectively. In the dark scene, our FCM-DETR algorithm performs better than other algorithms by detecting more targets and with higher accuracy. In the bright scene, FCM-DETR also detects more small-scale targets than other algorithms. Notably, our method can distinguish negative samples well, reducing the false alarm rate of fire and smoke detection.

6. Conclusion

With the rapid development of deep learning technology, object detection techniques are increasingly being used in fields like forest fire surveillance, fire emergency identification, and industrial safety. Nevertheless, there is still huge room for improvement in this technology. FCM-DETR, our proposed model, leverages the advanced Deformable DETR as a baseline to accurately identify and localize fire and smoke instances in images. Employing ConvNeXt for its powerful ability, lightweight FCM-DETR extracts richer and more comprehensive feature information. Subsequently, a Mixed encoder comprising SSFI and CCFM modules is developed, reducing the computational complexity of the original encoder while maintaining high accuracy in fire and smoke detection. Lastly, the latest PIoU v2 is introduced, which not only accelerates the convergence speed and improves its robustness in complex fire scenarios, but also raises the detection accuracy to a new level. Through extensive experience and evaluation, the effectiveness and potential of our approach are being demonstrated. The model ultimately attained the m A P of 66.7%, outperforming the comparative model.
Moving forward, considering that DETR is still a novel technology, several avenues for future work can build upon the findings of this study. Extending our approach to real-time video-based fire and smoke detection is an important direction. In future works, we will improve the real-time processing capability of the model and further reduce its computational complexity while ensuring its effectiveness, aiming to achieve practical applications.

Author Contributions

Conceptualization, methodology, resources, software, validation, visualization, writing—original draft preparation and editing, T.L.; supervision and writing—review, G.Z. All authors have read and agreed to the published version of the manuscript.

Funding

This research received no external funding.

Institutional Review Board Statement

Not applicable.

Informed Consent Statement

Not applicable.

Data Availability Statement

Not applicable.

Conflicts of Interest

The authors declare no conflict of interest.

References

  1. Hall, Shelby, and Ben Evarts. “Fire loss in the United States during 2021.” National Fire Protection Association (NFPA) (2022).
  2. Wang, Z., Wang, Z., Zou, Z. et al. Severe Global Environmental Issues Caused by Canada’s Record-Breaking Wildfires in 2023. Adv. Atmos. Sci. (2023).
  3. M. D. Nguyen, H. N. Vu, D. C. Pham, B. Choi and S. Ro, “Multistage Real-Time Fire Detection Using Convolutional Neural Networks and Long Short-Term Memory Networks,” in IEEE Access, vol. 9, pp. 146667-146679, 2021. [CrossRef]
  4. Çetin, A. Enis, et al. “Video fire detection–review.” Digital Signal Processing 23.6 (2013): 1827-1843.
  5. Töreyin, B. Uğur, et al. “Computer vision based method for real-time fire and flame detection.” Pattern recognition letters 27.1 (2006): 49-58. [CrossRef]
  6. P. V. Koerich Borges, J. Mayer and E. Izquierdo, “Efficient visual fire detection applied for video retrieval,” 2008 16th European Signal Processing Conference, Lausanne, Switzerland, 2008, pp. 1-5.
  7. Y. H. Habiboğlu, O. Günay and A. E. Çetin, “Flame detection method in video using covariance descriptors,” 2011 IEEE International Conference on Acoustics, Speech and Signal Processing (ICASSP), Prague, Czech Republic, 2011, pp. 1817-1820. [CrossRef]
  8. Li, Pu, and Wangda Zhao. “Image fire detection algorithms based on convolutional neural networks.” Case Studies in Thermal Engineering 19 (2020): 100625. [CrossRef]
  9. J. Dunnings and T. P. Breckon, “Experimentally Defined Convolutional Neural Network Architecture Variants for Non-Temporal Real-Time Fire Detection,” 2018 25th IEEE International Conference on Image Processing (ICIP), Athens, Greece, 2018, pp. 1558-1562.
  10. Huang, J.; Zhou, J.; Yang, H.; Liu, Y.; Liu, H. A Small-Target Forest Fire Smoke Detection Model Based on Deformable Transformer for End-to-End Object Detection. Forests 2023, 14, 162. [CrossRef]
  11. Muhammad K, Ahmad J, Baik S W. Early fire detection using convolutional neural networks during surveillance for effective disaster management[J]. Neurocomputing, 2018, 288: 30-42.
  12. Redmon, Joseph, et al. “You only look once: Unified, real-time object detection.” Proceedings of the IEEE conference on computer vision and pattern recognition. 2016.
  13. Redmon, Joseph, and Ali Farhadi. “YOLO9000: better, faster, stronger.” Proceedings of the IEEE conference on computer vision and pattern recognition. 2017.
  14. Redmon, Joseph, and Ali Farhadi. “YOLO9000: better, faster, stronger.” Proceedings of the IEEE conference on computer vision and pattern recognition. 2017.
  15. Redmon, Joseph, and Ali Farhadi. “Yolov3: An incremental improvement.” arXiv preprint arXiv:1804.02767 (2018).
  16. Bochkovskiy, Alexey, Chien-Yao Wang, and Hong-Yuan Mark Liao. “Yolov4: Optimal speed and accuracy of object detection.” arXiv preprint arXiv:2004.10934 (2020).
  17. Li, Chuyi, et al. “YOLOv6: A single-stage object detection framework for industrial applications.” arxiv preprint arxiv:2209.02976 (2022).
  18. Wang, Chien-Yao, Alexey Bochkovskiy, and Hong-Yuan Mark Liao. “YOLOv7: Trainable bag-of-freebies sets new state-of-the-art for real-time object detectors.” Proceedings of the IEEE/CVF conference on computer vision and pattern recognition. 2023.
  19. Uijlings, Jasper RR, et al. “Selective search for object recognition.” International journal of computer vision 104 (2013): 154-171.
  20. Girshick, Ross. “Fast r-cnn.” Proceedings of the IEEE international conference on computer vision. 2015.
  21. Ren, Shaoqing, et al. “Faster r-cnn: Towards real-time object detection with region proposal networks.” Advances in neural information processing systems 28 (2015).
  22. Cai Z, Vasconcelos N. Cascade R-CNN: High quality object detection and instance segmentation[J]. IEEE transactions on pattern analysis and machine intelligence, 2019, 43(5): 1483-1498.
  23. Sun, Peize, et al. “Sparse r-cnn: End-to-end object detection with learnable proposals.” Proceedings of the IEEE/CVF conference on computer vision and pattern recognition. 2021.
  24. Zhao, L.; Zhi, L.; Zhao, C.; Zheng, W. Fire-YOLO: A Small Target Object Detection Method for Fire Inspection. Sustainability 2022, 14, 4930. [CrossRef]
  25. Carion, Nicolas, et al. “End-to-end object detection with transformers.” European conference on computer vision. Cham: Springer International Publishing, 2020. [CrossRef]
  26. Zhu, Xizhou, et al. “Deformable DETR: Deformable Transformers for End-to-End Object Detection.” International Conference on Learning Representations. 2020.
  27. Hu, Yaowen, et al. “Fast forest fire smoke detection using MVMNet.” Knowledge-Based Systems 241 (2022): 108219. [CrossRef]
  28. Dai, Jifeng, et al. “Deformable convolutional networks.” Proceedings of the IEEE international conference on computer vision. 2017.
  29. Geng, X., Su, Y., Cao, X. et al. YOLOFM: an improved fire and smoke object detection algorithm based on YOLOv5n. Sci Rep 14, 4543 (2024). [CrossRef]
  30. Chen, G.; Cheng, R.; Lin, X.; Jiao, W.; Bai, D.; Lin, H. LMDFS: A Lightweight Model for Detecting Forest Fire Smoke in UAV Images Based on YOLOv7. Remote Sens. 2023, 15, 3790. [CrossRef]
  31. Pan Jin, Xiaoming Ou, and Liang Xu. “A collaborative region detection and grading framework for forest fire smoke using weakly supervised fine segmentation and lightweight faster-RCNN.” Forests 12.6 (2021): 768. [CrossRef]
  32. Feng, Qihan, Xinzheng Xu, and Zhixiao Wang. “Deep learning-based small object detection: A survey.” Mathematical Biosciences and Engineering 20.4 (2023): 6551-6590. [CrossRef]
  33. P. Barmpoutis, K. Dimitropoulos, K. Kaza and N. Grammalidis, “Fire Detection from Images Using Faster R-CNN and Multidimensional Texture Analysis,” ICASSP 2019 - 2019 IEEE International Conference on Acoustics, Speech and Signal Processing (ICASSP), Brighton, UK, 2019, pp. 8301-8305.
  34. Chaoxia, Chenyu, Weiwei Shang, and Fei Zhang. “Information-guided flame detection based on faster R-CNN.” IEEE Access 8 (2020): 58923-58932. [CrossRef]
  35. Duan, Kaiwen, et al. “Corner proposal network for anchor-free, two-stage object detection.” European Conference on Computer Vision. Cham: Springer International Publishing, 2020.
  36. Zhang, Shifeng, et al. “Bridging the gap between anchor-based and anchor-free detection via adaptive training sample selection.” Proceedings of the IEEE/CVF conference on computer vision and pattern recognition. 2020.
  37. Zhao, Mingxin, et al. “Quantizing oriented object detection network via outlier-aware quantization and IoU approximation.” IEEE Signal Processing Letters 27 (2020): 1914-1918. [CrossRef]
  38. Mardani, Konstantina, Nicholas Vretos, and Petros Daras. “Transformer-based fire detection in videos.” Sensors 23.6 (2023): 3035. [CrossRef]
  39. Li, Yuming, et al. “An efficient fire and smoke detection algorithm based on an end-to-end structured network.” Engineering Applications of Artificial Intelligence 116 (2022): 105492. [CrossRef]
  40. Huang, Jingwen, et al. “A small-target forest fire smoke detection model based on deformable transformer for end-to-end object detection.” Forests 14.1 (2023): 162. [CrossRef]
  41. Meng, Depu, et al. “Conditional detr for fast training convergence.” Proceedings of the IEEE/CVF international conference on computer vision. 2021.
  42. Liu, Shilong, et al. “DAB-DETR: Dynamic Anchor Boxes are Better Queries for DETR.” International Conference on Learning Representations. 2021.
  43. Li, Feng, et al. “Lite DETR: An interleaved multi-scale encoder for efficient detr.” Proceedings of the IEEE/CVF Conference on Computer Vision and Pattern Recognition. 2023.
  44. Vaswani, Ashish, et al. “Attention is all you need.” Advances in neural information processing systems 30 (2017).
  45. He, K. M.; Zhang, X. Y.; Ren, S. Q.; Sun, J. Deep residual learning for image recognition. In: Proceedings of the IEEE Conference on Computer Vision and Pattern Recognition, 770–778, 2016.
  46. Liu, Ze, et al. “Swin transformer: Hierarchical vision transformer using shifted windows.” Proceedings of the IEEE/CVF international conference on computer vision. 2021.
  47. Liu, Zhuang, et al. “A convnet for the 2020s.” Proceedings of the IEEE/CVF conference on computer vision and pattern recognition. 2022.
  48. Mehta, Sachin, and Mohammad Rastegari. “Separable Self-attention for Mobile Vision Transformers.” Transactions on Machine Learning Research (2022).
  49. Lv, Wenyu, et al. “Detrs beat yolos on real-time object detection.” ariXv preprint ariXv:2304.08069 (2023).
  50. Rezatofighi, Hamid, et al. “Generalized intersection over union: A metric and a loss for bounding box regression.” Proceedings of the IEEE/CVF conference on computer vision and pattern recognition. 2019. [CrossRef]
  51. Zheng, Zhaohui, et al. “Distance-IoU loss: Faster and better learning for bounding box regression.” Proceedings of the AAAI conference on artificial intelligence. Vol. 34. No. 07. 2020.
  52. Gevorgyan, Zhora. “SIoU loss: More powerful learning for bounding box regression.” ariXv preprint ariXv:2205.12740 (2022).
  53. Liu, Can, et al. “Powerful-IoU: More straightforward and faster bounding box regression loss with a nonmonotonic focusing mechanism.” Neural Networks 170 (2024): 276-284.
  54. Zhang, Yi-Fan, et al. “Focal and efficient IOU loss for accurate bounding box regression.” Neurocomputing 506 (2022): 146-157. [CrossRef]
  55. Tong, Zanjia, et al. “Wise-IoU: bounding box regression loss with dynamic focusing mechanism.” arxiv preprint arxiv:2301.10051 (2023).
  56. Kingma, Diederik P., and Jimmy Ba. “Adam: A method for stochastic optimization.” ariXv preprint ariXv:1412.6980 (2014).
  57. Tan, Mingxing, and Quoc Le. “Efficientnet: Rethinking model scaling for convolutional neural networks.” International conference on machine learning. PMLR, 2019.
  58. Woo, Sanghyun, et al. “Convnext v2: Co-designing and scaling convnets with masked autoencoders.” Proceedings of the IEEE/CVF Conference on Computer Vision and Pattern Recognition. 2023.
  59. Lyu, Chengqi, et al. “Rtmdet: An empirical study of designing real-time object detectors.” arxiv preprint arxiv:2212.07784 (2022).
  60. Chen, Qiang, et al. “Group detr: Fast detr training with group-wise one-to-many assignment.” Proceedings of the IEEE/CVF International Conference on Computer Vision. 2023.
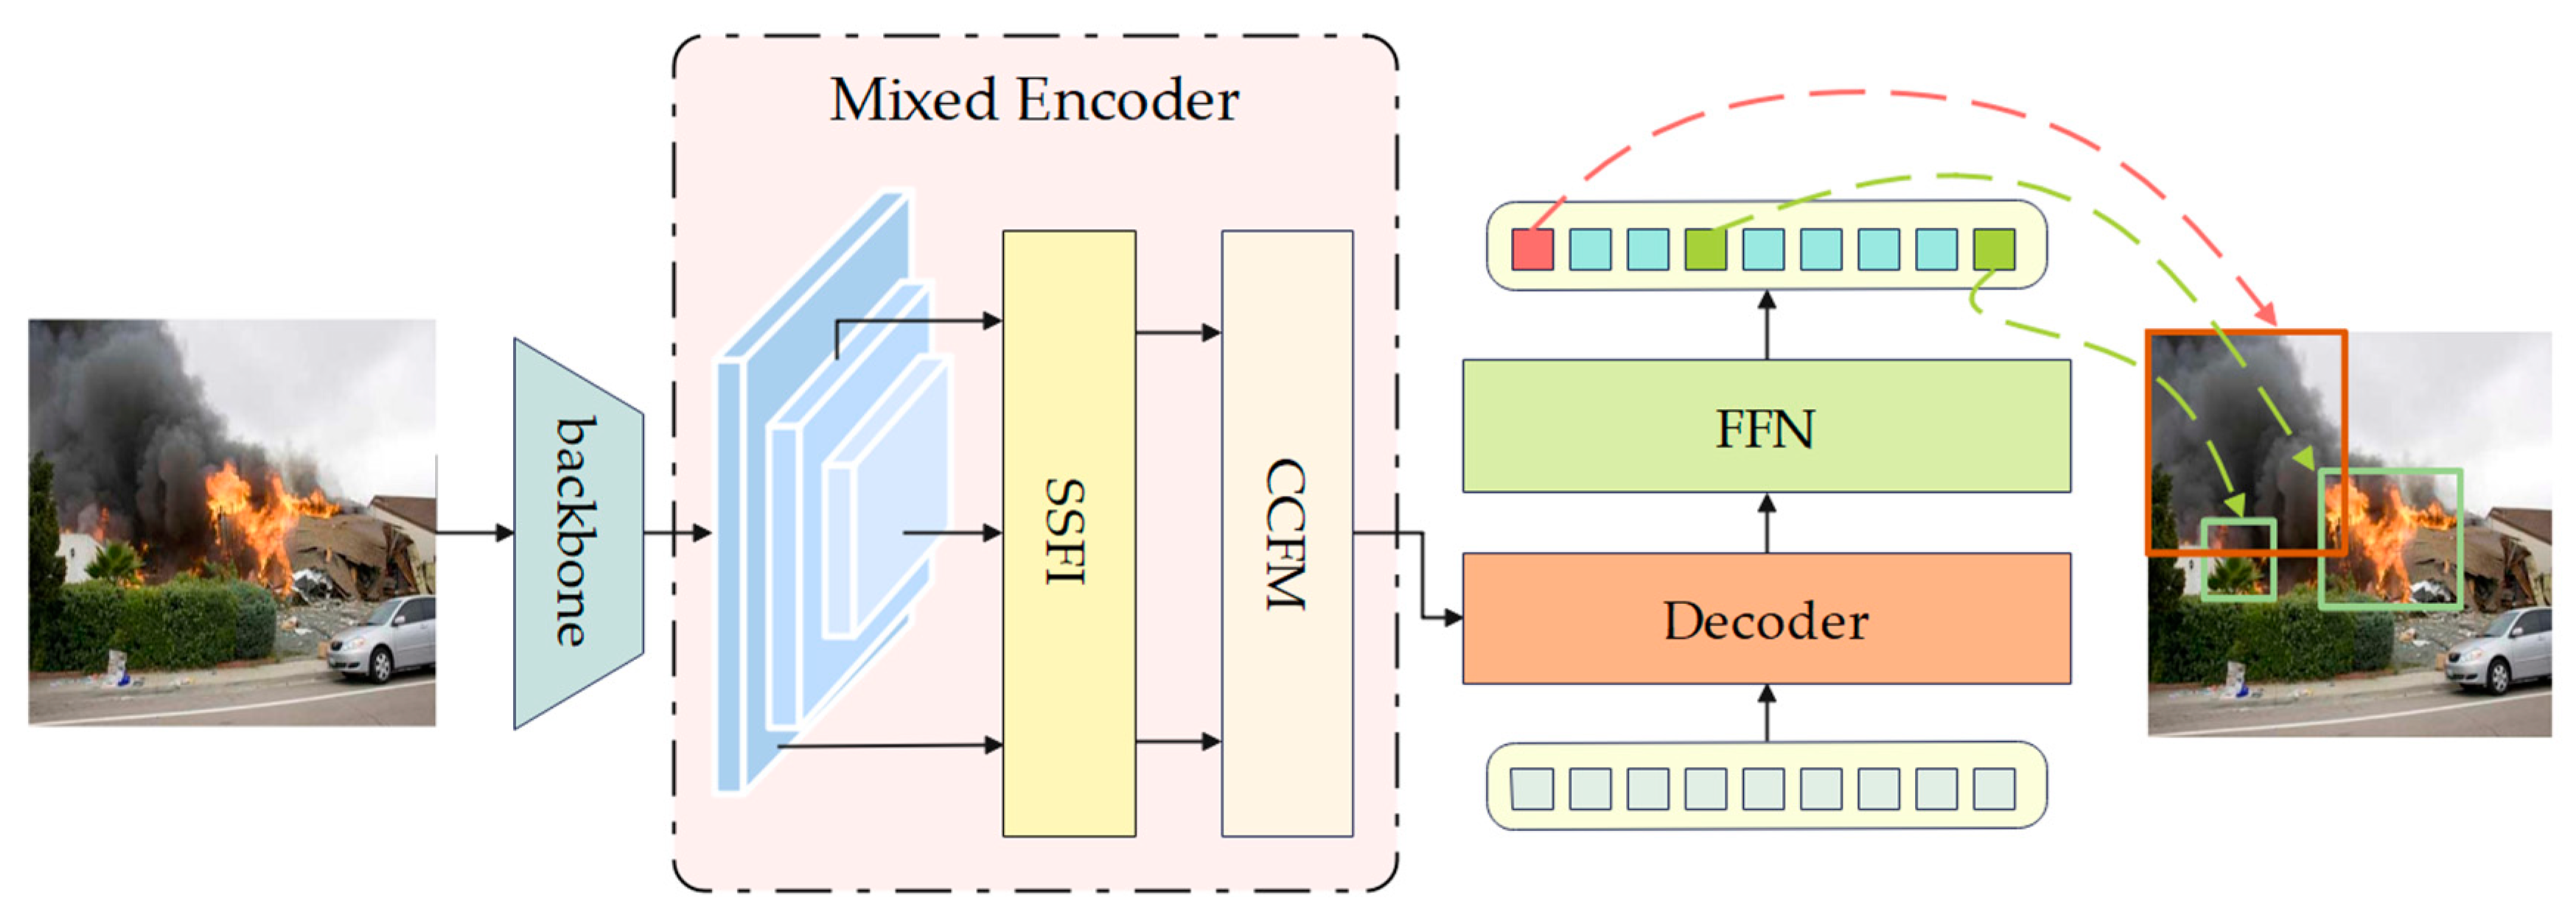
Figure 1. Overall architecture of FCM-DETR.
Preprints 107596 g001
Figure 2. Architecture of SSFI.
Preprints 107596 g002
Figure 3. Architecture of Separable self-attention block.
Preprints 107596 g003
Figure 4. Architecture of CCFM.
Preprints 107596 g004
Figure 5. (a) Two situations that lead to GIoU degradation into IoU; (b) Schematic of loss function parameters.
Preprints 107596 g005
Figure 6. Display of partial images in the dataset, where (a) represents the smoke or fire to be detected, and (b) represents negative samples.
Preprints 107596 g006
Figure 7. The training process curve of the baseline under different IoU-based loss functions.
Preprints 107596 g007
Figure 8. The detection performance of FCM-DETR and other algorithms under different situations.
Preprints 107596 g008
Table 1. Hardware and software configuration during the experiment.
CPU: Intel Xeon Platinum 8255C @2.50GHz
Hardware configuration GPU: NVIDIA GeForce RTX 3090
GPU number: 4
GCC: Ubuntu 9.4.0-1ubuntu1~20.04.1
CUDA Version: 11.7
Software configuration Python: 3.8.10
PyTorch: 1.11.0
CuDNN: 8.2
Table 2. Parameter configurations in the experiment.
Parameter Name Parameter Value
epoch 100
batch size 4
accumulative counts 4
optimizer AdamW
learning rate 0.0002
weight decay 0.0001
Table 3. The performance of Deformable DETR under different backbones.
Backbone m A P m A P 50 m A P 75 m A P s m A P m m A P l F L O P s P a r a m s ( M ) F P S
ResNet-50 65.5 84.0 63.7 45.1 53.7 70.6 126.0 41.1 25.1
EfficientNet-b0 64.9 81.6 63.3 35.6 53.4 69.8 71.3 16.4 18.9
ConvNeXtv2-A 60.2 74.4 60.1 27.2 49.4 65.2 74.4 41.9 19.6
ConvNeXt-tiny 66.1 84.3 65.2 53.6 53.1 71.6 70.8 40.8 29.8
Table 4. The performance of the baseline under different IoU-based loss functions.
IoU loss function m A P m A P 50 m A P 75 m A P s m A P m m A P l Total training time (h)
GIoU 65.5 84.0 63.7 45.1 53.7 70.6 23.2
DIoU 65.4 82.8 63.8 39.1 52.4 70.6 19.2
CIoU 65.6 83.8 64.4 43.2 54.3 70.8 18.0
SIoU 65.5 83.6 64.6 41.1 53.1 70.6 19.2
PIoUv1 65.2 83.3 64.5 48.7 51.7 70.5 18.9
PIoUv2 65.6 83.6 64.8 48.2 52.8 70.7 19.5
Table 5. Results of ablation experiments on FCM-DETR.
Improved methods Evaluation metrics
Model ConvNeXt Mixed
Encoder
Loss
function
m A P A c c u r a c y f i r e A c c u r a c y s m o k e A c c u r a c y h u m a n F L O P s P a r a m s ( M )
1 Deformable DETR × × × 65.5 96.89 73.97 79.88 126.0 41.1
2 × × 66.1 97.50 80.48 80.17 70.8 40.8
3 × × 65.8 98.01 73.27 79.99 75.5 46.3
4 × × 65.6 97.21 76.91 78.62 123.0 40.1
5 × 66.6 98.05 78.09 78.89 77.5 50.1
6 × 66.2 97.62 80.75 79.40 79.8 40.8
7 66.7 98.05 78.78 80.22 77.5 50.8
Table 6. Comparison results between FCM-DETR and other models.
Preprints 107596 i002
Disclaimer/Publisher’s Note: The statements, opinions and data contained in all publications are solely those of the individual author(s) and contributor(s) and not of MDPI and/or the editor(s). MDPI and/or the editor(s) disclaim responsibility for any injury to people or property resulting from any ideas, methods, instructions or products referred to in the content.
Copyright: This open access article is published under a Creative Commons CC BY 4.0 license, which permit the free download, distribution, and reuse, provided that the author and preprint are cited in any reuse.
Prerpints.org logo

Preprints.org is a free preprint server supported by MDPI in Basel, Switzerland.

Subscribe

© 2024 MDPI (Basel, Switzerland) unless otherwise stated