1. Introduction
Microbiology laboratories perform antibiograms following standardized procedures, based on the determination of the level of inhibition exerted by a given antibiotic on bacterial growth [
1]. The assays require incubation based on the time necessary for the microorganisms to grow, involving periods from 24 hours to several days. Hospital acquired infections, usually in the Intensive Care Unit (ICU), cause great concern worldwide since they result in a high mortality and morbidity rate, mainly in immunocompromised patients. These critical patients require rapid and effective antibiotic treatment [
2]. The development of a rapid antibiogram is a great challenge that can save lives and reduce health care costs.
New methodologies are being developed for rapid antibiotic susceptibility testing [reviewed in
3,
4,
5,
6,
7]. Most current techniques are based on the evaluation of microbial proliferation, for example using automated methods that accelerate the achievement of results. Thus, panels have been introduced in the market measuring turbidity changes or in which the culture medium includes a fluorescent indicator, which allows for results to be obtained in about eight hours.
Microbial growth results can also be accelerated using real-time microscopy [
7,
8], light scattering with a laser beam [
9] and real-time quantitative polymerase chain reaction (qPCR) of specific bacterial DNA sequences [
10]. In this way, it is possible to obtain results of the potential effect on bacterial growth after 6 hours of culture with the antibiotic. Another procedure relies on the evaluation of cell mass and growth by vibrating devices [
11], the changes in a rotating magnetic field [
12], loss of nanometer oscillations [
13] or use of recombinant bacteriophages, which produce light when the luciferase gene expression is triggered once they infect a specific bacterial host [
14].
In addition to the evaluation of bacterial growth, some experimental approaches are being developed based on the effect, or lack thereof, of certain physiological or metabolic parameters by antibiotics like NADH and FADH, pH, heat, membrane potentials or cell electrophysiology, that behave as biochemical flags of active cellular metabolism [
15,
16,
17,
18]. Proteomic and other "omic" methodologies, and the use of next-generation sequencing are also under development, although several issues remain to be resolved [
6,
19].
Beta-lactams and quinolones are within the most prescribed antibiotics at the hospital and resistance to them are dangerously increasing during the last years [
20,
21]. Ciprofloxacin is a very widely prescribed fluoroquinolone. It binds to DNA gyrase and/or topoisomerase IV attached to DNA, producing complexes that may block DNA replication and RNA transcription. The topoisomerases produce DNA double-strand breaks, but bound quinolone inhibits the subsequent ligation of the DNA ends by trapping the topoisomerase on DNA, resulting in DNA fragmentation and cell death [
22,
23,
24]. Susceptibility to ciprofloxacin is habitually decreased by mutations in the gene encoding the protein targets gyrA and/or parC, but also by overexpression of efflux pumps, such as AcrAB-TolC or by the presence of plasmids like Qnr proteins or the QepA active pump [
23,
24,
25]. Several mutations may coexist producing a high-level of resistance.
Ampicillin is a widely used beta-lactam. This penicillin inhibits bacterial peptidoglycan biosynthesis from the cell wall. It binds covalently to the active center of penicillin binding proteins (PBPs) inhibiting the transpeptidation step, stopping bacterial growth. Moreover, murein hydrolases or autolysins are triggered by the accumulation of peptidoglycan precursors, degrading the peptidoglycan, leading to bacterial death [
26,
27,
28]. Resistance to beta-lactams is generally due to the production of beta-lactamases. Modification of the permeability of cell wall, loss or mutation of porins, increased expression of active efflux pumps, and over-synthesis or alteration of PBPs, may be other mechanisms of resistance [
29,
30].
We had previously developed a fast and simple methodology to determine the resistance to quinolones [
31,
32]. The bacteria incubated with the antibiotic are included in an inert microgel on a slide and incubated with a lysis solution that removes the cell wall, releasing the nucleoids. This DNA is stained with a high sensitivity fluorochrome and is observed under fluorescence microscopy. Since the quinolones induce the fragmentation of bacterial DNA, if the strain is susceptible, a halo of DNA fragments that have diffused from the residual bacterial body is observed. If the strain is resistant, the nucleoids appear compact.
Subsequently, this technology was adapted for antibiotics that inhibit the synthesis of peptidoglycan, such as beta-lactams and glycopeptides [
33,
34]. In this case, the lysis solution only acts on those bacteria whose cell wall has been affected by the antibiotic, releasing the nucleoid. Resistant strains are not affected at the cell wall by the lysis solution and maintain their usual appearance. These methodologies have also allowed the rapid determination of colistin resistance [
35]. The most significant achievement of this methodology is that the results can be obtained in two hours.
The antibiograms based on cell growth or in modification of physiological or metabolic targets, cannot discriminate between the susceptibility/resistance of each specific antibiotic when incubated simultaneously in combination. This means that the sensitivity or resistance to a quinolone and a beta-lactam can only be determined separately. If the combination affects bacterial growth, it is not possible to discern whether this has been the effect of both antibiotics or only one of them, nor which one. It also happens with the microscopic techniques that we have developed for quinolones and beta-lactams, since the different lysing solutions used are not compatible. With this aim, a different methodology is needed with the goal to assess synergism, indifference or antagonism between two antibiotics against a specific species of bacteria. Regardless of the technique used, an additional 18-24 hours of incubation are required to obtain a result.
Here we report the feasibility of a rapid procedure to determine the susceptibility/resistance to the combination of ciprofloxacin and ampicillin in E. coli strains, based on a simple microscope visualization. This aforementioned procedure allows one to simultaneously discriminate the effect, or lack thereof, of each antibiotic separately.
2. Results
2.1. Dose-Response to Ciprofloxacin
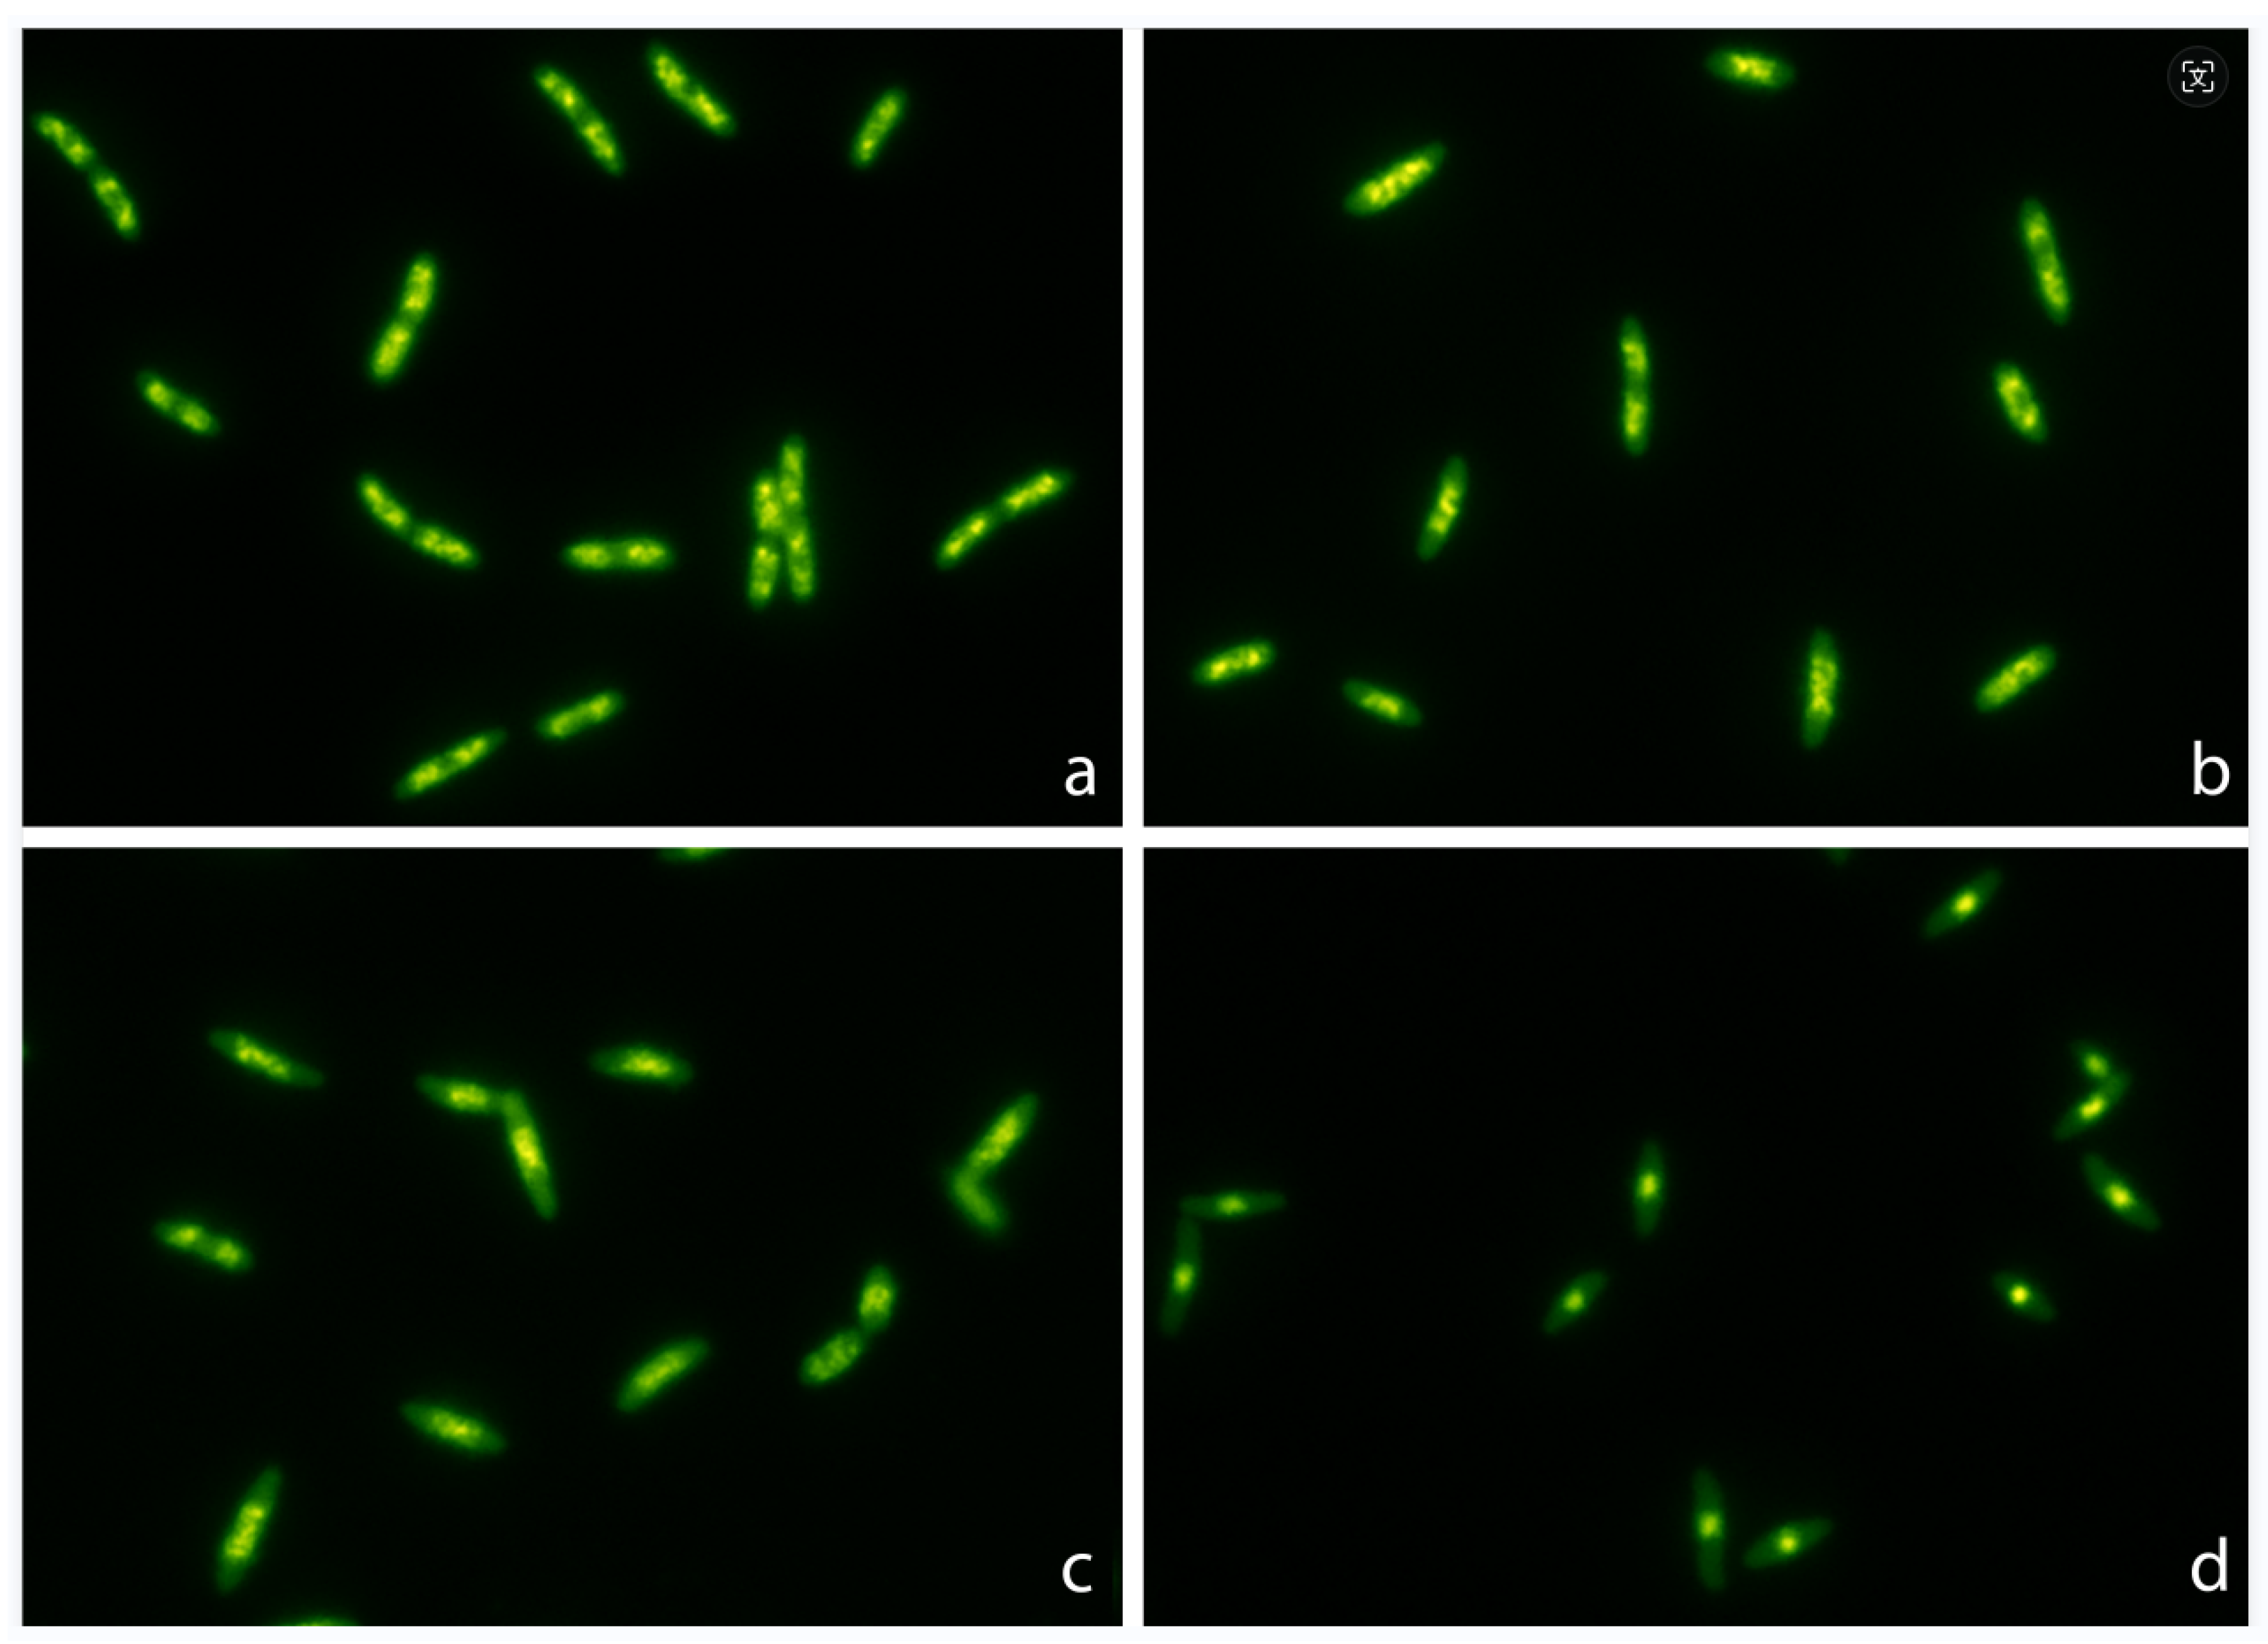
A.E. coli TG1 strain was incubated with increasing concentrations of ciprofloxacin for 45 min and processed to visualize the nucleoids inside the bacteria (
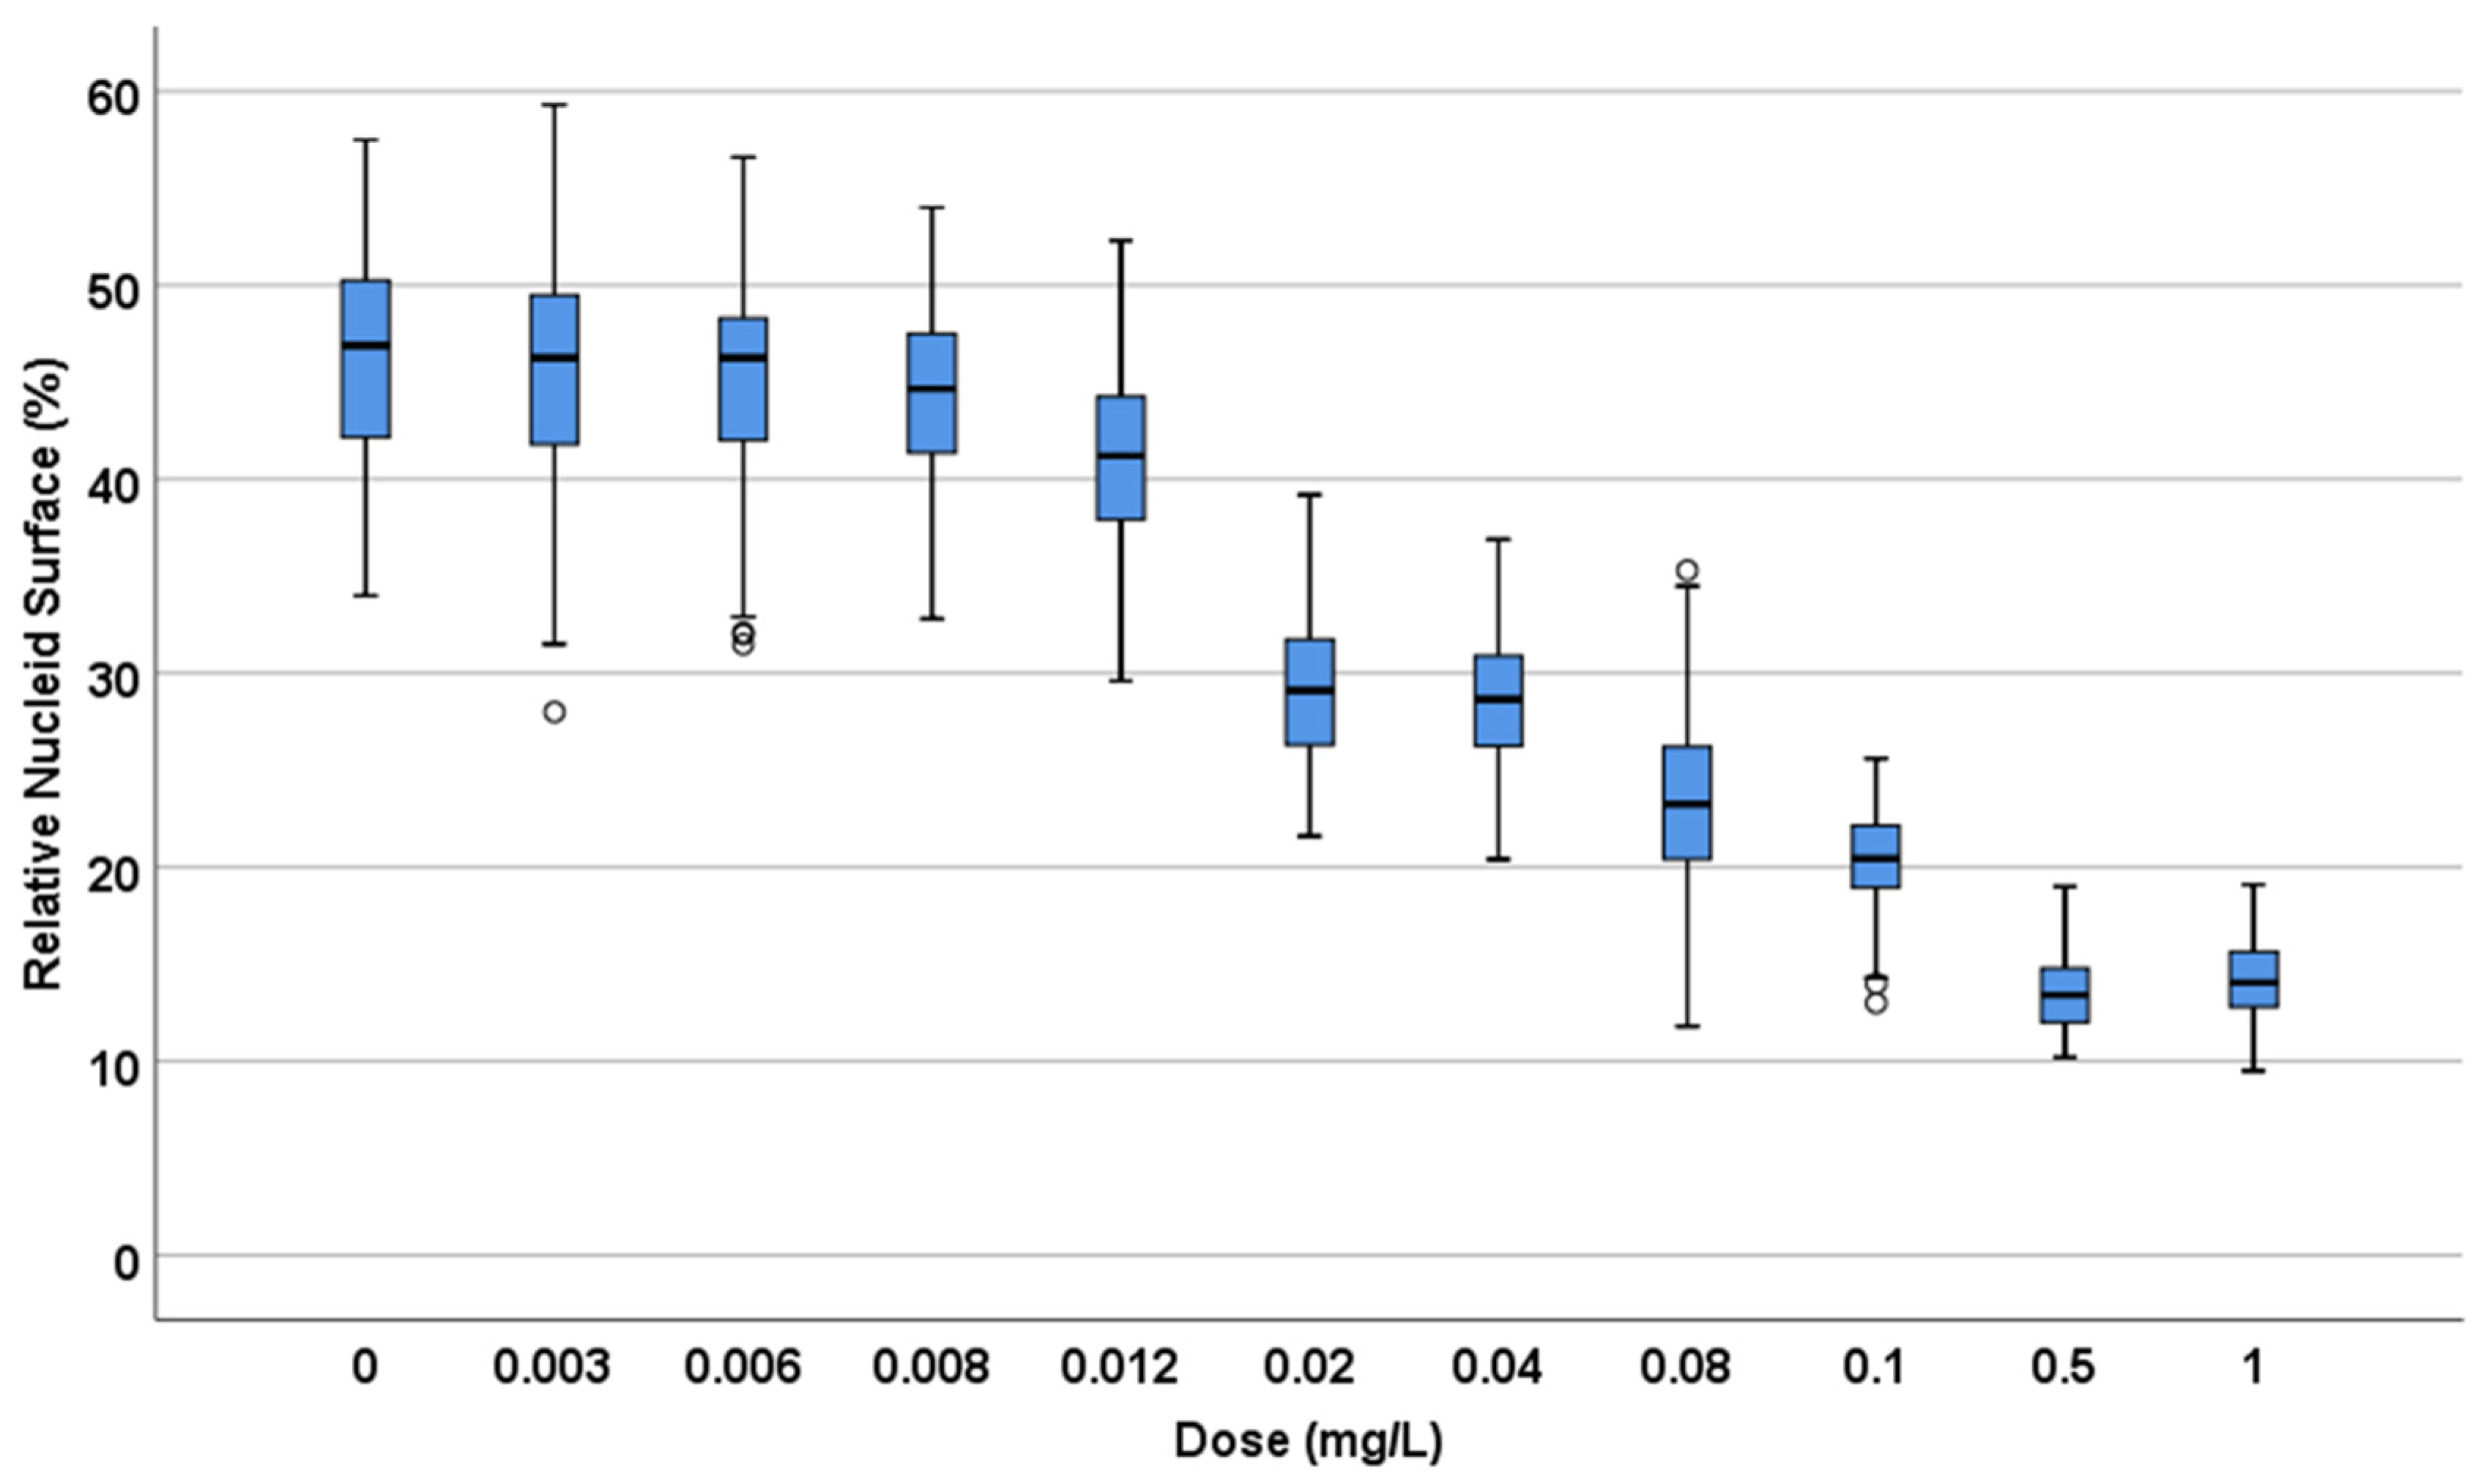
Figure 1). In control untreated culture, the baseline Relative Nucleoid Surface (RNS) occupied 46.9 % (median) of the total surface of the bacteria. The RNS was significantly lower at the MIC and the nucleoids were progressively condensed at the middle of the bacteria as concentration of ciprofloxacin increased, so that after 0.5-1 mg/L the median RNS was stabilized at 13.4-14% respectively (
Figure 2).
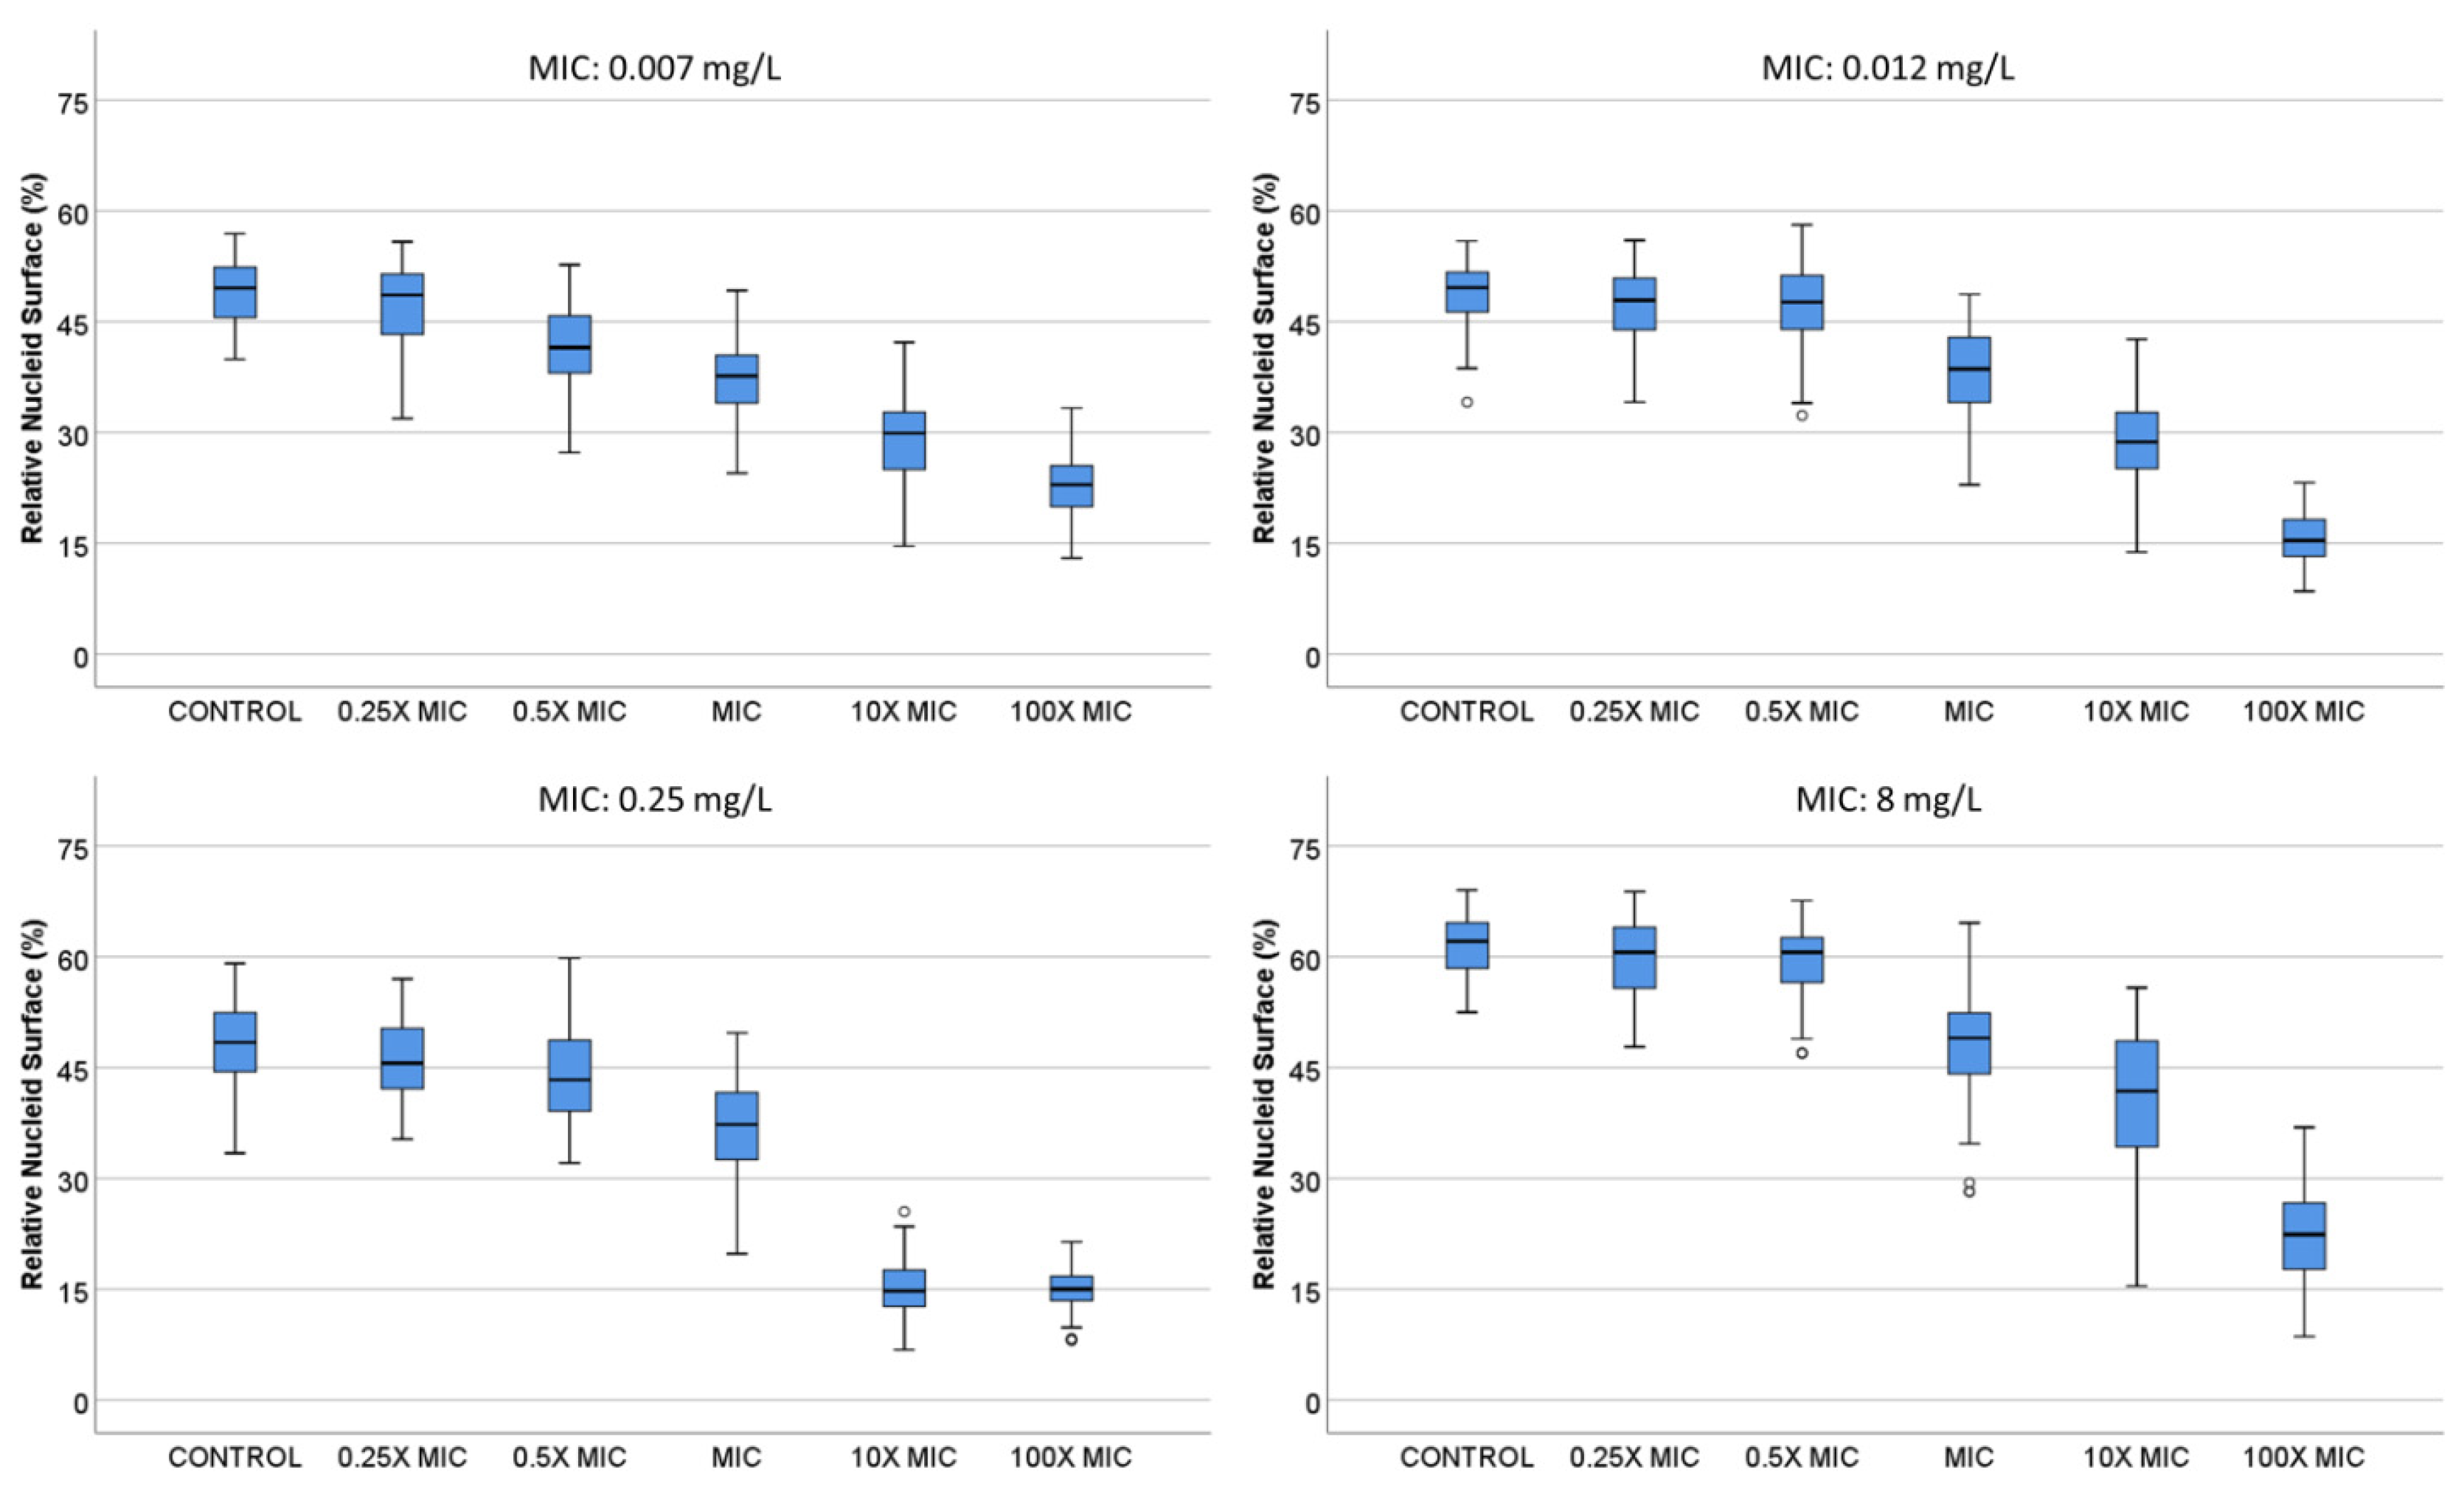
B. E. coli strains with MIC 0.007, 0.012, 0.25 and 8 mg/L were incubated with 0, 0.25X, 0.5X, 1X, 10X and 100X MIC concentrations of ciprofloxacin (
Figure 3). In general, the nucleoids occupied around 50% of the total surface of the bacteria in the control untreated samples. The nucleoids started to condense at 1X MIC, being progressively more compact at 10X and 100X MIC doses, finally achieving a 15.0-22.9% median RNS at the center of the bacteria. In the strain with lower MIC, the effect was already significant with 0.5X MIC dose.
In a previous report, these strains had also been incubated with a lysing solution to remove the cell wall and release the nucleoids in the microgel [
31]. Ciprofloxacin induced chromosomal DNA breakage resulting in a peripheral halo of DNA fragments that diffused from the central residual bacteria. The higher the dose, the greater the fragmentation, the greater the number of DNA spots and the greater the circular surface area of diffusion. The RNS was strongly correlated with the diameter of dispersion of DNA spots observed after bacterial lysis (Spearman’s rho: -0.83,
p < 0.001) (Supplementary
Figure 1). The higher the fragmentation, the lower the RNS, i.e., the higher the nucleoid compaction.
2.2. Dose-Response to Ampicillin
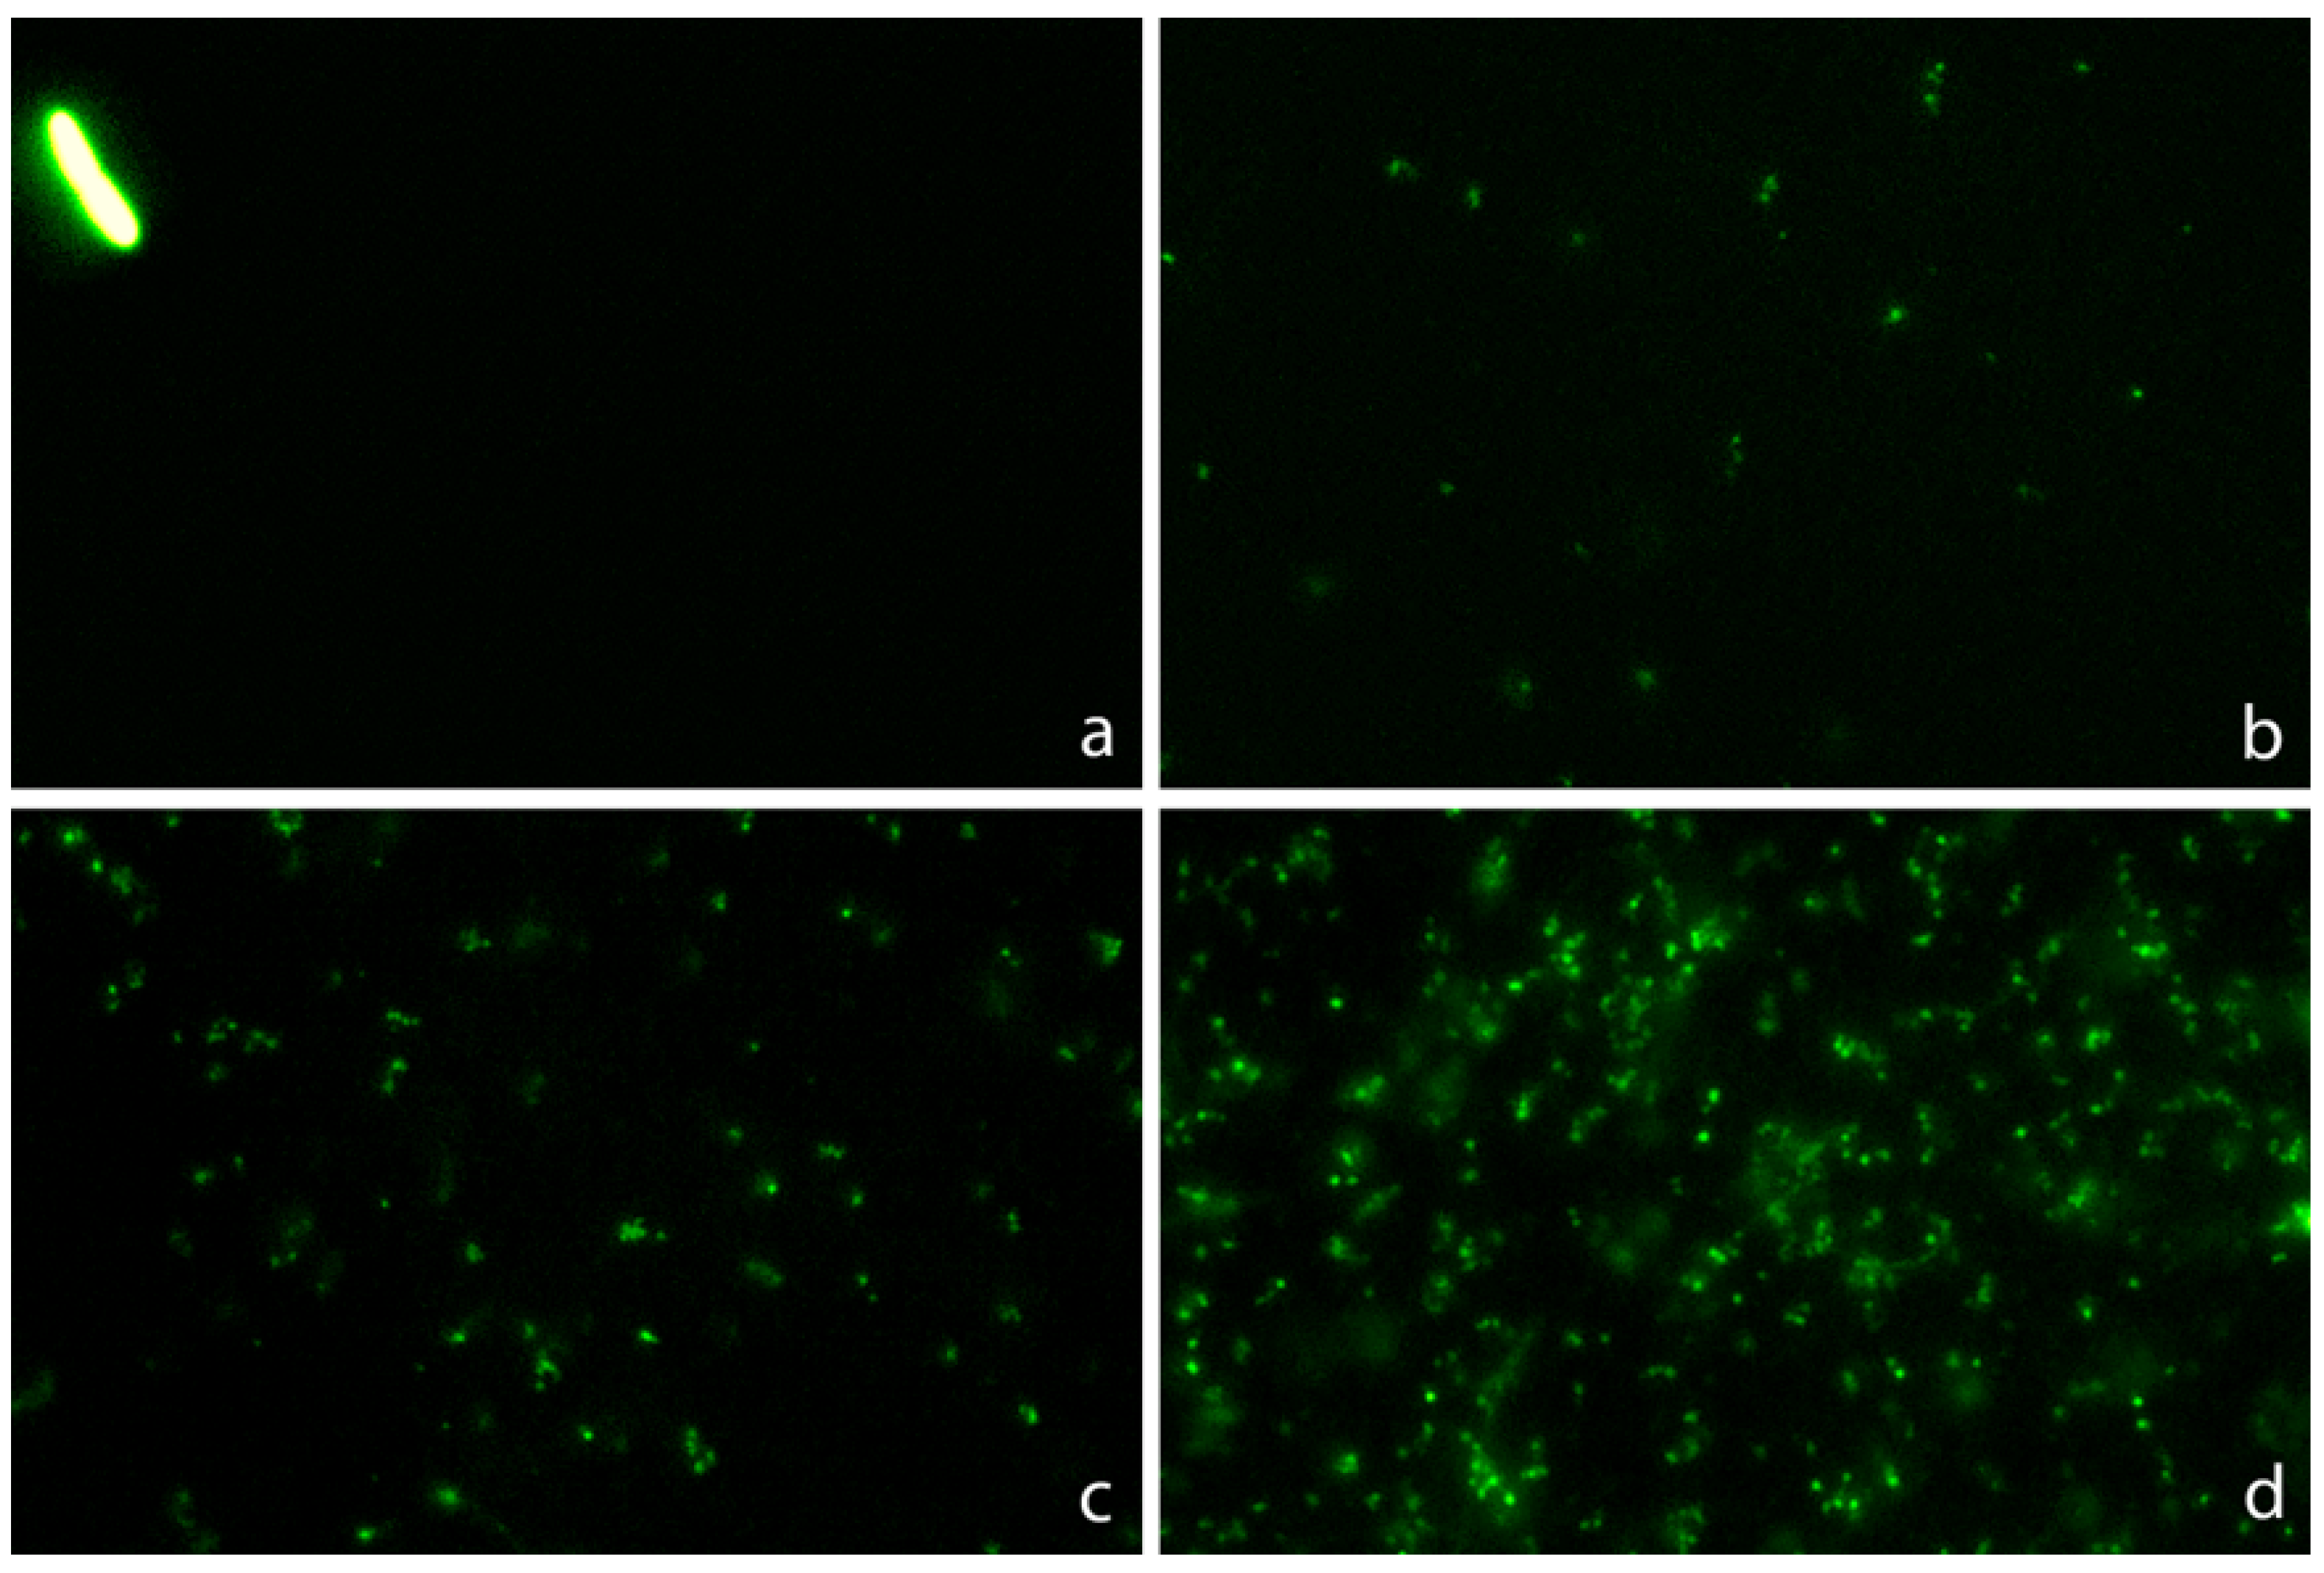
C. One strain susceptible (MIC: 4 mg/L) and one resistant (MIC: 128 mg/L) were incubated with increasing concentrations of ampicillin for 45 min (
Figure 4). In the susceptible strain, a significant increase in the intercellular DNA spots was evident at 2 mg/L, rising progressively to achieve a median of 2.51 spots/µm
2 at 32 mg/L. The resistant strain did not increase the background DNA fragments at any dose (
Figure 5).
2.3. Dose-Responses to Combined Ciprofloxacin and Ampicillin
One strain susceptible to both ciprofloxacin (MIC: 0.047 mg/L) and ampicillin (MIC: 4 mg/L) and another strain resistant to ciprofloxacin (MIC: 8 mg/L) but susceptible to ampicillin (MIC: 6 mg/L) were co-incubated with both antibiotics for 45 min. After technical processing, RNS and background of DNA fragments were recorded.
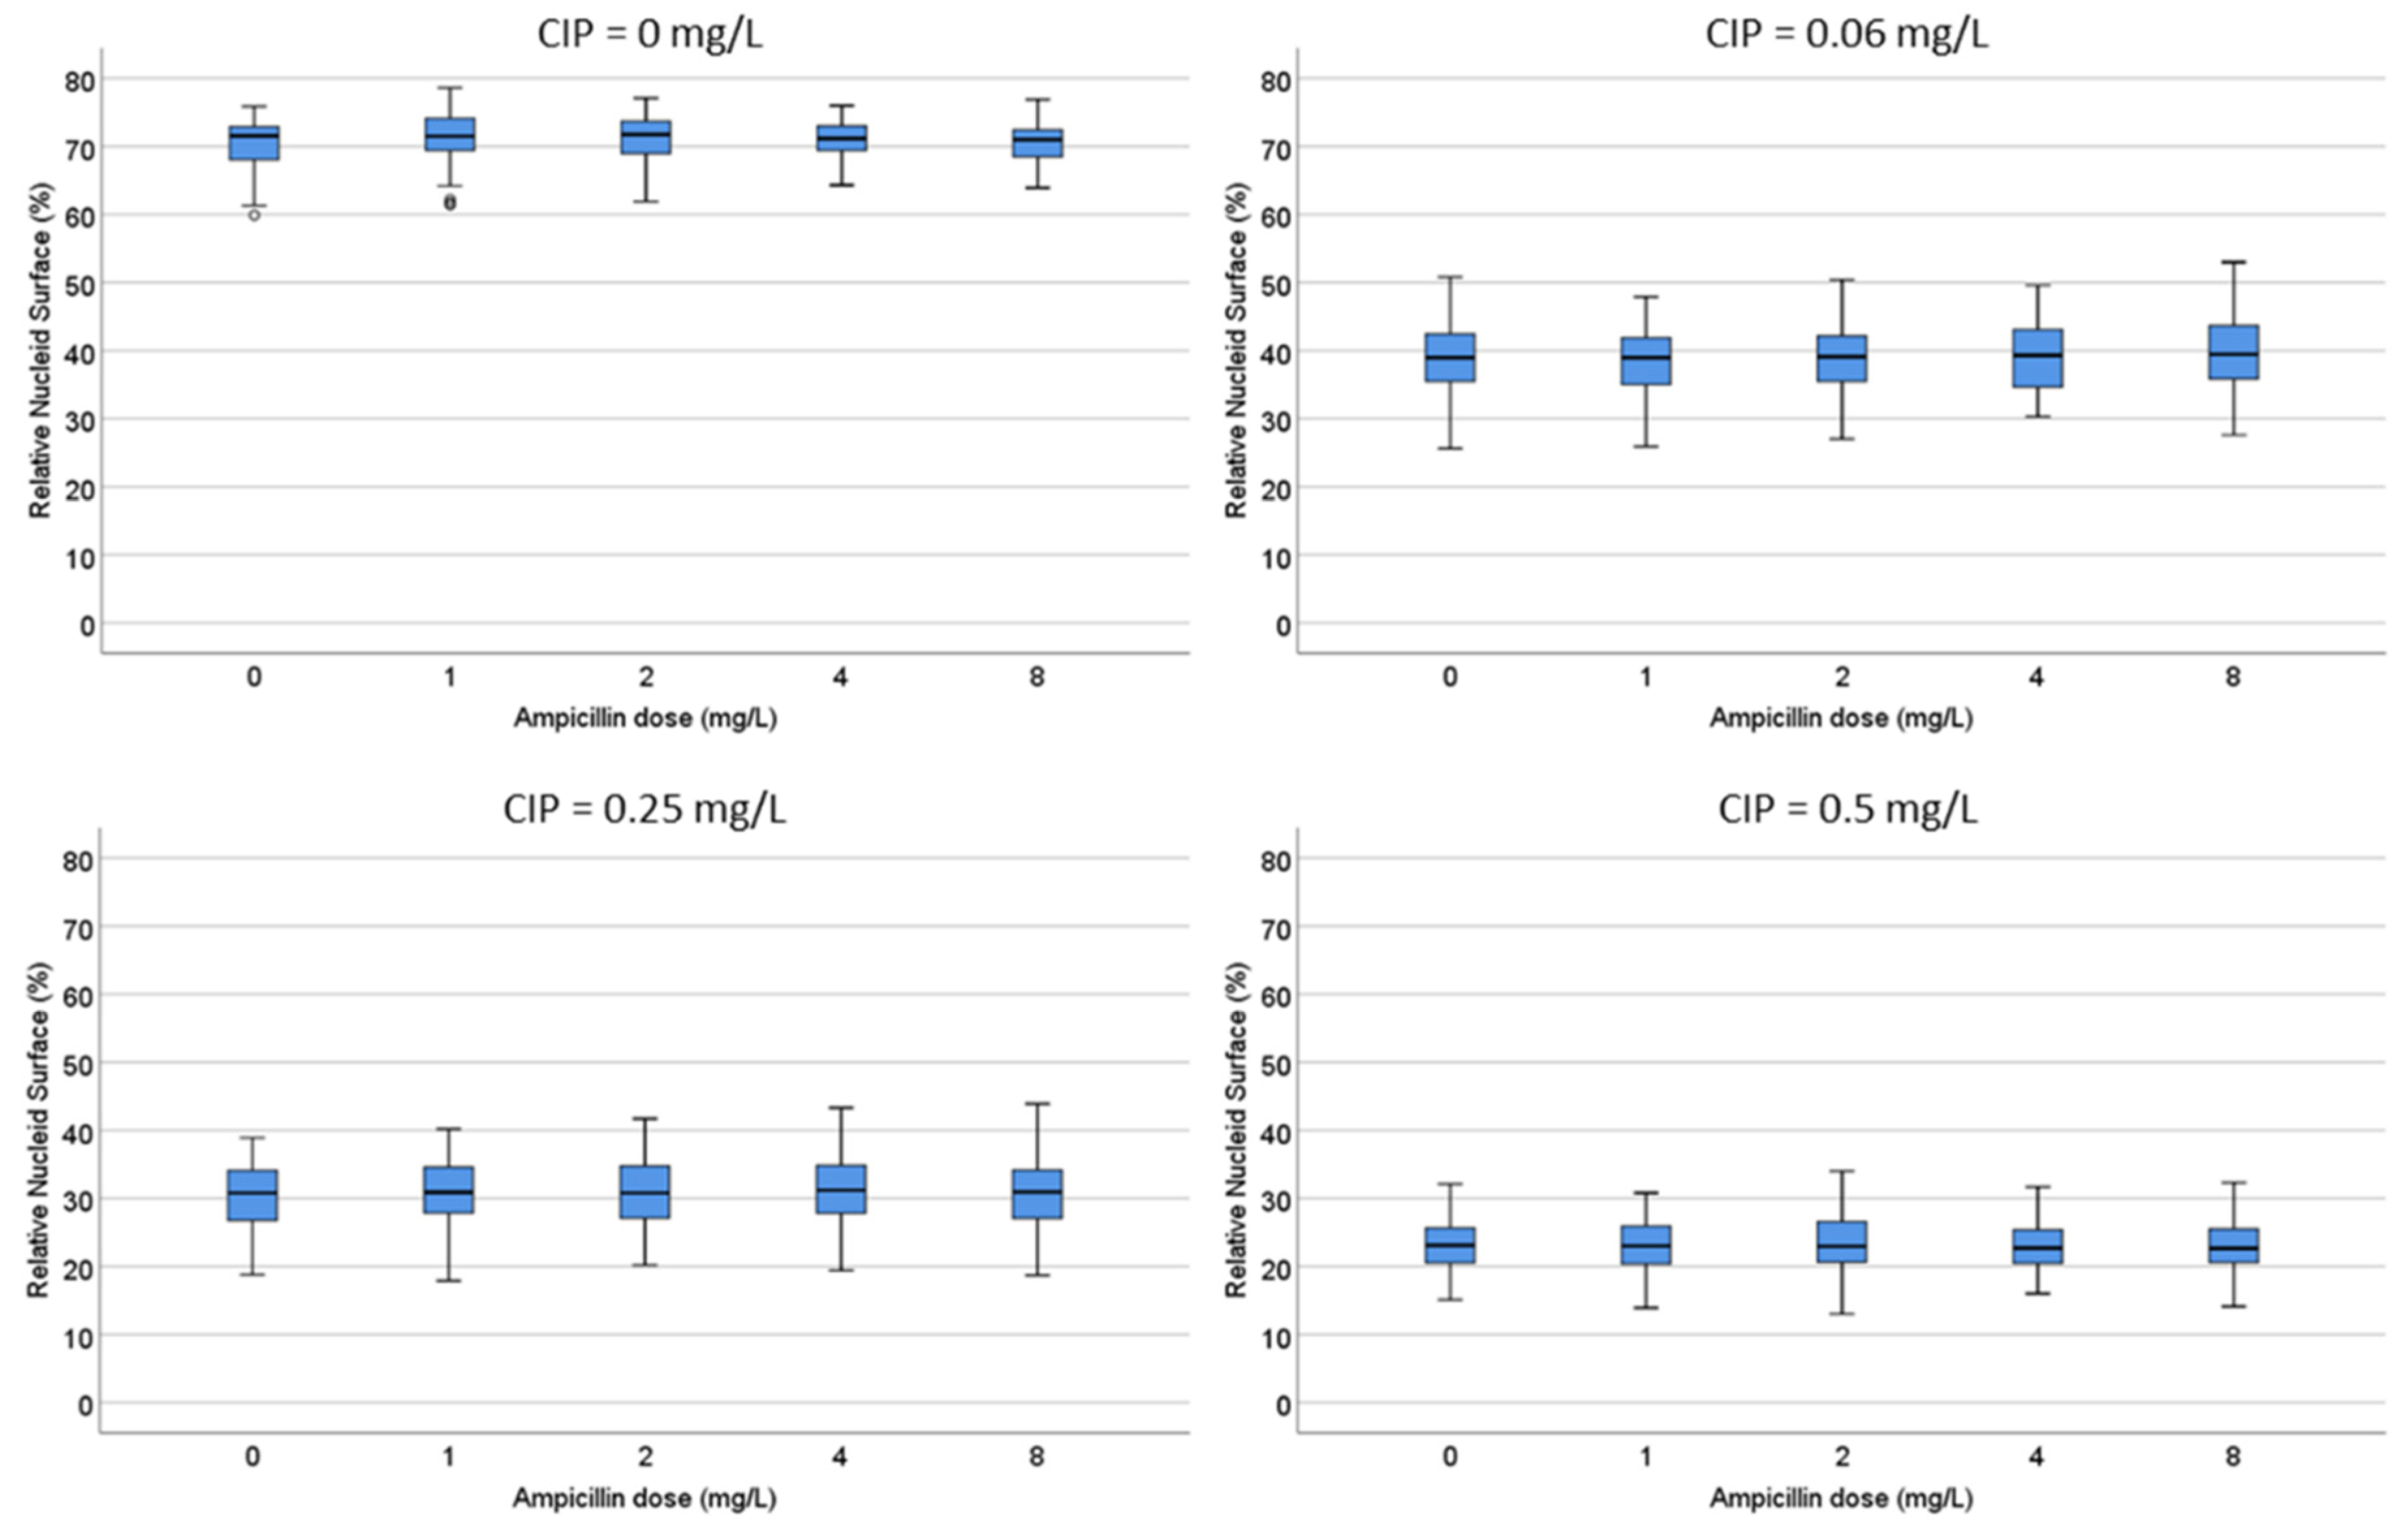
D. Both strains were incubated with ciprofloxacin 0, 0.06, 0.25 and 0.5 mg/L. For each fixed dose of ciprofloxacin, ampicillin was simultaneously added at 0, 1, 2, 4 and 8 mg/L. In the strain susceptible to ciprofloxacin, the median RNS decreased from 70.6% to 20.5% as the quinolone increased. The RNS from each ciprofloxacin dose was not modified by any concentration of ampicillin (
Figure 6). In the strain resistant to ciprofloxacin, the baseline RNS was not affected by the quinolone nor by the ampicillin.
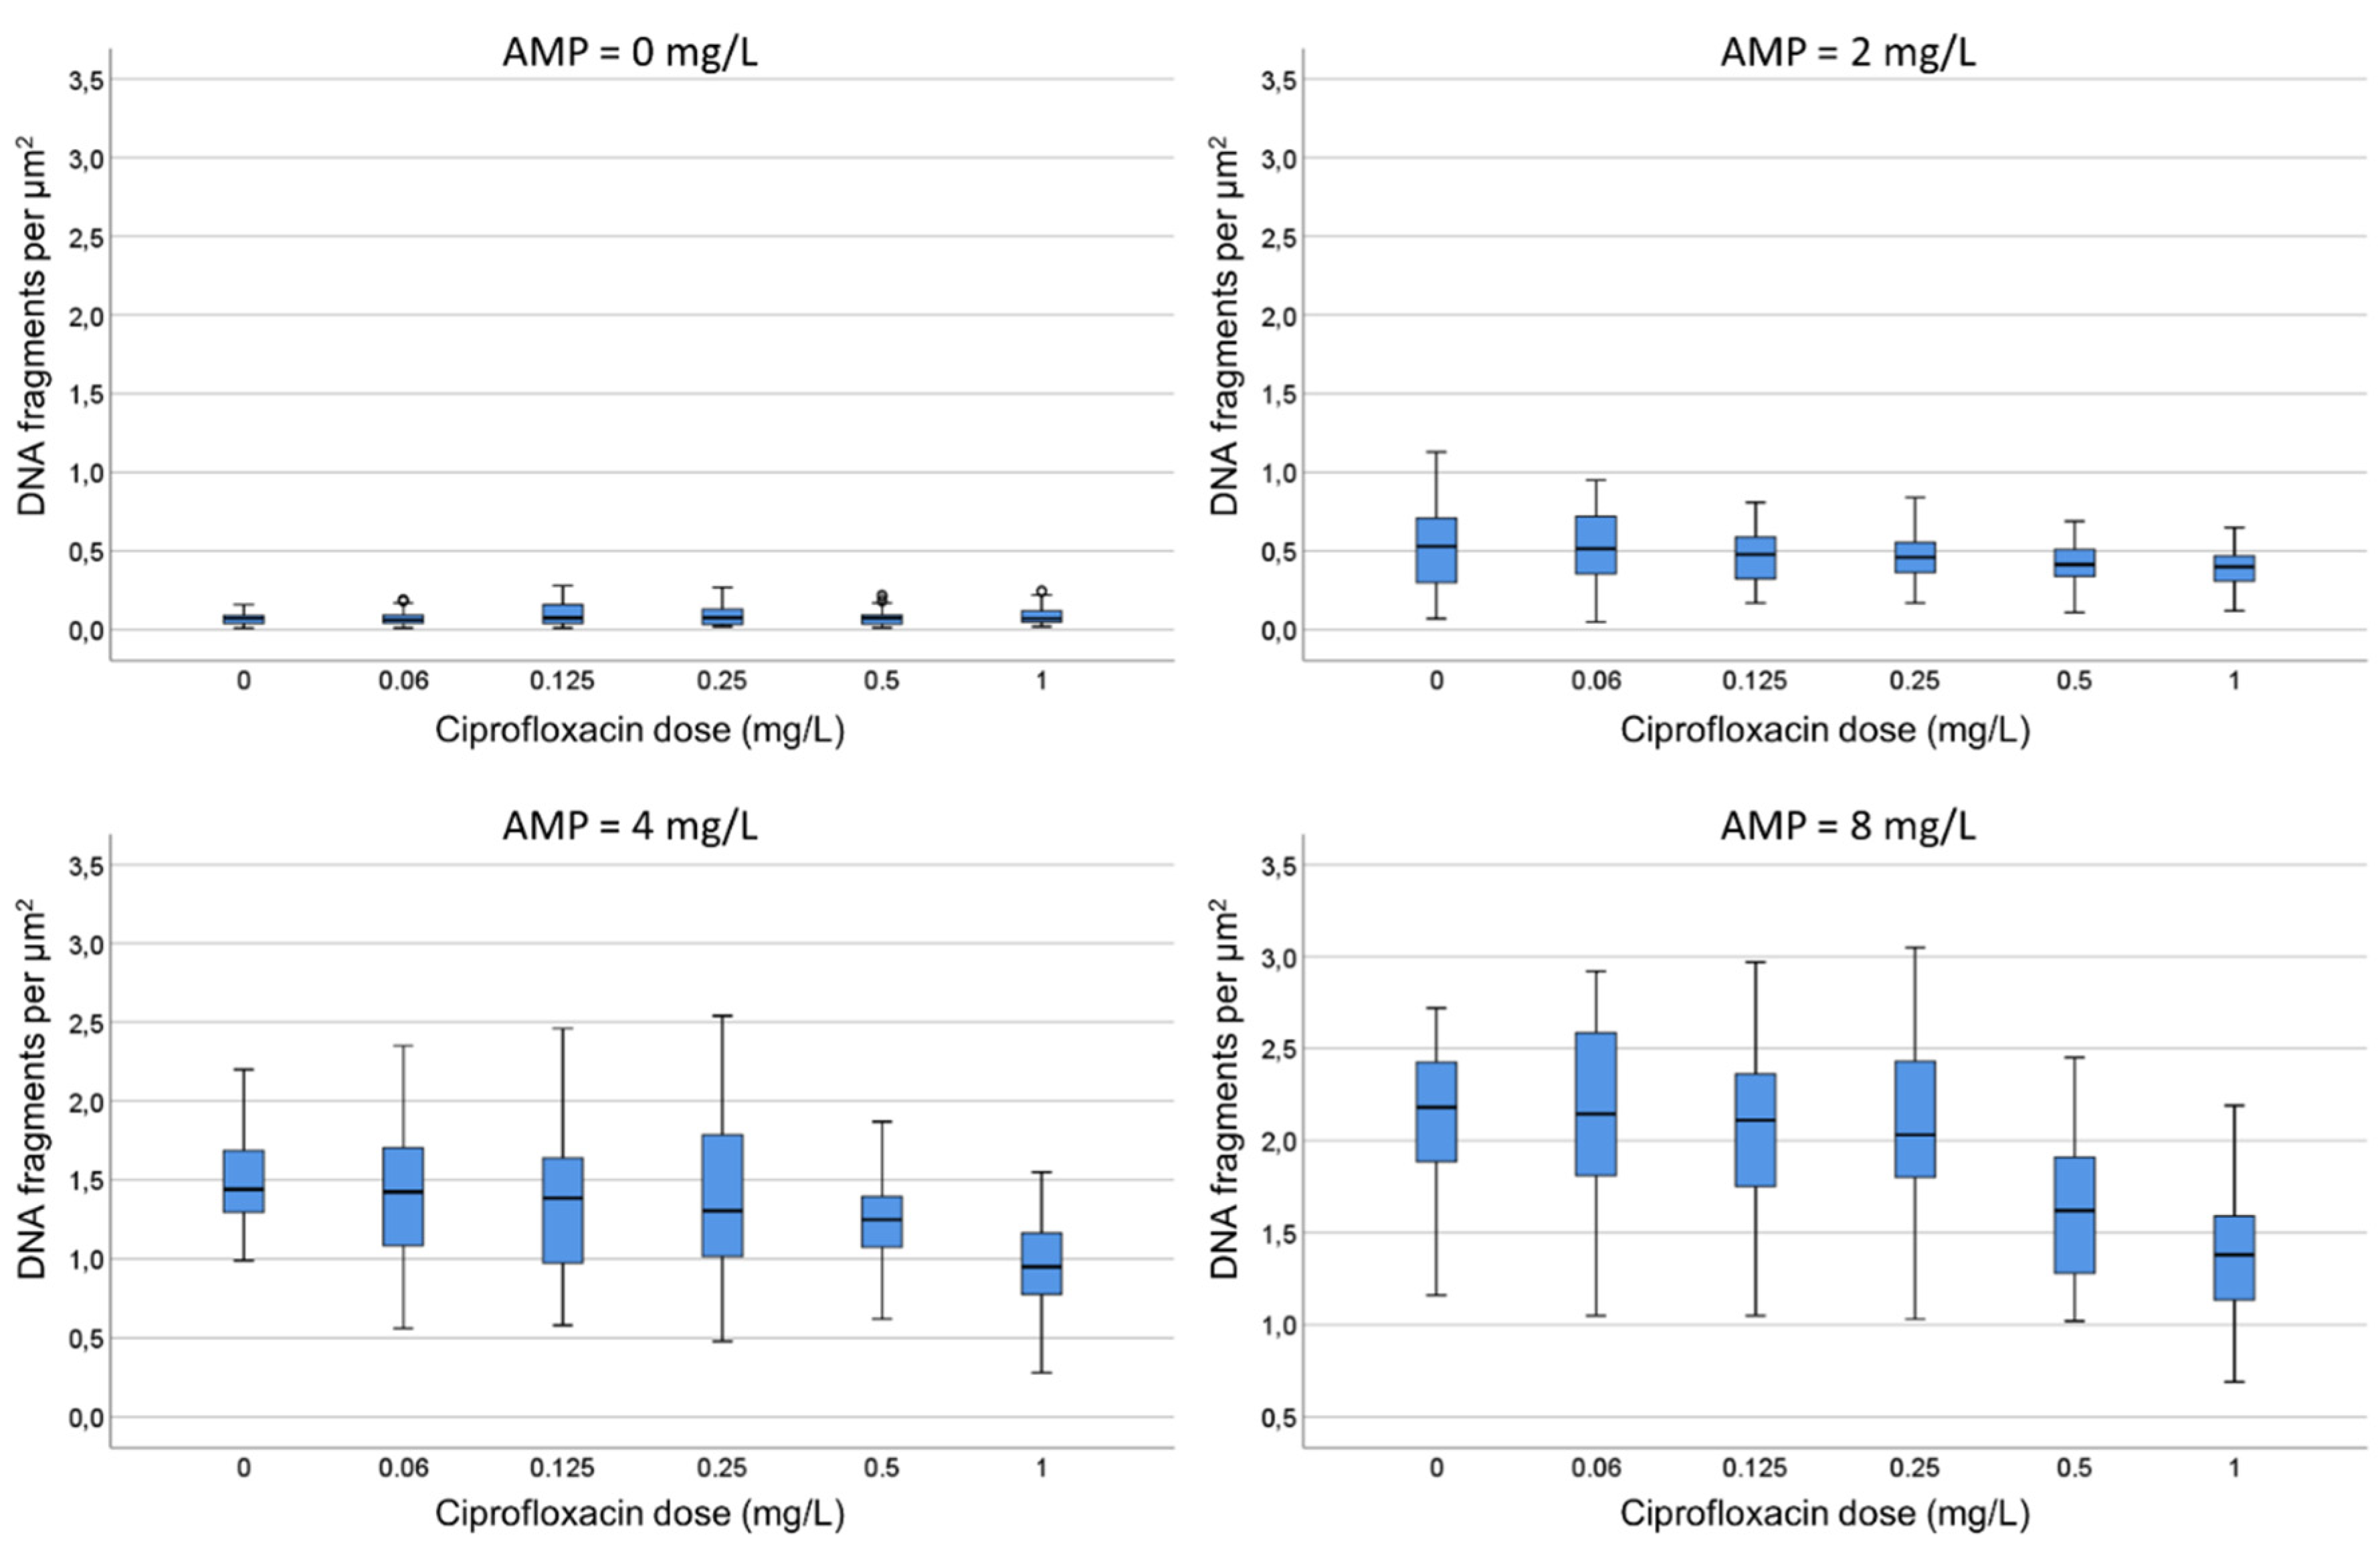
E. Both strains were incubated with ampicillin 0, 2, 4 and 8 mg/L. For each fixed dose of ampicillin, ciprofloxacin was simultaneously added at 0, 0.06, 0.125, 0.25, 0.5 and 1 mg/L. In the strain susceptible to ciprofloxacin, as ampicillin increased, the median of background DNA fragments increased from 0.06 to 2.18 spots/µm
2. For each concentration of ampicillin, ciprofloxacin decreased the spots/µm
2 in a dose-dependent way (
Figure 7). For example, the 2.18 spots/µm
2 obtained at the highest dose of ampicillin alone were reduced to 1.38 spots/µm
2 when co-incubated with the highest dose of the quinolone. Despite the reduction of the DNA spots with respect to the culture incubated with ampicillin only, the background continued to be highly remarkable. In the strain resistant to ciprofloxacin, the co-incubation with the quinolone did not affect the background of DNA spots produced by ampicillin.
2.4. Comparison with the Standard Antibiogram
F. E. coli clinical isolates (n = 60) were categorized accordingly to the standard antibiograms in susceptible to ciprofloxacin and ampicillin (n = 13), non-susceptible to both antibiotics (n = 18), susceptible to ciprofloxacin and non-susceptible to ampicillin (n = 11) and non-susceptible to ciprofloxacin and susceptible to ampicillin (n = 18). These strains were co-incubated with the EUCAST breakpoints of susceptibility for ciprofloxacin (0.25 mg/L) and ampicillin (8 mg/L) for 45 min and technically processed [
36].
A RNS breakpoint for ciprofloxacin was established based on one strain whose MIC was similar to that of the CLSI cut-off point. This strain had a baseline RNS value of 48.4% median, which decreased significantly to 37.3% after being incubated with the MIC-CLSI breakpoint dose. The TG1 baseline median RNS was the lowest, 46.9 %. Taking this into account, a cut-off point of susceptibility for 0.25 mg/L ciprofloxacin was established as < 40% median RNS.
Regarding ampicillin, in strains whose MIC was close to the CLSI breakpoint, this dose produced a median of 2.1 spots/µm2 of intercellular DNA fragments, which decreased to 1.7 spots/µm2 when co-incubated with the CLSI breakpoint for ciprofloxacin, being highly susceptible to the quinolone. The background of the strains was habitually very low, 0.01-0.05 spots/µm2 median, but one strain showed 0.5 spots/µm2, so a cut-off point of susceptibility for 8 mg/L ampicillin was established as > 1 spots/µm2 median.
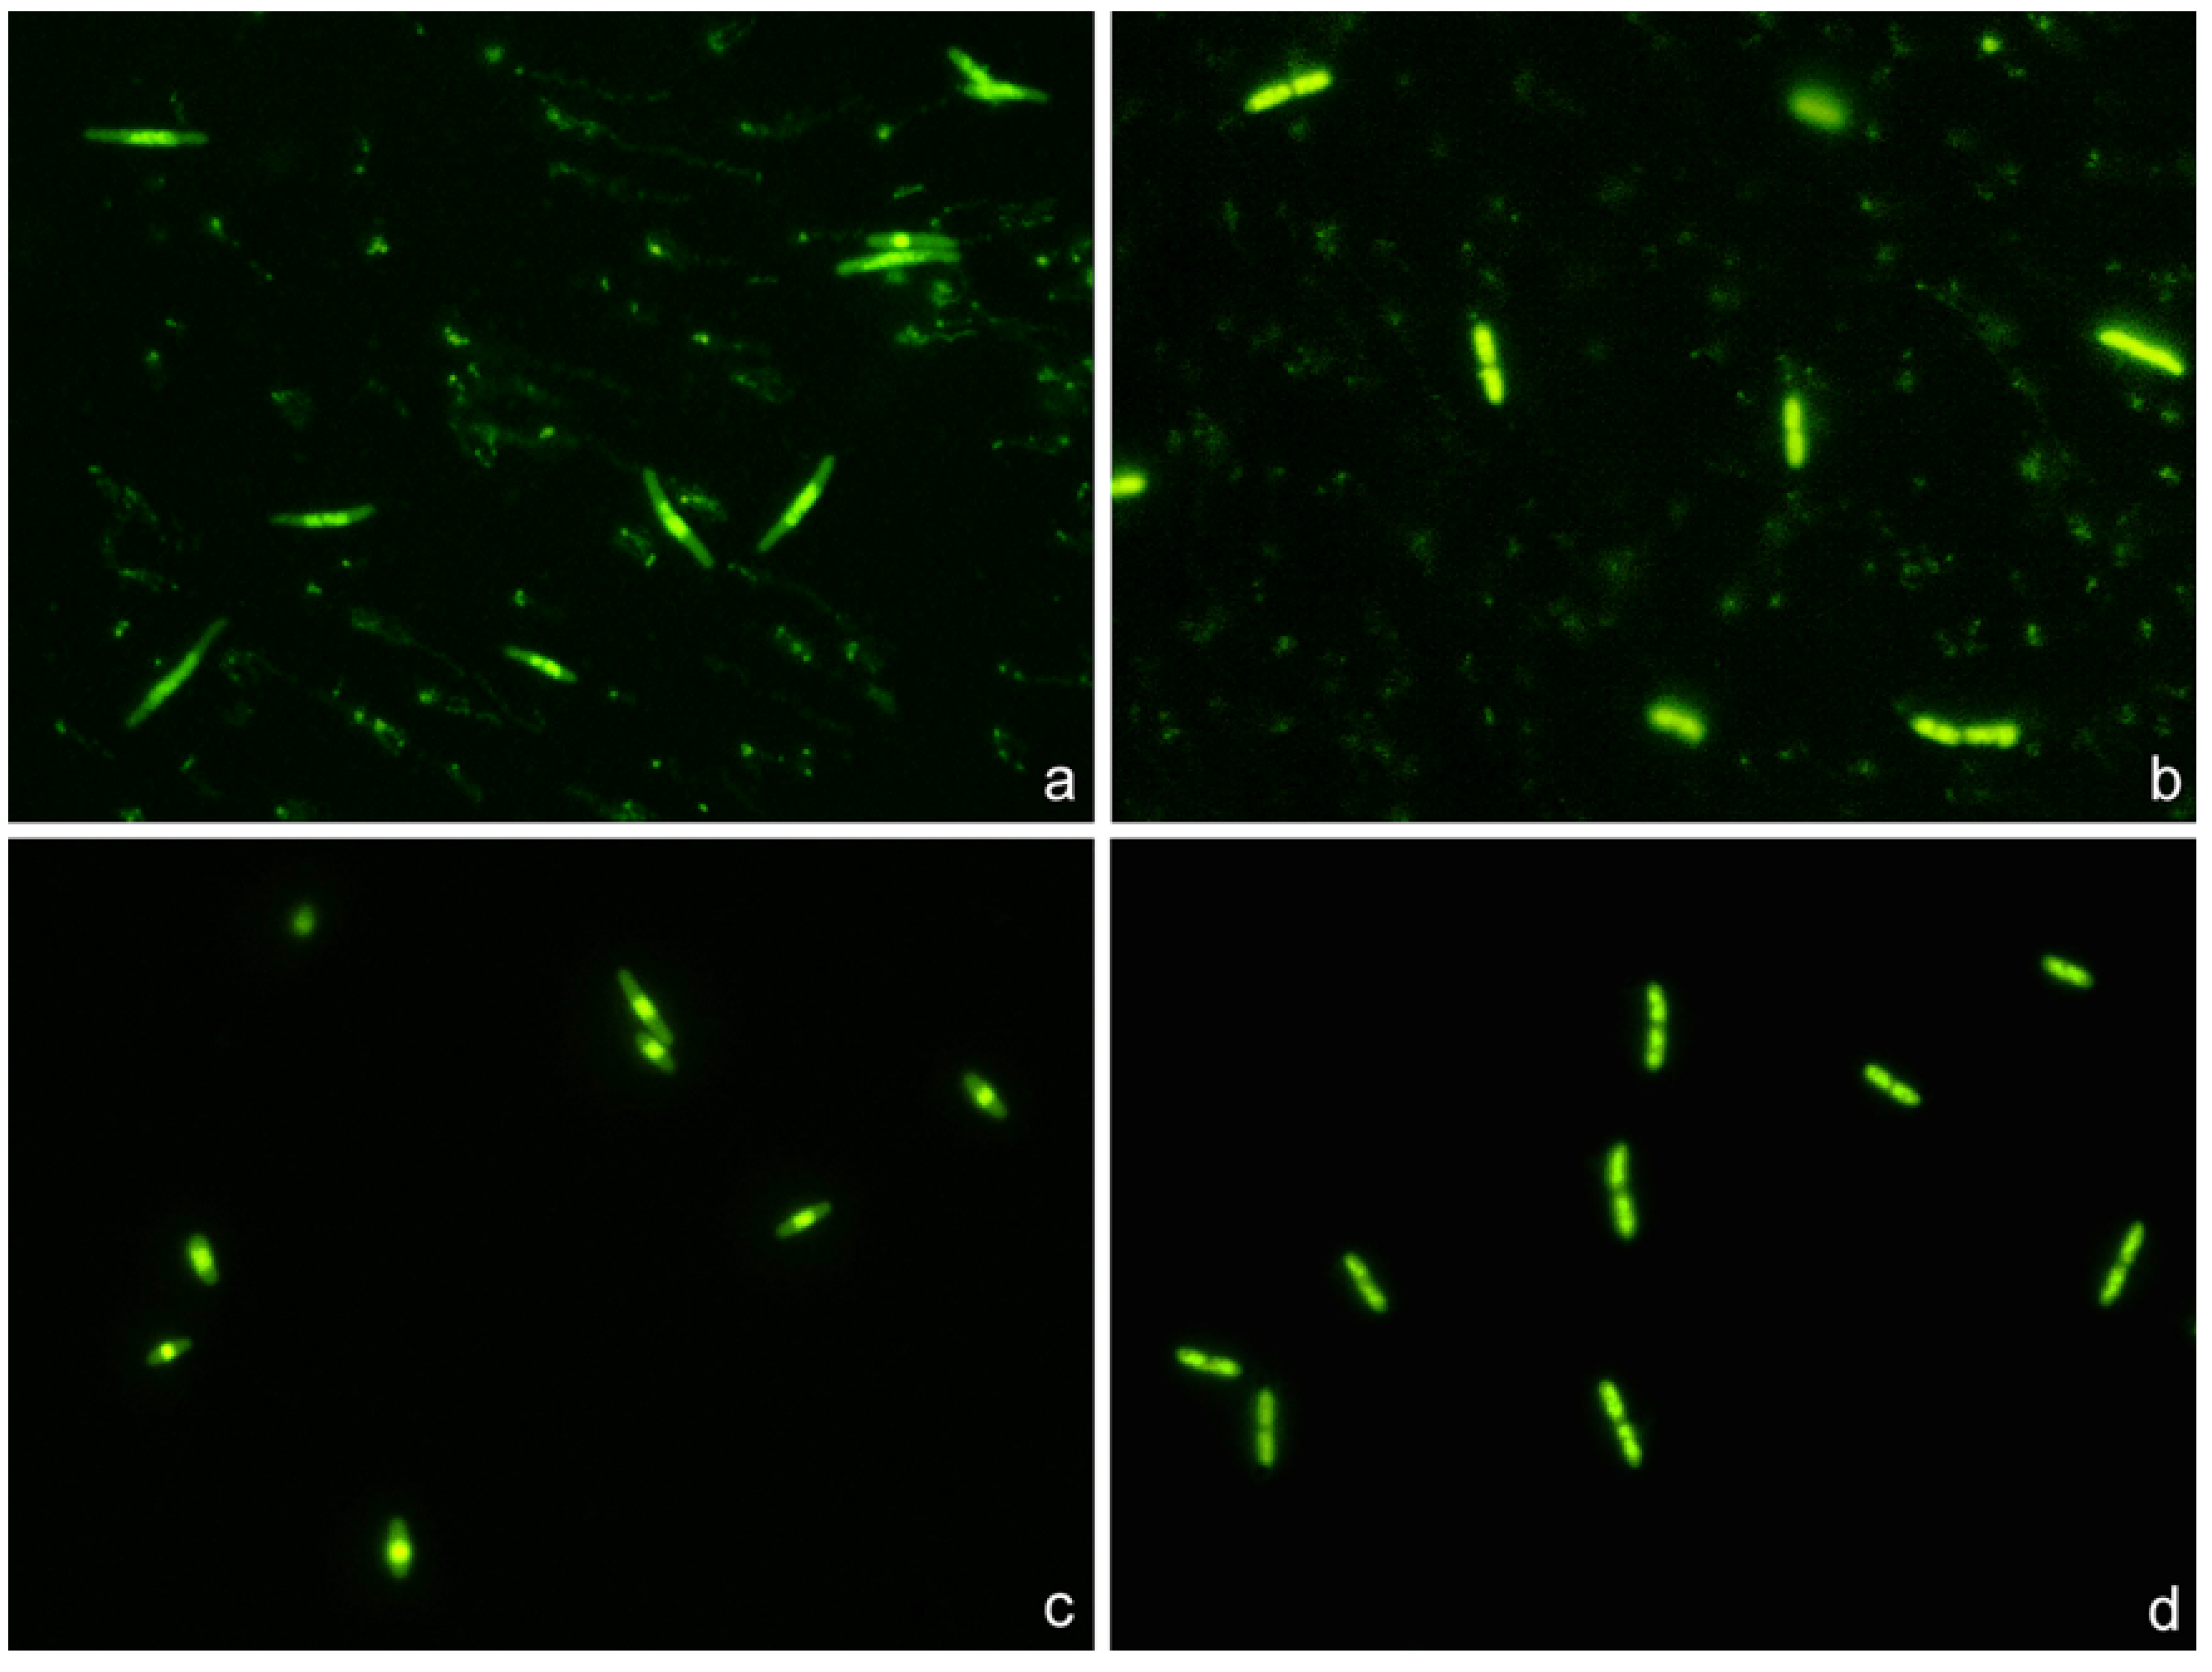
Strains susceptible to ciprofloxacin and ampicillin clearly showed highly condensed central nucleoids and a significant background of intercellular DNA spots (
Figure 8). Strains susceptible to ciprofloxacin but non-susceptible to ampicillin revealed highly packed nucleoids but practically no background of DNA spots. Strains non-susceptible to ciprofloxacin but susceptible to ampicillin showed a very high background of DNA fragments but the nucleoids were spread inside the cells, without change with respect to those of the control untreated cultures. Strains non-susceptible to both antibiotics were similar to the control untreated cultures, with spread nucleoids and practically no intercellular DNA fragments (
Figure 8). The results of the categorization by the phenotypic functional assay were fully concordant with those from the standard antibiogram for each specific antibiotic.
3. Discussion
Progress has been achieved in the isolation and rapid identification of the microorganism that causes an infection, through specific selective cultures and molecular or proteomic techniques. Nevertheless, after identification, an antibiogram must be performed. Many experimental rapid antibiograms rely on the effect, or lack thereof, by the antibiotics of the bacterial growth or related metabolic activity and cell mass parameters [
14,
15,
16,
17,
18,
19,
20,
21,
22,
23,
24,
25,
26,
27,
28,
29,
30,
31]. To perform these antibiograms it is necessary to collect a sufficient mass of bacteria (i.e., germs) to evaluate. The more antibiotics to test, the more germs, and all of this implies a necessary and preceding growth time.
The main mechanisms of antibiotic resistance include neutralization through enzymatic activity, modification of antibiotic targets, inactivation of porin channel and upregulation of efflux pumps [
37]. Nucleic acid or mass spectroscopy-based approaches may detect mutations in known genes or specific metabolites or the proteins involved in the different mechanisms of resistance, so theoretically may provide information on possible susceptibility/resistance to different antibiotics in a single assay [
6]. Nevertheless, it requires previous knowledge of the resistance mechanism and may not be confident in evaluating the level of non-susceptibility and detecting uncharacterized process of resistance. Moreover, the molecular profile may not be strictly correlated with the functional phenotype [
4]. Phenotypic assays overcome these limitations.
Regarding morphological phenotypic responses, it has been reported that the treatment of
E. coli with fluoroquinolones like fleroxacin produces nucleoids that are progressively smaller with increasing concentrations [
38]. This is extensively explored in the present report, detailing quantitatively that
E. coli exposed to ciprofloxacin shows a marked reorganization of the nucleoid when it is affected by the antibiotic. However, resistant bacilli show no change in the morphological pattern of the nucleoid, being similar to the control without quinolone. The phenomenon follows a dose-response behavior, depending on the MIC of the pathogen. This quinolone evaluation system is a much simpler and faster technique than the one we had initially developed, which needed a bacterial lysis and the evaluation of the level of fragmentation or not from the DNA of the released nucleoids [
31,
32]. In the new technique, it is not necessary to perform any lysis. Otherwise, regarding phenotypic responses to beta-lactams, we had stated that gram-negative bacilli incubated with penicillins resulted in a background of intercellular DNA fragments which seemed related to dose and susceptibility [
33].
Taking advantage of these referred morphological responses, the present report is a proof of concept of the feasibility of an entirely phenotypic functional assay for the rapid simultaneous determination of susceptibility or not to a mixture of a quinolone (ciprofloxacin) and a penicillin (ampicillin) in E. coli, independently of the possible mechanism of resistance. The experimental conditions were set up, introducing quantitative estimations through image analysis, validating the combination of both parameters to assess each antibiotic individually. This is a simple methodology, summarized in the following steps: 1. Brief co-incubation of the bacterial strain with both antibiotics in broth culture. 2. Immobilization of the microorganisms and background DNA fragments of culture on a slide. 3. High sensitivity fluorescent nucleic acid dying for microscopy and evaluation of the condensation or not of the nucleoid inside the bacteria (regarding ciprofloxacin susceptibility or resistance, respectively) and presence or not of intercellular DNA spots (regarding ampicillin susceptibility or resistance, respectively). It must be noted that ciprofloxacin and/or ampicillin treatments did not significantly modify the cell length or volume under the incubation time and conditions of the assay.
In the present study, the technical manipulation is minimum, with practically only incubation and visualization, so results may be obtained in one hour. It must be taken into account that if the bacteria are not growing exponentially, they should be previously incubated in liquid broth for 90 min, to achieve the active growing phase. A simple brief visual inspection of the slide allows one to confidently recognize the activity, or lack thereof, of each antibiotic. If a more precise assessment is required, the use of image analysis software may provide an accurate quantitative approach, as demonstrated. To gain assurance, it is recommended the concurrent processing of known reference strains, susceptible to both antibiotics, resistant to both, susceptible to one and resistant to another and vice versa.
Although the work is a proof of concept, it may have clinical interest since some studies have shown that the combination of a fluoroquinolone with a beta-lactam had
in vitro and
in vivo synergy against extended-spectrum beta-lactamase producing
E. coli and
P. aeruginosa isolates [
39]. Moreover, it has reduced mortality for bacteremia caused by gram-negative bacilli [
40].
The possibility of being able to incubate bacteria with a combination of antibiotics and recognize the sensitivity or resistance to each of them, simultaneously but independently, can reduce the required cell amounts for testing and shorten the time to obtain results. Such aforementioned procedural improvements may be crucial for the success of the treatment in cases of great urgency. In addition, it could also guide the very urgent prescription of a combination of antibiotics to the critical patient in order to obtain antibacterial synergism or try to reduce the toxicity of a certain drug. This may also help to prevent the development and spreading of antimicrobial resistance.
4. Materials and Methods
4.1. Bacterial Strains and Minimum Inhibitory Concentrations (MICs) Determination
The work was performed using
E. coli TG1 strain and clinical isolates of
E. coli (n=60) collected at the University Hospital A Coruña between 2010 and 2021. Bacteria were routinely grown in Mueller-Hinton broth (1% Bacto Tryptone, 0.5% yeast extract, 0.5% NaCl) or on Mueller-Hinton agar plates, at 37ºC in aerobic conditions. Cell growth in liquid cultures was observed by monitoring turbidity with the spectrophotometer at OD600 (Unicam 8625, Cambridge, UK). The MICs were ascertained by automated microdilution (MicroScan Walkaway, Siemens) and corroborated by a Liofilmchem MIC Test Strip according to the manufacturer’s instructions, with susceptibility defined using EUCAST criteria [
36].
4.2. Technical Processing
To immobilize the intact bacteria on slides, the Micro-Halomax® kit for fluorescence microscopy (Halotech DNA SL, Madrid, Spain) was used [
31,
32,
33]. An aliquot of each sample was diluted to a concentration of 1 x 10
7 microorganisms/ml in Mueller-Hinton broth. 18 μl of bacterial culture were mixed with 6 μl of the antibiotic solution in a microtiter plate, the final volume being adjusted to 30 μl and incubated 45 min at 37ºC. 0.5 ml snap cap microfuge tubes containing gelled aliquots of low-melting point agarose are provided with the kit to process a sample. The tube was placed in a water bath at 90-100ºC for 5 min to completely melt the agarose, and then placed in a water bath at 37ºC. The 30 μl of the bacterial-antibiotic sample were added to the tube and mixed with the 70 μl of melted agarose. Aliquots of 10 μl of the sample-agarose mixture were pipetted onto a precoated slide and covered with an 18 x 18 mm coverslip. The slide was placed on a cold plate in the refrigerator (4ºC) for 5 min, to allow the agarose to produce a microgel with the trapped intact cells inside. The slide was dehydrated by incubating horizontally in increasing cold (-20ºC) ethanol baths (70-90-100%) for 2 min each, and air-dried in an oven. DNA staining was performed with 25 μl the fluorochrome SYBR Gold (Molecular Probes, Eugene, OR, USA) that had been diluted 1:400 in TBE buffer (0.09M Tris-Borate, 0.002M EDTA, pH 7.5), incubating for 5 min in the dark.
Images were viewed under an epifluorescence microscope (Nikon E800), with a 100x objective and appropriate fluorescence filter, and acquired using a high-sensitivity CCD camera (KX32ME, Apogee Instruments, Roseville, CA). Groups of 16 bit digital images were obtained for each experimental point under similar conditions and stored in tiff. file format. Image analysis was performed using macros designed with NIS-Elements software (Nikon Instruments Inc., Tokyo, Japan). For ciprofloxacin, the total cell surface and nucleoid surface to establish the relative nucleoid surface (RNS, in %) was measured in 100 cells per assay. For ampicillin, the software discriminates the bacteria from spots corresponding to DNA fragments spread out in the background and counts the number of these particles. Results were reported as DNA fragments per µm2 of slide surface.
4.3. Experiments
4.3.1. Dose-Response to Ciprofloxacin
A. E. coli TG1 strain exponentially growing in Mueller-Hinton broth was incubated with ciprofloxacin (MIC: 0.012 mg/L) for 45 min, to eleven increasing concentrations from 0.003 to 1 mg/L, besides the control without antibiotic. After technical processing, RNS was established for each concentration.
B. Strains with MIC 0.007, 0.012, 0.25 and 8 mg/L were incubated with 0, 0.25X, 0.5X, 1X, 10X and 100X MIC concentrations, for each strain. After technical processing, RNS was established for each concentration. Previous data about the degree of DNA fragmentation were available from the experiment b [
31], where the diameter of the halo of DNA spots emerging from the residual core of the lysed bacteria had been measured in μm. This allowed to estimate a possible correlation between RNS and DNA fragmentation level, as well as regression analysis.
4.3.2. Dose-Response to Ampicillin
C. One strain susceptible (MIC: 4 mg/L) and one resistant (MIC: 128 mg/L) were incubated for 45 min with 0, 0.25, 0.5, 1, 2, 4, 8, 16 and 32 mg/L ampicillin. After technical processing, the number of intercellular DNA spots per µm2 were established.
4.3.3. Dose-Responses to Combined Ciprofloxacin and Ampicillin
This experiment was performed with two strains, one susceptible to both ciprofloxacin (MIC: 0.047 mg/L) and ampicillin (MIC: 4 mg/L) and another strain resistant to ciprofloxacin (MIC: 8 mg/L) but susceptible to ampicillin (MIC: 6 mg/L). After 45 min of co-incubation and subsequent technical processing, RNS and background of DNA fragments were recorded.
D. Both strains were incubated with ciprofloxacin 0, 0.06, 0.25 and 0.5 mg/L. For each fixed dose of ciprofloxacin, ampicillin was simultaneously added at 0, 1, 2, 4 and 8 mg/L.
E. Both strains were incubated with ampicillin 0, 2, 4 and 8 mg/L. For each fixed dose of ampicillin, ciprofloxacin was simultaneously added at 0, 0.06, 0.125, 0.25, 0.5 and 1 mg/L.
4.3.4. Comparison with the Standard Antibiogram
F. Clinical isolated E. coli strains (n = 60) were co-incubated with the EUCAST breakpoints of susceptibility for ciprofloxacin (0.25 mg/L) and ampicillin (8 mg/L) for 45 min. After technical processing, susceptibility or non-susceptibility was determined according to RNS for ciprofloxacin and number of intercellular DNA spots per µm2 for ampicillin.
4.4. Data Analysis
Data were analyzed with the SPSS software package for windows (IBM). Friedman test and Wilcoxon text with Bonferroni correction were employed for statistical comparisons. The relationship between RNS and DNA fragmentation was assessed using Spearman correlation and linear regression analysis. Significance was established as p < 0.05.
Supplementary Materials
The following supporting information can be downloaded at: Preprints.org, Figure S1: Linear regression showing the relationship between the mean Relative Nucleoid Surface (RNS) of E. coli strains incubated with ciprofloxacin and the mean diameter of dispersion of DNA spots observed after bacterial lysis [
31].
Author Contributions
Conceptualization: J.L.F. and G.B.; study design, J.L.F. and G.B.; methodology, I.L., F.O. and M.d.C.F.; software, I.L. and F.O.; validation, I.L. and F.O. statistical analysis, F.O., G.B. and J.G.; writing—original draft preparation, J.L.F.; writing—review and editing, J.L.F., G.B. and J.G.; supervision, J.L.F. and funding acquisition, J.L.F. and G.B. All authors have read and agreed to the published version of the manuscript.
Funding
This work was funded by Project PI20/01263 awarded to J.L.F. within the National Plan for Scientific Research, Development and Technological Innovation 2017–2020 funded by the Instituto de Salud Carlos III (ISCIII)-General Subdirection of Assessment and Promotion of the Research-European Regional Development Fund (FEDER) “A way of making Europe”. The work was also supported by CIBERINFEC (Infectious Diseases Area of the Network Biomedical Research Center of the Carlos III Health Institute). This work was also funded by IMI 6th call COMBACTE New Drugs 4 Bad Bugs (ND4BB).
Institutional Review Board Statement
Not Applicable.
Informed Consent Statement
Not Applicable.
Data Availability Statement
Not Applicable.
Acknowledgments
We are grateful to Michael E. Kjelland for revision of the manuscript.
Conflicts of Interest
J.G. and J.L.F. are advisers of Halotech DNA SL. All other authors declare no conflict of interest.
References
- Jorgensen JH, Ferraro MJ. Antimicrobial susceptibility testing: a review of general principles and contemporary practices. Clin Infect Dis. 2009 Dec 1;49(11):1749-55. [CrossRef] [PubMed]
- Peleg AY, Hooper DC. Hospital-acquired infections due to gram-negative bacteria. N Engl J Med. 2010 May 13;362(19):1804-13. [CrossRef] [PubMed]
- Khan ZA, Siddiqui MF, Park S. Current and emerging methods of antibiotic susceptibility testing. Diagnostics (Basel). 2019 May 3;9(2):49. [CrossRef] [PubMed]
- Maugeri G, Lychko I, Sobral R, Roque ACA. Identification and antibiotic-susceptibility profiling of infectious bacterial agents: a review of current and future trends. Biotechnol J. 2019 Jan;14(1):e1700750. Epub 2018 Aug 26. [CrossRef] [PubMed]
- van Belkum A, Bachmann TT, Lüdke G, Lisby JG, Kahlmeter G, Mohess A, Becker K, Hays JP, Woodford N, Mitsakakis K, Moran-Gilad J, Vila J, Peter H, Rex JH, Dunne WM Jr; JPIAMR AMR-RDT Working group on antimicrobial resistance and rapid diagnostic testing. Developmental roadmap for antimicrobial susceptibility testing systems. Nat Rev Microbiol. 2019 Jan;17(1):51-62. [CrossRef] [PubMed]
- Datar R, Orenga S, Pogorelcnik R, Rochas O, Simner PJ, van Belkum A. Recent Advances in Rapid Antimicrobial Susceptibility Testing. Clin Chem. 2021 Dec 30;68(1):91-98. [CrossRef] [PubMed]
- Syal K, Mo M, Yu H, Iriya R, Jing W, Guodong S, Wang S, Grys TE, Haydel SE, Tao N. Current and emerging techniques for antibiotic susceptibility tests. Theranostics. 2017 Apr 10;7(7):1795-1805. [CrossRef] [PubMed]
- Baltekin Ö, Boucharin A, Tano E, Andersson DI, Elf J. Antibiotic susceptibility testing in less than 30 min using direct single-cell imaging. Proc Natl Acad Sci U S A. 2017 Aug 22;114(34):9170-9175. Epub 2017 Aug 8. [CrossRef] [PubMed]
- Hayden RT, Clinton LK, Hewitt C, Koyamatsu T, Sun Y, Jamison G, Perkins R, Tang L, Pounds S, Bankowski MJ. Rapid antimicrobial susceptibility testing using forward laser light scatter technology. J Clin Microbiol. 2016 Nov;54(11):2701-2706. Epub 2016 Aug 24. [CrossRef] [PubMed]
- Pulido MR, García-Quintanilla M, Martín-Peña R, Cisneros JM, McConnell MJ. Progress on the development of rapid methods for antimicrobial susceptibility testing. J Antimicrob Chemother. 2013 Dec;68(12):2710-7. [CrossRef] [PubMed]
- Godin M, Delgado FF, Son S, Grover WH, Bryan AK, Tzur A, Jorgensen P, Payer K, Grossman AD, Kirschner MW, Manalis SR. Using buoyant mass to measure the growth of single cells. Nat Methods. 2010 May;7(5):387-90. Epub 2010 Apr 11. [CrossRef] [PubMed]
- Kinnunen P, McNaughton BH, Albertson T, Sinn I, Mofakham S, Elbez R, Newton DW, Hunt A, Kopelman R. Self-assembled magnetic bead biosensor for measuring bacterial growth and antimicrobial susceptibility testing. Small. 2012 Aug 20;8(16):2477-82. Epub 2012 Jun 5. [CrossRef] [PubMed]
- Kasas S, Malovichko A, Villalba MI, Vela ME, Yantorno O, Willaert RG. Nanomotion detection-based rapid antibiotic susceptibility testing. Antibiotics (Basel). 2021 Mar 10;10(3):287. [CrossRef] [PubMed]
- Meile S, Kilcher S, Loessner MJ, Dunne M. Reporter phage-based detection of bacterial pathogens: design guidelines and recent developments. Viruses. 2020 Aug 26;12(9):944. [CrossRef] [PubMed]
- Avesar J, Rosenfeld D, Truman-Rosentsvit M, Ben-Arye T, Geffen Y, Bercovici M, Levenberg S. Rapid phenotypic antimicrobial susceptibility testing using nanoliter arrays. Proc Natl Acad Sci U S A. 2017 Jul 18;114(29):E5787-E5795. Epub 2017 Jun 26. [CrossRef] [PubMed]
- Hoettges KF, Dale JW, Hughes MP. Rapid determination of antibiotic resistance in E. coli using dielectrophoresis. Phys Med Biol. 2007 Oct 7;52(19):6001-9. Epub 2007 Sep 17. [CrossRef] [PubMed]
- Baldoni D, Hermann H, Frei R, Trampuz A, Steinhuber A. Performance of microcalorimetry for early detection of methicillin resistance in clinical isolates of Staphylococcus aureus. J Clin Microbiol. 2009 Mar;47(3):774-6. Epub 2009 Jan 21. [CrossRef] [PubMed]
- Alvarez-Barrientos A, Arroyo J, Cantón R, Nombela C, Sánchez-Pérez M. Applications of flow cytometry to clinical microbiology. Clin Microbiol Rev. 2000 Apr;13(2):167-95. [CrossRef] [PubMed]
- Dunne WM Jr, Jaillard M, Rochas O, Van Belkum A. Microbial genomics and antimicrobial susceptibility testing. Expert Rev Mol Diagn. 2017 Mar;17(3):257-269. Epub 2017 Jan 29. [CrossRef] [PubMed]
- Kim B, Hwang H, Kim J, Lee MJ, Pai H. Ten-year trends in antibiotic usage at a tertiary care hospital in Korea, 2004 to 2013. Korean J Intern Med. 2020 May;35(3):703-713. Epub 2018 Sep 27. [CrossRef] [PubMed]
- Fair RJ, Tor Y. Antibiotics and bacterial resistance in the 21st century. Perspect Medicin Chem. 2014 Aug 28;6:25-64. [CrossRef] [PubMed]
- Drlica K, Malik M, Kerns RJ, Zhao X. Quinolone-mediated bacterial death. Antimicrob Agents Chemother. 2008 Feb;52(2):385-92. Epub 2007 Aug 27. [CrossRef] [PubMed]
- Collins JA, Osheroff N. Gyrase and Topoisomerase IV: Recycling old targets for new antibacterials to combat fluoroquinolone resistance. ACS Infect Dis. 2024 Apr 12;10(4):1097-1115. Epub 2024 Apr 2. [CrossRef] [PubMed]
- Bush NG, Diez-Santos I, Abbott LR, Maxwell A. Quinolones: mechanism, lethality and their contributions to antibiotic resistance. Molecules. 2020 Dec 1;25(23):5662. [CrossRef] [PubMed]
- Ruiz J. Unusual and unconsidered mechanisms of bacterial resilience and resistance to quinolones. Life (Basel). 2024 Mar 14;14(3):383. [CrossRef] [PubMed]
- Kitano K, Tomasz A. Triggering of autolytic cell wall degradation in Escherichia coli by beta-lactam antibiotics. Antimicrob Agents Chemother. 1979 Dec;16(6):838-48. [CrossRef] [PubMed]
- Cho H, Uehara T, Bernhardt TG. Beta-lactam antibiotics induce a lethal malfunctioning of the bacterial cell wall synthesis machinery. Cell. 2014 Dec 4;159(6):1300-11. [CrossRef] [PubMed]
- Lima LM, Silva BNMD, Barbosa G, Barreiro EJ. β-lactam antibiotics: An overview from a medicinal chemistry perspective. Eur J Med Chem. 2020 Dec 15;208:112829. Epub 2020 Sep 16. [CrossRef] [PubMed]
- Mora-Ochomogo M, Lohans CT. β-Lactam antibiotic targets and resistance mechanisms: from covalent inhibitors to substrates. RSC Med Chem. 2021 Aug 4;12(10):1623-1639. [CrossRef] [PubMed]
- Lepe JA, Martínez-Martínez L. Resistance mechanisms in Gram-negative bacteria. Med Intensiva (Engl Ed). 2022 Jul;46(7):392-402. Epub 2022 May 31. [CrossRef] [PubMed]
- Tamayo M, Santiso R, Gosalvez J, Bou G, Fernández JL. Rapid assessment of the effect of ciprofloxacin on chromosomal DNA from Escherichia coli using an in situ DNA fragmentation assay. BMC Microbiol. 2009 Apr 13;9:69. [CrossRef] [PubMed]
- Santiso R, Tamayo M, Fernández JL, del Carmen Fernández M, Molina F, Villanueva R, Gosálvez J, Bou G. Rapid and simple determination of ciprofloxacin resistance in clinical strains of Escherichia coli. J Clin Microbiol. 2009 Aug;47(8):2593-5. Epub 2009 Jul 1. [CrossRef] [PubMed]
- Santiso R, Tamayo M, Gosálvez J, Bou G, Fernández M del C, Fernández JL. A rapid in situ procedure for determination of bacterial susceptibility or resistance to antibiotics that inhibit peptidoglycan biosynthesis. BMC Microbiol. 2011 Aug 25;11:191. [CrossRef] [PubMed]
- Bou G, Otero FM, Santiso R, Tamayo M, Fernández M del C, Tomás M, Gosálvez J, Fernández JL. Fast assessment of resistance to carbapenems and ciprofloxacin of clinical strains of Acinetobacter baumannii. J Clin Microbiol. 2012 Nov;50(11):3609-13. Epub 2012 Aug 29. [CrossRef] [PubMed]
- Tamayo M, Santiso R, Otero F, Bou G, Lepe JA, McConnell MJ, Cisneros JM, Gosálvez J, Fernández JL. Rapid determination of colistin resistance in clinical strains of Acinetobacter baumannii by use of the micromax assay. J Clin Microbiol. 2013 Nov;51(11):3675-82. Epub 2013 Aug 28. [CrossRef] [PubMed]
- The European Committee on Antimicrobial Susceptibility Testing. Breakpoint tables for interpretation of MICs and zone diameters. Version 14.0, 2024. http://www.eucast.org.
- Blair JM, Webber MA, Baylay AJ, Ogbolu DO, Piddock LJ. Molecular mechanisms of antibiotic resistance. Nat Rev Microbiol. 2015 Jan;13(1):42-51. Epub 2014 Dec 1. [CrossRef] [PubMed]
- Georgopapadakou NH, Bertasso A. Effects of quinolones on nucleoid segregation in Escherichia coli. Antimicrob Agents Chemother. 1991 Dec;35(12):2645-8. [CrossRef] [PubMed]
- Piccoli L, Guerrini M, Felici A, Marchetti F. In vitro and in vivo synergy of levofloxacin or amikacin both in combination with ceftazidime against clinical isolates of Pseudomonas aeruginosa. J Chemother. 2005 Aug;17(4):355-60. [CrossRef] [PubMed]
- Al-Hasan MN, Wilson JW, Lahr BD, Thomsen KM, Eckel-Passow JE, Vetter EA, Tleyjeh IM, Baddour LM. Beta-lactam and fluoroquinolone combination antibiotic therapy for bacteremia caused by gram-negative bacilli. Antimicrob Agents Chemother. 2009 Apr;53(4):1386-94. Epub 2009 Jan 21. [CrossRef] [PubMed]
Figure 1.
Representative images of Escherichia coli TG1 strain incubated with increasing concentrations of ciprofloxacin (MIC: 0.012 mg/L) for 45 min and stained with SYBR Gold. The nucleoids were progressively condensed at the middle of the bacteria as concentration of ciprofloxacin increased. The median Relative Nucleoid Surface (RNS) with respect to the total surface of the bacteria was 46.9% for 0 mg/L (a), 41.2% for 0.012 mg/L (b), 28.7% for 0.04 mg/L (c) and 13.4% for 0.5 mg/L (d).
Figure 2.
Relative Nucleoid Surface (RNS) of E. coli TG1 strain incubated with increasing concentrations of ciprofloxacin (MIC: 0.012 mg/L) for 45 min. The data are presented as box and whisker plots. The horizontal line in the box indicates the median, the lower line of the box is the first quartile, the upper line of the box is the third quartile and the whiskers (the end of the vertical lines) are the maximum and minimum values. Abnormal values are presented as dots outside the box.
Figure 3.
Relative Nucleoid Surface (RNS) of E. coli strains with MIC 0.007, 0.012, 0.25 and 8 mg/L, incubated with ciprofloxacin at concentrations that are multiple of MIC.
Figure 3.
Relative Nucleoid Surface (RNS) of E. coli strains with MIC 0.007, 0.012, 0.25 and 8 mg/L, incubated with ciprofloxacin at concentrations that are multiple of MIC.
Figure 4.
Images of intercellular DNA fragments after incubation for 45 min with increasing concentrations of ampicillin in a susceptible E. coli strain (MIC: 4 mg/L). The median DNA fragments per µm2 was 0.03 for 0 mg/L (a), 0.60 for 2 mg/L (b), 1.25 for 4 mg/L (c) and 2.30 for 16 mg/L (d).
Figure 4.
Images of intercellular DNA fragments after incubation for 45 min with increasing concentrations of ampicillin in a susceptible E. coli strain (MIC: 4 mg/L). The median DNA fragments per µm2 was 0.03 for 0 mg/L (a), 0.60 for 2 mg/L (b), 1.25 for 4 mg/L (c) and 2.30 for 16 mg/L (d).
Figure 5.
Intercellular DNA fragments per µm2 after incubation for 45 min with increasing concentrations of ampicillin in one susceptible E. coli strain (MIC: 4 mg/L) and one resistant (MIC: 128 mg/L).
Figure 5.
Intercellular DNA fragments per µm2 after incubation for 45 min with increasing concentrations of ampicillin in one susceptible E. coli strain (MIC: 4 mg/L) and one resistant (MIC: 128 mg/L).
Figure 6.
Evaluation of the influence of ampicillin on the Relative Nucleoid Surface (RNS) effect of ciprofloxacin. One E. coli strain susceptible to ciprofloxacin (MIC: 0.047 mg/L) and ampicillin (MIC: 4 mg/L) was incubated with fixed concentrations of ciprofloxacin (0, 0.06, 0.25 or 0.5 mg/L) together with increasing concentrations of ampicillin (0, 1, 2, 4 and 8 mg/L).
Figure 7.
Evaluation of the influence of ciprofloxacin on the intercellular DNA fragments per µm2 produced by ampicillin (AMP). The E. coli strain susceptible to ciprofloxacin (MIC: 0.047 mg/L) and ampicillin (MIC: 4 mg/L), was incubated with fixed concentrations of ampicillin (0, 2, 4 or 8 mg/L) together with increasing concentrations of ciprofloxacin (0, 0.06, 0.125, 0.25, 0.5 and 1 mg/L).
Figure 8.
Representative images of the technique for rapid detection of susceptibility or not to a quinolone and a beta-lactam simultaneously. Four E. coli strains were incubated with the EUCAST breakpoint concentrations of susceptibility for ciprofloxacin (0.25 mg/L) and ampicillin (8 mg/L), simultaneously for 45 min. The fluorescence microscopy images were obtained after technical processing. (a) Strain susceptible to both antibiotics (MIC ciprofloxacin: 0.012 mg/L; MIC ampicillin: 2 mg/L). The visualization of an intense central spot corresponding to a condensed nucleoid inside the bacteria is the marker of susceptibility to ciprofloxacin. The presence of a background of DNA fragments is indicative of susceptibility to ampicillin. (b) Strain non-susceptible to ciprofloxacin and susceptible to ampicillin (MIC ciprofloxacin: 8 mg/L; MIC ampicillin: 4 mg/L). The fluorescence from the nucleoid is spread inside the bacteria and no central spot is evident. This is the pattern observed in control E. coli, without quinolone treatment, thus evidencing resistance to the ciprofloxacin dose. Otherwise, the presence of background DNA fragments is the signal of susceptibility to ampicillin. (c) Strain susceptible to ciprofloxacin and non-susceptible to ampicillin (MIC ciprofloxacin: 0.047 mg/L; MIC ampicillin: 12 mg/L). The fluorescence inside the bacteria in concentrated in a central spot, being indicative of affectation by the quinolone. There is no background of DNA fragments, so the strain is resistant to the ampicillin dose. (d) Strain non-susceptible to both antibiotics (MIC ciprofloxacin: 4 mg/L; MIC ampicillin: 12 mg/L). The fluorescence from the nucleoid is spread inside the bacteria, so the strain is resistant to ciprofloxacin dose. No background of DNA fragments is observed, so the strain is also resistant to ampicillin dose.
|
Disclaimer/Publisher’s Note: The statements, opinions and data contained in all publications are solely those of the individual author(s) and contributor(s) and not of MDPI and/or the editor(s). MDPI and/or the editor(s) disclaim responsibility for any injury to people or property resulting from any ideas, methods, instructions or products referred to in the content. |
© 2024 by the authors. Licensee MDPI, Basel, Switzerland. This article is an open access article distributed under the terms and conditions of the Creative Commons Attribution (CC BY) license (http://creativecommons.org/licenses/by/4.0/).
