Preprint
Article

HPV, HBV, and HIV-1 Viral Integration Site Mapping: A Streamlined Workflow from NGS to Genomic Insights of Carcinogenesis

Altmetrics

Downloads

126

Views

71

Comments

0

A peer-reviewed article of this preprint also exists.

This version is not peer-reviewed

Submitted:

27 May 2024

Posted:

28 May 2024

You are already at the latest version

Alerts
Abstract
Viral integration within the host genome plays a pivotal role in carcinogenesis. Various disruptive mechanisms are involved, leading to genomic instability, mutations, and DNA damage. With next-generation sequencing (NGS), we can now precisely identify viral and host genomic breakpoints and chimeric sequences, which are useful for integration site analysis. In this study, we evaluated a commercial hybrid-capture NGS panel specifically designed for detecting three key viruses: HPV, HBV, and HIV-1. We also tested workflows for Viral Hybrid Capture (VHC) and Viral Integration Site (VIS) analysis, leveraging customized viral databases in CLC Microbial Ge-nomics. By analyzing sequenced data from virally infected cancer cell lines (including SiHa, HeLa, CaSki, C-33A, DoTc2, 2A3, SCC154 for HPV; 3B2, SNU-182 for HBV; and ACH-2 for HIV-1), we precisely pinpointed viral integration sites. The workflow also highlighted disrupted and neigh-boring human genes that may play a crucial role in tumor development. Our results included in-formative virus-host read mappings, genomic breakpoints, and integration circular plots. These visual representations enhance our understanding of the integration process. In conclusion, our seamless end-to-end workflow bridges the gap in understanding viral contributions to cancer development, paving the way for improved diagnostics and treatment strategies.
Keywords: 
Subject: Biology and Life Sciences  -   Virology

1. Introduction

In 1911, Peyton Rous isolated a transmissible agent from a large tumor on the breast of a Plymouth Rock hen [1,2]. His groundbreaking work demonstrated that malignant tumors may have infectious origins. The impact of his novel discovery ushered in the field of tumor virology which deepened our understanding of carcinogenesis by insertional mutagenesis [1,2]. Rous was eventually awarded the Nobel Prize in 1966, and the famed chicken retrovirus was eponymously named Rous sarcoma virus (RSV) [1,2]. Today, seven viruses have been classified as human carcinogens (Group 1) by the International Agency for Research on Cancer (IARC), which include: Epstein-Barr virus (EBV); Hepatitis B virus (HBV), Hepatitis C virus (HCV), Human immunodeficiency virus type 1 (HIV-1), Human papillomavirus (HPV), Human T-cell lymphotropic virus type I, (HTLV-I), and Kaposi’s sarcoma-associated herpesvirus (KSHV) [3]. HIV-1 infection alone, interestingly, does not lead to cell transformation or immortalization. Instead, HIV-1 accelerates the process by interacting with oncoviruses, suppressing the immune system, and producing transferable HIV-1 proteins, thus acting as a co-factor in carcinogenesis [3,4].
Globally, the burden of cancer is staggering with an estimated incidence rate of 20 million new cases in 2022 with a projected increase to 35 million in 2050 [5]. One out of every eight cases are attributed to chronic infections. HPV and HBV are the two most common viral causes of cancer worldwide [5,6,7,8,9]. In 2020, there were 730,000 cancer cases attributable to HPV and 380,000 cancer cases attributable to HBV [5]. The most common cancers associated with HPV were cervical cancer (with 662,301 cases) followed by oropharyngeal and anogenital cancers. As for HBV, it was hepatocellular carcinoma (HCC). In 2022, the global population of people living with HIV (PLWH) was 39 million, and those acquiring new infections was 1.3 million [10]. With anti-viral treatment, life expectancy for HIV-infected persons has increased. However, among individuals co-infected with HPV and HBV, non-AIDS-defining cancers have become a concerning cause of mortality [4].
The journey from viral infection to malignant transformation of the host cell is complicated and disparate for HPV, HBV, and HIV-1 (Figure 1). Typically, these three viruses display host cell specificity, requiring binding to specific cell surface proteins for entry [4,11,12]. After traversing the cytoplasm, the viral genomes enter the nucleus for replication (Figure 1). Viral DNA integration into the host genome, whether accidental or deliberate, can disrupt or alter the function of host cancer-associated genes and neighboring genes, ultimately leading to malignant transformation. The mechanism of integration for each virus is briefly described here and shown in Figure 1. During host cell division, the HPV circular genome tethers like a “hitchhiker” on sister chromatids [13,14]. The viral genome then unwinds bidirectionally, replicates, and partitions equally into the daughter cells [15,16]. Such intimate “liaisons” between viral and host DNA result in accidental integration at vulnerable sites (e.g., open chromatin and common fragile sites) [15,16]. For HBV, after virion entry into the hepatocyte, the relaxed circular DNA (rcDNA) and double stranded linear DNA (dslDNA) traverses into the nucleus for conversion to covalently closed circular (cccDNA) [17]. Only the dslDNA integrates randomly at double-stranded DNA (dsDNA) breaks in the host genome through non-homologous end joining (NHEJ) or micro-homology mediated end-joining (MMEJ) [17,18]. The integrated viral DNA leads to viral persistence, pathogenesis, and carcinogenesis [17,18]. For HIV-1, upon entering the immune cell, the RNA genome of the virion undergoes reverse transcription, resulting in a dsDNA (provirus) [19]. The provirus then enters the nucleus for insertion into the host genome at random sites by the HIV-1 integrase enzyme [19].
Viral hybrid-capture next-generation sequencing (hyb-cap NGS) is a widely used method for targeted or whole genome sequencing [20]. It also enables the capture of virus-host chimeric reads, useful for identifying genomic breakpoints, especially for integration site analysis [21]. In 2022, a commercial hyb-cap NGS kit for HPV, HBV, and HIV-1 became available [22]. The anticipated benefits of using pre-designed, virus-specific probes for targeted sequencing include eliminating the effort involved in probe design, ensuring quality assurance, and standardizing protocols. As for post-sequencing analysis, our prior study demonstrated the efficiency of the Viral Hybrid-Capture (VHC) and Viral Integration Site (VIS) workflows within CLC Microbial Genomics Module (CLC MGM) for HPV integration site analysis [21]. Our current study builds upon this previous work. We evaluated a commercial viral hyb-cap NGS kit and the VHC/VIS workflows for HPV, HBV, and HIV-1 integration analysis. Customized genomic databases were constructed to cover HBV and HIV-1. The results confirmed the effectiveness of a comprehensive laboratory pipeline that identifies viral integration sites and their impact on host genes. This process enhances our understanding of cancer development and facilitates the identification of diagnostic, prognostic, and therapeutic markers.

2. Materials and Methods

2.1. NGS Dataset of HPV, HBV, and HIV-Positive Cell Lines

Cell lines for cancer of the cervix (SiHa, HeLa, CaSki, C33-A, and DoTc2), hypopharynx (2A3), tongue (UPCI:SCC154 or SCC154), liver (Hep3B or 3B2.1-7, and SNU-182), and synthetic HIV-1 RNA plasmid (ATCC VR-3245SD) were acquired from the American Type Culture Collection (ATCC, Manassas, VA) for testing [23]. The cell type, primary tumor site, and viral genotypes are shown in Table 1. The cells were cultured in media and conditions as prescribed by ATCC [23]. After cellular DNA extraction, the genomic DNA (gDNA) (20 uL with concentration of ≥ 20 ng/uL) was submitted to Qiagen Genomic Services (QIAGEN, Germantown, MD) for viral hyb-cap NGS. The QIAseq xHYB Viral STI Panel (QIAGEN, Germantown, MD) was used for gDNA library target enrichment and genotyping HPV (19 types: 16, 18, 26, 31, 33, 35, 39, 45, 51, 52, 53, 56, 58, 59, 66, 68, 68a, 73, 82), HBV, and HIV-1 [22]. Per manufacturer’s protocol, the gDNA NGS libraries were hybridized overnight to the hyb-cap panel of probes. The probe-target hybrids were then bound to streptavidin-coated magnetic beads and washed for removal of unbound library fragments. The target enriched libraries were amplified and paired end sequenced on the MiSeq sequencer (Illumina, San Diego, CA).
The synthetic HIV-1 RNA plasmids were reversed transcribed to cDNA using SuperScript™ III First-Strand Synthesis SuperMix (Invitrogen, Waltham, Massachusetts) according to the manufacturer’s instructions prior to hyb-cap NGS.
We supplemented our samples with sequencing data from a representative HIV-1 latently infected cell line (ACH-2) (Table 1) [25]. The dataset is available from NCBI SRA under BioProject accession number, PRJNA524421 (https://www.ncbi.nlm.nih.gov/sra) [25,26]. The raw sequencing files and metadata were downloaded into CLC Genomics workbench using the “Search for Reads in SRA” tool under Sequence Read Archive (SRA) Study (SRP187583) and Run (SRR8670572) accession numbers (AN) [26]. The files were imported into the VHC/VIS workflows for viral sequence analysis.

2.2. Customized HPV, HBV, and HIV-1 Reference Databases for CLC Workflows and Tools

HPV is a small, dsDNA virus consisting of approximately 8,000 base pairs (bp), which encode 6 early genes (E1, E2, E4, E5, E6, and E7) and 2 late genes (L1 and L2) [21]. Customized HPV reference (n = 219) and variant (n = 139) genome databases previously constructed were downloaded using the “Download Curated Microbial Reference Database” tool within the CLC Microbial Genomics Module (CLC MGM) of CLC Genomics Workbench Premium 23.0.4 (Redwood City, CA, USA) [27]. Two formats (taxonomic profiling index and sequence list) were downloaded and incorporated into the VHC and VIS workflows. The names of the databases in index and list formats, respectively, were: 1)
“HPV REF_taxpro_index” and “HPV REF” for HPV reference genomes, and 2) “HPV VAR_taxpro_index” and “HPV VAR” for HPV variant genomes (Figure 2A) [21].
HBV is a small, enveloped DNA virus with a genome length of ~3,200 bp. HBV exists in two primary forms (i.e., rcDNA and dslDNA), composing 90% and 10% of virions, respectively (Figure 1) [17]. The genome encodes 4 open reading frames, designated C (capsid protein), P (polymerase), S (surface proteins) and X (regulatory protein) [28]. To construct the customized database, HBV complete genomes, genotypes A-J (n = 268) were identified in NCBI Virus (https://www. ncbi.nlm.nih.gov/labs/virus/vssi/#/) on 25 December 2023 for metadata (CSV) download [29]. The associated GenBank files (GB) were downloaded from NCBI Nucleotide (https://www.ncbi.nlm.nih.gov/nuccore) [30]. The files from human (n = 268) and animal (n = 27) hosts were imported into CLC MGM for customization and use as separate databases. Customization involved creation of an author-defined, clinically relevant, common 7-level taxonomic nomenclature for each HBV genome file. The current HBV taxonomic nomenclature with 9 primary ranks by International Committee on Taxonomy of Viruses (ICTV) 2022 Release (https://ictv.global/msl) is as follows: Realm: Riboviria; Kingdom: Pararnavirae; Phylum: Artverviricota; Class: Revtraviricetes; Order: Blubervirales; Family: Hepadnaviridae; Genus: Orthohepadnavirus; Species: Hepatitus B virus [31]. To deepen the taxonomic depth to sub-species, we created a customized taxonomy based on the attributes of the Baltimore classification and genotype/sublineage nomenclature [32,33]. Specifically, we defined our 7-level taxonomic ranks as: Virus_nucleic acid type; Family; Genus; Species; Genotype; Sub-lineage, and 3-letter Country code [34]. For example, the taxonomy of HBV genotype A, sub-lineage 1 from a blood sample collected in Martinique (Accession: HE974362) was annotated as “Virus_dsDNA-RT_env; Hepadnaviridae; Orthohepadnavirus; HBV; A; 1; MTQ.” The customized taxonomy created in a metadata file replaced the original taxonomy of the sequence file for downstream applications as described in Section 2.3. For genome sequences devoid of a sub-lineage, the reserved space in the 7-level taxonomic nomenclature was left blank.
HIV-1 is a retrovirus with a genome consisting of two identical, single-stranded ~9,300 bp RNA molecules [35]. The genome encodes 9 genes categorized according to three major protein products: 1) structural proteins: gag, pol, and env, 2) essential regulatory proteins: tat and rev, and 3) accessory regulatory proteins: nef, vpr, vif, and vpu [35]. The Los Alamos National Laboratory (LANL) HIV Databases (https://www.hiv.lanl. gov/content/index) were accessed on 22 January 2024 to obtain the NCBI GenBank AN for HIV-1/SIV reference genomes [36]. The AN were entered into the NCBI Nucleotide and NCBI Virus repositories for retrieval of GenBank (GB) and metadata (CSV) files (n = 53), respectively. HIV-1 is subcategorized as 4 groups (M, N, O and P). The M group is further divided into 9 subtypes (A through L) [36]. The files for human (n = 53) and animal (n = 27) hosts were imported into CLC MGM and customized for use as separate databases. The HIV nomenclature with 9 primary ranks by the ICTV 2022 Release is as follows: Realm: Riboviria; Kingdom: Pararnavirae; Phylum: Artverviricota; Class: Revtraviricetes; Order: Ortervirales; Family: Retroviridae; Subfamily: Orthoretrovirinae; Genus: Lentivirus; Species: Human immunodeficiency virus 1 [31]. A customized taxonomy based on the attributes of the Baltimore classification and group/sub-lineage nomenclature was created [32,36,37]. We defined our 7-level taxonomic ranks as: Virus_nucleic acid type; Family; Subfamily; Genus; Species; Group; and Sub-lineage. For example, the taxonomy of HIV-1 Group O, sub-lineage null from a blood sample collected in Cameroon (Accession: AY169812) was annotated as “Virus_ssRNA-RT_env; Retroviridae; Orthoretrovirinae; Lentivirus; HIV-1; O; .” The customized taxonomy created in a metadata file replaced the original taxonomy of the sequence file for downstream applications.
For HBV and HIV-1, the GenBank sequence files imported into CLC MGM were converted into a singular sequence list using the “Create Sequence List” tool. Metadata (.xlsx format) were appended to enrich the sequence list using the “Update Sequence Attributes in Lists” tool. Finally, the singular sequence list was partitioned with the “Split Sequence List” tool based on sequence “Name” to revert to individual sequences in preparation for whole genome alignment (WGA) and database creation (Figure 2A).
The human reference genome (Homo sapiens Genome Reference Consortium Human Build 38 (GRCh38 or hg38) files were downloaded using the “Download Genomes from Public Repositories” function within the CLC MGM (Figure 2A) for use within the workflows.

2.3. Whole Genome Alignment and Phylogenetic Analysis of Database Sequences

CLC Genomics Workbench Premium 23.0.4, inclusive of the CLC MGM (Redwood City, CA, USA), was installed on an HP notebook computer (specifications: Windows 10 operating system, Intel i7–7500U dual-core processor @ 2.70 GHz and 8 GB RAM) for all analyses. The CLC system requirements are provided online [27]. The “Whole Genome Alignment” plugin was downloaded from within the CLC Workbench and the “Create Whole Genome Alignment” tool was used for automated data analysis (Figure 2A). The analysis consisted of 3 primary steps: 1) sequence import, 2) alignment parameter selection, and 3) annotation copying from a reference genome (optional) (Figure 2B). The WGA output displayed the aligned regions between all genomes.
The HBV and HIV-1 genome sequences were aligned by the WGA tool; the annotation of the respective reference genomes (NCBI Nucleotide AN: NC_003977 and NC_001802) were employed to standardize the annotation for all genomes. The WGA output was entered into the “Create Average Nucleotide Identity Comparison” tool to quantify the similarity between genomes (Figure 2A, C). For each pair of genomes, the aligned regions were identified for calculation of two measurements: 1) Alignment Percentage (AP) defined as average percentage of two genomes which is aligned, and 2) Average Nucleotide Identity (ANI) defined as average percentage of matching nucleotides for the aligned regions. The tool generated a pairwise comparison table (type AP or ANI) for input into the ”Create Tree from Comparison” tool for construction of a Neighbor Joining (NJ) or Unweighted Pair Group Method with Arithmetic Mean (UPGMA) tree (Figure 2A). The visual information displayed by the phylogenetic tree was augmented with metadata to decorate or colorize the clades, nodes, and labels.

2.4. Viral Hybrid Capture (VHC) Analysis and Workflow

The “Analyze Viral Hybrid Capture (VHC) Data” ready-to-use workflow of CLC MGM was used for automated data analysis (Figure 2A, D). The analysis consisted of 4 primary steps: 1) Data import, 2) Data quality control (QC), 3) Taxonomic Profiling of reads mapping to viral and human reference genomes, and 4) Low frequency variant detection. Post-workflow output included tables and visualization tracks for best matched sequence, read mapping, annotated CDS, low coverage areas, and annotated genetic variants.

2.5. Viral Integration Site (VIS) Analysis and Workflow

The “Identify Viral Integration Sites (VIS)” ready-to-use workflow of CLC MGM was used for automated data analysis (Figure 2A, E). The analysis consisted of 4 primary steps: 1) Data import, 2) Reads mapping to human and viral reference genomes, 3) Breakpoint detection in human and viral genomes, and 4) Gene identification surrounding breakpoint(s). Workflow outputs included tables, read mapping to host and viral genomes, and circular plot of viral-host genomes zoomable from the chromosome to gene level.

3. Results

3.1. Whole Genome Alignment (WGA) and Comparison of HBV and HIV-1 genomes

After construction of the customized HBV and HIV-1 reference databases as described in Section 2.2, WGA was performed with a respective runtime of 27 and 2 min. The runtime for the “Create Average Nucleotide Indentity Comparison“ tool were only 15 and 2 sec, respectively.The output, i.e., pairwise comparison (PWC) table revealed the quantitative measures of similarity between HBV genomes: 1) Alignment Percentage (AP) between two HBV genomes (range, 88-100%), and 2) Average Nucleotide Identity (ANI) or the percentage of exact nucleotide matches of the aligned regions (range, 99-100%). In the context of HIV-1 genomes, the AP ranged from 88% to 100%, while the ANI spanned from 99% to 100%.

3.1.1. Phylogenetic Trees of HBV and HIV-1 Genomes

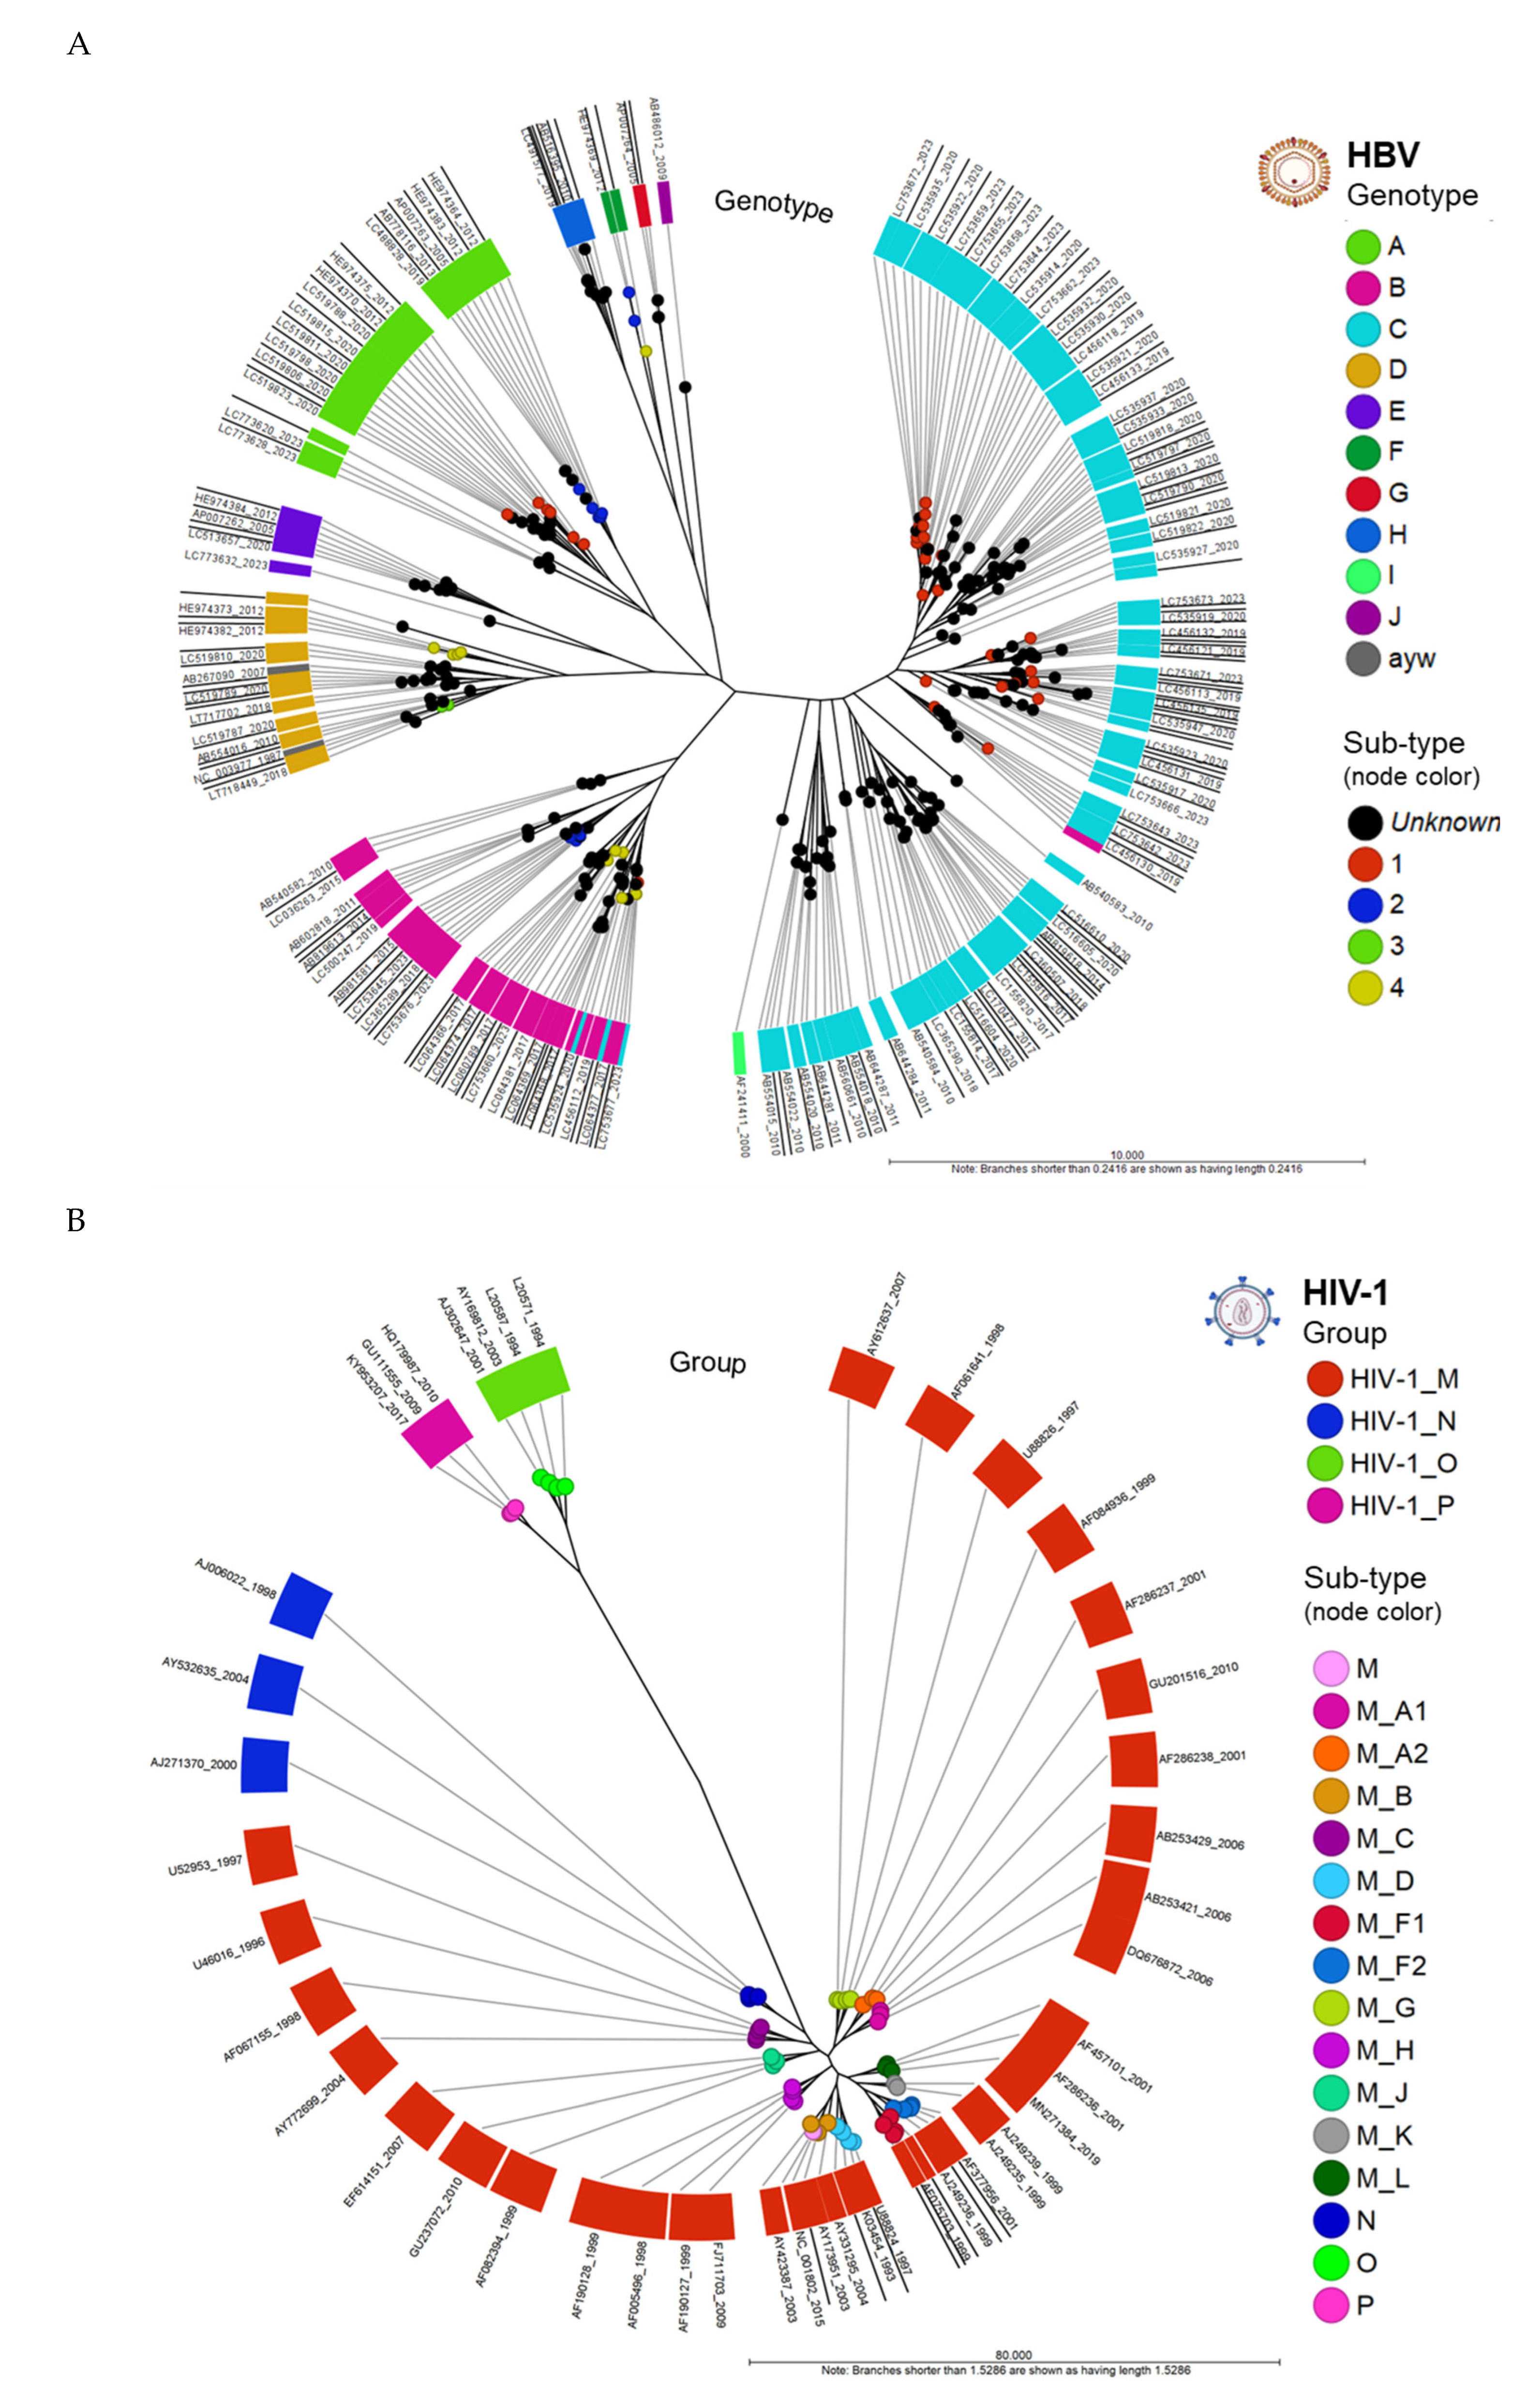
Circular phylograms of HBV and HIV-1 genomes were created from the PWC table using the “Create Tree from Comparison” tool (runtime: 1 second). Metadata enriched the visualization of HBV genotypes and HIV-1 groups, along with their respective sub-lineages. The radial phylogram of aligned HBV whole genomes (n = 268) revealed clustering of the 10 genotypes (A-J) into clades (Figure 3A). Two genomes, NCBI AN (NC_003977 (HBV RefSeq) and AB267090) carried the conventional (predated) serological classification and nomenclature (adw, adr, ayw and ayr) based on HBV surface antigen (HBsAg) reactivity. The serotype ayw of the 2 genomes corresponded to genotype D by alignment. All genomes except for four accessions clustered according to its assigned genotype in NCBI. These discrepant genomes (AN: LC064379, LC535924, LC535945, and LC753677) were found in genotypes B and C (pink/blue in figure) possibly due to genotype assignment error. The phylogram of aligned HIV-1 whole genomes (n = 53) clustered into 4 groups (M-P) (Figure 3B). All genomes grouped and clustered correctly based on their assigned clade and subtype, as designated by NCBI. For groups N, O, and P, which lacked subtypes, the nodes were colorized according to their respective clades (as shown in Figure 3B). Additionally, a few genomes within group M, also lacking subtypes, the nodes were colored pink in the same figure. The ANI NJ unrooted trees were constructed from the PWC table.

3.2. Viral Hybrid Capture (VHC) Analysis and Visualization

The entire dataset comprised of 11 FASTQ files and 10.5 GB of digital information was imported for analysis. The cell line characteristics are provided in Table 1. The VHC workflow median runtime per sample was 17 min (range, 1 to 61 min). The QC workflow generated the following outputs: 1) QC for sequencing reads (graphical report and supplementary report), and 2) Abundance table. Specifically, the graphical report summarized the total number of sequences and nucleotides in a sample, per-sequence analysis, per-base analysis, over-representation analyses, sequence duplication levels, and duplicated sequences. The QC supplementary report includes two additional columns, i.e., “coverage” and “abs” for absolute numbers of sequences or bases for the per-sequence or per-base analyses. The reader is referred to the CLC MGM manual online for an in-depth explanation of QC metrics [27].

3.2.1. HPV Taxonomic Profiling

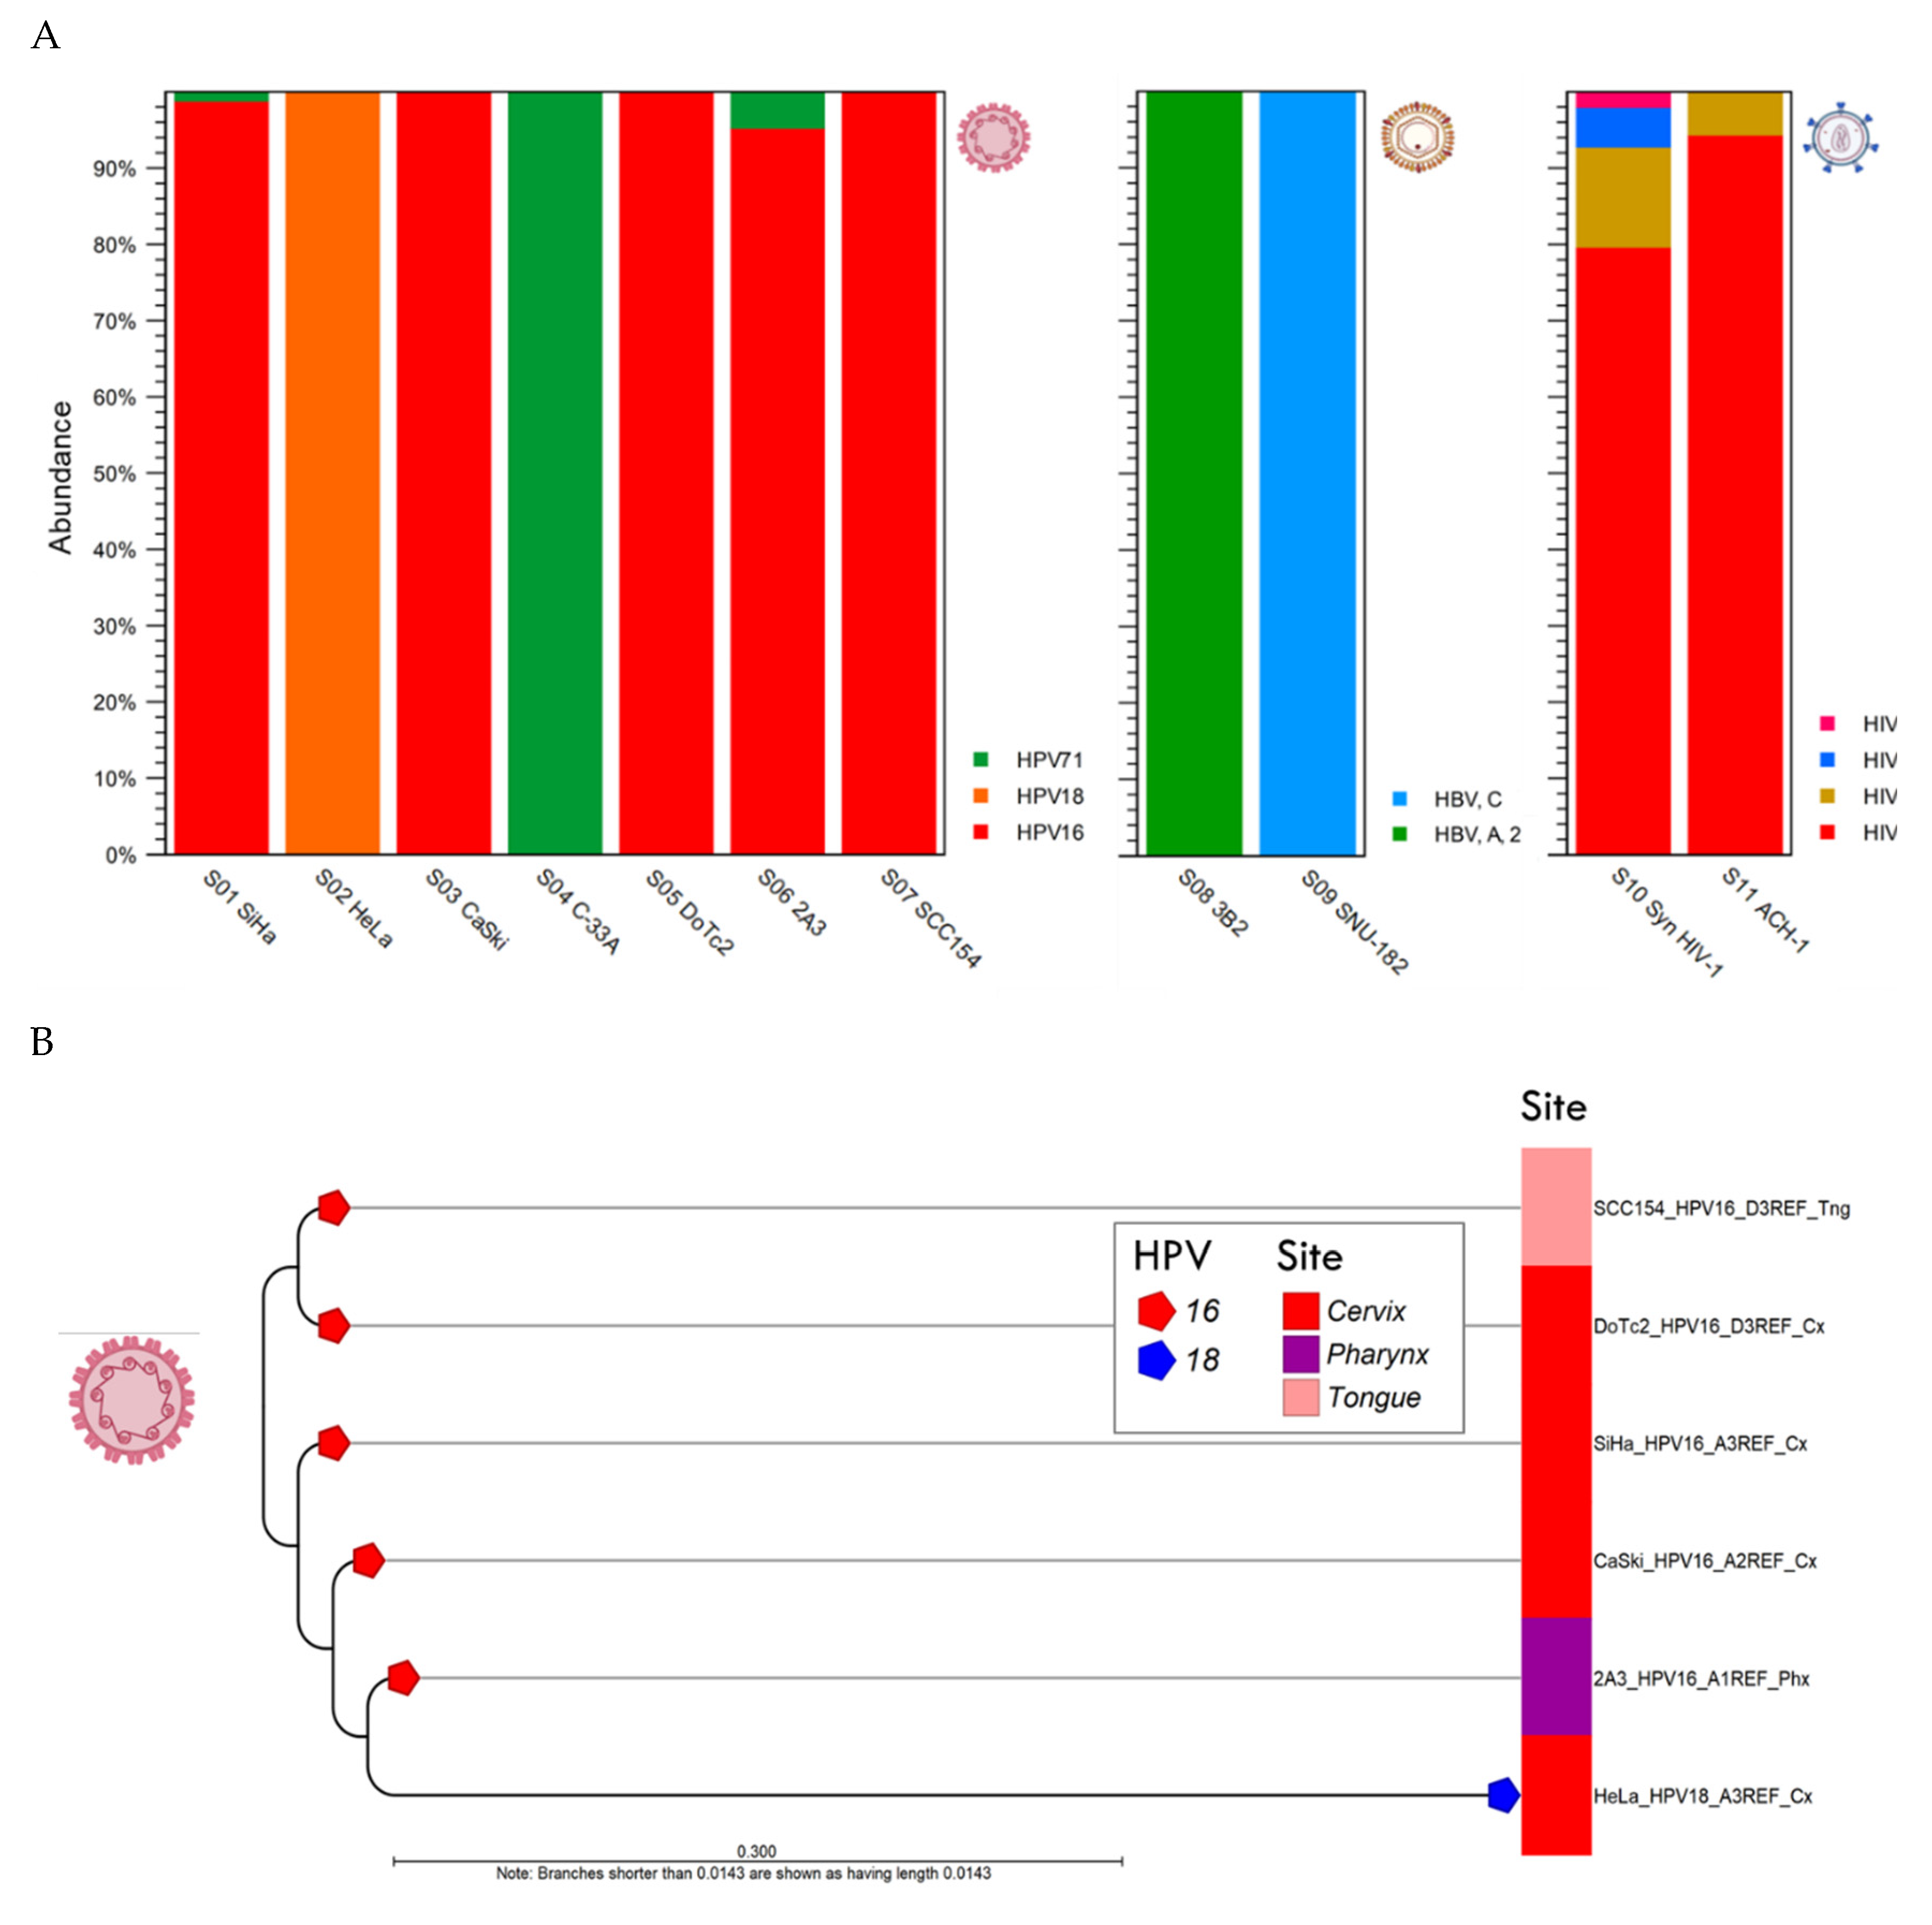
The HPV taxonomic profiling workflow produced individual abundance tables that displays the names of the identified taxa, 7-level taxonomic nomenclature, coverage estimate, and abundance value (raw or relative number of reads found in the sample associated with the taxon). Low abundance genotypes were cut-off at a threshold of <1% of total composition. The merged abundance table (Supplementary Table S1) lists all taxonomic profiling results and the summary statistics, e.g., combined abundance of reads for the taxon across all samples, and the minimum, maximum, mean, median and standard deviation of the number of reads for the taxa across all samples. The graphical output of the merged abundance table is shown as a stacked bar chart in Figure 4A. For S04 C-33A (p53+ and pRB+), only 346 reads for HPV-71 were identified. According to IARC, HPV-71 is classified as “not classifiable/probably not carcinogenic” [3]. Given the low read counts, this is likely an incidental finding for commensal HPV-71. Instead, the mutations driving this malignant cell line are attributed to p53 and pRB.
To determine the HPV sub-lineage of the dominant genotype within each sample, the “HPV consensus sequence” generated from the VHC workflow was aligned against the “HPV VAR” BLAST database using the CLC BLAST tool. The BLAST output table is provided in Supplementary Table S2. To construct the phylogenetic tree based on HPV genotype and sub-lineages, the “HPV consensus sequence” output from the VHC workflow of the 6 samples were aligned collectively and analyzed phylogenetically using the “Create Alignment” and “Create Tree” tools sequentially. The resulting NJ tree was labeled according to the cell line nomenclature, HPV genotype, sub-lineage, and tumor site as shown in Figure 4B. The identification of HPV-16 and -18 sub-lineages and variants is clinically significant in terms of carcinogenic risk. A global investigation into the dispersal of HPV-16 sub-lineages (A, B, C, and D) revealed that regional specificity (i.e., A3-4 for East Asia, B1-4 and C1-4 for Africa, D2 for the Americas, B4, C4 and D4 for North Africa) may significantly impact cervical cancer risk [38].

3.2.2. Viral Hybrid Capture (VHC) Tracklists

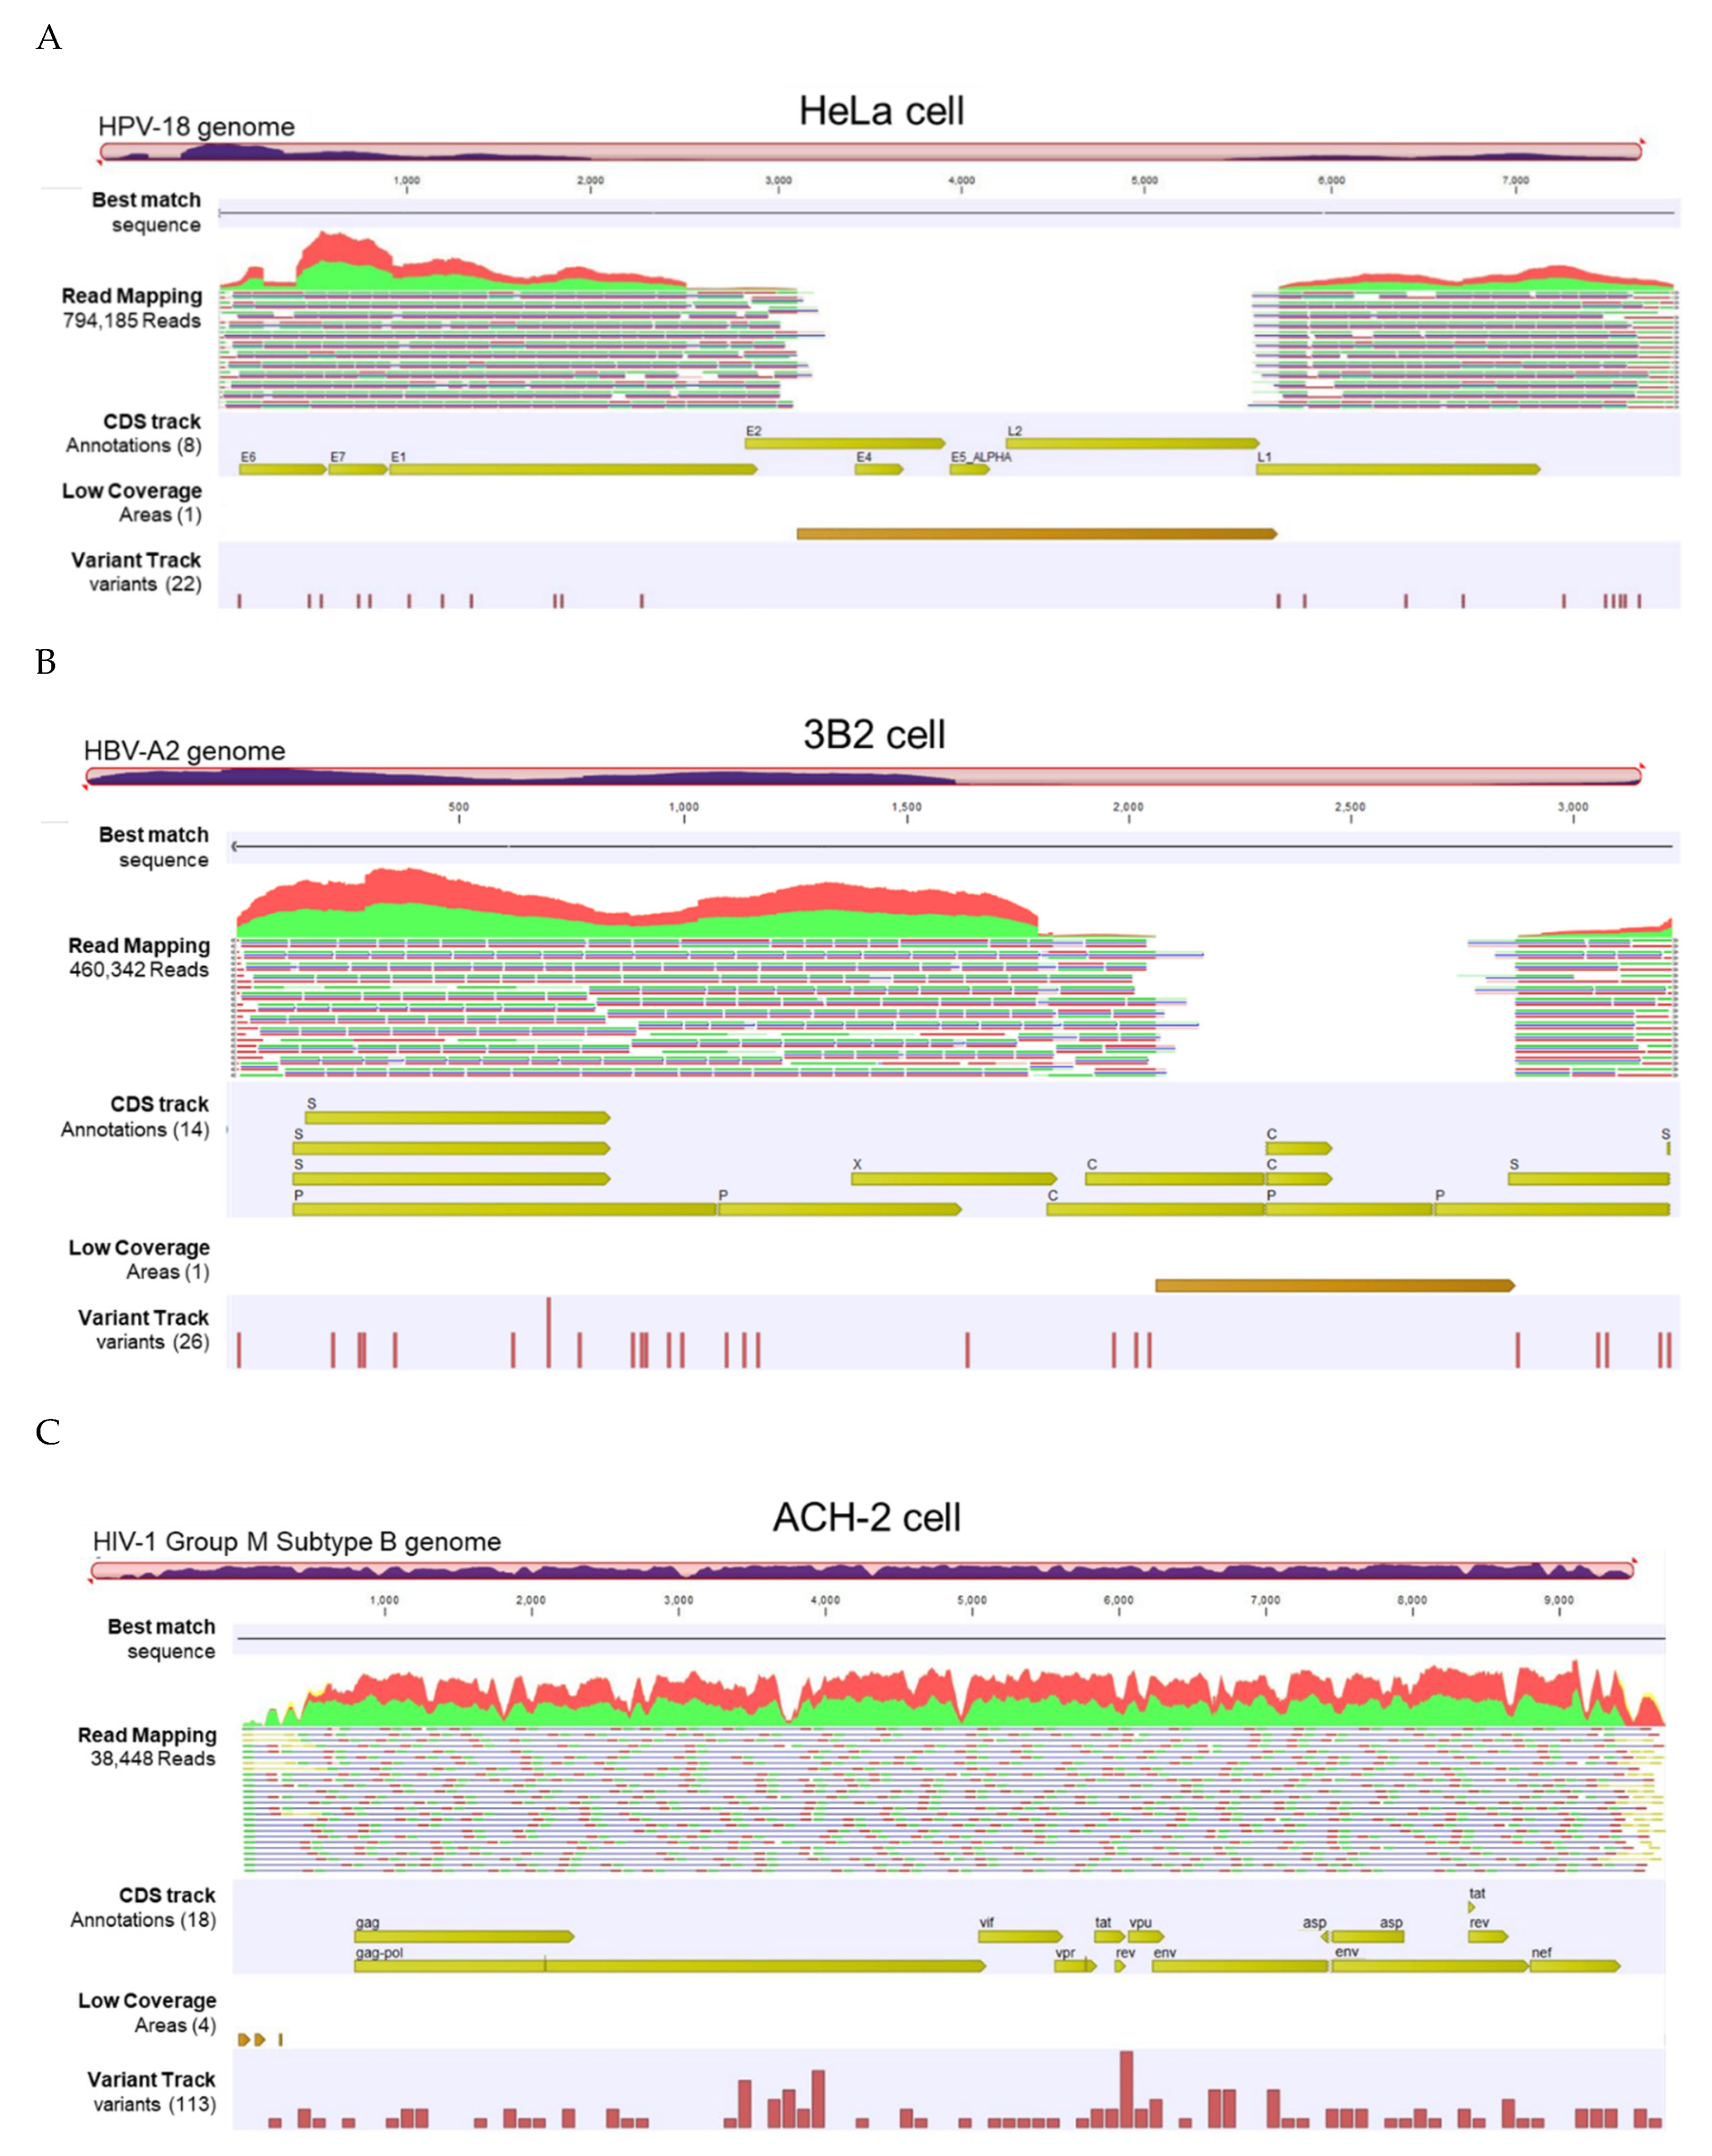
The VHC workflow generated a “Track List” containing: 1) read mapping track, 2) annotated variant track, 3) amino acid track, and 4) low coverage areas track. Representative track lists from the HeLa, 3B2, and ACH-2 cell lines show paired-reads mapped onto the linearized HPV-18, HBV-A2 and HIV-1 Group M reference genomes, respectively (Figure 5). The auto-generated tracks provide a visual representation of read abundance, spanning from 38,448 to 794,185 reads, as well as sequencing coverage and breadth of genome coverage for the three samples. The large gap (break) between reads is automatically detected and shown in the “low coverage areas” track using the default threshold criteria (best match reference genome coverage <30x). The annotated variant track shows low frequency variants detected using the default threshold (coverage >30x and frequency ≥20%). Finally, the amino acid track shows the virus-coded amino acids generated from the coding DNA sequence (CDS) annotation of the reference sequence list chosen as the “Best Reference for Read Mapping” in the workflow. Zooming in on the track list to the nucleotide or amino acid level allows for detailed comparison to the reference genome and detection of variants (not shown). The track lists for all samples (S01 to S11) are displayed in Supplementary Figure S1.

3.3. Viral Integration Site (VIS) Analysis and Visualization

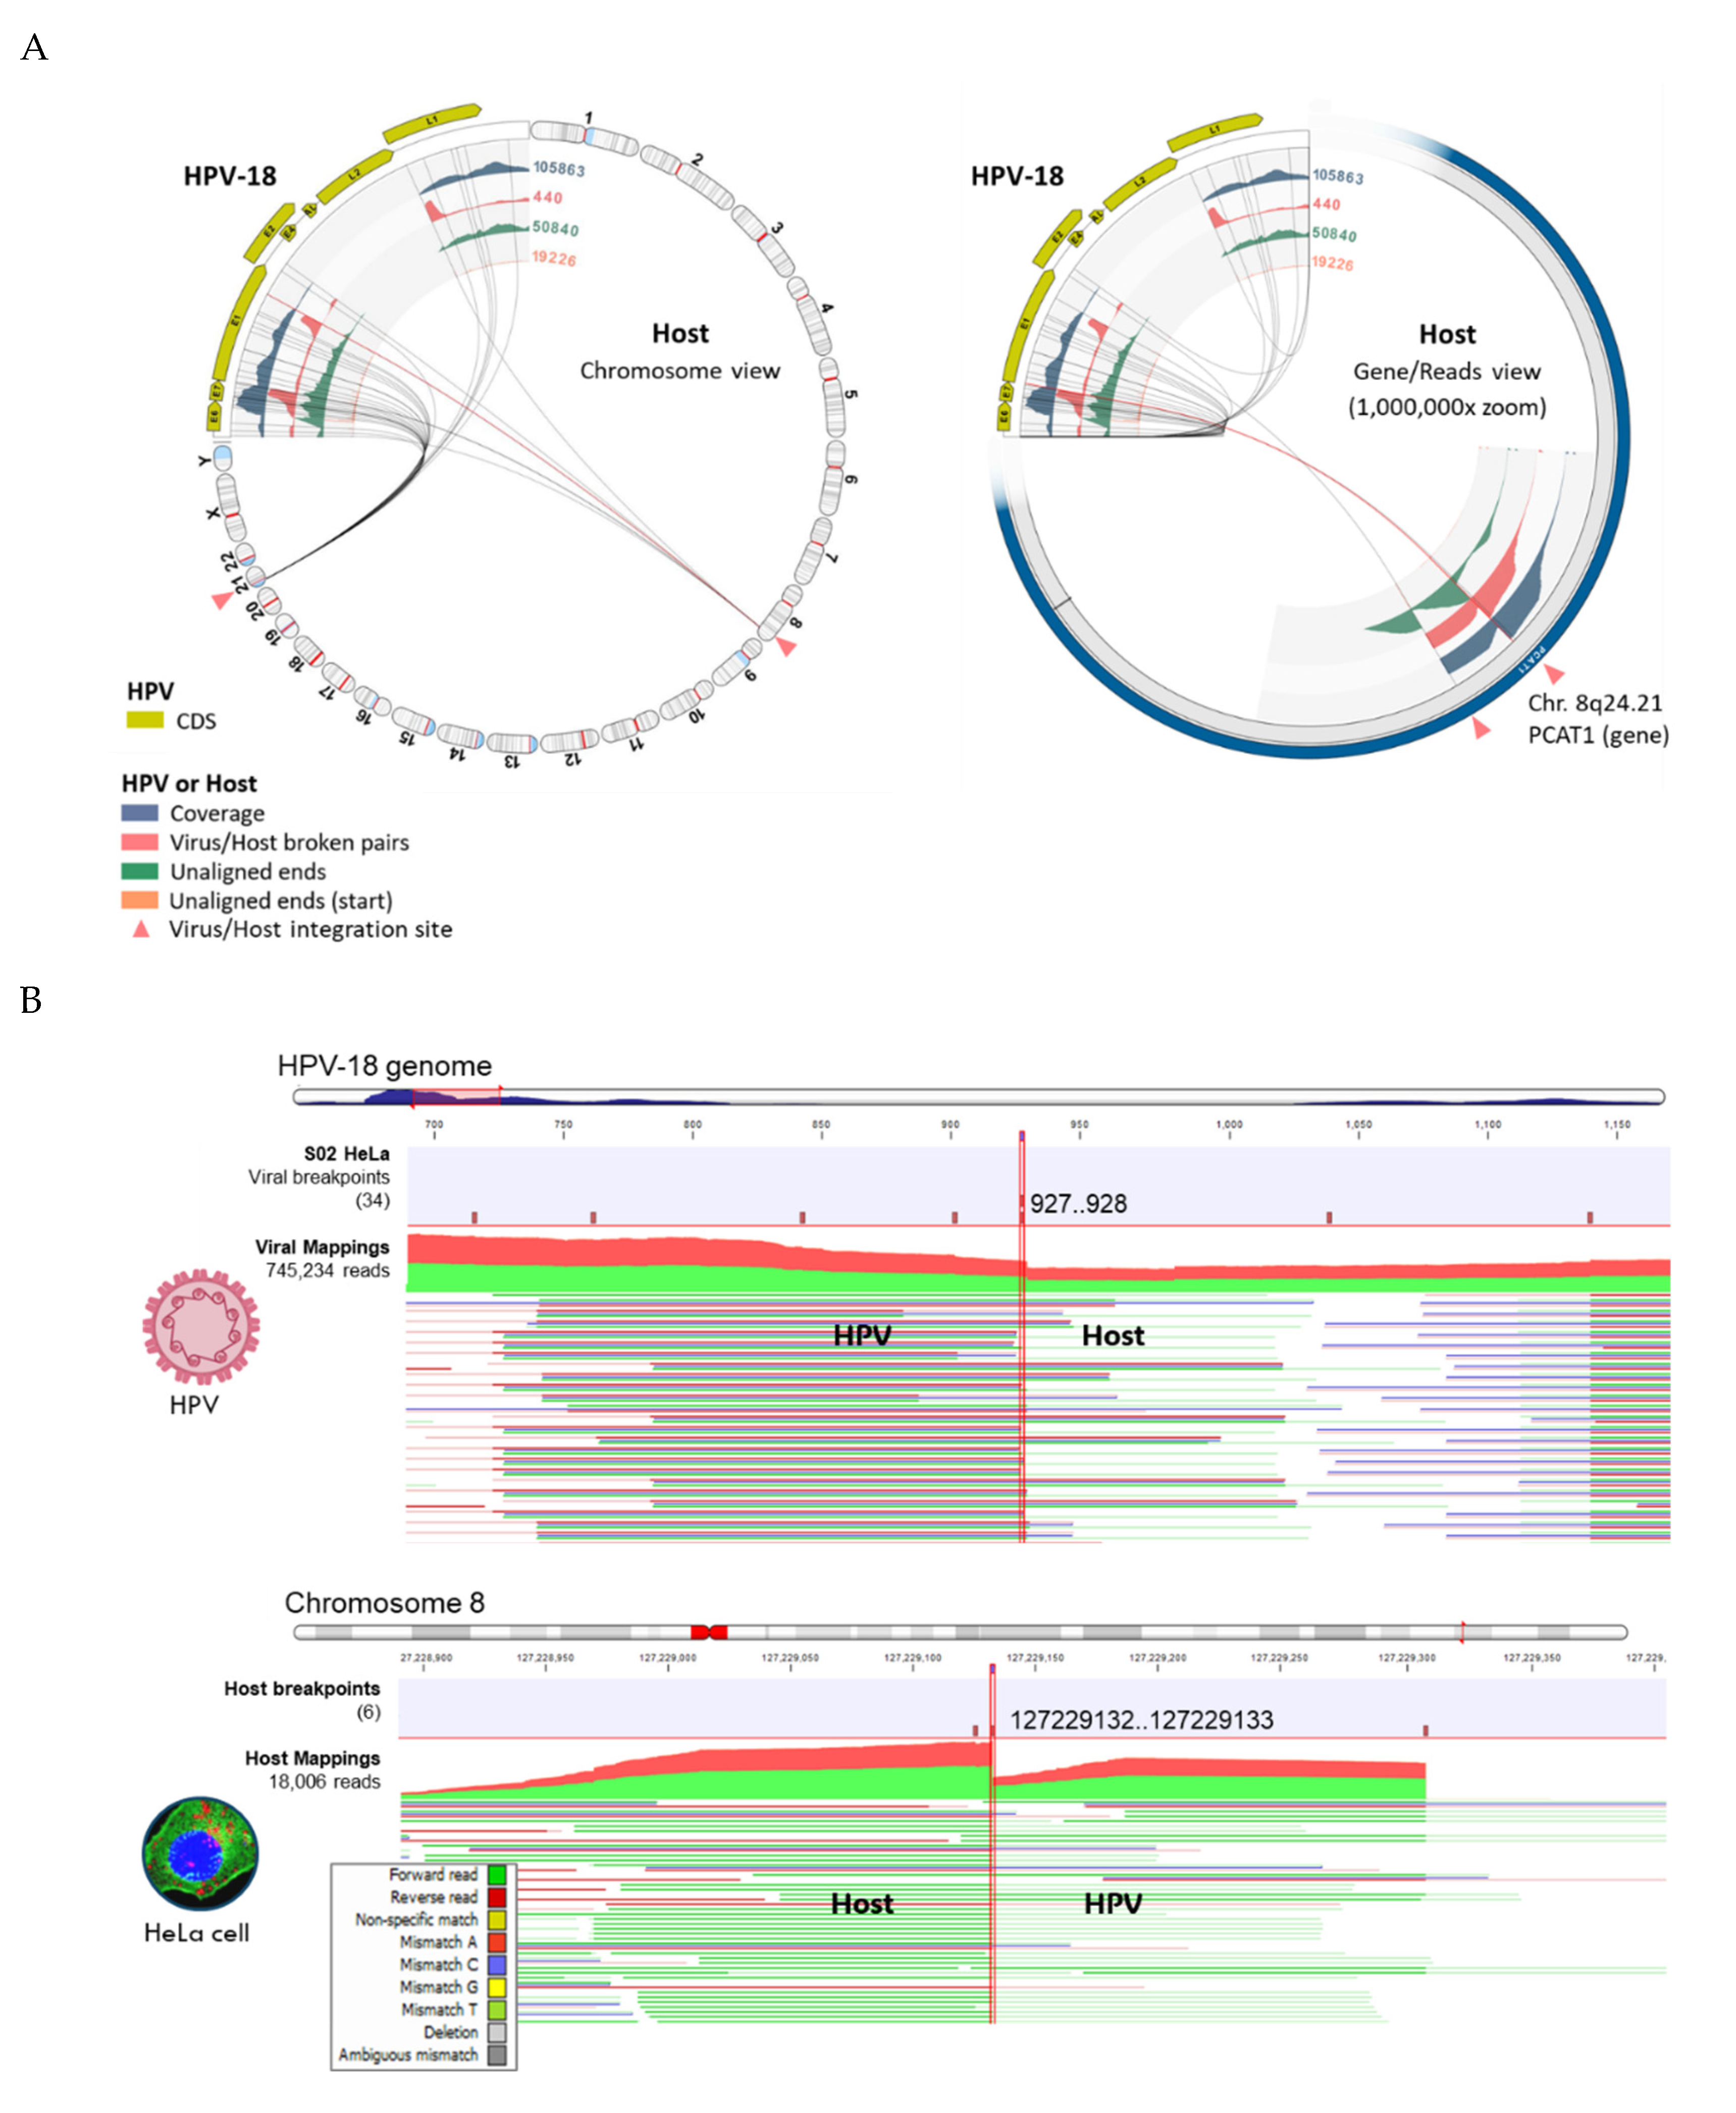
The VIS workflow median runtime per sample was 79 min (range 11 to 158 min). The workflow generated the following output files: (1) viral mapping and breakpoints annotation track, (2) host mapping and breakpoints annotation track, (3) zoomable and rotatable VIS circular plot, and (4) VIS summary report. A representative VIS circular plot of S02 HeLa presents the entire HPV and human genome in a circular layout with four inner circles of different read tracks (Figure 6A). Virus-host integration linkages i.e., chimeric reads are shown as bi-directional curvilinear lines, and the read coverage (color-coded histogram tracks) are mapped onto genome coordinates (Figure 6A). For S02 HeLa, a large break in the HPV genome between E2 and L2 genes was easily discernable, and viral-host integration within cytobands 8q24.21 and 21p11.2 were detected. The 1,000,000x gene-level view reveals the host integration site(s), disrupted genes (PCAT1 and CASC19), and nearby gene (MYC) using the rotational function of the VIS circular plot. In Figure 6B, the HPV and host read mappings for S02 HeLa are depicted. The figure highlights sites of broken read-pairs and viral-host chimeric forward/reverse reads, which have been magnified to nucleotide-level details. The unaligned segment of chimeric reads is distinguished by its subdued color.
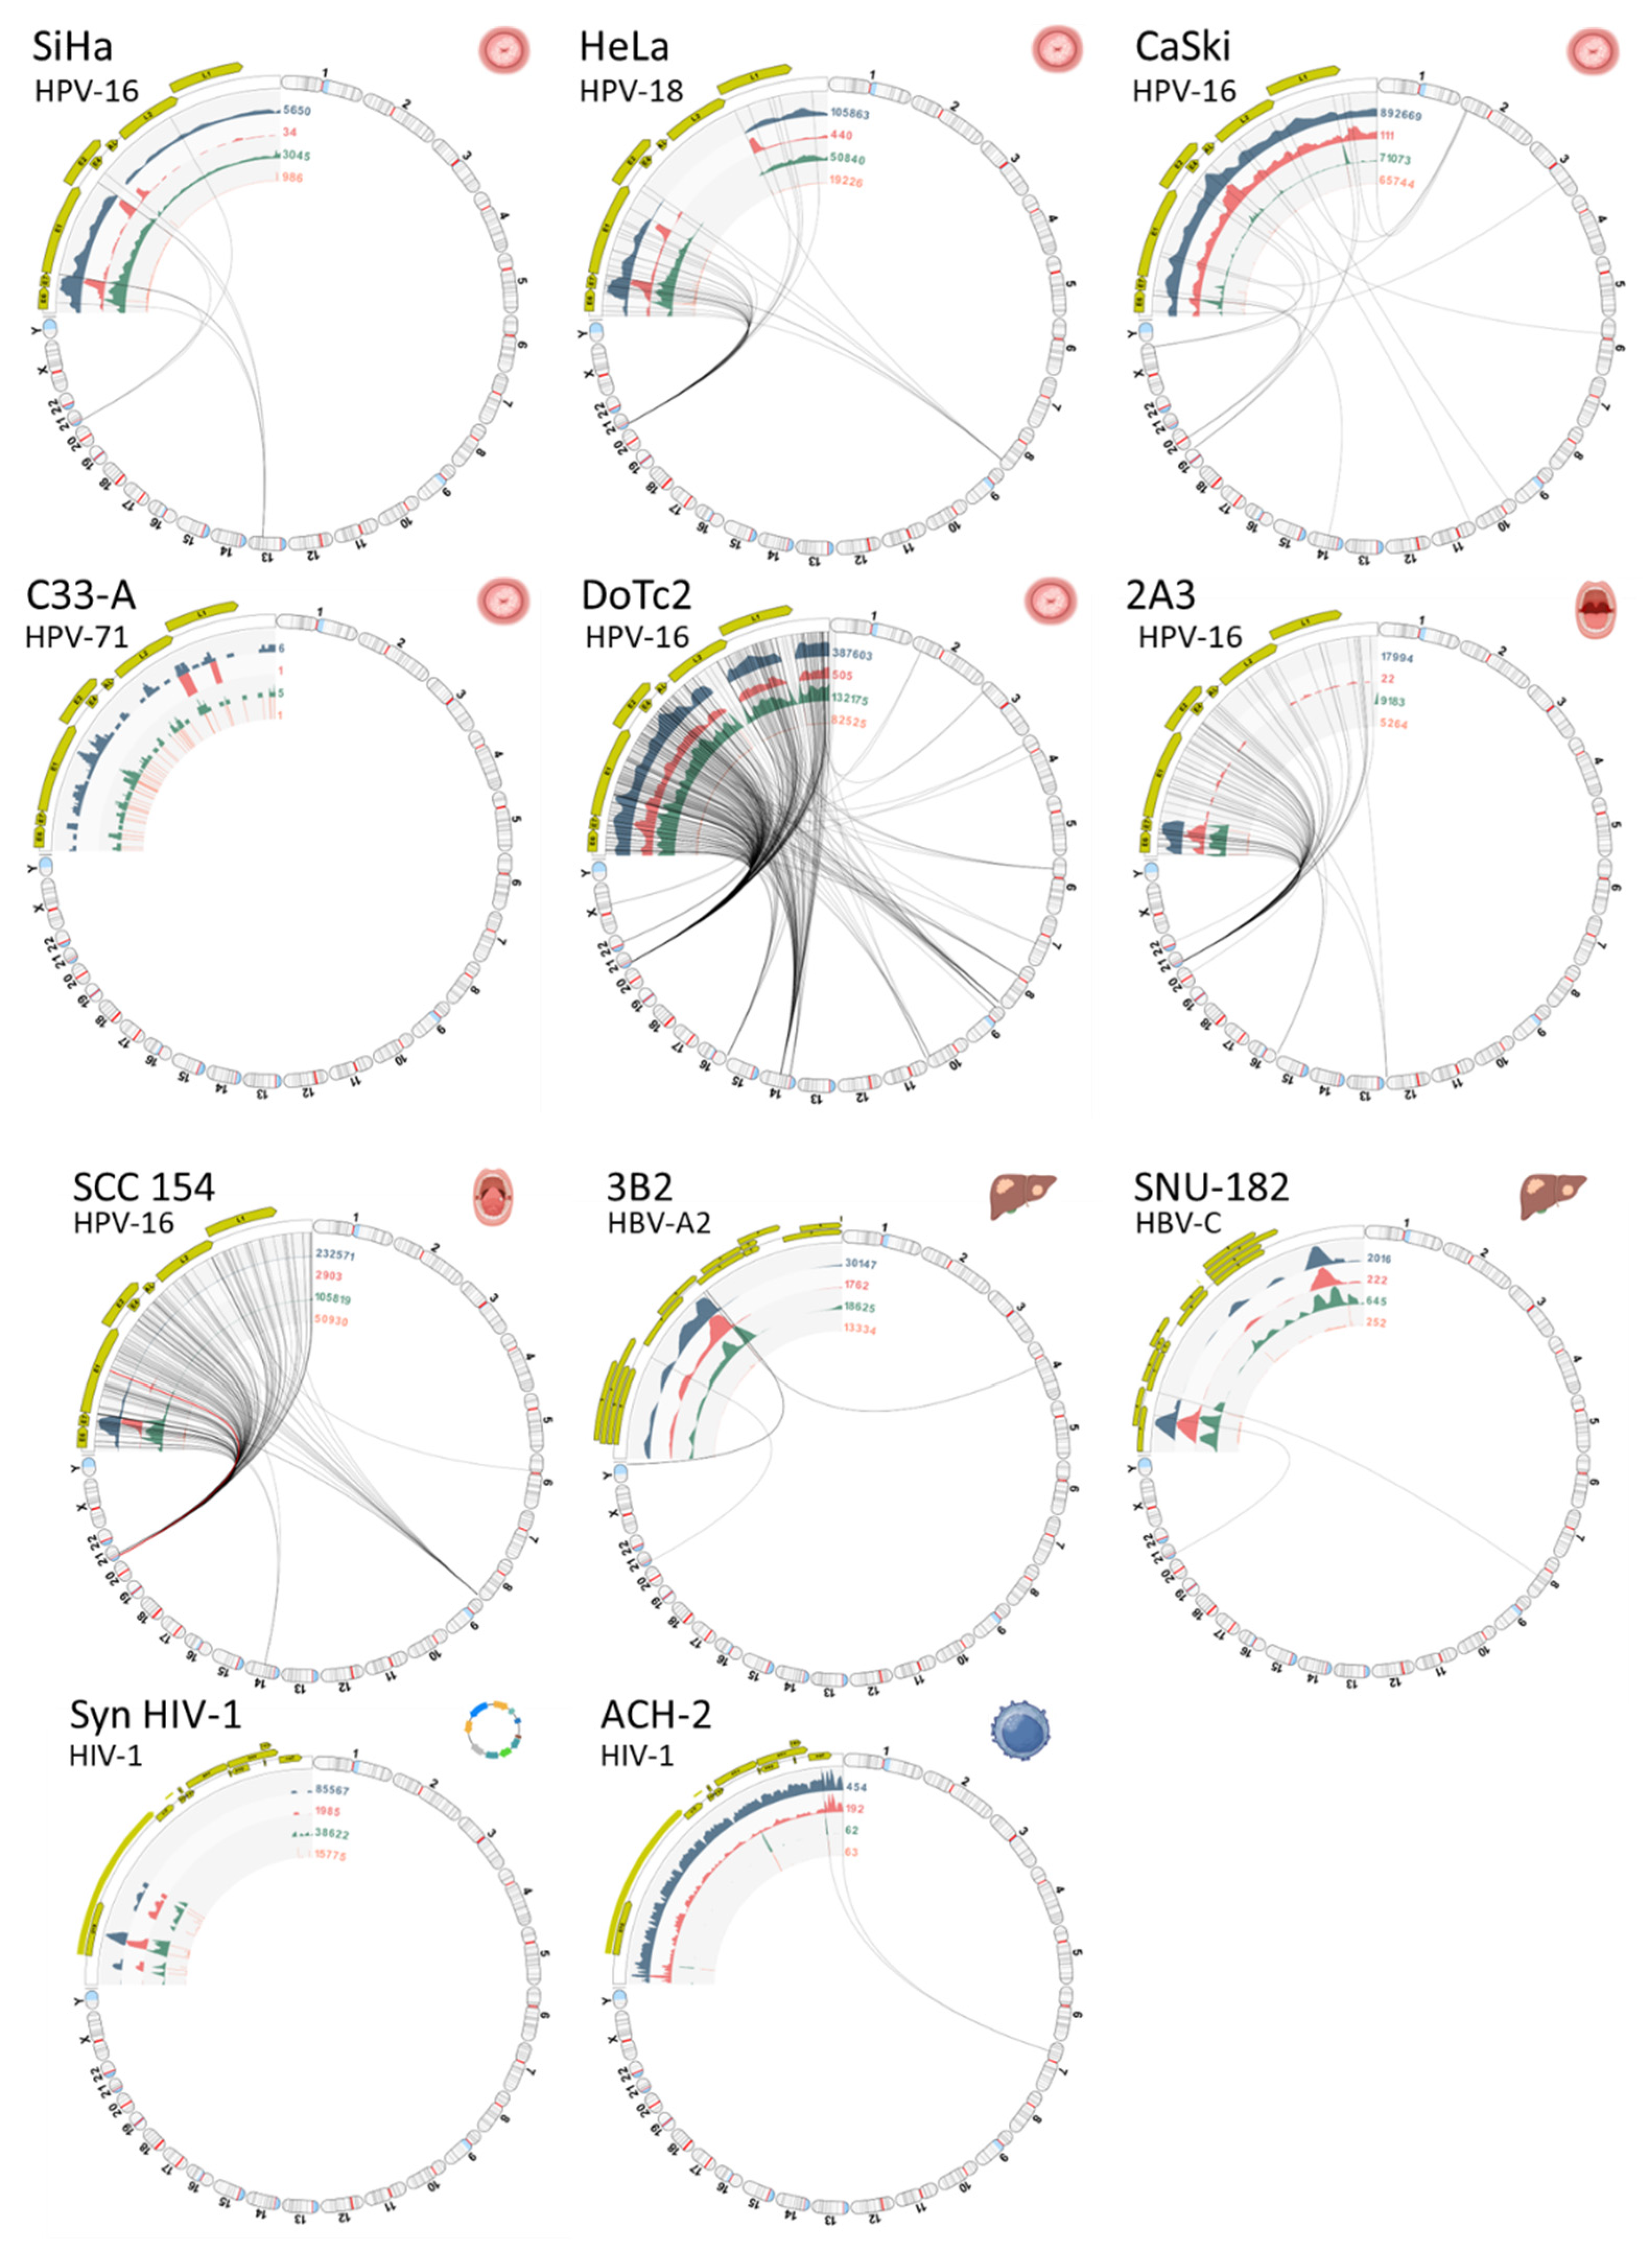
A collage of VIS circular plots in chromosome view for S01 through S11 is presented in Figure 7. The gaps in viral read mappings are easily identified by the absence of (or low) read coverage represented by the first inner circle (blue-gray histogram). The read counts (numerals) adjoining the inner circular tracks facilitate quick assessment of read quantity and coverage. Virus-host integration linkages manifested as chimeric reads are represented by the bi-directional curvilinear lines. As expected, the C-33A cervical cancer cell line (expressing p53+ and pRB+) and the synthetic HIV-1 plasmid, which are both devoid of viral incorporation, exhibited no signs of viral-host integration. The HIV-1 infected ACH-2 cells showed a single integration site, where all other virally transformed cell lines displayed multiple integration sites.
The auto-generated VIS summary reports with tables of disrupted and nearby genes for all samples are provided in Supplementary Table S4. A condensed version lists the major viral integration events detected in all virally transformed cell lines (Table 2). To compare with existing literature, the genomic coordinates in the report were converted to the International System for Human Cytogenetic Nomenclature (ISCN), specifically referring to cytobands [39,40]. Furthermore, an extensive search in PubMed and HumCFS (https://webs.iiitd.edu.in/raghava/humcfs/index.html) was performed to determine if a chromosomal region has been deemed a Common Fragile Site (CFS) or viral integration hotspot [41,42]. The disrupted and nearby genes identified in the report were also searched in NCBI Gene and PubMed to determine its function and association with carcinogenesis [43]. Statistically, the median number of viral integration events by chromosomal cytoband for the cohort was 5 (range, 1 to 13). CFS identified in this study included chr. 1q25.1, 3p25.1, 4p15.31, 8q24.3, 8q24.13, 8q24.21, 10q26.11, 12q24.33, 13q22.1, 19q13.42, 20q11.23, and Xq27.3 [41]. On average, one integration event per sample was located at a CFS (range, 0 to 3) with a median CFS/VIS of 0.2 (range, 0 to 0.5). Hotspots for HPV integration was identified in SiHa and HeLa cell lines at chr. 13q22.1 and 8q24.21, respectively [42]. Chromosomal regions (chr. 13q22.1, 8q24 and 21p11.2) associated with carcinogenesis were also identified in the cell lines [44,45,46,47,48,49]. The median number of integration events at/near a cytoband or gene associated with carcinogenesis per sample was 2 (range, 2 to 10). Host genes adjacent to the VIS, which have been identified in the literature as oncogenes, tumor suppressor genes, or cancer-associated genes were denoted in Table 2 by superscripted numerals [44,45,46,47,48,49,50,51,52,53,54,55,56,57,58,59,60,61,62,63,64,65,66,67,68,69,70,71,72,73,74,75,76,77,78]. Taken together, the findings offer valuable insights into the intricate relationship between viral integration, chromosomal location, and genetic alterations that contribute to carcinogenesis.

3.4. Workflow Runtimes

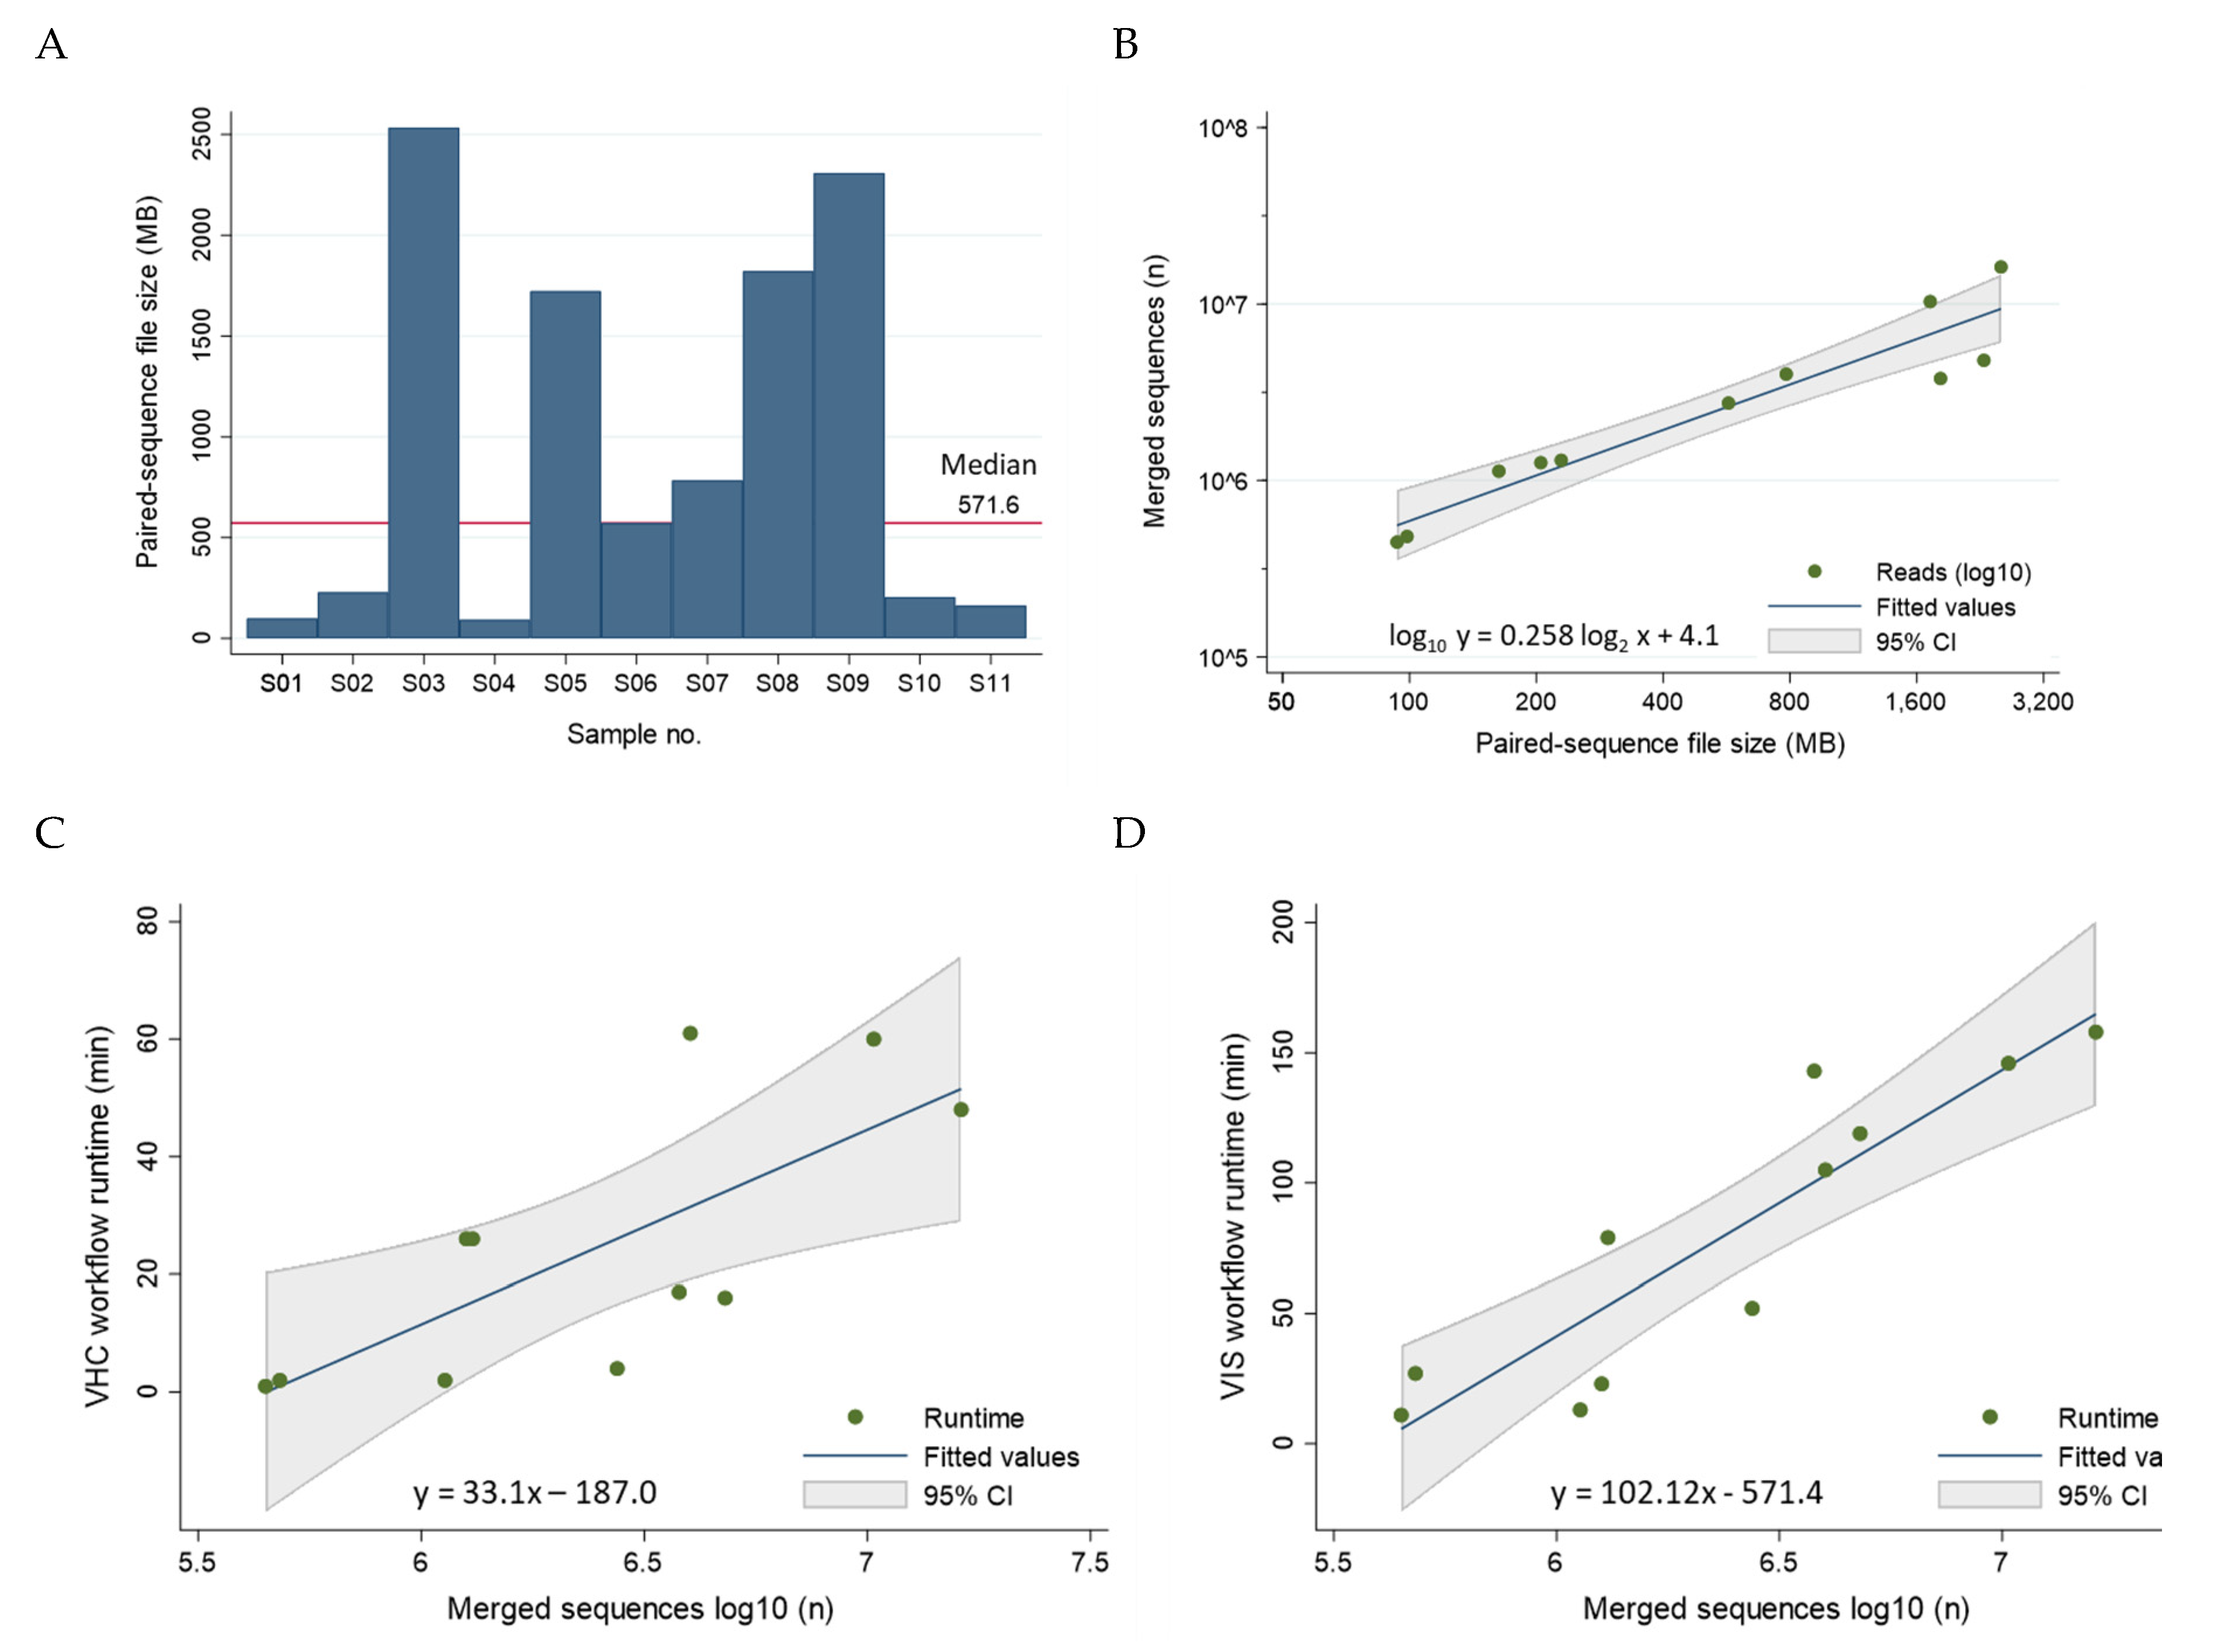
The sequencing file size of the 11 samples ranged broadly between 93 and 2,535 MB with a median of 571.6 MB consisting of 2,750,036 merged reads (Figure 8A). The file size correlated near-perfectly with the number of merged sequences after log2-log10 transformation (R2 = 0.90) (Figure 8B). The median runtime per sample for the VHC and VIS workflows were 17 min (range, 1 to 61 min) and 79 min (range, 11 to 158 min), respectively. The combined VHC/VIS median runtime per sample was 105 min (range 12 to 206 min). These timed results serve to establish a benchmark for future studies and demonstrate workflow efficiency for a unified bioinformatics analysis. A modest correlation between number of merged sequences/sample and VHC and VIS runtimes was found with R2 = 0.53 and R2 = 0.81, respectively (Figure 8C, D). The regression equations are useful for estimating runtimes based on merged reads/sample (Figure 8C, D). Analyses were performed using STATA/IC 17.0 (StataCorp LP, College Station, TX, USA).

4. Discussion

In this study, we developed and tested an end-to-end workflow from NGS to mapping virus-host integration sites. Eleven samples comprised of 9 established cancer cell lines, one synthetic HIV-1 plasmid, and one publicly available HIV-1 dataset were subjected to testing. Overall, the pre-designed hybrid capture probes of the QIAseq xHYB Viral STI Panel performed well in terms of sequence quality and quantity, as well as breadth and depth of viral genome coverage.
The creation of curated genomic databases played a vital role in the analytical workflows for both HBV and HIV-1. Unlike HPV, which benefits from an organized and curated genomic database, namely Papilloma Virus Episteme (PaVE), previously customized for use within CLC MGM [79]. Both HBV and HIV-1 necessitated considerable manual curation which were structured similarly to our prototypical HPV database [79]. For HBV, an exhaustive literature search for HBV databases identified only one online database, i.e., HBVdb release 59 (https://hbvdb.lyon.inserm.fr/HBVdb/HBVdbIndex) with 106,100 entries and tools for FASTA sequence annotation, genotyping, and drug resistance profiling [80]. Given that HBVdb was not designed for NGS data analysis, we developed our own database sourced from NCBI Virus [29]. The goal was to create a comprehensive and representative database with the following features: 1) sufficient resolution at both the genotype and subtype levels, 2) adequate genomic diversity without being exhaustive computationally, and 3) compatibility with CLC MGM for NGS analysis. For HIV-1, the LANL HIV-1 database served as the foundational resource, providing accession numbers for a comprehensive range of well-characterized HIV-1 reference genomes. However, the GenBank taxonomic information associated with each viral genome needed revision to incorporate genotype and subtype nomenclature. This modification was essential to enable precise subtyping for taxonomic profiling and variant analysis. After construction of the databases and alignment of the genomes, we successfully visualized the phylogenetic distances and relationships. The resulting tree allowed us to examine genotype and sub-lineage representation, ensuring accuracy of the databases. Viral sub-lineage classification is of utmost importance in the realms of epidemiologic research, public health, and outbreak investigations. Recently, the Bacterial and Viral Bioinformatics Resource Center (BV-BRC) held the 2024 Viral Sub-species Classification Workshop to address the complexity, enormity, and challenges of classifying and tracing viral evolution [81]. Establishing a clinically relevant, widely accepted terminology is crucial for clinical virology, especially in the context of diagnostics, vaccine research, and therapeutics [81].
The utility of all three databases was demonstrated by using our deep-sequenced samples. By integrating curated viral and human genome databases into CLC MGM workflows, we streamlined the processing of hybrid-capture NGS data. This involved inputting FASTQ files, selecting reference genomes, and configuring necessary parameters. Efficient and rapid taxonomic classification and visualization of viral metagenomes allowed us to uncover compositional differences between samples. The VHC mapping, along with its track list and zoomable visualization, facilitated easy inspection of mapped regions, variants, and low-coverage areas at both the nucleotide and amino acid levels. Remarkably, the median processing time for the VHC workflow was only 17 minutes per sample using a laptop computer. Furthermore, the HPV consensus sequences obtained from the VHC workflow proved valuable in revealing HPV sub-lineages and elucidating evolutionary relationships between samples. The VIS workflow efficiently processed NGS data, achieving a median runtime of 79 minutes per sample. The autogenerated VIS outputs featured tracks with viral and host breakpoint annotations, a zoomable and rotatable circular plot, and a summary report highlighting disrupted and surrounding genes. The tabulated report facilitated review and identification of pathogenic genetic alterations.
The primary locations of viral-host integration identified herein for SiHa, HeLa, CaSki, SCC154, and ACH-2 cell lines were consistent with prior investigations, although some differences in minor integration sites were noted [24,42,44,45,48,82,83,84,85,86,87,88,89,90,91]. The discrepant results may be attributed to differences in sequencing methods, software platforms, parameters, and cut-off definitions. Additionally, the identification of disrupted and nearby genes depended on user-defined search parameters (e.g., choosing between 100 KB and 500 KB for nearby gene distance), which can either restrict or expand the results. Studies specifically related to viral integration in the DoTc2, 2A3, Hep 3B2, and SNU-182 cell lines were not found in PubMed or online databases, VISDB and VIS Atlas [88,89,90,91]. Previously, DoTc2 cells were identified as HPV-negative by ATCC [23]. However, a recent study by Vuckovic et al. and subsequent retesting using a novel set of primers by ATCC confirmed HPV-16 integration [23,92]. Our findings corroborated HPV-16 integration in DoTc2 and revealed disrupted segments of HPV L1 and L2 genes by VHC analysis as the cause of false-negative PCR results. Hence, the findings generated by this study will serve as a valuable reference for future investigations.
Exploring the functions and interactions of genes adjacent to the viral integration sites provides valuable insights into their roles in carcinogenesis. For instance, in SiHA cells with HPV-16 integration, the gene LINC00393 on chromosome 13q22.1 has been implicated in altering 3D chromatin structure, leading to downregulation of the tumor suppressor gene KLF12 [44]. The HPV-18 DNA fragments in HeLa cells were detected approximately 500 kb upstream of the MYC proto-oncogene (located at chr. 8: 127,735,434-127,742,951). MYC is the human homolog of the oncogene (v-myc) carried by the avian retrovirus, which is associated with myelocytomatosis and other neoplasms [93]. A long-range chromatin interaction between HPV-18 fragments, the MYC gene, and the cytoband 8q24.21 has been demonstrated to constitutively activate the MYC gene, leading to cell proliferation and tumorigenesis [45]. Notably, the 8q24.21 region is recognized as a hotspot for genetic mutations associated with various cancer types [46,47]. In a recent review focusing on gastric cancer (GC), genetic alterations within the 8q24 cytoband and its sub-bands (8q24.3, 8q24.11-13, 8q24.21, and 8q24.22) were explored [47]. Among the genes frequently associated with GC within the 8q24 region are NSMCE2, PCAT1, CASC19, CASC8, CCAT2, PRNCR1, POU5F1B, PSCA, JRK, MYC, PVT1, and PTK2 [47]. The presence of similar genetic alterations across different cancer types suggests a common mechanism of oncogenesis. In our study, cytoband 21p11.2 emerged as another frequent and significant site. Bi et al. reported that 21p11.2 was the most frequently integrated region in cervical squamous cell carcinoma [48]. Among the affected downstream genes, RNA5-8SN1 to N3 which encode 45S ribosomal RNA promoters could potentially be exploited for expressing viral oncoproteins [48]. Additionally, the downstream gene MIR3648-1 (located at chr. 21: 8208473-8208652) may play a role as a tumor-suppressive miRNA within the MIR-3648/FRAT1-FRAT2/MYC negative feedback loop [50]. In SNU-182 cells, HBV DNA fragments were integrated at HAS2-AS1 downstream of the HAS2 gene on cytoband 8q24.13 (located at chr. 8: 118,300,001–121,500,000). A pan-cancer analysis, including HCCA, revealed that significant downregulation of HAS2 contributes to cancer progression and metastasis [73,74]. In ACH-2 cells, we identified the integration of the HIV-1 provirus at the NT5C3A gene on cytoband 7p14.3 (located at chr. 7: 33,014,113-33,062,776). The NT5C3A-encoded enzyme, pyrimidine 5′ nucleotidase, catalyzes the dephosphorylation of pyrimidine 5′ monophosphates, including the antiretroviral AZT monophosphate (AZT-MP) used in HIV/AIDS treatment [75]. The combined evidence highlights the substantial impact of virally integrated sites and neighboring genes on carcinogenesis or cellular function modification.
This study has several strengths. Firstly, we demonstrated the benefit of using an off-the-shelf, pre-designed hyb-cap NGS kit for detecting HPV, HBV, and HIV-1. Unlike custom probe design, which typically demands expert knowledge of the target virus, molecular biology, and bioinformatics, the pre-designed kit circumvented those exacting, time-consuming requirements. Furthermore, this represents the initial assessment of result quality achieved using the QIAseq xHYB Viral STI Panel, providing an important benchmark for future comparisons. Secondly, the VHC and VIS workflows, equipped with embedded customized viral databases, efficiently localized viral-host integration sites, and identified disrupted human genes. This end-to-end workflow serves to facilitate translational research and enhance our understanding of viral oncogenesis.
We acknowledge the limitations of our study, which focused on cancer cell lines and a single synthetic plasmid for performance testing. To further our investigation, we intend to broaden our testing to include clinical samples and datasets. Hybrid-capture NGS technology exhibits remarkable versatility and can be applied to diverse starting materials e.g., genomic RNA or DNA extracted from cells, fresh or formalin-fixed paraffin-embedded (FFPE) tissues [22]. Additionally, NGS analysis of cell-free (cfDNA) or circulating tumor DNA (ctDNA) holds great promise for mutational profiling [94]. Sastre-Garau et al. demonstrated that hybrid capture NGS of liquid biopsies (using a standard 10 mL blood sample) from patients with carcinoma of the cervix, oropharynx, oral cavity, anus, and vulva enabled molecular characterization of HPV DNA and identification of host insertion sites [95]. Similarly, hybrid capture NGS successfully detected cell-free, virus-host chimeric DNA in liquid biopsies obtained from patients with HCCA [96]. NGS hybrid-capture probes have also been developed to target all HIV-1 subtypes (groups M, N, O, and P) and HIV-2 subtypes (A and B) for monitoring sequence diversity and tracking viral evolution [97]. In the future, we plan to implement our streamlined approach for detecting viral DNA/RNA fragments in liquid biopsies. This promising, non-invasive test has the potential to assess therapeutic response and detect residual or recurrent disease in virally induced cancers.

5. Conclusions

In summary, our streamlined workflow—from sequencing to insights—has effectively mapped viral-host integration sites with speed and accuracy. Our approach is well-positioned to expedite genomic exploration and drive progress in the century-old field of tumor virology.

Supplementary Materials

The following supporting information can be downloaded at the website of this paper posted on Preprints.org. Figure S1: Viral hybrid capture (VHC) track lists, Table S1: Taxonomic profiling results, Table S2: BLAST identification of HPV sub-lineages, Table S3: Best viral reference by read mapping reports; Table S4: Viral integration sites summary reports; Database S1: HBV REF v1.0 (.clc format). Database S2: HIV-1 REF v1.0 (.clc format)

Author Contributions

Conceptualization, J.SG.; methodology, J.SG., A.E.; database, J.SG.; validation, J.SG.; formal analysis, J.SG.; investigation, J.SG., A.E.; resources, J.SG.; data curation, J.SG.; writing – original draft preparation, J.SG.; writing – review & editing, J.SG., A.E.; visualization, J.SG.; supervision, J.SG.; project administration, J.SG.; funding acquisition, J.SG. All authors have read and agreed to the published version of the manuscript.

Funding

This research was funded by the Department of Clinical Investigation at Brooke Army Medical Center, Fort Sam Houston, Texas. The APC was funded by J.SG.

Institutional Review Board Statement

Not applicable.

Informed Consent Statement

Not applicable.

Data Availability Statement

The data presented in this study are openly available in the NCBI Sequence Read Archive (SRA) under BioProject Accession Number: PRJNA1114395. Title: HPV, HBV, and HIV-1 Viral Integration Site Mapping: A Streamlined Workflow from NGS to Genomic Insights of Carcinogenesis. The HBV REF v1.0 and HIV-1 REF v1.0 that support the findings of this study are available as respective supplementary files, Database S1 and S2.

Acknowledgments

The viral and anatomical icons in the Graphical Abstract, Figures 3, 4 and 6 were created with biorender.com. The view(s) expressed herein are those of the authors and do not reflect the official policy or position of Brooke Army Medical Center, the United States Army Medical Department, the United States Army Office of the Surgeon General, the Department of the Army, the Defense Health Agency, the Department of Defense, or the United States Government.

Conflicts of Interest

No potential conflicts of interest were disclosed by the authors. The funding institution had no role in the design of the study; in the collection, analyses, or interpretation of data; in the writing of the manuscript, or in the decision to publish the results.

Abbreviations

AdenoCA, adenocarcinoma; AN, accession number; ANI, Average Nucleotide Identity; AP, Alignment Percentage; BLAST, Basic local alignment search tool; BV-BRC, Bacterial and Viral Bioinformatics Resource Center; cccDNA, covalently closed circular DNA; CCRS, chemokine receptor type 5; CDS, coding DNA sequence; cfDNA, cell-free DNA; CFS, Common Fragile Site; chr, chromosome; CLC MGM, CLC Microbial Genomics Module; ctDNA, circulating tumor DNA; CXCR4, chemokine receptor type 4; DDR, DNA damage repair; dsDNA, double-stranded DNA; dslDNA, double-stranded linear DNA; ECM, extracellular matrix; gDNA, genomic DNA; GFR, growth factor receptor; HBV, Hepatitis B virus; HCCA, hepatocellular carcinoma; HIV, Human immunodeficiency virus type 1; HPV, Human papillomavirus; HSPG, heparin sulfate proteoglycan; hyb-cap NGS, hybrid-capture next-generation sequencing; IARC, International Agency for Research on Cancer; ICTV, International Committee on Taxonomy of Viruses; ISCN, International System for Human Cytogenetic Nomenclature; LANL, Los Alamos National Laboratory; MMEJ, micro-homology mediated end-joining; NGS, next-generation sequencing; NHEJ, non-homologous end joining; NJ, Neighbor Joining; NTCP, Na+-taurocholate co-transporting polypeptide; PWC, pairwise comparison; rcDNA, relaxed circular DNA; RSV, Rous sarcoma virus; SCCA, squamous cell carcinoma; SRA, Sequence Read Archive; VHC, Viral Hybrid Capture; VIS, Viral Integration Site; WGA, whole genome alignment

References

  1. Weiss RA, Vogt PK. 100 years of Rous sarcoma virus. J Exp Med. 2011, 208, 2351–2355. [Google Scholar] [CrossRef] [PubMed]
  2. Lipsick, J. A History of Cancer Research: Tumor Viruses. Cold Spring Harb Perspect Biol. 2021, 13, a035774. [Google Scholar] [CrossRef]
  3. International Agency for Research on Cancer (IARC). Monographs on the Identification of Carcinogenic Hazards to Humans, volumes 1-135. Available online: https://monographs.iarc.who.int/agents-classified-by-the-iarc/ (accessed on 2 February2024).
  4. Proulx J, Ghaly M, Park IW, Borgmann K. HIV-1-Mediated Acceleration of Oncovirus-Related Non-AIDS-Defining Cancers. Biomedicines. 2022, 10, 768. [Google Scholar]
  5. World Health Organization (WHO). Global cancer burden growing, amidst mounting need for services. Available online: https://www.who.int/news/item/01-02-2024-global-cancer-burden-growing--amidst-mounting-need-for-services (accessed on 2 February2024).
  6. International Agency for Research on Cancer (IARC). Cancers Attributable to Infections. Geneva: World Health Organization. Available online: https://gco.iarc.fr/causes/infections/tools-bars?mode=2&sex=0&population=who&country=4&continent=0&agent=0&cancer=0&key=attr_cases&lock_scale=0&nb_results=10 (accessed on 2 February2024).
  7. Wild, C.P.; Weiderpass, E.; Stewart, B.W. World Cancer Report: Cancer Research for Cancer Prevention. Lyon: International Agency for Research on Cancer; International Agency for Research on Cancer: Lyon, France, 2020; Available online: http://publications.iarc.fr/586 (accessed on 6 June 2022).
  8. de Martel C, Georges D, Bray F, Ferlay J, Clifford GM. Global burden of cancer attributable to infections in 2018: a worldwide incidence analysis. Lancet Glob Health. 2020, 8, e180–e190. [Google Scholar] [CrossRef] [PubMed]
  9. Maucort-Boulch D, de Martel C, Franceschi S, Plummer M. Fraction and incidence of liver cancer attributable to hepatitis B and C viruses worldwide. Int J Cancer. 2018, 142, 2471–2477. [Google Scholar] [CrossRef]
  10. World Health Organization (WHO). HIV data and statistics. Available online: https://www.who.int/teams/global-hiv-hepatitis-and-stis-programmes/hiv/strategic-information/hiv-data-and-statistics (accessed on 2 February2024).
  11. Aksoy P, Gottschalk EY, Meneses PI. HPV entry into cells. Mutat Res Rev Mutat Res. 2017, 772, 13–22. [Google Scholar] [CrossRef]
  12. Park JH, Iwamoto M, Yun JH, Uchikubo-Kamo T, Son D, Jin Z, Yoshida H, Ohki M, Ishimoto N, Mizutani K, Oshima M, Muramatsu M, Wakita T, Shirouzu M, Liu K, Uemura T, Nomura N, Iwata S, Watashi K, Tame JRH, Nishizawa T, Lee W, Park SY. Structural insights into the HBV receptor and bile acid transporter NTCP. Nature. 2022, 606, 1027–1031. [Google Scholar] [CrossRef] [PubMed]
  13. McBride AA, Sakakibara N, Stepp WH, Jang MK. Hitchhiking on host chromatin: how papillomaviruses persist. Biochim Biophys Acta. 2012, 1819, 820–825. [Google Scholar] [CrossRef]
  14. Coursey TL, McBride AA. Hitchhiking of Viral Genomes on Cellular Chromosomes. Annu Rev Virol. 2019, 6, 275–296. [Google Scholar] [CrossRef]
  15. Warburton A, Della Fera AN, McBride AA. Dangerous Liaisons: Long-Term Replication with an Extrachromosomal HPV Genome. Viruses. 2021, 13, 1846. [Google Scholar] [CrossRef]
  16. McBride AA, Warburton A. The role of integration in oncogenic progression of HPV-associated cancers. PLoS Pathog. 2017, 13, e1006211. [Google Scholar]
  17. Tu T, Budzinska MA, Shackel NA, Urban S. HBV DNA Integration: Molecular Mechanisms and Clinical Implications. Viruses. 2017, 9, 75. [Google Scholar] [CrossRef] [PubMed]
  18. Tu T, Zhang H, Urban S. Hepatitis B Virus DNA Integration: In Vitro Models for Investigating Viral Pathogenesis and Persistence. Viruses. 2021, 13, 180. [Google Scholar] [CrossRef] [PubMed]
  19. Grandgenett DP, Engelman AN. Brief Histories of Retroviral Integration Research and Associated International Conferences. Viruses. 2024, 16, 604. [Google Scholar] [CrossRef]
  20. Kumar A, Murthy S, Kapoor A. Evolution of selective-sequencing approaches for virus discovery and virome analysis. Virus Res. 2017, 239, 172–179. [Google Scholar] [CrossRef] [PubMed]
  21. Shen-Gunther J, Cai H, Wang Y. HPV Integration Site Mapping: A Rapid Method of Viral Integration Site (VIS) Analysis and Visualization Using Automated Workflows in CLC Microbial Genomics. Int J Mol Sci. 2022, 23, 8132. [Google Scholar] [CrossRef] [PubMed]
  22. Qiagen: QIAseq xHYB Viral STI Panel. Available online: https://www.qiagen.com/us/products/next-generation-sequencing/ metagenomics/targeted-metagenomics/qiaseq-xhyb-viral-and-bacterial-panels/ (accessed on 1 August 2022).
  23. American Type Culture Collection (ATCC). Available online: https://www.atcc.org/ (accessed on 1 August 2022).
  24. Cellosaurus. Available online: https://www.cellosaurus.org (accessed on 1 December 2023).
  25. Iwase SC, Miyazato P, Katsuya H, Islam S, Yang BTJ, Ito J, Matsuo M, Takeuchi H, Ishida T, Matsuda K, Maeda K, Satou Y. HIV-1 DNA-capture-seq is a useful tool for the comprehensive characterization of HIV-1 provirus. Sci Rep. 2019, 9, 12326. [Google Scholar] [CrossRef] [PubMed]
  26. National Center for Biotechnology Information. Sequence Read Archive. Available online: https://www.ncbi.nlm.nih.gov/sra (accessed on 5 January 2024).
  27. Qiagen Digital Insights. Available online: https://digitalinsights.qiagen.com/products-overview/discovery-insights-portfolio/analysis-and-visualization/qiagen-clc-microbial-genomics-module/ (accessed on 12 July 2023).
  28. Richardson, C. Hepadnaviruses. In Fundamentals of Molecular Virology, 2nd Edition; Editor Acheson, NJ., Ed.; John Wiley & Sons: NJ, USA, 2011; pp. 365–376. [Google Scholar]
  29. NCBI Virus. Available online: https://www. ncbi.nlm.nih.gov/labs/virus/vssi/#/ (accessed on 25 December 2023).
  30. NCBI Nucleotide. Available online: https://www.ncbi.nlm.nih.gov/nuccore (accessed on 25 December 2023).
  31. International Committee on Taxonomy of Viruses (ICTV): Master Species Lists. Available online: https://ictv.global/msl (accessed on 25 December 2023).
  32. Koonin, E.V.; Krupovic, M.; Agol, V.I. The Baltimore Classification of Viruses 50 Years Later: How Does It Stand in the Light of Virus Evolution? Microbiol. Mol. Biol. Rev. 2021, 85, e0005321. [Google Scholar] [CrossRef]
  33. Locarnini SA, Littlejohn M, Yuen LKW. Origins and Evolution of the Primate Hepatitis B Virus. Front Microbiol. 2021, 12, 653684. [Google Scholar]
  34. United Nations Statistical Division-Geographic Regions. Available online: https://unstats.un.org/unsd/methodology/m49/ (accessed on 12 July 2023).
  35. Cochrane, A. Human Immunodeficiency Virus. In Fundamentals of Molecular Virology, 2nd ed.; Editor Acheson, NJ., Ed.; John Wiley & Sons: NJ, USA, 2011; pp. 354–364. [Google Scholar]
  36. Los Alamos National Laboratory (LANL). HIV Databases. Available online: https://www.hiv.lanl.gov/content/index (accessed on 22 January 2024).
  37. Sharp PM, Hahn BH. Origins of HIV and the AIDS pandemic. Cold Spring Harb Perspect Med. 2011, 1, a006841. [Google Scholar]
  38. Clifford GM, Tenet V, Georges D, Alemany L, Pavón MA, Chen Z, Yeager M, Cullen M, Boland JF, Bass S, Steinberg M, Raine-Bennett T, Lorey T, Wentzensen N, Walker J, Zuna R, Schiffman M, Mirabello L. Human papillomavirus 16 sub-lineage dispersal and cervical cancer risk worldwide: Whole viral genome sequences from 7116 HPV16-positive women. Papillomavirus Res. 2019, 7, 67–74. [Google Scholar] [CrossRef] [PubMed]
  39. Brothman AR, Persons DL, Shaffer LG. Nomenclature evolution: Changes in the ISCN from the 2005 to the 2009 edition. Cytogenet Genome Res. 2009, 127, 1–4. [Google Scholar] [CrossRef] [PubMed]
  40. Simons A, Shaffer LG, Hastings RJ. Cytogenetic Nomenclature: Changes in the ISCN 2013 Compared to the 2009 Edition. Cytogenet Genome Res. 2013, 141, 1–6. [Google Scholar] [CrossRef] [PubMed]
  41. HumCFS: A Database of Human Chromosomal Fragile Sites. Available online: https://webs.iiitd.edu.in/raghava/humcfs/index.html (accessed on 1 January 2024).
  42. Bodelon C, Untereiner ME, Machiela MJ, Vinokurova S, Wentzensen N. Genomic characterization of viral integration sites in HPV-related cancers. Int J Cancer. 2016, 139, 2001–2011. [Google Scholar] [CrossRef] [PubMed]
  43. NCBI Gene. Available online: https://www.ncbi.nlm.nih.gov/gene (accessed on 1 January 2024).
  44. Xu X, Han Z, Ruan Y, Liu M, Cao G, Li C, Li F. HPV16-LINC00393 Integration Alters Local 3D Genome Architecture in Cervical Cancer Cells. Front Cell Infect Microbiol. 2021, 11, 785169. [Google Scholar]
  45. Shen C, Liu Y, Shi S, Zhang R, Zhang T, Xu Q, Zhu P, Chen X, Lu F. Long-distance interaction of the integrated HPV fragment with MYC gene and 8q24.22 region upregulating the allele-specific MYC expression in HeLa cells. Int J Cancer. 2017, 141, 540–548. [Google Scholar] [CrossRef] [PubMed]
  46. Wilson C, Kanhere A. 8q24.21 Locus: A Paradigm to Link Non-Coding RNAs, Genome Polymorphisms and Cancer. Int J Mol Sci. 2021, 22, 1094. [Google Scholar] [CrossRef]
  47. Larios-Serrato V, Valdez-Salazar HA, Ruiz-Tachiquín ME. The landscape of 8q24 cytoband in gastric cancer (Review). Oncol Lett. 2024, 27, 179. [Google Scholar] [CrossRef] [PubMed]
  48. Bi Y, Hu J, Zeng L, Chen G, Cai H, Cao H, Ma Q, Wu X. Characteristics of HPV integration in cervical adenocarcinoma and squamous carcinoma. J Cancer Res Clin Oncol. 2023, 149, 17973–17986. [Google Scholar] [CrossRef]
  49. Diosdado B, Buffart TE, Watkins R, Carvalho B, Ylstra B, Tijssen M, Bolijn AS, Lewis F, Maude K, Verbeke C, Nagtegaal ID, Grabsch H, Mulder CJ, Quirke P, Howdle P, Meijer GA. High-resolution array comparative genomic hybridization in sporadic and celiac disease-related small bowel adenocarcinomas. Clin Cancer Res. 2010, 16, 1391–1401. [Google Scholar] [CrossRef]
  50. Tang W, Pei M, Li J, Xu N, Xiao W, Yu Z, Zhang J, Hong L, Guo Z, Lin J, Dai W, Xiao Y, Wu X, Liu G, Zhi F, Li G, Xiong J, Chen Y, Zhang H, Xiang L, Li A, Liu S, Wang J. The miR-3648/FRAT1-FRAT2/c-Myc negative feedback loop modulates the metastasis and invasion of gastric cancer cells. Oncogene. 2022, 41, 4823–4838. [Google Scholar] [CrossRef] [PubMed]
  51. Xiong T, Li J, Chen F, Zhang F. PCAT-1: A Novel Oncogenic Long Non-Coding RNA in Human Cancers. Int J Biol Sci. 2019, 15, 847–856. [Google Scholar] [CrossRef] [PubMed]
  52. Wu Y, Mou J, Zhou G, Yuan C. CASC19: An Oncogenic Long Non-coding RNA in Different Cancers. Curr Pharm Des. 2024 Mar 27.
  53. Wang K, Liang Q, Li X, Tsoi H, Zhang J, Wang H, Go MY, Chiu PW, Ng EK, Sung JJ, Yu J. MDGA2 is a novel tumour suppressor cooperating with DMAP1 in gastric cancer and is associated with disease outcome. Gut. 2016, 65, 1619–1631. [Google Scholar] [CrossRef] [PubMed]
  54. Choi EJ, Yoo NJ, Kim MS, An CH, Lee SH. Putative Tumor Suppressor Genes EGR1 and BRSK1 Are Mutated in Gastric and Colorectal Cancers. Oncology. 2016, 91, 289–294. [Google Scholar] [CrossRef] [PubMed]
  55. Wang WF, Zhong HJ, Cheng S, Fu D, Zhao Y, Cai HM, Xiong J, Zhao WL. A nuclear NKRF interacting long noncoding RNA controls EBV eradication and suppresses tumor progression in natural killer/T-cell lymphoma. Biochim Biophys Acta Mol Basis Dis. 2023, 1869, 166722. [Google Scholar]
  56. Tachibana M, Kiyokawa E, Hara S, Iemura S, Natsume T, Manabe T, Matsuda M. Ankyrin repeat domain 28 (ANKRD28), a novel binding partner of DOCK180, promotes cell migration by regulating focal adhesion formation. Exp Cell Res. 2009, 315, 863–876. [Google Scholar] [CrossRef] [PubMed]
  57. Jafari S, Ravan M, Karimi-Sani I, Aria H, Hasan-Abad AM, Banasaz B, Atapour A, Sarab GA. Screening and identification of potential biomarkers for pancreatic cancer: An integrated bioinformatics analysis. Pathol Res Pract. 2023, 249, 154726. [Google Scholar] [CrossRef] [PubMed]
  58. Xu HW, Wang MQ, Zhu SL. Analysis of IGFBP7 expression characteristics in pan-cancer and its clinical relevance to stomach adenocarcinoma. Transl Cancer Res. 2023, 12, 2596–2612. [Google Scholar] [CrossRef]
  59. Zhang JJ, Hong J, Ma YS, Shi Y, Zhang DD, Yang XL, Jia CY, Yin YZ, Jiang GX, Fu D, Yu F. Identified GNGT1 and NMU as Combined Diagnosis Biomarker of Non-Small-Cell Lung Cancer Utilizing Bioinformatics and Logistic Regression. Dis Markers. 2021, 2021, 6696198. [Google Scholar]
  60. Ni Z, Cong S, Li H, Liu J, Zhang Q, Wei C, Pan G, He H, Liu W, Mao A. Integration of scRNA and bulk RNA-sequence to construct the 5-gene molecular prognostic model based on the heterogeneity of thyroid carcinoma endothelial cell. Acta Biochim Biophys Sin (Shanghai). 2024, 56, 255–269. [Google Scholar]
  61. Wu G, Dong Y, Hu Q, Ma H, Xu Q, Xu K, Chen H, Yang Z, He M. HGH1 and the immune landscape: a novel prognostic marker for immune-desert tumor microenvironment identification and immunotherapy outcome prediction in human cancers. Cell Cycle. 2023, 22, 1969–1985. [Google Scholar] [CrossRef] [PubMed]
  62. Matsui Y, Imai A, Izumi H, Yasumura M, Makino T, Shimizu T, Sato M, Mori H, Yoshida T. Cancer-associated point mutations within the extracellular domain of PTPRD affect protein stability and HSPG interaction. FASEB J. 2024, 38, e23609. [Google Scholar] [CrossRef] [PubMed]
  63. Lyu Y, Wang Y, Ding H, Li P. Hypoxia-induced m6A demethylase ALKBH5 promotes ovarian cancer tumorigenicity by decreasing methylation of the lncRNA RMRP. Am J Cancer Res. 2023, 13, 4179–4191. [Google Scholar] [PubMed] [PubMed Central]
  64. Das, L. Epigenetic alterations impede epithelial-mesenchymal transition by modulating centrosome amplification and Myc/RAS axis in triple negative breast cancer cells. Sci Rep. 2023, 13, 2458. [Google Scholar] [CrossRef] [PubMed]
  65. Yang C, Zhang X, Yang X, Lian F, Sun Z, Huang Y, Shen W. Function and regulation of RGS family members in solid tumours: a comprehensive review. Cell Commun Signal. 2023, 21, 316. [Google Scholar] [CrossRef] [PubMed]
  66. Lin YH, Chen CW, Cheng HC, Liu CJ, Chung ST, Hsieh MC, Tseng PL, Tsai WH, Wu TS, Lai MD, Shih CL, Yen MC, Fang WK, Chang WT. Inhibition of lncRNA RPPH1 activity decreases tumor proliferation and metastasis through down-regulation of inflammation-related oncogenes. Am J Transl Res. 2023, 15, 6701–6717. [Google Scholar] [PubMed] [PubMed Central]
  67. Yan W, Li SX, Gao H, Yang W. Identification of B-cell translocation gene 1-controlled gene networks in diffuse large B-cell lymphoma: A study based on bioinformatics analysis. Oncol Lett. 2019, 17, 2825–2835. [Google Scholar]
  68. Jia Z, Wang M, Li S, Li X, Bai XY, Xu Z, Yang Y, Li B, Li Y, Wu H. U-box ubiquitin ligase PPIL2 suppresses breast cancer invasion and metastasis by altering cell morphology and promoting SNAI1 ubiquitination and degradation. Cell Death Dis. 2018, 9, 63. [Google Scholar] [CrossRef]
  69. Han Z, Wang Y, Han L, Yang C. RPN2 in cancer: An overview. Gene. 2023, 857, 147168. [Google Scholar] [CrossRef]
  70. Keramati F, Seyedjafari E, Fallah P, Soleimani M, Ghanbarian H. 7SK small nuclear RNA inhibits cancer cell proliferation through apoptosis induction. Tumour Biol. 2015, 36, 2809–2814. [Google Scholar] [CrossRef]
  71. Chiovaro F, Chiquet-Ehrismann R, Chiquet M. Transcriptional regulation of tenascin genes. Cell Adh Migr. 2015, 9, 34–47. [Google Scholar] [CrossRef]
  72. Heczko L, Hlaváč V, Holý P, Dvořák P, Liška V, Vyčítal O, Fiala O, Souček P. Prognostic potential of whole exome sequencing in the clinical management of metachronous colorectal cancer liver metastases. Cancer Cell Int. 2023, 23, 295. [Google Scholar] [CrossRef] [PubMed]
  73. Bao X, Ran J, Kong C, Wan Z, Wang J, Yu T, Ruan S, Ding W, Xia L, Zhang D. Pan-cancer analysis reveals the potential of hyaluronate synthase as therapeutic targets in human tumors. Heliyon. 2023, 9, e19112. [Google Scholar] [CrossRef]
  74. Vigetti D, Deleonibus S, Moretto P, Bowen T, Fischer JW, Grandoch M, Oberhuber A, Love DC, Hanover JA, Cinquetti R, Karousou E, Viola M, D’Angelo ML, Hascall VC, De Luca G, Passi A. Natural antisense transcript for hyaluronan synthase 2 (HAS2-AS1) induces transcription of HAS2 via protein O-GlcNAcylation. J Biol Chem. 2014, 289, 28816–28826. [Google Scholar] [CrossRef]
  75. Bogusławska DM, Skulski M, Bartoszewski R, Machnicka B, Heger E, Kuliczkowski K, Sikorski AF. A rare mutation (p.F149del) of the NT5C3A gene is associated with pyrimidine 5′-nucleotidase deficiency. Cell Mol Biol Lett. 2022, 27, 104. [Google Scholar]
  76. Xu H, Liu P, Yan Y, Fang K, Liang D, Hou X, Zhang X, Wu S, Ma J, Wang R, Li T, Piao H, Meng S. FKBP9 promotes the malignant behavior of glioblastoma cells and confers resistance to endoplasmic reticulum stress inducers. J Exp Clin Cancer Res. 2020, 39, 44. [Google Scholar] [CrossRef]
  77. Jin Z, Liu B, Lin B, Yang R, Wu C, Xue W, Zou X, Qian J. The Novel lncRNA RP9P Promotes Colorectal Cancer Progression by Modulating miR-133a-3p/FOXQ1 Axis. Front Oncol. 2022, 12, 843064. [Google Scholar] [CrossRef] [PubMed]
  78. Nodin B, Fridberg M, Uhlén M, Jirström K. Discovery of dachshund 2 protein as a novel biomarker of poor prognosis in epithelial ovarian cancer. J Ovarian Res. 2012, 5, 6. [Google Scholar] [CrossRef] [PubMed]
  79. Shen-Gunther J, Xia Q, Cai H, Wang Y. HPV DeepSeq: An Ultra-Fast Method of NGS Data Analysis and Visualization Using Automated Workflows and a Customized Papillomavirus Database in CLC Genomics Workbench. Pathogens. 2021, 10, 1026. [Google Scholar] [CrossRef]
  80. HBVdb: The Hepatitis B Virus database. Available online: https://hbvdb.lyon.inserm.fr/HBVdb/HBVdbIndex (accessed on 25 December 2023).
  81. BV-BRC Viral Sub-species Classification Workshop. Available online: https://www.bv-brc.org/docs/news/2024/2024-04-08-bv-brc-workshop-subspecies.html (accessed on 10 April 2024).
  82. Hu Z, Zhu D, Wang W, Li W, Jia W, Zeng X, Ding W, Yu L, Wang X, Wang L, Shen H, Zhang C, Liu H, Liu X, Zhao Y, Fang X, Li S, Chen W, Tang T, Fu A, Wang Z, Chen G, Gao Q, Li S, Xi L, Wang C, Liao S, Ma X, Wu P, Li K, Wang S, Zhou J, Wang J, Xu X, Wang H, Ma D. Genome-wide profiling of HPV integration in cervical cancer identifies clustered genomic hot spots and a potential microhomology-mediated integration mechanism. Nat Genet. 2015, 47, 158–163. [Google Scholar] [CrossRef]
  83. Akagi K, Li J, Broutian TR, Padilla-Nash H, Xiao W, Jiang B, Rocco JW, Teknos TN, Kumar B, Wangsa D, He D, Ried T, Symer DE, Gillison ML. Genome-wide analysis of HPV integration in human cancers reveals recurrent, focal genomic instability. Genome Res. 2014, 24, 185–199. [Google Scholar] [CrossRef]
  84. Shi Z, Lopez J, Kalliney W, Sutton B, Simpson J, Maggert K, Liu S, Wan J, Stack MS. Development and evaluation of ActSeq: A targeted next-generation sequencing panel for clinical oncology use. PLoS One. 2022, 17, e0266914. [Google Scholar]
  85. Olthof NC, Huebbers CU, Kolligs J, Henfling M, Ramaekers FC, Cornet I, van Lent-Albrechts JA, Stegmann AP, Silling S, Wieland U, Carey TE, Walline HM, Gollin SM, Hoffmann TK, de Winter J, Kremer B, Klussmann JP, Speel EJ. Viral load, gene expression and mapping of viral integration sites in HPV16-associated HNSCC cell lines. Int J Cancer. 2015, 136, E207–E218. [Google Scholar]
  86. Ku JL, Park JG. Biology of SNU cell lines. Cancer Res Treat. 2005, 37, 1–19. [Google Scholar] [CrossRef]
  87. Sunshine S, Kirchner R, Amr SS, Mansur L, Shakhbatyan R, Kim M, Bosque A, Siliciano RF, Planelles V, Hofmann O, Ho Sui S, Li JZ. HIV Integration Site Analysis of Cellular Models of HIV Latency with a Probe-Enriched Next-Generation Sequencing Assay. J Virol. 2016, 90, 4511–4519. [Google Scholar] [CrossRef]
  88. VIS Atlas: A Database of Virus Integration Sites in Human Genome from NGS Data to Explore Integration Patterns. Genomics Proteomics Bioinformatics. 2023, 21, 300–310. [CrossRef]
  89. VIS Atlas. Available online: http://www.vis-atlas.tech/ (accessed on 1 April 2024).
  90. Tang D, Li B, Xu T, Hu R, Tan D, Song X, Jia P, Zhao Z. VISDB: a manually curated database of viral integration sites in the human genome. Nucleic Acids Res. 2020, 48, D633–D641. [Google Scholar] [CrossRef] [PubMed]
  91. VISDB Viral Integration Site DataBase. Available online: https://bioinfo.uth.edu/VISDB/index.php/homepage (accessed on 1 April 2024).
  92. Vučković N, Hoppe-Seyler K, Riemer AB. Characterization of DoTc2 4510-Identifying HPV16 Presence in a Cervical Carcinoma Cell Line Previously Considered to Be HPV-Negative. Cancers (Basel). 2023, 15, 3810.
  93. Vogt, PK. Retroviral oncogenes: a historical primer. Nat Rev Cancer. 2012, 12, 639–648. [Google Scholar] [CrossRef]
  94. Law EW, Settell ML, Kurani SS, Eckert EC, Liu MC, Greenberg-Worisek AJ. Liquid Biopsy: Emergence of an Alternative Cancer Detection Method. Clin Transl Sci. 2020, 13, 845–847. [Google Scholar] [CrossRef]
  95. Sastre-Garau X, Diop M, Martin F, Dolivet G, Marchal F, Charra-Brunaud C, Peiffert D, Leufflen L, Dembélé B, Demange J, Tosti P, Thomas J, Leroux A, Merlin JL, Diop-Ndiaye H, Costa JM, Salleron J, Harlé A. A NGS-based Blood Test For the Diagnosis of Invasive HPV-associated Carcinomas with Extensive Viral Genomic Characterization. Clin Cancer Res. 2021, 27, 5307–5316. [Google Scholar] [CrossRef] [PubMed]
  96. Li CL, Ho MC, Lin YY, Tzeng ST, Chen YJ, Pai HY, Wang YC, Chen CL, Lee YH, Chen DS, Yeh SH, Chen PJ. Cell-Free Virus-Host Chimera DNA From Hepatitis B Virus Integration Sites as a Circulating Biomarker of Hepatocellular Cancer. Hepatology. 2020, 72, 2063–2076. [Google Scholar] [CrossRef] [PubMed]
  97. Yamaguchi J, Olivo A, Laeyendecker O, Forberg K, Ndembi N, Mbanya D, Kaptue L, Quinn TC, Cloherty GA, Rodgers MA, Berg MG. Universal Target Capture of HIV Sequences From NGS Libraries. Front Microbiol. 2018, 9, 2150. [Google Scholar]
  98. How to BLAST Guide National Center for Biotechnology Information. Available online: https://ftp.ncbi.nlm.nih.gov/pub/factsheets/HowTo_BLASTGuide.pdf (accessed on 6 June 2022).
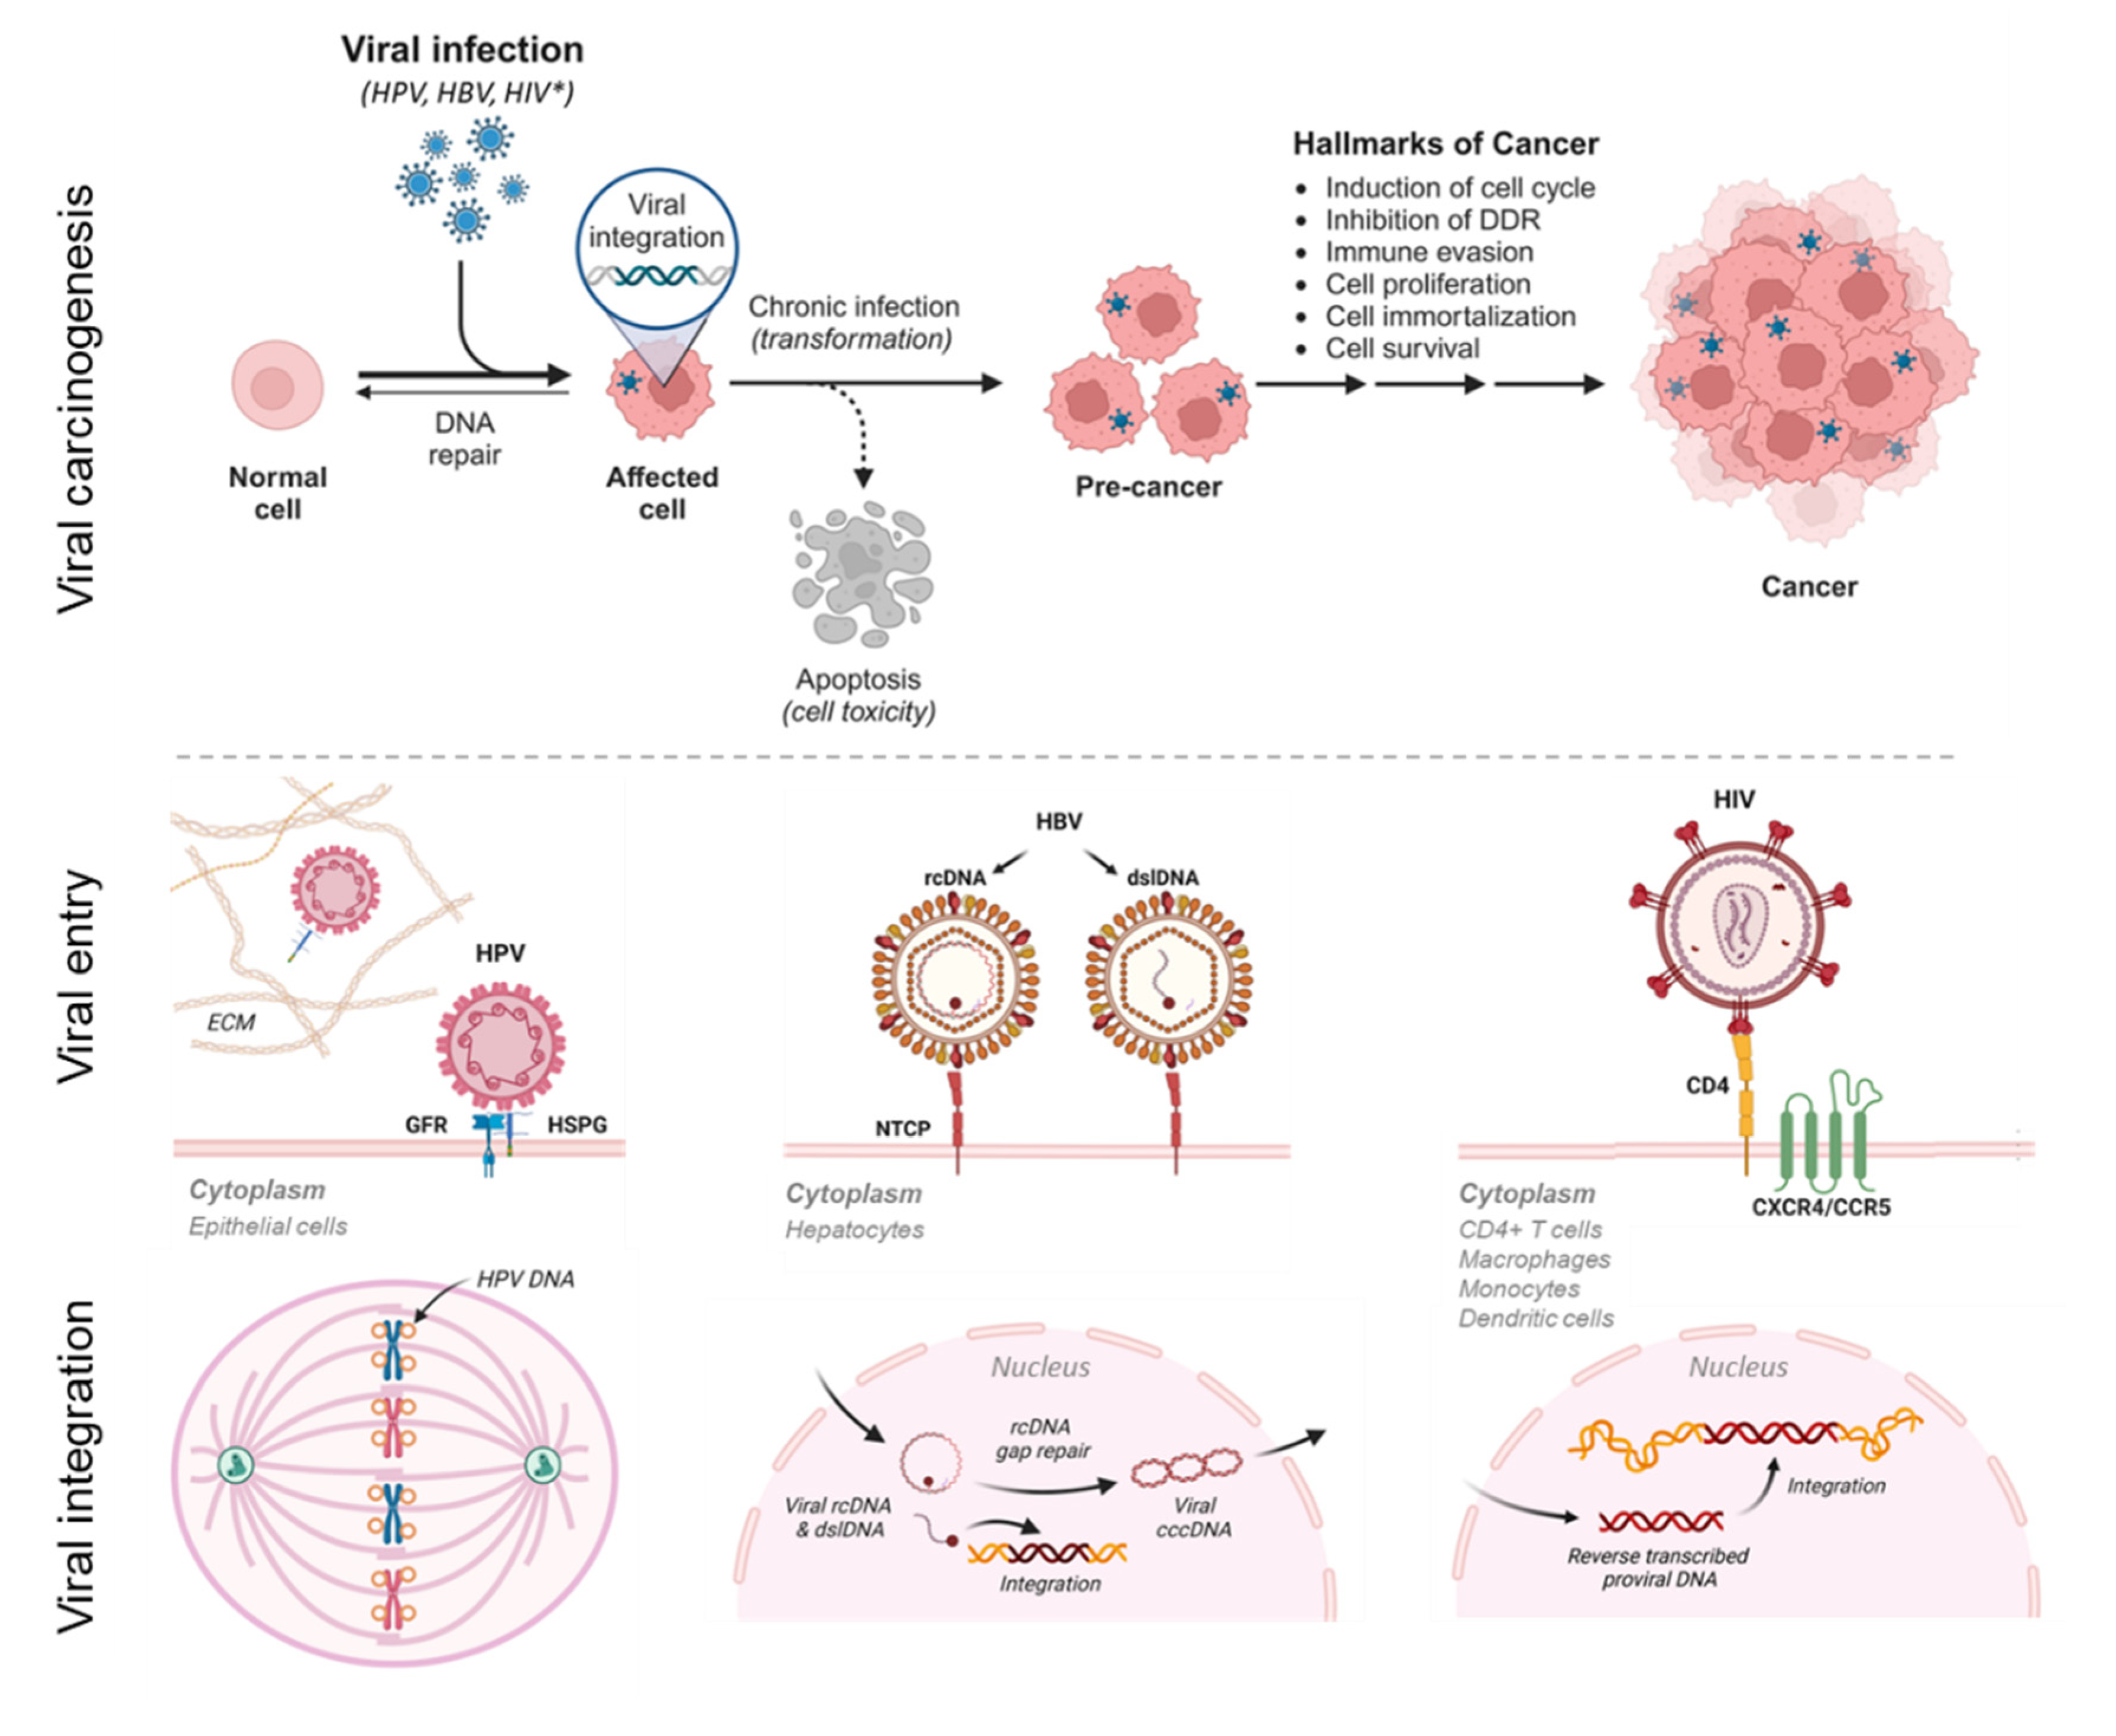
Figure 1. Viral carcinogenesis, viral entry, and viral-host genome integration. Hallmarks of viral carcinogenesis from integration to malignant transformation for human oncoviruses i.e., HPV, HBV, and HIV-1* (accelerates oncovirus-mediated carcinogenesis). Viral entry into mammalian cells is host and surface receptor specific [4,11,12]. The modes of viral-host integration differ respectively among HPV, HBV, and HIV-1 to include faulty viral partitioning to daughter cells during mitosis, non-homologous end joining (NHEJ) or micro-homology mediated end-joining (MMEJ) at double-strand DNA breaks, and provirus insertion [13,14,15,16,17,18,19]. cccDNA, covalently closed circular DNA; CCRS; chemokine receptor type 5; CXCR4, chemokine receptor type 4; DDR, DNA damage repair; dslDNA, double-stranded linear DNA; ECM, extracellular matrix; GFR, growth factor receptor; HSPG, heparin sulfate proteoglycan; NTCP, Na+-taurocholate co-transporting polypeptide; rcDNA, relaxed circular DNA (figure created with BioRender.com).
Preprints 107636 g001
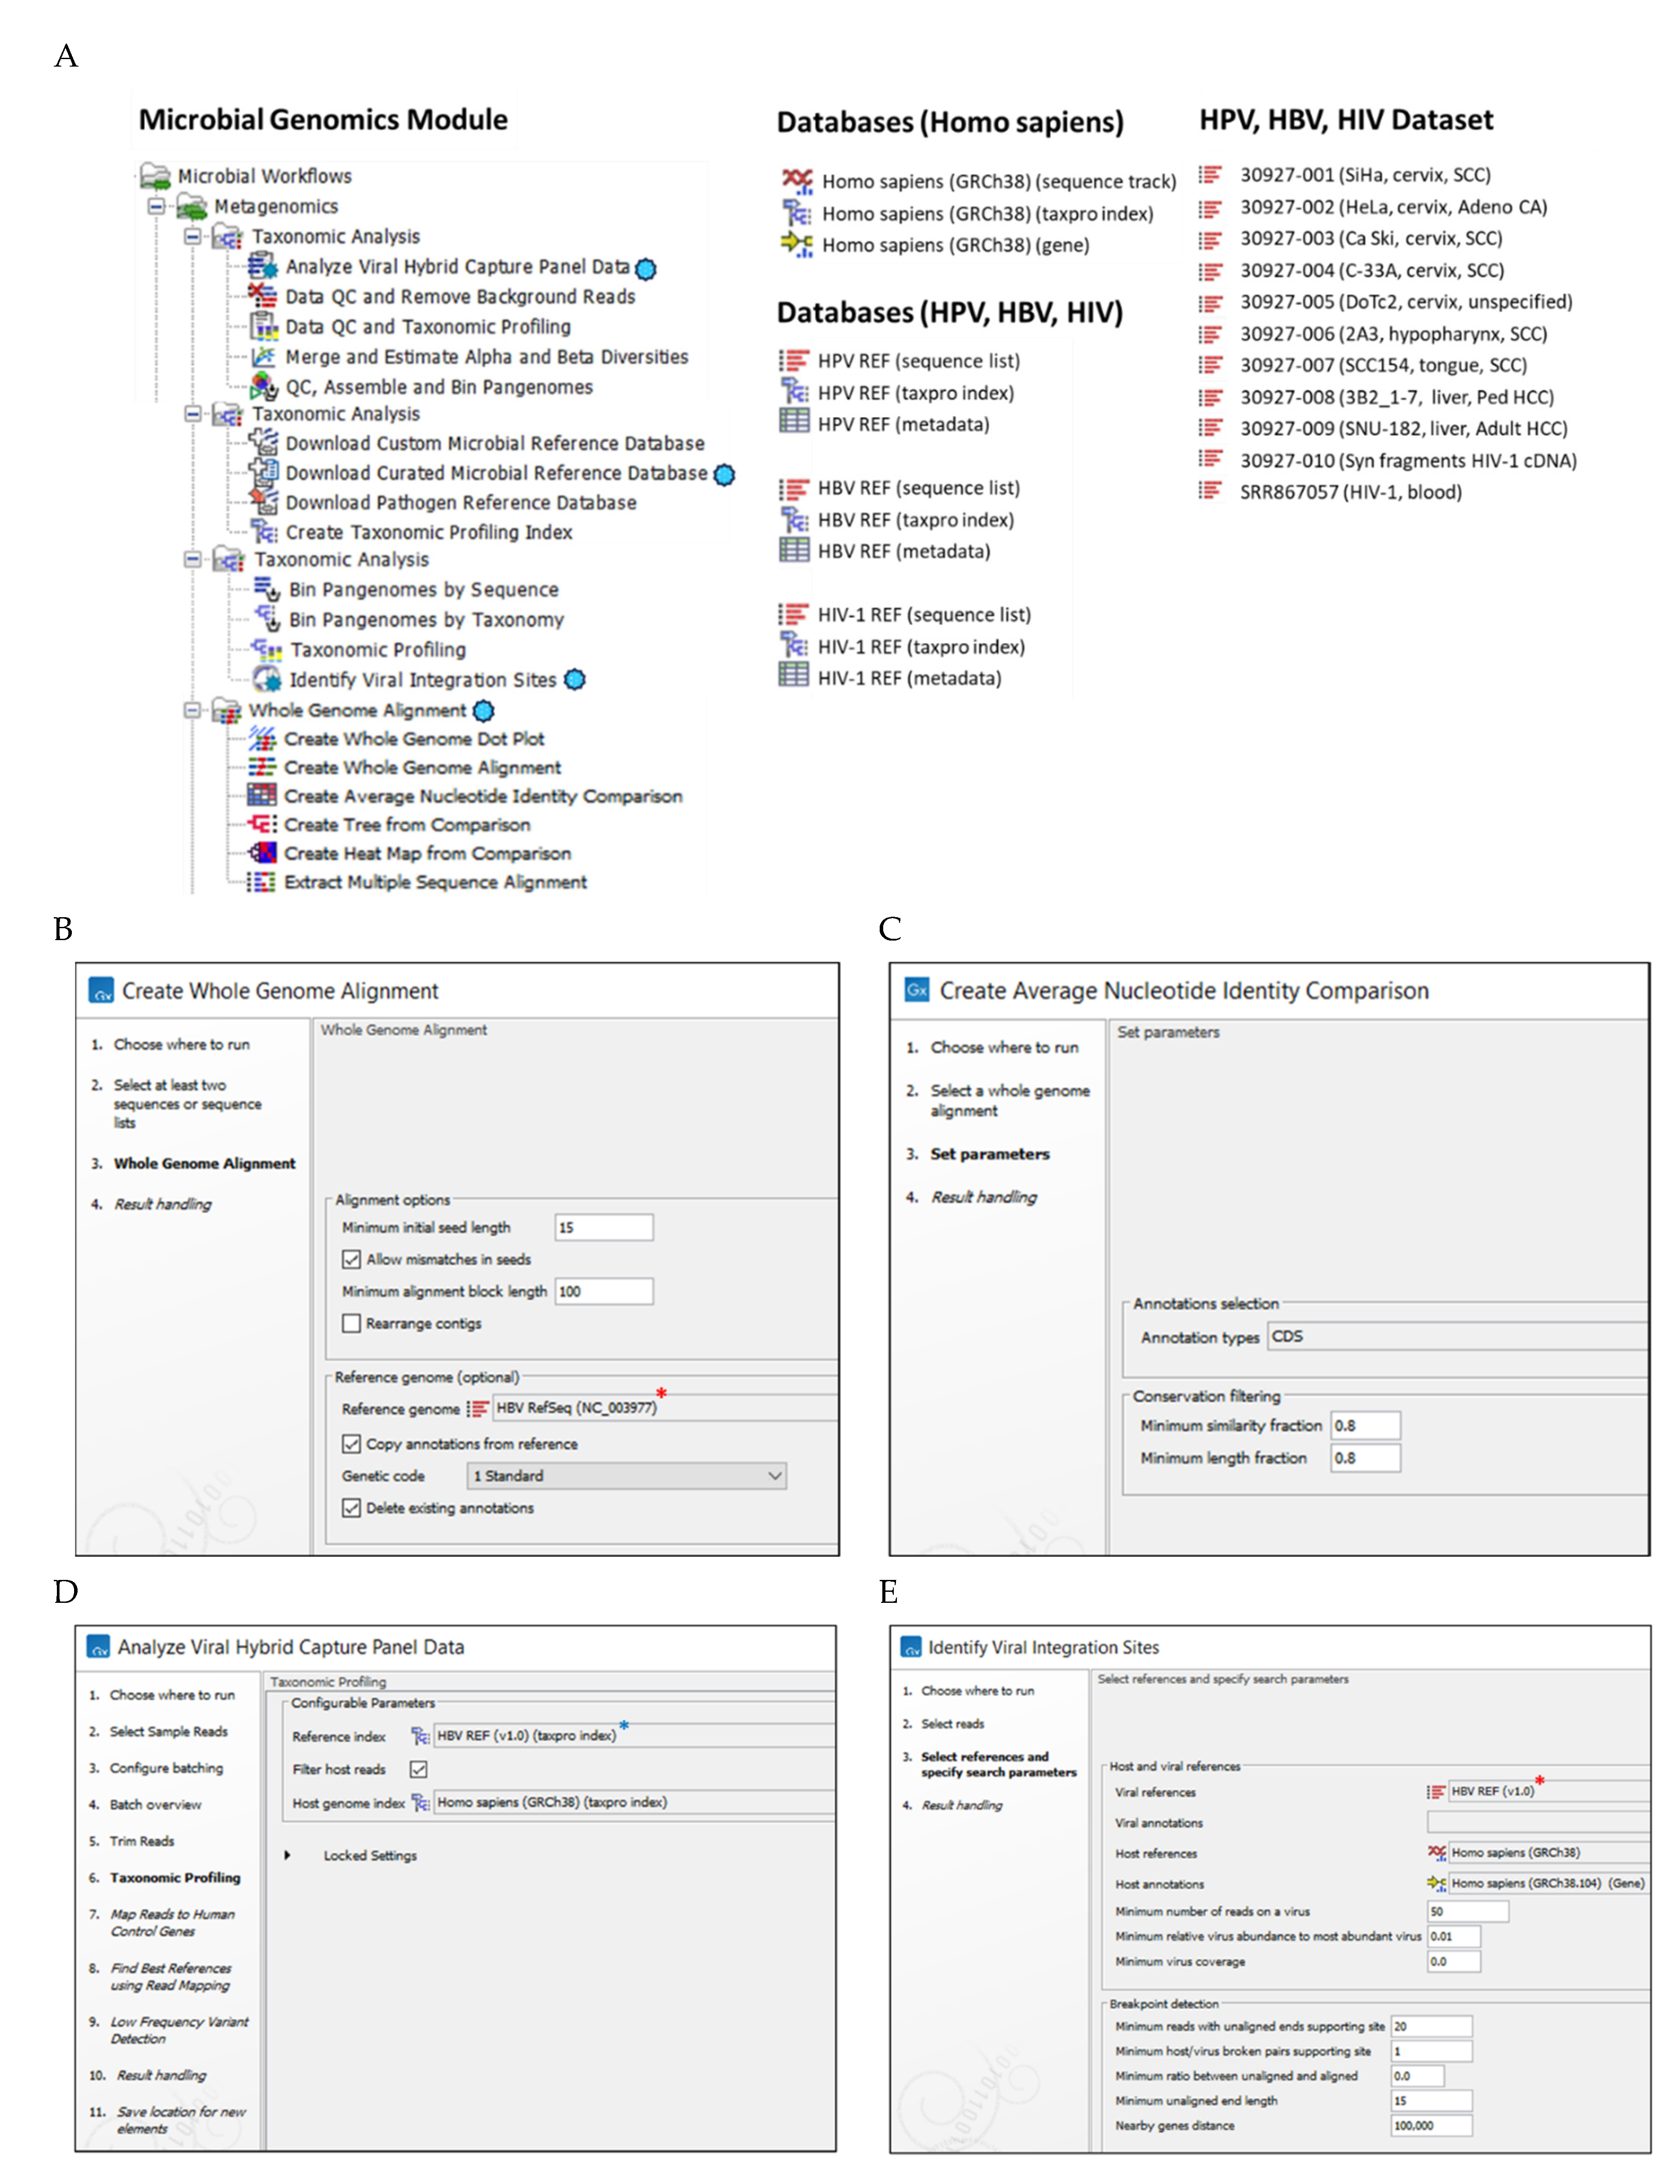
Figure 2. Bioinformatics methods (A) CLC Microbial Genomics Module, databases and dataset used for Whole Genome Alignment (WGA), Viral Hybrid Capture (VHC) data analysis and Viral Integration Site (VIS) analysis. Primary workflows and tools used for this study are designated by the virus icon (Preprints 107636 i001); (B) WGA workflow steps (1-4) with user-defined parameter settings for WGA and annotation e.g., HBV RefSeq (*) genome; (C) Create Average Nucleotide Identity Comparison workflow inputs the WGA file for quantification of the similarity between genomes, and outputs a pairwise comparison matrix; (D) VHC workflow steps (1-11) with user-defined parameter settings for Taxonomic Profiling (*) e.g., HBV reference index and Host genome index; (E) VIS workflow steps (1-4) with selected HBV(*) and Host reference genome databases and user-defined search parameters entered for this study.
Preprints 107636 g002
Figure 3. Circular phylograms of HBV and HIV-1 genomes (A) Phylogram of aligned HBV whole genomes (n = 268) clustered into 10 genotypes (A-J). The genotypes (clades) and sub-types (nodes) reveal the relatedness of its member samples. Two genomes, NC_003977 (HBV RefSeq) and AB267090 carried the conventional classification by serology (adw, adr, ayw and ayr) based on HBV surface antigen (HBsAg) reactivity. All genomes clustered according to its assigned genotype except for four accessions found in genotypes B and C (pink/blue discordancy in figure); (B) Phylogram of aligned HIV-1 whole genomes (n = 53) clustered into 4 groups (M-P). All genomes clustered according to their assigned group (clade) and sub-type (nodes). The outermost ring (label) displays the NCBI accession number and release date (year).
Preprints 107636 g003
Figure 4. Viral Hybrid Capture (VHC) analysis (A) Relative abundance of HPV, HBV and HIV-1 genotypes found in individual samples (n = 11) after taxonomic profiling are shown as stacked bars. For HPV-positive cell lines (S01-S07), three HPV genotypes were identified in the cohort. For S08 through S11, the HBV and HIV-1 genotypes/groups and sub-lineages were deciphered by taxonomic profiling (see legend); (B) For HPV-16 and -18 positive cervical and oral samples, the sub-lineages (alphanumeric code in the label) were determined by BLAST against the HPV variant reference database. The sub-lineages were genetically distinct as shown by the divergent branches in the phylogenetic tree. Cx, cervix; Phx, pharynx; Tng, tongue.
Preprints 107636 g004
Figure 5. Viral Hybrid Capture (VHC) track list view. (A-C) Representative VHC track lists for HeLa, 3B2 and ACH-2 cell lines containing HPV, HBV, and HIV-1, respectively. The displayed tracks include (top to bottom): best match sequence, read mapping against the viral reference genome, coding sequence (CDS) track, low coverage areas, and annotated variant track. Low coverage regions correspond to viral genomic gaps (breaks) for the individual viruses. The read mapping track was truncated due to its extensive length.
Preprints 107636 g005
Figure 6. Viral-host Integration Site (VIS) Analysis of HeLa cells (A) VIS circular plots in chromosome view (left) and gene view (right) revealed 2 integration sites at chromosomal cytobands 8p24.21 and 21p11.2. The dynamic functions of the VIS circular plot (i.e., genome rotation and zoom) facilitated rapid inspection of the integration sites; (B) Read mappings to HPV-18 and chromosome 8 at viral or host breakpoints (vertical brown bars with genomic coordinates) reveal both forward (green) and reverse (red) viral-host chimeric reads (bolded HPV/Host). The unaligned chimeric segment of a read sequence stands out with its subdued color. Read mappings were truncated due to their extensive length.
Preprints 107636 g006
Figure 7. Viral Integration Site (VIS) circular plots. Collage of VIS circular plots for samples (S01 to S11) in chromosome view. Virus-host integration linkages manifested as chimeric reads are designated by the bi-directional curvilinear lines. As expected, the C-33A cervical cancer cell line (p53+ and pRB+) and the synthetic HIV-1 plasmid lacking viral incorporation did not show any viral-host integration. In contrast, the HIV-1 infected ACH-2 cell had a single integration site, while all other virally transformed cell lines exhibited multiple integration sites. (anatomical icons created with BioRender.com).
Preprints 107636 g007
Figure 8. Correlation between NGS Reads and VHC/VIS Workflow Runtimes. (A) The sequencing file sizes of the 11 samples ranged broadly between 93 and 2,535 MB with a median of 571.6 MB; (B) The file size correlated near-perfectly with the number of merged sequences after log2-log10 transformation, respectively (R2 = 0.90); (C, D) The number of merged reads (log10) correlated positively with VHC and VIS workflow runtimes in a linear-log relationship. The correlation was modest for both VHC and VIS with R2 = 0.53 and R2 = 0.81, respectively. The regression equations are useful for estimation of workflow runtimes based on number of merged reads. Log transformation was used to compress the wide range of X- or Y-values, making them suitable for linear modeling.
Preprints 107636 g008
Table 1. Cell line and construct information.
Sample No. Cell line or construct1 Age Genome ancestry Virus-genotype Tumor site Histology
S01 SiHa 55 NE. Asian (Japanese) HPV-16 Cervix SCCA
S02 HeLa 30 African (American) HPV-18 Cervix AdenoCA
S03 CaSki 40 N European HPV-16 Cervix (met)5 SCCA
S04 C-33A 66 N European P53+, pRB+ Cervix SCCA
S05 DoTc2 NS N European HPV-16 Cervix NS
S06 2A3 56 SE Asian (Indian) HPV-164 Hypopharynx SCCA
S07 SCC154 54 Caucasian HPV-164 Tongue SCCA
S08 3B2.1-7 8 African (American) HBV-A24 Liver HCCA
S09 SNU-182 24 NE Asian (Korean) HBV-C4 Liver HCCA
S10 Syn HIV-12 NA NA HIV-1 M4 NA NA
S11 ACH-23 3 Caucasian HIV-1 M4 Blood T-cell
AdenoCA, adenocarcinoma; HCCA, hepatocellular carcinoma; met, metastasis; NA, not applicable; N, northern; NE, northeastern; NS, not specified; SE, southeastern; SCCA, squamous cell carcinoma. 1 Cell lines (S01-S09) were acquired from ATCC for sequencing [23]. The demographic, virus, and tumor information for samples (S01-S09 and S11) were gleaned from ATCC and Cellosaurus [23,24]. 2 Syn HIV-1 is a quantitative synthetic construct of HIV-1 RNA which contains fragments of the 5′ LTR, gag, pot, tat, rev, and nef genes acquired from ATCC [23]. 3 ACH-2 is an HIV-1 latently infected cell line [25]. 4 Viral genotypes or groups in italic font were determined by this study. 5 Cell line established from a cervical SCCA metastasis on the small bowel mesentery [23].
Table 2. Cell lines, viral integration sites, and disrupted host genes.
VIS Cell line
Cervix Oropharynx Liver T-cell
SiHa HeLa CaSki DoTc2 2A3 SCC154 3B2 SNU-182 ACH-2
1 13q22.11,2,3
LINC003934
KLF125
8q24.212,3
PCAT14
CASC194
MYC5
2p11.2
LINC01830
PRR30
2p22.3
LINC004864
12q24.331 FBRSL1 6p12.2
7SK4
4q13.36 1q25.11
TNR
7p14.3
NT5C3A FKBP95
RP95
2 21p11.22
MIR3648-15
RNA5-8SNx
21p11.22
MIR3648-15
RNA5-8SNx
3q236
3p25.11
ANKRD284 RN7SL4P4
16p13.3
METTL26
8q24.31,2
HGH14
13q31.35 2q34
UNC804
3 6p21.16
4p15.311
IGFBP75
20q11.231
RPN24
14q21.3
RN7SL24
16q11.26 4q31.35
4 10p146 6p21.32
ZBTB22
21p11.22
MIR3648-15
RNA5-8SNx
21p11.22
MIR3648-15
RNA5-8SNx
21p11.22
MIR3648-15
RNA5-8SNx
8q24.131,2
HAS2-AS14
5 11p15.46 7q21.3
GNGT14
22q11.22
PPIL24
21q21.17 Yq126 17p11.16
6 14q21.3
MDGA24
8p11.21
PLAT4
HGH14
21p11.22
MIR3648-15
RNA5-8SNx
7 19q13.421
BRSK14
9p23
PTPRD4 RN7SL5P
RMRP4
8 20p11.16 10q26.111
TUBGCP24
RGS104
9 Xq27.31, 6 14q21.3
RPPH14
RN7SL24
RPS294 RN7SL14
10 16p13.3
METTL26
11 21p11.22
MIR3648-15
RNA5-8SNx
12 22q11.22
PPIL24
13 Xq21.2
DACH24
VIS, viral integration site numbered in sequence; x, 1 to 3. 1Chromosomal region and band recognized as a human common fragile site [41]. 2Chromosomal region and band associated with carcinogenesis [44,45,46,47,48,49]. 3Chromosomal region and band recognized as an HPV integration hotspot (i.e., 2q22.3, 3p14.2, 3q28, 8q24.21, 8q24.22, 13q22.1, 14q24.1, 17p11.1, 17q23.1 and 17q23.2) [42]. 4Disrupted oncogenic, tumor suppressor or cancer-associated gene(s) [44,45,46,47,48,49,50,51,52,53,54,55,56,57,58,59,60,61,62,63,64,65,66,67,68,69,70,71,72,73,74,75,76,77,78]. 5Nearby oncogenic, tumor suppressor or cancer-associated gene(s) [44,45,46,47,48,49,50,51,52,53,54,55,56,57,58,59,60,61,62,63,64,65,66,67,68,69,70,71,72,73,74,75,76,77,78]. 6Viral integration site without disrupted gene(s). Nearby genes listed in Supplementary Table S4. 7Disrupted uncharacterized long non-coding RNA gene listed in Supplementary Table S4.
Disclaimer/Publisher’s Note: The statements, opinions and data contained in all publications are solely those of the individual author(s) and contributor(s) and not of MDPI and/or the editor(s). MDPI and/or the editor(s) disclaim responsibility for any injury to people or property resulting from any ideas, methods, instructions or products referred to in the content.
Copyright: This open access article is published under a Creative Commons CC BY 4.0 license, which permit the free download, distribution, and reuse, provided that the author and preprint are cited in any reuse.
Prerpints.org logo

Preprints.org is a free preprint server supported by MDPI in Basel, Switzerland.

Subscribe

© 2024 MDPI (Basel, Switzerland) unless otherwise stated