Preprint
Article

Competitive Distribution of Public Goods: The Role of Quorum Sensing in the Development of Bacteria Colonies

Altmetrics

Downloads

70

Views

27

Comments

0

A peer-reviewed article of this preprint also exists.

This version is not peer-reviewed

Submitted:

28 May 2024

Posted:

29 May 2024

You are already at the latest version

Alerts
Abstract
The production of public goods is a necessary condition for the survival of the species but it comes at the expense of individual growth. In a prototype bacterial colony, we model the role of quorum sensing as a resource redistribution mechanism. Two types of bacterial colonies are analyzed, one made up of a single strain and one made up of two different strains. Based on a recent series of experimental data present in the literature, we analyze two types of strains with different extinction times: strains that consume available resources very quickly, therefore becoming extinct quickly, and strains that consume resources slowly and die due to aging. We show that the proposed quorum sensing model describes the main experimental result, namely that coexistence favors the survival of both strains. Furthermore, the production of public goods is maximized when both types of individuals have the maximum proliferation output. Finally, we highlight the role played by so-called dormant cells in the duration of survival time. These cells are of particular interest, because their ability to counteract different types of stress (e.g. the use of antibiotics) still constitutes a challenge.
Keywords: 
Subject: Physical Sciences  -   Applied Physics

1. Introduction

The development of bacterial colonies is a fascinating research topic where complexity of a well-organized system is implemented by the simplest biological elements, cells. Furthermore, understanding the mechanisms underlying colony growth has multiple interests because it can help controlling and containing potentially dangerous strains [1,2] or, conversely, sustaining beneficial strains [3,4]. More generally, such mechanisms are useful to identify common social mechanisms that can also be observed in multiple evolved species [5].
The available literature offers several models that describe social cooperation, particularly between evolved beings. For instance, cooperation may be induced by forms of global awareness that achieve higher level of well-being by reducing personal payoff and adopting risk-averse strategies [6,7,8].
In less evolved living beings, the concept of conscious awareness is, presumably, replaced by a sort of an unconscious awareness, associated with mechanisms of elementary communication performed through hormones, pheromones or, in general, small molecules. This seems to be the basis of functioning of very organized systems such as beehives, anthills, and again bacterial colonies.
In bacteria, this kind of communication is called quorum sensing [9,10] (QS). It has a pivotal role in the production of both offspring and public goods like toxins, biofilm, bioluminescence, etc. Furthermore, in the framework of ecological competition, the concept of competition-sensing [11] was coined to describe abilities gained by bacteria in detecting and responding to ecological competition. In fact, one of these abilities is quorum sensing [11] which seems to be involved in the cooperative interaction of bacterial colonies [12,13,14,15,16].
The concept of awareness as well as other paradigms like the characterization as cheaters, defeaters, cooperators (which have a clear meaning in evolved species) lose their traditional meaning in the case of less evolved species where they may rather be related to different abilities in the management of nutrients (metabolism) or stressing conditions.
In general, although it is not clear what are the conditions under which cooperation wins against individualism [17,18,19,20], it is known that cooperation is widely adopted by living beings of different evolutive level and has a key role in regulating ecological and also evolutionary processes [20]. Many proposed models of cooperation or mutualism produce results which appear to differ from real data [20] suggesting that some key element is still missing in our knowledge of this phenomenon.
Recent studies considered colonies of Vibrio harveyi, a bacterium widespread diffused in aqueous environment and mainly known for its ability to produce bioluminescence. In this case, the role of QS in the maintenance of wellness in natural (wild type) strains as well as its evolutive role in sustaining cooperation in bacteria colonies was highlighted [12,13,14]. Specifically, natural strains of this and probably other bacteria are supposed to be a well mixed combination of strains classified as defectors/cooperators with respect to public goods (PG) production. In particular, it was observed that while defectors maximize their growth at the expense of PG production, cooperators do the opposite and maximize PG production at the expense of their growth. Both these strategies drive to extinction: in the former case due to exhaustion of resources, in the latter due to aging . While defeaters outcompete unconditional cooperators lineages, if mixed properly, QS may regulate the performance of both, producing a stable colony which is resilient against the attacks of enemies/defeaters [12].
In natural environment, bacteria compete mainly for space and nutrients [16,21] and metabolism plays a key role in ecological competition [11,21] . As expected, in conditions of limited amount of nutrients, competitors with high metabolism perform better than competitors with low metabolism. On the other hand, a more complex and partially unknown role is played by metabolism in conditions in which the amount of nutrients changes (enrichment paradox) [22], or in describing the behavior of bacteria during dormancy [23].
In this paper, we outline a model where QS acts as a moderator between two strains characterized by two different social behaviors and promotes cooperation, in agreement with experiments [12,13,14]. In particular, we model each strain as characterized by two specific biochemical mechanisms, the assimilation rate related to the metabolism of the cell [21] (higher metabolism, higher offspring production), and the productivity level of PG, i.e. the fraction of resources allocated for this purpose. Depending on the values of metabolism and productivity we have four schematical characterizations of the single agent: (a) cheater with high metabolism and low productivity; (b) defeater with high metabolism and high productivity (is defeated in offspring production due to the high amount of resources driven to PG); (c) cooperator with low metabolism and high productivity; (d) dormant with low metabolism and low productivity. In our modeling the limited amount of resources (environmental conditions) and the existence of a maximal surviving time drive each of the categories to extinction in short time. On the other hand, if appropriately mixed, two strains turn out to be able to perform better than both the single ones, in terms of survival time, fitness, and public goods production. The responsible for this interesting behavior is quorum sensing, here introduced as a long-range interaction among agents which acts as a moderator in the development of each type of agent. The model and results are detailed in the following sections.

2. Materials and Methods

We model a bacterial colony in a way to take into account strains that display specific social behaviors [12,13,14]. If left to develop alone, they would produce extinction with little production of public good. If properly mixed, they should exhibit a large PG production. The key element of the modeling is quorum sensing, previously introduced to describe bioluminescence in Vibrio harveyi [24,25] and which is here shown to be able to provide some general benefits to the colony, in agreement with experiments [12,13,14]
The model is intended to represent colonies of bacteria developing in a limited environment and limited food conditions in line with the description in [12,13,14]. Colonies are made up of single or multiple strains, each characterized by a specific rate of nutrient assimilation (σ) and a level of productivity (α) of public goods.

Model

The proposed model is an agent-based model on a regular network [24,25,26,27,28]. The amount of resources is limited. In the network, each node represents an occupiable position. Each node can be occupied by only one of two different types of agents, each identified by a productivity parameter α, which regulates the amount of public goods produced and an assimilation rate σ that characterizes the agent-type. The productivity parameter can be adjusted to achieve the best performance. A higher productivity reduces the offspring levels. Each kind of agent reproduces the features of a specific bacterial strain, and therefore we will use the two terms interchangeably. Strains with a low assimilation rate (small σ) reproduce with difficulty, and finally die out due to ageing. On the other hand, strains with a high assimilation rate reproduce easily and quickly deplete the environmental resources, thus dying due to hunger. Strains that adopt low productive behavior (small α) are most effective in producing offsprings, and the opposite happens for strains that adopt highly productive behavior.
The model implements the concept of quorum sensing (QS), i.e. a long-range interaction between cells, via an effective long-range potential instead of physical exchange of small molecules (autoinducers [9,10]). This potential is produced by a characteristic of the cell, i.e. the sensing-charge (Q), which represents the strength of the cell/agent and can be associated with its size. The value of Q, which here takes integer values, has multiple roles. It determines whether the agent can reproduce, donating half of Q to the offspring. It also determines the quantity of energy (nutrients) that each agent can receive. It selects the node that the offspring can occupy and, finally, determines the quantity of public goods produced by the colony.
The evolution of each agent stops when it reaches the maximum value of Qmax. On the other hand, the energy necessary to improve the sensing-charge is ideally taken from outside, i.e. from the environment, and there is a maximum amount of energy that the colony may receive. When this threshold is reached, the colony evolution stops. Each agent has also an age indicator which brings the sensing-charge value to zero once a maximum value τ is reached whereupon no agent is present on that node.
The colony is allowed to evolve for subsequent iterations and the assumed configuration is stored at each iteration. The age indicator grows by one unit at each step if the sensing-charge value does not change, otherwise it is reset.
The initial value of Q (0/1) is assigned stochastically in the first iteration in order to distribute a number of sensing-charges equal to an assigned fraction of the total number of nodes.
At each iteration each agent receives energy which it uses, in proportion to its assimilation rate, for reproduction or migration. The amount of received energy depends on the energy distributed in the colony. In turn, this depends on the existing sensing-charges and on its own productivity, increasing as the aptitude for productivity decreases. The final amount of nutrients used by each agent depends on its own assimilation rate.
Finally, the colony produces public goods (nutrients, viral agents, bioluminescence etc. [9,10]) which are a product of QS and specifically of the level of cooperativity [24,25].
In the model, links and nodes give complementary information about the colony. Specifically, while the colony growth depends on the nodes of the network, the production of PG is described by means of the links by solving a random resistor network (RRN) [29] that overlays the grid and evolves with it. The impedance of this RRN depends on the amount and distribution of sensing-charges in the network and converts these data into a measurable quantity that we identify with the specific public goods produced by the colony, for example, bioluminescence [24].
The procedure is detailed as follows:
  • LANDSCAPE INITIALIZATION
INPUT DATA: input data (shown in Table I) include a random distribution of agents with Q = 1 in the grid, in agreement with the chosen fraction of occupiable sites. Each node may be occupied by only a single-type agent.
POTENTIAL DESIGNATION: the potential V of each node and the energy of the whole network are computed. For the l-th node, the potential V l ,   and its energy, ε l ,   are given by
V ( l ) = j l N Q ( j ) D i s t ( j , l )   ,   ε ( l ) = Q ( l ) j l N Q ( j ) D i s t ( j , l )
where N=Lx x Ly is the network size and D i s t ( j , l ) is the Euclidean distance between the two nodes l and j. Q ( k ) is the sensing-charge of the k-agent, indepently on its type.
The energy of the network is computed as
E n e r g y = 1 2 i , j = 1 ( i j ) N Q ( i ) Q ( j ) D i s t ( i , j )
.
If E n e r g y M a x ( E ) the evolution stops.
NETWORK SETUP Each agent explores the other agents in the grid and opens links with the ones with lower potential. The matrix of links is thus non- symmetric.
2.
RRN INIZIALIZATION
RESISTANCE NETWORK the link between the nodes n , m is equipped with an elementary resistance : r e s n , m = r m a x D i s t n , m ,   where r m a x an asymptotally large resistivity value. Unlike the matrix of links, the matrix r e s n , m   is symmetric.
Finally, following a strategy formerly used in the description of the electric performances of biological matter [30,31,32] , a pair of ideal extended electrical contacts is attached to the ends of the network and ideally connected with a d.c. bias matter [30,31].
3.
COLONY EVOLUTION
LINK ACTIVATION Each link across the n , m nodes is activated with probability:
p n , m = min ( 1 , exp α 3   Δ E n , m ) ,         Δ E n , m = ε n ε m E n e r g y
The parameter α is the cooperativity coefficient and E n e r g y   (see Eq.2) measures the amount of sensing-charges present in the landscape. Only the activated links play a role in the production of public good production and offspring.
The specific expression of the probability of activation ,Eq.(3), accounts for different aspects, i.e.
  • the amount of energy distributed in the landscape, being larger for larger energy, thus producing an autocatalytic effect;
  • the difference of energy between the considered agents, being larger for smaller differences, thus allowing a better distribution of activated links among nodes similar in energy;
  • the productivity of the agent, which represents the canalization of resources, in offspring or public goods production, thus producing less active links for higher productivity .
PUBLIC GOODS PRODUCTION If a link has been activated then its resistance decreases according to the law:
r e s n , m = D i s t n , m r m a x 1 f ( n , m ) + r m i n f ( n , m ) ,
where r m i n   is the minimal value assigned to the resistivity and the interpolating functions   f ( n , m ) is taken to have a Hill-like shape [33,34]:
f n , m = w γ ( n , m ) K γ + w γ ( n , m ) ,
with w ( n , m ) the mean value of the sensing-charges of the nodes n , m . The Hill number γ coincides with the productivity coefficient for a single strain. For the case of two strains it is given by their mean value, <α>. Notice that in Eq.(5), γ is the colony cooperativity index which we related in [25] to the amount of bioluminescence produced by several mutants of Vibrio harvey. As a matter of facts, it represents the strength with which the agents present in the network cooperate in the formation of the public goods, to the extent of their sensing-charges. The parameter K = g Q m a x controls the steepness of the interpolation and hence the amount of sensing-charges necessary to reach the minimal resistance.
OFFSPRING PRODUCTION Each agent receives energy from other nodes with a higher potential. In particular, the sensing-charge value grows as
Q n Q n + f l o o r σ * l i n k s ( n ) N
where 1< σ < N is the assimilation rate, specific for the considered agent , and links(n) is the number of links activated and connected to the n-th node.
In this step, for each agent we consider migration/duplication transitions. An empty site is selected for reproduction. The choice is done by first sorting the neighbors in order of increasing potential. Then, the k-th node in the list is selected with probability [24,25]
p k = k 1 ! 9 k 1 1 k 9 ,     k = 1 ,   ,   8 .
This formula corresponds to choose the minimum potential node (k=1) with probability 1-1/9 and otherwise, with probability 1/9, choose the second (k=2) with probability 1-2/9 and so on. It is possible that none of the 8 nodes is chosen, although this happens with a very small probability 8!/9^8 = 0.00093.
If the parent agent has the minimum nonzero value Q=1, it will migrate to the target node that inherits Q=1 while the parent node is set to Q=0.
If instead the parent node has Q   2 , it gives half of its sensing-charge to the target node, thus implementing a binary-fission event [24,25]. Parent and offspring have the same assimilation rate and cooperative coefficient.
The final extinction of the colony happens due to greed or starvation, the former occurring when the agents have consumed all the available resources, the latter when the agents have not be able to obtain energy and die due to ageing.
The overall free parameters of our simulations are listed in the following Table 1 (in the third column we report the fixed values used in the presented simulations)

3. Results

Our analysis aims to detect the conditions under which cohabitation performs better than living alone, in particular looking at the fitness, i.e. the ability to spread in the landscape. Fitness is here measured by the ratio f = N f N i where, for each competitor, N f / i is the final/initial number of agents, and colony survival time is given in terms of iteration steps.
Simulations were performed on grids of size 20x20 and averaged over 30 repetitions of the stochastic evolution.
We considered two situations corresponding to a single strain or two-strain colonies.

3.1. Single-Strain Colonies (SSC): Investigation on the Conditions for Reproduction

Different strains with assimilation rate (σ) between 1 and 30 have been evolved using different productivity levels (α). For σ < 9, no-growing (NG) is the permanent condition of the strains (also exploring very small values of α, here not reported). They all die due to aging (dormant cells). On the other hand, at the high value σ=30 only the highest productivity level (α=10) produces NG and no death for ageing is observed as long as α is less than 5. On the other hand, the colony quickly consumes available nutrients and dies out. At intermediate values ​​of α, the probability of NG depends on α and σ (see Figure 1). Extinction due to both aging or resource exhaustion may occur. Figure 1 reports the % of realizations in which extinction is due to ageing instead of resource exhaustion. The initial concentration of agents is 10% of occupiable sites.

3.2. Two-Strain Colonies

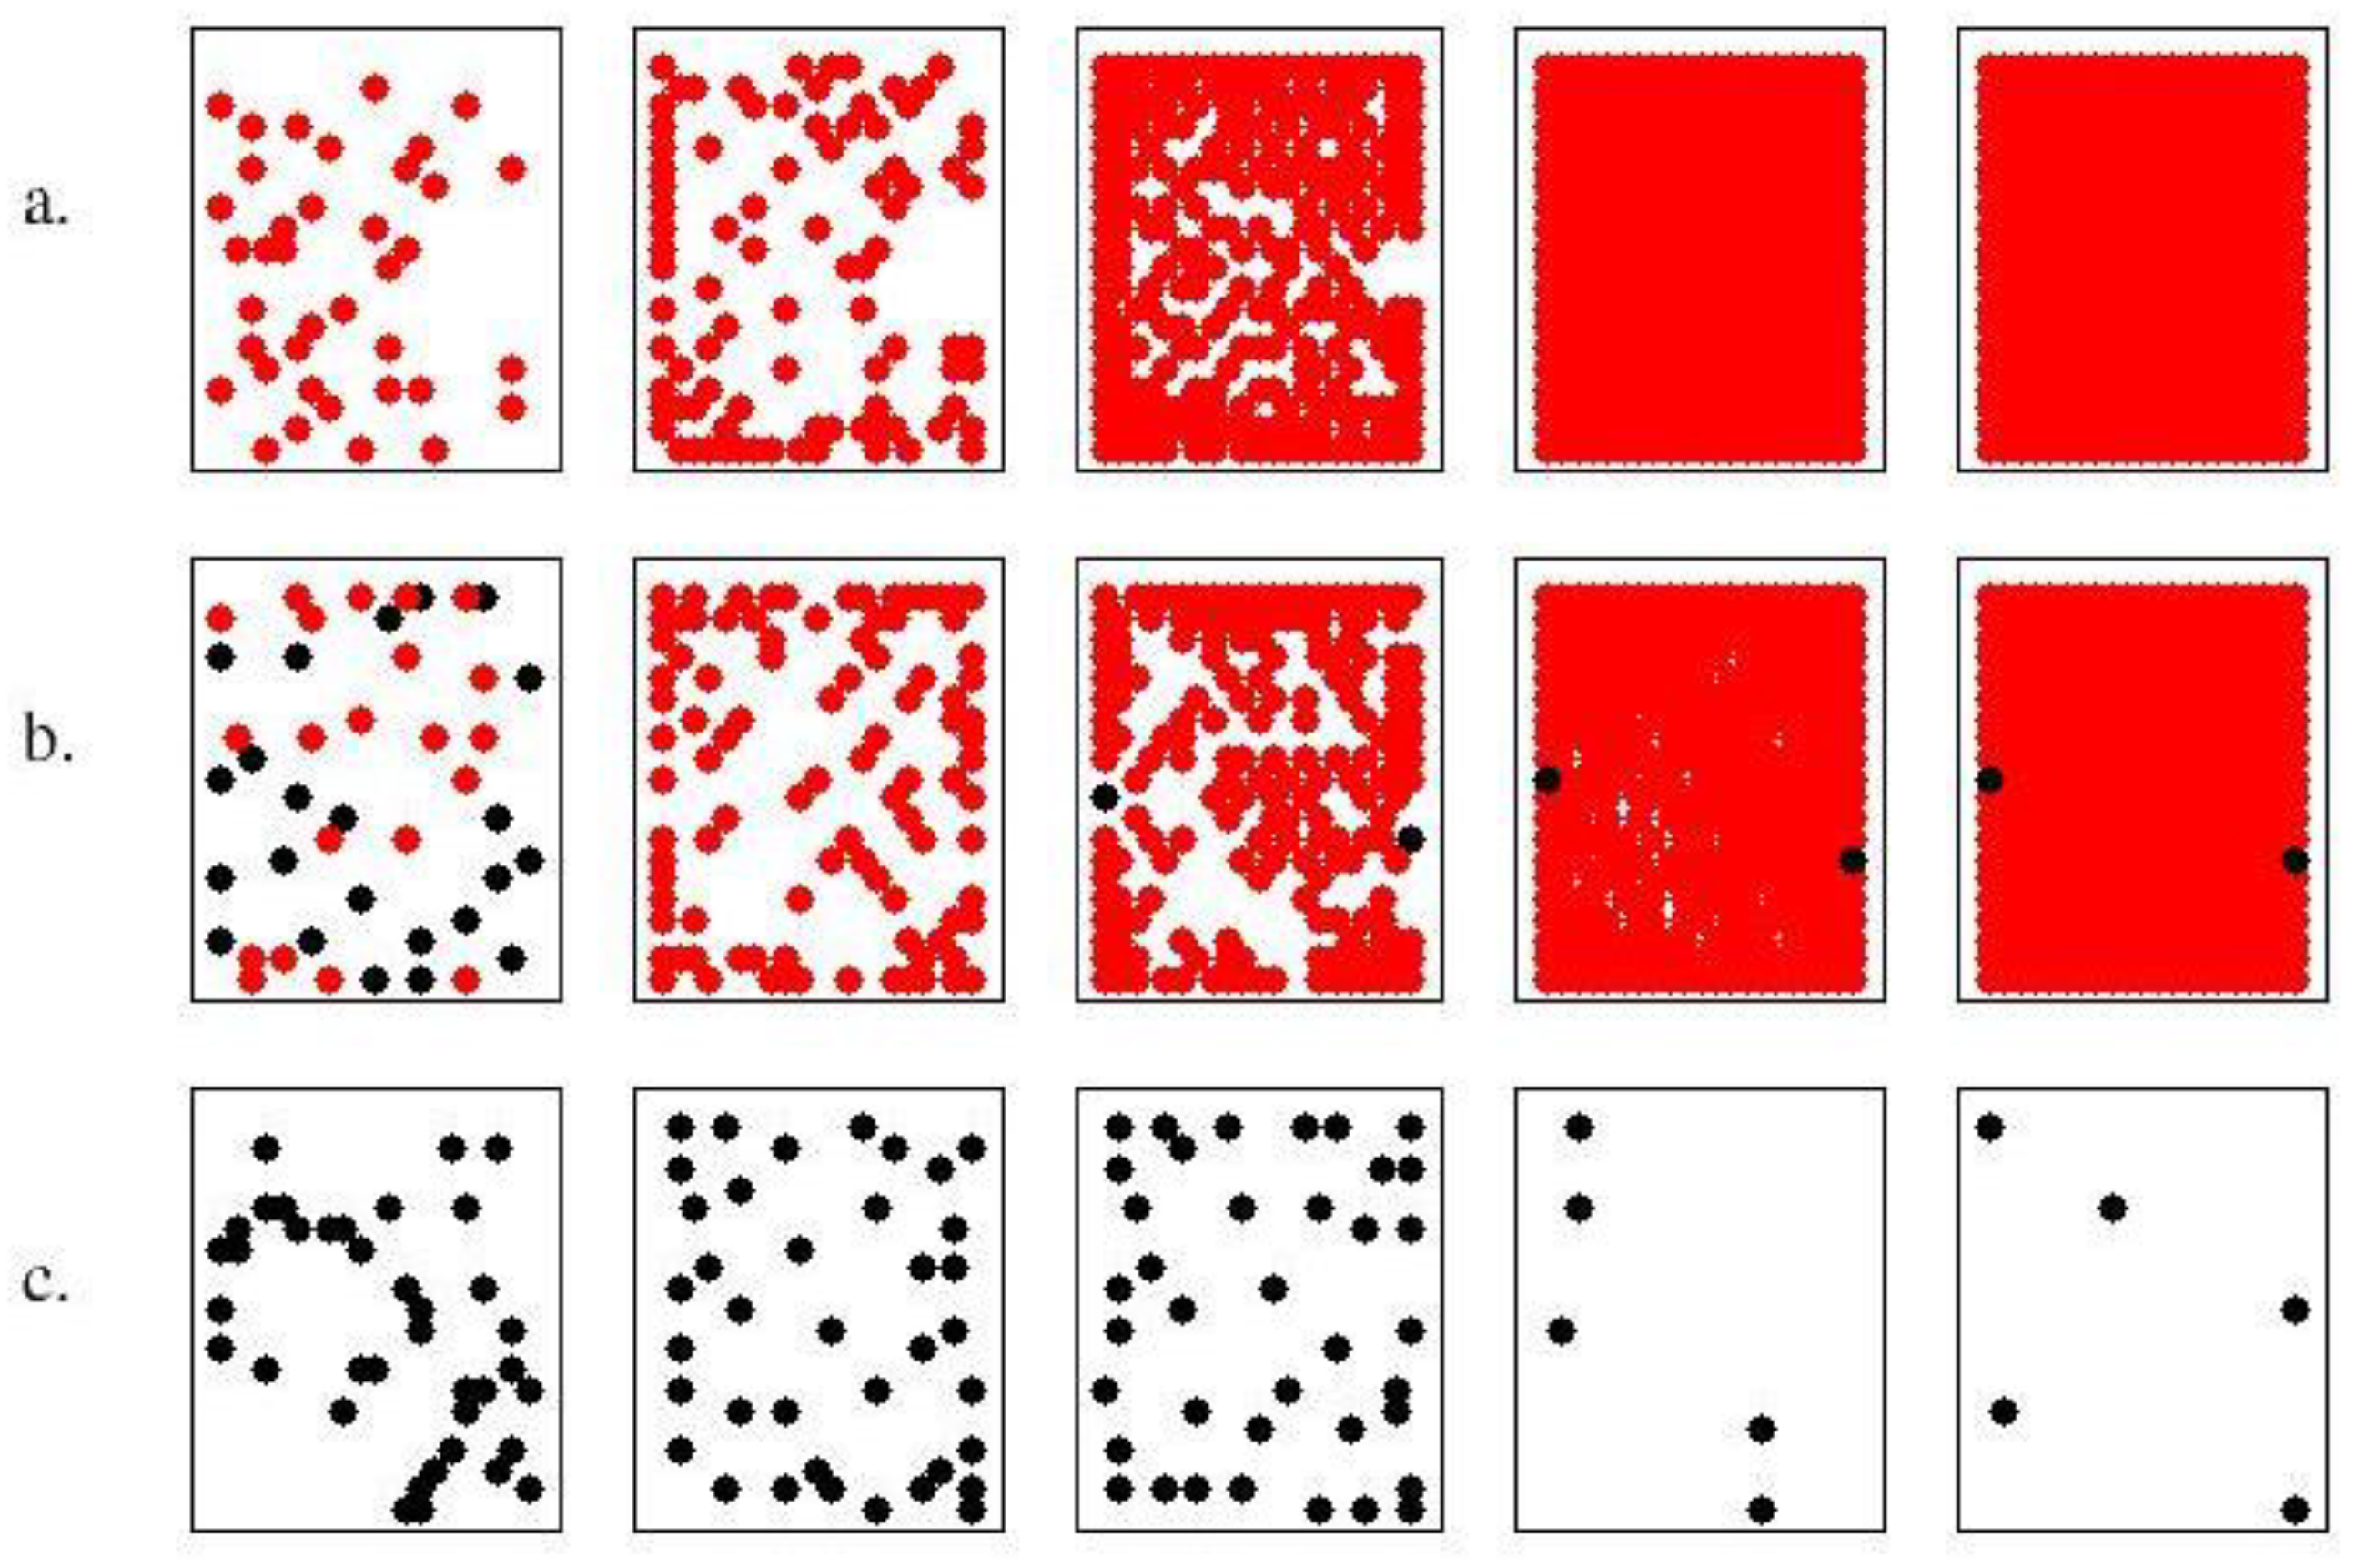
The first investigation concerns the comparison between a (strong) cooperator (σ=2, α1=10) and a cheater (σ=20, α2=0.1). The former has quite long life (20 time units) and dies due to aging, while the latter has short life (13 time units) and dies from nutrient depletion. The cooperator has a production of PG about 4 fold larger than that of the defeater, although quite small (0.3 a.u.). When they are mixed in equal percentages the resulting colony shows a survival time approximately as long as that of the cooperator (Figure 2 and Figure 3) and a huge PG production (Figure 4, γ=<α>=5.05). The dynamic of colony development is shown in Figure 2, for cheaters alone (a); cooperators alone (c) and the mixed combination (b) . Notice that, in the single state, cooperators do not reproduce and migrate until extinction. The extinction event is not reported in this figure.
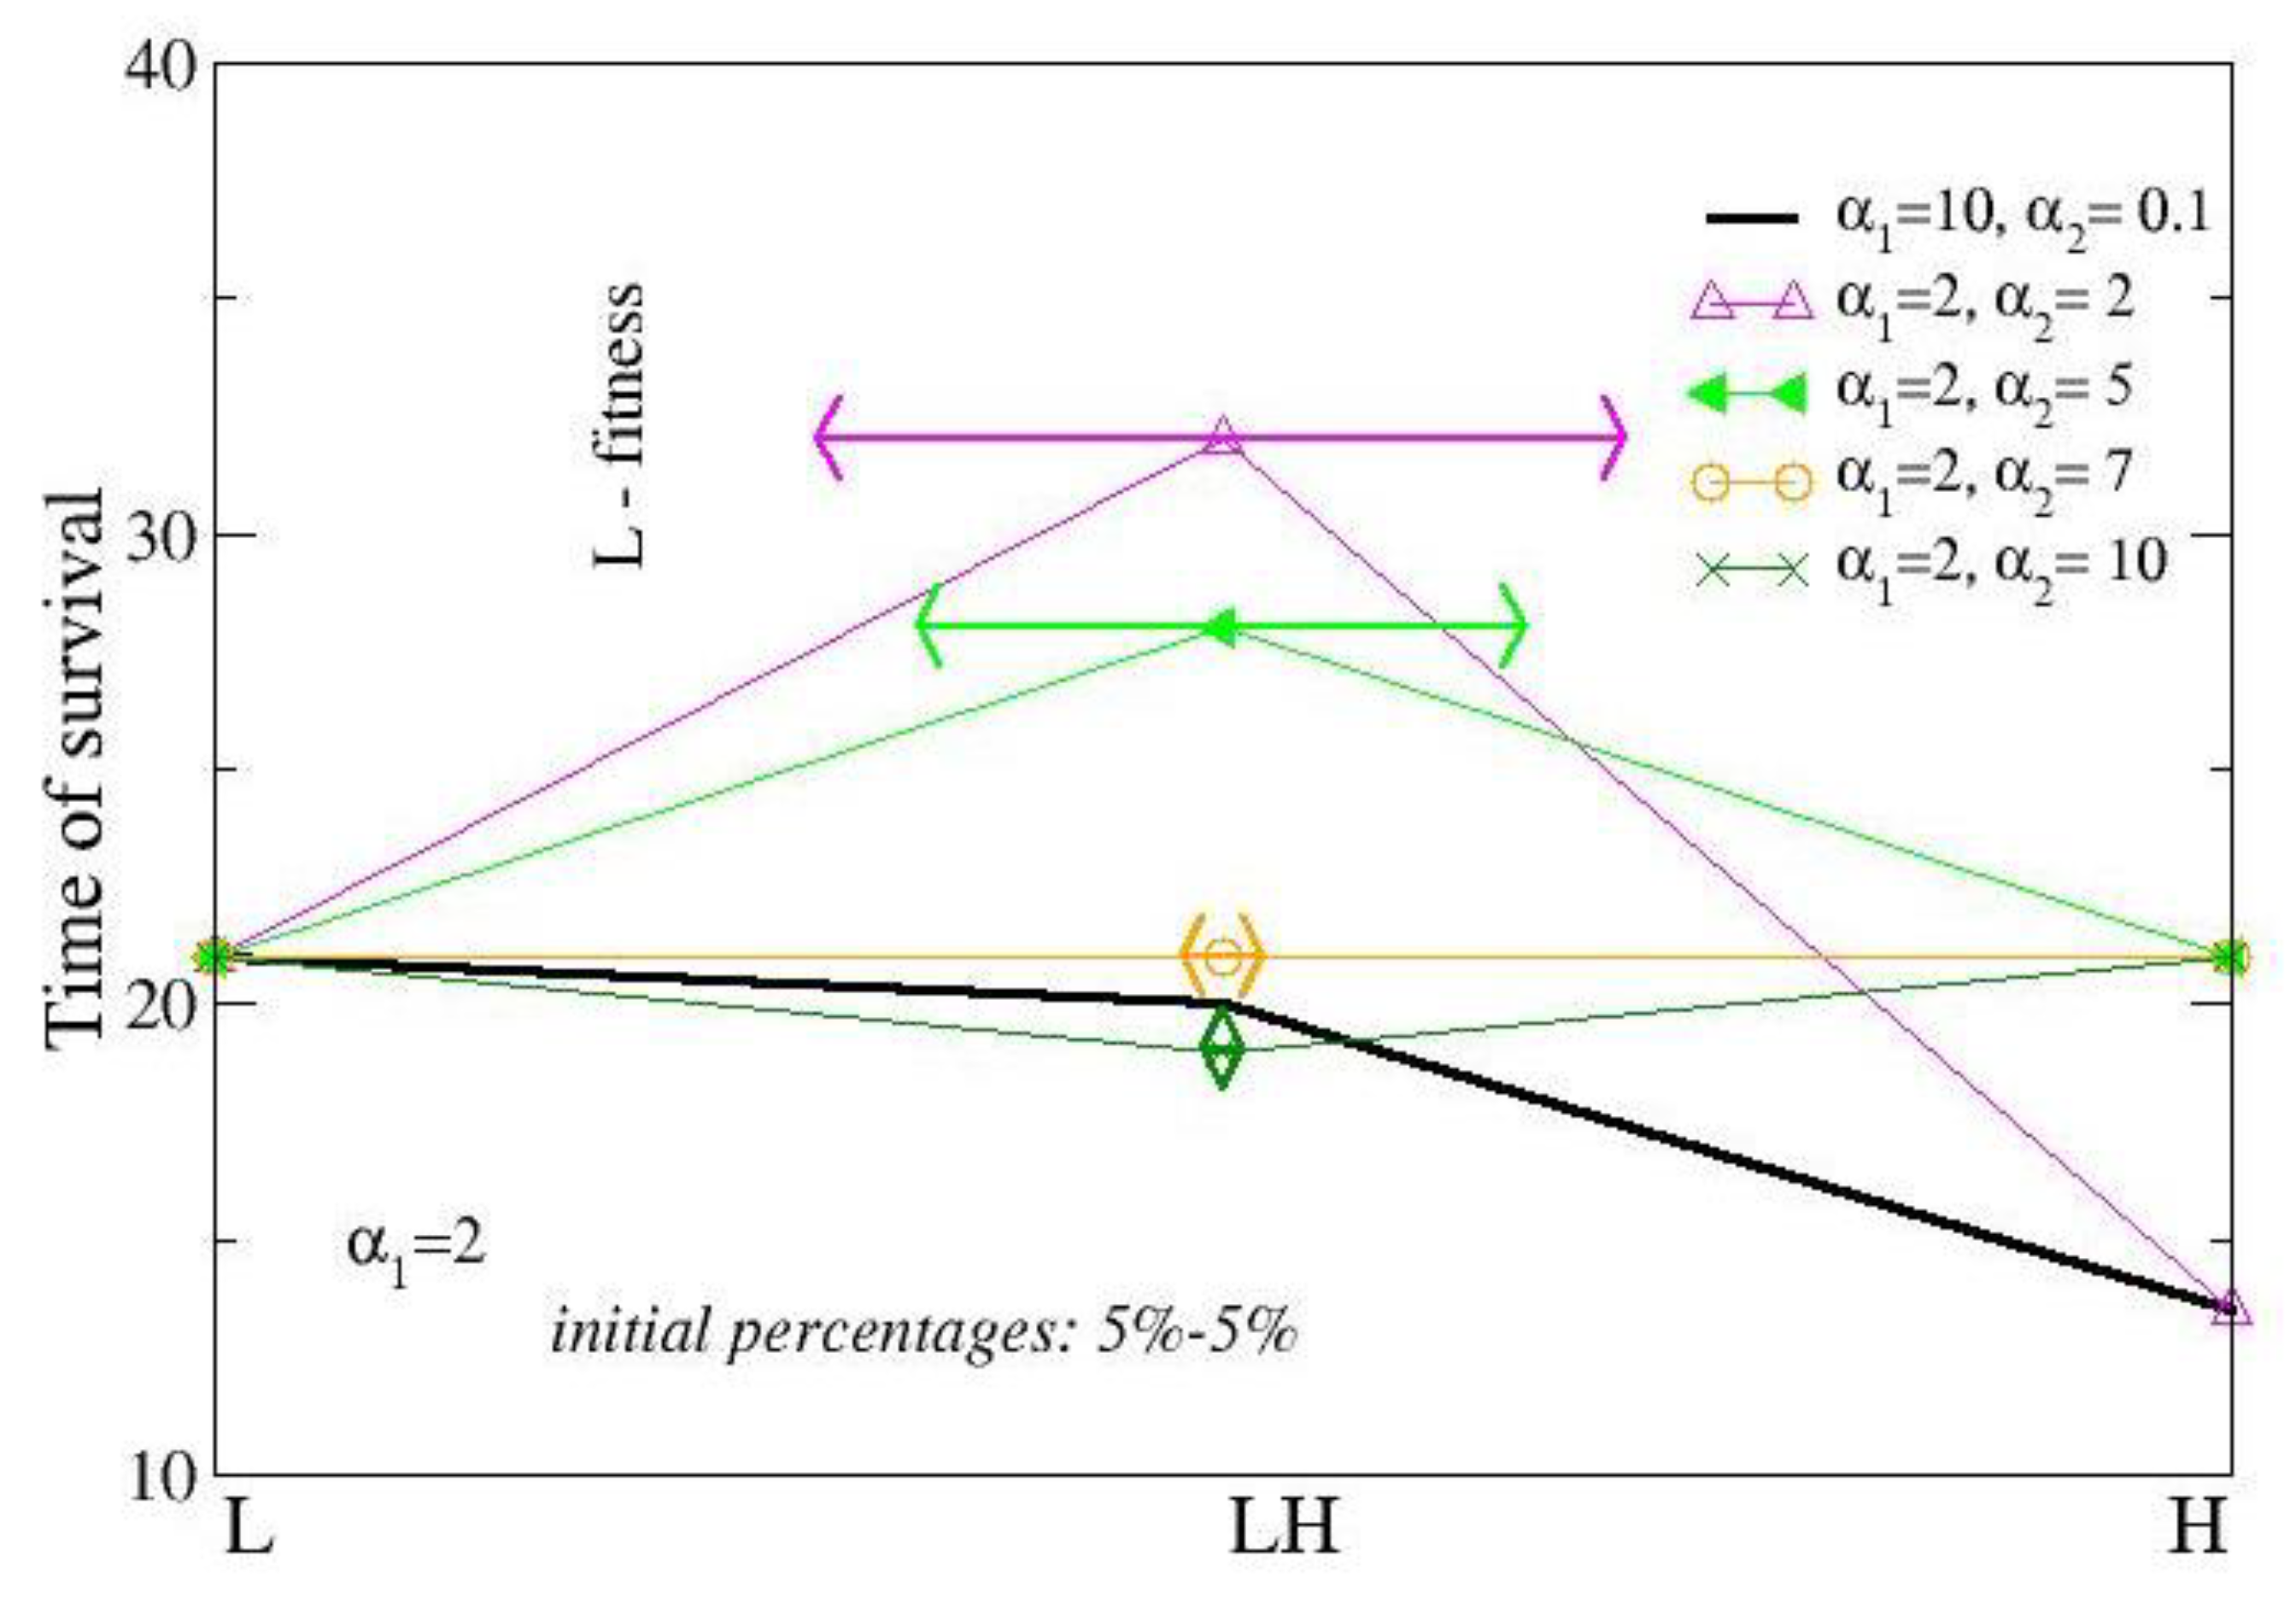
Finally, we have investigated the colony performance using a low-metabolism strain, non prolific at the lowest values of α, (a dormant strain), hereafter named L, and a high-metabolism strain, non prolific for α > 5 , hereafter named H. They were mixed at an equal initial concentration (5%), named Mix, and the performances were recorded in terms of survival time and fitness. The selected assimilation rates are σ=2, 20, respectively, and the cooperative level of the high-performing strain , α2, varies in the range [10-4-10]. These values of α2 describe social behaviors going from cheaters to defeater, while the productivity level of the low-performing strain, α1, is taken equal 2.
The lifetime of the L strain is determined only by the maximal aging time (τ) and be made as long as desired. Each iteration corresponds to a time step. The survival time of the H strain at low values of the productivity value is quite smaller than that of L strain because it rapidly multiplies consuming the available resources. The smaller the amount of available resources the smaller the lifetime. When productivity rate grows, the probability of becoming non prolific increases and lifetime tends to that of the L strain.
For α2 smaller than 5, the mixed state Mix guarantees a better outcome than the low- performing strain, which from sterile becomes low prolific (fitness larger than 1), and, furthermore, extends the survival times of both strains compared to single states. For a very high cooperative level (α2>5) both the high- and low-performing strains become even less and less prolific. Finally, first the landscape is invaded by the high-performing strain and later it too becomes extinct .
This behavior is due to the long-range interaction, i.e. to QS, that distributes the sensing-charges to the extent that they are present in the landscape and without distinguishing what they are produced by. Thus, the sterile strain receives many more sensing-charges than it would receive in a landscape populated only by sterile cells, and the fertile one receives fewer sensing-charges than it should receive in a landscape populated only by fertile cells. In this way, the sterile ones can reproduce and do not die from aging. Also, fertile cells do not consume resources too quickly. Fitness of sterile cells is greater than zero and the overall survival time is lengthened because the resources are consumed less quickly.
The survival time of mixed states with a1=2 and α2 varying from 10-4 to 2 about doubles the value of the H strain and the fitness of L is 1.6 and is quite insensitive of the value of α2 For larger values of α2 ,the fitness of L decreases until zero (at a2≥7). Only a small fraction of H does not die for ageing and the survival time of the mixed state Mix tends to the survival time of L. For higher values of α2, both L and H are nonprolific and the survival time of the mixed state is smaller than that of single state due to the smaller initial concentration.
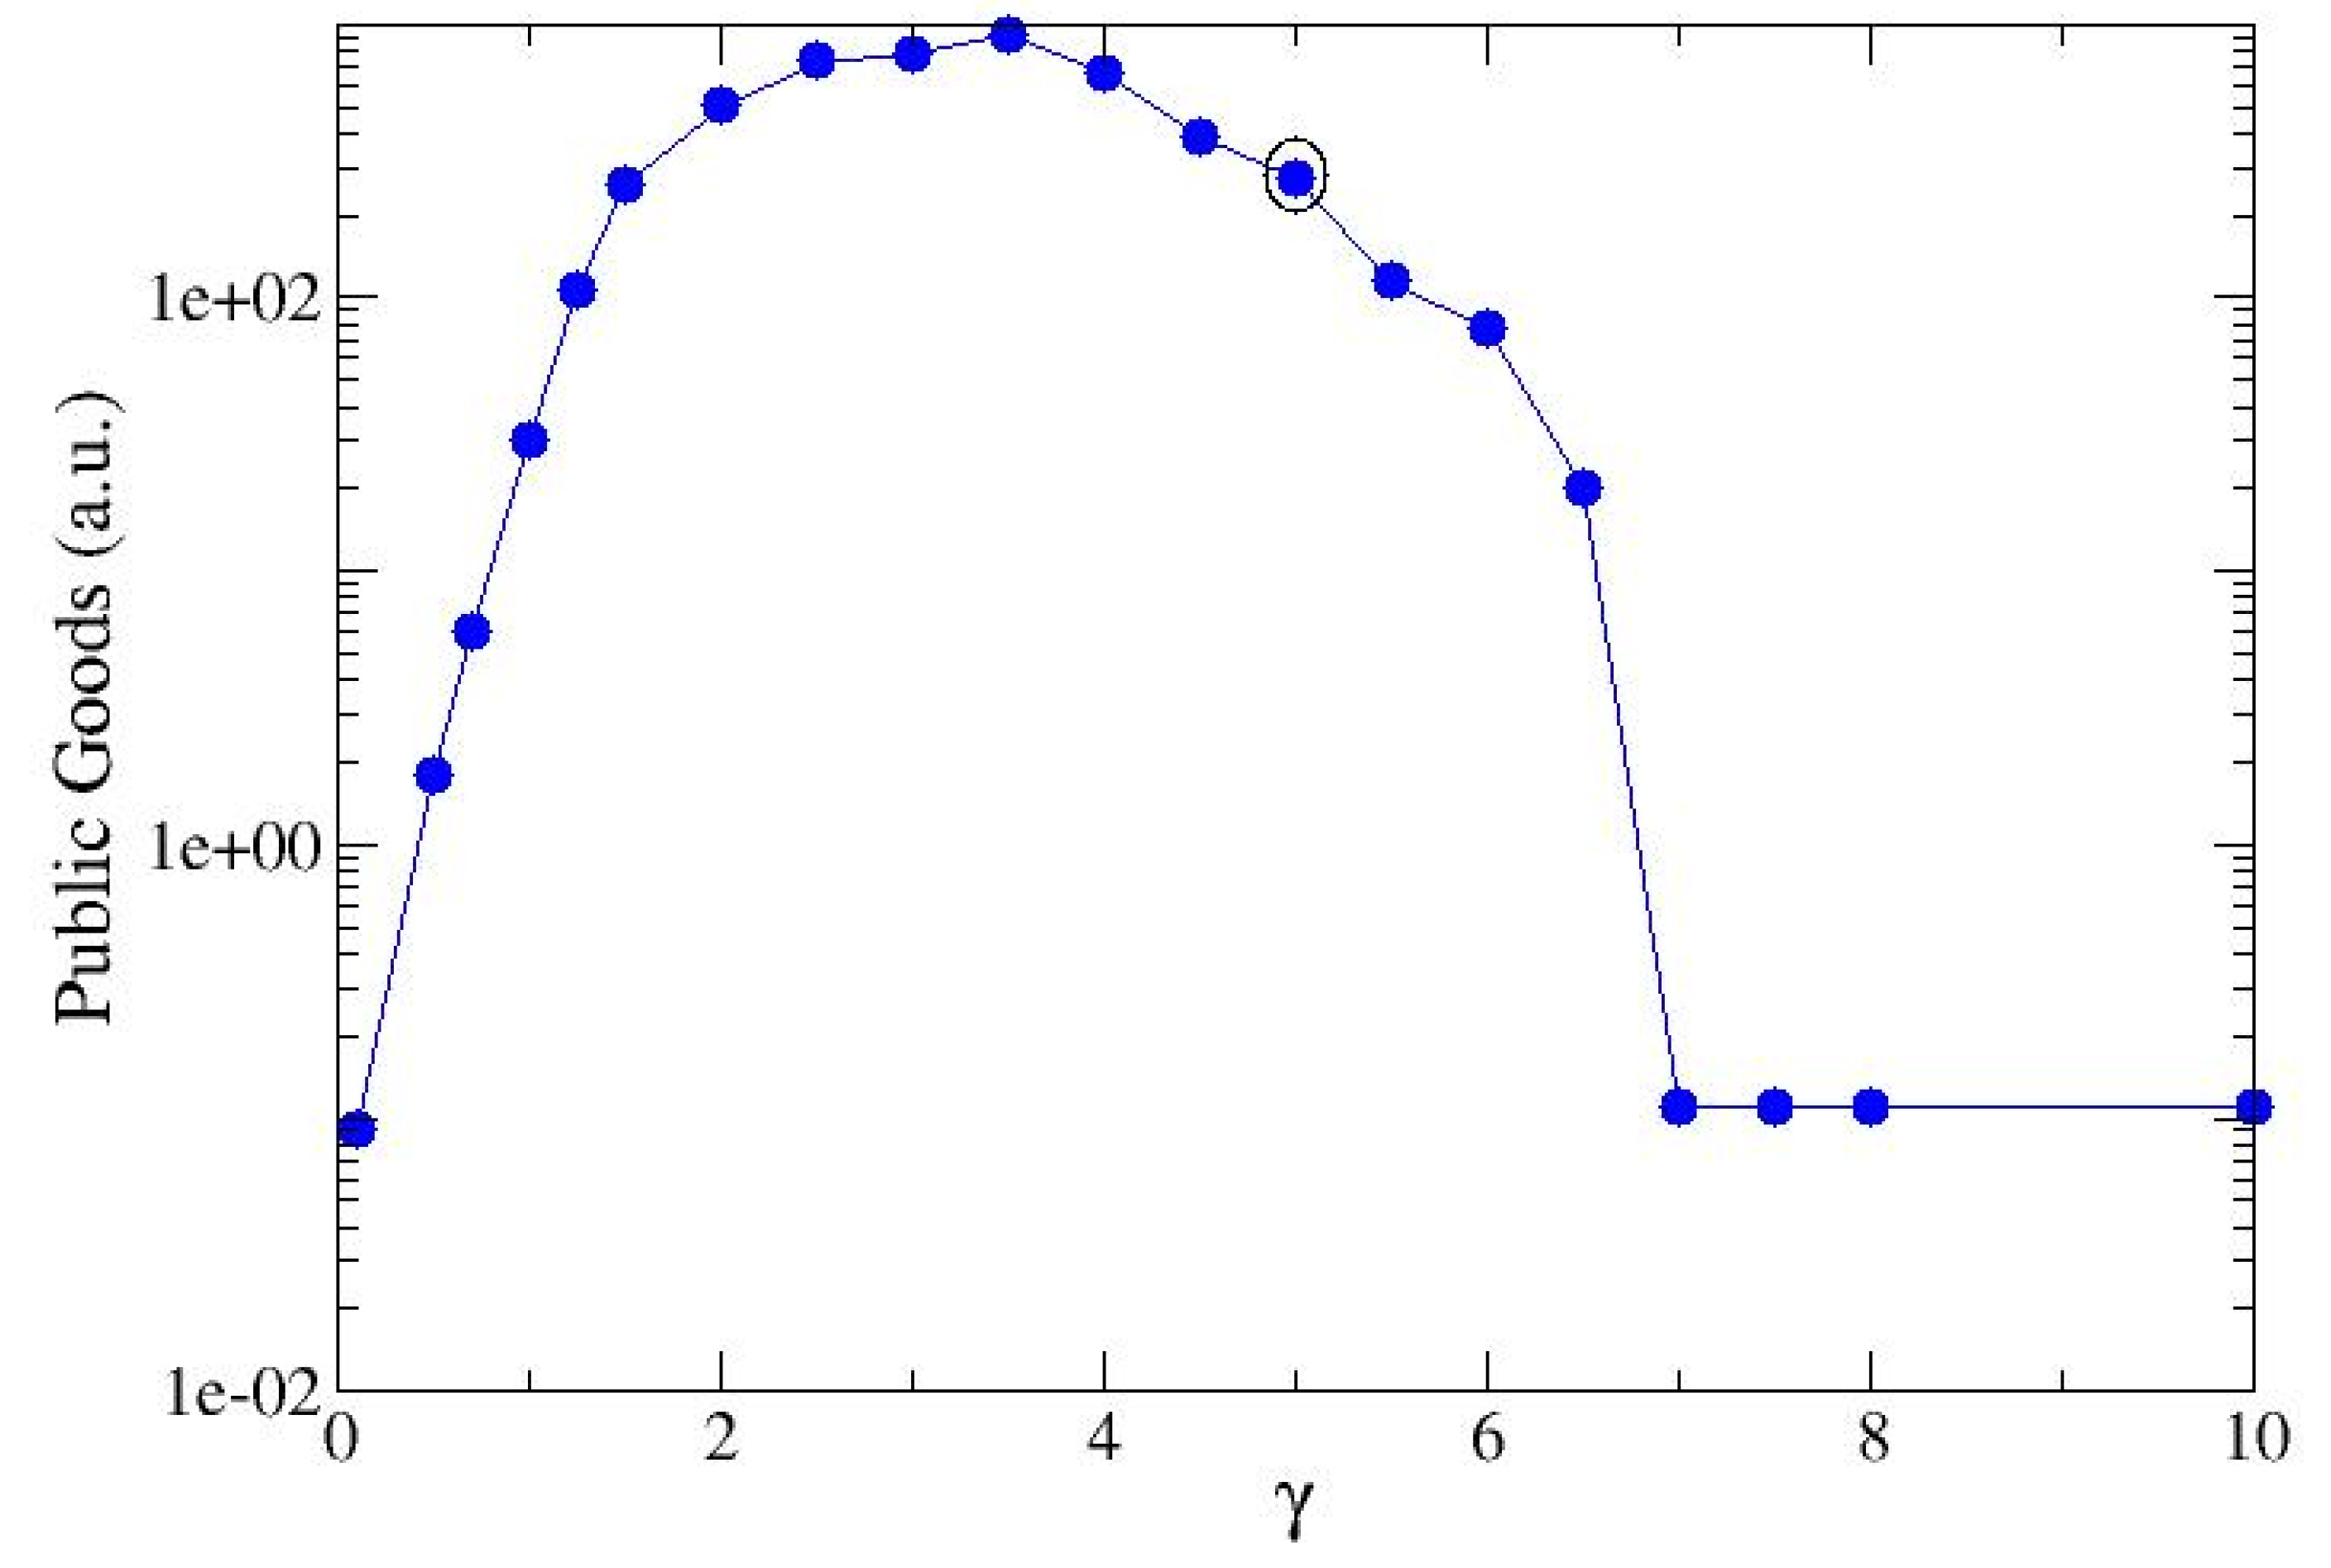
For the selected couple of strains (σ=2, 20), the production of public good depends on the value of the Hill number γ, here assumed equal to the mean of the productivity rates, <α> (see Equation 5) . It has an initial growth, followed by a decrease due to the reduced ability of the strains to reproduce (Figure 4) . In the present analysis the maximum has been reached for <α> close to 3.5. Larger values of <α> no more allow the strains to reciprocally sustain themselves and the most proficient strain invades the landscape. Furthermore, the minimal values are related to two different conditions: a. low cooperativity, i.e. small quantities of resources are directed towards the production of PG and, instead, used for offspring, b. high cooperativity, i.e. the maximum amount of resources is allocated to the production of PG, but the surviving agents are few and the final result is scarce production.
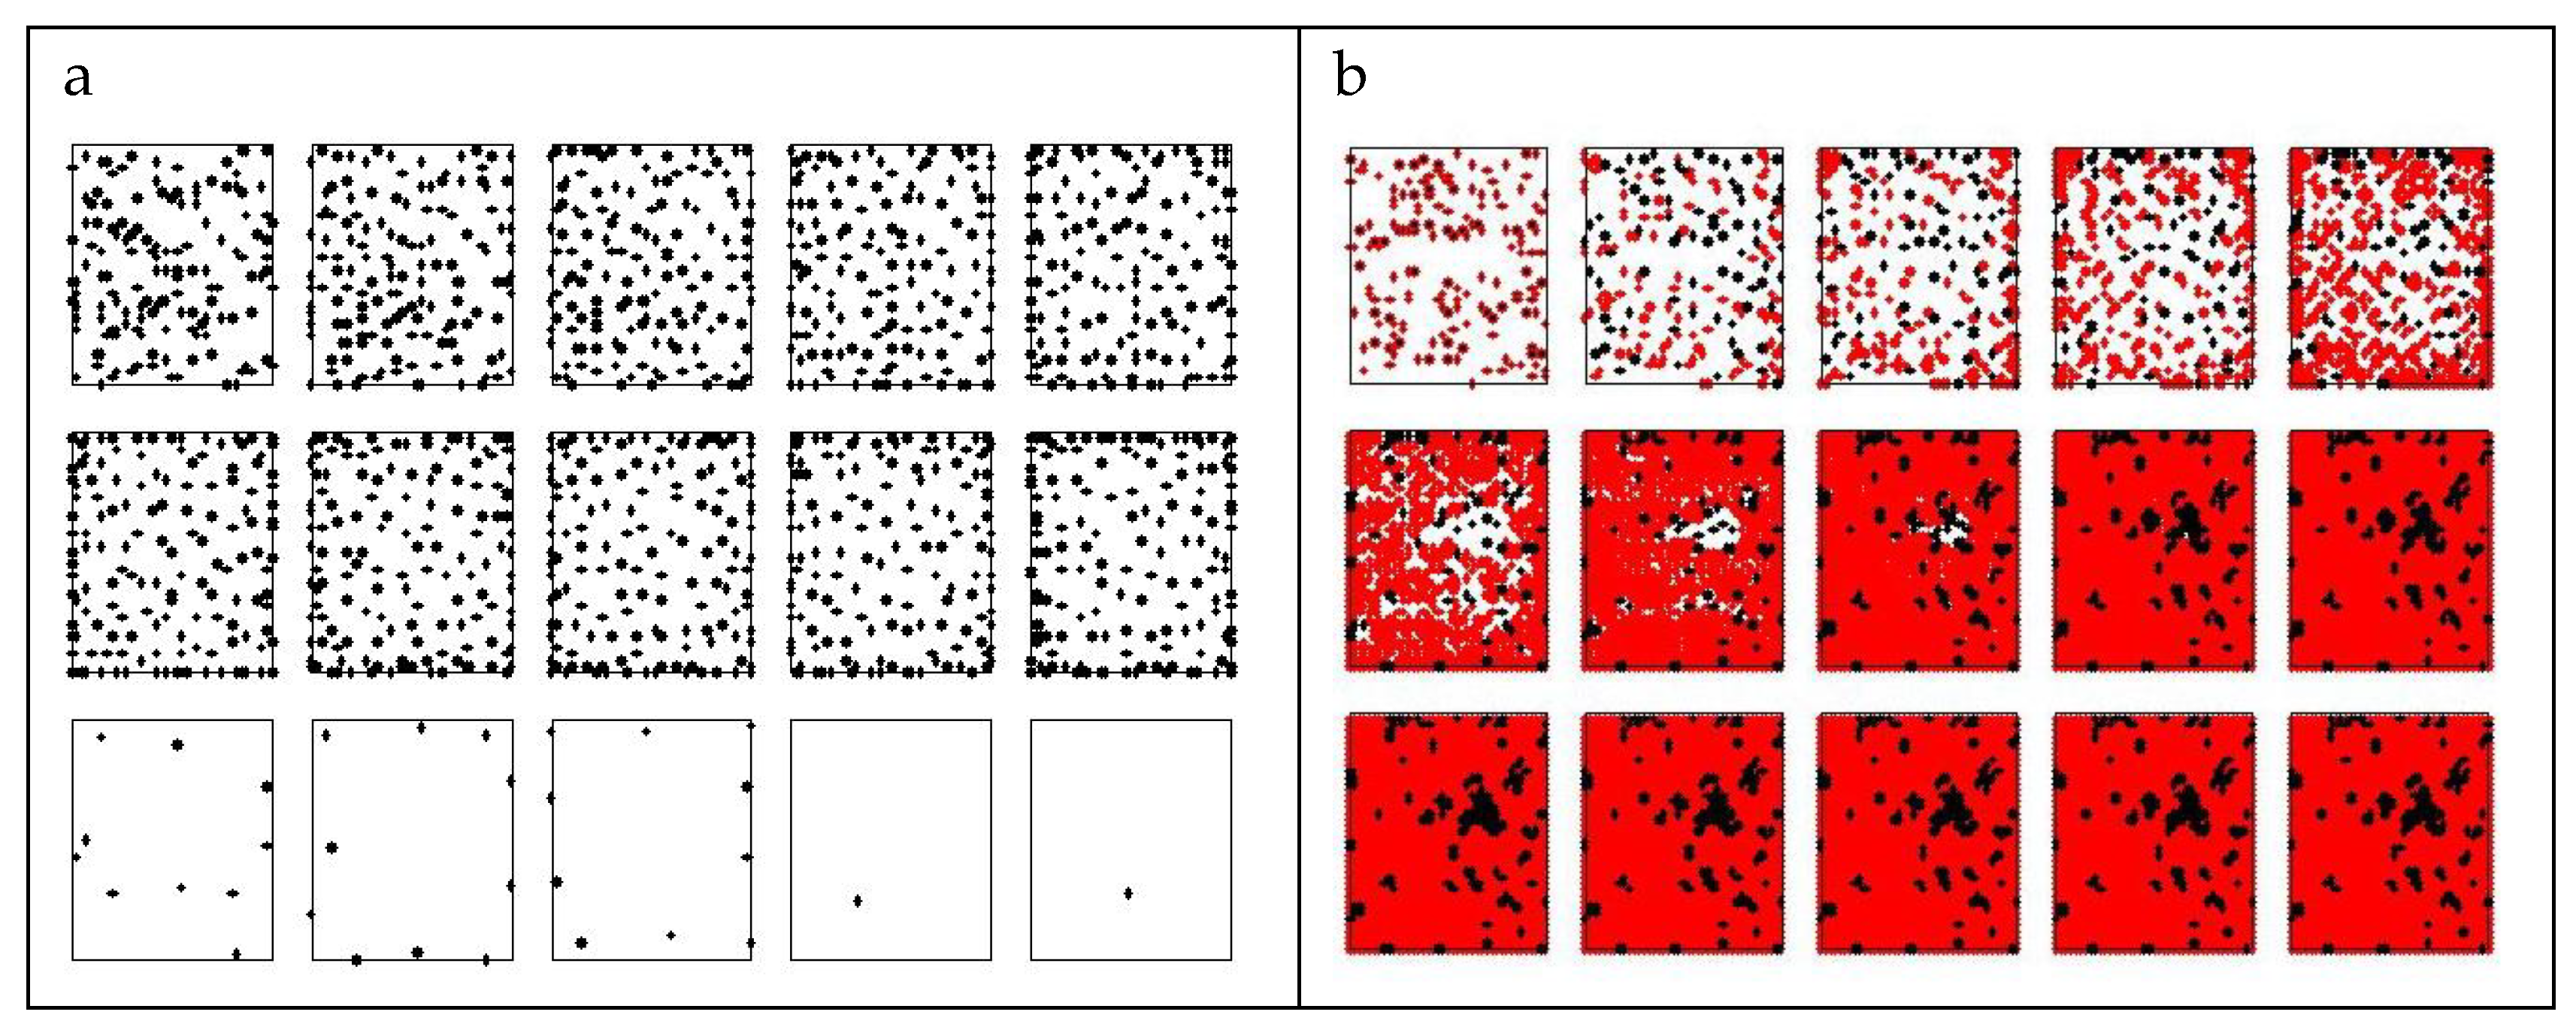
In Figure 5 we show the time evolution of a seed composed of : (a) 10% of a L strain (α1=2) and (b) 5%+5% of L and H strains. The red dots are for the H strain (α2= 10-4) and the black dots are for the L strain. We can observe that while the L strain dies out in a few (15) steps, it survives and reproduces in the mixed state, reaching a fitness value of 1.6. Survival time is doubled with respect the evolution of a the single strain.

4. Discussion

The relevance of quorum sensing (QS) in the regulation of biological activity of bacteria colonies is well known [9,10]. Many models are formulated to describe its effects, based on deterministic equations [35,36,37] as well as stochastic simulations [38,39,40,41] .On the other hand, the precise role of QS in other kinds of regulatory mechanisms, like those underlying the ecological competition, has been sketched although not clarified [11,12,13,14,15,17]
In previous studies, we proposed a model of QS described as a long-range interaction between bacteria represented as a collection of agents living on a regular grid and coupled by Coulomb-like interaction. The associated complex network is dynamical and self-generated. It grows as the number of agents increases and new connections are established among them. Following previous studies, the network growth is monitored by means of an ideal flux of current whose intensity corresponds to some kind of public goods (PG), specifically bioluminescence, produced by the colony [24,25].
In the present investigation, we are interested in a scenario of ecological competition (exploitative competition) between strains differing in the metabolism (assimilation rate) and productivity levels. The individual agents show a specific social behavior when single strain colonies (SSC) are considered. Remarkably, their social traits may change when several strains are simultaneously present and are in mutual metabolic competition.
This may be regarded as an instance of exploitative competition among species, i.e. a competition without direct interference, but instead indirectly triggered due to mutual subtraction of nutrients [11,21].
In our analysis, we focused on a colony made of two competitors comparing the performance of the mixed system with that of SSC. As we mentioned above, the two strains are characterized by different metabolic rates and we examined the dependence on the productivity rate of the strain with higher metabolism (H). The considered productivity levels correspond to social behavior interpolating from single specie colony SSC-cheater to SSC-defeater. Instead, the specie with lower metabolism (L) is classified as an SSC-dormant and remains unchanged throughout the analysis.
Cooperation is here meant as the overall propensity of the colony to produce public goods. Each strain has a specific ability in producing these benefits and this may be modified in the presence of a second different strain. When this brings an advantage to the colony, we have cooperation, otherwise, we have anti-cooperation. The cooperative character of agents is quantified in terms of a cooperative index, γ= <α> (Equation 5) calculated as the mean value of the productivities of the two single strains. The amount of produced PG grows with γ in the region of cooperation and decrease with γ in the region of anti-cooperation (Figure 4). In the colony evolution, both the present (competing) strains attain γ as the productivity index. In this sense, quorum sensing acts as a mediator between different kinds of competitors.
As long as H has a productivity index low enough to be classified as an SSC-cheater, the cooperativity index is also low. In this situation, L becomes able to compete with H because it may exploit the greater available amount quantity of local resources (compared to that produced by itself). On the other hand, it also happens that H slows down its development due to the reduced amount of local resources (compared to the SSC case). As a consequence, the coexistence of both species leads (with different fitness) to a colony survival time larger than that of a single strain and the amount of produced PG is high, showing cooperation.
A completely different scenario is observed when the strain H has a high productivity value larger than 5. In this case, the H specie changes its social trait from SSC-cheater to SSC-defeater. This happens because in the development of a SSC the amount of offspring produced is low and therefore the amount of PG is also small. On the other hand, since the common (averaged) value of cooperation increases, the L specie becomes incapable of reproducing. Therefore, H completely outperforms L and both the quantity of PG and colony survival time decrease. In this case there is anti-cooperation. By further increasing the productivity of the SSC-defeater H, it also becomes incapable of reproducing and the produced PG goes to zero. The survival time is the characteristic one of the SSD-dormant. This kind of outcome resemble the so-called “tragedy of commons”, described in [15] as an effect of an increased cost of cooperation in a mixed colony .
From the above discussion, it emerges the key role of our choice of representing the interaction between coexisting strains assuming a common cooperative index equal to the mean value of the productivity levels of the single strains. This feature attempts to implement in a simple way the observation that quorum sensing operates mediating the features of the concurring strains [12,13,14,21]. The advantages for the colony in terms of fitness, survival time, and total PG production are a consequence of this choice. Such improved behaviors are detectable also in the case of equal values of productivity, in strains with different assimilation rates.
In conclusion, we showed that a QS mechanism described by a long-range interaction between bacterial cells is able to regulate cell growth and to stabilize cooperation between strains with different social behaviors. In particular, we analyzed the interaction between a strain of non-growing cells (dormant) and high-growing cells with variable productivity levels. We observed that they can profitably coexist until the high metabolism specie is not required to produce too many PG . The cooperation mechanism works in scenarios where the sub-population of slowly growing dormant cells sustains the fast growing cells and has a key role in the persistence of the latter. This could help explaining the resurgence of some infections when treated with antibiotics that do not attack dormant cells [23].

Author Contributions

All authors contributed equally to this research. All authors have read and agreed to the published version of the manuscript.

Funding

This research received no external funding.

Data Availability Statement

Data and code will be made available on reasonable request .

Conflicts of Interest

The authors declare no conflicts of interest.

References

  1. Tang, K.; Zang, X.-H. Quorum quenching agents: resources for antivirulence therapy. Mar. Drugs, 2014, 12.6: 3245-3282.
  2. Appelbaum, P. C. 2012 and beyond: potential for the start of a second pre-antibiotic era?. J. Antimicrob. Chemothera., 2012, 67.9: 2062-2068. [CrossRef]
  3. Nguyen,T. H.; Goycoolea, F. M. Chitosan/Cyclodextrin/TPP nanoparticles loaded with quercetin as novel bacterial quorum sensing inhibitors. Molecules, 2017, 22(11), 1975.
  4. Nguyen, H. T.; Hensel, A.; Goycoolea, F. M. Chitosan/cyclodextrin surface-adsorbed naringenin-loaded nanocapsules enhance bacterial quorum quenching and anti-biofilm activities. Colloids Surf. B Biointerfaces, 2022, 211, 112281. [Google Scholar] [CrossRef] [PubMed]
  5. Alfinito, E.; Barra, A.; Beccaria, M., Fachechi, A.; Macorini, G. An evolutionary game model for behavioral gambit of loyalists: Global awareness and risk-aversion. Europhys. Lett., 2018, 121.3: 38001. [CrossRef]
  6. Smith, J. M. The theory of games and the evolution of animal conflicts. J. Theor. Biol. 1974, 47(1), 209–221. [Google Scholar] [CrossRef] [PubMed]
  7. Weibull, J. W. Evolutionary game theory. MIT press: Cambridge, Massachusetts, USA, 1997.
  8. Parsek, M. R.; Greenberg, E. P. (2005). Sociomicrobiology: the connections between quorum sensing and biofilms. Trends Microbiol,2005,13(1), 27-33. [CrossRef]
  9. Henke, J. M.; Bassler, B.L. Three parallel quorum-sensing systems regulate gene expression in Vibrio harveyi,J. Bacteriol.,2004,186 (20), 6902-6914. [CrossRef]
  10. Miller, M. B.; Bassler, B. L. Quorum sensing in bacteria. Annu. Rev. Microbiol. 2001, 55(1), 165–199. [Google Scholar] [CrossRef] [PubMed]
  11. Cornforth, D. M; Foster, K. R. Competition sensing: the social side of bacterial stress responses. Nat. Rev. Microbiol., 2013, 11(4), 285–293. [Google Scholar] [CrossRef] [PubMed]
  12. Bruger, E. L.; Snyder, D. J.; Cooper, V. S.; Waters, C. M. Quorum sensing provides a molecular mechanism for evolution to tune and maintain investment in cooperation. The ISME Journal, 2021, 15(4), 1236–1247. [Google Scholar] [CrossRef] [PubMed]
  13. Bruger, E. L.; Waters, C. M. Maximizing growth yield and dispersal via quorum sensing promotes cooperation in Vibrio bacteria. Appl. Environ. Microbiol. , 2018, 84(14), e00402-18. [CrossRef]
  14. Bruger, E. L.; Waters, C. M. Bacterial quorum sensing stabilizes cooperation by optimizing growth strategies. Appl. Environ. Microbiol. 2016; 82.22, 6498–6506. [Google Scholar] [CrossRef]
  15. Dandekar, A. A.; Chugani, S.; Greenberg, E. P. Bacterial quorum sensing and metabolic incentives to cooperate. Science, 2012, 338(6104), 264-266. [CrossRef]
  16. Hibbing, M. E.; Fuqua, C.; Parsek, M. R.; Peterson, S. B. Bacterial competition: surviving and thriving in the microbial jungle. Nat. Rev. Microbiol., 2010 , 8(1), 15-25. [CrossRef]
  17. Wang, Y.; Rattray, J. B.; Thomas, S. A.; Gurney, J.; Brown, S. P. (2020). In silico bacteria evolve robust cooperation via complex quorum-sensing strategies. Scientific reports, 2020, 10(1), 8628. [CrossRef]
  18. Foster, K. R.; Wenseleers, T. A general model for the evolution of mutualisms. Journal of evolutionary biology, 2006, 19(4), 1283-1293. [CrossRef]
  19. Stone, L. The stability of mutualism. Nature communications, 2020, 11(1), 2648. [CrossRef]
  20. Zhang, Z.; Yan, C.; Zhang, H. Mutualism between antagonists: its ecological and evolutionary implications. Integrative Zoology, 2021, 16(1), 84–96. [Google Scholar] [CrossRef] [PubMed]
  21. Watkins, E. R.; Maiden, M. C.; Gupta, S. (2016). Metabolic competition as a driver of bacterial population structure. Future Microbiol., 2016, 11(10), 1339-1357. [CrossRef]
  22. Rosenzweig, M. L. Paradox of enrichment: destabilization of exploitation ecosystems in ecological time. Science, 1971, 171(3969), 385-387. [CrossRef]
  23. Lempp, M.; Lubrano, P.; Bange, G.; Link, H. Metabolism of non-growing bacteria. Biol. Chem., 2020, 401(12), 1479-1485. [CrossRef]
  24. Alfinito, E.; Cesaria, M.; Beccaria, M. Did Maxwell dream of electrical bacteria?. Biophysica, 2022, 2(3), 281-291. [CrossRef]
  25. Alfinito, E.; Beccaria, M.; Cesaria, M. Cooperation in bioluminescence: understanding the role of autoinducers by a stochastic random resistor model. EPJ E, 2023,46(10), 94. [CrossRef]
  26. Miller, J.; Parker, M.; Bourret, R. B.; Giddings, M. C. An agent-based model of signal transduction in bacterial chemotaxis. PloS one, 2010, 5(5), e9454. [CrossRef] [PubMed]
  27. Wang, Y.; Rattray, J. B.; Thomas, S. A.; Gurney, J.; Brown, S. P. (2020). In silico bacteria evolve robust cooperation via complex quorum-sensing strategies. Scientific Rep., 2020, 10(1), 8628. [CrossRef]
  28. Leaman, E. J.; Geuther, B. Q.; Behkam, B. Hybrid centralized/decentralized control of a network of bacteria-based bio-hybrid microrobots. J. Micro-Bio Robot., 2019, 15, 1-12. [CrossRef]
  29. Stauffer, D. ; Aharony,A. Introduction to percolation theory, 2rd ed.; CRC Press: Boca-Raton, 2018. [Google Scholar]
  30. Alfinito, E.; Reggiani, L.; Pousset, J. Proteotronics: Electronic devices based on proteins. In Sensors: Proceedings of the Second National Conference on Sensors, Rome 19-21 February, 2014 (pp. 3-7). Cham: Springer International Publishing.
  31. Cataldo, R., Leuzzi, M.; Alfinito, E. Modelling and development of electrical aptasensors: a short review. Chemosensors ,2018, 6(2), 20.
  32. Alfinito, E.; Beccaria, M.; Fachechi, A.; Macorini, G. Reactive immunization on complex networks. Europhys. Lett., 2017 , 117(1), 18002. [CrossRef]
  33. Hill,V. A new mathematical treatment of changes of ionic concentration in muscle and nerve under the action of electric currents, with a theory as to their mode of excitation, J. Physiol.1910, 40 (3), 190-224.
  34. Goutelle, S.; Maurin, M.; Rougier,F.; Barbaut,X.; Bourguignon,L.; Ducher, M; P. Maire,P. The Hill equation: a review of its capabilities in pharmacological modelling, Fundam. Clin. Pharmacol., 2008, 22(6), 633-648 (2008). [CrossRef]
  35. Dockery, J. D.; Keener, J. P. Mathematical model for quorum sensing in Pseudomonas Aeruginosa, Bull. Math. Biol., 2001, 63 (1), 95-116. [CrossRef]
  36. Ward, J. P. ; King, J. R.; Koerber, A. J. ; Williams, P.; Croft, J. M.; Sockett, R. E. Mathematical modelling of quorum sensing in bacteria, IMA J. Math. Med. Biol., 2001, 18(3), 263-292. [CrossRef]
  37. Frederick, M. R.; Kuttler, C. ; Hense ,B. A.; Eberl, H. J. , A mathematical model of quorum sensing regulated EPS production in biofilm communities, Theor. Biol. Medical Model. 2011, 8, 1-29. [CrossRef]
  38. Goryachev, A. B. Understanding Bacterial Cell-Cell Communication with Computational Modeling, Chem. Rev. , 2011, 111(1), 238-250 (2011). [CrossRef]
  39. Sinclair, P.; C. A. Brackley, C.A.; Carballo-Pacheco, M.; Allen, R. J. Model for quorum-sensing mediated stochastic biofilm nucleation, Phys. Rev. Lett, 2022, 129(19),198102.
  40. E. Ben-Jacob, O. Schochet, A. Tenenbaum, I. Cohen, A. Czirok and T. Vicsek, Generic modelling of cooperative growth patterns in bacterial colonies, Nature 368(6466), 1994, 46-49. [CrossRef]
  41. J. Pérez-Velázquez, J.; Gölgeli, M.; García-Contreras,R. Mathematical modelling of bacterial quorum sensing: a review, Bull. Math. Biol. 2016, 78, 1585-1639.
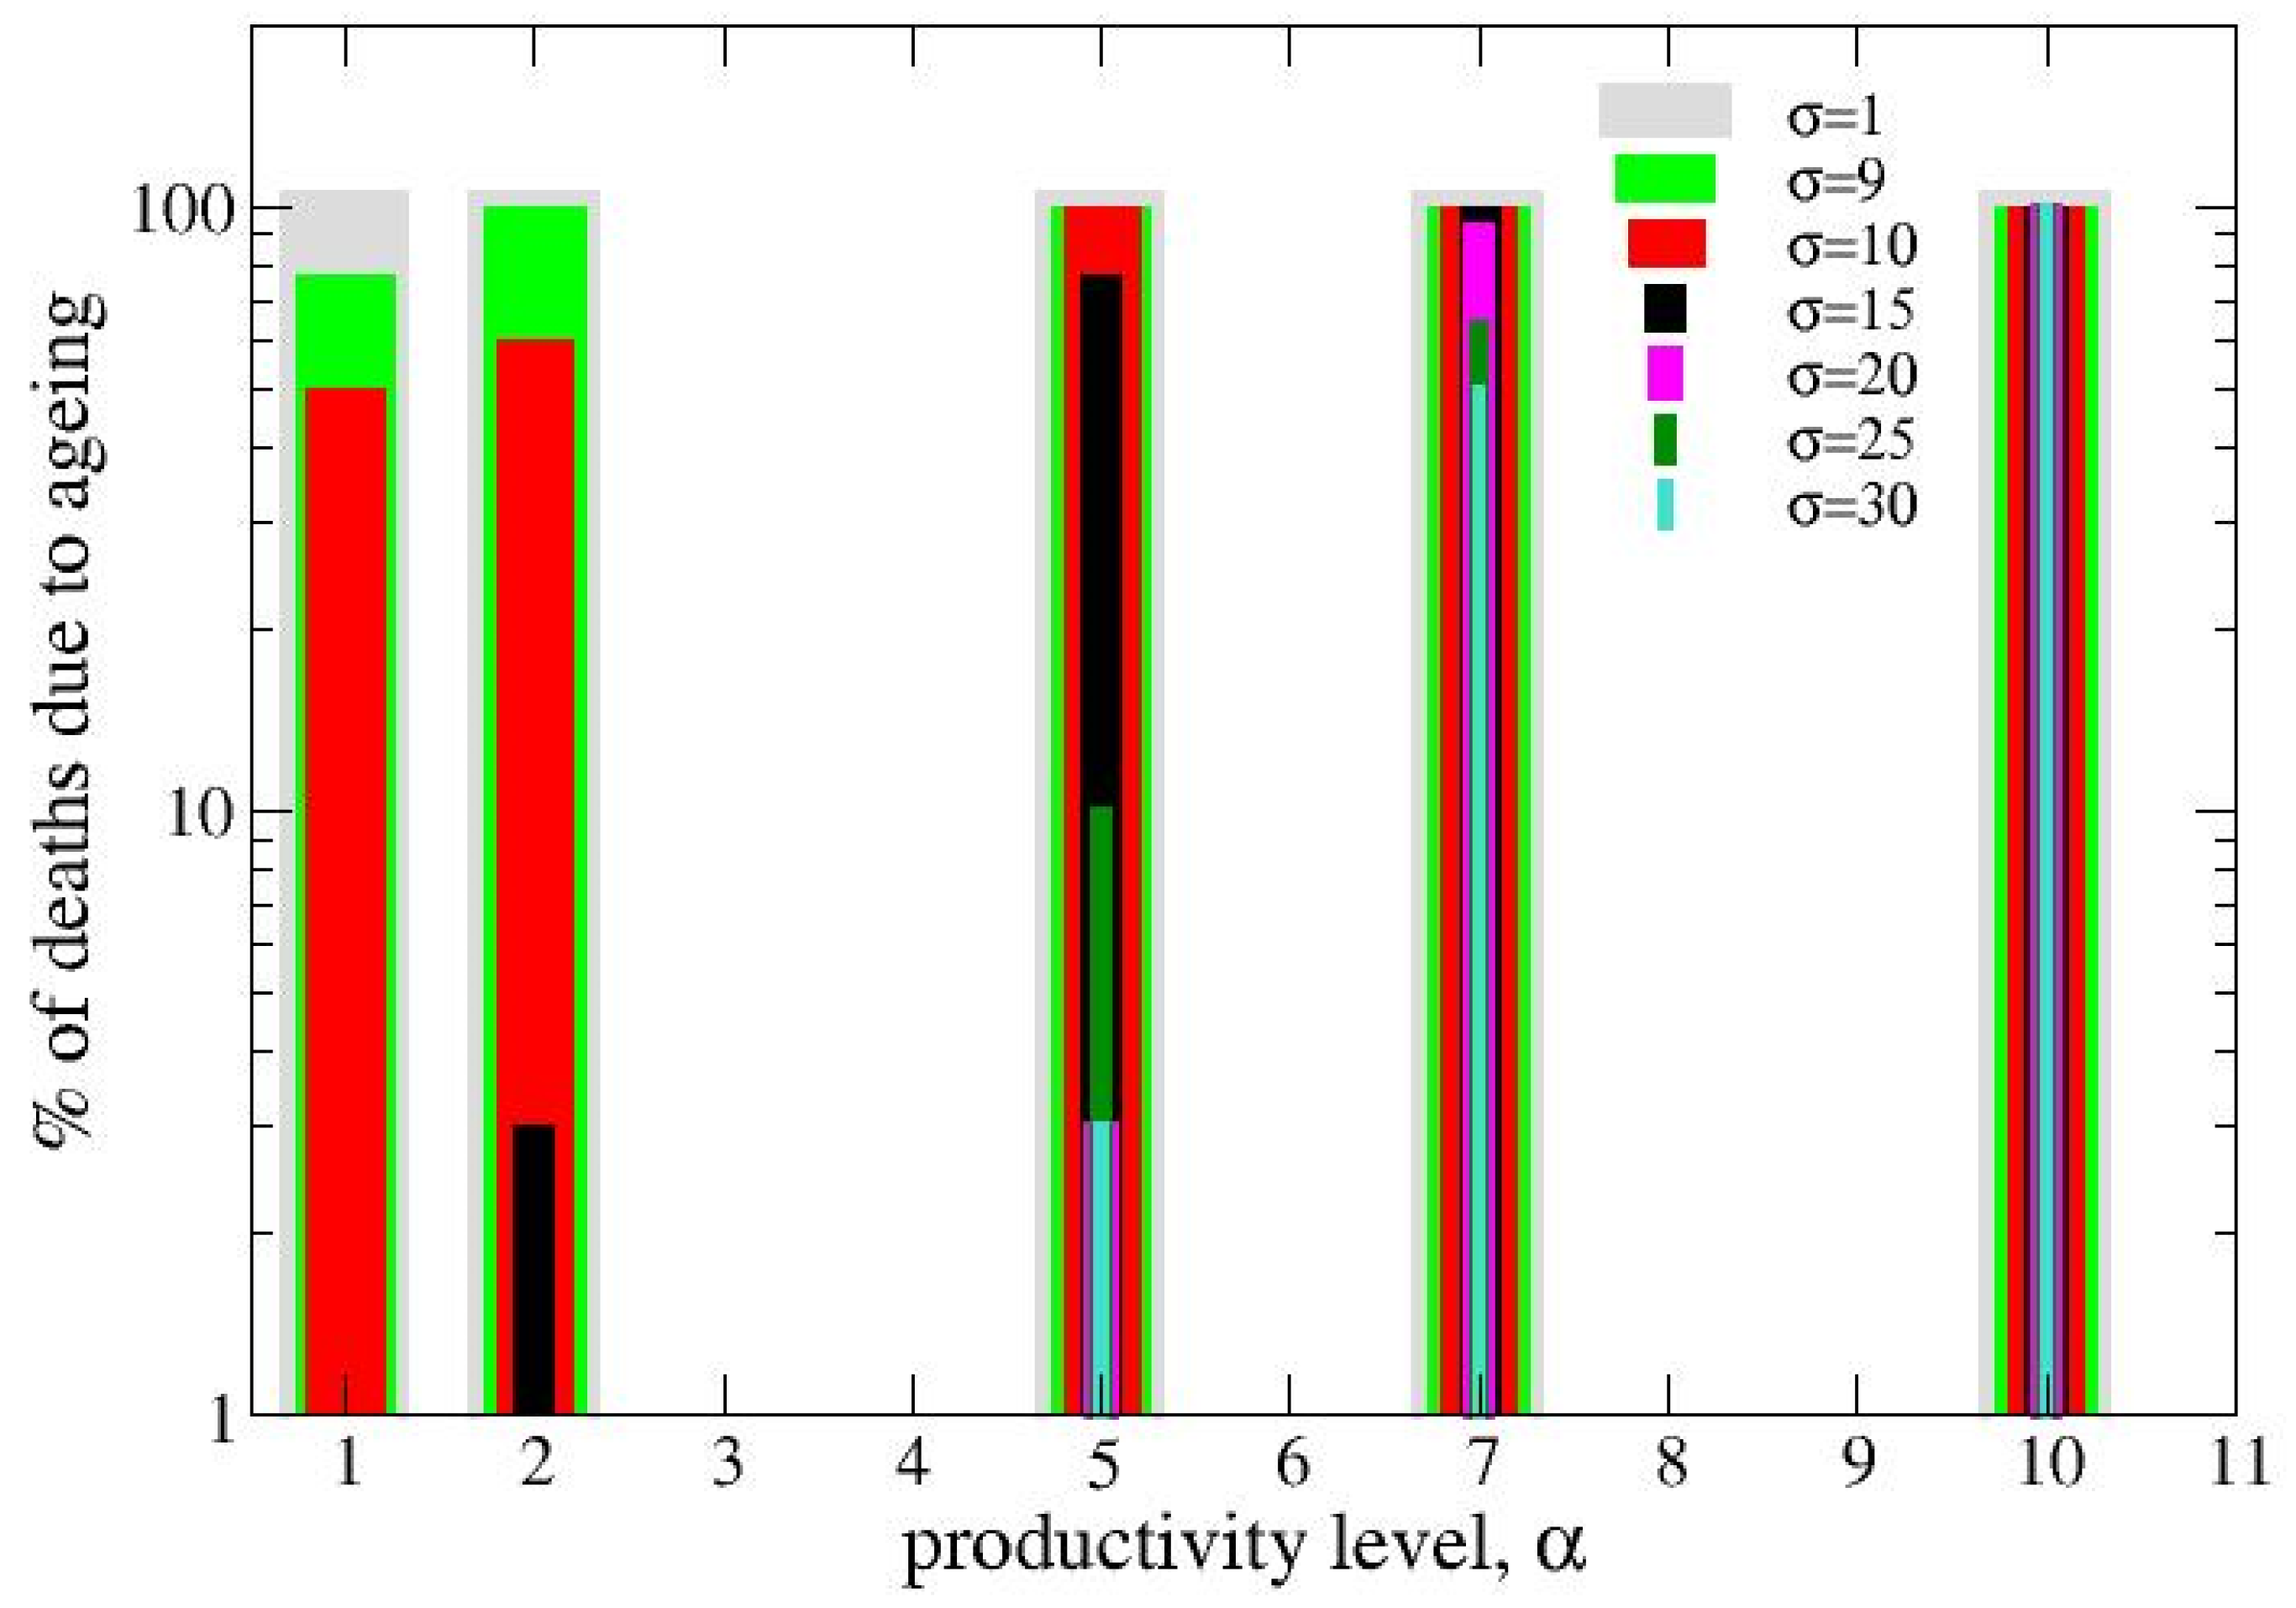
Figure 1. Percentage of colonies died due to ageing in single-strain colony evolutions. Data correspond to strains with different values of the assimilation rate (σ) from 1 to 30 evaluated in the range of productivity (α) from 1 to 10. Stochastic averaging is over 30 realizations. Grid size is 20x20 and the initial percentage of seeds is 10%.
Preprints 107706 g001
Figure 2. Time evolution of pure and complex state. Data concerns pure states high-metabolism agents H (row a), of low-metabolism agents L (row c), and also (row b) mixed states of both in the initial percentages of 10%, 10% and (5%+5%), respectively. The assimilation rates (σ) are 2,20, for L and H, respectively, and the productivity values (α) are 10,01 for L and H, respectively. Initial and final configurations are reported for each kind of colony, last iteration is 13 for row a, 22 for row b, 20 for row c.
Preprints 107706 g002
Figure 3. Survival times of mixed states. Data concerns: single-strain colonies of low-metabolism cells (σ1=2) (L) ; single-strain colonies of high-metabolism cells, (σ2=20) (H) ; mixed states of both (LH). The initial percentages are of 10% for the single-strain colonies and 5%+5%, for the mixed state. Horizontal lines report the fitness of the L in the mixed state, which goes from 1.6 for α2 ≤ 1 to 0 for α2=5. Black bold line describes the colony evolution of a strong cooperator (σ1=2, α1=10) and a cheater (σ2=20, α2=0.1). Time is calculated in iteration steps.
Preprints 107706 g003
Figure 4. Public goods produced by a mixed colony, calculated for different values of the cooperativity value, γ, here calculated as the mean value between the two productivity values, <α>. Both strains have the same value of cooperativity value given by the average of the single strain cooperativity coefficient. The amount of public goods is here measured in terms of the current that flows inside the network. Each point is the mean value over a set of 30 realizations. The marked point refer to the value <α>=5.05 and refer to the mixed state of a cheater (σ=20, α=0.1) and a strong cooperator(σ=2, α=10)-see text- .
Preprints 107706 g004
Figure 5. Time evolution of the L single state (a) and the Mix mixed state (b) . The initial concentration of active nodes is 10%. The productivity rate σ is 2 for the L strain and 10-4 for the H strain. The maximal aging time τ is 10 (see Table 1). Last iteration is 15 for L and 32 for Mix. Dark dots are for L, while red dots are for H.
Preprints 107706 g005
Table 1. Model parameters. We briefly recall their meaning and the values adopted in simulations.
Lx, Ly Dimensions of the rectangular grid 20x20
f0 Initial fraction of occupied nodes 0.1
α productivity coefficient variable
rmax, rmin Resistance values entering the link resistance formula rmax=1000, rmin=1(a.u.)
g Parameter in the Hill-like function, controlling the resistance interpolation 0.01
σ Activation efficiency variable
Qmax Maximum value of the activity triggering death or biofilm formation 80
τ Ageing time 10
Max(E) Maximal fraction of energy to be used 0.9
Qmin Minimal reproduction size 2
Disclaimer/Publisher’s Note: The statements, opinions and data contained in all publications are solely those of the individual author(s) and contributor(s) and not of MDPI and/or the editor(s). MDPI and/or the editor(s) disclaim responsibility for any injury to people or property resulting from any ideas, methods, instructions or products referred to in the content.
Copyright: This open access article is published under a Creative Commons CC BY 4.0 license, which permit the free download, distribution, and reuse, provided that the author and preprint are cited in any reuse.
Prerpints.org logo

Preprints.org is a free preprint server supported by MDPI in Basel, Switzerland.

Subscribe

© 2024 MDPI (Basel, Switzerland) unless otherwise stated