Submitted:
28 May 2024
Posted:
29 May 2024
You are already at the latest version
Abstract
Keywords:
1. Introduction
2. Materials and Methods
2.1. Insect Source
2.2. Toxicity Bioassays
2.3. Sublethal Effect of Nitenpyram on A. gossypii
2.4. Changes in Microbial Diversity of A. gossypii under Nitenpyram
3. Results
3.1. Toxicity of Nitenpyram to A. gossypii
3.2. Sublethal Effect of Nitenpyram on A. gossypii Parents
3.3. Transgenerational Sublethal Effect of Nitenpyram on G1-G3 Generations of A. gossypii
3.4.16. S rRNA Sequencing Data and Sample Characteristics
3.5. Changes in Microbial Community of A. gossypii under Nitenpyram Treatment
4. Discussion
5. Conclusions
Supplementary Materials
Author Contributions
Funding
Institutional Review Board Statement
Data Availability Statement
Conflicts of Interest
References
- Müller, F.P. Incidence of the aphid Acyrthosiphon gossypii Mordvilko on legumes and on cotton (Homoptera: Aphididae). Beitrage Entomol 1975, 25, 257–260. [Google Scholar]
- Gao, G.Z.; Perkins, L.E.; Zalucki, M.P.; Lu, Z.Z.; Ma, J.H. Effect of temperature on the biology of Acyrthosiphon gossypii Mordvilko (Homoptera: Aphididae) on cotton. J. Pest Sci. 2013, 86, 167–172. [Google Scholar] [CrossRef]
- Lu, Z.Z.; Tian, C.Y.; Song, Y.D. Relationship between Aphis gossypii and Acyrthosiphon gossypii on cotton in Xinjiang. China Cotton 2002, 29, 11–12. [Google Scholar]
- Liu, D.; Jiang, H.X.; Wang, Z.F.; Cao, Y.; Zhang, S.E.; Zhai, G.Y. The prevention and control of alfalfa aphid. Shandong J. Anim. Husb. Vet 2012, 33, 94–96. [Google Scholar]
- Bass, C.; Puinean, A.M.; Zimmer, C.T.; Denholm, I.; Field, L.M.; Foster, S.P.; Gutbrod, O.; Nauen, R.; Slater, R.; Williamson, M.S. The evolution of insecticide resistance in the peach potato aphid, Myzus persicae. Insect Biochem. Mol. Biol. 2014, 51, 41–51. [Google Scholar] [CrossRef] [PubMed]
- Mirza, F.K.; Yarahmadi, F.; Jalal Abadi, A.L.; Meraaten, A.A. Enzymes mediating resistance to chlorpyriphos in Aphis fabae (Homoptera: Aphididae). Ecotoxicol. Environ. Saf. 2020, 206, 111335. [Google Scholar] [CrossRef] [PubMed]
- Liang, P.; Tian, Y.A.; Biondi, A.; Desneux, N.; Gao, X.W. Short-term and transgenerational effects of the neonicotinoid nitenpyram on susceptibility to insecticides in two whitefly species. Ecotoxicology 2012, 21, 1889–1898. [Google Scholar] [CrossRef] [PubMed]
- Elbert, A.; Haas, M.; Springer, B.; Thielert, W.; Nauen, R. Applied aspects of neonicotinoid uses in crop protection. Pest Manage. Sci. 2008, 64, 1099–1105. [Google Scholar] [CrossRef]
- Minamida, I.; Iwanaga, K.; Tabuchi, T.; Uneme, H.; Dantsuji, H.; Oksuchi, T. Synthesis and insecticidal activity of acyclic nitroethene compounds containing a 3-pyridylmethylamino group. J Pestic Sci. 1993, 18, 31–40. [Google Scholar] [CrossRef]
- Bass, C.; Denholm, I.; Williamson, M.S.; Nauen, R. The global status of insect resistance to neonicotinoid insecticides. Pestic. Biochem. Physiol. 2015, 121, 78–87. [Google Scholar] [CrossRef]
- Wang, S.Y.; Qi, Y.F.; Desneux, N.; Shi, X.Y.; Biondi, A.; Gao, X.W. Sublethal and transgenerational effects of short-term and chronic exposures to the neonicotinoid nitenpyram on the cotton aphid Aphis gossypii. J Pest Sci. 2017, 90, 389–396. [Google Scholar] [CrossRef]
- Zhu, X.H.; Wei, Q.; Wan, P.J.; Wang, W.X.; Lai, F.X.; He, J.C.; Fu, Q. Effect of Paclobutrazol Application on Enhancing the Efficacy of Nitenpyram against the Brown Planthopper, Nilaparvata lugens. Int. J. Mol. Sci. 2023, 24, 10490. [Google Scholar] [CrossRef] [PubMed]
- Li, Z.; Mao, K.; Jin, R.; Cai, T.; Qin, Y.; Zhang, Y.; He, S.; Ma, K.; Wan, H.; Ren, X.; et al. miRNA novel_268 targeting NlABCG3 is involved in nitenpyram and clothianidin resistance in Nilaparvata lugens. Int. J. Biol. Macromol. 2022, 217, 615–623. [Google Scholar] [CrossRef] [PubMed]
- Stapel, J.O.; Cortesero, A.M.; Lewis, W.J. Disruptive sublethal effects of insecticides on biological control: altered foraging ability and life span of a parasitoid after feeding on extrafloral nectar of cotton treated with systemic insecticides. Biol. Control 2000, 17, 243–249. [Google Scholar] [CrossRef]
- Desneux, N.; Decourtye, A.; Delpuech, J.M. The sublethal effects of pesticides on beneficial arthropods. Annu. Rev. Entomol. 2007, 52, 81–106. [Google Scholar] [CrossRef] [PubMed]
- Desneux, N.; Rafalimanana, H.; Kaiser, L. Dose–response relationship in lethal and behavioural effects of different insecticides on the parasitic wasp Aphidius ervi. Chemosphere 2004, 54, 619–627. [Google Scholar] [CrossRef] [PubMed]
- Ceuppens, B.; Eeraerts, M.; Vleugels, T.; Cnops, G.; Roldan-Ruiz, I.; Smagghe, G. Effects of dietary lambda-cyhalothrin exposure on bumblebee survival, reproduction, and foraging behavior in laboratory and greenhouse. J Pest Sci. 2015, 88, 777–783. [Google Scholar] [CrossRef]
- Wu, H.M.; Feng, H.L.; Wang, G.D.; Zhang, L.L.; Zulu, L.; Liu, Y.H.; Zheng, Y.L.; Rao, Q. Sublethal effects of three insecticides on development and reproduction of Spodoptera frugiperda (Lepidoptera: Noctuidae). Agronomy 2022, 12, 1334. [Google Scholar] [CrossRef]
- Cheng, Z.; Qin, Q.; Wang, D.; Han, S.; Zhang, S.; He, Y. Sublethal and transgenerational effects of exposures to the thiamethoxam on the seven-spotted lady beetle, Coccinella septempunctata L. (Coleoptera: Coccinellidae). Ecotoxicol. Environ. Saf. 2022, 243, 114002. [Google Scholar] [CrossRef]
- Fouad, E.A.; El-Sherif, S.A.N.; Mokbel, E.S.M.S. Flupyradifurone induces transgenerational hormesis effects in the cowpea aphid, Aphis craccivora. Ecotoxicology 2022, 31, 909–918. [Google Scholar] [CrossRef]
- Gul, H.; Ul Haq, I.; Ullah, F.; Khan, S.; Yaseen, A.; Shah, S.H.; Tariq, K.; Güncan, A.; Desneux, N.; Liu, X. Impact of sublethal concentrations of flonicamid on key demographic parameters and feeding behavior of Schizaphis graminum. Ecotoxicology 2023, 32, 756–767. [Google Scholar] [CrossRef] [PubMed]
- Hadian, S.; Zandi-Sohani, N.; Yarahmadi, F.; Sohrabi, F. Determination of sub-lethal effects of spirotetramat and chlorpyrifos on Aenasius bambawalei Hayat (Hymenoptera: Encyrtidae) by using life table. Iran Agric. Res. 2022, 40, 33–40. [Google Scholar]
- Ullah, F.; Gul, H.; Tariq, K.; Desneux, N.; Gao, X.; Song, D. Thiamethoxam induces transgenerational hormesis effects and alteration of genes expression in Aphis gossypii. Pestic. Biochem. Physiol. 2020, 165, 104557. [Google Scholar] [CrossRef] [PubMed]
- Li, W.; Li, X.Q.; Wang, W.R.; Zhang, S.C.; Cui, J.J.; Peng, Y.; Zhao, Y. Impact of Sulfoxaflor Exposure on Bacterial Community and Developmental Performance of the Predatory Ladybeetle Propylea japonica. Microb Ecol. 2023, 86, 1226–1239. [Google Scholar] [CrossRef] [PubMed]
- Shang, J.; Yao, Y.S.; Chen, L.L.; Zhu, X.Z.; Niu, L.; Gao, X.K.; Luo, J.Y.; Ji, J.C.; Cui, J.J. Sublethal exposure to deltamethrin stimulates reproduction and alters symbiotic bacteria in Aphis gossypii. J Agric Food Chem. 2021, 69, 15097–15107. [Google Scholar] [CrossRef] [PubMed]
- Zhao, M.; Lin, X.Y.; Guo, X.R. The role of insect symbiotic bacteria in metabolizing phytochemicals and agrochemicals. Insects 2022, 13, 583. [Google Scholar] [CrossRef]
- Cheng, D.F.; Guo, Z.J.; Riegler, M.; Xi, Z.Y.; Liang, G.W.; Xu, Y.J. Gut symbiont enhances insecticide resistance in a significant pest, the oriental fruit fly Bactrocera dorsalis (Hendel). Microbiome 2017, 5, 1–12. [Google Scholar] [CrossRef]
- Wang, H.Y.; Zhang, C.X.; Cheng, P.; Wang, Y.; Liu, H.M.; Wang, H.F.; Wang, H.W.; Gong, M.Q. Differences in the intestinal microbiota between insecticide-resistant and-sensitive Aedes albopictus based on full-length 16S rRNA sequencing. Microbiology Open 2021, 10, e1177. [Google Scholar] [CrossRef]
- Chen, B.; Zhang, N.; Xie, S.; Zhang, X.; He, J.; Muhammad, A.; Sun, C.; Lu, X.; Shao, Y. Gut bacteria of the silkworm Bombyx mori facilitate host resistance against the toxic effects of organophosphate insecticides. Environ. Int. 2020, 143, 105886. [Google Scholar] [CrossRef]
- Moores, G.D.; Gao, X.W.; Denholm, I.; Devonshire, A.L. Characterisation of insensitive acetylcholinesterase in insecticide-resistant cotton aphids, Aphis gossypii glover (homoptera: Aphididae). Pestic. Biochem. Physiol. 1996, 56, 102–110. [Google Scholar] [CrossRef]
- Chen, X.W.; Li, F.; Chen, A.Q.; Ma, K.S.; Liang, P.Z.; Liu, Y.; Song, D.I.; Gao, X.W. Both point mutations and low expression levels of the nicotinic acetylcholine receptor β1 subunit are associated with imidacloprid resistance in an Aphis gossypii (Glover) population from a Bt cotton field in China. Pestic. Biochem. Physiol. 2017, 141, 1–8. [Google Scholar] [CrossRef] [PubMed]
- Chi, H.; Liu, H. Two new methods for the study of insect population ecology. Bull. Inst. Zool. Acad. Sin. 1985, 24, 225–240. [Google Scholar]
- Johnson, R.W. An introduction to the bootstrap. Teach Stat. 2001, 23, 49–54. [Google Scholar] [CrossRef]
- Nossa, C.W.; Oberdorf, W.E.; Yang, L.Y.; Aas, J.A.; Paster, B.J.; DeSantis, T.Z.; Brodie, E.L.; Malamud, D.; Poles, M.A.; Pei, Z.H. Design of 16S rRNA gene primers for 454 pyrosequencing of the human foregut microbiome. World J. Gastroenterol. 2010, 16, 4135. [Google Scholar] [CrossRef] [PubMed]
- Bolyen, E.; Rideout, J.R.; Dillon, M.R.; Bokulich, N.A.; Abnet, C.C.; Al-Ghalith, G.A.; Alexander, H.; Alm, E.J.; Arumugam, M.; Asnicar, F. Reproducible, interactive, scalable and extensible microbiome data science using QIIME 2. Nat. Biotechnol. 2019, 37, 852–857. [Google Scholar] [CrossRef] [PubMed]
- Callahan, B.J.; McMurdie, P.J.; Rosen, M.J.; Han, A.W.; Johnson, A.J.A.; Holmes, S.P. DADA2: High-resolution sample inference from Illumina amplicon data. Nat. Methods. 2016, 13, 581–583. [Google Scholar] [CrossRef] [PubMed]
- Schloss, P.D.; Westcott, S.L.; Ryabin, T.; Hall, J.R.; Hartmann, M.; Hollister, E.B.; Lesniewski, R.A.; Oakley, B.B.; Parks, D.H.; Robinson, C.J. Introducing mothur: open-source, platform-independent, community-supported software for describing and comparing microbial communities. Appl. Environ. Microbiol. 2009, 75, 7537–7541. [Google Scholar] [CrossRef] [PubMed]
- Du, P.Q.; Wu, X.H.; Xu, J.; Dong, F.S.; Liu, X.G.; Zheng, Y.Q. Effects of trifluralin on the soil microbial community and functional groups involved in nitrogen cycling. J. Hazard. Mater. 2018, 353, 204–213. [Google Scholar] [CrossRef] [PubMed]
- Segata, N.; Izard, J.; Waldron, L.; Gevers, D.; Miropolsky, L.; Garrett, W.S.; Huttenhower, C. Metagenomic biomarker discovery and explanation. Genome Biol. 2011, 12, 1–18. [Google Scholar] [CrossRef]
- Simon-Delso, N.; Amaral-Rogers, V.; Belzunces, L.P.; Bonmatin, J.M.; Chagnon, M.; Downs, C.; Furlan, L.; Gibbons, D.W.; Giorio, C.; Girolami, V. Systemic insecticides (neonicotinoids and fipronil): trends, uses, mode of action and metabolites. Environ. Sci. Pollut. Res. 2015, 22, 5–34. [Google Scholar] [CrossRef]
- Dai, C.; Ricupero, M.; Puglisi, R.; Lu, Y.; Desneux, N.; Biondi, A.; Zappalà, L. Can contamination by major systemic insecticides affect the voracity of the harlequin ladybird? Chemosphere 2020, 256, 126986. [Google Scholar] [CrossRef] [PubMed]
- Sial, M.U.; Zhao, Z.Z.; Zhang, L.; Zhang, Y.N.; Mao, L.G.; Jiang, H.Y. Evaluation of insecticides induced hormesis on the demographic parameters of Myzus persicae and expression changes of metabolic resistance detoxification genes. Sci. Rep. 2018, 8, 16601. [Google Scholar] [CrossRef] [PubMed]
- Li, X.; Li, Y.; Zhu, X.; Li, X.; Cheng, D.; Zhang, Y. Effects of imidacloprid-induced hormesis on the development and reproduction of the rose-grain aphid Metopolophium dirhodum(Hemiptera: Aphididae). Front Physiol. 2023, 14, 1113464. [Google Scholar] [CrossRef] [PubMed]
- Skouras, P.J.; Stathas, G.J.; Voudouris, C.C.; Darras, A.I.; Tsitsipis, J.A.; Margaritopoulos, J.T. Effect of synthetic insecticides on the larvae of Coccinella septempunctata from Greek populations. Phytoparasitica 2017, 45, 165–173. [Google Scholar] [CrossRef]
- Hannig, G.T.; Ziegler, M.; Marçon, P.G. Feeding cessation effects of chlorantraniliprole, a new anthranilic diamide insecticide, in comparison with several insecticides in distinct chemical classes and mode-of-action groups. Pest Manage. Sci. 2009, 65, 969–974. [Google Scholar] [CrossRef] [PubMed]
- Liang, P.Z.; Ma, K.S.; Chen, X.W.; Tang, C.Y.; Xia, J.; Chi, H.; Gao, X.W. Toxicity and Sublethal Effects of Flupyradifurone, a Novel Butenolide Insecticide, on the Development and Fecundity of Aphis gossypii (Hemiptera: Aphididae). J. Econ. Entomol. 2019, 112, 852–858. [Google Scholar] [CrossRef] [PubMed]
- Zhang, S.W.; Zeng, Q.H.; Yang, H.; Zhang, C.; Ding, B.; Yang, H.Z.; Yang, M.F. Sublethal and transgenerational effects of broflanilide on Myzus persicae (Sulzer)(Hemiptera: Aphididae). Crop Prot. 2023, 174, 106421. [Google Scholar] [CrossRef]
- Iftikhar, A.; Hafeez, F.; Aziz, M.A.; Hashim, M.; Naeem, A.; Yousaf, H.K.; Saleem, M.J.; Hussain, S.; Hafeez, M.; Ali, Q.; et al. Assessment of sublethal and transgenerational effects of spirotetramat, on population growth of cabbage aphid,Brevicoryne brassicae L. (Hemiptera: Aphididae). Front Physiol. 2022, 13, 1014190. [Google Scholar] [CrossRef]
- Tang, Q.L.; Liang, P.Z.; Li, J.H.; Gao, X.W. A sublethal concentration of afidopyropen suppresses the population growth of the cotton aphid, Aphis gossypii Glover (Hemiptera: Aphididae). J. Integr. Agric. 2022, 21, 2055–2064. [Google Scholar]
- Liu, X.; Fu, Z.; Zhu, Y.; Gao, X.; Liu, T.X.; Liang, P. Sublethal and transgenerational effects of afidopyropen on biological traits of the green peach aphid Myzus persicae (Sluzer). Pestic. Biochem. Physiol. 2022, 180, 104981. [Google Scholar] [CrossRef]
- Wei, Y.D.; Su, Y.; Han, X.; Guo, W.F.; Zhu, Y.; Yao, Y.S. Evaluation of Transgenerational Effects of Sublethal Imidacloprid and Diversity of Symbiotic Bacteria on Acyrthosiphon gossypii. Insects 2023, 14, 427. [Google Scholar] [CrossRef] [PubMed]
- Han, W.S.; Zhang, S.F.; Shen, F.Y.; Liu, M.; Ren, C.C.; Gao, X.W. Residual toxicity and sublethal effects of chlorantraniliprole on Plutella xylostella (lepidoptera: plutellidae). Pest Manage. Sci. 2012, 68, 1184–1190. [Google Scholar] [CrossRef] [PubMed]
- Afza, R.; Afzal, A.; Riaz, M.A.; Majeed, M.Z.; Idrees, A.; Qadir, Z.A.; Afzal, M.; Hassan, B.; Li, J. Sublethal and transgenerational effects of synthetic insecticides on the biological parameters and functional response of Coccinella septempunctata (Coleoptera: Coccinellidae) under laboratory conditions. Front Physiol. 2023, 14, 1088712. [Google Scholar] [CrossRef] [PubMed]
- Xiao, D.; Yang, T.; Desneux, N.; Han, P.; Gao, X.W. Assessment of Sublethal and Transgenerational Effects of Pirimicarb on the Wheat Aphids Rhopalosiphum padi and Sitobion avenae. PloS one 2015, 10, e0128936. [Google Scholar] [CrossRef]
- Szabó, B.; Seres, A.; Bakonyi, G. Distinct changes in the life-history strategies of Folsomia candida Willem (Collembola: Isotomidae) due to multi-and transgenerational treatments with an insecticide. Appl Soil Ecol. 2020, 152, 103563. [Google Scholar] [CrossRef]
- Wang, H.; Xian, X.Q.; Gu, Y.Y.; Castañé, C.; Arnó, J.; Wu, S.R.; Wan, F.H.; Liu, W.X.; Zhang, G.F.; Zhang, Y.B. Similar bacterial communities among different populations of a newly emerging invasive species, Tuta absoluta (Meyrick). Insects 2022, 13, 252. [Google Scholar] [CrossRef] [PubMed]
- Naveed, W.A.; Liu, Q.; Lu, C.C.; Huang, X.L. Symbiotic Bacterial Communities of Insects Feeding on the Same Plant Lineage: Distinct Composition but Congruent Function. Insects 2024, 15, 187. [Google Scholar] [CrossRef] [PubMed]
- Zhu, H.M.; Li, D.L.; Desneux, N.; Gatti, J.L.; Hu, Z.Q.; Luo, C. Facultative symbiont provides fitness benefits to the grain aphid, but not to parasitoid offspring. Entomol Gen. 2024, 44, 163–170. [Google Scholar] [CrossRef]
- Ye, Q.T.; Gong, X.; Liu, H.H.; Wu, B.X.; Peng, C.W.; Hong, X.Y.; Bing, X.L. The symbiont Wolbachia alleviates pesticide susceptibility in the two-spotted spider mite Tetranychus urticae through enhanced host detoxification pathways. Insect Sci. 2024. [Google Scholar] [CrossRef]
- Xia, X.; Sun, B.; Gurr, G.M.; Vasseur, L.; Xue, M.; You, M. Gut Microbiota Mediate Insecticide Resistance in the Diamondback Moth, Plutella xylostella(L.). Front Microbiol. 2018, 9, 25. [Google Scholar] [CrossRef]
- Zeng, B.; Zhang, F.; Liu, Y.T.; Wu, S.F.; Bass, C.; Gao, C.F. Symbiotic bacteria confer insecticide resistance by metabolizing buprofezin in the brown planthopper, Nilaparvata lugens (Stål). PLoS Pathog. 2023, 19, e1011828. [Google Scholar] [CrossRef] [PubMed]
- Zhang, S.; Luo, J.; Wang, L.; Zhang, L.; Zhu, X.; Jiang, W.; Cui, J. Bacterial communities in natural versus pesticide-treated Aphis gossypii populations in North China. Microbiology Open 2019, 8, e00652. [Google Scholar] [CrossRef] [PubMed]
- Gao, Y.F.; Ren, Y.J.; Chen, J.C.; Cao, L.J.; Qiao, G.H.; Zong, S.X.; Hoffmann, A.A.; Wei, S.J.; Yang, Q. Effects of fungicides on fitness and Buchnera endosymbiont density in Aphis gossypii. Pest Manage. Sci. 2023, 79, 4282–4289. [Google Scholar] [CrossRef] [PubMed]
- Shigenobu, S.; Wilson, A.C.C. Genomic revelations of a mutualism: the pea aphid and its obligate bacterial symbiont. Cell. Mol. Life Sci. 2011, 68, 1297–1309. [Google Scholar] [CrossRef] [PubMed]
- Guo, S.K.; Gong, Y.J.; Chen, J.C.; Shi, P.; Cao, L.J.; Yang, Q.; Hoffmann, A.A.; Wei, S.J. Increased density of endosymbiotic Buchnera related to pesticide resistance in yellow morph of melon aphid. J. Pest Sci. 2020, 93, 1281–1294. [Google Scholar] [CrossRef]
- Liu, Y.; Chen, C.Y.; Li, R.; Liang, P.Z.; Gu, S.H.; Zhang, L.; Gao, X.W. Endosymbiosis change under the stress of omethoate and four plant allelochemicals in cotton aphid, Aphis gossypii Glover (Hemiptera: Aphididae). 2023.
- Pinyakong, O.; Habe, H.; Kouzuma, A.; Nojiri, H.; Yamane, H.; Omori, T. Isolation and characterization of genes encoding polycyclic aromatic hydrocarbon dioxygenase from acenaphthene and acenaphthylene degrading Sphingomonas sp. strain A4. FEMS Microbiol. Lett. 2004, 238, 297–305. [Google Scholar]
- Lv, N.; Li, R.; Cheng, S.; Zhang, L.; Liang, P.; Gao, X. The gut symbiont Sphingomonas mediates imidacloprid resistance in the important agricultural insect pest Aphis gossypii Glover. BMC Biol. 2023, 21, 86. [Google Scholar] [CrossRef]
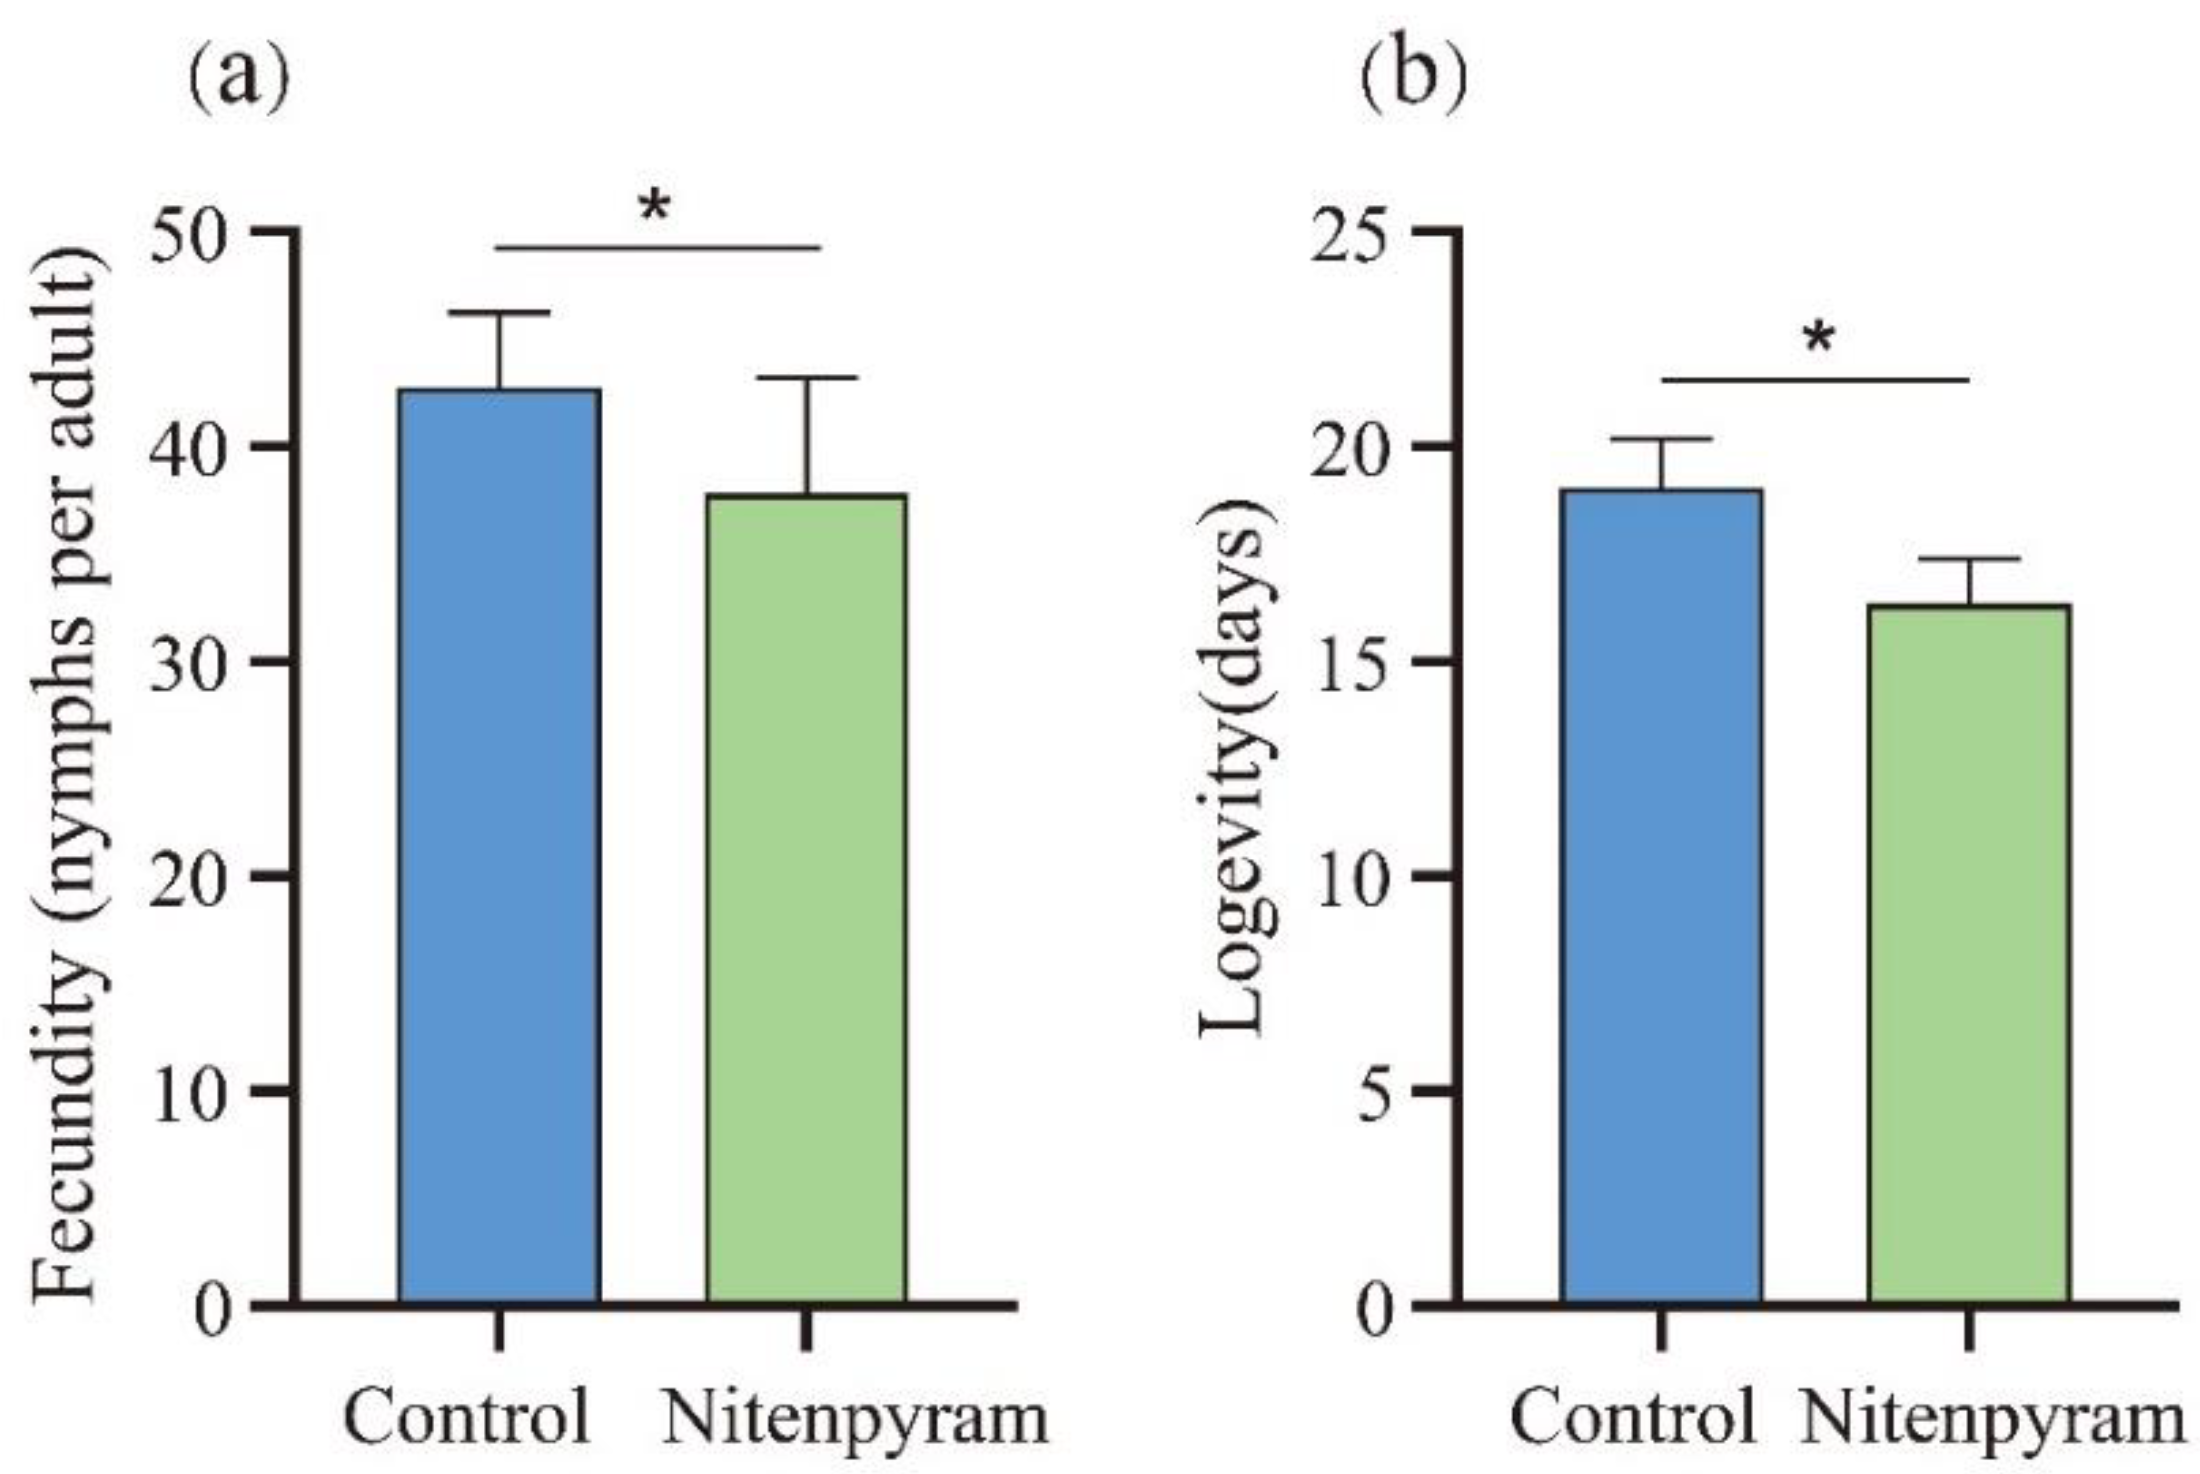
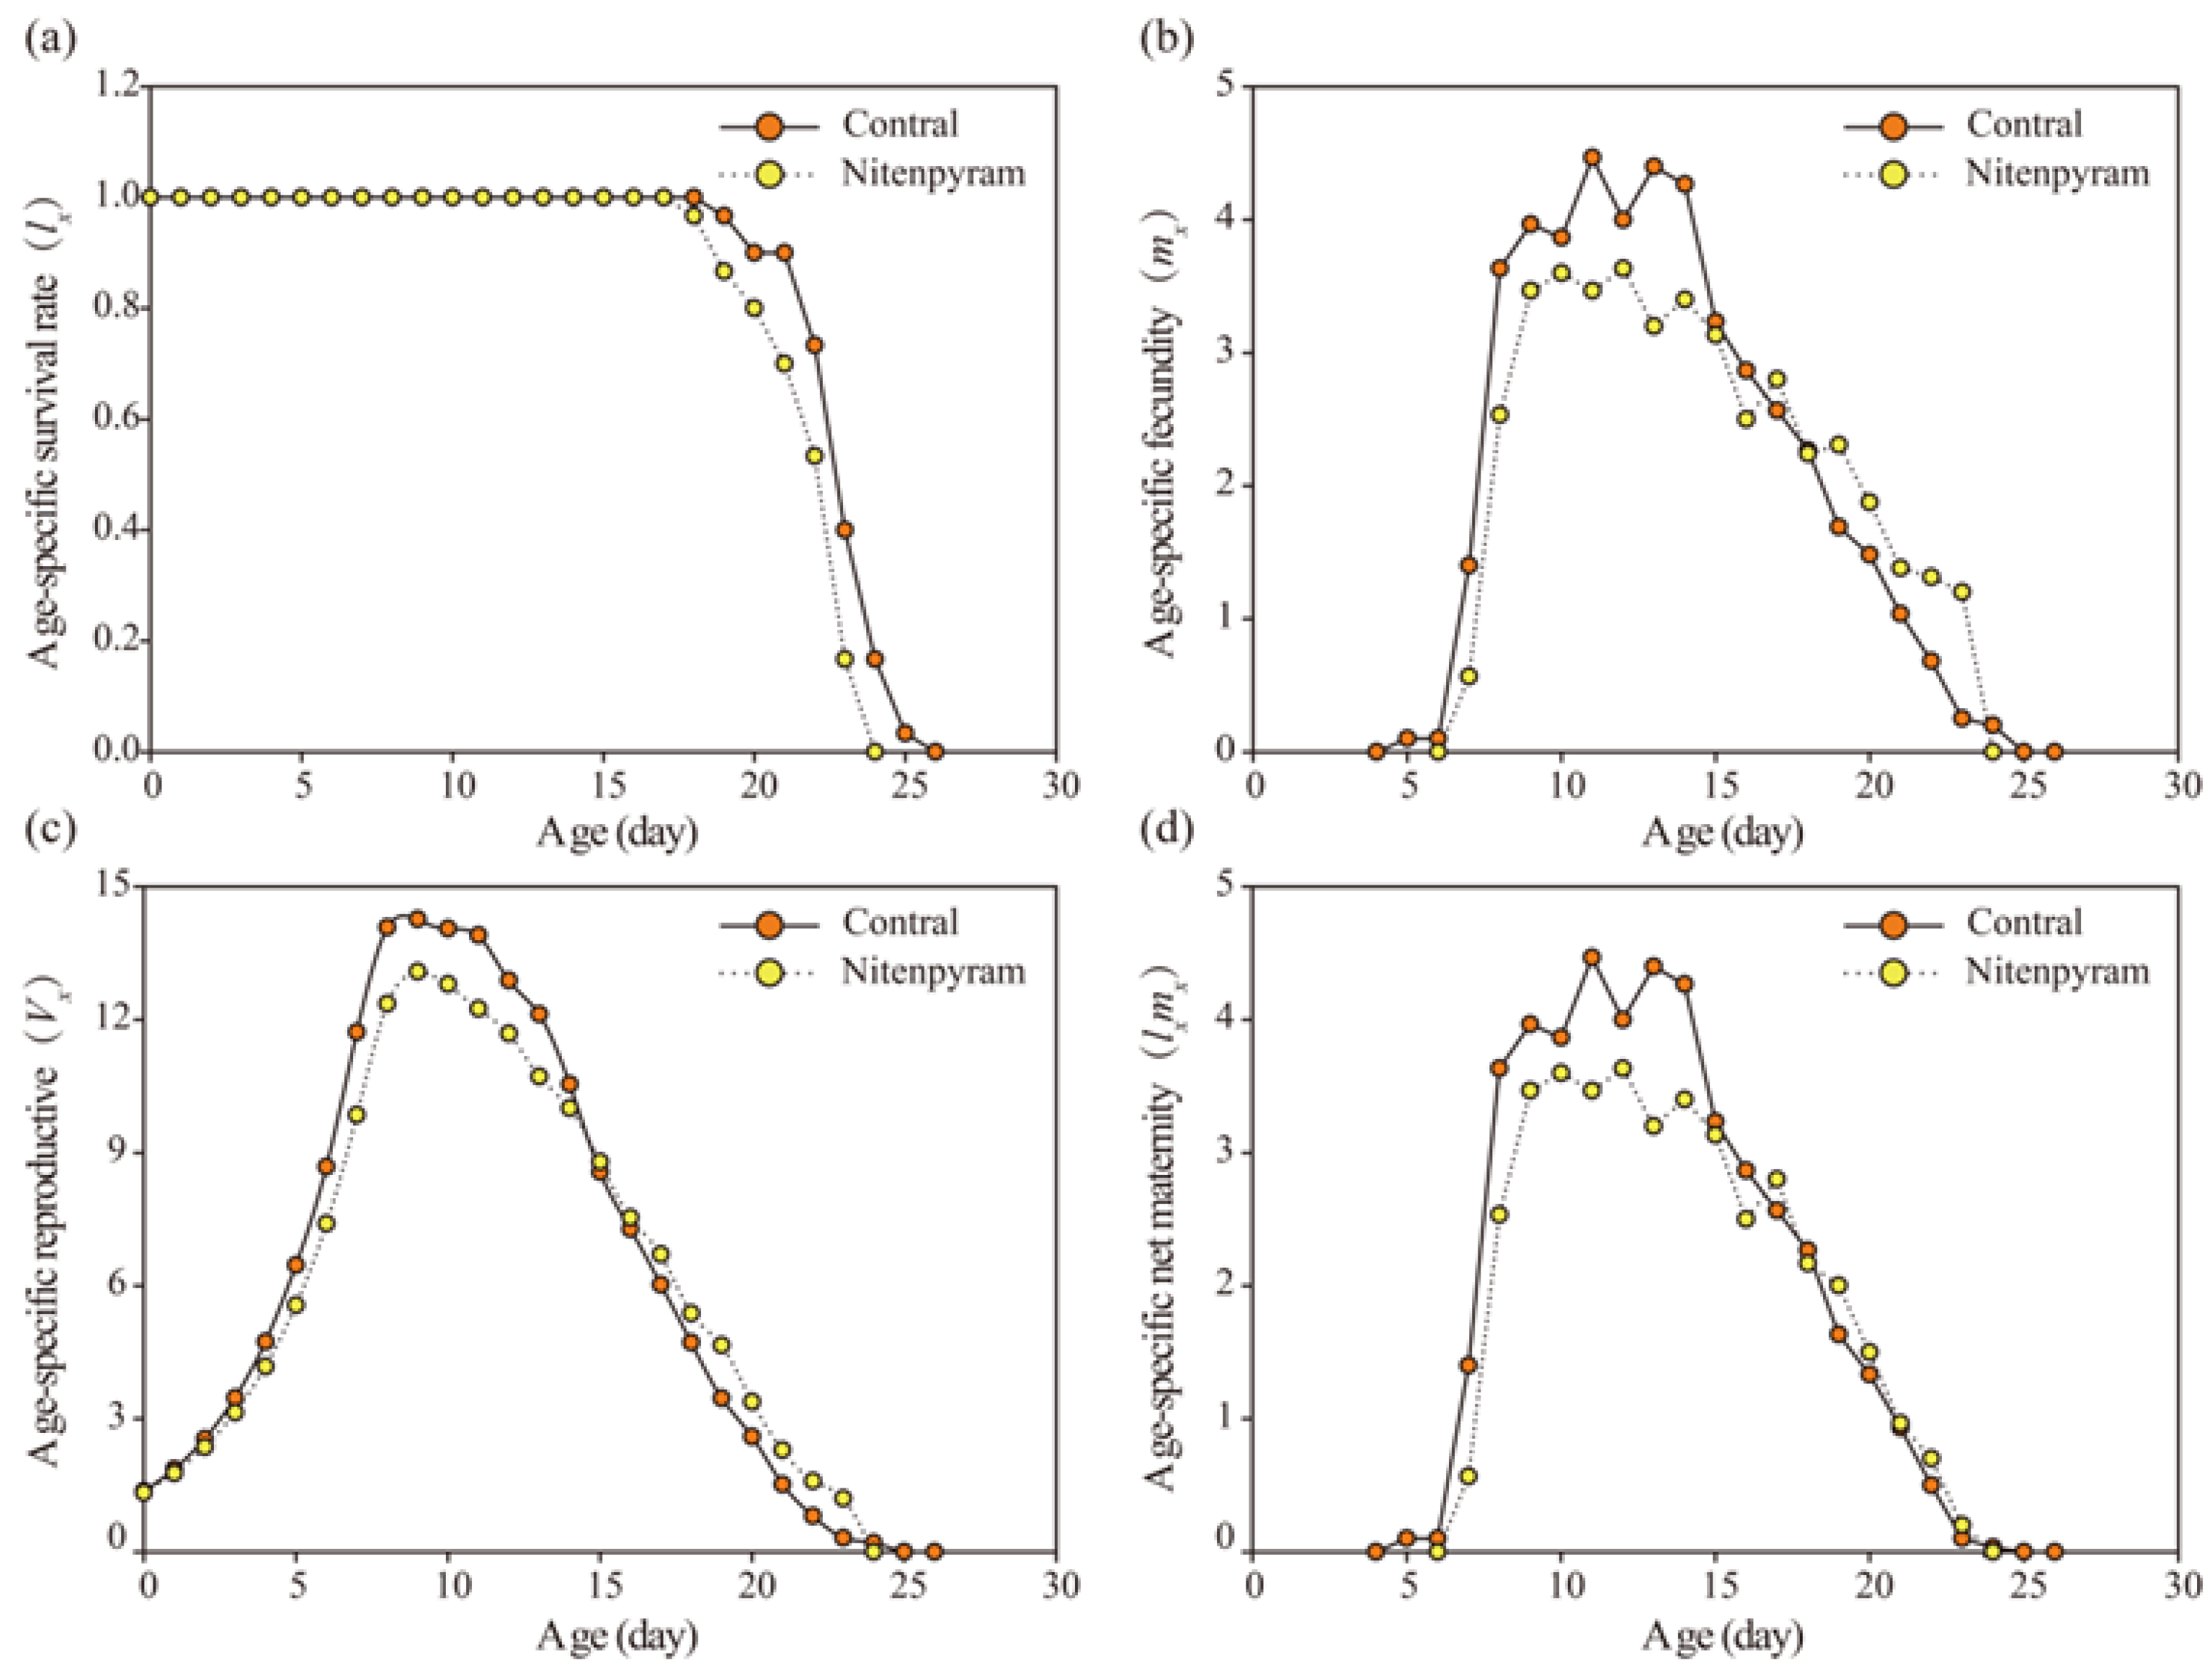
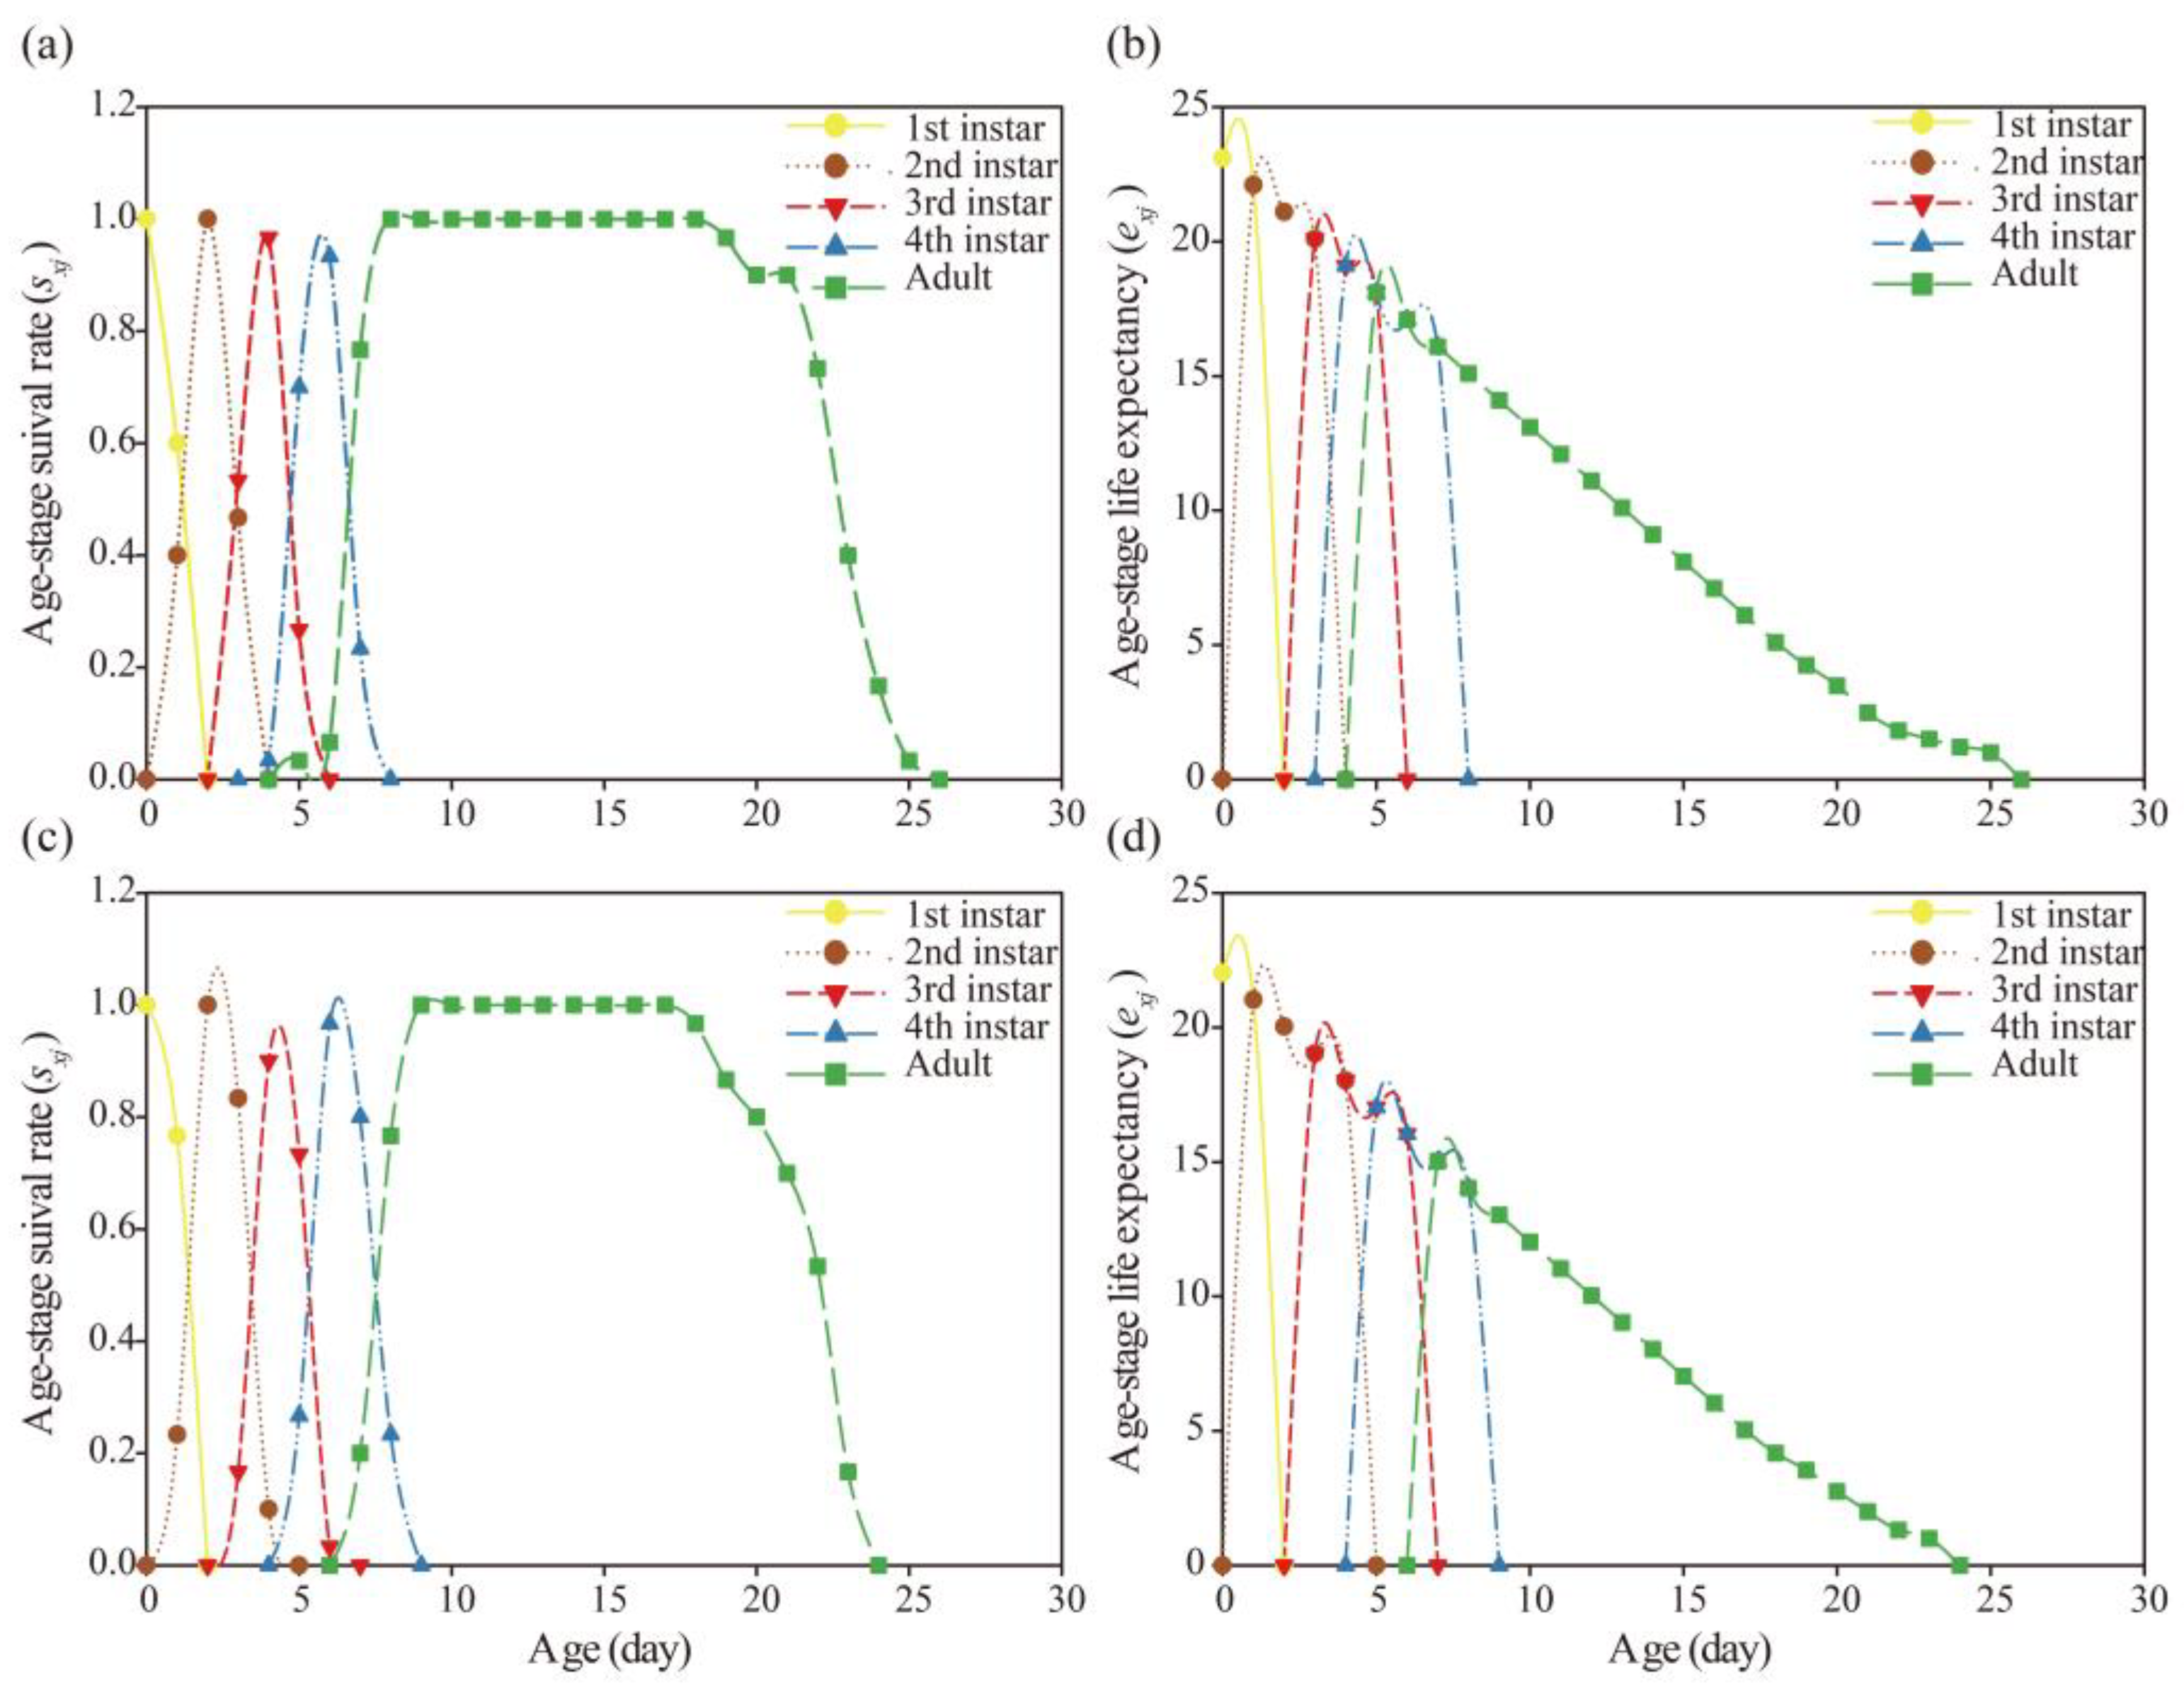
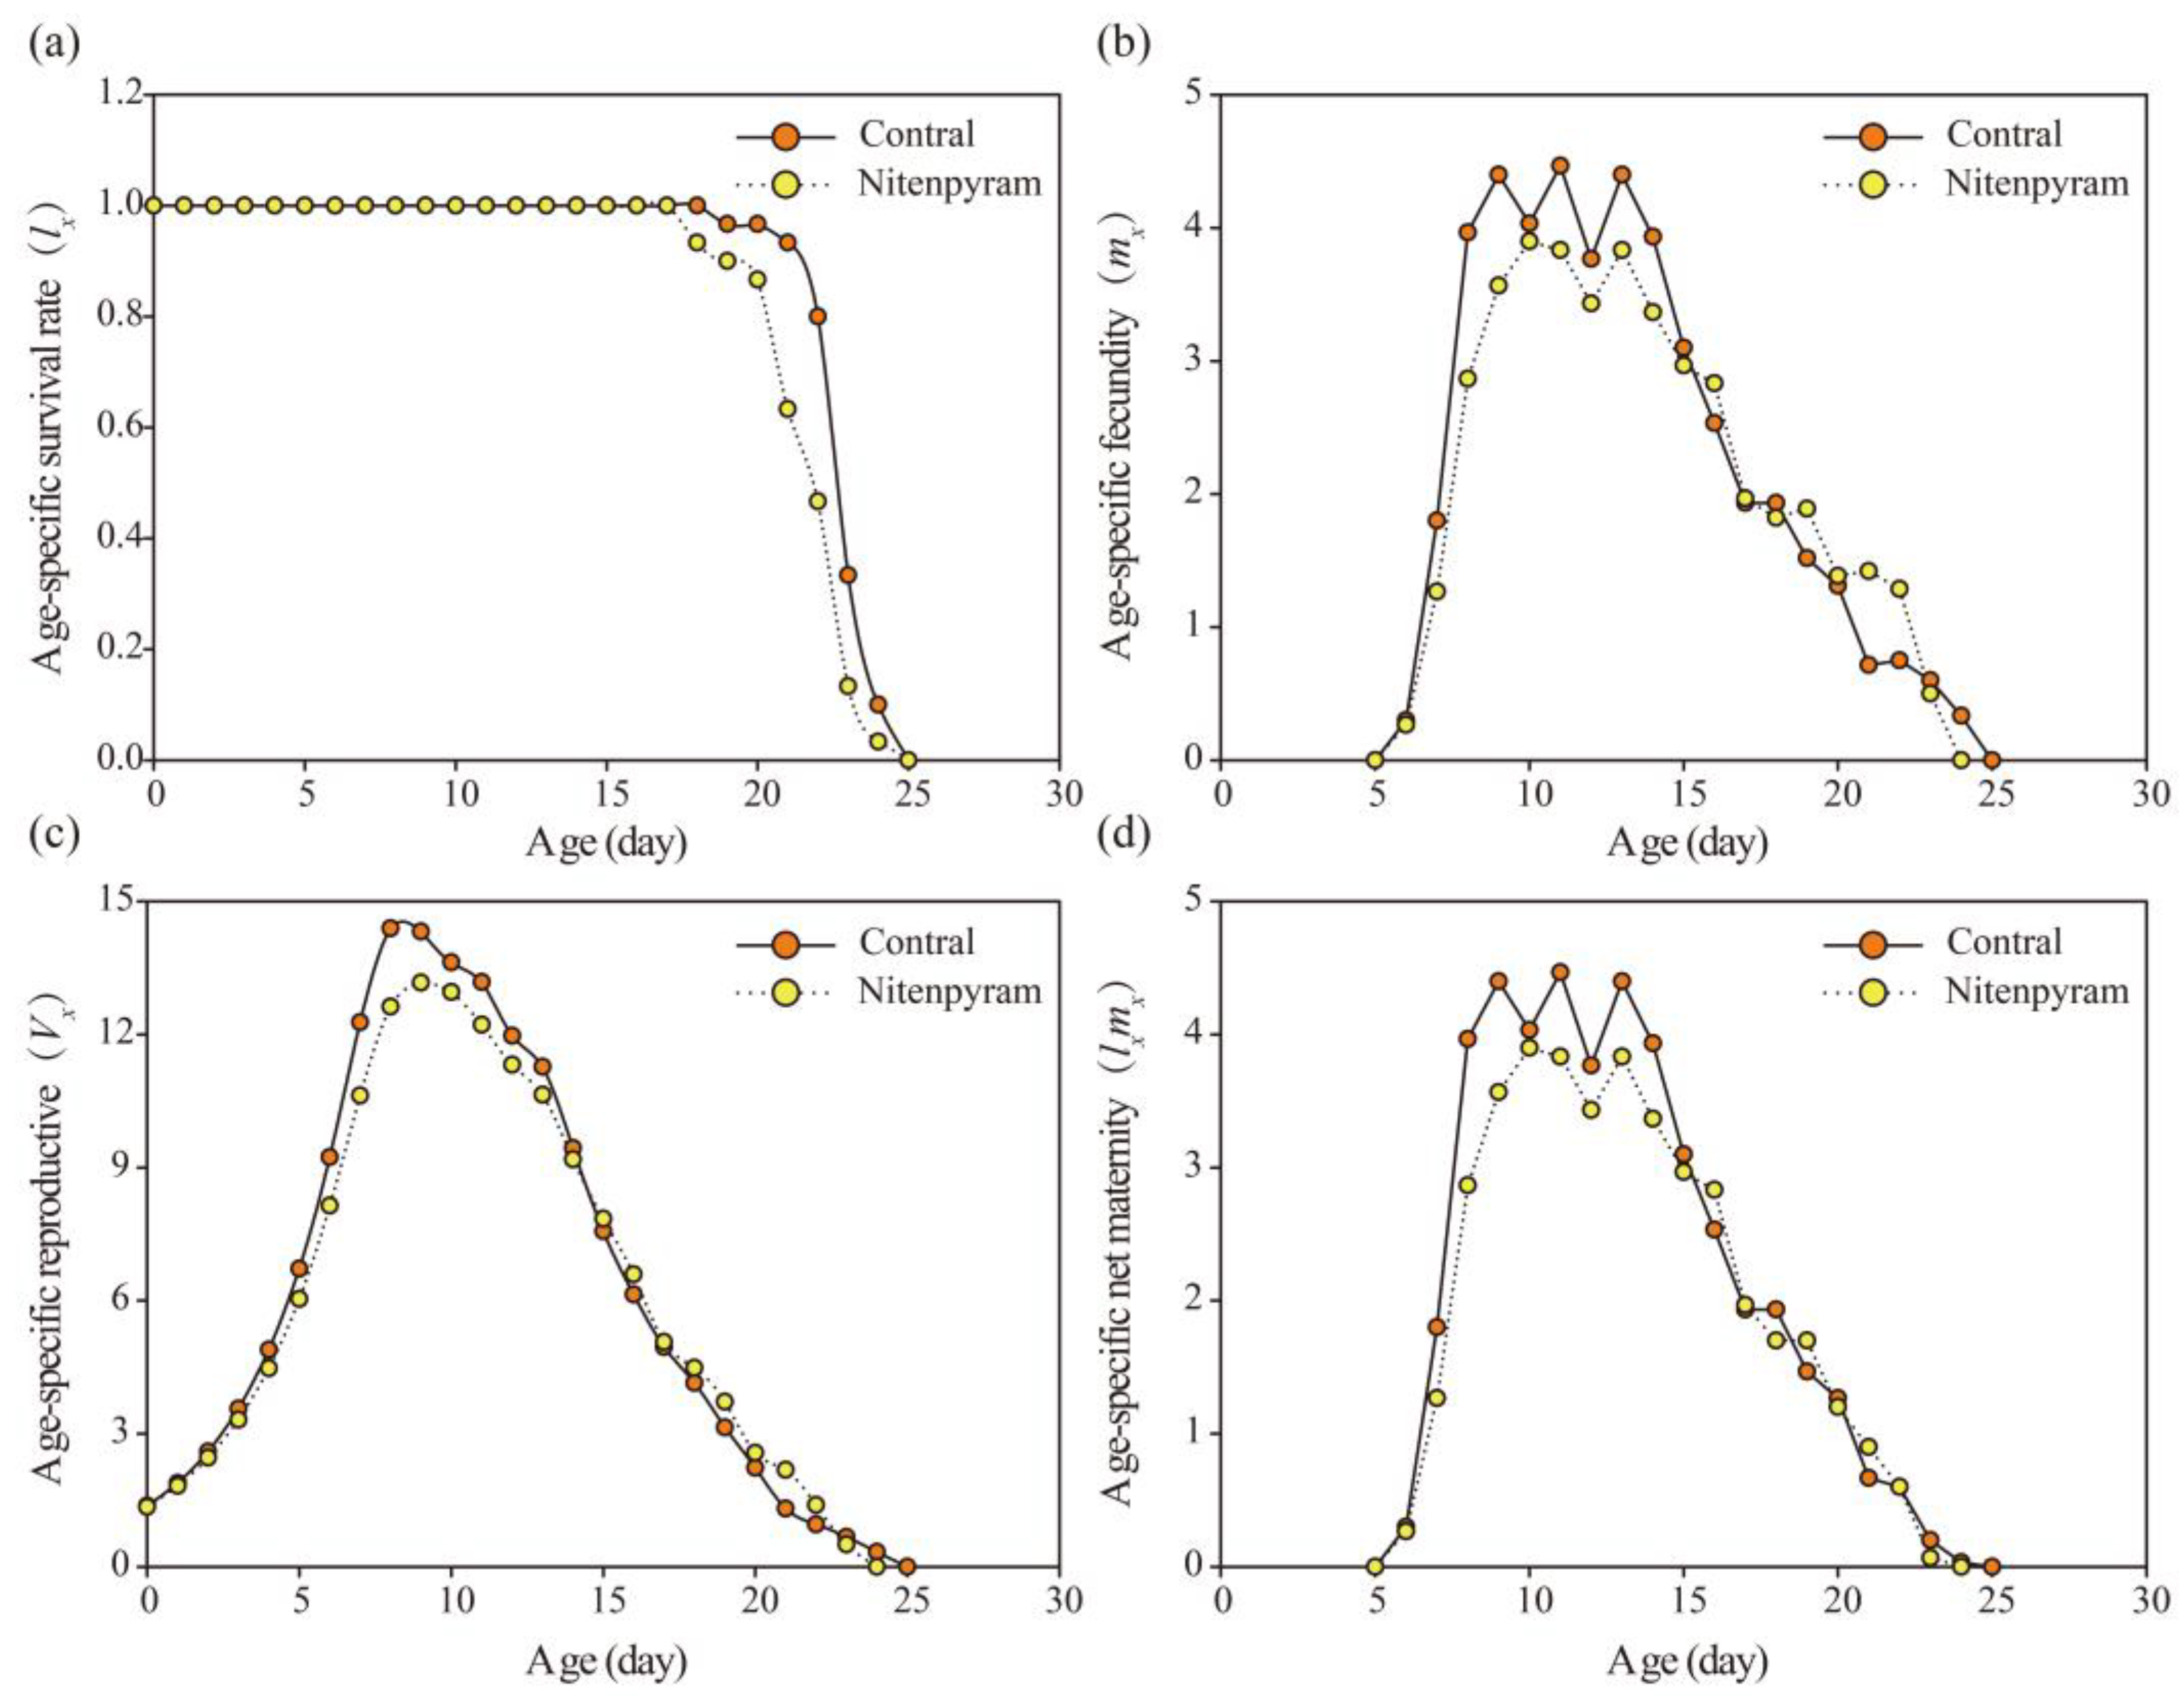

| Treatment | Slope ± SEa | LC20 (mg·L−1) (95% CL)b |
LC50 (mg·L−1) (95% CL)b |
R2 |
|---|---|---|---|---|
| Nitenpyram | 1.41±0.31 | 2.49 (0.78-4.31) |
10.12 (6.34-17.08) |
0.98 |
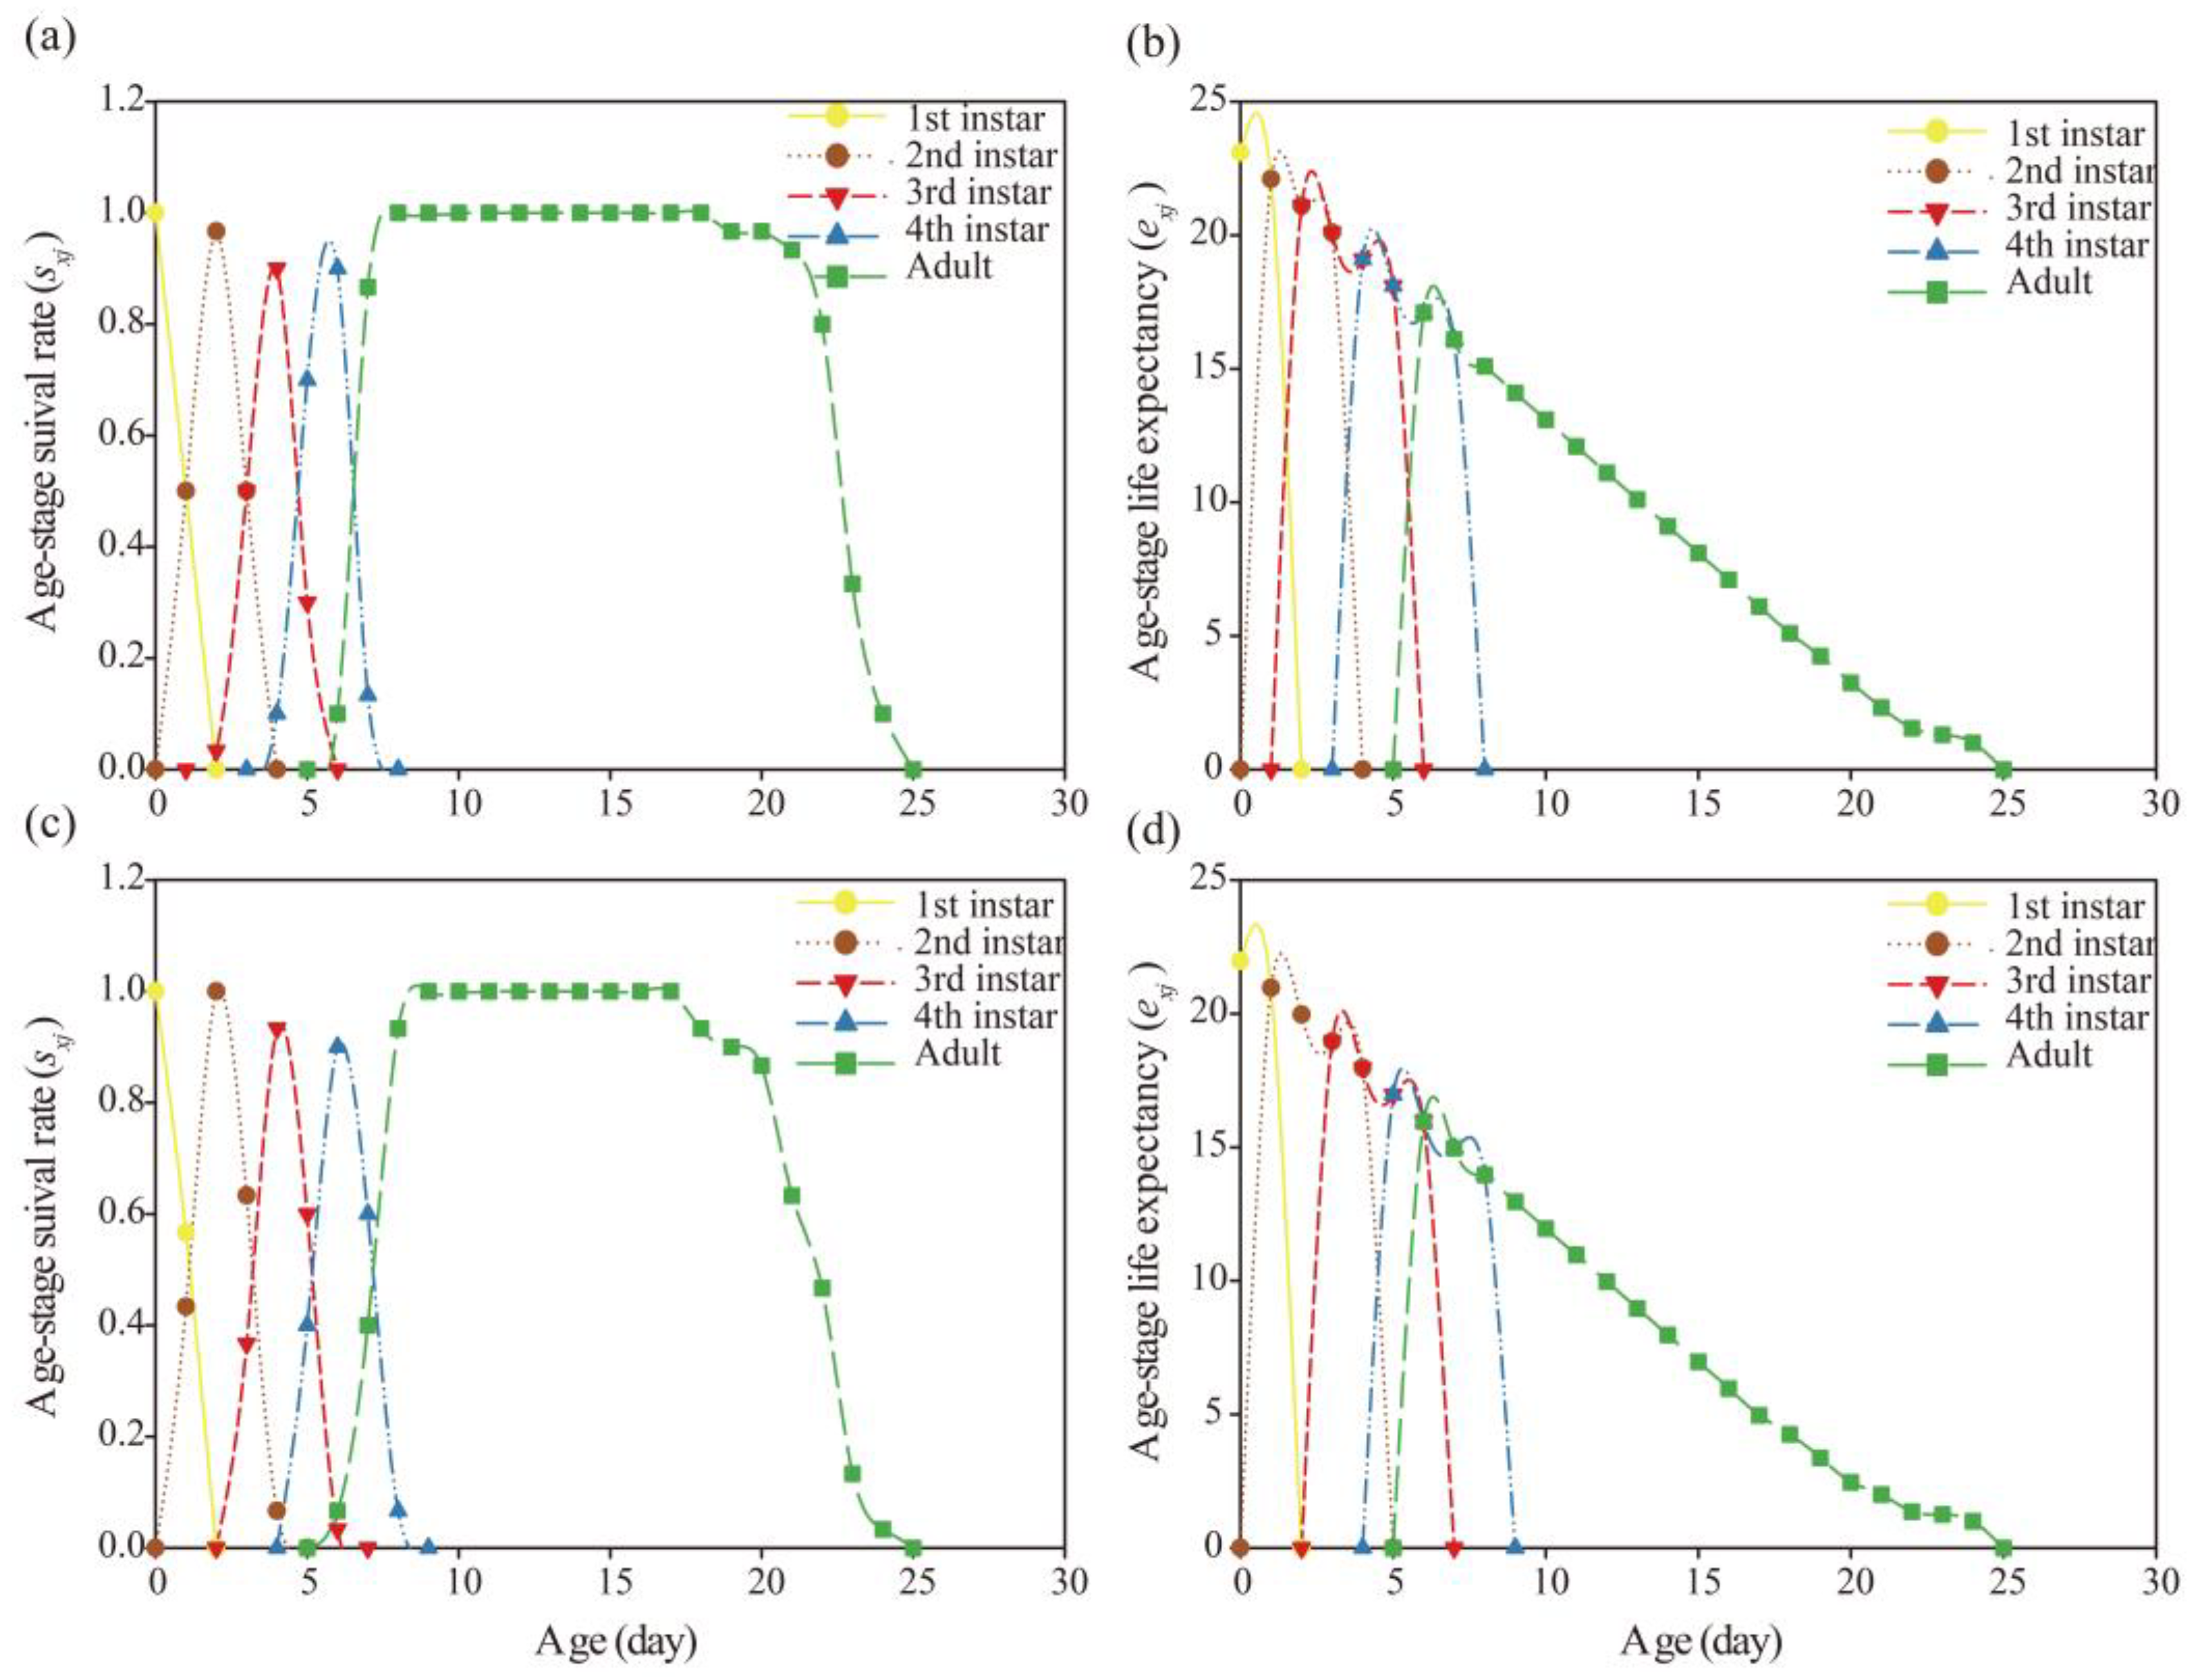
| Treatments | First instar (d) | P | Second instar (d) | P | Third instar (d) | P | Fourth instar (d) | P | Pre-adult (d) | P | APOP (d) | P | TPOP (d) | P | Longevity (d) | P | Fecundity | P | |
|---|---|---|---|---|---|---|---|---|---|---|---|---|---|---|---|---|---|---|---|
| G1 | Control | 1.60±0.09 | 0.20 | 1.87±0.09 | 0.02 | 1.77±0.09 | 0.56 | 1.90±0.09 | 0.01 | 7.13±0.11 | <0.001 | 0.27±0.08 | <0.001 | 7.40±0.14 | <0.001 | 23.10±0.28 | 0.01 | 45.67±1.10 | <0.001 |
| Nitenpyram | 1.77±0.08 | 2.17±0.08 | 1.83±0.07 | 2.27±0.10 | 8.03±0.12 | 0.00±0.00 | 8.03±0.12 | 22.03±0.31 | 39.83±1.20 | ||||||||||
| G2 | Control | 1.50±0.09 | 0.70 | 1.97±0.11 | 0.19 | 1.73±0.08 | 0.08 | 1.83±0.08 | 0.29 | 7.03±0.09 | <0.001 | 0.13±0.06 | 0.69 | 7.17±0.11 | 0.004 | 23.10±0.22 | 0.002 | 44.80±0.99 | 0.001 |
| Nitenpyram | 1.57±0.09 | 2.13±0.06 | 1.93±0.07 | 1.97±0.07 | 7.60±0.13 | 0.10±0.05 | 7.70±0.14 | 21.97±0.30 | 40.27±1.03 | ||||||||||
| G3 | Control | 1.60±0.09 | 0.79 | 1.97±0.06 | 0.53 | 1.87±0.06 | 0.60 | 1.97±0.06 | 0.48 | 7.40±0.12 | 0.11 | 0.07±0.05 | 0.81 | 7.47±0.12 | 0.21 | 22.13±0.25 | 0.04 | 43.17±1.23 | 0.34 |
| Nitenpyram | 1.57±0.09 | 1.87±0.15 | 1.80±0.07 | 1.87±0.10 | 7.10±0.14 | 0.10±0.05 | 7.20±0.17 | 22.87±0.25 | 44.63±0.90 | ||||||||||
| Treatments | R0 | P | rm | P | λ | P | T | P | |
|---|---|---|---|---|---|---|---|---|---|
| G1 | Control | 45.67±1.10 | <0.001 | 0.31±0.004 | <0.001 | 1.36±0.006 | <0.001 | 12.29±0.19 | 0.02 |
| Nitenpyram | 39.83±1.20 | 0.29±0.004 | 1.33±0.005 | 12.88±0.15 | |||||
| G2 | Control | 44.80±0.99 | 0.001 | 0.32±0.004 | 0.006 | 1.37±0.006 | 0.006 | 11.97±0.16 | 0.13 |
| Nitenpyram | 40.27±1.03 | 0.30±0.005 | 1.35±0.007 | 12.34±0.19 | |||||
| G3 | Control | 43.17±1.23 | 0.34 | 0.31±0.004 | 0.070 | 1.36±0.006 | 0.07 | 12.26±0.17 | 0.16 |
| Nitenpyram | 44.63±0.90 | 0.32±0.005 | 1.38±0.007 | 11.90±0.19 | |||||
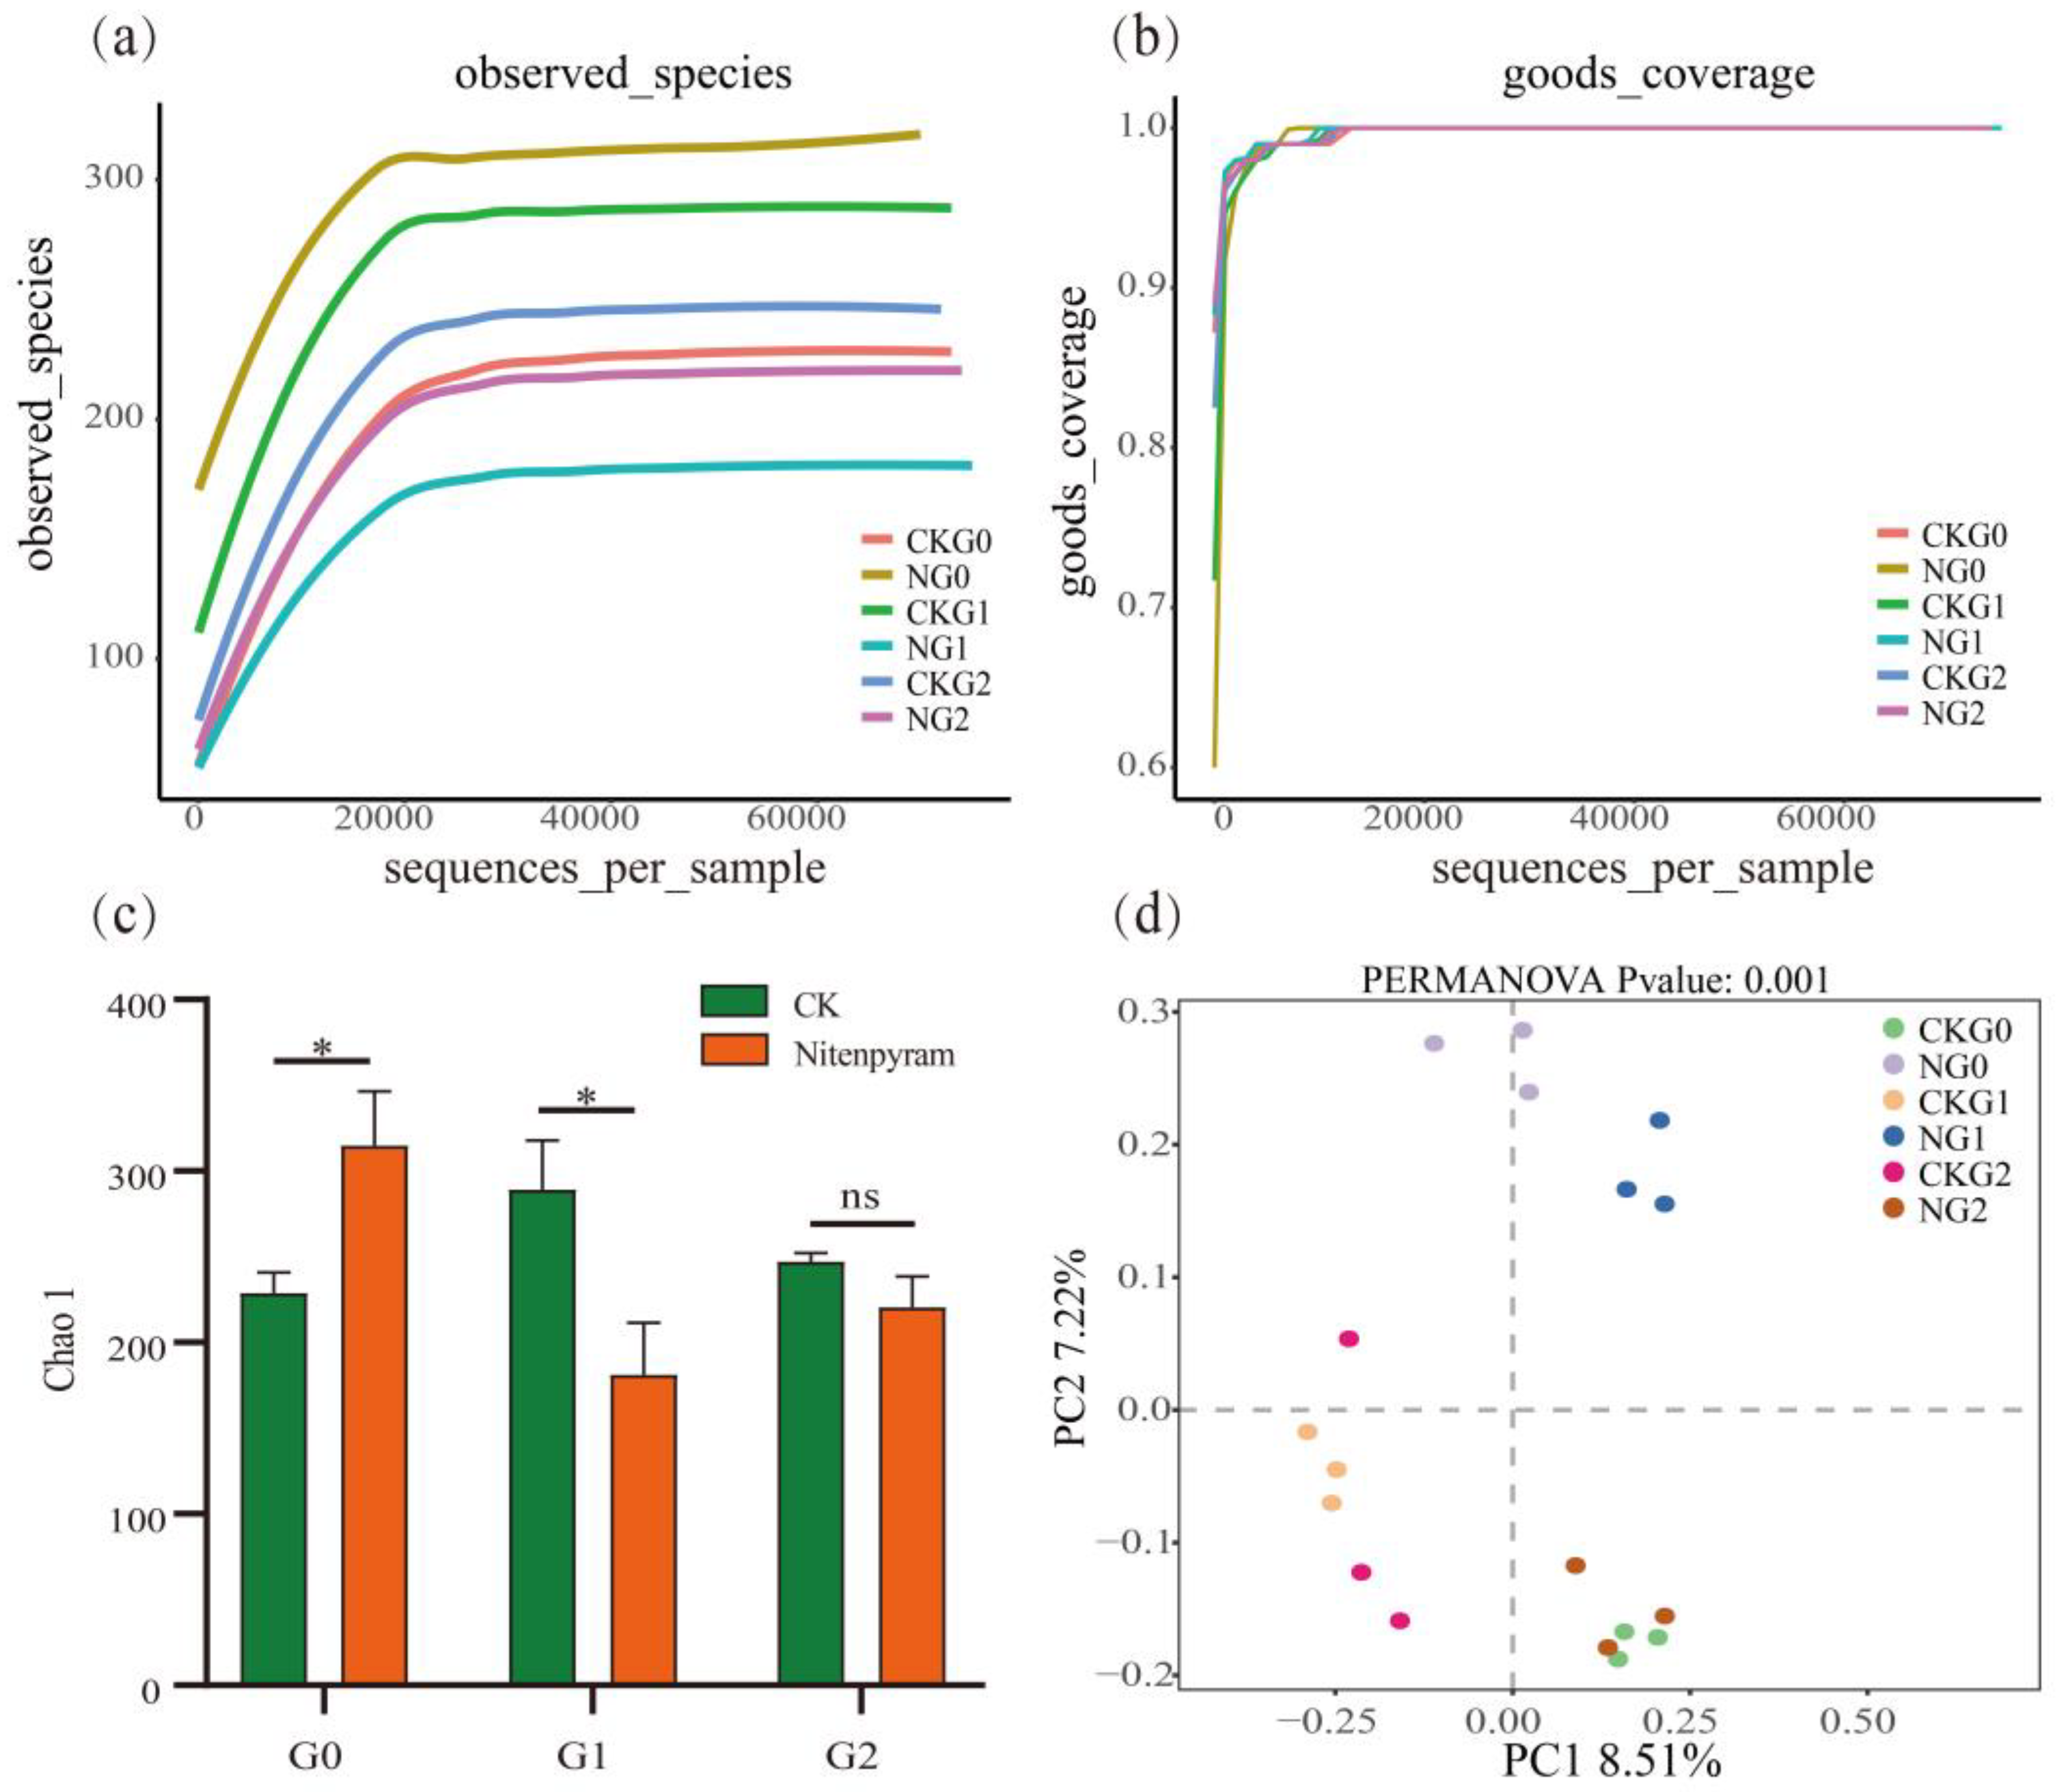
| Samples | Raw_reads | filtered | ASV_counts | chao1 | goods_coverage | shannon | observed_species | simpson | ACE |
|---|---|---|---|---|---|---|---|---|---|
| CK-G0 | 79947 | 76925 | 229 | 228.96 | 1.00 | 1.22 | 228.60 | 0.27 | 228.06 |
| N-G0 | 79587 | 76499 | 315 | 314.75 | 1.00 | 3.86 | 314.63 | 0.72 | 316.08 |
| CK-G1 | 80480 | 77255 | 289 | 289.02 | 1.00 | 3.06 | 288.90 | 0.71 | 289.35 |
| N-G1 | 81553 | 78381 | 181 | 180.94 | 1.00 | 1.06 | 180.77 | 0.23 | 180.97 |
| CK-G2 | 79600 | 76584 | 247 | 247.34 | 1.00 | 2.37 | 247.30 | 0.64 | 247.43 |
| N-G2 | 79847 | 76721 | 220 | 220.54 | 1.00 | 1.10 | 220.23 | 0.22 | 220.24 |
Disclaimer/Publisher’s Note: The statements, opinions and data contained in all publications are solely those of the individual author(s) and contributor(s) and not of MDPI and/or the editor(s). MDPI and/or the editor(s) disclaim responsibility for any injury to people or property resulting from any ideas, methods, instructions or products referred to in the content. |
© 2024 by the authors. Licensee MDPI, Basel, Switzerland. This article is an open access article distributed under the terms and conditions of the Creative Commons Attribution (CC BY) license (http://creativecommons.org/licenses/by/4.0/).


