1. Introduction
Image and video compression standards play an essential role in modern media communication, enabling the efficient storage and transmission of digital content. However, the compression process unavoidably introduces some degree of information loss, resulting in image or video distortion that can be perceived by human observers. To improve the subjective quality of compressed media, many techniques based on the perception of the Human Visual System (HVS) have been developed.
The quantization stage is a crucial step in the image and video coding chain, where information is discarded to reduce the amount of data to be stored or transmitted. This process introduces artifacts and distortions that are not present in the original source. As a consequence, it is crucial to consider the limitations and properties of the HVS to develop efficient compression algorithms.
The masking properties of the HVS have been extensively studied to provide mechanisms to quantize the information of image areas where reconstruction errors are not perceived by the HVS [
1]. The HVS is not always able to detect distortions when they are masked by texture, contrast, luminance, and other factors. Therefore, these masking properties can be used to reduce the perceptual impact of compression artifacts.
Contrast Masking is one of the most commonly used HVS-based techniques to reduce compression artifacts. It involves incorporating the Contrast Sensitivity Function (CSF) during the quantization stage of image and video codecs. The CSF shows that the HVS is unable to detect differences between objects and their background under certain conditions of luminance, distance, or spatial frequency [
2,
3,
4,
5]. Compression artifacts can be masked under these conditions because they act as foreground, while the scene acts as the background.
Texture and luminance masking are two techniques that also exploit properties of the HVS to reduce compression artifacts. Texture masking takes advantage of the fact that the presence of texture in some areas of the image can mask some of the reconstruction errors, making it more difficult to detect a compression artifact in a textured area than in a homogeneous one. On the other hand, luminance masking is based on the observation that compression artifact errors are less noticeable in areas with high or low luminance. This means that errors in dark or bright regions of an image are less visible to the HVS, allowing for the reduction of the amount of information to be encoded without significant perceptual loss.
2. Related Work
Tong
et al. [
6] proposed a perceptual model of texture and luminance masking for images compressed using the JPEG standard [
7]. The authors provided a method to classify the transform blocks according to their content type, namely: texture blocks (containing a lot of spatial activity), edge blocks (containing a clear edge as primary feature) or plain blocks (generally smooth, with low spatial activity). The authors claim that the human sensitivity to error is, in general, inversely proportional to the spatial activity, and is extremely sensitive to low spatial activity areas (plain blocks). To perform this classification, the authors use an algorithm that is based on the weight of the DCT coefficients grouped by their frequency or position within the transformed block. Finally, the degree of additional quantization that should be applied to each block is determined in such a way that the distortions produced by increments in quantization remain masked.
Tong’s model has been modified and refined by other authors. For example, Zhang
et al. [
8] built a luminance model and block classifier using the mean of the DCT coefficients. Zhang
et al. also considered the intra-band masking effect, which refers to the imperceptible error tolerance within the sub-band itself. In other words, a different quantization value is applied for each coefficient within the 8×8 block, depending on the block classification and the coefficient position in the block.
Most models are based on partitioning the image into 8×8 blocks [
8,
9,
10], however Ma
et al. [
11] extend the classification algorithm to block sizes of 16×16 to adapt for higher image resolutions. Furthermore, the proposed classification model was performed in the pixel domain. This is based on the Canny edge detector and applies an adaptive quantization scheme that depends on the block size. The problem of edge detection algorithms lies in finding the optimal threshold value: choosing a low value will cause very small edges to be detected, while choosing a high value will skip important edges [
12]. Several authors [
13,
14] have used a 4×4 reduction of the classifier proposed in [
6].
Regarding the video coding standards, several studies have incorporated perceptual coding schemes in their reference software. In MPEG-2 Test Model 5 [
15], a QP (Quantization Parameter) offset based on the spatial activity is defined, which is calculated as a function of the variance of pixels within the macroblock. Tang
et al. [
16] proposed a bit allocation technique for the JM7.6 Reference Software of the H.264/AVC video coding standard by adopting a novel visual distortion sensitivity model that is based on motion attention and texture structure.
From version 16 of the HEVC Reference Software encoder description [
17], there is an option called Adaptive QP that varies the quantization parameter for each coding unit (CU) to provide improved perceptual image quality. This algorithm is based on the algorithm used in MPEG-2 TM5. Prangnell
et al. [
18] proposed a modified version of the Adaptive QP algorithm by extending the spatial activity calculation to the chrominance channels and obtained better performance than when using only the luminance. In [
19], Kim
et al. designed a perceptual video coding scheme for HEVC based on Just Noticeable Differences (JND) models—including contrast, texture and luminance masking—in both transform and pixel domain. JND models are based on determining the threshold under which the HVS is unable to perceive differences from the original source. The main drawback of [
19] is that the behavior of the RDO-based mode decision is modified, and therefore corrective factors are required to compensate for the distortion introduced by JND.
Wang
et al. [
20] proposed a block level adaptive quantization (BLAQ) for HEVC, where each CU has its own QP adapted to the local content. The author does not use masking techniques to determine the QP but it is obtained by a brute force algorithm. To reduce the complexity of the algorithm, the authors modified the rate-distortion cost function that gives priority to the distortion, as measured in PSNR. Xiang
et al. proposed in [
21] a novel adaptive perceptual quantization method based on and adaptive perceptual CU early splitting algorithm to address the spatial activity and Lagrange multiplier selection problems in the HEVC quantization method. In [
22], Zhang
et al. proposed a method to predict the optimal QP value at CTU level by employing spatial and temporal combined masks using the perception-based video metric (PVM). Because the default CTU block size is
, this work does not take advantage of HEVC quadtree partitioning when applying masking techniques in smaller regions.
Recent advancements in the development of contrast masking models using deep learning have been reported in literature. Marzuki
et al. [
23] proposed an HEVC perceptual adaptive quantization based on a deep neural network. They determine the QP at frame-level, and therefore do not take advantage of texture masking in scenes with multiple texture types. Bosse
et al. [
24] proposed a method of distortion-sensitive bit-allocation in image and video compression based on distortion sensitivity estimated using a deep convolutional neural network (CNN).
An important aspect to be considered when including masking in an encoder is the way that the block type or the adaptive quantization value to be applied in each block is signaled in the bit-stream. Most of the cited authors use the thresholds that are defined by the Just Noticeable Differences (JND) model to discard the coefficients below a certain value (i.e., being included in the image or video encoding algorithm) without sending additional information to the decoder. In [
6], Tong
et al. analyzed the performance of both methods, namely the first method that does not send extra information and the second method that requires extra side information to be sent to the decoder. They concluded that the latter method achieves a better rate-distortion (RD) performance. Studies that are based on modifying the QP value at slice or block level often make use of the delta QP parameter, which is the difference between the current QP and the previously encoded QP.
Many of the works that have been cited so far make use of the Peak Signal-to-Noise Ratio (PSNR) distortion metric to evaluate RD performance. However, it is well-known that the PSNR metric does not accurately reflect the perceptual assessment of quality [
25,
26]. Consequently, in studies, such as [
11], subjective tests were carried out using the Difference Mean Opinion Score (DMOS) as an indicator of perceptual quality. However, given that PSNR is not an adequate metric to properly evaluate the impact of perceptual techniques, we decided to use some objective metrics that attempt to characterize the subjectivity of the HVS, such as Structural Similarity (SSIM) [
27], Multi-Scale SSIM (MS-SSIM) [
28] and PSNR-HVS-M [
29], to measure their RD performance.
The SSIM and the MS-SSIM metrics are based on the hypothesis that the HVS is highly adapted to extract structural information from the scenes. Both metrics consider the luminance, contrast, and structural information of the scenes, whereas MS-SSIM also considers the scale. The PSNR-HVS-M metric, which is a modified version of PSNR, considers the contrast sensitivity function (CSF) and the between-coefficient contrast masking of DCT basis functions.
In this work, we present a novel scheme of texture and contrast masking to be applied in the HEVC Reference Software [
17]. For the contrast masking model, we start from the frequency-dependent quantization matrices that are included in the HEVC Reference software for blocks from 8×8 to 32×32 sizes. In addition, we add a new 4×4 weighting matrix [
30] that achieves an additional rate reduction while maintaining the perceptual quality. For the texture masking model, we make use of the mean directional variance (MDV) metric and we use the support vector machine (SVM) to perform the block classification (plain, edge or texture). The QP offset value is calculated as a function of the block classification and its texture energy, in a similar way as that proposed by Tong
et al. [
6].
To demonstrate the potential of this novel scheme, we have encoded a set of well-known test sequences and analyzed their performance in terms of rate and distortion. The results are presented with the Bjøntegaard-Delta Rate (BD-rate) model [
31], using the SSIM, MS-SSIM and PSNR-HVS-M distortion metrics.
The main innovations provided by this work are the following ones: (a) an improved Contrast Masking method that covers all HEVC available block sizes (4×4 to 32×32) that includes a new efficient quantization matrix; (b) a new block classification method for block texture masking based on the mean directional variance (MDV) that efficiently classifies every block in texture, edge or plain; (c) a new QP offset calculator for the HEVC Adaptive QP tool, based on the block texture energy and its classification. All these innovations define a novel perceptual quantizer based on the one proposed in the HEVC reference software.
The rest of this paper is structured as follows. The proposed contrast and texture masking models for the HEVC video coding standard are explained in
Section 3.
Section 4 gives the results when masking techniques are applied to a series of well-known video sequences. Finally,
Section 5 summarizes the conclusions of this study and makes some recommendations for future research.
3. Proposed HEVC Perceptual Quantizer
In this section, the details of the new perceptual quantizer for the HEVC video coding standard will be described. We will first describe how CSF masking is applied in HEVC (scaling list tool) followed by the proposed improvements. Then, after applying the CSF masking, we will use a texture masking over-quantization scheme that is based on (a) the use of a new block classifier, and (b) an optimized over-quantizer that depends on the block type and its energy.
3.1. Proposed Contrast Sensitivity Function
Contrast masking is a perceptual compression technique that exploits the visual adaptation of our HVS to contrast. This adaptation depends on the amount of contrast between an object and its surroundings (or background), the distance and the spatial frequency. Several studies have been performed to characterize the CSF using subjectively measured human contrast thresholds for different spatial frequencies [
2,
3,
4]. In this regard, the Mannos and Sakrison model [
5] is one of the most popular in the field of image and video coding.
The HEVC standard uses a frequency-dependent quantization to implement CSF masking [
32]. Depending on its contrast sensitivity importance, a different amount of quantization is applied to each frequency coefficient of a block (i.e., the higher the perceptual importance, the lower the corresponding quantization level).
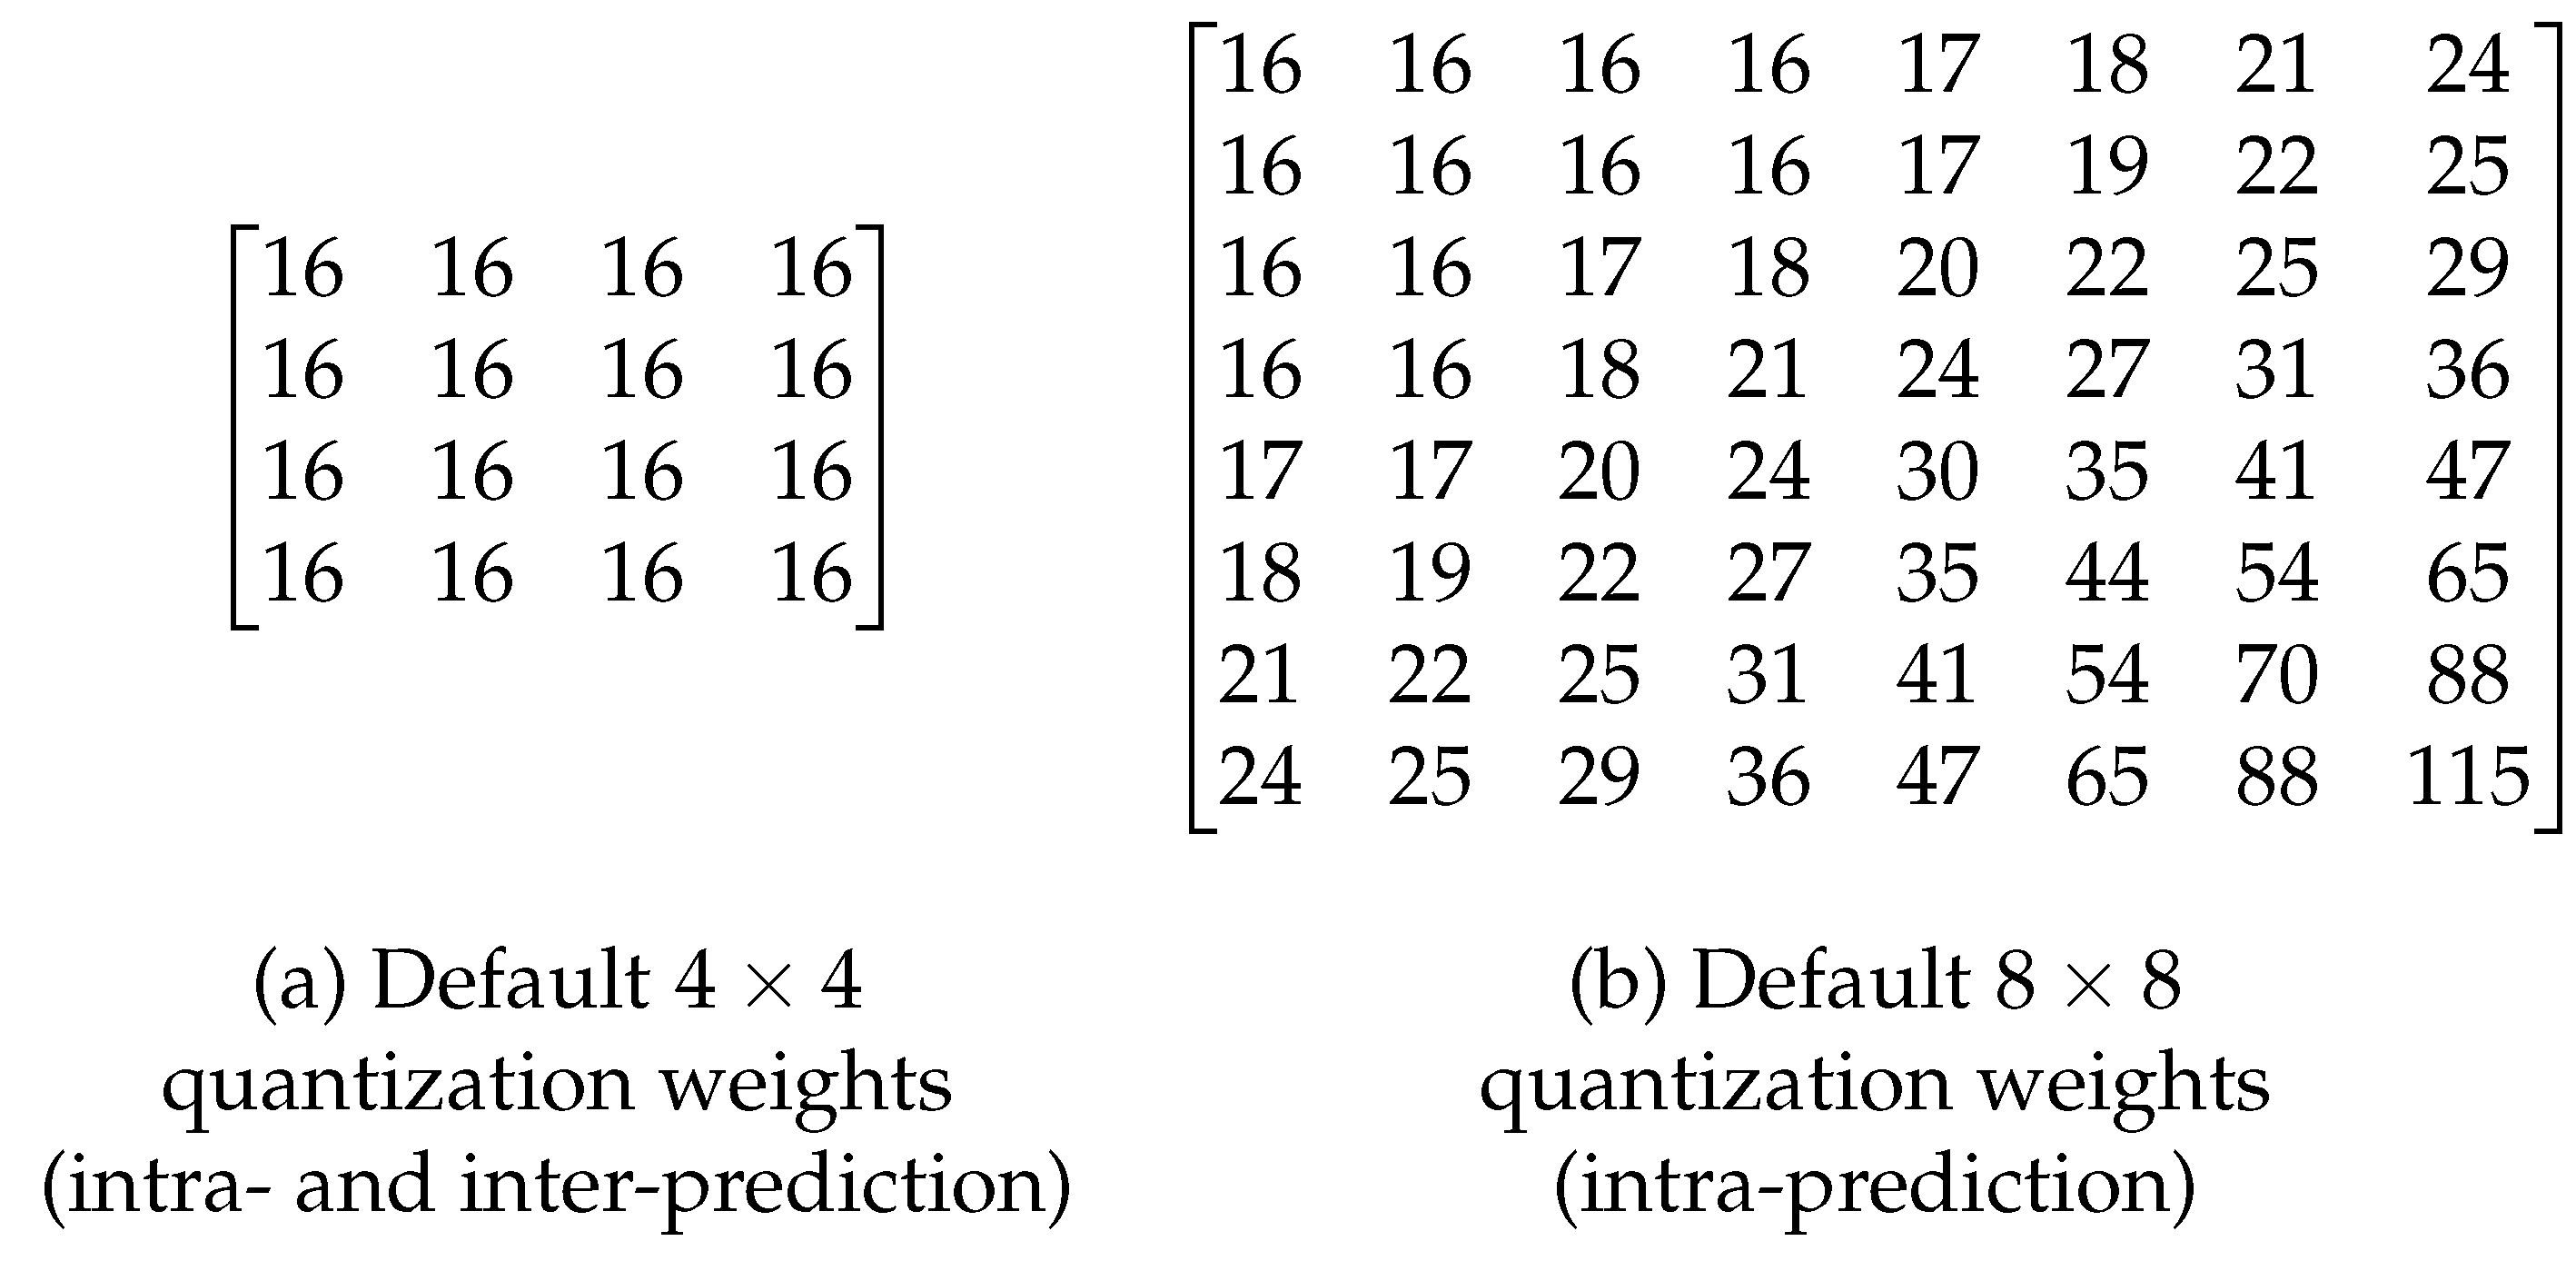
With this goal in mind, the HEVC reference software defines the use of static non-uniform quantization matrices, which are also called weighting matrices, by setting the
ScalingList (SCL) option to 1 (default is 0) in the coding configuration parameters. These weighted quantization matrices are defined for the intra- and inter-predictions, as well as for the luminance component and the chrominance components. In terms of CUs, non-uniform quantization matrices are only defined for CUs of
(see
Figure 1b). Meanwhile, for
and
, the matrices are obtained by upsampling, using a replication of the
matrix. In the case of
CUs, the HEVC reference software does not define any weighting matrix, and therefore it uses a uniform matrix (see
Figure 1a).
In this work, we include a new
weighting matrix to increase the compression level for small blocks while maintaining the same perceptual quality. Instead of deriving the matrix weights by downsampling the default quantization matrix of size 8×8, as the standard does for the higher resolution matrices, we propose to determine the weights of the
matrix from the study presented in [
30]. The author proposes the use of the CSF model of Mannos and Sakrison [
5] (Equation (
1)), where
f is the radial frequency in cycles/degree (cpd), assuming the best viewing conditions in which defects are detected earlier. In other words, using a high resolution display and a short viewing distance. Coding or compression defects may be masked by the content and by visual capacity at higher resolution and longer viewing distance.
Assuming a display resolution of 600 pixels per inch (ppi) and a viewing distance of 12.23 inches, the maximum frequency represented in the signal is
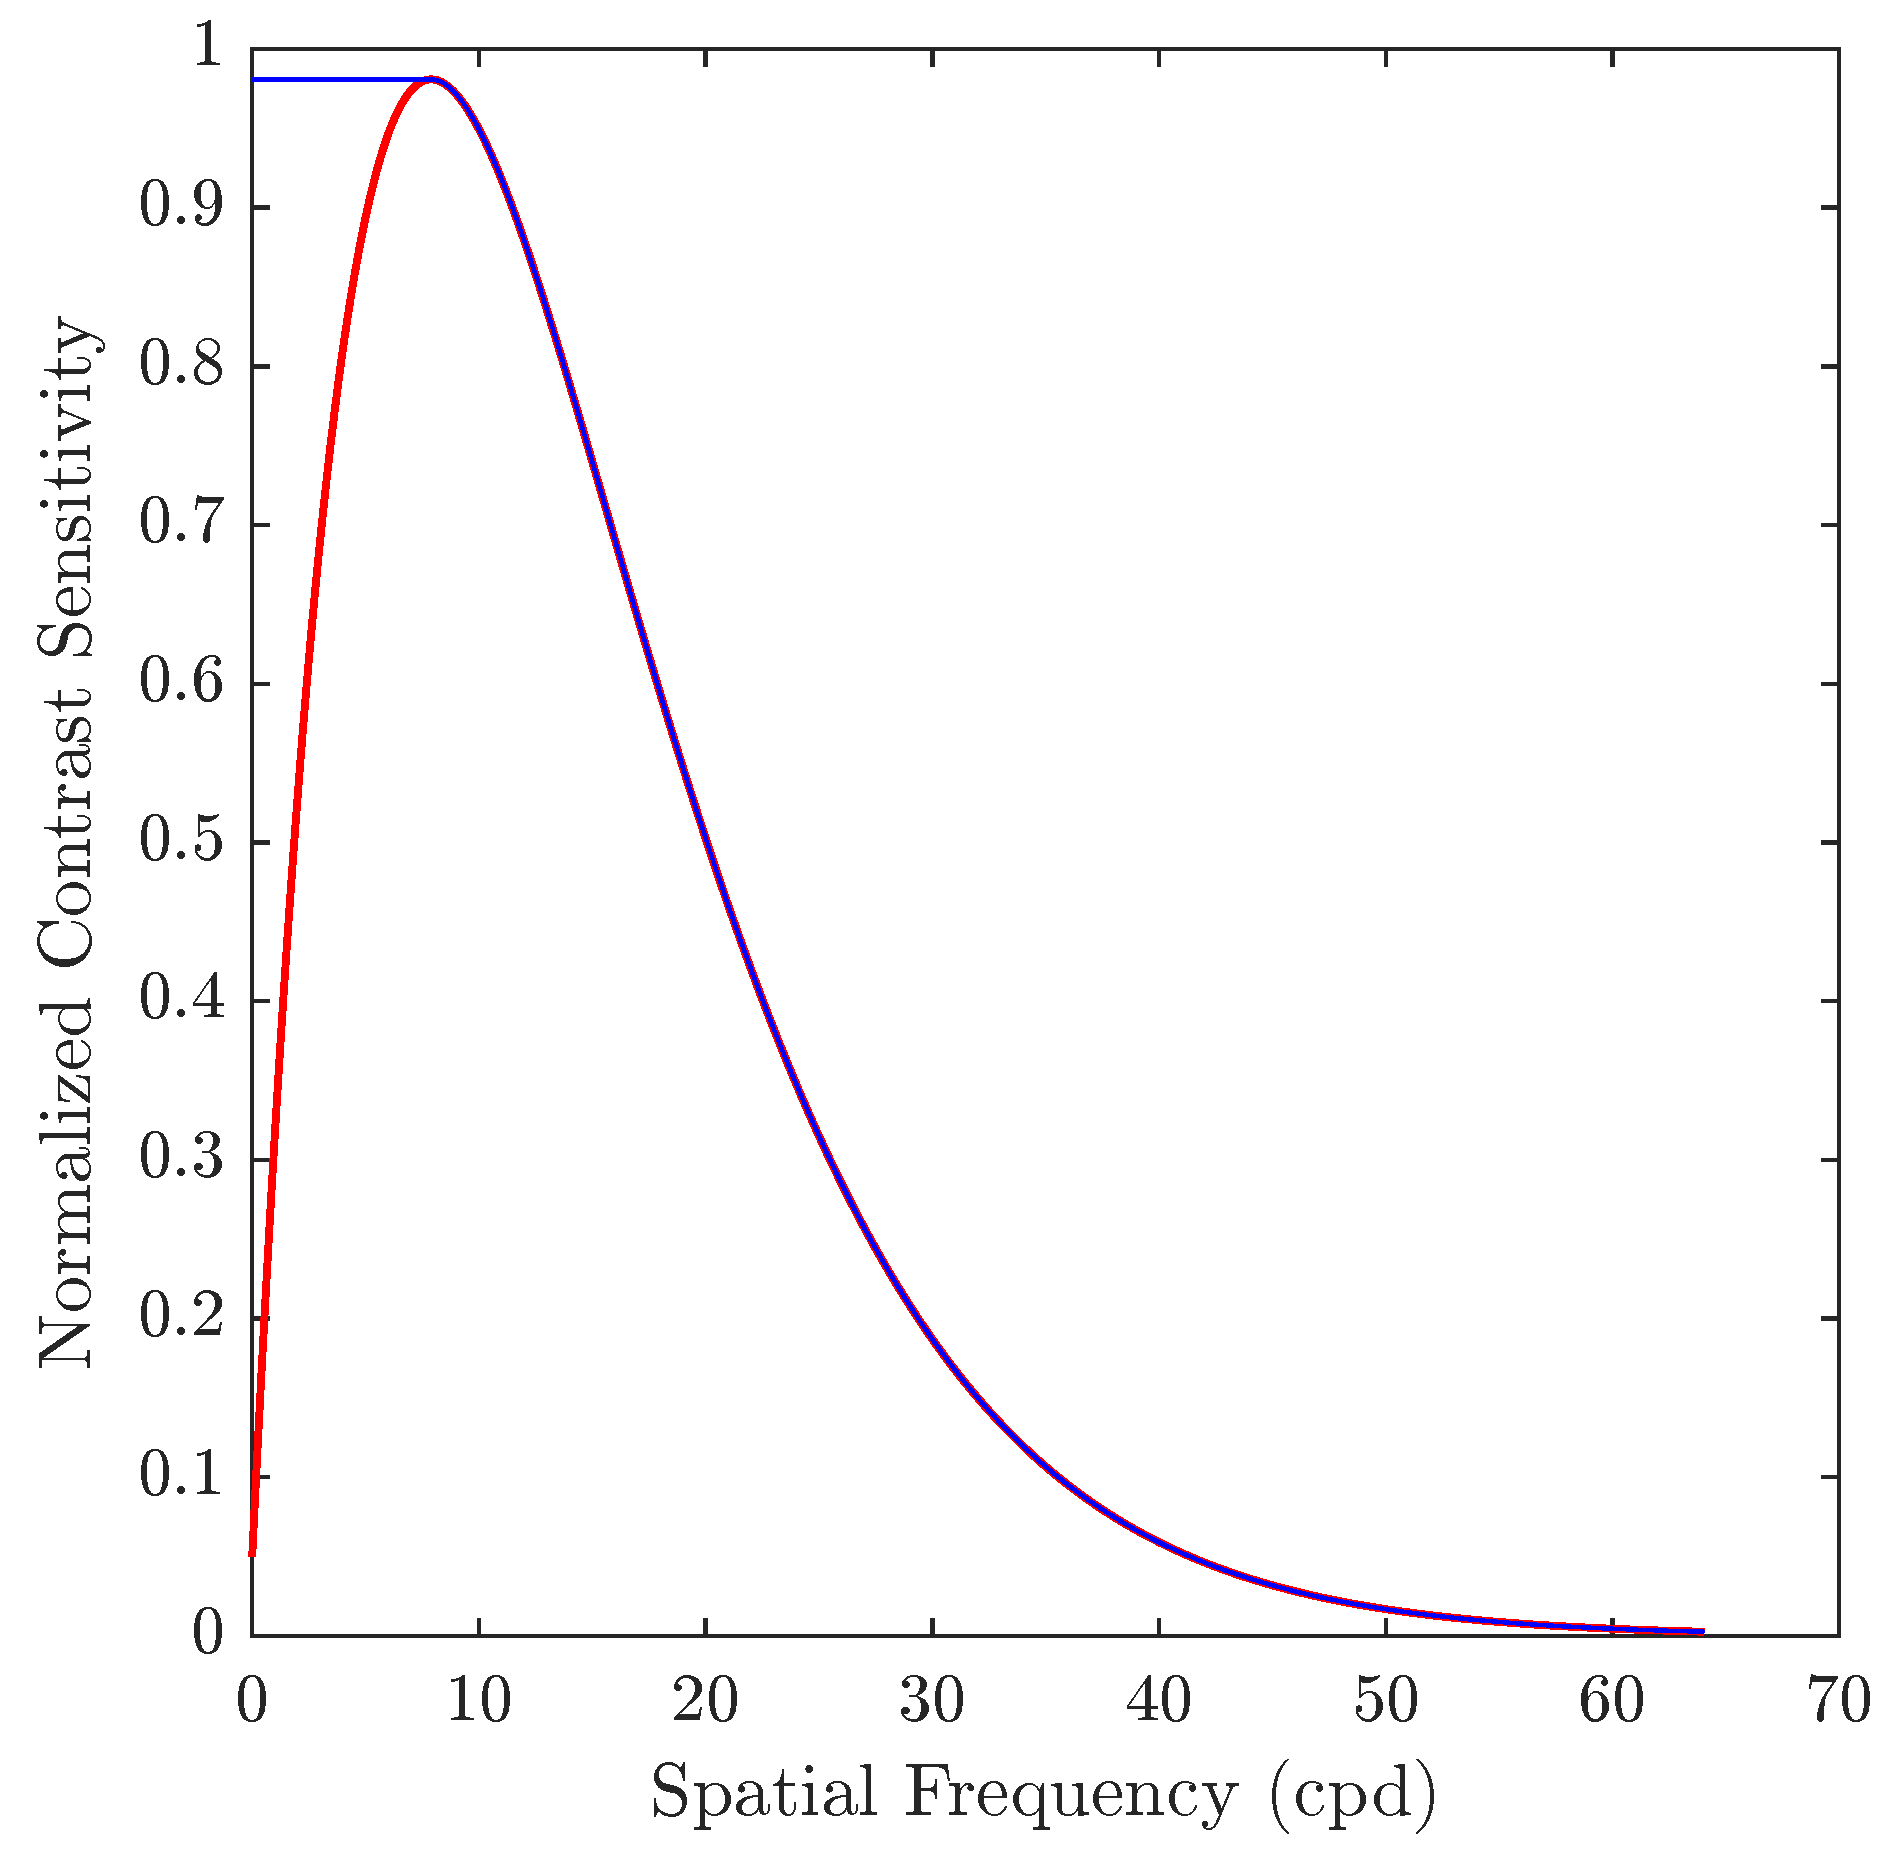
cpd. The CSF curve obtained with Equation (
1) is shown in
Figure 2.
The red curve corresponds to the definition of CSF according to Equation (
1). As we can see, the HVS is most sensitive in an intermediate region, acting as a bandpass filter, while it is less sensitive to very low and very high frequencies. In addition, as shown with the blue curve in
Figure 2, spatial frequency values below the maximum sensitivity peak have been saturated. This is done to preserve the information of the coefficients close to the DC component, including this one, because it is in this region where most of the information (energy) is concentrated after applying the DCT to a block.
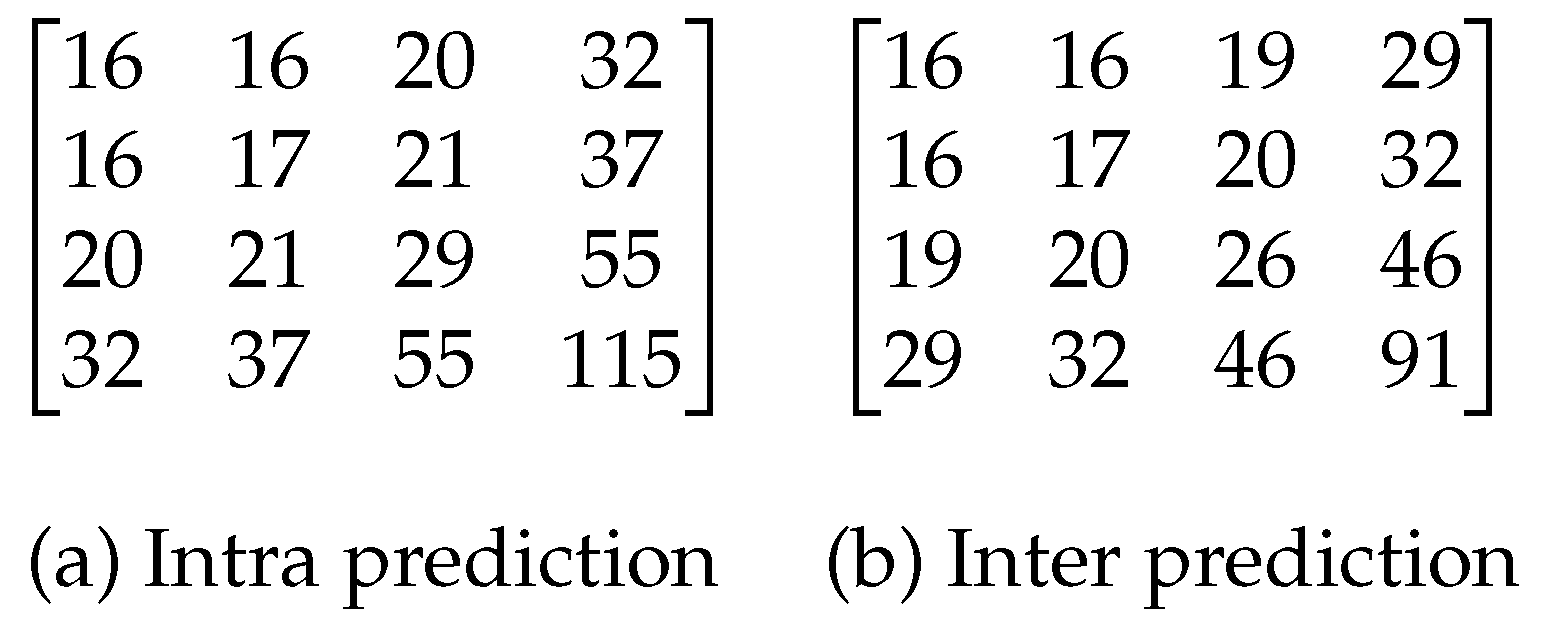
After calculating the spatial frequency corresponding to each coefficient of the matrix, and applying the scaling factor given by the HEVC standard for quantization matrices, we finally obtain the proposed 4×4 weighting matrices (
Figure 3).
For the remaining block sizes, we use the default weighting matrices that were proposed by the HEVC standard. To implement our proposal in the HEVC Reference Software, we set the ScalingList parameter to 2. This allows us to define a custom weighting matrix scheme from a text file, which is identified by the ScalingListFile parameter.
To measure the impact of this optimization, we have driven an experimental test using the HEVC Reference Software version 16.20 [
33]. The test video sequences (see
Table 1) from HEVC conformance test proposal [
34] were encoded with the SCL parameter set to 1 (default weighting matrices) and 2 (custom weighting matrix scheme), and the gains (BD-rate) were obtained compared to the default encoding (SCL set to 0). The other coding tools have been left with their default values, with the exception of the transform skip (TransformSkip) parameter, which has been disabled for all sequences except those of class F to maximize the perceptual response, as stated in [
35].
The average BD-rate performance (negative values mean gains) for different perceptual metrics is shown in
Table 2. Low BD-rate gains are achieved (always below
) by enabling only the weighting matrices included in the HEVC standard (SCL = 1). Even for low-resolution sequences (classes C and D), BD-rate losses are observed for some metrics, such as for SSIM metric in class D sequences, where a loss of
is introduced.
As shown in
Table 2 (SCL = 2), our proposal obtains a remarkable increase in BD-rate gains for all cases. The improvement is between
and
on average for all classes. The SSIM metric scores are lower when compared to the other metrics at low-resolution video sequences (classes C and D), while PSNR-HVS-M obtains the highest BD-rate gains (above
) for these sequences. Meanwhile, there seems to be a consensus on all metrics for class E (video-conference applications) and F (synthetic or artificial) sequences because they all obtain broadly similar results.
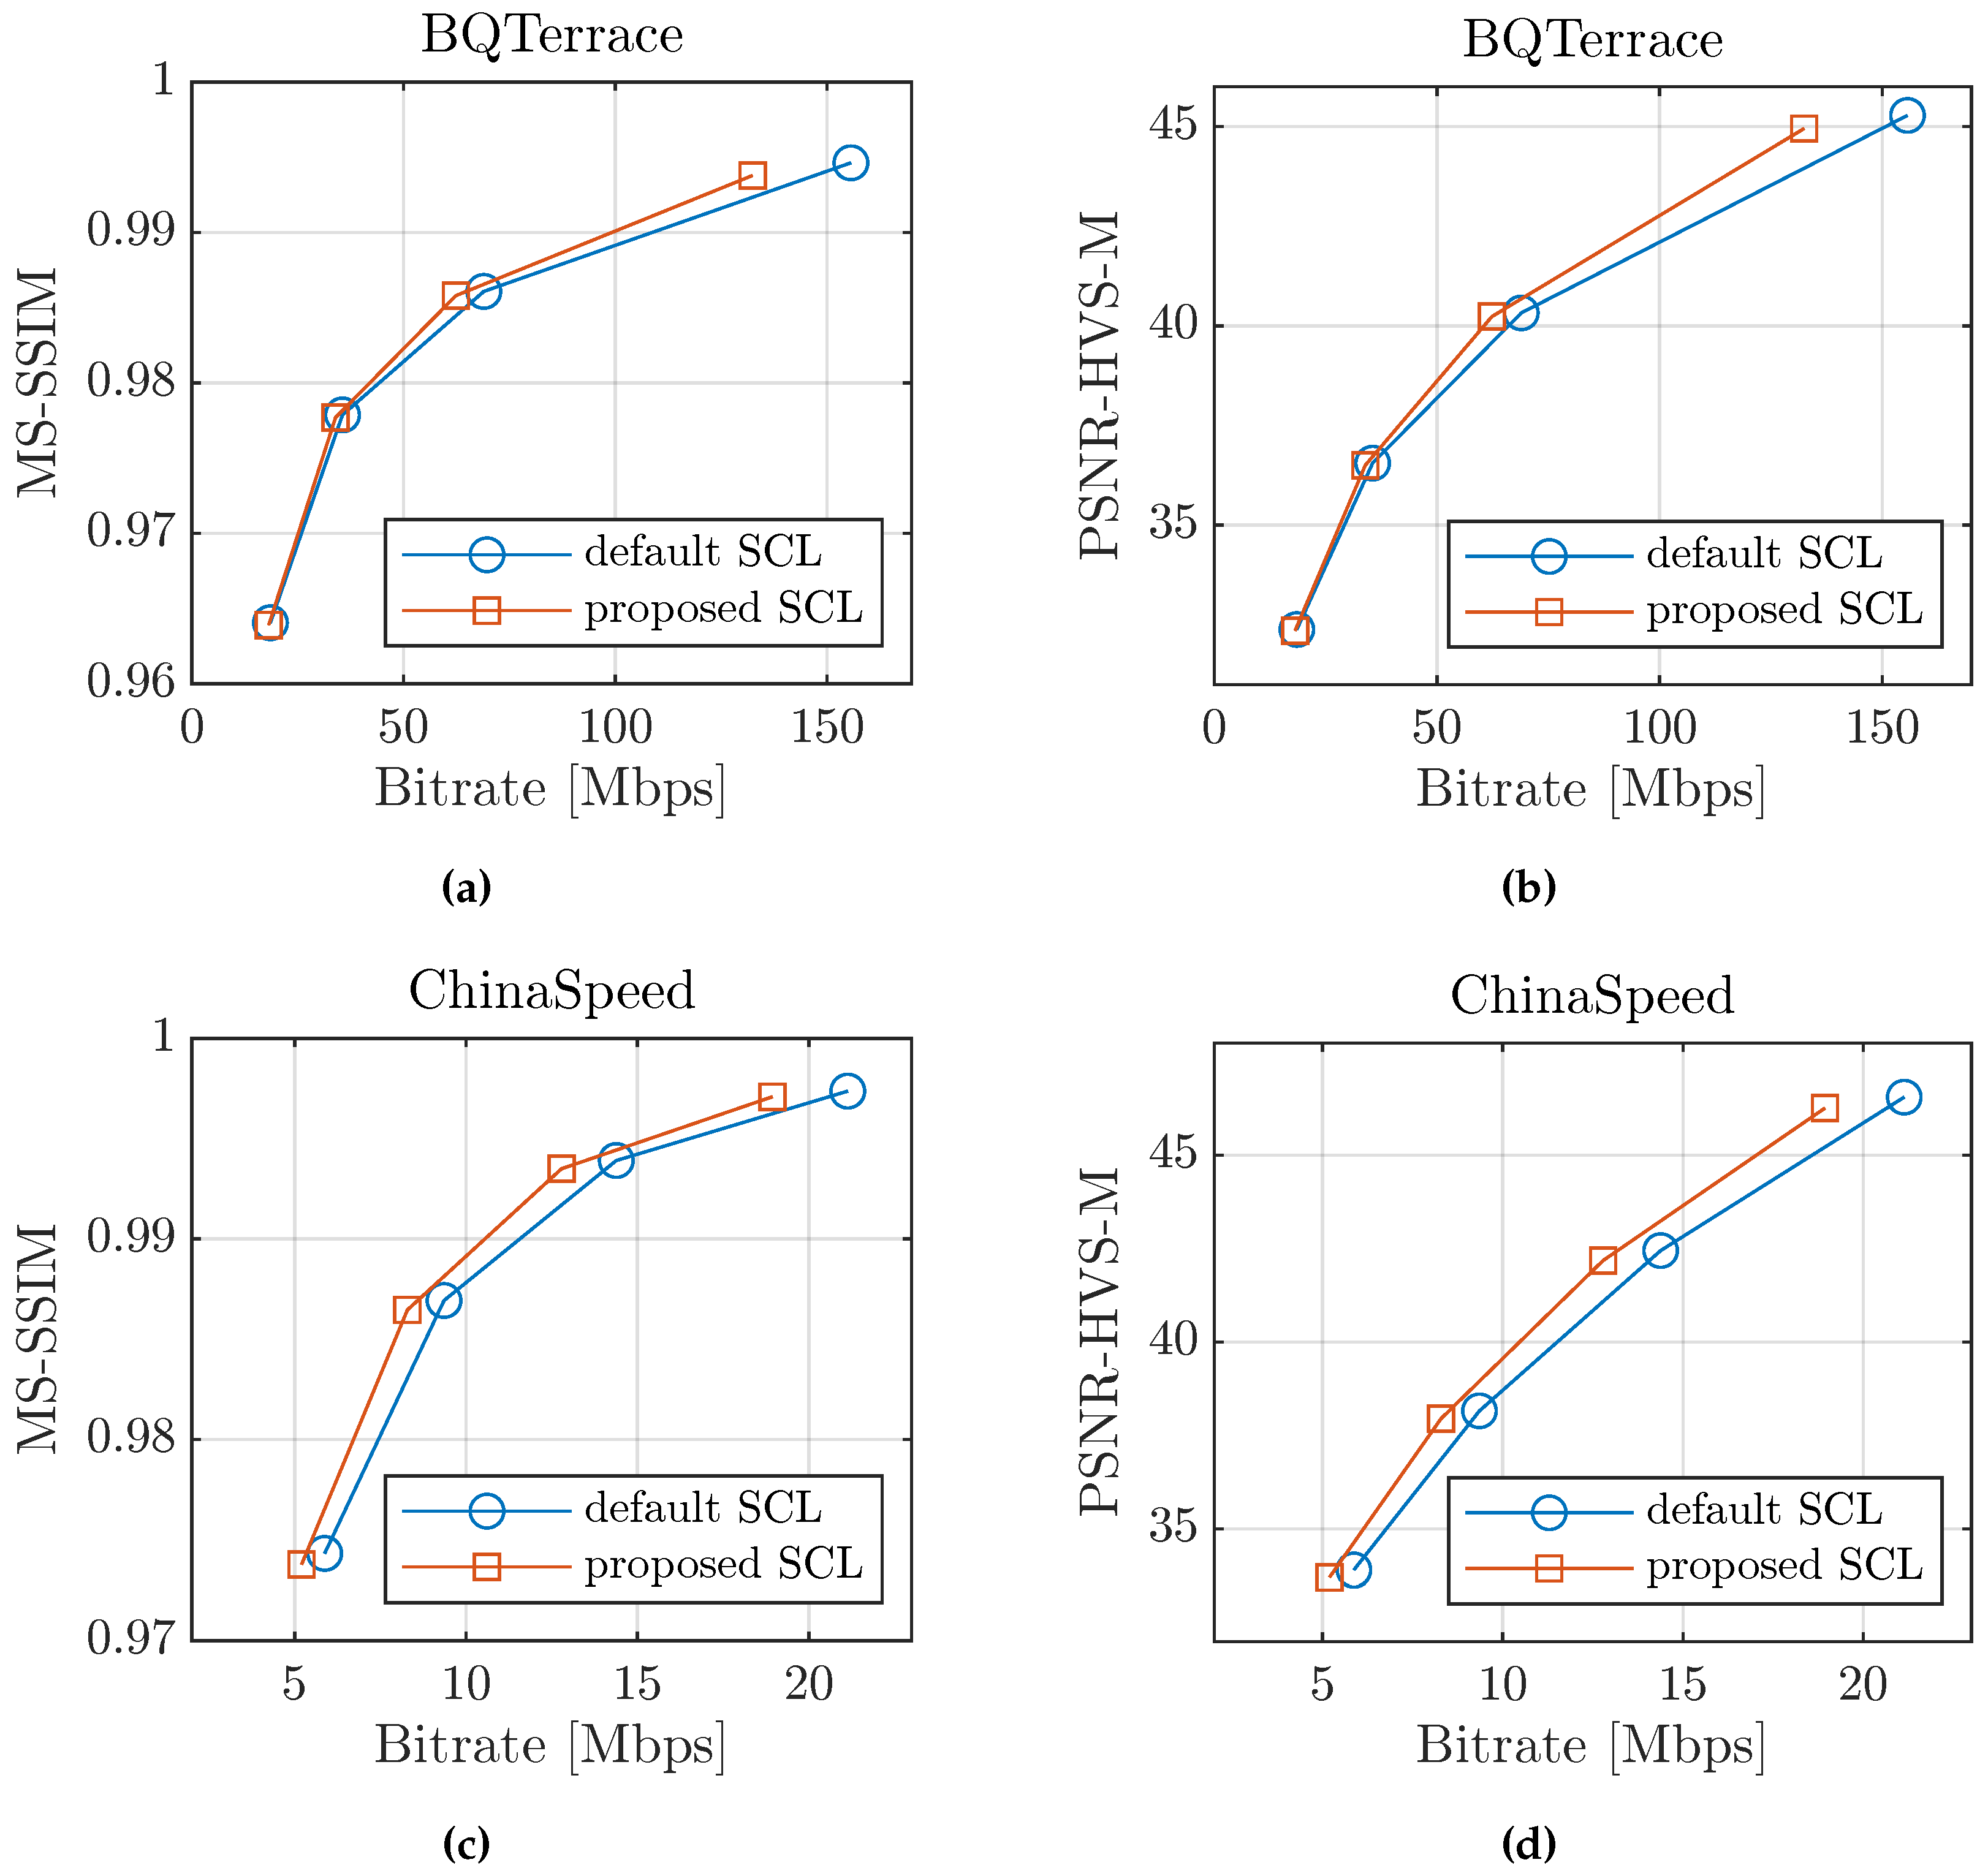
In
Figure 4 we can see that our proposal reduces the bit rate considerably as the quantization parameter decreases; in other words, at low compression rates. This occurs because as the value of the quantization parameter is reduced, the number of TUs (transform units) of size 4×4 increases; and thus, the performance impact of our proposed 4×4 weighting matrix is more noticeable.
3.2. Block Classification Based on Texture Orientation and SVM
After applying the improved CSF masking, we proceed to compute the proper QP offset based on the block texture information. For this purpose, we first need to identify the texture info of each block by means of a block classifier in a similar way as Tong
et al. [
6] proposed for the JPEG image encoder. In [
6], the authors stated that to maximize perceptual RD, plain blocks should not be over-quantized; the edge blocks could be minimally over-quantized and texture blocks could be over-quantized according to their texture energy level.
The main limitation when importing the texture classifier scheme that was proposed by Tong
et al. into the HEVC standard is the adaptation to the different block sizes. JPEG only uses
block size, whereas HEVC includes a wide variety of CU sizes. It should also be considered that the HEVC standard uses the integer transform (I-DCT and I-DST) of the prediction residual. For those reasons, we propose a novel texture block classification using the supervised SVM, which uses the features obtained from the mean directional variance (MDV) metric proposed by Damian
et al. [
36] as input features.
Our first step was the classification of about 1800 HEVC encoded luma blocks of different sizes, depending on whether they are smooth, edged or textured. To achieve this, we randomly selected blocks from some image databases, such as ESPL Synthetic Image Database [
37], USC-SIPI Image Database [?], TESTIMAGE [
38] and Kodak image dataset [?]. To avoid possible bias in human classification, five different video coding researchers were involved in the classification process. The users classified the blocks according to their type (texture, plane or edge) by using software that randomly presented the blocks for classification. As an example,
Figure 5 shows several manually classified blocks that are organized according to size and block type. As can be seen, the blocks that were classified as plain have a smooth content. In contrast, the content of the texture blocks is a more random pattern. The blocks classified as edge have a very pronounced directionality.
Figure 5 also shows the polar diagram of the mean directional variance (MDV) values for each block. The MDV measures the local directionality of an image by calculating the cumulative variance along discrete lines in the given direction. Using the version of MDV that was introduced in [
36], we computed the 12 rational slopes of all of the manually classified blocks to find any correlation between the values of this metric and the classification result. Because the
block size does not provide sufficient resolution to calculate the 12 rational slopes, and even the manual classification performed by human observers was not completely coherent, the
blocks were discarded from the texture over-quantization process.
Interesting results can be extracted from the experiments and results shown in
Figure 5. On the one hand, texture blocks tend to exhibit polar diagrams that are close to circular shapes, which show high variance values in all directions. However, edge blocks have a minimum (dominant gradient) in the direction of the edge orientation. Strong edges in a block have higher differences between the minimum and maximum MDV values, and are used to form a polar diagram with an "8" shape. Plain blocks tend to have a variety of patterns; however, all of them have relatively very low MDV values when compared to texture and edge blocks (see
Figure 5a–g).
To establish a robust block classification, we decided to use a SVM classifier. The SVM is a machine learning technique that facilitates linear and non-linear binary classification. Because we want to get three block clusters (plane, edge and texture), we must use either of two multi-class methods: One vs. One (OvO) or One vs. Rest (OvR). The main difference between these two techniques lies in the number of binary classifier models required. In the OvR strategy, the multi-class classification is split into one binary classification model per class; while for the OvO strategy, for the N-class instances dataset, binary classification models are needed. Because we have only three clusters, both techniques will require the same number of binary classification models, and therefore both strategies will have similar computational cost.
After analyzing the results of applying different statistics to the MDV data (e.g., the mean, the variance, the median, etc.), it has been observed that the best results (i.e., a better clustering in the
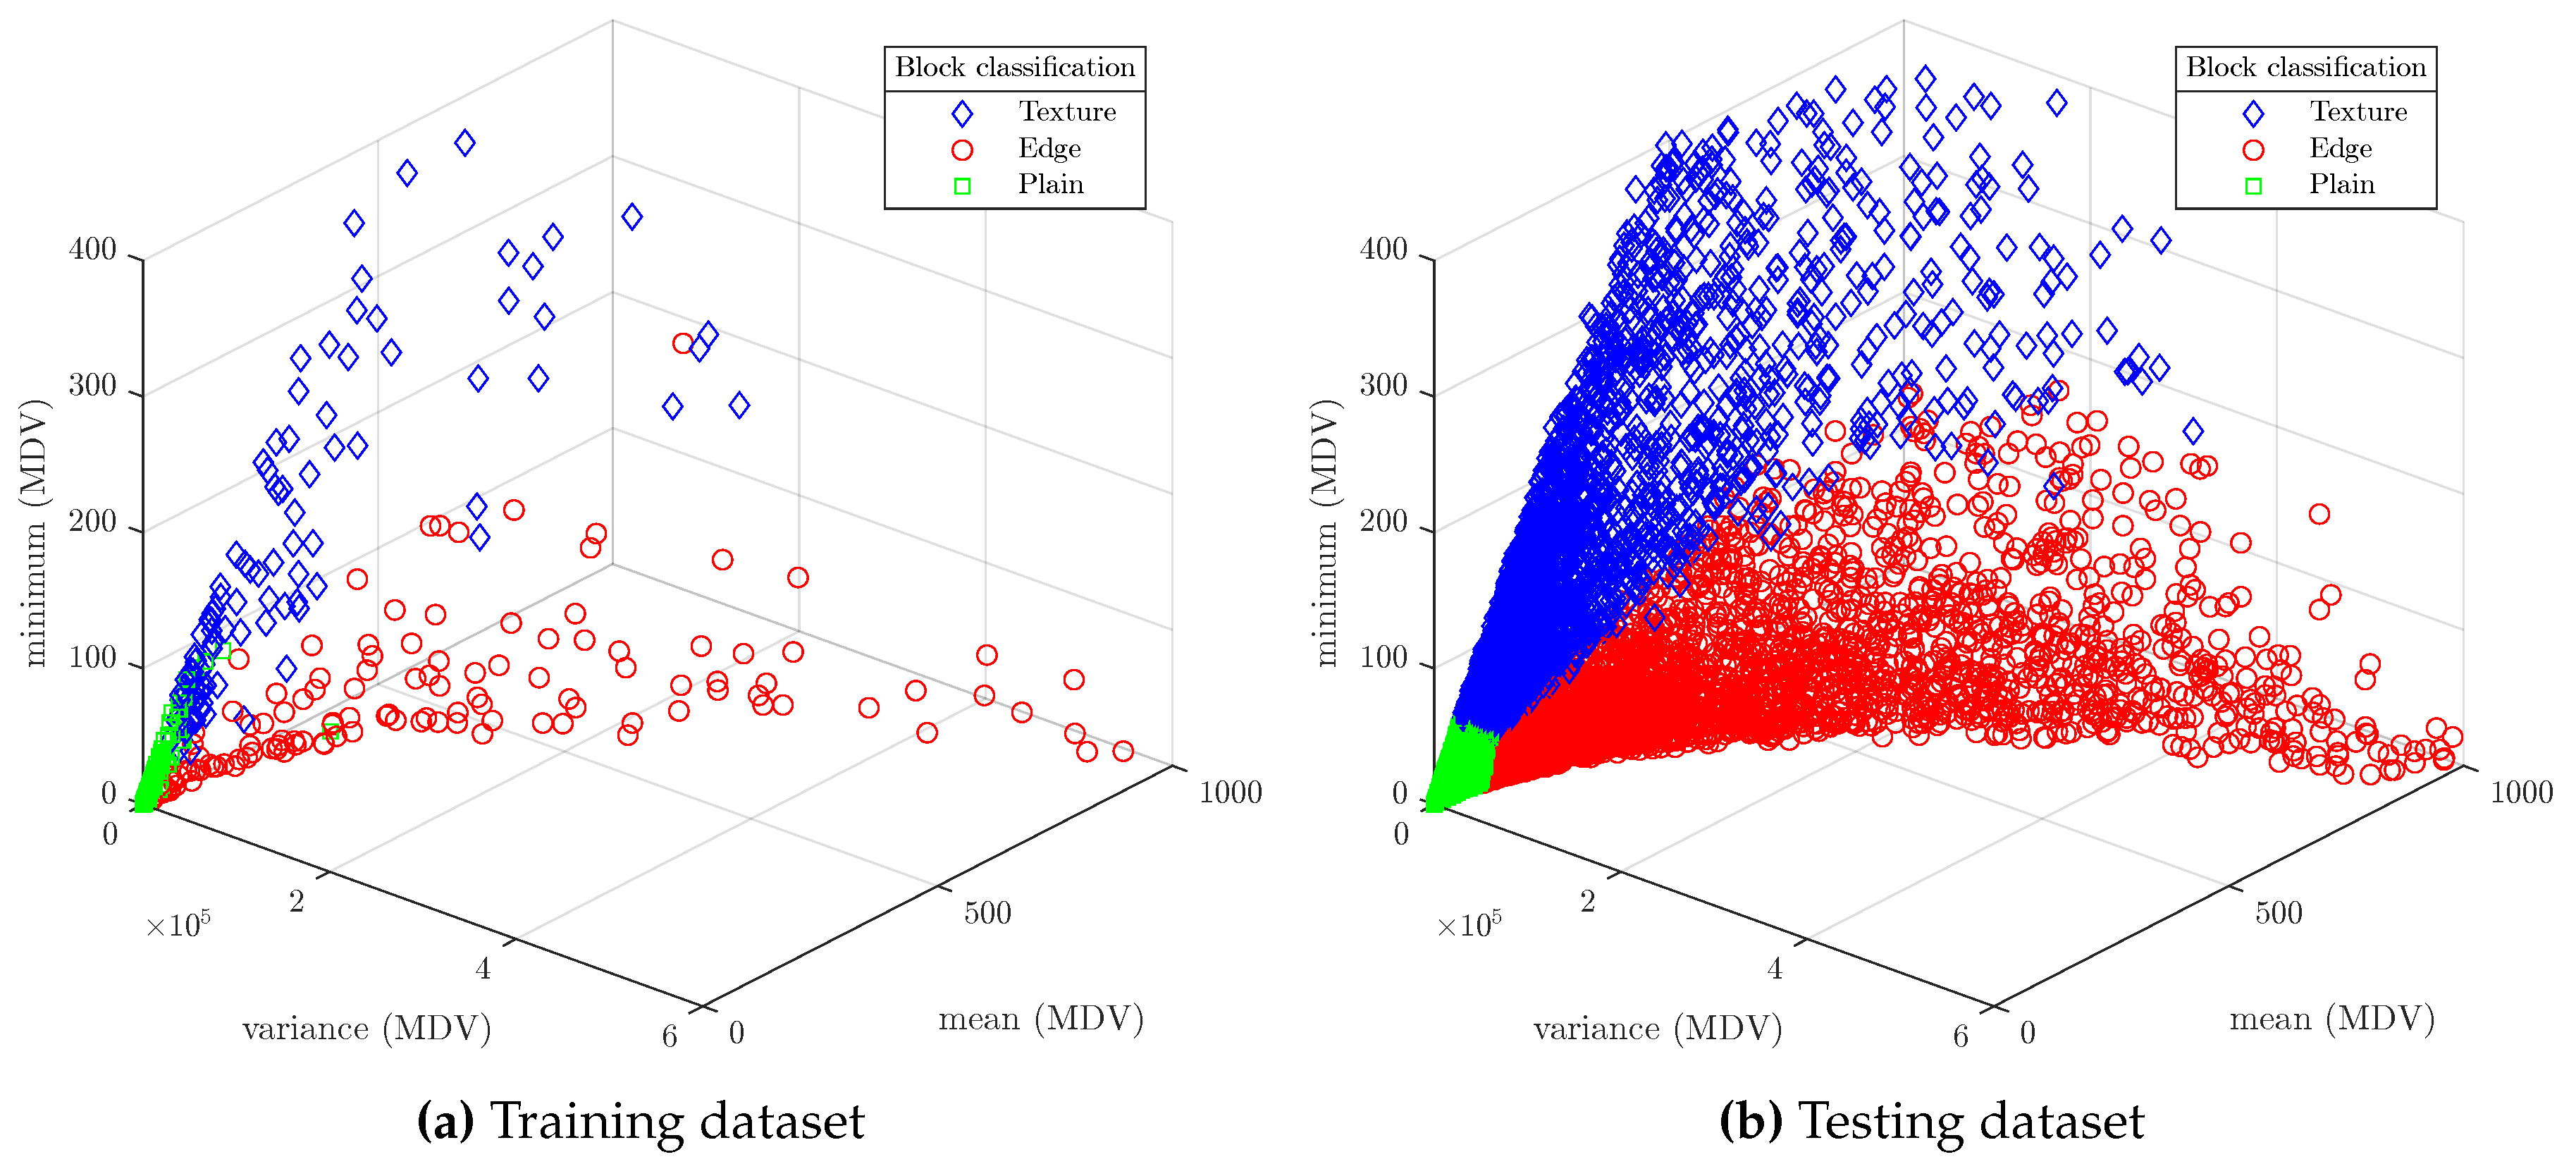
space) are obtained using the mean, the variance and the minimum value of the MDV as the input features to be applied in the SVM algorithm. The manual classification of 16×16 blocks of the training dataset is shown in
Figure 6a. Texture occupies the YZ plane (they have low
), edge blocks occupy the XY plane (they have low
), and plain blocks stay close to the origin of coordinates.
Given that the available block sizes in the HEVC standard are limited, instead of using the block size as an additional feature of a single SVM model, we have decided to use one SVM model for each block size.
SVM models has been implemented using the Classification Learner application from MATLAB R2020a. The optimizable Support Vector Machine was selected to find the optimal SVM model parameters, including kernel function type (linear, quadratic, cubic or Gaussian), kernel scale, box constraint and multi-class method (OvO and OvR).
The optimal parameters and resulting model accuracy of the three models (after 30 iterations of Bayesian Optimization) are shown in
Table 3. As can be seen, a high degree of accuracy has been obtained for all of the models, which is enough for a correct block classification.
Figure 6b shows the classification of
blocks belonging to the testing dataset. It can be seen that the model has properly classified the blocks into texture, edge or plain.
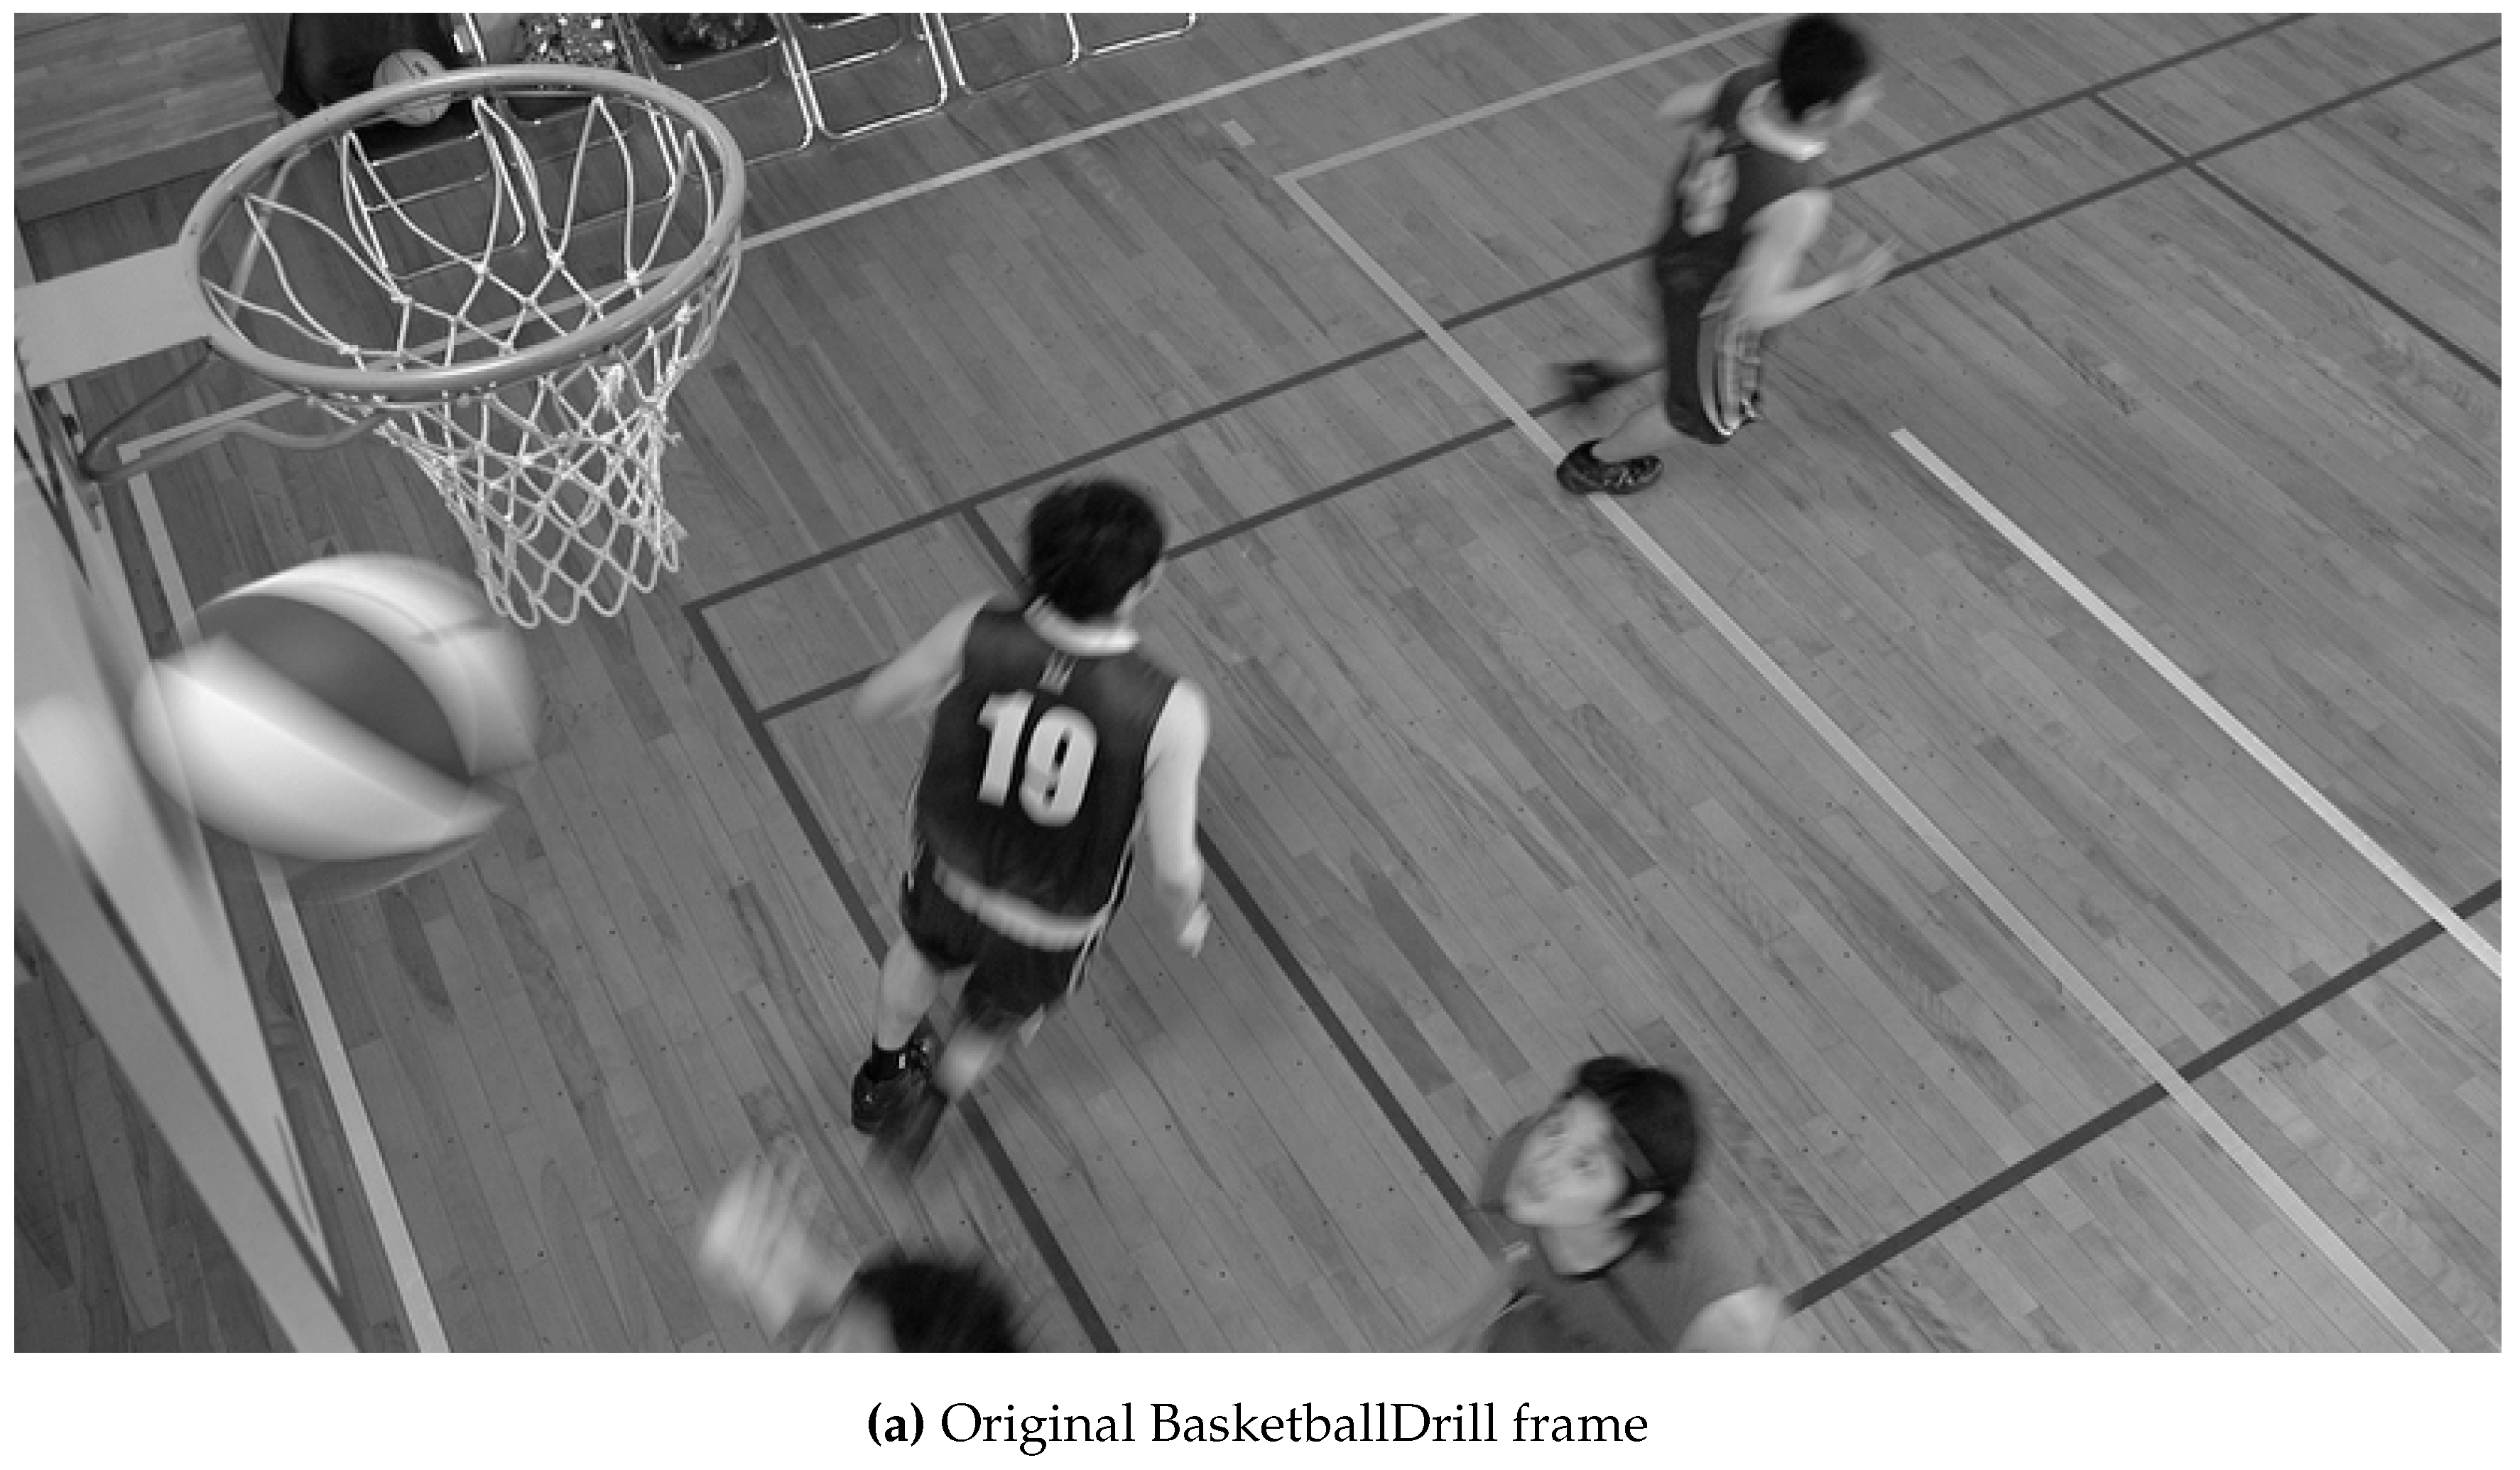
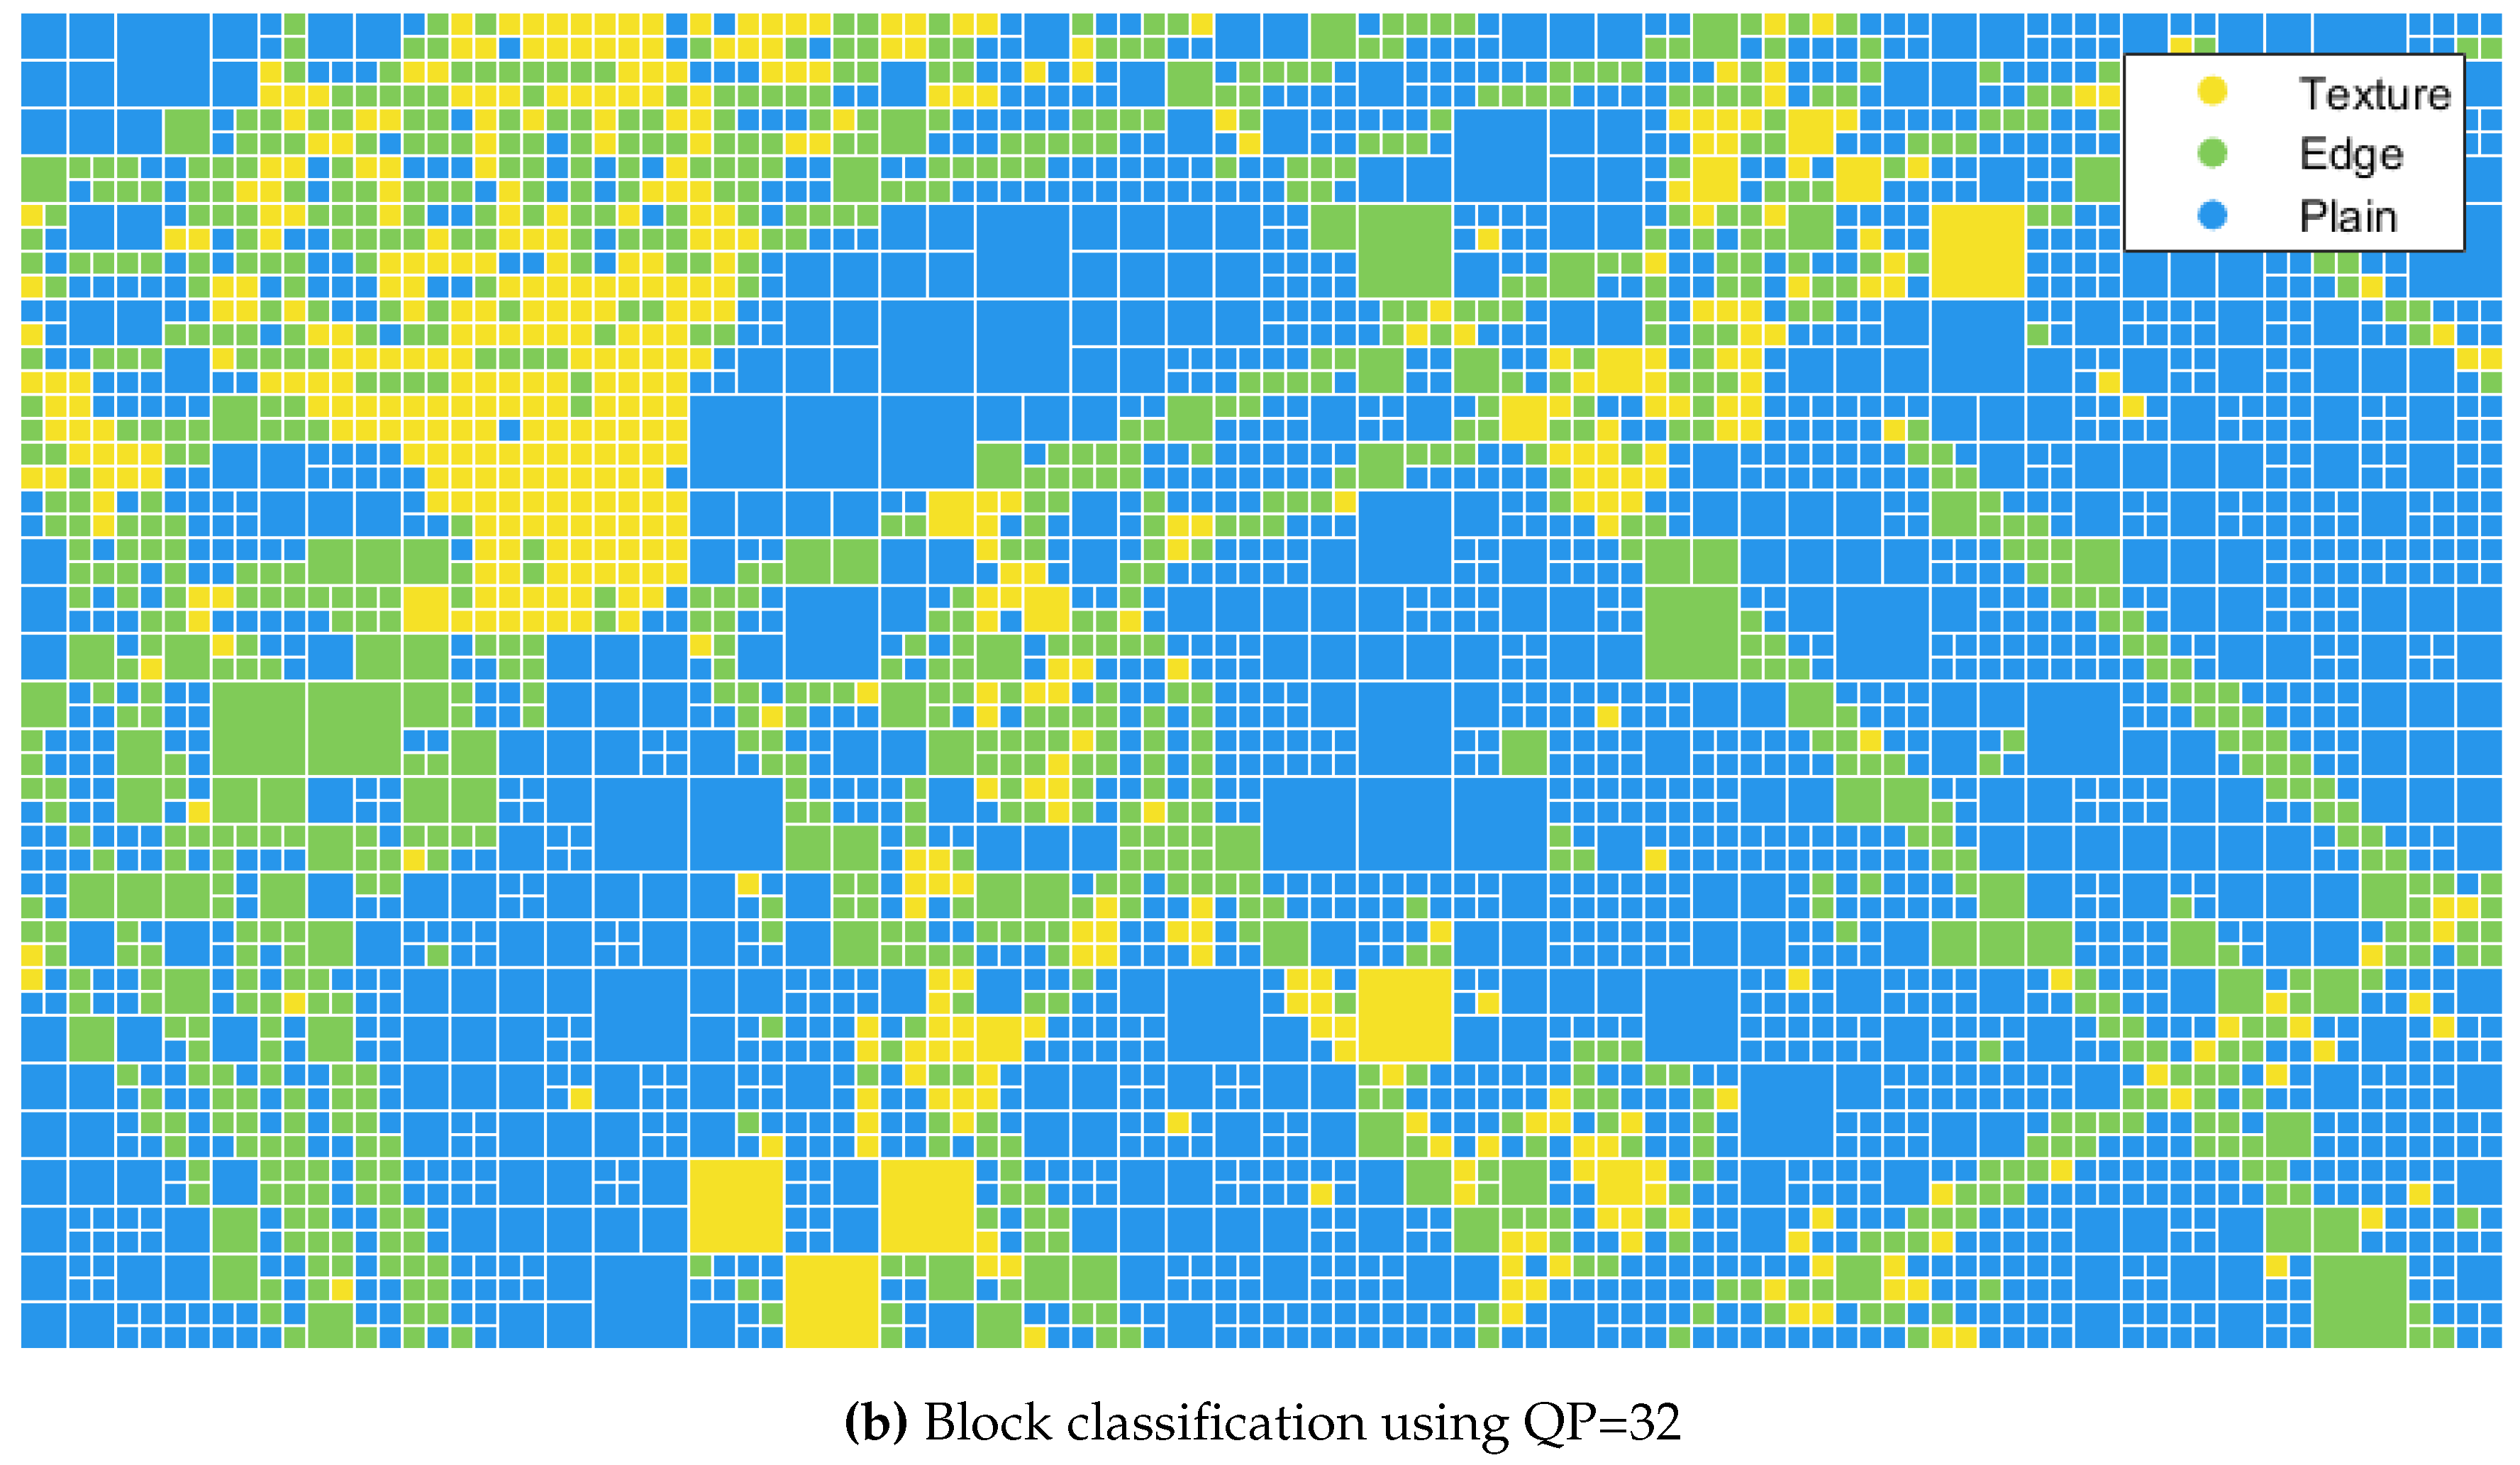
As a visual example, Figure shows the result of applying block classification to the CUs (coding units) of a BasketballDrill frame quantized at QP 32. It can be seen that the lines of the basket court are correctly labelled as edge blocks, while some parts of the basket net are considered as texture blocks.
The SVM models have been integrated into the HEVC Reference Software (HM) for evaluation. In the HM code, block classification is computed at frame level before the quadtree partitioning and rate-distortion optimization (RDO) stage, in the same way as the Adaptive QP algorithm of the HEVC video coding standard [
17].
The workflow of the block classification code is as follows: after loading and storing the original YUV pictures into the picture buffer list, if texture masking is enabled, then the function
xPreanalyzeTextureMasking is called. This function splits each frame into square blocks of size 32, 16, and 8 pixels, the classification of each one is calculated using the corresponding SVM model according to its size. The result is stored in memory. It also calculates and stores the block energy (
) (defined in
Section 3.3), which is required to compute the over-quantization (QP offset). Later, during the partitioning and RDO stage, the block type and energy of each CU is already available according to its size and location inside the frame.
3.3. Obtaining Optimal QP Offset
The next step after classifying a CU block is to obtain its optimal QP offset. We have defined the block energy (
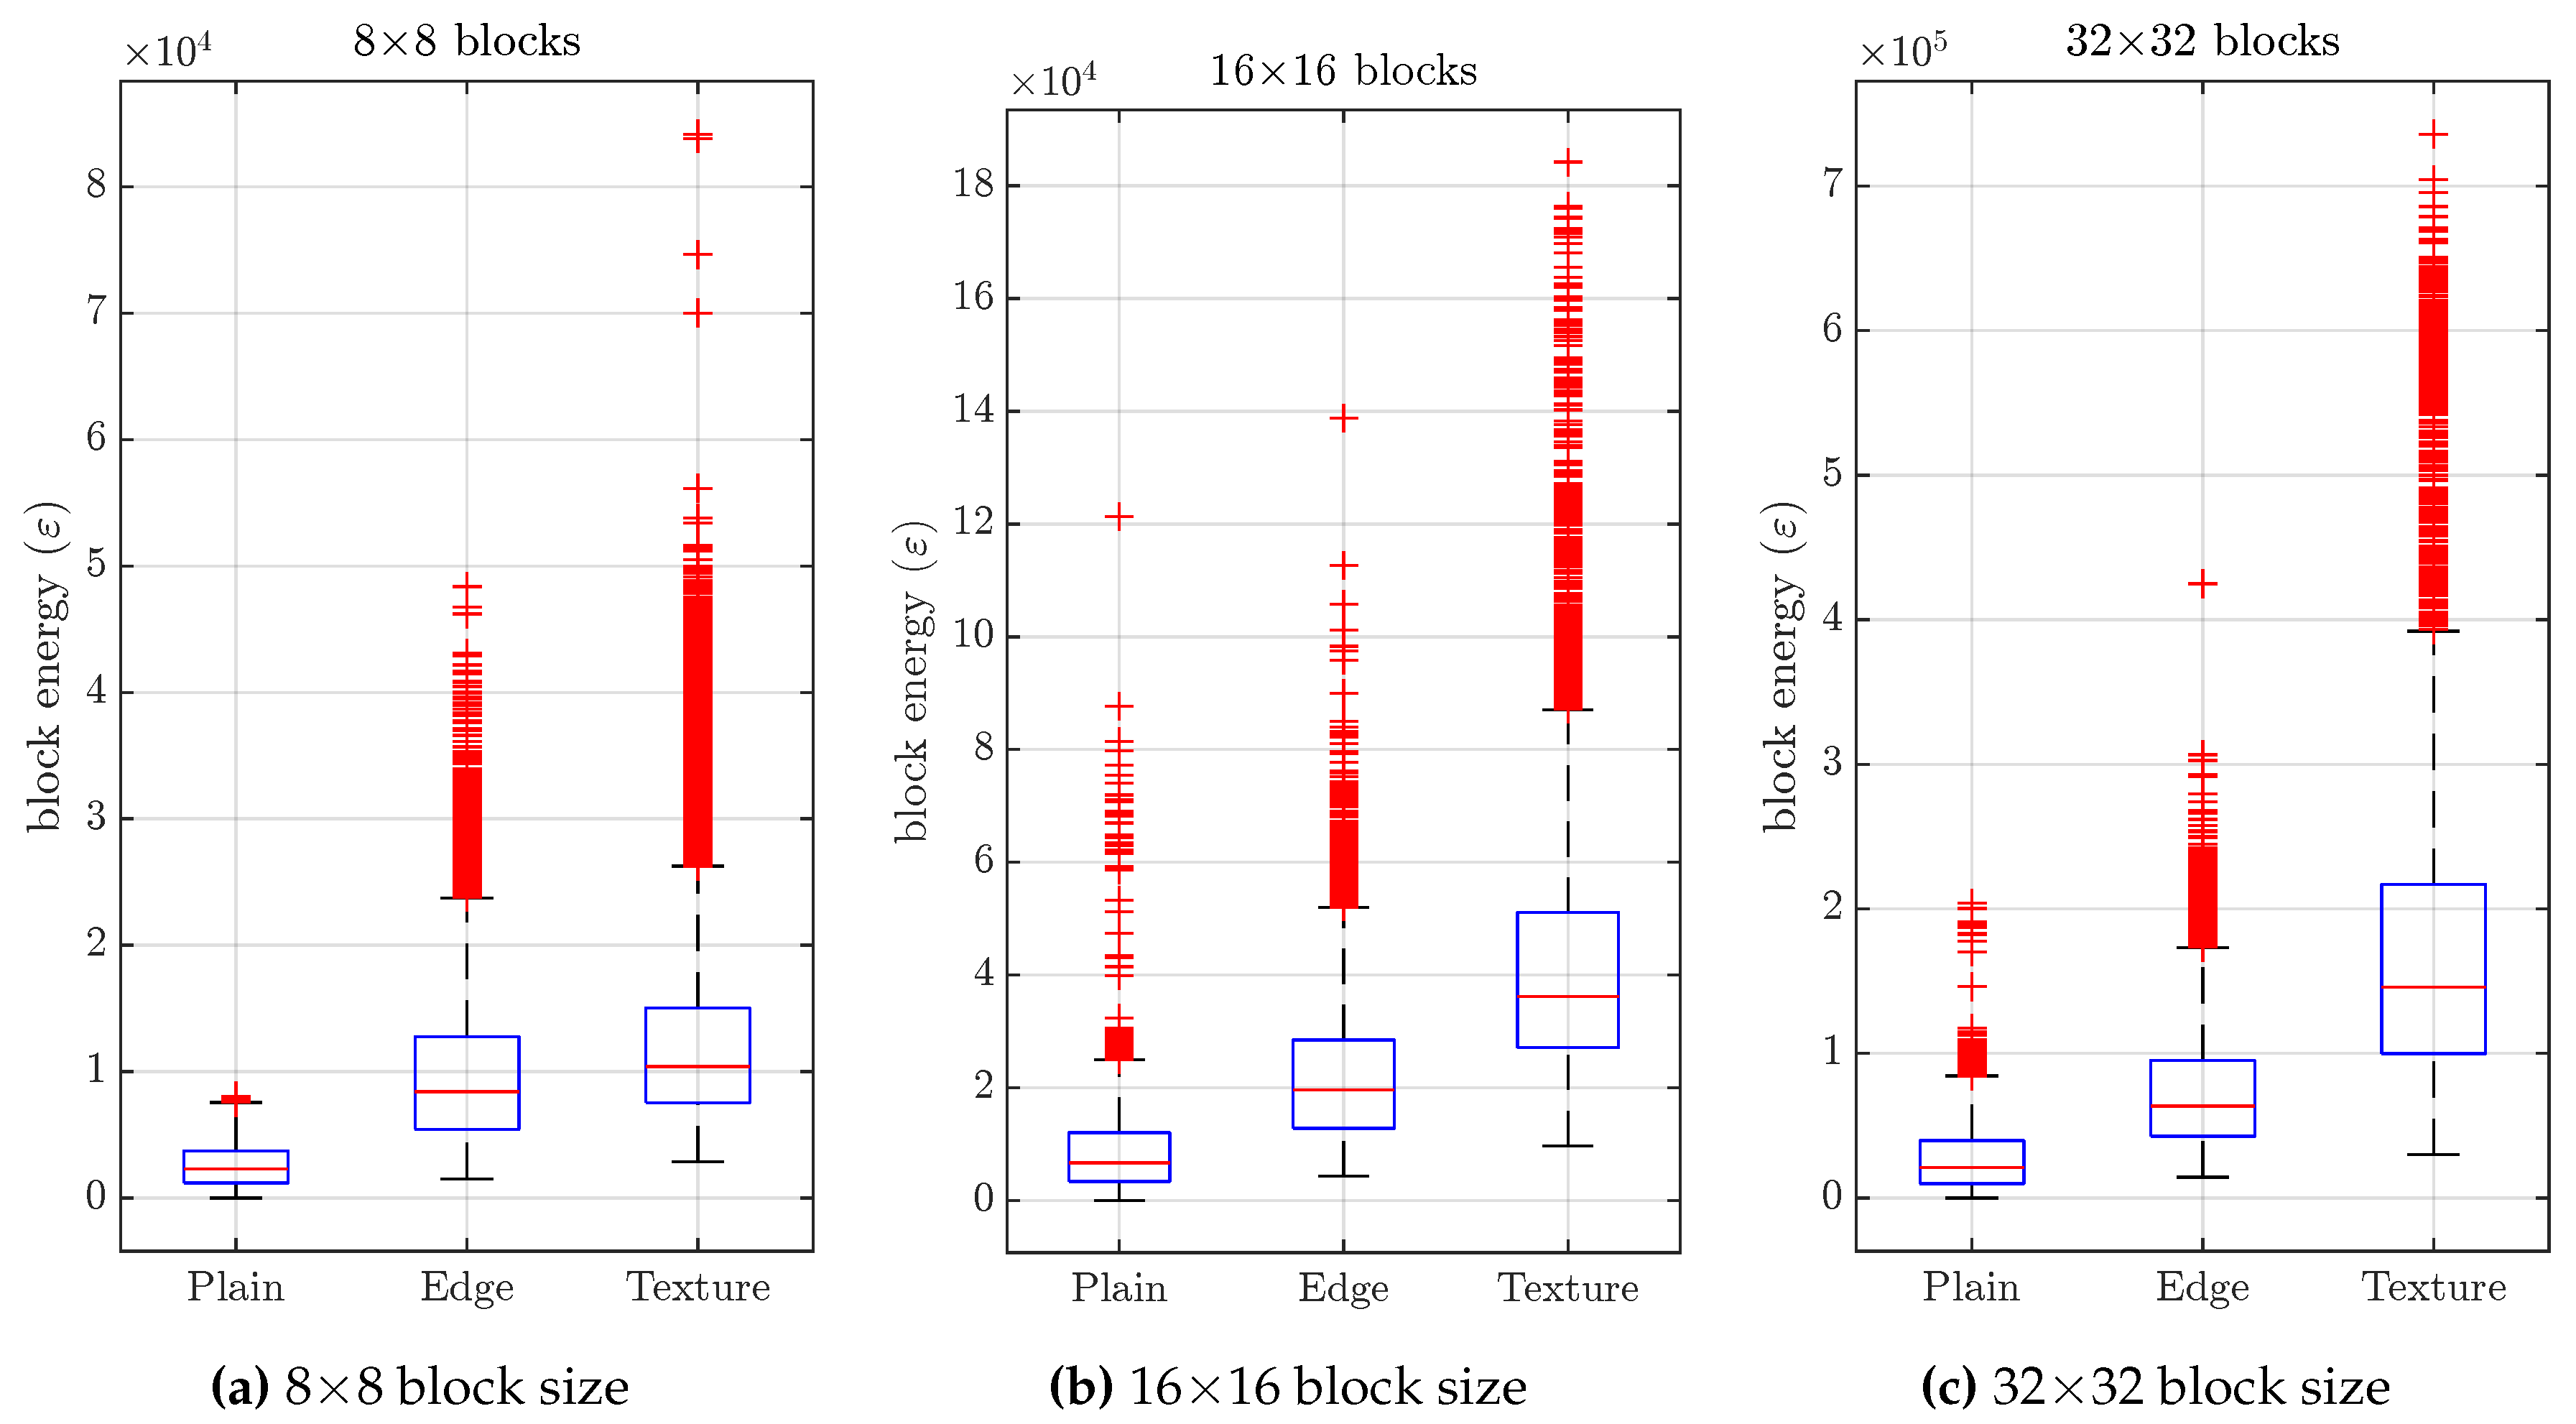
) as the absolute sum of all of the AC transformed coefficients of the original picture. The energy distribution has been analyzed according to the block type (texture, edge or plain) and its size. In
Figure 8, the block energy distribution is shown as a box plot for each block size and type. This representation allows us to graphically visualize the five-number summary, which consists of the minimum and maximum range values, the upper and lower quartiles, and the median.
A pattern can be observed in terms of the block energy distribution according to block classification. As expected, blocks classified as texture have the highest block energy distribution, followed by edge blocks and finally plain blocks have the lowest energy distribution.
In the HEVC standard, the adaptive QP mode assign to each CU a QP offset or that modifies the slice QP adaptively by means of a rate-distortion analysis where PSNR is the distortion metric. Our objective is to also obtain a for each CU but we follow a different approach based on the block energy. The distortion metric that we use is perceptually-based (e.g., SSIM, MS-SSIM or PSNR-HVS-M metric).
Equation (
2) shows the inverse procedure to obtain
, as proposed in [
39], where
is the quantization step size for the CU block
in the block partitioning map and
is the QP offset parameter to be applied to over-quantize
block. When
, then
(i.e., no additional quantization should be applied to
block).
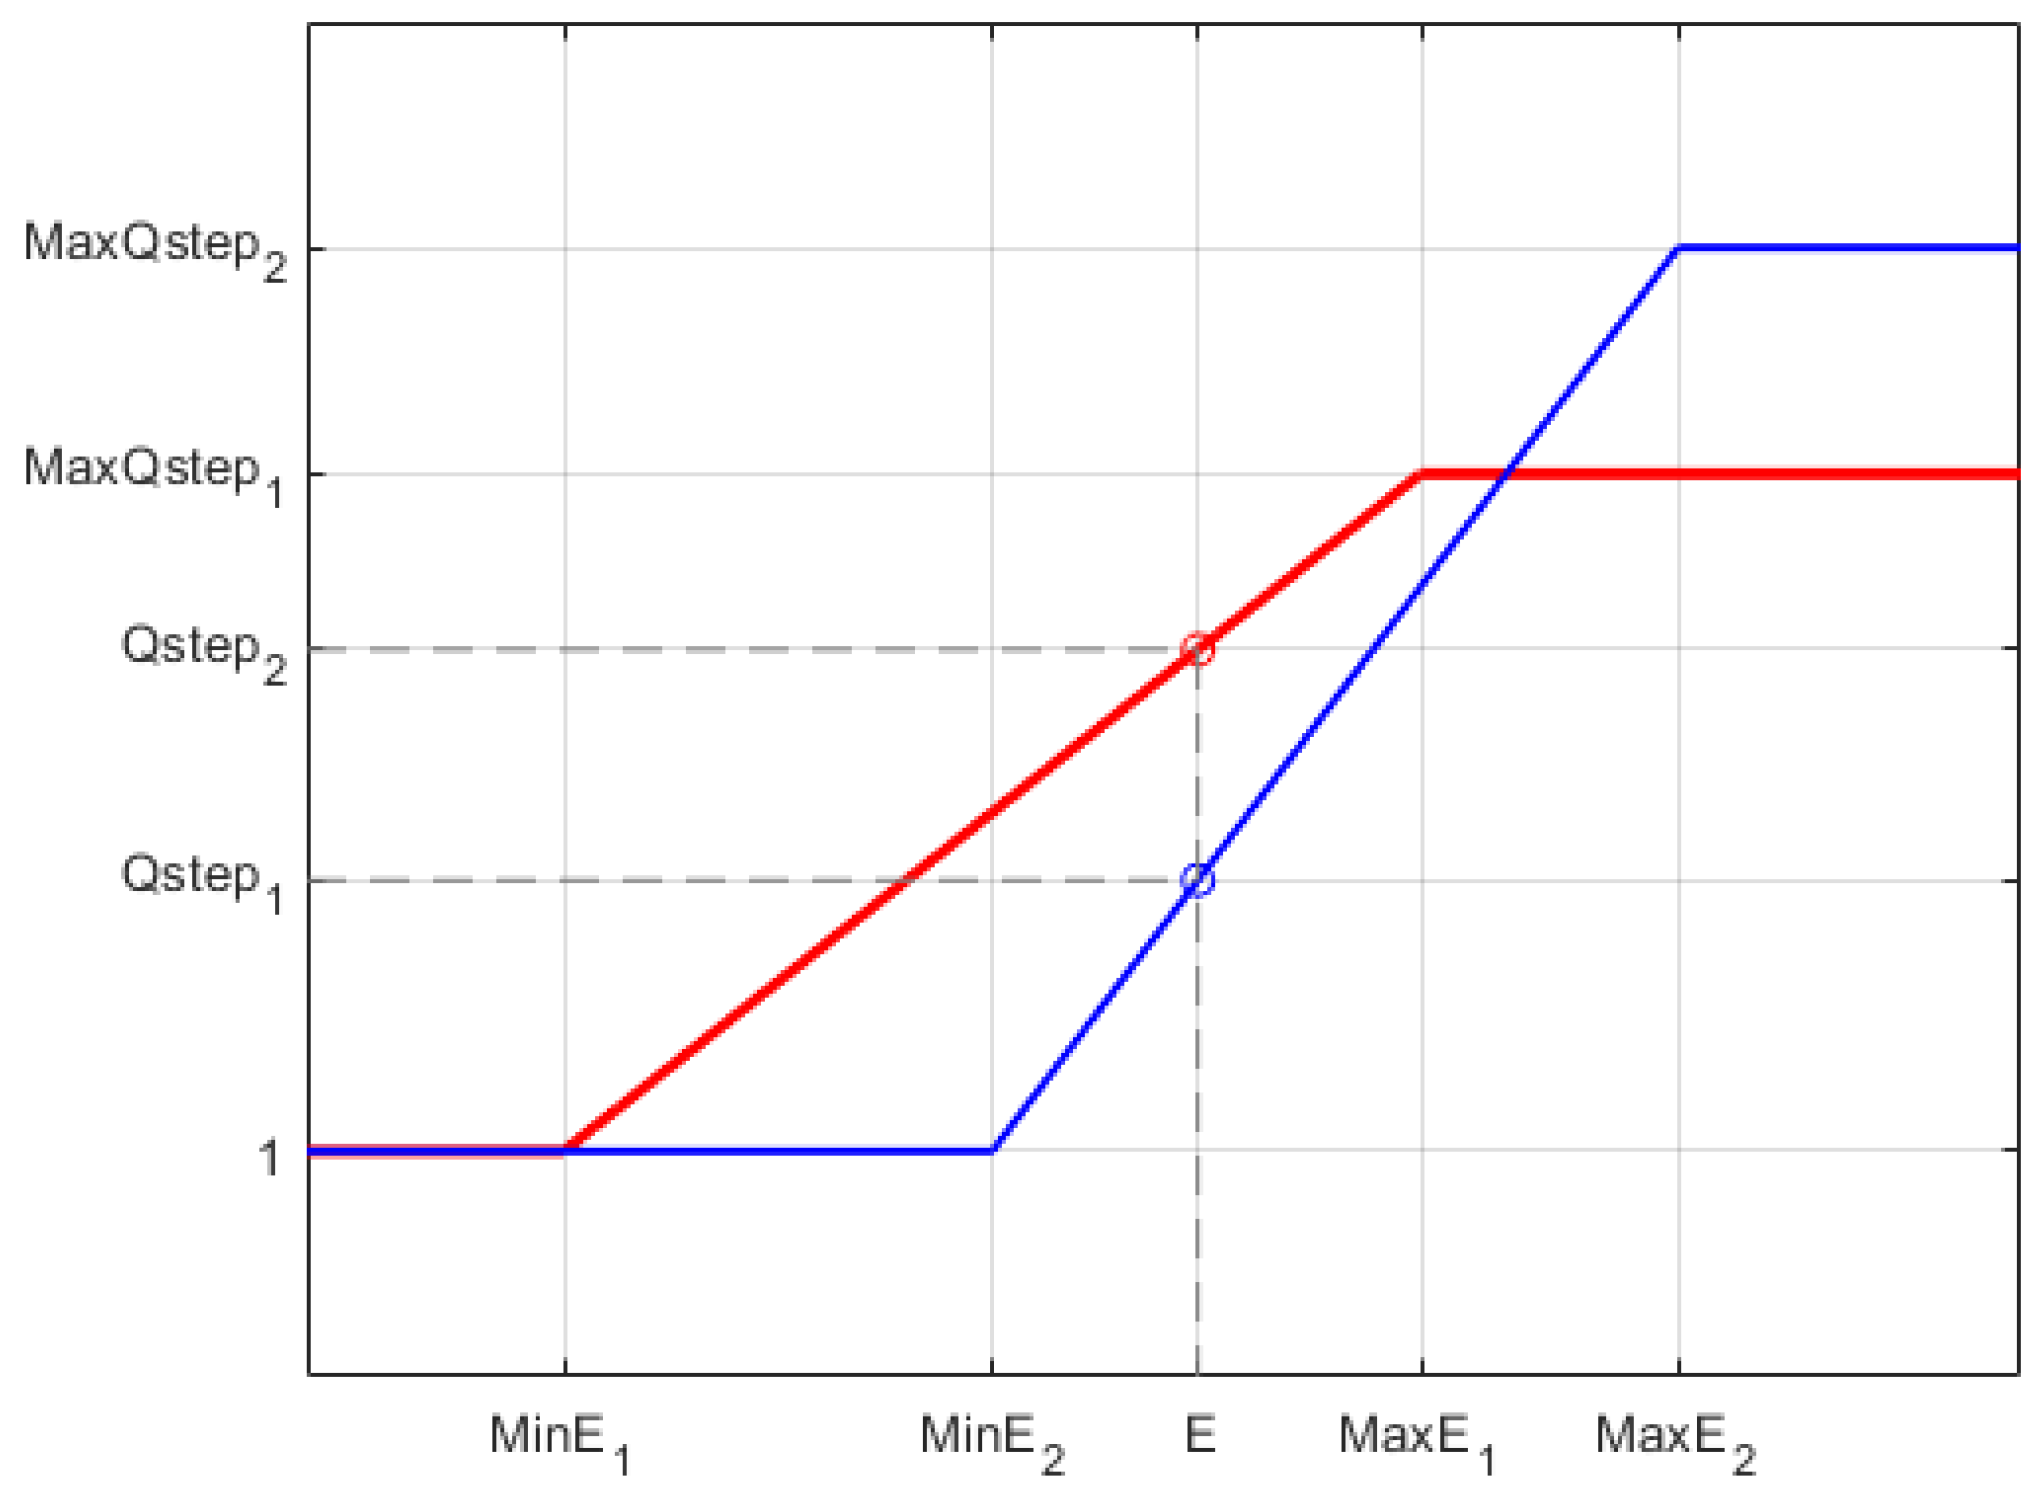
To obtain the
value for a block, we use the linear threshold elevation function that is presented in Equation (
3), similarly to the one proposed in [
6], where
and
correspond with the maximum and minimum block energy of the set of blocks belonging to the same block type and size (
Figure 8),
is the maximum allowed quantization step size,
is the energy of the current block
and
corresponds to the quantization step to be assigned to the block.
Figure 9 shows the representation of Equation (
3), where the two lines show how the slope of the function varies for two different sets of function parameters (i.e.,
,
and
). As we can see in
Figure 9, the corresponding
is different for each parameter set, while the block energy
is the same. The question that arises here is, how to choose the function parameters to maximize the overall Bjøntegaard BD-rate [
31] performance value?, BD-rate will be computed considering the use of a perceptual distortion metric instead PSNR.
We have used different sets of parameters to find the optimum combination for each block size (i.e.,
,
and
) and for each block type (i.e., Texture and Edge). We do not consider plain blocks because they are more sensitive to visible artifacts [
6] and should not be over-quantized.
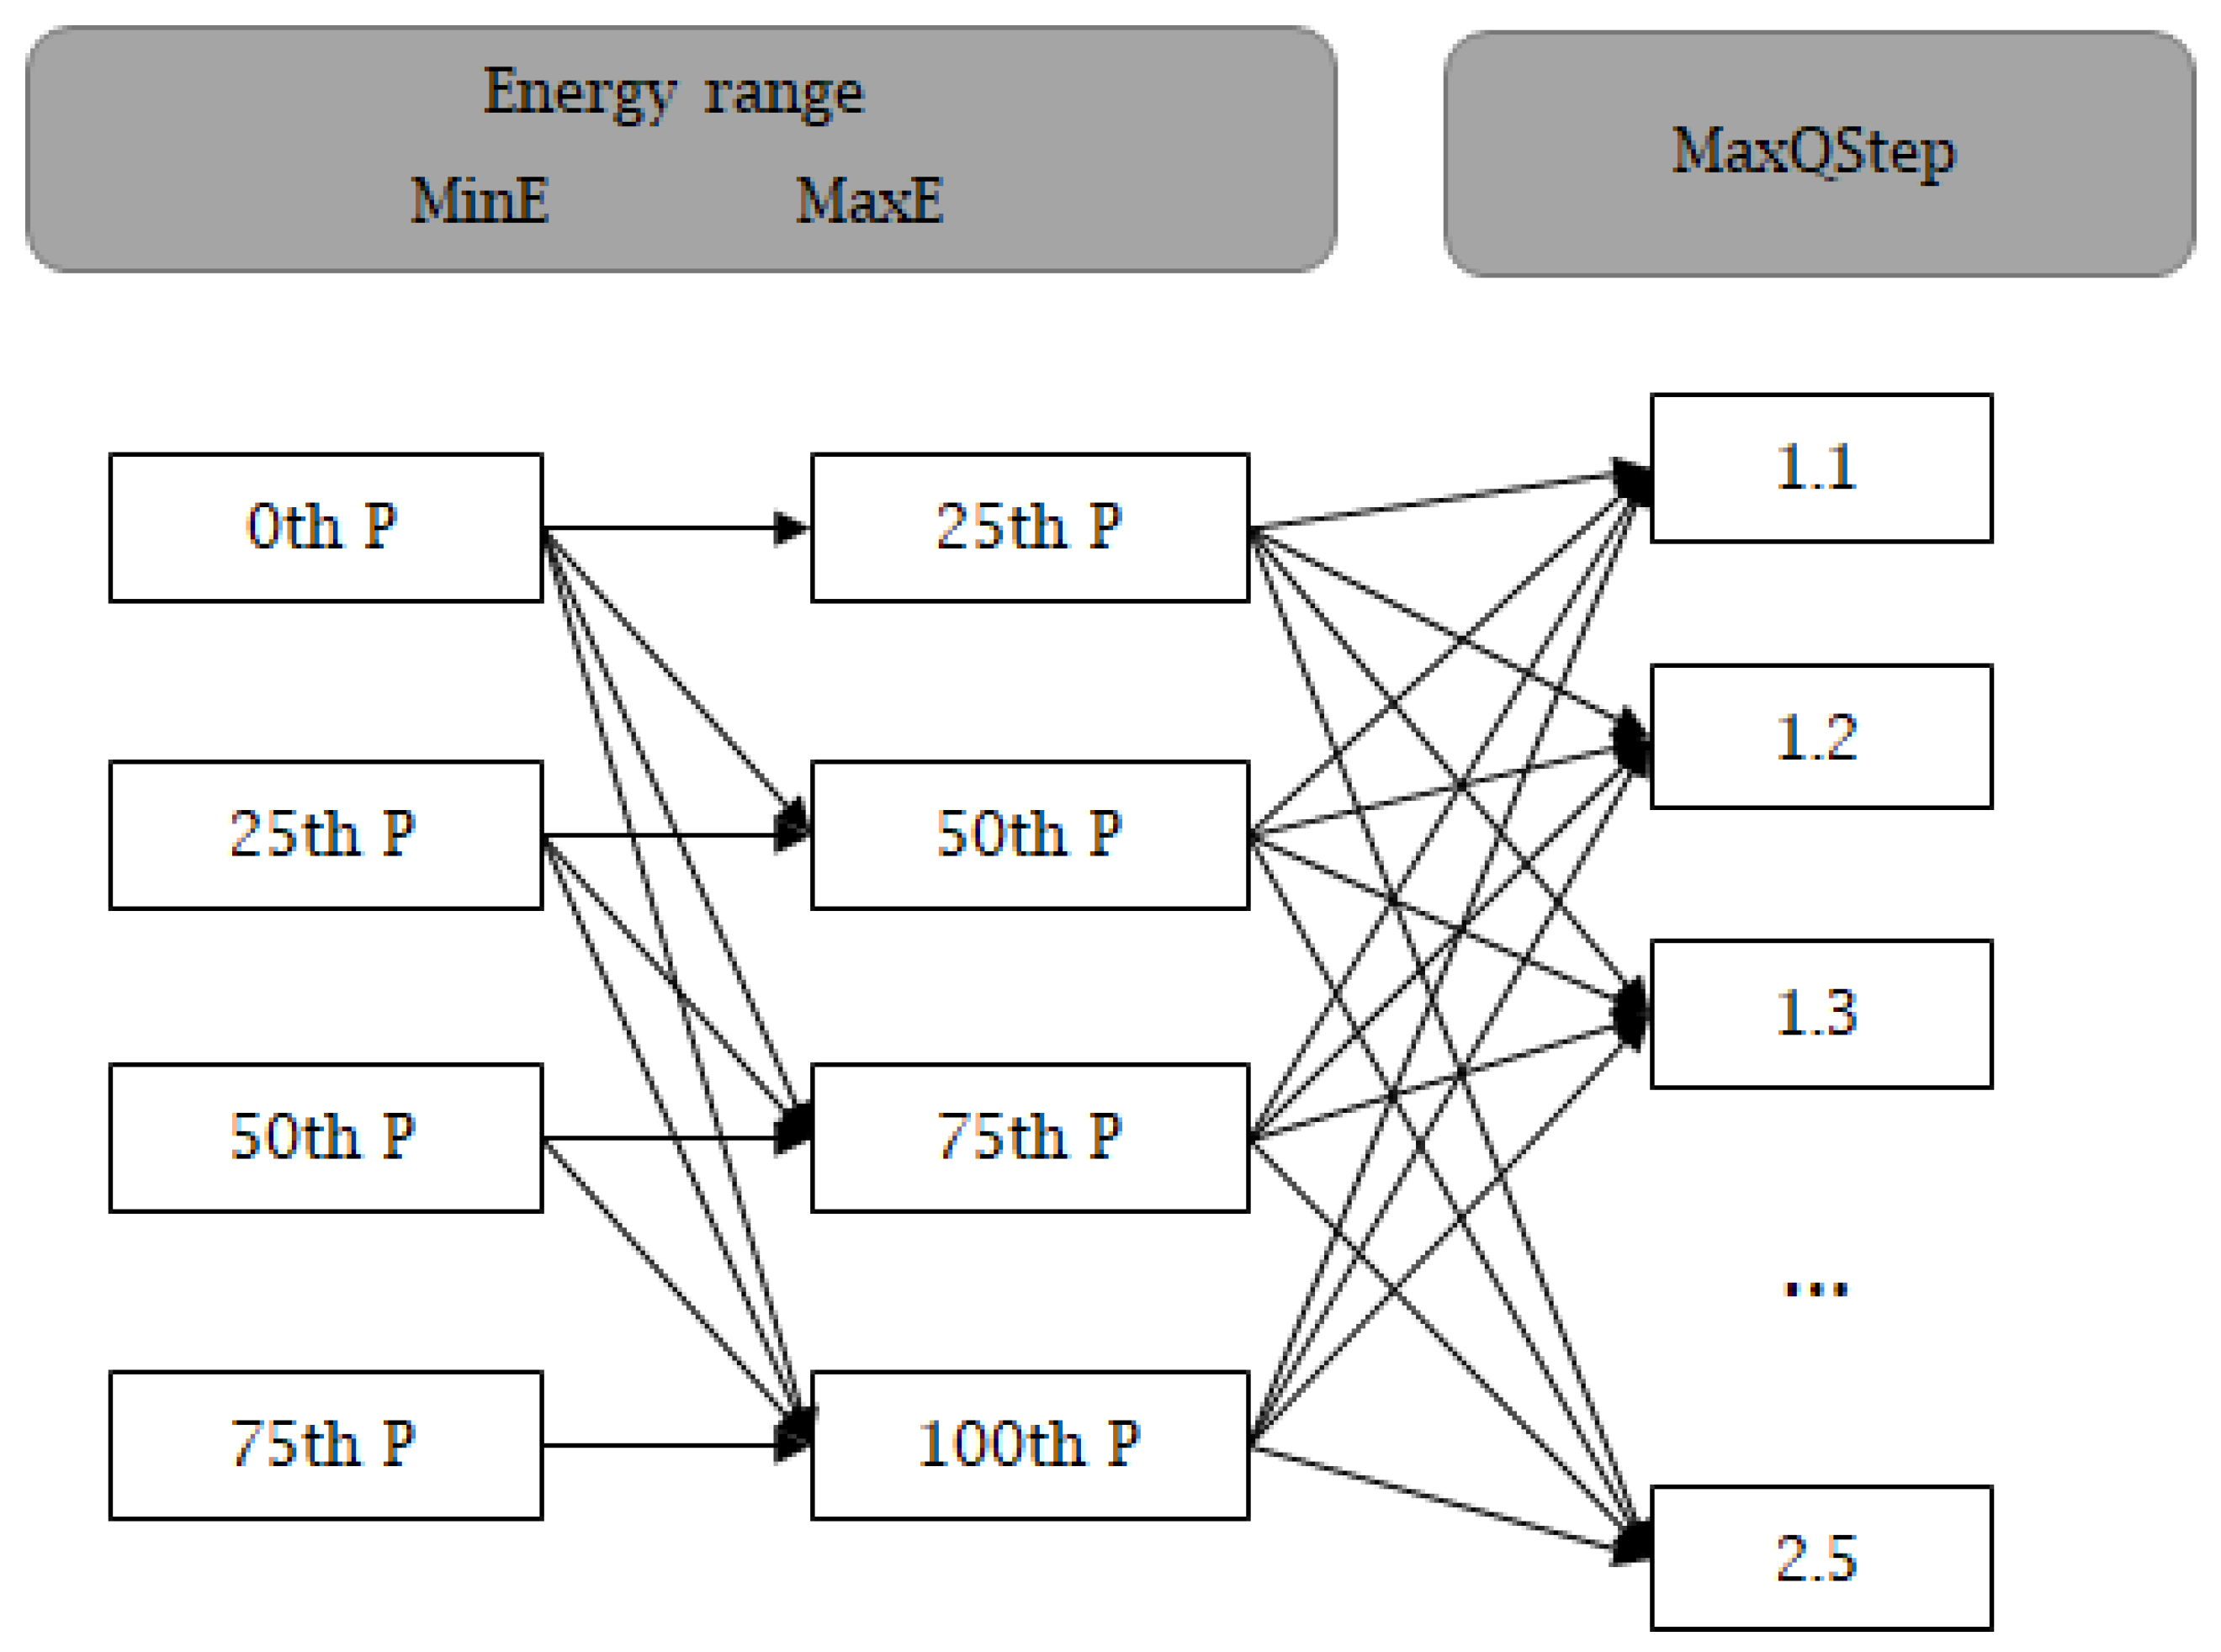
Figure 10 summarizes all the tested parameter sets for each block size and type. A parameter set is built following the connection arrows in the graph. So, for example, in the first set,
gets the value of the energy at the lower whisker (i.e., 0th percentile),
gets the energy at the bottom of the box (i.e., 25th percentile) and finally the value 1.1 is given to
. The second parameter set has the same values for
and
but we change
to 1.2, and so on. To guarantee that the range of the resulting
be bounded between 0 and 7 (maximum QP offset allowed in HEVC), we have restricted the
range to be between 1.1 and 2.5.
We use the Bjøntegaard BD-rate [
31] as a performance metric to determine the best parameter set. Therefore, for each one, we will run a set of encodings using QP values 22, 27, 32, and 37 with the video test sequences belonging to classes A, B and E, which have the highest frame resolution (as suggested in [
34]).
After collecting all of the results, we have determined the near optimal
,
and
values for each block type and size, as in
Table 4.
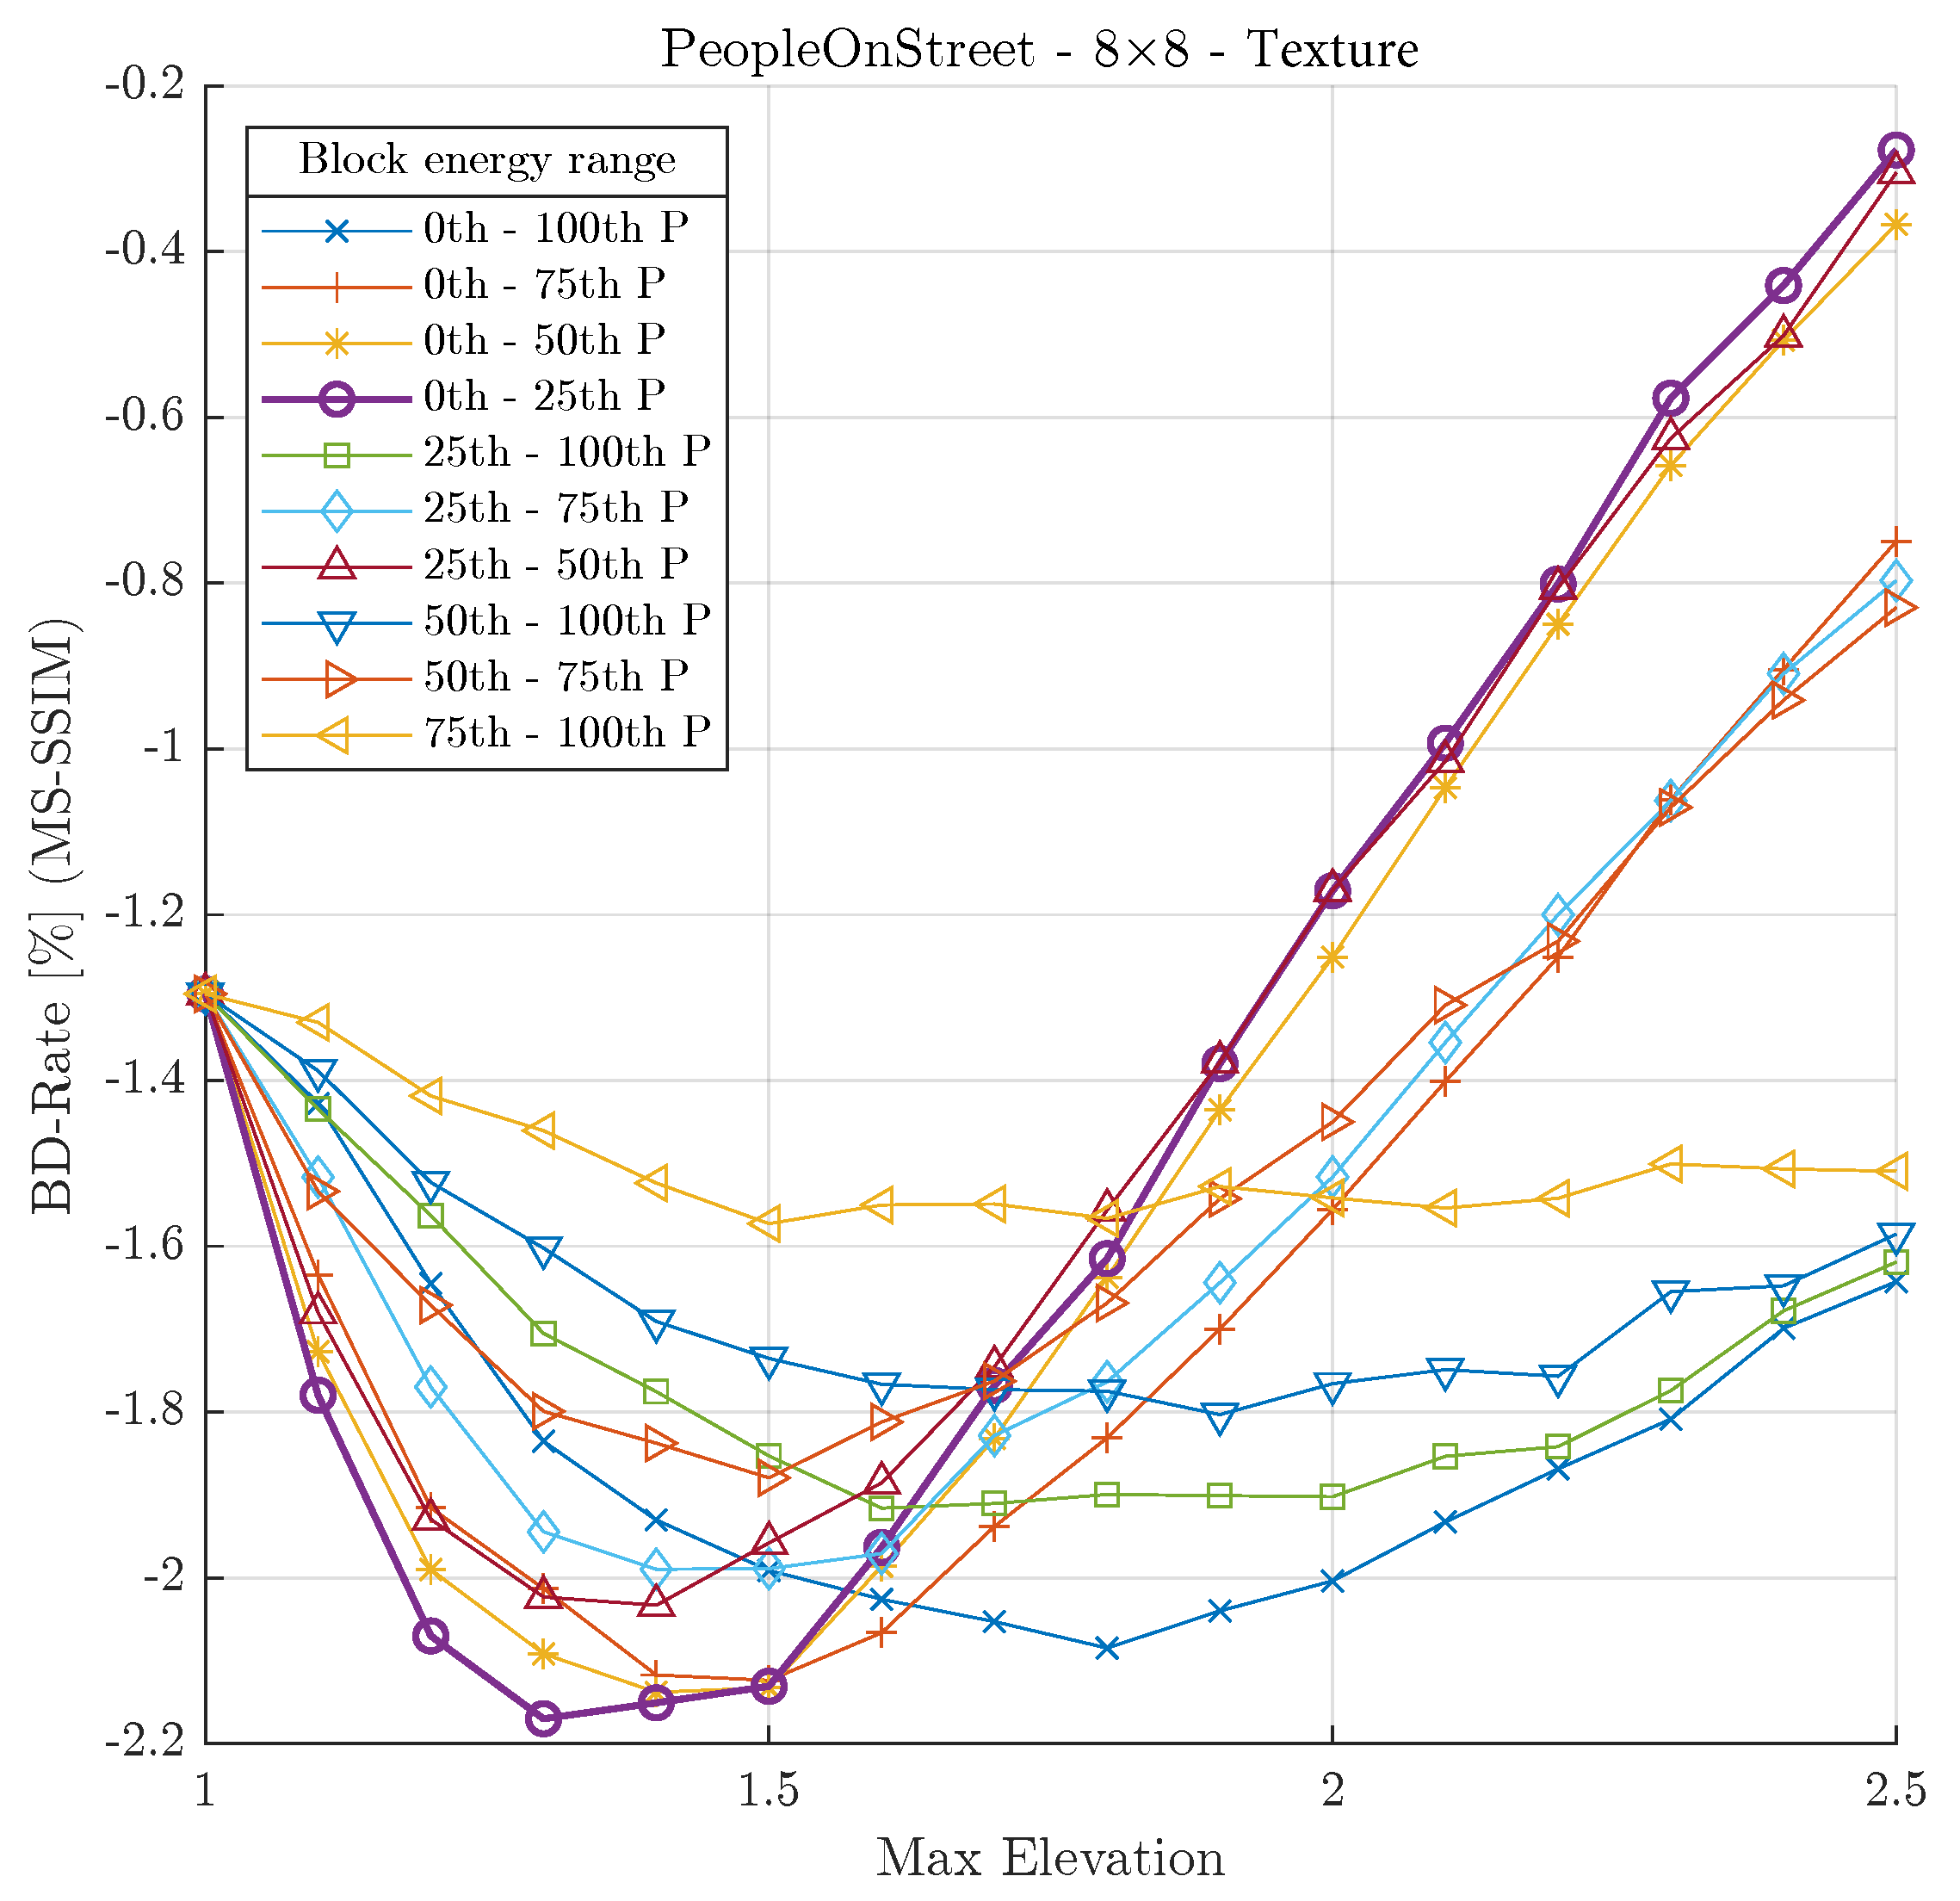
As an example, applying the optimum parameter set for texture blocks of size 8×8 in the PeopleOnStreet video test sequence is shown in
Figure 11. This figure shows the evolution of the BD-rate (lower is better) for different values of the
parameter. Each curve corresponds to a certain block energy range (
and
parameters). It can be seen that, for this particular case, the energy range from the 0th to 25th percentile (purple curve with circle marks) obtains the highest BD-rate gain when
.
The BD-rate performance for all of the objective quality metrics used after applying the optimal parameters is shown in
Table 5. Each column shows the results of applying the optimal over-quantization values only to blocks of the corresponding block type and size.
4. Results and Discussion
To analyze the behavior of our HEVC perceptual quantizer proposal as a whole, we performed an exhaustive evaluation of the contrast and texture masking models that were described in the previous sections. Following the recommendations defined in the HEVC conformance test [
34], we have employed (a) all video test sequences proposed, grouping the results by the classes they belong to (see
Table 1); (b) the Bjøntegaard BD-rate metric [
31] using the SSIM, MS-SSIM and PSNR-HVS-M as the perceptual video quality metrics. QP values of 22, 27, 32 and 37 were used to compute the BD-rate.
The implementation of our proposed contrast and texture masking models has been deployed using the HEVC Reference Software version 16.20 [
33], running on an Intel Xeon E5-2620 v2 (Intel 64 architecture with 24 cores).
To make texture masking compliant with the HEVC standard (in other words, to make the resulting bitstream readable with any HEVC-compliant decoder), we signaled the corresponding QP offset values at CU level because the HEVC standard allows the transmission of a delta QP value for each CU block; that is, the difference in QP steps relative to the slice of QP that it belongs to [
39].
Table 6,
Table 7 and
Table 8 show the results after encoding the whole set of video test sequences for all intra, random access and low delay coding configurations, respectively. In these tables, the “Contrast masking” column shows the gains that were obtained by applying only our CSF proposal presented in
Section 3.1, while the “Contrast & Texture masking” column shows the total gains of applying the CSF and texture masking proposals, as explained in
Section 3.3.
As expected, applying both contrast and texture masking techniques gives higher gains than applying contrast masking alone. For both of the structural information-based metrics (i.e., SSIM and MS-SSIM), the difference between using or not texture masking implies an average BD-rate reduction of for all intra (AI), for random access (RA) and for low delay (LD) configurations. Regarding the PSNR-HVS-M metric, the benefit achieved by adding texture masking scheme is lower, with an average BD-rate reduction of , and for AI, RA and LD, respectively. It seems that this metric does not take into special consideration the effect of texture masking generated by over-quantizing blocks with higher energy.
The highest BD-rate gains are obtained for video test sequences that belongs to medium and low-resolution video sequences (i.e., classes C and D), with an average gain between and , depending on the metric and base configuration used.
The lowest gains are obtained for class A and class E, obtaining a BD-rate gains between and , on average.
As expected, the perceptual performance obtained by our contrast and texture masking proposals is highly dependent on the sequence type and its content but, on average, BD-rate savings of more than are obtained, with particular cases achieving up to .
As an example, the behavior of the first frame of the BQSquare sequence for all of the intra-configurations will be analyzed. In
Figure 12 , we show the R/D curves for the first frame. As can be seen, our proposal improves the perceptual performance of the reconstructed frame for all of the metrics used. The contrast and texture masking scheme (yellow line) has the highest performance.
It is also worth noting that our proposal achieves the highest bit rate savings at low compression rates, as can be seen in
Figure 12, where for a QP of 22 we have a bit rate of
Mbps for default coding,
Mbps when contrast masking is used and
Mbps when contrast and texture masking are used; in other words, a
of bit rate saving.
For perceptual quality,
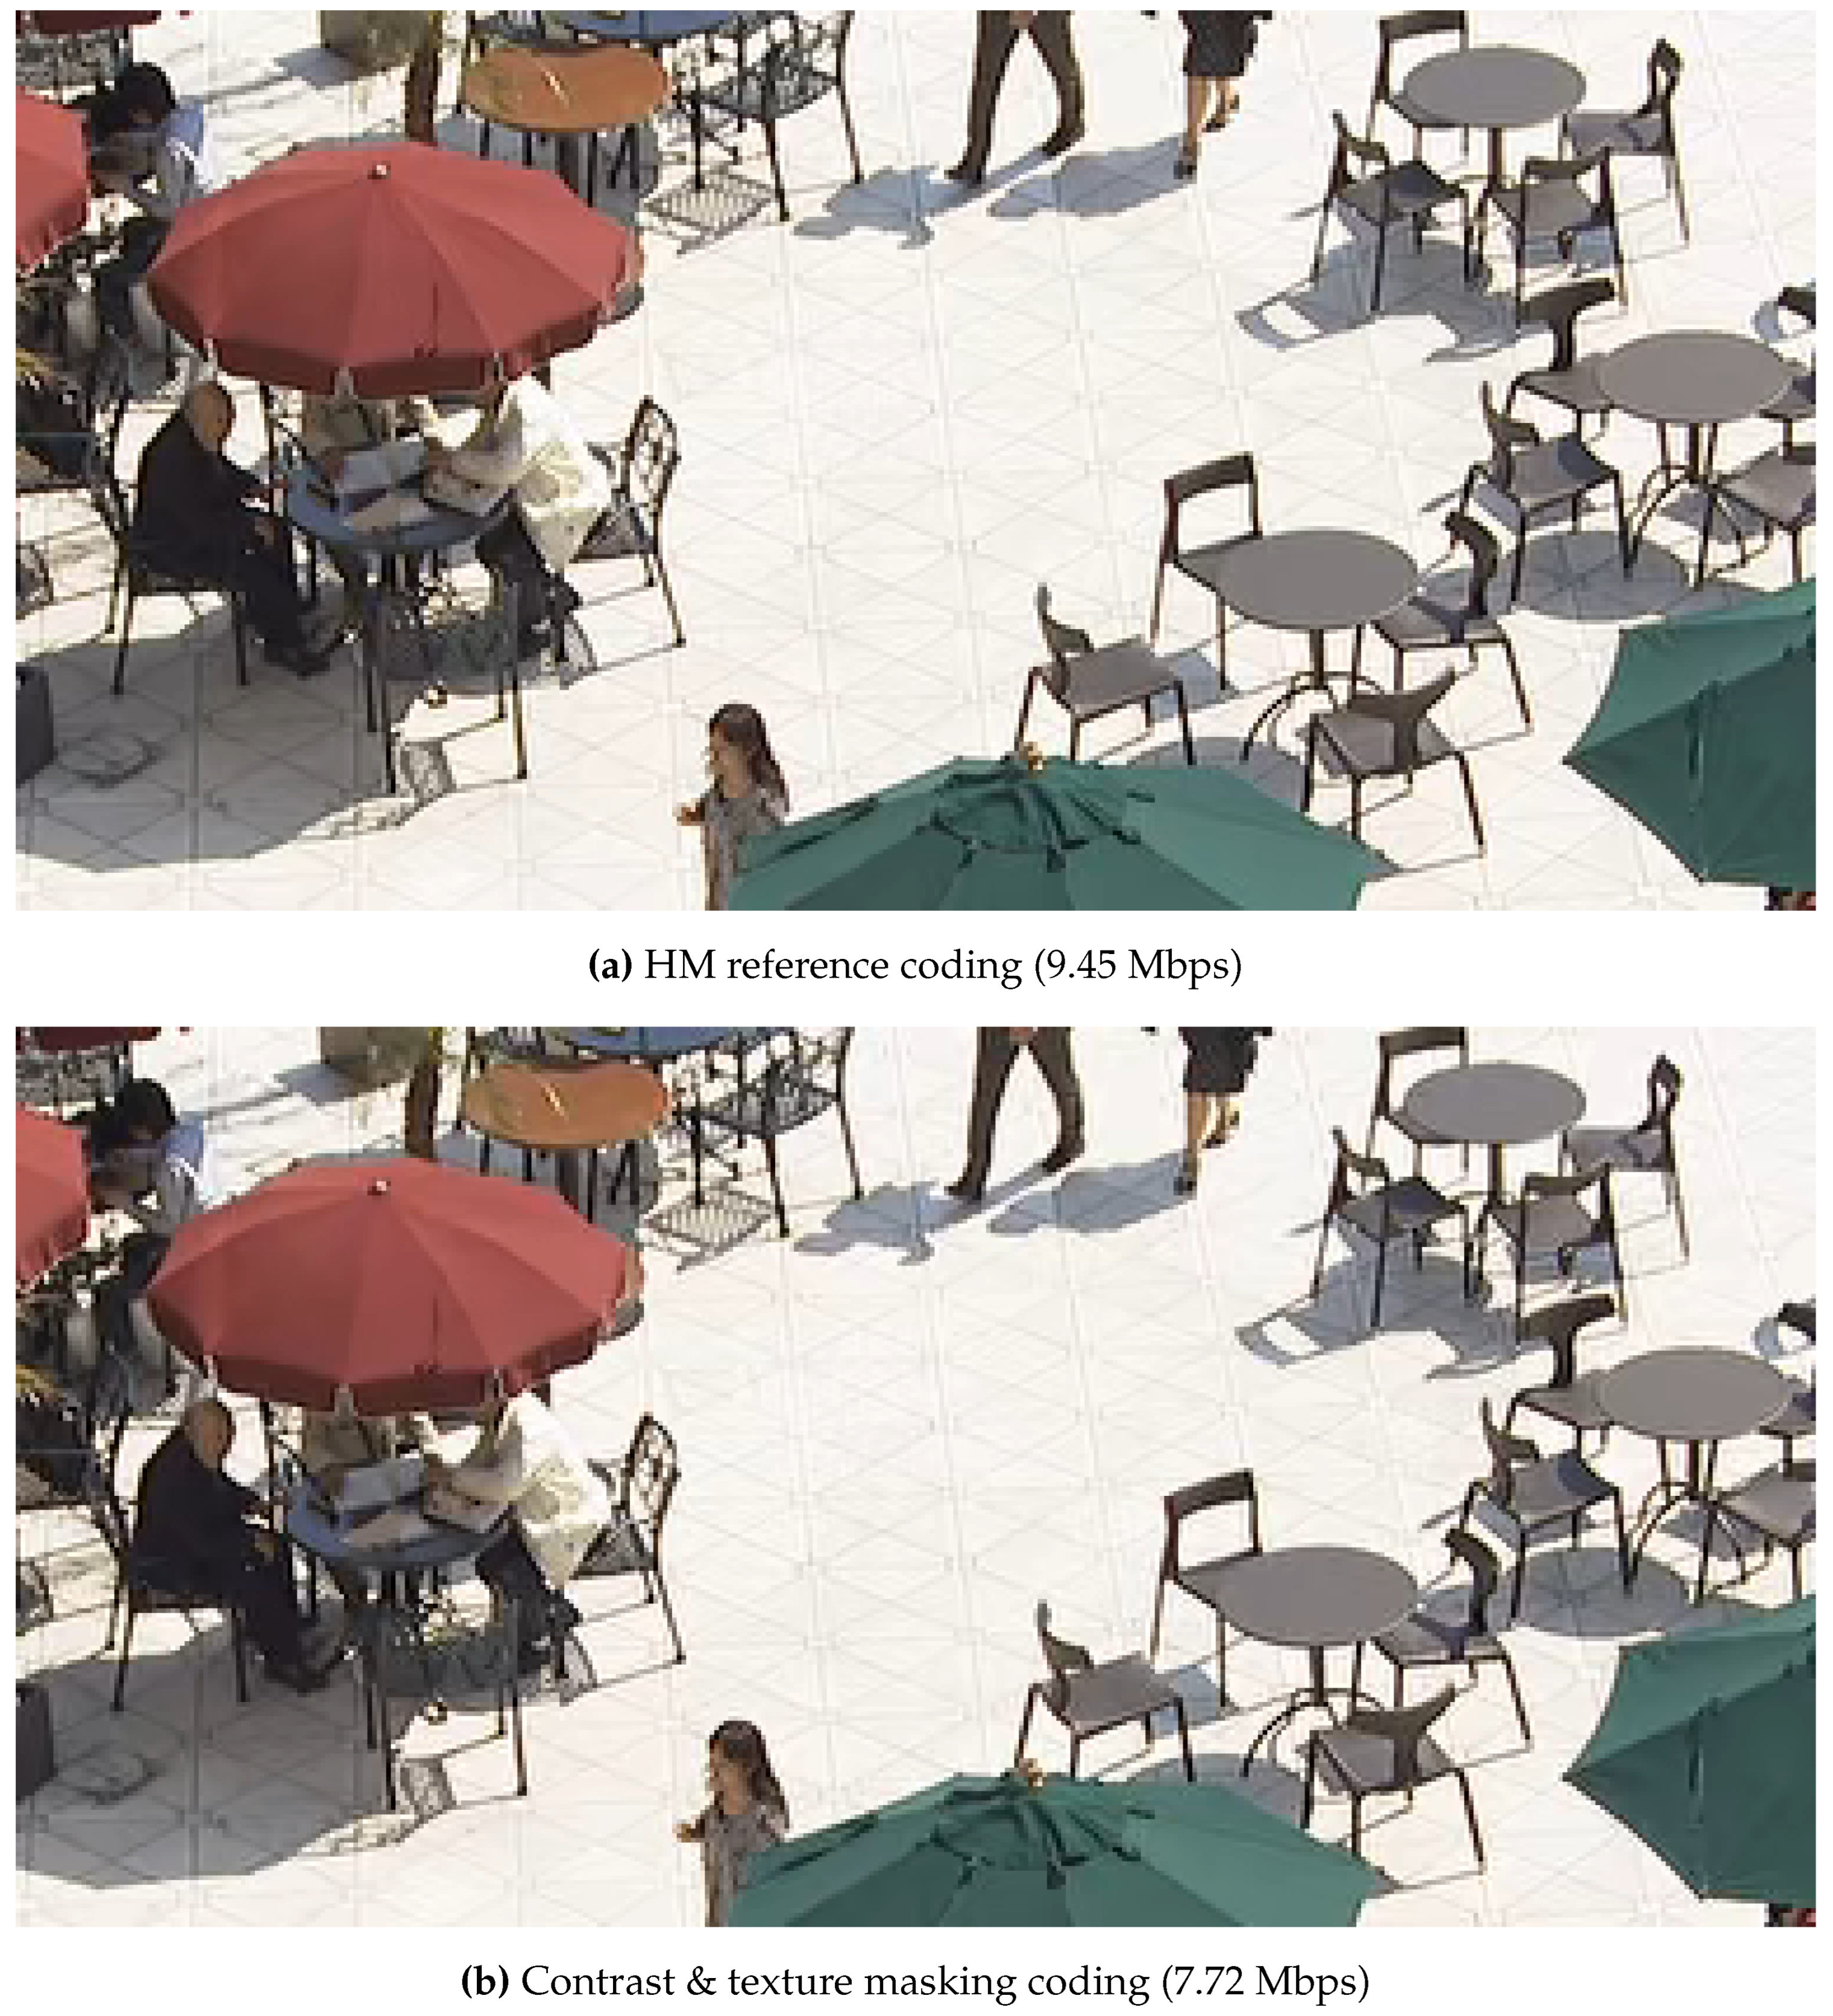
Figure 13 compares the first frame of the BQSquare sequence encoded with
, whose bit rate savings we have analyzed in the previous paragraph. In this case, we compare the result of the default encoding (
Figure 13a) versus the encoding using our proposed contrast and texture masking (
Figure 13b). After performing a subjective analysis it is quite difficult to see any difference between the two pictures.
In terms of Rate-Distortion, our proposal manages to save a significant number of bits at the cost of a very low perceptual quality reduction.
5. Conclusions and Future Work
Compression techniques based on the HVS (e.g., texture and contrast masking) have been used for years, which proves that they are mechanisms capable of reducing the rate without impairing the image quality. In this work, we have developed a novel scheme by efficiently combining contrast and texture masking techniques for the HEVC Reference Software showing the ability to reduce the bit rate while maintaining similar perceptual quality. We have proved that by adding our proposed non-uniform quantization matrix, we obtain an average BD-rate reduction for all of the video test sequence and the three coding modes that ranges from (SSIM) to (PSNR-HVS-M).
We have also developed a new block classification algorithm using the mean directional variance of the image blocks and a supported vector machine that leads to a texture masking model that, in combination with contrast masking, achieves an overall average BD-rate reduction between (SSIM) and (MS-SSIM).
In our future work, we will (a) study the inclusion of texture over-quantization for 4×4 blocks in the HEVC Reference Software to further improve the RD performance of our texture masking model; (b) develop a pre-processing stage to determine when masking should not be applied at frame level because there are sequences that hardly get any perceptual benefit from it; and (c) evaluate other perceptual coding techniques, such as the luminance masking, or the use of attention and focus metrics, which in combination with the techniques presented in this study could be able to outperform the perceptual RD performance of the HEVC Reference Software.
Author Contributions
Funding acquisition, O.L.G. and G.F.E; Investigation, J.R.A., D.R.C, M.M.R, G.V.W. and M.P.M; Software, J.R.A, D.R.C., G.F.E and M.M.R.; Supervision, M.P.M., O.L.G and G.V.W.; Validation, O.L.G. and M.P.M.;Writing—original draft, J.R.A., M.P.M., G.V.W., M.M.R. and O.L.G.;Writing—review & editing, M.P.M., G.F.E, G.V.W. and O.L.G.
Funding
This research was funded by MCIN/AEI/10.13039/501100011033 and by “ERDF A way of making Europe” under grants PID2021-123627OB-C55 and PID2021-123627OB-C52. This research has also been funded by the Valencian Ministry of Innovation, Universities, Science and Digital Society (Generalitat Valenciana) under grants CIAICO/2021/278 and GV/2021/152 as well as by Junta de Comunidades de Castilla-La Mancha under grant SBPLY/21/180501/000195.
Data Availability Statement
The data presented in this study are available on request from the corresponding author due to privacy.
Conflicts of Interest
The authors declare no conflicts of interest.
References
- Gao, X.; Lu, W.; Tao, D.; Li, X. Image quality assessment and human visual system. Visual Communications and Image Processing 2010. International Society for Optics and Photonics, SPIE, 2010, Vol. 7744, pp. 316–325. [CrossRef]
- Ngan, K.N.; Leong, K.S.; Singh, H. Adaptive cosine transform coding of images in perceptual domain. IEEE Transactions on Acoustics, Speech, and Signal Processing 1989, 37, 1743–1750. [Google Scholar] [CrossRef]
- Chitprasert, B.; Rao, K.R. Human visual weighted progressive image transmission. IEEE Trans. on Communications 1990, 38, 1040–1044. [Google Scholar] [CrossRef]
- Nill, N. A visual model weighted cosine transform for image compression and quality assessment. IEEE Trans. on Communications 1985, 33, 551–557. [Google Scholar] [CrossRef]
- Mannos, J.; Sakrison, D. The effects of a visual fidelity criterion of the encoding of images. IEEE Transactions on Information Theory 1974, 20, 525–536. [Google Scholar] [CrossRef]
- Tong, H.; Venetsanopoulos, A. A perceptual model for JPEG applications based on block classification, texture masking, and luminance masking. Proceedings 1998 International Conference on Image Processing. ICIP98 (Cat. No.98CB36269), 1998, pp. 428–432 vol.3. [CrossRef]
- ISO/IEC 10918-1/ITU-T Recommendation T.81. Digital Compression and Coding of Continuous-Tone Still Image, 1992.
- Zhang, X.; Lin, W.; Xue, P. Improved estimation for just-noticeable visual distortion. Signal Processing 2005, 85, 795–808. [Google Scholar] [CrossRef]
- Wei, Z.; Ngan, K.N. Spatio-temporal just noticeable distortion profile for grey scale image/video in DCT domain. IEEE Transactions on Circuits and Systems for Video Technology 2009, 19, 337–346. [Google Scholar] [CrossRef]
- Wang, Y.; Zhang, C.; Kaithaapuzha, S. Visual Masking Model Implementation for Images & Video. EE368 spring final paper 2009/2010, 2010.
- Ma, L.; Ngan, K.N. Adaptive block-size transform based just-noticeable difference profile for videos. Proceedings of 2010 IEEE International Symposium on Circuits and Systems, 2010, pp. 4213–4216. [CrossRef]
- Othman, Z.; Abdullah, A. An adaptive threshold based on multiple resolution levels for canny edge detection. Recent Trends in Information and Communication Technology; Springer International Publishing: Cham, 2018; pp. 316–323. [Google Scholar] [CrossRef]
- Gong, X.; Lu, H. Towards fast and robust watermarking scheme for H.264 Video. 2008 Tenth IEEE International Symposium on Multimedia, 2008, pp. 649–653. [CrossRef]
- Mak, C.; Ngan, K.N. Enhancing compression rate by just-noticeable distortion model for H.264/AVC. 2009 IEEE International Symposium on Circuits and Systems, 2009, pp. 609–612. [CrossRef]
- MPEG Test Model Editing Committee. MPEG-2 Test Model 5. Sydney MPEG meeting. Document: ISO/IEC JTC1/SC29/WG11 N400, 1993.
- Tang, C.W.; Chen, C.H.; Yu, Y.H.; Tsai, C.J. Visual sensitivity guided bit allocation for video coding. IEEE Transactions on Multimedia 2006, 8, 11–18. [Google Scholar] [CrossRef]
- McCann, K.; Rosewarne, C.; Bross, B.; Naccari, M.; Sharman, K. High Efficiency Video Coding (HEVC) Test Model 16 (HM 16) Encoder Description. 18th Meeting of the Joint Collaborative Team on Video Coding (JCT-VC), Sapporo. Document: JCTVC-R1002, 2014.
- Prangnell, L.; Hernández-Cabronero, M.; Sanchez, V. Coding block-level perceptual video coding for 4:4:4 data in HEVC. 2017 IEEE International Conference on Image Processing (ICIP), 2017, pp. 2488–2492. [CrossRef]
- Kim, J.; Bae, S.H.; Kim, M. An HEVC-compliant perceptual video coding scheme based on JND models for variable block-sized transform kernels. IEEE Transactions on Circuits and Systems for Video Technology 2015, 25, 1786–1800. [Google Scholar] [CrossRef]
- Wang, M.; Ngan, K.N.; Li, H.; Zeng, H. Improved block level adaptive quantization for high efficiency video coding. 2015 IEEE International Symposium on Circuits and Systems (ISCAS), 2015, pp. 509–512. [CrossRef]
- Xiang, G.; Jia, H.; Yang, M.; Liu, J.; Zhu, C.; Li, Y.; Xie, X. An improved adaptive quantization method based on perceptual CU early splitting for HEVC. 2017 IEEE International Conference on Consumer Electronics (ICCE), 2017, pp. 362–365. [CrossRef]
- Zhang, F.; Bull, D.R. HEVC enhancement using content-based local QP selection. 2016 IEEE International Conference on Image Processing (ICIP), 2016, pp. 4215–4219. [CrossRef]
- Marzuki, I.; Sim, D. Perceptual adaptive quantization parameter selection using deep convolutional features for HEVC encoder. IEEE Access 2020, 8, 37052–37065. [Google Scholar] [CrossRef]
- Bosse, S.; Dietzel, M.; Becker, S.; Helmrich, C.R.; Siekmann, M.; Schwarz, H.; Marpe, D.; Wiegand, T. Neural Network Guided Perceptually Optimized Bit-Allocation for Block-Based Image and Video Compression. 2019 IEEE International Conference on Image Processing (ICIP), 2019, pp. 126–130. [CrossRef]
- Girod, B. , MA, USA, 1993; p. 207–220.Error. In Digital Images and Human Vision; MIT Press: Cambridge, MA, USA, 1993; pp. 207–220. [Google Scholar]
- Eskicioglu, A.M.; Fisher, P.S. Image quality measures and their performance. IEEE Transactions on Communications 1995, 43, 2959–2965. [Google Scholar] [CrossRef]
- Zhou Wang. ; Bovik, A.C.; Sheikh, H.R.; Simoncelli, E.P. Image quality assessment: from error visibility to structural similarity. IEEE Transactions on Image Processing 2004, 13, 600–612. [Google Scholar] [CrossRef]
- Wang, Z.; Simoncelli, E.P.; Bovik, A.C. Multiscale structural similarity for image quality assessment. The Thrity-Seventh Asilomar Conference on Signals, Systems Computers, 2003, 2003, Vol. 2, pp. 1398–1402 Vol2. [Google Scholar] [CrossRef]
- Ponomarenko, N.; Silvestri, F.; Egiazarian, K.; Carli, M.; Astola, J.; Lukin, V. On between-coefficient contrast masking of DCT basis functions. Proceedings of the Third International Workshop on Video Processing and Quality Metrics, 2007, Vol. 4.
- Martínez-Rach, M.O. Perceptual image coding for wavelet based encoders. PhD thesis, Universidad Miguel Hernández de Elche, 2014.
- Bjontegaard, G. Calculation of average PSNR differences between RD-Curves. Proc. of the ITU-T Video Coding Experts Group - Thirteenth Meeting, 2001.
- Haque, M.; Tabatabai, A.; Morigami, Y. HVS model based default quantization matrices. 7th Meeting of the Joint Collaborative Team on Video Coding (JCT-VC). Document: JCTVC-G880, 2011.
- Fraunhofer Institute for Telecommunications. HM Reference Software Version 16.20. https://vcgit.hhi.fraunhofer.de/jvet/HM/-/tags/HM-16.20, 2018.
- Bossen, F. Common test conditions and software reference. 11th Meeting of the Joint Collaborative Team on Video Coding (JCT-VC). Doc. JCTVC-K1100, 2012.
- Atencia, J.R.; Granado, O.L.; Malumbres, M.P.; Martínez-Rach, M.O.; GlennVan Wallendael. Analysis of the perceptual quality performance of different HEVC coding tools. IEEE Access 2021, 9, 37510–37522. [Google Scholar] [CrossRef]
- Ruiz-Coll, D.; Fernández-Escribano, G.; Martínez, J.L.; Cuenca, P. Fast intra mode decision algorithm based on texture orientation detection in HEVC. Signal Processing: Image Communication 2016, 44, 12–28. [Google Scholar] [CrossRef]
- Kundu, D.; Evans, B.L. Full-reference visual quality assessment for synthetic images: A subjective study. 2015 IEEE International Conference on Image Processing (ICIP), 2015, pp. 2374–2378. [CrossRef]
- Asuni, N.; Giachetti, A. TESTIMAGES: a large-scale archive for testing visual devices and basic image processing algorithms. Smart Tools and Apps for Graphics - Eurographics Italian Chapter Conference; Giachetti, A., Ed. The Eurographics Association, 2014. [CrossRef]
- Sze, V.; Budagavi, M.; Sullivan, G.J. High Efficiency Video Coding (HEVC): Algorithms and Architectures; Integrated Circuits and Systems, Springer, 2014.
Figure 1.
Default HEVC quantization weighting matrices.
Figure 1.
Default HEVC quantization weighting matrices.
Figure 2.
Contrast Sensitivity Function.
Figure 2.
Contrast Sensitivity Function.
Figure 3.
Proposed 4×4 quantization weighting matrices.
Figure 3.
Proposed 4×4 quantization weighting matrices.
Figure 4.
Rate-Distortion curves comparing our proposed CSF with the default implemented in the HEVC standard using different perceptual metrics. Figures (a) and (b) correspond to the BQTerrace sequence of class B, while figures (c) and (d) correspond to the ChinaSpeed sequence of class F.
Figure 4.
Rate-Distortion curves comparing our proposed CSF with the default implemented in the HEVC standard using different perceptual metrics. Figures (a) and (b) correspond to the BQTerrace sequence of class B, while figures (c) and (d) correspond to the ChinaSpeed sequence of class F.
Figure 5.
Samples of manually classified blocks (left-hand) and their associated polar diagram of the MDV metric (right-hand). From top to bottom: , and block sizes; from left- to right-hand: plain, edge and texture blocks.
Figure 5.
Samples of manually classified blocks (left-hand) and their associated polar diagram of the MDV metric (right-hand). From top to bottom: , and block sizes; from left- to right-hand: plain, edge and texture blocks.
Figure 6.
(a) Scatter plot of manually classified blocks (training dataset), and (b) the classification results provided by the trained SVM model (testing dataset).
Figure 6.
(a) Scatter plot of manually classified blocks (training dataset), and (b) the classification results provided by the trained SVM model (testing dataset).
Figure 7.
Example of block classification for the first frame of sequence BasketballDrill, using optimal SVM models for each block size.
Figure 7.
Example of block classification for the first frame of sequence BasketballDrill, using optimal SVM models for each block size.
Figure 8.
Box and whisker plot of the block energy () distribution by size and texture classification.
Figure 8.
Box and whisker plot of the block energy () distribution by size and texture classification.
Figure 9.
Representation of Equation (
3) for two sets of function parameter, a)
,
and
and b)
,
and
.
is different for each set.
Figure 9.
Representation of Equation (
3) for two sets of function parameter, a)
,
and
and b)
,
and
.
is different for each set.
Figure 10.
Flowchart of candidate selection for brute force analysis of perceptually optimal parameters. The Ps in energy range boxes refer to the percentile.
Figure 10.
Flowchart of candidate selection for brute force analysis of perceptually optimal parameters. The Ps in energy range boxes refer to the percentile.
Figure 11.
BD-rate curves (MS-SSIM metric) for PeopleOnStreet video test sequence over the parameter when modifying texture blocks of size 8. Each curve represents a different block energy range ( and ).
Figure 11.
BD-rate curves (MS-SSIM metric) for PeopleOnStreet video test sequence over the parameter when modifying texture blocks of size 8. Each curve represents a different block energy range ( and ).
Figure 12.
Rate-Distortion curves of the first frame of the BQSquare sequence, comparing our proposed contrast masking (red line) and contrast and texture masking (yellow line) with the HM reference coding (blue line), using the (a) SSIM, (b) MS-SSIM and (c) PSNR-HVS-M perceptual metrics.
Figure 12.
Rate-Distortion curves of the first frame of the BQSquare sequence, comparing our proposed contrast masking (red line) and contrast and texture masking (yellow line) with the HM reference coding (blue line), using the (a) SSIM, (b) MS-SSIM and (c) PSNR-HVS-M perceptual metrics.
Figure 13.
Visual comparison of the first frame of the BQSquare sequence encoded at . On the left-hand side is the HM reference encoded, and on the right-hand side is the frame encoded with contrast and texture masking.
Figure 13.
Visual comparison of the first frame of the BQSquare sequence encoded at . On the left-hand side is the HM reference encoded, and on the right-hand side is the frame encoded with contrast and texture masking.
Table 1.
HEVC video test sequence properties.
Table 1.
HEVC video test sequence properties.
| Class |
Sequence
name |
Resolution |
Frame
count |
Frame
rate |
Bit
depth |
| A |
Traffic |
2560x1600 |
150 |
30 |
8 |
| |
PeopleOnStreet |
|
150 |
30 |
8 |
| |
Nebuta |
|
300 |
60 |
10 |
| |
SteamLocomotive |
|
300 |
60 |
10 |
| B |
Kimono |
1920x1080 |
240 |
24 |
8 |
| |
ParkScene |
|
240 |
24 |
8 |
| |
Cactus |
|
500 |
50 |
8 |
| |
BQTerrace |
|
600 |
60 |
8 |
| |
BasketballDrive |
|
500 |
50 |
8 |
| C |
RaceHorses |
832x480 |
300 |
30 |
8 |
| |
BQMall |
|
600 |
60 |
8 |
| |
PartyScene |
|
500 |
50 |
8 |
| |
BasketballDrill |
|
500 |
50 |
8 |
| D |
RaceHorses |
416x240 |
300 |
30 |
8 |
| |
BQSquare |
|
600 |
60 |
8 |
| |
BlowingBubbles |
|
500 |
50 |
8 |
| |
BasketballPass |
|
500 |
50 |
8 |
| E |
FourPeople |
1280x720 |
600 |
60 |
8 |
| |
Johnny |
|
600 |
60 |
8 |
| |
KristenAndSara |
|
600 |
60 |
8 |
| F |
BaskeballDrillText |
832x480 |
500 |
50 |
8 |
| |
ChinaSpeed |
1024x768 |
500 |
30 |
8 |
| |
SlideEditing |
1280x720 |
300 |
30 |
8 |
| |
SlideShow |
|
500 |
20 |
8 |
Table 2.
Average coding performance [% BD-rate] when using our proposed weighting matrix (intra prediction).
Table 2.
Average coding performance [% BD-rate] when using our proposed weighting matrix (intra prediction).
Sequence
Class |
SCL = 1 (HEVC presets) |
SCL = 2 (ours) |
| |
SSIM |
MS-SSIM |
PSNR-
HVS-M
|
SSIM |
MS-SSIM |
PSNR-
HVS-M
|
| Class A |
-0.66 |
-0.33 |
-0.62 |
-1.06 |
-0.82 |
-1.58 |
| Class B |
-0.97 |
-0.48 |
-0.99 |
-3.20 |
-2.58 |
-4.23 |
| Class C |
0.26 |
0.08 |
-0.08 |
-4.82 |
-5.36 |
-7.39 |
| Class D |
1.26 |
0.29 |
-0.05 |
-1.36 |
-5.66 |
-7.65 |
| Class E |
-0.74 |
-0.50 |
-0.75 |
-1.78 |
-1.39 |
-1.98 |
| Class F |
-0.15 |
-0.04 |
-0.11 |
-4.57 |
-4.19 |
-4.17 |
| Average |
-0.17 |
-0.16 |
-0.43 |
-2.80 |
-3.33 |
-4.48 |
Table 3.
Optimized SVM models: parameters and accuracy.
Table 3.
Optimized SVM models: parameters and accuracy.
Model
parameters |
Block Size |
| |
8×8 |
16×16 |
32×32 |
| Kernel function |
linear |
linear |
linear |
| Kernel scale |
auto |
auto |
auto |
| Box constraint level |
85 |
285 |
35 |
| Multi-class method |
One-vs-All |
One-vs-One |
One-vs-All |
| Standardize data |
true |
true |
true |
| Model accuracy |
93.9% |
95.4% |
94.5% |
Table 4.
Optimal linear function parameters.
Table 4.
Optimal linear function parameters.
| Classification |
Parameter |
Block Size |
| |
|
8×8 |
16×16 |
32×32 |
| Texture |
MinE |
2864 |
9712 |
29952 |
| |
MaxE |
26256 |
26800 |
216880 |
| |
MaxElevation |
1.3 |
1.2 |
2.2 |
| Edge |
MinE |
1520 |
4320 |
14320 |
| |
MaxE |
5424 |
52016 |
63504 |
| |
MaxElevation |
1.2 |
1.3 |
1.2 |
Table 5.
Average coding performance [% BD-rate] after applying the optimal values derived from our texture masking proposal.
Table 5.
Average coding performance [% BD-rate] after applying the optimal values derived from our texture masking proposal.
| Class |
Metric |
Texture blocks |
Edge blocks |
| |
|
8×8 |
16×16 |
32×32 |
8×8 |
16×16 |
32×32 |
| A |
SSIM |
-1.04 |
-0.98 |
-1.01 |
-0.67 |
-1.07 |
-1.05 |
| |
MS-SSIM |
-0.87 |
-0.76 |
-0.80 |
-0.46 |
-0.80 |
-0.82 |
| |
PSNR-HVS-M |
-1.69 |
-1.44 |
-1.52 |
-1.26 |
-1.52 |
-1.57 |
| B |
SSIM |
-3.74 |
-3.14 |
-3.15 |
-3.03 |
-3.21 |
-3.19 |
| |
MS-SSIM |
-3.02 |
-2.47 |
-2.52 |
-2.34 |
-2.56 |
-2.57 |
| |
PSNR-HVS-M |
-4.58 |
-4.05 |
-4.17 |
-3.90 |
-4.16 |
-4.21 |
| E |
SSIM |
-2.12 |
-1.74 |
-1.77 |
-1.48 |
-1.87 |
-1.78 |
| |
MS-SSIM |
-1.68 |
-1.35 |
-1.40 |
-0.98 |
-1.50 |
-1.39 |
| |
PSNR-HVS-M |
-2.14 |
-1.89 |
-1.96 |
-1.17 |
-2.02 |
-1.99 |
Table 6.
Average coding performance in all of the intra-configuration [% BD-rate]
Table 6.
Average coding performance in all of the intra-configuration [% BD-rate]
| Class |
Sequence name |
Contrast masking |
Contrast & texture masking |
| |
|
SSIM |
MS-SSIM |
PSNR-
HVS-M
|
SSIM |
MS-SSIM |
PSNR-
HVS-M
|
| A |
Traffic |
-1.00 |
-0.93 |
-1.77 |
-2.25 |
-1.89 |
-2.05 |
| |
PeopleOnStreet |
-1.23 |
-1.27 |
-1.95 |
-3.38 |
-2.98 |
-2.54 |
| |
Nebuta |
-1.22 |
-0.39 |
-1.64 |
-2.40 |
-1.70 |
-1.85 |
| |
SteamLocomotiveTrain |
-0.80 |
-0.67 |
-0.98 |
-0.05 |
-0.04 |
-0.36 |
| |
Average |
-1.06 |
-0.82 |
-1.58 |
-2.02 |
-1.65 |
-1.70 |
| B |
Kimono |
-0.50 |
-0.41 |
-0.89 |
-0.53 |
-0.35 |
-0.81 |
| |
ParkScene |
-2.26 |
-1.67 |
-3.11 |
-3.82 |
-2.91 |
-3.75 |
| |
Cactus |
-2.97 |
-2.26 |
-4.06 |
-5.10 |
-3.94 |
-4.83 |
| |
BQTerrace |
-6.68 |
-5.44 |
-7.82 |
-9.61 |
-8.09 |
-8.89 |
| |
BasketballDrive |
-3.61 |
-3.11 |
-5.27 |
-5.05 |
-4.31 |
-5.66 |
| |
Average |
-3.20 |
-2.58 |
-4.23 |
-4.82 |
-3.92 |
-4.79 |
| C |
RaceHorses |
-4.80 |
-5.60 |
-7.62 |
-7.60 |
-8.21 |
-9.07 |
| |
BQMall |
-3.28 |
-3.53 |
-4.96 |
-5.09 |
-5.26 |
-5.58 |
| |
PartyScene |
-6.51 |
-7.45 |
-9.89 |
-8.22 |
-9.19 |
-10.75 |
| |
BasketballDrill |
-4.70 |
-4.86 |
-6.58 |
-7.46 |
-7.66 |
-7.86 |
| |
Average |
-4.82 |
-5.36 |
-7.26 |
-7.09 |
-7.58 |
-8.31 |
| D |
RaceHorses |
-0.63 |
-3.00 |
-5.71 |
-2.43 |
-5.67 |
-6.91 |
| |
BQSquare |
-2.81 |
-9.24 |
-10.12 |
-6.25 |
-14.24 |
-12.30 |
| |
BlowingBubbles |
-0.28 |
-6.16 |
-9.39 |
-1.33 |
-7.74 |
-9.87 |
| |
BasketballPass |
-1.74 |
-4.25 |
-5.39 |
-3.65 |
-7.07 |
-6.84 |
| |
Average |
-1.36 |
-5.66 |
-7.65 |
-3.41 |
-8.68 |
-8.98 |
| E |
FourPeople |
-1.54 |
-1.27 |
-1.81 |
-2.75 |
-2.25 |
-1.98 |
| |
Johnny |
-1.65 |
-1.00 |
-1.87 |
-2.98 |
-2.25 |
-1.85 |
| |
KristenAndSara |
-2.15 |
-1.88 |
-2.26 |
-4.42 |
-3.87 |
-2.98 |
| |
Average |
-1.78 |
-1.39 |
-1.98 |
-3.38 |
-2.79 |
-2.27 |
| F |
BasketballDrillText |
-4.74 |
-4.89 |
-5.97 |
-7.88 |
-8.08 |
-7.64 |
| |
ChinaSpeed |
-6.25 |
-5.41 |
-5.34 |
-9.94 |
-8.84 |
-7.26 |
| |
SlideEditing |
-1.85 |
-1.57 |
-1.51 |
-3.51 |
-3.08 |
-2.89 |
| |
SlideShow |
-5.45 |
-4.88 |
-3.84 |
-8.78 |
-7.93 |
-5.32 |
| |
Average |
-4.57 |
-4.19 |
-4.17 |
-7.52 |
-6.98 |
-5.78 |
| |
Class average |
-2.80 |
-3.33 |
-4.48 |
-4.71 |
-5.27 |
-5.30 |
Table 7.
Average coding performance in random access configuration [% BD-rate]
Table 7.
Average coding performance in random access configuration [% BD-rate]
| Class |
Sequence name |
Constrast masking |
Contrast & texture masking |
| |
|
SSIM |
MS-SSIM |
PSNR-
HVS-M
|
SSIM |
MS-SSIM |
PSNR-
HVS-M
|
| A |
Traffic |
-1.60 |
-1.30 |
-2.41 |
-4.12 |
-3.87 |
-4.07 |
| |
PeopleOnStreet |
-0.98 |
-0.81 |
-1.30 |
-6.38 |
-5.95 |
-4.36 |
| |
Nebuta |
-2.16 |
-1.19 |
-1.55 |
-3.53 |
-2.17 |
-1.05 |
| |
SteamLocomotiveTrain |
-0.92 |
-0.74 |
-0.93 |
-0.79 |
-0.63 |
-0.51 |
| |
Average |
-1.42 |
-1.01 |
-1.55 |
-3.71 |
-3.15 |
-2.50 |
| B |
Kimono |
-0.39 |
-0.30 |
-0.64 |
-0.75 |
-0.60 |
-0.62 |
| |
ParkScene |
-2.72 |
-1.86 |
-3.30 |
-5.02 |
-4.11 |
-4.68 |
| |
Cactus |
-3.19 |
-2.60 |
-4.75 |
-5.52 |
-4.65 |
-5.84 |
| |
BQTerrace |
-12.00 |
-10.32 |
-12.82 |
-15.89 |
-13.59 |
-14.28 |
| |
BasketballDrive |
-3.21 |
-3.20 |
-5.33 |
-6.15 |
-5.91 |
-6.59 |
| |
Average |
-4.30 |
-3.66 |
-5.37 |
-6.67 |
-5.77 |
-6.40 |
| C |
RaceHorses |
-4.48 |
-4.89 |
-6.88 |
-8.66 |
-9.00 |
-9.39 |
| |
BQMall |
-3.31 |
-3.37 |
-4.98 |
-6.71 |
-6.76 |
-7.13 |
| |
PartyScene |
-5.67 |
-5.87 |
-9.10 |
-8.56 |
-8.67 |
-10.54 |
| |
BasketballDrill |
-1.61 |
-1.90 |
-3.84 |
-5.80 |
-6.01 |
-6.00 |
| |
Average |
-3.77 |
-4.01 |
-6.20 |
-7.43 |
-7.61 |
-8.26 |
| D |
RaceHorses |
0.60 |
-2.45 |
-4.38 |
-4.16 |
-7.38 |
-7.39 |
| |
BQSquare |
-1.57 |
-8.85 |
-10.49 |
-6.29 |
-14.72 |
-13.04 |
| |
BlowingBubbles |
2.21 |
-5.30 |
-9.32 |
-0.36 |
-8.32 |
-10.83 |
| |
BasketballPass |
-1.15 |
-3.49 |
-4.60 |
-5.67 |
-8.19 |
-7.30 |
| |
Average |
0.02 |
-5.02 |
-7.20 |
-4.12 |
-9.65 |
-9.64 |
| E |
FourPeople |
-1.44 |
-1.07 |
-1.80 |
-3.33 |
-2.75 |
-2.82 |
| |
Johnny |
-1.90 |
-1.25 |
-2.11 |
-3.72 |
-2.81 |
-2.74 |
| |
KristenAndSara |
-2.37 |
-2.06 |
-2.52 |
-4.98 |
-4.42 |
-3.84 |
| |
Average |
-1.90 |
-1.46 |
-2.15 |
-4.01 |
-3.32 |
-3.13 |
| F |
BasketballDrillText |
-1.83 |
-2.15 |
-3.65 |
-6.26 |
-6.43 |
-5.90 |
| |
ChinaSpeed |
-6.52 |
-5.88 |
-5.40 |
-11.12 |
-10.31 |
-8.08 |
| |
SlideEditing |
-1.30 |
-0.86 |
-2.09 |
-2.19 |
-2.19 |
-3.66 |
| |
SlideShow |
-4.93 |
-4.35 |
-3.89 |
-9.72 |
-8.82 |
-6.69 |
| |
Average |
-3.64 |
-3.31 |
-3.76 |
-7.32 |
-6.94 |
-6.08 |
| |
Class average |
-2.50 |
-3.08 |
-4.37 |
-5.54 |
-6.08 |
-6.00 |
Table 8.
Average coding performance in low delay configuration [% BD-rate]
Table 8.
Average coding performance in low delay configuration [% BD-rate]
| Class |
Sequence name |
Constrast masking |
Contrast & texture masking |
| |
|
SSIM |
MS-SSIM |
PSNR-
HVS-M
|
SSIM |
MS-SSIM |
PSNR-
HVS-M
|
| A |
Traffic |
-1.37 |
-1.13 |
-2.40 |
-5.03 |
-4.85 |
-4.92 |
| |
PeopleOnStreet |
-0.66 |
-0.72 |
-1.24 |
-6.07 |
-5.93 |
-4.33 |
| |
Nebuta |
-2.29 |
-1.20 |
-1.52 |
-2.52 |
-1.37 |
-0.90 |
| |
SteamLocomotiveTrain |
-0.71 |
-0.56 |
-0.83 |
-0.44 |
-0.07 |
-0.11 |
| |
Average |
-1.26 |
-0.90 |
-1.50 |
-3.51 |
-3.05 |
-2.56 |
| B |
Kimono |
-0.21 |
-0.16 |
-0.32 |
-0.03 |
0.05 |
0.02 |
| |
ParkScene |
-1.93 |
-1.55 |
-2.67 |
-3.99 |
-3.63 |
-4.06 |
| |
Cactus |
-2.11 |
-1.59 |
-3.68 |
-4.39 |
-3.61 |
-4.79 |
| |
BQTerrace |
-10.42 |
-8.93 |
-13.03 |
-16.13 |
-14.36 |
-16.37 |
| |
BasketballDrive |
-3.11 |
-3.08 |
-4.92 |
-6.27 |
-6.00 |
-6.52 |
| |
Average |
-3.56 |
-3.06 |
-4.92 |
-6.16 |
-5.51 |
-6.34 |
| C |
RaceHorses |
-4.27 |
-4.67 |
-7.05 |
-8.42 |
-8.82 |
-9.39 |
| |
BQMall |
-3.36 |
-3.48 |
-5.02 |
-7.93 |
-8.01 |
-7.94 |
| |
PartyScene |
-7.37 |
-7.40 |
-10.70 |
-11.57 |
-11.60 |
-13.24 |
| |
BasketballDrill |
-1.13 |
-1.33 |
-2.76 |
-5.51 |
-5.69 |
-5.38 |
| |
Average |
-4.03 |
-4.22 |
-6.38 |
-8.35 |
-8.53 |
-8.99 |
| D |
RaceHorses |
-0.31 |
-2.21 |
-4.13 |
-4.99 |
-7.58 |
-6.99 |
| |
BQSquare |
-8.30 |
-14.38 |
-15.77 |
-15.26 |
-22.89 |
-20.48 |
| |
BlowingBubbles |
-2.97 |
-7.26 |
-10.74 |
-6.55 |
-11.54 |
-13.17 |
| |
BasketballPass |
-2.64 |
-4.31 |
-5.53 |
-7.49 |
-9.55 |
-8.75 |
| |
Average |
-3.56 |
-7.04 |
-9.04 |
-8.57 |
-12.89 |
-12.35 |
| E |
FourPeople |
-0.20 |
0.01 |
-0.79 |
-2.03 |
-1.54 |
-1.20 |
| |
Johnny |
-0.71 |
-0.35 |
-1.24 |
-4.01 |
-3.38 |
-2.99 |
| |
KristenAndSara |
-1.22 |
-0.88 |
-1.45 |
-2.82 |
-2.40 |
-1.60 |
| |
Average |
-0.71 |
-0.41 |
-1.16 |
-2.95 |
-2.44 |
-1.93 |
| F |
BasketballDrillText |
-1.31 |
-1.52 |
-2.66 |
-6.28 |
-6.41 |
-5.46 |
| |
ChinaSpeed |
-6.25 |
-5.73 |
-5.36 |
-10.81 |
-10.10 |
-7.54 |
| |
SlideEditing |
-1.35 |
-1.48 |
-0.72 |
-3.91 |
-3.45 |
-1.99 |
| |
SlideShow |
-5.59 |
-5.34 |
-5.05 |
-10.28 |
-9.75 |
-7.92 |
| |
Average |
-3.62 |
-3.52 |
-3.45 |
-7.82 |
-7.43 |
-5.73 |
| |
Class average |
-2.79 |
-3.19 |
-4.41 |
-6.23 |
-6.64 |
-6.32 |
|
Disclaimer/Publisher’s Note: The statements, opinions and data contained in all publications are solely those of the individual author(s) and contributor(s) and not of MDPI and/or the editor(s). MDPI and/or the editor(s) disclaim responsibility for any injury to people or property resulting from any ideas, methods, instructions or products referred to in the content. |
© 2024 by the authors. Licensee MDPI, Basel, Switzerland. This article is an open access article distributed under the terms and conditions of the Creative Commons Attribution (CC BY) license (http://creativecommons.org/licenses/by/4.0/).
