INTRODUCTION
Recent trends have shown that companies are becoming more involved in joint industry projects (JIP) when planning on a certain project, which is beneficial in cost savings but could be risky such as losing shared equipment and data altogether as well as having to wait for the technical scope for a significant amount of time and getting many contracts signed and agreed. However, when it comes to collecting met ocean data, which is not sensitive or confidential amongst companies. They are easily encouraged to work together to gather such data.
Swail et al. (2006) described that the hindcast approach consists of the application of numerical wind and wave models together with historical meteorological data to simulate the evolution of surface winds and ocean wave response in the basin or region of interest. The most common example of the met ocean data application is the standard of designing and constructing offshore structures, especially in the safety and financial implications of operating companies. Hence, the measurements and database facilities used to gather the relevant data such as wind, wave, and storm surge must be accurate with the environmental load conditions and extreme values (Mayeetae, Liew & Yew, 2013).
The design criteria of specific sites can be obtained through the statistical process of extremal analysis of the hindcast data (Swail et al., 2006). Under-designing of an offshore or nearshore structure can bring about safety issues so it is essential for the right data to be gathered and analyzed so that they can be understood by engineers when planning an offshore project. Meanwhile, over-designing can cause excessive usage of steel in fabrication (Lim & Mohd Shahir Liew, 2015). Thus, the design criteria must be able to fulfill the requirements of being conservative for today’s solutions and simultaneously have room for additional modifications to the structure in the future Shaw & Shell Global Solutions. (2020).
The study focused on collecting historical met ocean data (tidal elevation, u velocity, v velocity, current speed, current direction, temperature, and salinity) of potential sites from reliable sources and met ocean data of current conditions of potential sites via measuring instruments. Model and simulate the environment based on the data collected of present met ocean conditions using MIKE 21/3 HD FM software. Process, analyze, and calibrate the met ocean data of each potential site. A prototype was later deployed on Bidon Island.
Furthermore, seaweed is comprised of many species that are native to certain habitats with specific environmental conditions. Hence, it is essential to study and analyze potential locations for the deployment of any project, especially a project that involves spatial planning. Seaweeds are sensitive to environmental changes and thus, require deep analysis of the location to ensure the survival of the seaweed farm.
STATE OF THE ART
Recent trends show a significant increase in companies participating in joint industry projects (JIPs) for specific initiatives. These collaborative efforts are primarily driven by cost-saving benefits, but they also come with risks such as the potential loss of shared equipment and data, delays in defining technical scopes, and the complexity of negotiating multiple contracts (Sørensen & Hansen, 2018). Nonetheless, the collection of metocean data, which is typically non-sensitive and non-confidential, encourages collaboration among companies. Enhanced funding in such projects can improve the safety of equipment and the accuracy of data collection (Thornton et al., 2016).
Examples of notable JIPs include the Gulf of Mexico Storm Hindcast of Oceanographic Extremes (GUMSHOE), the North European Storm Study (NESS/NEXT), the South East Asia Meteorological and Oceanographic Study (SEAMOS), and the West Africa Extremes Study (WAX) (Shaw & Shell Global Solutions, 2020).
Metocean data is crucial in joint projects, especially for long-term non-strategic technologies. During the development of the ISO standard for offshore structure design, significant uncertainty was identified in setting minimum deck elevations. Addressing this issue requires extensive metocean data, including the distribution of crest heights in storm conditions and extrapolation to very low probabilities with return periods of 10,000 years (Shell Global Solutions, 2019).
Hindcasting, a numerical modeling technique, assists in processing and analyzing metocean data by studying the distribution of metocean conditions. This approach is valuable because faulty measuring equipment can create data gaps, which have occurred in oceanographic data from regions such as the northern United States, the Gulf of Mexico, and Prince William Sound (Mayeetae, Liew, & Yew, 2013). Artificial neural networks have been used to address these gaps by developing buoy networks, although some data were still missing (Caires et al., 2017).
Tampering with measurement data can interfere with the statistical assessment of oceanographic and extreme condition design parameters for offshore structures. Despite inevitable data gaps and the time required to repair and reinstall faulty devices, hindcasting remains cost-effective and provides consistent data compared to direct measurements (Mayeetae, Liew, & Yew, 2013).
The primary application of metocean data is in the design and construction standards of offshore structures, impacting both safety and financial aspects for operating companies. Accurate measurements and databases for wind, wave, and storm surge data are crucial for assessing environmental load conditions and extreme values (Zieger et al., 2020). Metocean data helps determine the design criteria for offshore or nearshore infrastructures, preventing both structural failures and overdesigning. Statistical extremal analysis of hindcast data provides specific site design criteria (Swail et al., 2006).
Under-designing offshore or nearshore structures can pose safety risks, making it vital to gather and analyze accurate data for engineers to use in planning projects. Conversely, over-designing can lead to excessive use of steel in fabrication (Lim & Liew, 2018). Therefore, design criteria must be conservative enough to meet current needs while allowing for future modifications (Shaw & Shell Global Solutions, 2020).
METHOD AND MATERIALS
3.1. Met Ocean Data Investigation
Met ocean data study can also be known as wave climate study. A study on the wave climate data of the Caribbean Sea was carried out by Calverley, Szabo, Cardone, Orelup, and Parsons (2002) and the methodology of the study included utilizing a third-generation (3G) wave model adapted on a nested grid system and a two-dimensional (2-D) hydrodynamic model. These models can be used to describe currents that are generated by storms and water level anomalies. The validation of the data consisted of comparing continuous wave hindcast against NOAA data buoy sea state measurements at one location while comparing the data with TOPEX and ERS satellite altimeter wave height data for the whole basin. The verification was on paired data and probability distributions.
Met ocean data collection is comprised of using measuring instruments such as buoys and wave radars which aid in observing wave heights and directions of a specific region as well as installing anemometer on offshore platforms to measure wind speed and direction (Mayeetae, Liew & Yew, 2013, Lim & Mohd Shahir, 2015). Besides, wave radars can also be applied for structural monitoring, weather forecasting, sea state assessment for operations, water level observations, and wind farm monitoring. Instruments are prone to malfunction and thus, missing data is inevitable. Yet, the fragmented data that are acquired from the instruments are used for processing and analyzing. Hence, projects relating to the design and operation of offshore structures become dependent on hindcast modeling (Mayeetae, Liew & Yew, 2013).
Hence, this section includes the methodology of met ocean data which are commonly used by companies for joint projects as well as the environmental factors that affect the survivability and growth of the native seaweed species in Malaysia. (
Figure 1A-C).
The study involved: a. Collection of historical met ocean data (tidal elevation, u velocity, v velocity, current speed, current direction, temperature, and salinity) of potential sites from reliable sources and met ocean data of current conditions of potential sites via measuring instruments. b. Modeling and simulation of the environment based on the data collected of present met ocean conditions using MIKE 21/3 HD FM software. c. Processing, analysing, and calibration the met ocean data of each potential site.
3.2. Environmental Factors Affecting Seaweed and Farm Mooring System
Temperature
Malaysia, in general, only experiences wet and dry seasons and the climate is overall warm throughout the year. This can affect the sea temperature where the native seaweed dwells. One of the common native species called, "Eucheuma Seaweed" is known to thrive in sea temperatures of 25 to 30 ⁰C. the seaweed planted in Pulau Pangkor thrived at a temperature under 35⁰C. Meanwhile, another study recorded the temperature range for the native species at two related potential sites which are at Bidung Island and Setiu in Terengganu, Malaysia. The sampling resulted in the native species of Bidung Island, "Sargassum cristae folium", thriving in the temperature range of 24 to 34⁰C, "Enteromorpha Intestinalis" of Setiu recorded 20 to 33 ⁰C and Ulva Lactuca of Setiu resulted in 22-34 ⁰C. (Gan et.al, 2006). Hence, it is generally understood that seaweeds are unable to withstand temperatures above 35 ⁰C.
Salinity
Salinity refers to the salt content of seawater. Seaweeds must not be placed at the mouth of the river or anywhere near freshwater as they are unable to survive in freshwater. (….) Hence, according to Gan et. el. (2006) seaweeds generally thrive in salinity of over 20 ppt (parts per thousand). Eucheuma seaweed is listed for more than 28 ppt in salinity (Phang, 2006). Meanwhile, "Sargassum cristaefolium" in Bidong listed 30-33 ppt, "Ulva Lactuca" in Setiu with 19-22 ppt and "Enteromorpha Intestinalis" of Setiu with 8.2 to 25 ppt. Depending on the type of species that will be deployed in this project, it is best to find a location with salinity that is an optimum match with the seaweed.
Depth and Sunlight/Light Intensity
The depth of where the seaweeds will be placed is crucial in ensuring optimum growth of the seaweed as it correlates with the amount of sunlight, they are to receive all day. Based on …., the light intensity required by the seaweed is more than 50 μmol photon m^2 s^-1. Therefore, to get this amount of sunlight, when deploying the farming structure, it is crucial to determine that the depth between the seaweed and the surface of the water be at most 2 m. The seaweeds planted in Pulau Pangkor are measured to be at an average range of 1.5 to 2 m ((Phang, 2006).
Water Movement
Water movement mainly involves the current speed and direction of the potential study sites over a certain period. It is important to analyze and recognize the water movement pattern of a certain area before deploying the seaweed farming structure. This is because the current speed may cause excessive drag force to both the seaweed and the mooring components. According to..., a current speed of over 3 m/s will cause a large intolerable drag force. In addition, the direction of the water current is essential so that the drag force will be minimized when the structure is placed in a way that the current goes through the seaweed farm instead of against it. The overall result from the study can be simplified in the following tables.
Bathymetric/Geographic Conditions of Sites
The project focuses on the aspect of a deep-sea mooring system in which despite native species naturally inhabiting reef flats and sandy slopes, the condition of the seabed does not greatly affect the seaweed planted on the farming structure. However, the mooring design of the structure will require determining the type of seabed on any potential sites so that the mooring will be effective and able to withstand being swept away by the current.
Table 1 and
Table 2 show drag foces and current parameters respectively.
This section describes the general methodology of the study which is used to achieve the project’s aim and objectives. Met ocean data studies usually involve gathering the relevant historical met ocean data that ranges from 20 to 30 years at least from reliable sources based on the venue of the potential sites. Besides, met ocean data collection of the present conditions of the potential sites is also carried out via measuring instruments that are available and reliable to use. After collecting the met ocean data, the data will be processed and analyzed via numerical and hindcast modeling. For this study, it is suggested that the software named MIKE 21/3 HD FM is used for analyzing, simulating, and calibrating the models.
3.3. Met Ocean Data Collection
To be able to assess the met ocean environment of the potential sites, the historical met ocean data from trusted sources and met ocean data of current conditions obtained from measuring instruments of the region must be obtained first as stated in the first objective of this study. Some of the potential sites are considered to be close to one another. For sites that are relatively near to each other, collecting data at each site will not be necessary as the hindcast data is spatially homogenous over a large area for a specific region (Shaw & Shell Global Solutions, n.d.). Thus, for sites that are relatively close to each other, only one met ocean data set will be taken. The following is the number of data collection that will represent several potential sites:
- 1)
Western Coast near Langsuir Cave, Pulau Langkawi
- 2)
Eastern Coast near Bachok, Kelantan
- 3)
Eastern Coast near Setiu Wetland or River, Terengganu, and Western Coast near Bidong Island, Terengganu.
The parameters of the data that will be used for hindcast modeling will include wind, wave, and current. The wind data will comprise of speed and direction, the wave data will comprise of height and lastly, the current will comprise of speed and direction. Moreover, there are several sources where met ocean data of specific regions can be obtained namely, the University Corporation for Atmospheric Research (UCAR) and the National Centre for Atmospheric Research (NCAR). The institutions provide several suggested products or programs that have online databases on certain ocean parameters such as the Climate Forecast System Reanalysis (CFSR) (National Centre for Atmospheric Research Staff, 2014), Surface Flux and Meteorological Dataset: National Oceanography Centre (NOC) V2.0 (Kent & National Centre for Atmospheric Research, 2014), Global Sea Level from TOPEX & Jason Altimetry (National Centre for Atmospheric Research, 2013),
3.3. Numerical Hindcast Model
For each parameter specified in this study which are the wind, wave and current, the result produced via numerical hindcast modelling should include clear and well-presented simulations of the conditions over a selected period of time. Furthermore, the results of the numerical modelling will then be verified based on the guideline provided by the Department of Irrigation and Drainage Malaysia (DID). The following excerpt is the guideline by DID on the verification of numerical models;
The verification of the model is carried out by comparing the predicted water levels and current velocities to actual measured values. The verification stations shall be located at different locations from that of the calibration stations. The verification stations shall be close to the points of interest (areas where the impacts would probably occur) in the study. The calibration points shall be sufficient in numbers commensurate with the size of the model/project area. The following information shall be submitted for evaluation:
a) Water level difference diagram (showing the comparison of the water levels for the predicted and measured values)
b) Velocity difference diagram (showing the comparison of the speed and direction for predicted and measured values)
c) Average differences in the comparison for water levels, current speed and direction
The average differences in speed and direction shall not be more than 30 % and 450 respectively. The average difference in water level shall not be more than 10 %. The general pattern of speed and direction shall be similar. The differences between the predicted and measured values shall be treated as absolute values and these values shall be averaged over the duration of comparison. The time interval between each consecutive value shall be less than 60 minutes. (2001)
After that, should the average differences exceed the range as stated in the excerpt, the models must be calibrated. This is done by “comparing the predicted water levels and current velocities at spring and neap tides with the measured values and making the necessary adjustments to the various model parameters,” (Department of Irrigation and Drainage Malaysia, 2001). This is to ensure that the two data sets match each other closely.
The following list is the information that should be in the model calibrations which is required by DID: i) Values of all the model parameters that have been adjusted (eg. Roughness coefficient, eddy viscosity etc.,), ii) Water level difference diagram (showing the comparison of the water levels for the predicted and measured values), iii) Velocity difference diagram (showing the comparison of the speed and direction for predicted and measured values)
4. RESULTS
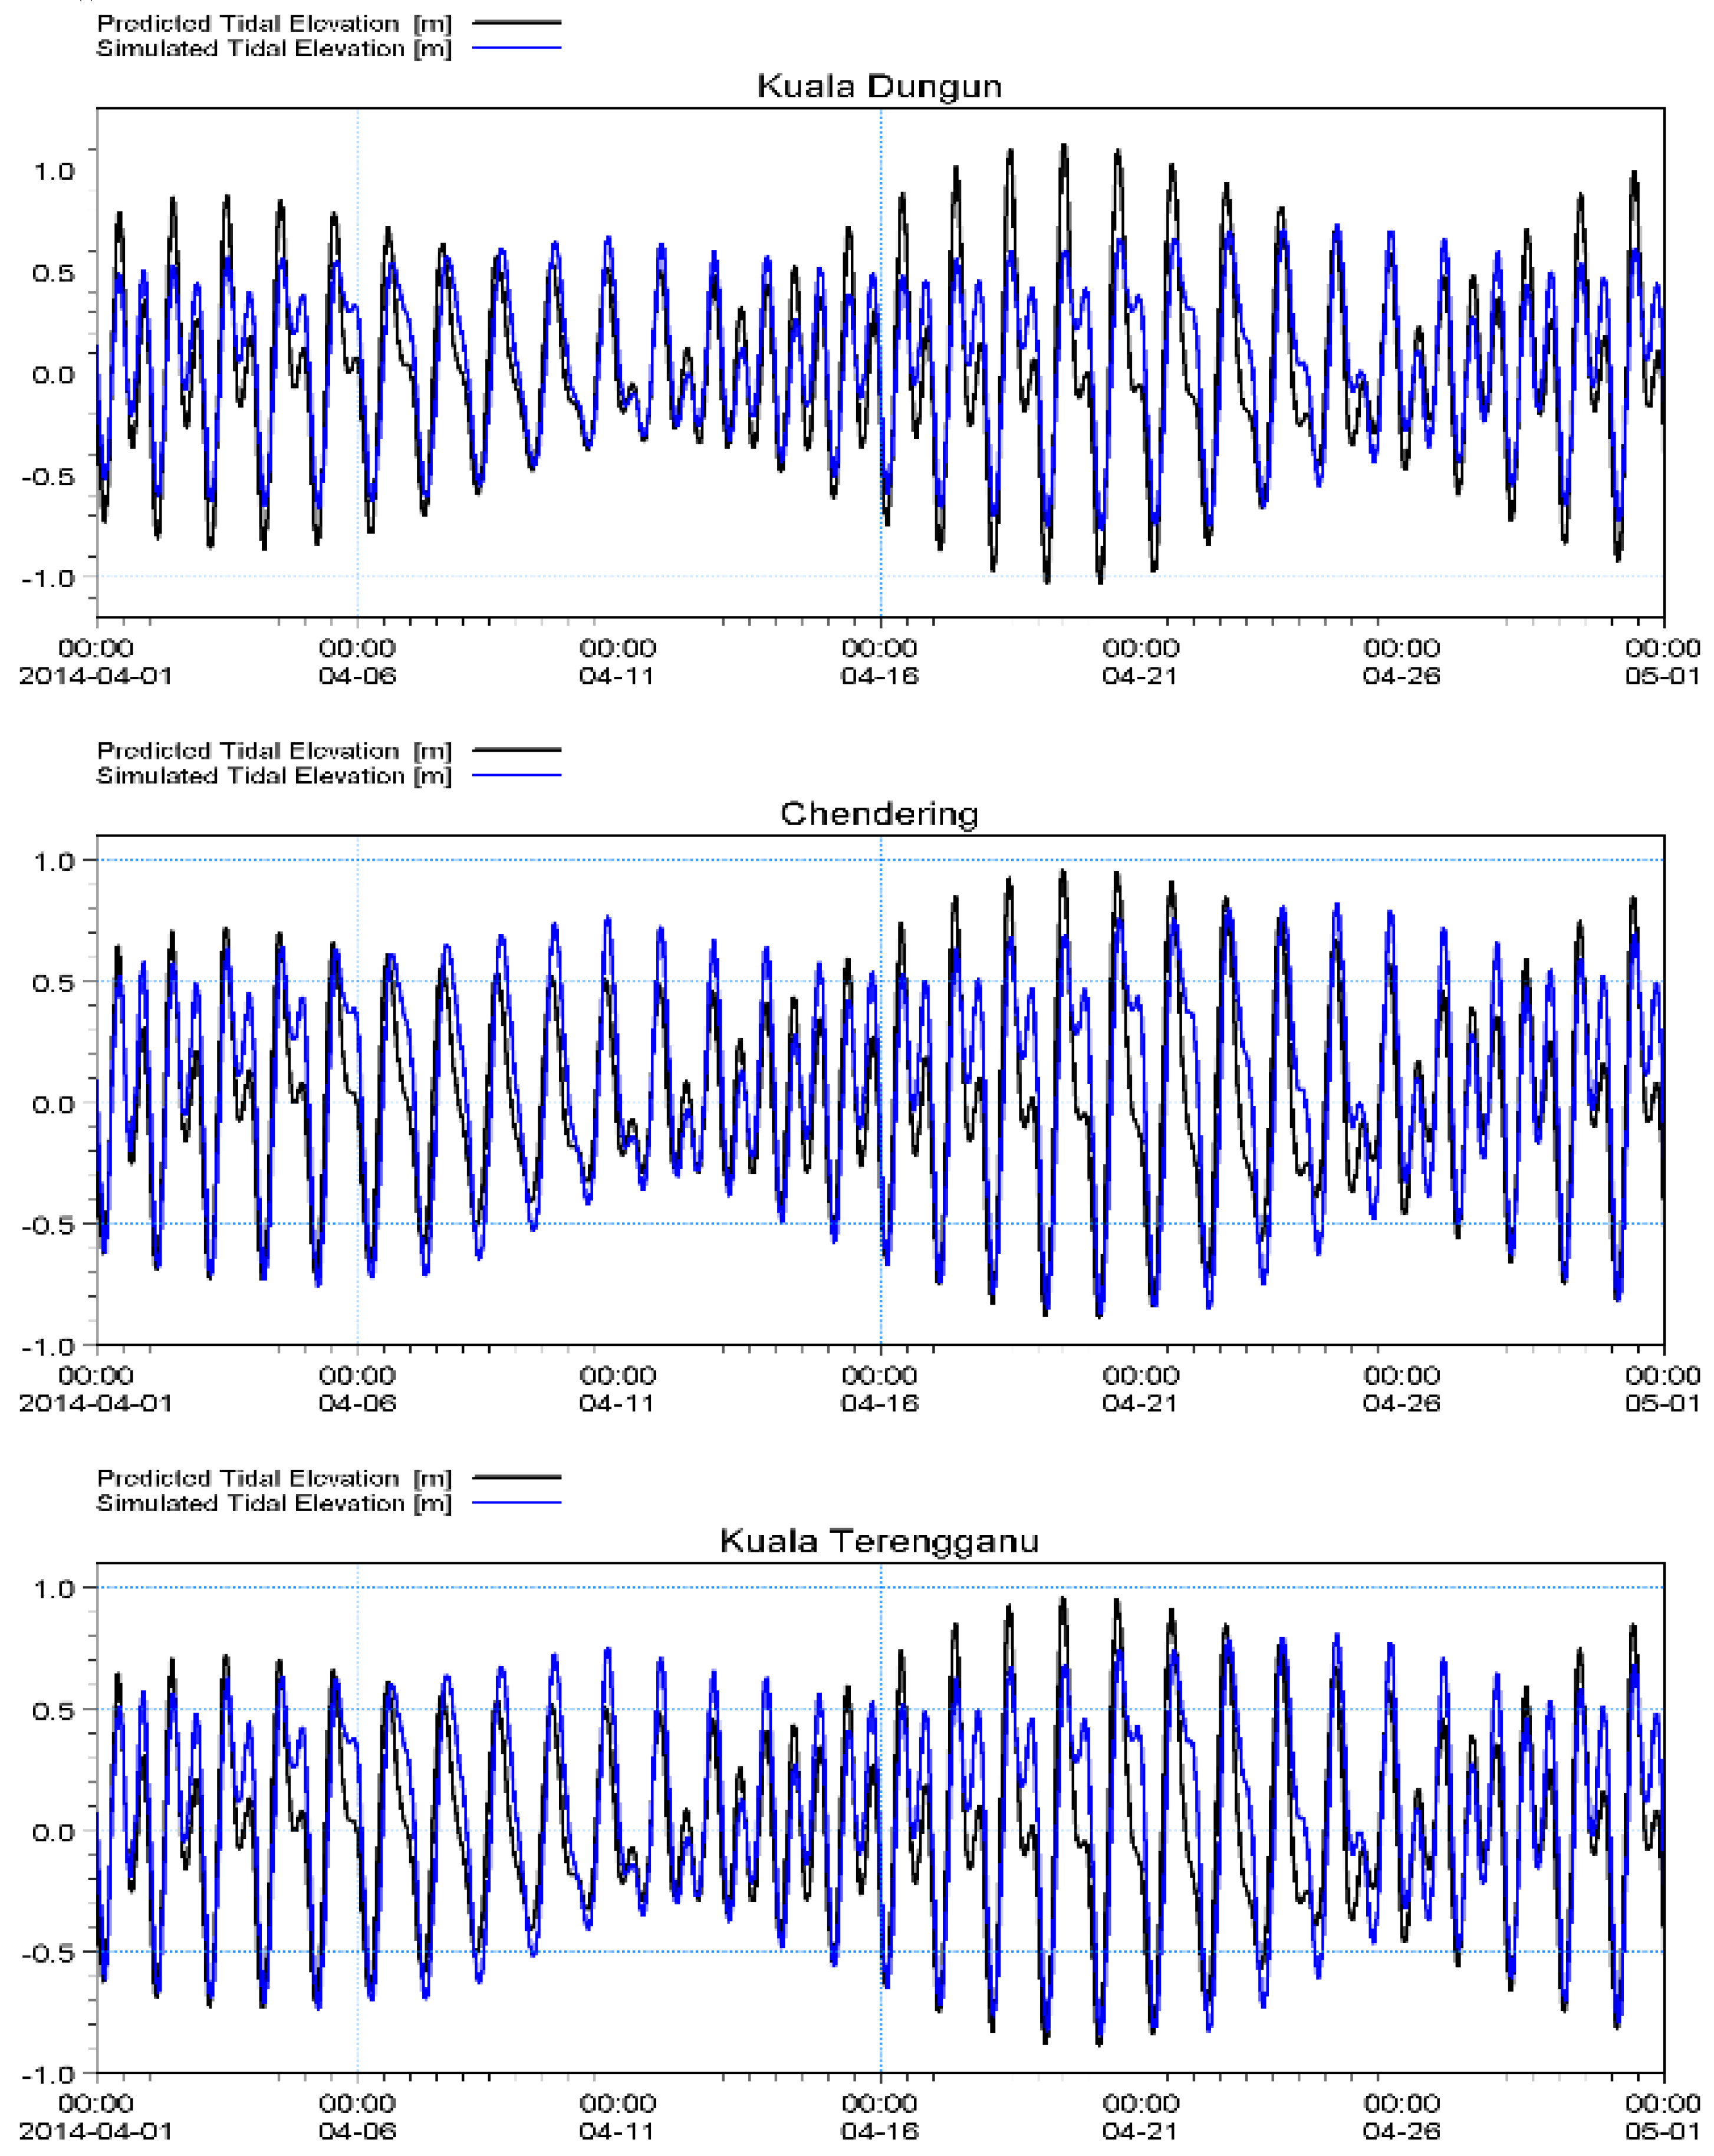
4.1. Model Calibration in Figure 2 Shows Statistics of Simulated Data for Tidal Elevation
and comparison for Tidal Elevation: Predicted Vs Simulated.
Figure 2.
Statistics of Simulated Data for Tidal Elevation.
Figure 2.
Statistics of Simulated Data for Tidal Elevation.
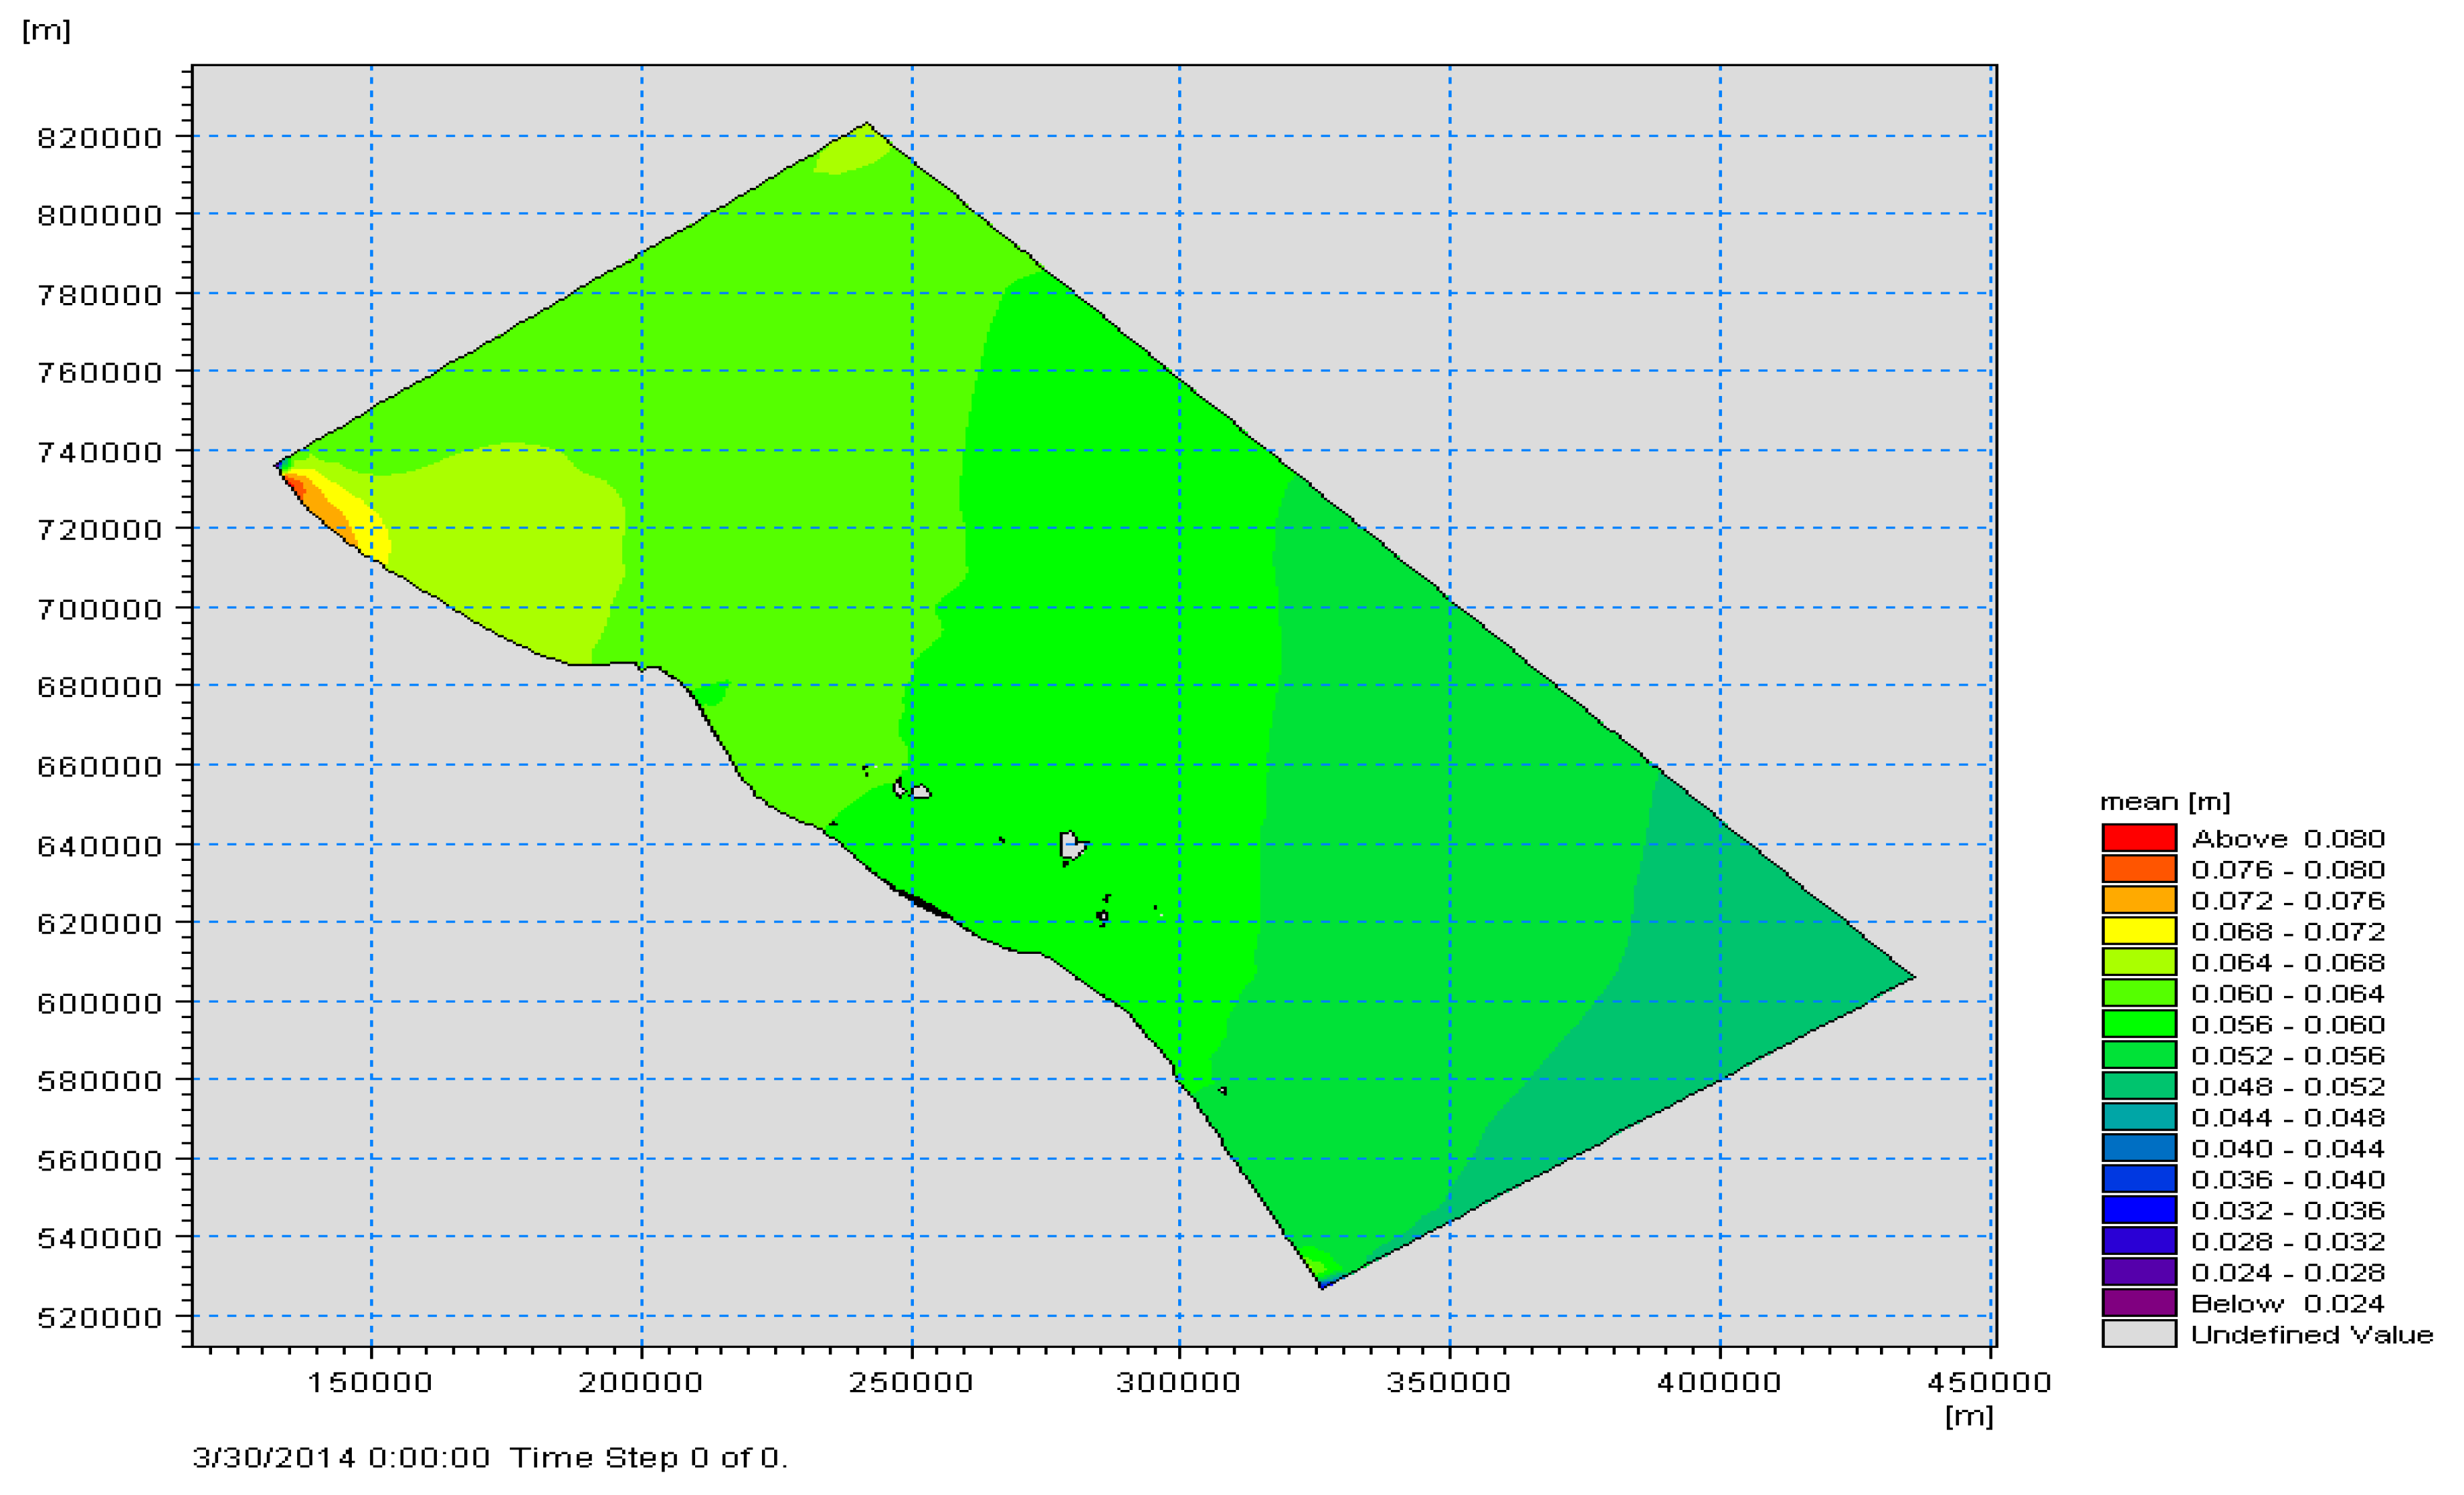
Figure 3.
Maximum Simulated Tidal Elevation.
Figure 3.
Maximum Simulated Tidal Elevation.
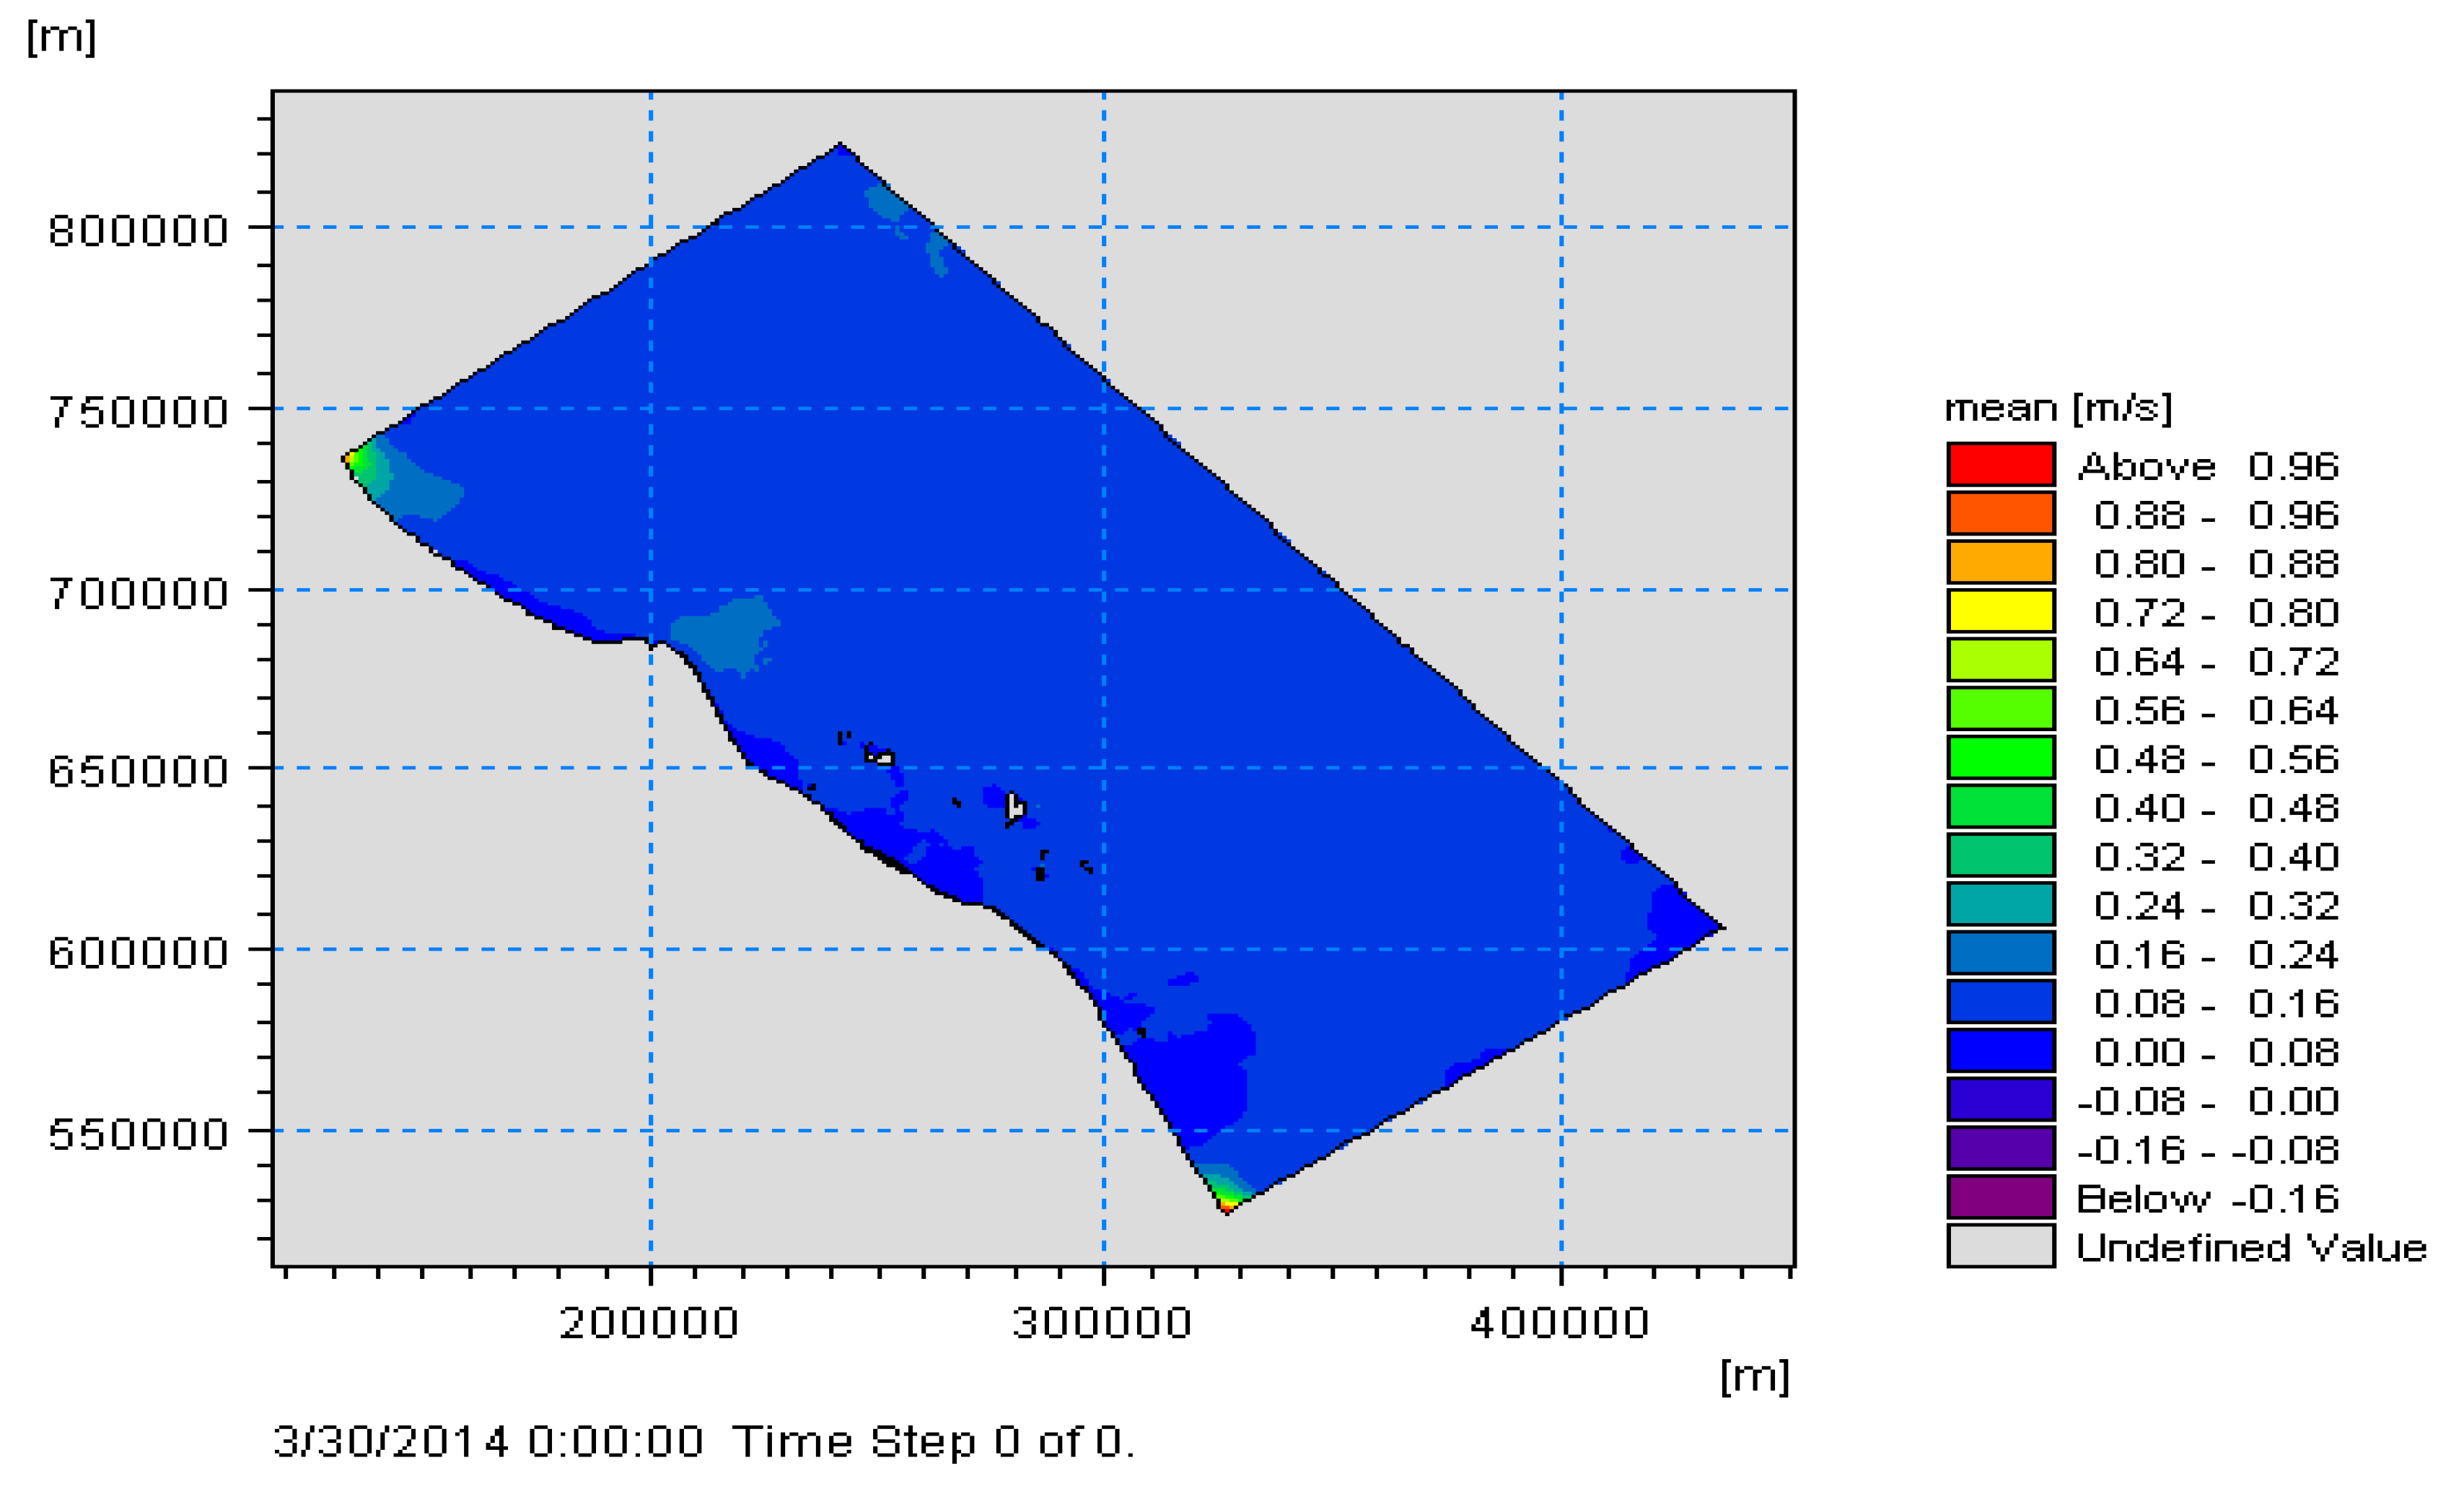
Figure 4.
Maximum Simulated Current Speed.
Figure 4.
Maximum Simulated Current Speed.
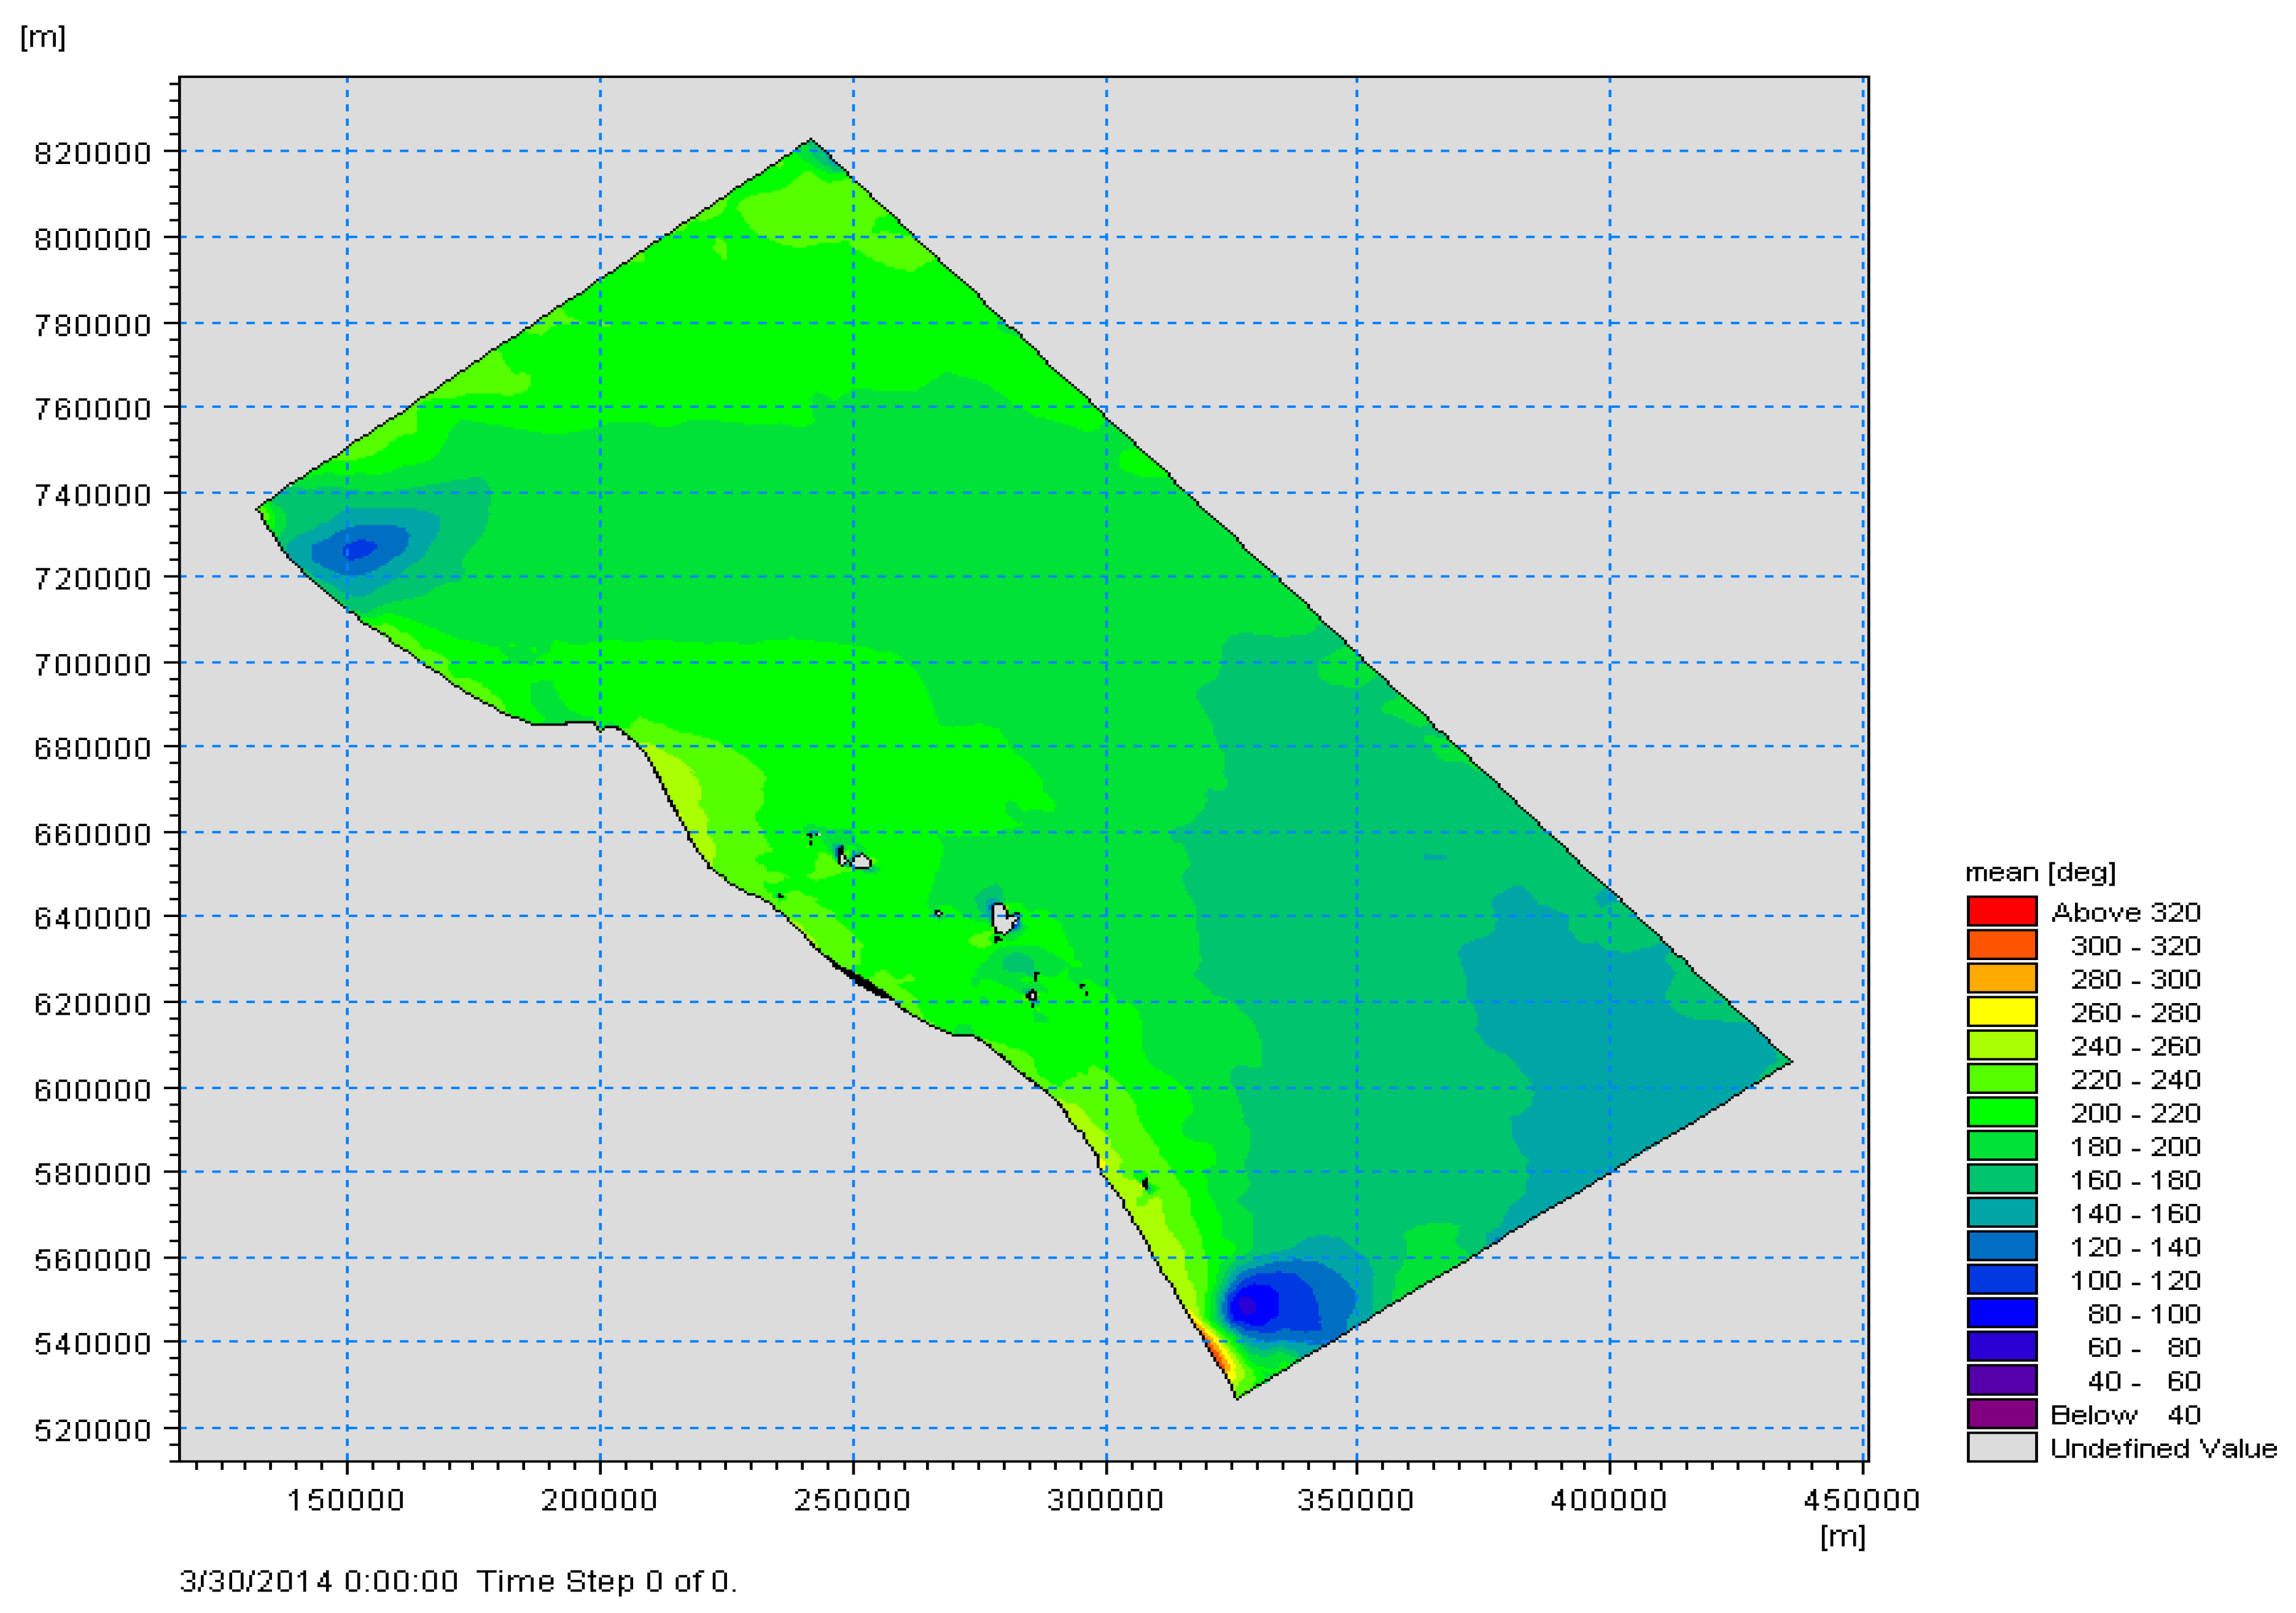
Figure 5.
Mean Simulated Current Direction.
Figure 5.
Mean Simulated Current Direction.
4.2. Physical Characteristics on the East Coast of Peninsular Malaysia
This is an overview of the physical characteristics of the sea in the northern part of the east coast of Peninsular Malaysia. This observation data can represent the coastal area of Terengganu and Kelantan in general terms. Provided are the time series data of temperature profile, current (in spectral density diagram), and wave characteristics. Most of these datasets are extracted from a long-term observation data collection made by INOS from 2012 to 2015.
Figure 6 shows the time-series of temperature profile from buoy observation during May to August 2014. The surface temperature during these months remained constant between 29 – 30 °C. A common feature was observed, where the temperature decreases with increasing depth. However, it is important to note that there was a sudden drop in the temperature record during June 2014.
Compilation of previous temperature records during June 2012-2015 also demonstrated the same result (
Figure 7), where there was a drop in temperature. The drop in temperature was slightly obvious and up to 4 °C.
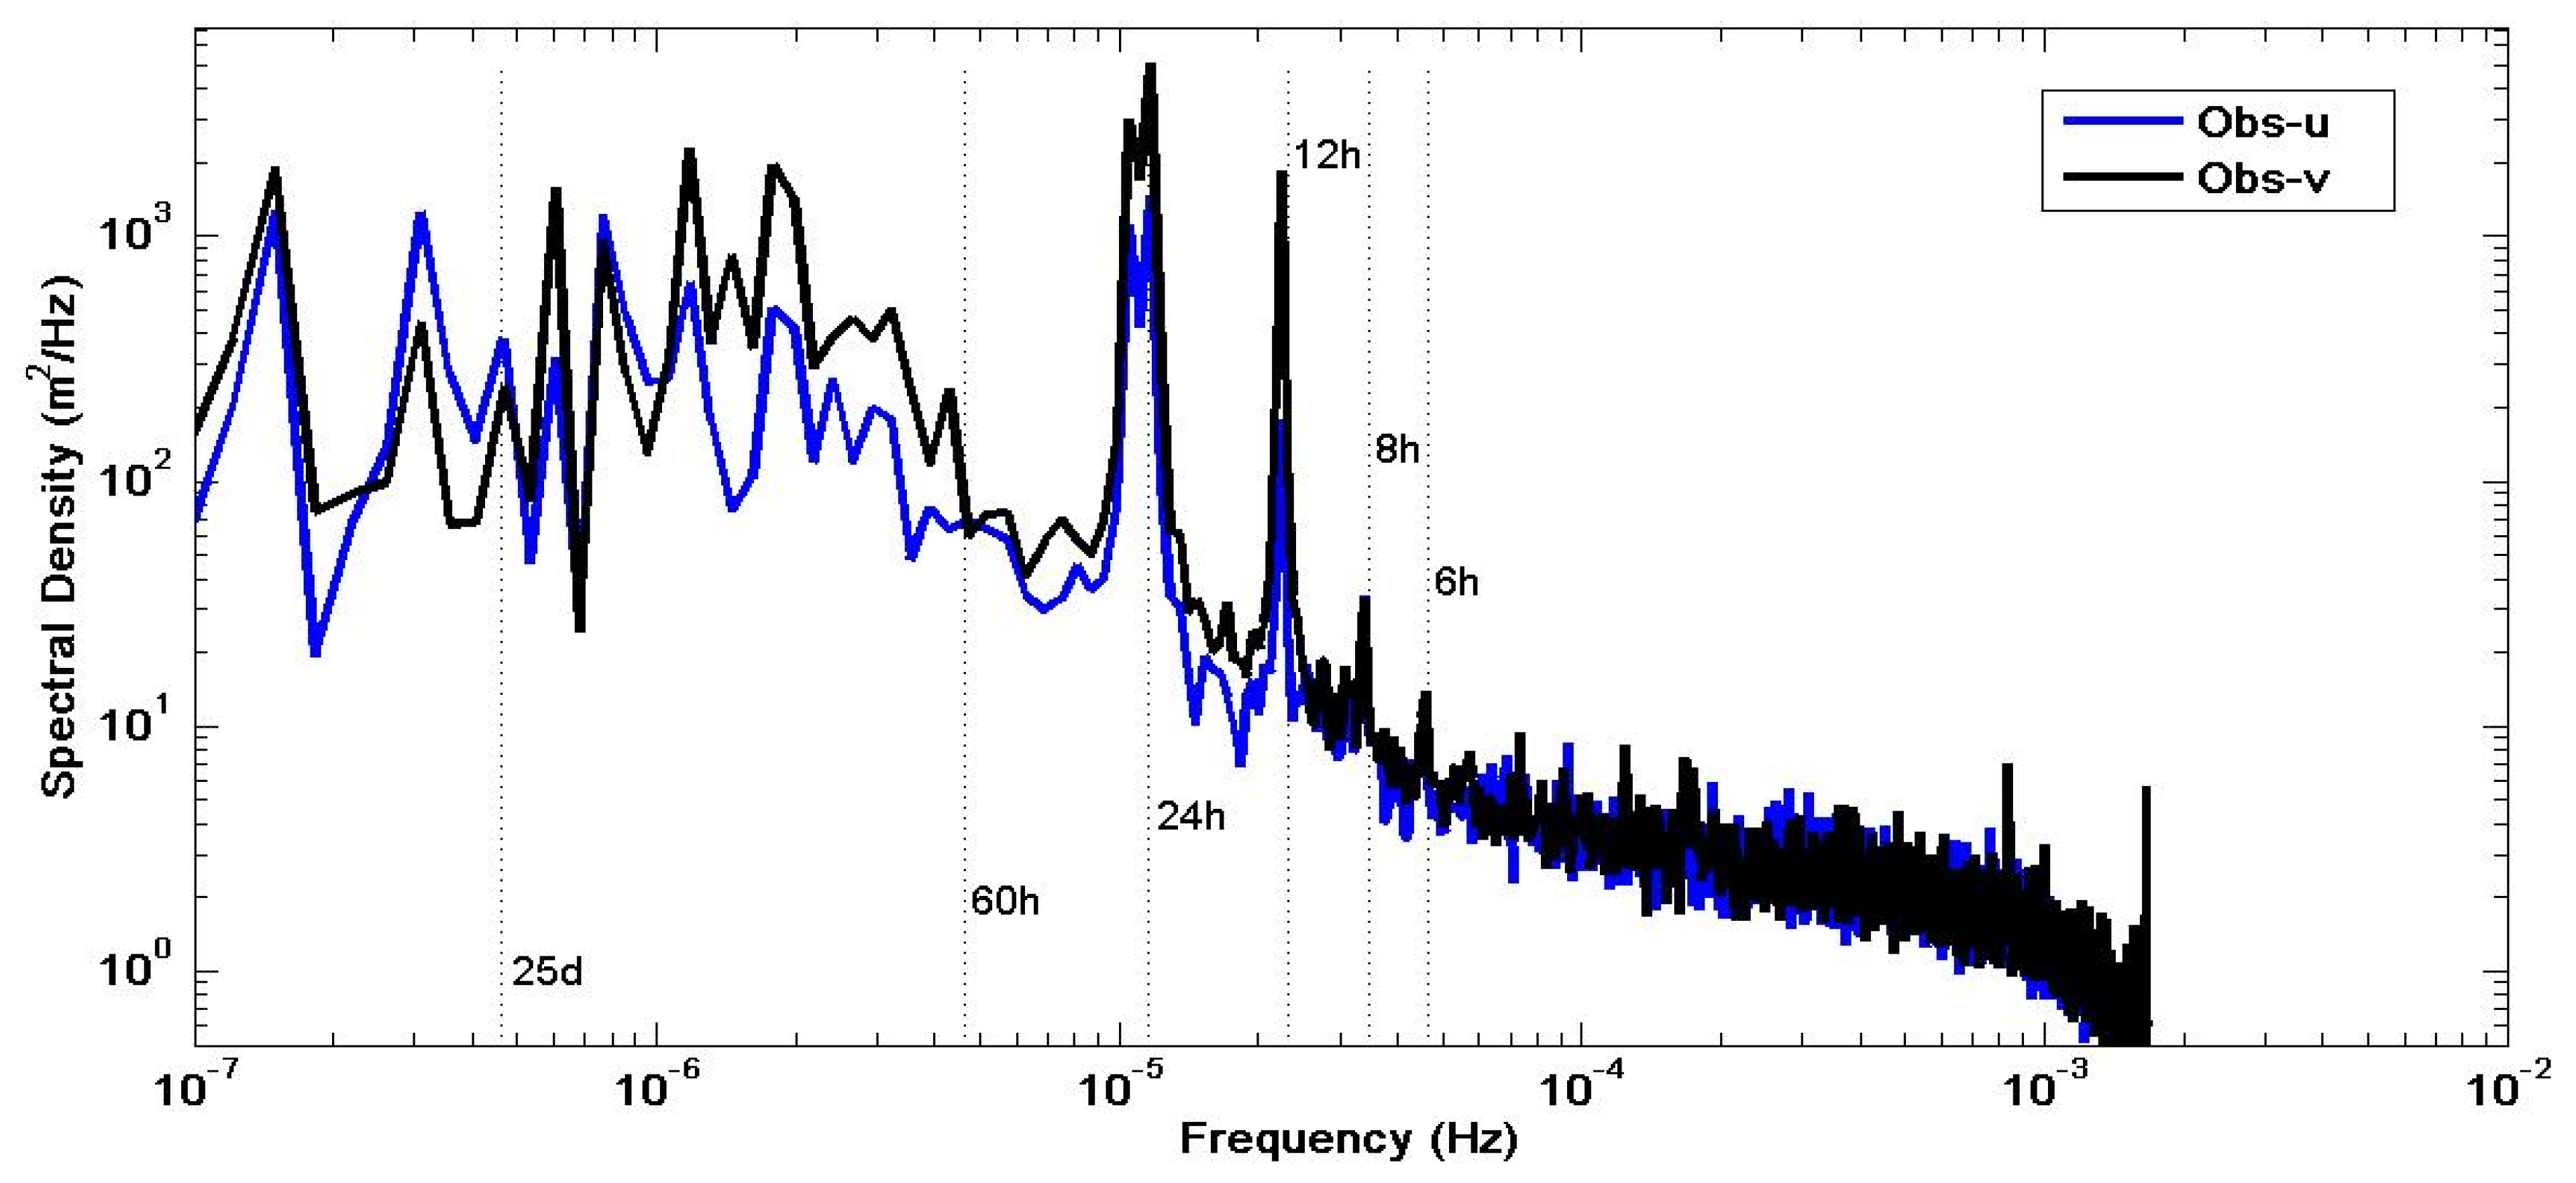
To determine the dominance of the tidal cycle, spectral density was plotted (
Figure 8). The figure clearly shows that the area was characterized by mixed tides with the dominant diurnal tides.
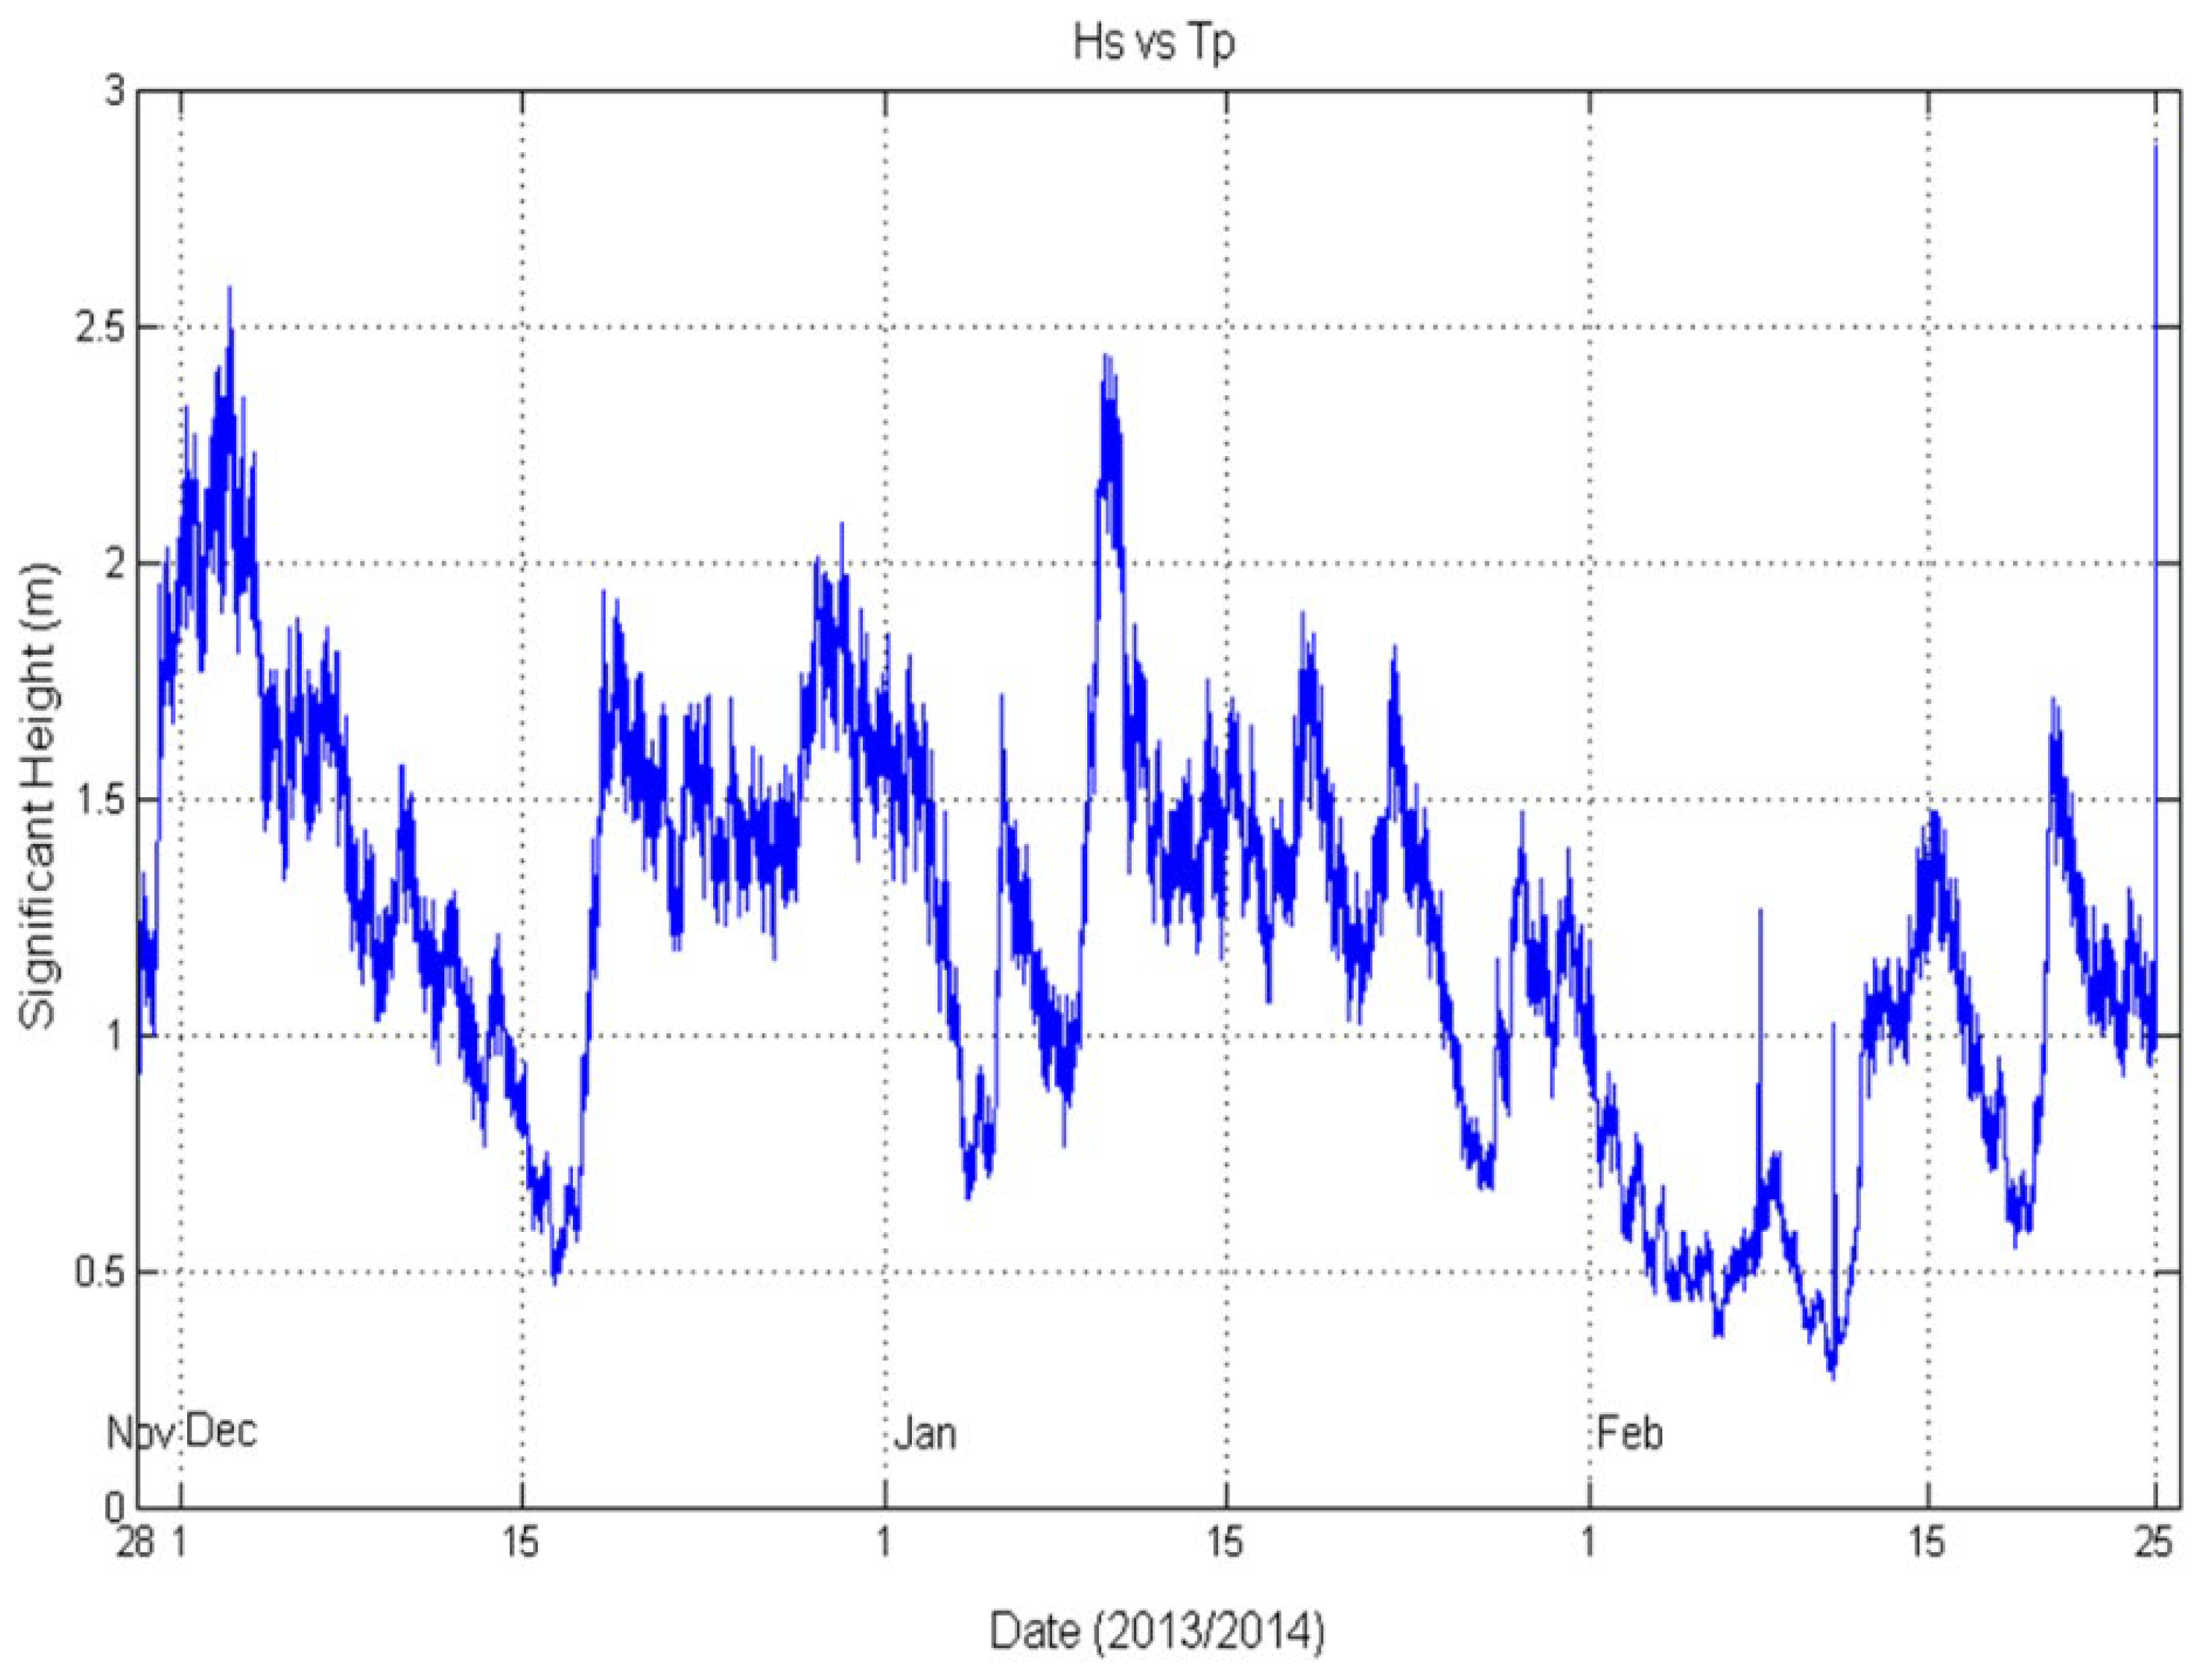
Figure 5 shows the time series of significant wave height from the 28
th of November 2013 to the 26
th of February 2014. Based on the figure, the three highest significant wave height values were detected in each month on the 2
nd of December 2013, the 10
th of January 2014, and the 25
th of February 2014 with 2.58 m, 2.44 m, and 2.88 m respectively. The lowest values are 0.47 m, 0.67 m, and 0.27 m on 17
th December 2013, 4
th January 2014, and 11
th February 2014 respectively. With the presence of wind blow from the South China Sea, the significant wave height value collected from sampling is much higher than the estimated tide value. This indicates that the combination of tides and winds during northeast monsoon produces rage waves which contribute to severe shoreline erosion.
5. 10x10 Prototype Deployment
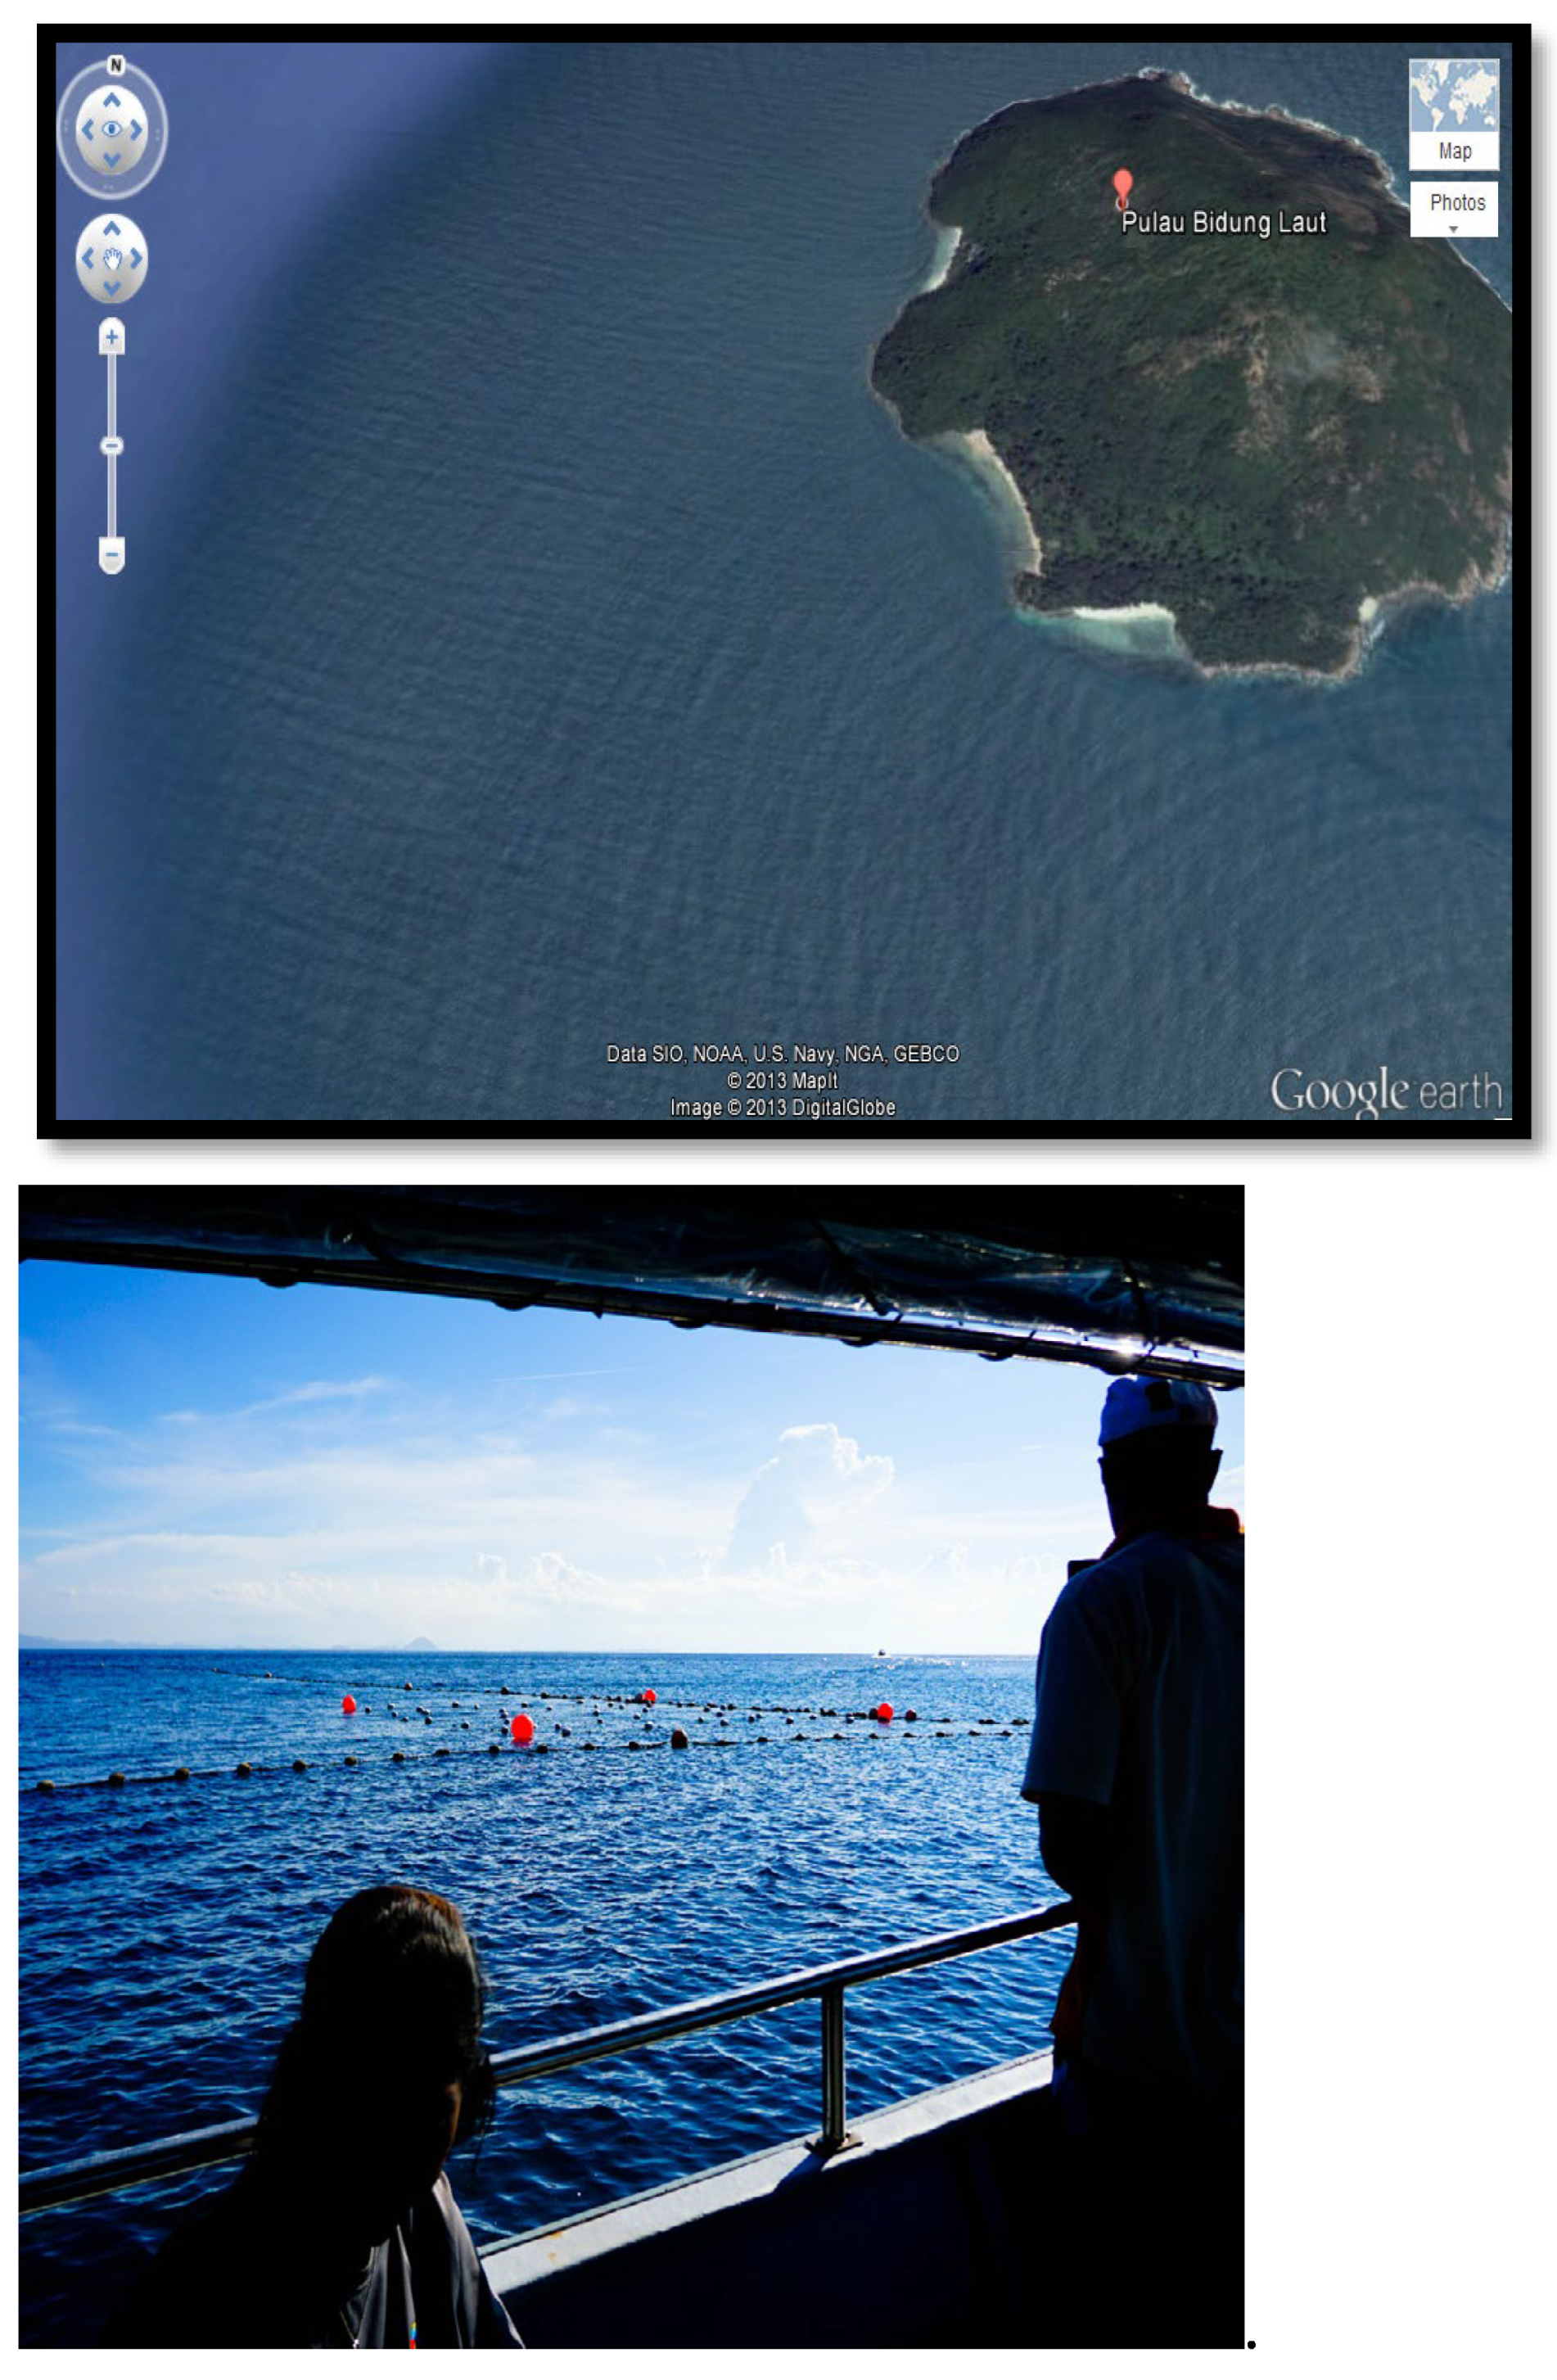
A 10x10 m new prototype was deployed after the Northeast Monsoon. Dimension of length and depth of each mooring system was approximately 20 m length and 10 m depth during high tide except for one mooring point near to crane machine which was less than 20 m in length. (
Figure 9).
Table 3 shows deployment parameters and
Table 4 shows the position of the buoy.
5.1. Seaweed Planting
Species of Ulva and 2 Gracilaria were measured for their fresh weight (as initial weight) and kept in planting baskets with dimensions (26 (L) x 19 (W) x 9 (H) cm) and volume (4.45 L) and covered with fishing net (1.5 cm mesh size). Stocking density for Ulva is 2.5 g/L and 5.0 g/L for both Gracilaria species and triplicates of samples were studied. 3 baskets were tied on the same line and parallel with another 2 lines also with 3 baskets each. After 2 weeks, measurement of growth was conducted biweekly in situ.
After 14 days, baskets for Ulva were empty due to all samples lost in the planting units. Gracilaria sp.1 remained in triplicates and growth measurements for up to 28 days. For Gracilaria sp.2, all triplicates’ samples were reweighed after 14 days and new stocking densities of 7.5 g/L in the original triplicates and 2.5 g/L were replaced in each empty basket. However, after 28 days, one of the replicates of 2.5 g/L Gracilaria sp.2 was lost due to the improper tie.
The growth rate for Gracilaria sp.1 on day 28 decreased from 3.84 %·day-1 to 2.15 %·day-1. Gracilaria sp.2 for two stocking densities 7.5 g/L and 2.5 g/L showed different growth rates which were 3.31 %·day-1 and 3.42 %·day-1, respectively on day 14. Gracilaria spp. were archived doubling time in 15-17 days showing the environment is still suitable for its growth. New branching tips were observed bigger on seaweed thalli and branches became thicker as well. However, the growth rates for both Gracilaria spp. decreased from day 14 to day 28 with possible reasons: nutrients, light and space competition between seaweed and fouling organisms; seaweed stock used for cultivation was kept in the hatchery for 2 months and getting older before cultivation started; tropical temperature making growth synergy slow due to high metabolism rate.
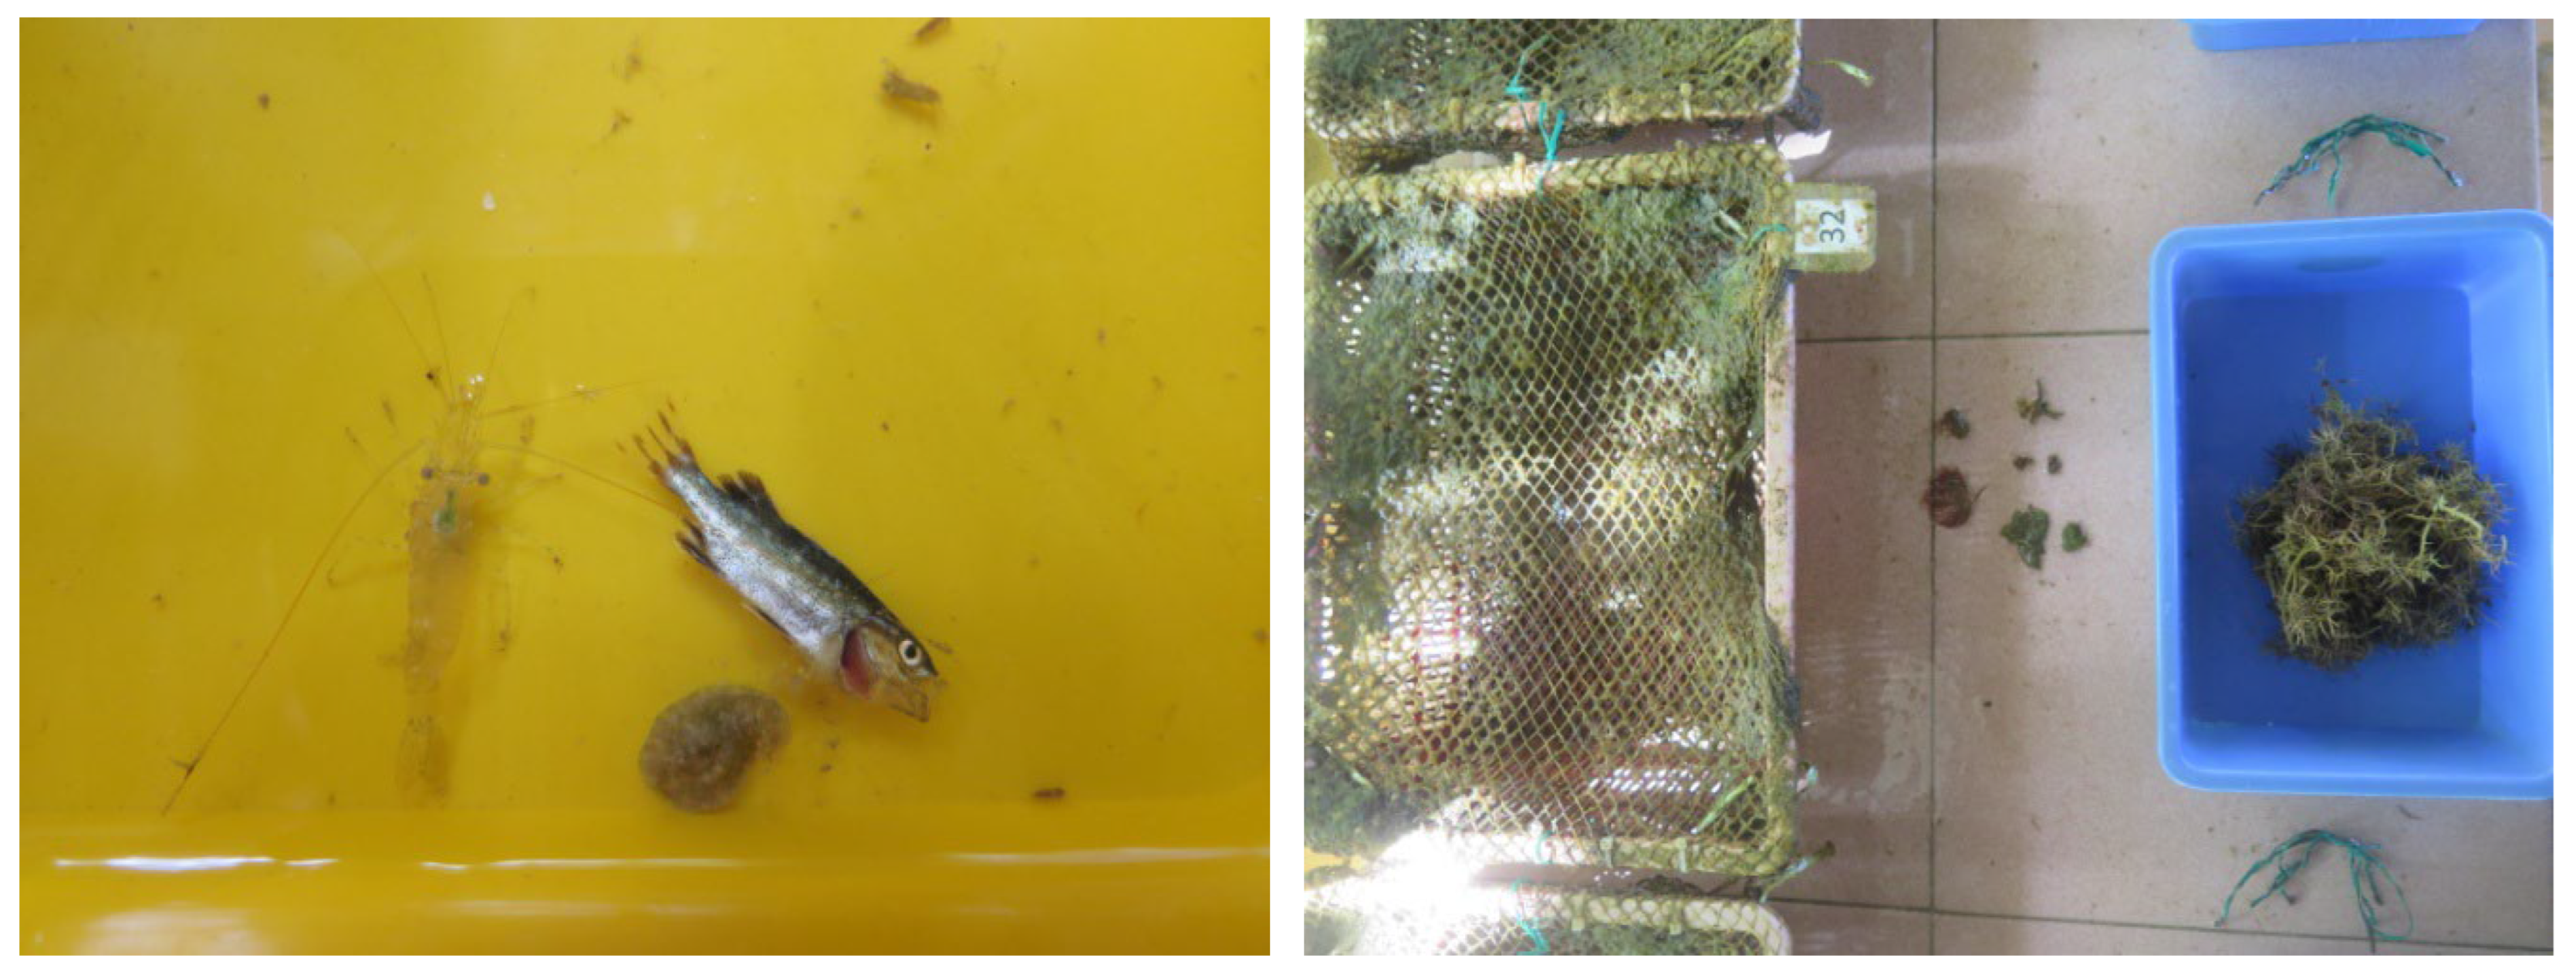
All Gracilaria samples were covered with epiphytic organisms like micro- and macro-algae and invertebrates. Besides, the net covering and planting basket were also attached with tiny brownish fouling invertebrates or microalgae and became abundant on day 28 for all baskets. Since the fouling organisms were too abundant and strongly attached to net covering, after fresh weight measurement all baskets were without cleaning planting baskets and tied back to the prototype for following growth observation.
List of fouling and epiphytic organisms: Invertebrates: Seahare, copepod, roundworm, shrimp (
Figure 10). Vertebrates: fish (not considered as fouling) (Figure 11). Microalgae: diatom mainly pennate diatom. Macroalgae: unidentified cyanobacteria; Bryopsis, Chaetomorpha, Cladophoropsis (green seaweed); Acanthophora, Herposiphonia, Laurencia, Polysiphonia, Tolypiocladia (red seaweed) (
Figure 10)
Discussion
The study presented a comprehensive approach to the feasibility analysis of deploying an offshore seaweed aquaculture system in Malaysia, emphasizing the importance of metocean data in ensuring structural safety and operational efficiency. This discussion synthesizes the findings and implications of the research, highlighting key aspects such as data collection, environmental factors, and the practical challenges faced during prototype deployment.
Metocean data, encompassing parameters such as tidal elevation, current speed and direction, temperature, and salinity, is critical for designing offshore structures. Accurate data prevents both under-designing, which could lead to structural failure, and over-designing, which results in unnecessary costs. The study utilized historical and real-time data from various coastal sites, processed through numerical modeling software (MIKE 21/3 HD FM), to simulate the environmental conditions accurately. This approach aligns with established methodologies in the field, providing a robust framework for assessing the feasibility of offshore projects.
The environmental conditions of the selected sites were carefully analyzed to ensure they met the requirements for seaweed cultivation. Temperature, salinity, light intensity, water movement, and bathymetric conditions were all considered. For instance, seaweed species such as Eucheuma and Gracilaria were found to thrive within specific temperature and salinity ranges. The study noted that temperatures above 35°C and salinities below 20 ppt could be detrimental to seaweed growth, aligning with findings from previous research.
The depth and sunlight availability were also critical factors. Seaweeds require a minimum light intensity of 50 μmol photon m² s⁻¹, necessitating careful placement of farming structures to ensure adequate light penetration. Water movement, characterized by current speed and direction, was another significant factor. Excessive current speeds can cause intolerable drag forces on the seaweed and mooring components, highlighting the importance of selecting sites with optimal current conditions.
One of the practical challenges encountered was the deployment of the prototype at Bidong Island. The study reported issues such as the loss of seaweed samples and the presence of fouling organisms, which impacted the growth rates of the seaweed. For example, Ulva samples were lost within 14 days, and Gracilaria species showed decreased growth rates over 28 days. These challenges underline the need for continuous monitoring and adaptive management practices to ensure the success of aquaculture systems.
The presence of fouling organisms, including microalgae and invertebrates, posed a significant challenge. These organisms competed with seaweed for nutrients and light, affecting overall growth rates. The study’s detailed documentation of these organisms provides valuable insights into potential ecological interactions that need to be managed in future deployments.
The findings from this study have several implications for future research and practical deployment of offshore seaweed aquaculture systems:
1. Data Collection and Analysis: Continued improvement in the accuracy and reliability of metocean data collection is essential. Integrating advanced technologies such as AI for data gap filling and real-time monitoring can enhance the precision of environmental simulations.
2. Environmental Suitability: Selecting sites with optimal environmental conditions is crucial. Detailed pre-deployment studies should be conducted to ensure that the selected sites meet the specific requirements of the seaweed species intended for cultivation.
3. Prototype Design and Testing: Iterative testing and refinement of prototype designs are necessary to address challenges such as fouling and structural stability. Adaptive designs that can be modified based on real-time feedback will likely improve the success rates of such projects.
4. Collaborative Efforts: Encouraging collaboration among industry stakeholders can lead to better resource sharing and cost efficiencies. Joint Industry Projects (JIPs) can play a significant role in advancing the offshore aquaculture sector, provided the risks associated with data and equipment sharing are managed effectively.
6. Conclusions
The study investigated the met
ocean environment for the spatial design and monitoring of a seaweed
aquaculture farm at the following potential sites; Western Coast near Langsuir
Cave, Pulau Langkawi, Eastern Coast near Bachok, Kelantan, Eastern Coast near
Setiu Wetland or River, Terengganu, Western Coast near Bidong Island,
Terengganu. The study collected historical met ocean data (wave, wind, and
current) of potential sites from reliable sources and met ocean data of present
conditions of potential sites via measuring instruments. Then modeled and
simulated the environment based on the data collected of present met ocean
conditions using MIKE 21/3 software and processed, analyzed, and calibrated the
met ocean data of each potential site. The prototype revealed information
required for scale-up.
This study underscores the
importance of a thorough feasibility analysis, driven by accurate metocean
data, for the successful deployment of offshore seaweed aquaculture systems. By
addressing environmental suitability and practical challenges, the research
provides a foundational framework for future endeavors in this emerging field.
The insights gained from the prototype deployment at Bidong Island will inform
subsequent projects, contributing to the sustainable growth of the offshore
aquaculture industry.
References
- Caires, S. , Swail, V. R., & Wang, X. L. (2017). Hindcast Data Sets for the North Atlantic and North Pacific Oceans. *Journal of Atmospheric and Oceanic Technology*, 34(2), 227-243.
- Calverley, M. , Szabo, D., Cardone, V., Orelup, E., & Parsons, M. (2002). Wave Climate Study of the Caribbean Sea (7th ed.). Retrieved from.
- http://www.oceanweather.com/about/papers/Wave%20Climate%20Study%20of%20the%20Caribbean%20Sea.pdf.
- Cho, W. (1996). GIS Application for Shoreline Management (1st ed.). Pangkor Island. - Case Study in Malaysia. 58. 157-166.
- Retrieved from http://www.water.gov.my/images/stories/coastal/pdf/newpapers/Did00010.pdf.
- Department of Irrigation and Drainage Malaysia, (2001). Guidelines for Preparation of Coastal Engineering Hydraulic Study and Impact Evaluation (5th ed.). Retrieved from http://www.water.gov.my/images/pdf/pce_hydraulic_study.pdf.
- Gan SY, Rofina Yasmin Othman, Qin S & Phang SM. (2006.) Crop improvement in seaweed cultivation. In: Phang et al. (eds) Advances in Seaweed Cultivation and Utilisation in Asia. University of Malaya Maritime Research Center Publication. p. 81- 104.
- Kent, E., & National Centre for Atmospheric Research (2014). Surface Flux and Meteorological Dataset: National Oceanography Centre (NOC) V2.0. Retrieved 19 March 2015, from https://climatedataguide.ucar.edu/climate-data/surface-flux-and-meteorological-dataset-national-oceanography-centre-noc-v20.
- Lee, S. (2001). Numerical Modelling Strategies in Coastal Hydraulic Studies (3rd ed.). Ampang: National Hydraulic Research Institute of Malaysia. Retrieved from http://www.water.gov.my/images/stories/coastal/pdf/newpapers/0000005399-did27.pdf.
- Lim, E. & Mohd Shahir Liew, (2015). Met ocean Data in the South China Sea: Hindcast (SEAFINE) vs. Measured Data. http://www.mssa.org.my/. Retrieved from http://www.mssa.org.my/site/index.php?option=com_content&view=article&id=117&Itemid=172.
- Lim, Y. , & Liew, M. S. (2018). Offshore Structural Engineering. *Engineering Journal*, 23(2), 105-112.
- Mayeetae, Z. Liew, M., & Yew, G. (2013). Correction Factors of Hindcast Wind and Wave for Malaysian Waters (1st ed.). Retrieved from http://www.seekdl.org/nm.php?id=1912.
- Masuda M, Abe T, Kogame K, Kawaguchi S, Phang SM, Daitoh M, Sakai T, Takahashi Y.
- & Suzuki M. (2002). Taxonomic notes on marine algae of Malaysia VIII. Three species.
- of Laurencia (Rhodophyceae). Botanica Marina 45(6): 571-579.
- National Centre for Atmospheric Research Staff (Eds), (2014). The Climate Data Guide: SODA: Simple Ocean Data Assimilation. https://climatedataguide.ucar.edu. Retrieved 19 March 2015, from https://climatedataguide.ucar.edu/climate-data/soda-simple-ocean-data-assimilation.
- National Centre for Atmospheric Research (Eds),. (2014). ORAS4: ECMWF Ocean Reanalysis And Derived Ocean Heat Content. https://climatedataguide.ucar.edu. Retrieved 19 March 2015, from https://climatedataguide.ucar.edu/climate-data/oras4-ecmwf-ocean-reanalysis-and-derived-ocean-heat-content.
- National Centre for Atmospheric Research (2013). Tropical Moored Buoy System: TAO, TRITON, PIRATA, RAMA (TOGA). https://climatedataguide.ucar.edu. Retrieved 19 March 2015, from https://climatedataguide.ucar.edu/climate-data/tropical-moored-buoy-system-tao-triton-pirata-rama-toga.
- National Centre for Atmospheric Research Staff (Eds), (2013). Global Sea Level FROM TOPEX & JASON ALTIMETRY. https://climatedataguide.ucar.edu. Retrieved 19 March 2015, from https://climatedataguide.ucar.edu/climate-data/global-sea-level-topex-jason-altimetry.
- National Centre for Atmospheric Research Staff (Eds), (2014). Climate Forecast System Reanalysis (CFSR). https://climatedataguide.ucar.edu. Retrieved 19 March 2015, from https://climatedataguide.ucar.edu/climate-data/climate-forecast-system-reanalysis-cfsr.
- Oceanweather.com, (2015). Met Ocean Studies: China Seas: GROW Fine South China Sea (GFSCS). Retrieved 19 March 2015, from http://www.oceanweather.com/met ocean/chinaseas/index.html.
- Oceanweather.com, (2015). Ocean Weather Inc: Met Ocean Studies: SEAFINE. Retrieved 19 March 2015, from http://www.oceanweather.com/met ocean/define.
- Phang, SM. (2006) Seaweed Resources in Malaysia: Current status and future prospects. Aquatic Ecosystem Health & Management 9(2): 185-202. [CrossRef]
- Rongxing, X., & Cho, W. Geographical Information System for Shoreline Management - A Malaysian Experience (1st ed.). Retrieved from http://www.water.gov.my/images/stories/coastal/pdf/newpapers/Did00011.pdf.
- Selamat, I., Liew, M., & Yew, G. (2013). Met Ocean Loads in Malaysian Waters: Extreme Value Analysis and Joint Probability (1st ed.). Retrieved from http://www.seekdl.org/nm.php?id=1921.
- Sharizaila Abdullah, (1993). Coastal Developments in Malaysia - Scope, Issues and Challenges (1st ed.). Retrieved from.
- http://www.water.gov.my/images/stories/coastal/pdf/newpapers/Did0006.pdf.
- Shaw, C. , & Shell Global Solutions (2019)., Offshore Industry Requirements and Recent Met Ocean Technology Developments (1st ed.). Retrieved from.
- http://ftp://ftp.wmo.int/Documents/PublicWeb/amp/mmop/documents/JCOMM-TR/J-TR-10-CLIMAR-99/Presentations/session_09/09.1_Shaw.pdf.
- Shaw & Shell Global Solutions. (2020). Joint Industry Projects in Metocean Data Collection*. Shell Global Solutions.
- Spindler, D., Chawla, A., & Tolman, H. (2011). An initial look at the CFSR Reanalysis winds for wave modeling (1st ed.). Retrieved from http://polar.ncep.noaa.gov/mmab/papers/tn290/MMAB_290.pdf.
- Storto, A., & National Centre for Atmospheric Research Staff (Eds), (2014). CMCC Global Ocean Reanalysis System (C-GLORS). https://climatedataguide.ucar.edu. Retrieved 19 March 2015, from https://climatedataguide.ucar.edu/climate-data/cmcc-global-ocean-reanalysis-system-c-glors.
- Sørensen, J. D. , & Hansen, L. P. (2018). Risk Management in Joint Industry Projects. *International Journal of Project Management*, 36(3), 365-373.
- Swail, V., Cardone, V., Ferguson, M., Gummer, D., Harris, E., Orelup, E., & Cox, A. (2006). The Msc50 Wind and Wave Reanalysis (9th ed.). Retrieved from http://www.oceanweather.com/about/papers/The%20MSC50%20Wind%20and%20Wave%20Reanalysis.pdf.
- Swail, V. , Cox, A., & Cardone, V. (2006). The North Atlantic Wave Climate. *Journal of Geophysical Research: Oceans*, 111(C6).
- Thornton, E. , Knauss, J. A., & Craig, A. (2016). Collaborative Research in Oceanography. *Marine Technology Society Journal*, 50(4), 7-13.
- Vannak, D. & Mohd Shahir Liew, (2013). Analyses and Validation of Measured Met Ocean Data in Time and Frequency Domains for Malaysian Basins and Operations (1st ed.). Retrieved from http://www.seekdl.org/nm.php?id=1731.
- Zieger, S. , Vinoth, J., & Young, I. R. (2020). Trends in Extreme Ocean Waves. *Geophysical Research Letters*, 47(3).
|
Disclaimer/Publisher’s Note: The statements, opinions and data contained in all publications are solely those of the individual author(s) and contributor(s) and not of MDPI and/or the editor(s). MDPI and/or the editor(s) disclaim responsibility for any injury to people or property resulting from any ideas, methods, instructions or products referred to in the content. |
© 2024 by the authors. Licensee MDPI, Basel, Switzerland. This article is an open access article distributed under the terms and conditions of the Creative Commons Attribution (CC BY) license (http://creativecommons.org/licenses/by/4.0/).
