1. Introduction
The 1990s will go down in history as a period of systemic financial crises for emerging economies. Latin American countries were first to be hit, following the 1994 Mexican peso crisis and its impact on other emerging markets (Herman and Klemm, 2019). This was followed by other crises that reverberated across emerging economies in Western Europe, East Asia and South-East Asia. In the beginning, blame was directed toward poor domestic policies, and little attention was given to the propagation aspect of these crises. It was only in the late 1990s, after more severe crises such as the 1997 “Asian flu”, the 1998 “Russian cold”, and the 1999 “Brazilian fever”, that economics and finance scholars began documenting the propagations of the crises from one country to another (Kaminsky and Reinhart, 2000). These propagations — if they cannot be explained by economic fundamentals alone —are referred to as financial contagions (hereafter referred to as contagions).
In this study, we investigate the pure form of contagions within the original members of the BRICS economic bloc, namely Brazil, Russia, India, China, and South Africa. The pure form of contagion refers to the propagations of shocks that are not related to shocks in macroeconomic fundamentals, and are solely the result of irrational phenomena, such as panics, herd behaviour, loss of confidence and risk aversion. The choice of BRICS was motivated by the fact that these emerging countries have stronger partnerships through the BRICS association. Additionally, these countries come from various continents across the world. This allows us to have a worldwide overview of how contagions are transmitted, not only in one region but across regions.
There is still a disagreement among academics as to the precise definition of contagion, and whether it should apply between two countries with similar macroeconomic fundamentals and direct linkages. The global financial crisis of 2008-2009 and the EuroZone Sovereign Debt Crisis (EZDC) crisis of 2009-2012 led to extensive research on financial contagion, with studies finding evidence of contagion effects across regional stock markets and financial and non-financial sectors. The most vulnerable sectors were observed in emerging Asian and European regions, while developed regions and some sectors across all regions were less affected. Our study adds to the existing literature on financial contagion in emerging market.
We utilise the Maximum Overlap Discrete Wavelet Transform (MODWT), as introduced by Percival and Walden (2000), to examine the presence of financial contagion within the stock markets of Brazil, Russia, India, China, and South Africa (BRICS) subsequent to the EZDC. The MODWT offers several advantages, including enhanced time-frequency resolution, localised interconnectedness, multiscale analysis, the capture of nonlinear dependencies, and robustness to volatility clustering. It also provides an improved computational efficiency, and better statistical properties. These properties enable an accurate analysis of transient phenomena and facilitate the extraction of meaningful information for studying financial contagion dynamics. These advantages render it a potent tool for assessing interconnections within financial data.
We position this paper within the literature that investigates the pure form of financial contagion in emerging markets using wavelet analysis. In this context, we posit that the market interconnectedness identified within this body of literature aligns more closely with what Giordano, Pericoli, and Tommasino (2013) term “wake-up call contagion” rather than “pure financial contagion.”
“Wake-up call contagion” is a channel of contagion that is most relevant for contagion across countries and financial institutions and markets. It occurs when a crisis in one country or financial institution leads investors to reevaluate the risk of a crisis in other countries or financial institutions, even if those countries or financial institutions have no direct exposure to the crisis (Ahnert and Bertsch, 2022). The above-mentioned argument places the analysis caused by COVID-19 [1] beyond the purview of this study.
We observe the presence of financial contagion in South Africa and Russia in the wake of the EZDC. Policymakers in South Africa and Russia should prioritise understanding idiosyncratic shock channels to address volatility spillover from the Eurozone’s equity market. This targeted approach allows for more effective responses tailored to specific vulnerabilities, emphasising the importance of maintaining strong domestic economic foundations for these countries in the face of global uncertainties. We find no contagion in the Brazilian, Chinese, and Indian stock markets during the European sovereign debt crisis. This resilience may be attributed to strong domestic economic fundamentals and effective policy measures.
The remainder of this paper is organised as follows:
Section 2 provides a review of the literature on the spillover effects of developed stock markets on emerging markets and BRICS countries in particular.
Section 3 details the methodology employed in this study.
Section 4 presents the results of our analysis and discusses these findings within the context of previous research and the objectives of this paper.
Section 5 offers policy recommendations, and
Section 6 brings the article to a conclusion.
2. Literature Review
In this section, we begin by surveying the literature on various perspectives of financial contagion. We then examine the literature that analyses financial contagion during financial crises originating from developed countries. Next, we focus on the literature related to financial contagion in emerging markets, with particular emphasis to BRICS countries. Lastly, we review some recent empirical studies that utilise wavelet analysis to investigate financial contagion.
2.1. Different Perspectives on Financial Contagion
Financial contagion can be defined as a significant increase in cross-market linkages after a shock. The term contagion started to gain popularity in financial and international economics literature in the aftermath of the “Asian Flu”, the financial crisis that engulfed Thailand in 1997. The crisis quickly spread through East Asia and later reached Russia and Brazil. Before this crisis, the term “contagion” usually referred to the spread of infectious diseases (Claessens and Forbes, 2013). Although drawing analogies between the propagation of financial crisis and the propagation of infectious diseases might seem fanciful, Claessens and Forbes (2013) pointed out that the comparison is useful on several levels. Both refer to the transmission of a malady through direct or indirect contact.
Over the years, the term contagion has gone through a gradual refinement and measurement process. Even though contagions have been documented in various papers, there is no consensus in the literature on the exact definition of what constitutes contagion and how it is measured. The definition of contagion provided by Forbes and Rigobon (2002:3) as “a significant increase in cross-market linkage after a shock to one country or group of countries” has gained widespread popularity. However, it is not universally accepted and is considered narrow by some scholars (Ranta, 2013).
Liow, Zhou, Li, and Huang (2019) emphasised the significance of differentiating between “fundamentals-based” and “pure” contagion. ‘Fundamentals-based” Fundamentals-based financial contagion refers to a situation where shocks are transmitted through the financial market due to underlying economic fundamentals. “Pure” contagion characterises a condition where an excessive transmission of shocks during a crisis occurs independently of any specific disturbances or fundamental linkages. This transmission is relatively rapid and ceases within a brief period. These transmissions result exclusively from irrational phenomena, such as panics, herd behaviour, loss of confidence, and risk aversion.
The World Bank (2013) reviewed the literature on contagion and identified three levels of definitions for it, they are (i) the broad, (ii) the restrictive, and (iii) the very restrictive. The broad definition characterises contagion as the transmission of shocks across countries or general cross-country spillover effects. This definition posits that contagion can occur during both tranquil and crisis periods. The restrictive definition views contagion as the result of shock propagation to other countries or cross-country correlation, beyond any fundamental link among the countries and common shocks. This definition is commonly known as excess co-movement and can be attributed to investors’ herd behaviour. Lastly, the very restrictive definition of contagion refers to the rise in cross-country correlations during crisis periods, compared to correlations during tranquil periods.
In a similar vein, Giordano, Pericoli, and Tommasino (2013) conducted a review to offer more precise and refined definitions of contagion. They went beyond the generic classifications to pinpoint specific circumstances in which contagion manifests itself, categorising these manifestations into three distinct types (i) wake-up call contagion, (ii) shift contagion and (iii) pure contagion.
Wake-up call contagion occurs when a crisis in one country leads investors to reevaluate the risk of default in other countries, even if those countries have no direct exposure to the crisis. The hypothesis of the wake-up call contagion was first proposed by Goldstein (1998) to explain contagion during the Asian financial crisis of the late 1990s. The author argued that a crisis in one region (region 1) can act as a wake-up call to investors in another region (region 2), compelling them to re-evaluate the regional fundamentals and obtain information about the macroeconomic shock. This can lead to contagion even if investors learn that region 2 has no ex-post exposure to region 1.
The shift contagion occurs when the normal cross-market connections intensify after a crisis in one country. Giordano, Pericoli, and Tommasino (2013) stressed that unlike wake-up-call contagion, which is driven by country-specific factors, shift contagion results from increased sensitivity to common global factors, such as global risk aversion. It can be thought of as a heightened response to shared economic conditions.
Pure contagion encompasses instances of contagion that are entirely unrelated to changes in fundamentals, whether at the country-specific or global level. Pure contagion can arise from various sources, including self-fulfilling loss of confidence, irrational herding behaviour, or wealth effects due to capital losses in the country that initiated the crisis (Giordano, Pericoli, and Tommasino, 2013).
2.2. Financial Contagion during Financial Crises
An extensive literature on financial contagion has developed in the aftermath of financial crises global financial crisis of 2008 - 2009 and the Eurozone crisis of 2009 -2012. These include among others Kenourgios and Dimitriou (2015) who examined the contagion effects of global financial crisis of 2008 and 2009 in ten sectors within six developed and emerging regions during different phases of the crisis. Their findings indicated that the global financial crisis of 2008 -2009 can be characterised by contagion effects across regional stock markets and regional financial and non-financial sectors. However, they noted that developed Pacific region and some sectors in particular consumer goods, healthcare and technology across all regions were less affected by the crisis, while the most vulnerable sectors were observed in the emerging Asian and European regions.
Ahmad, Sehgal and Bhanumurthy (2013) investigated the contagion effects of Greece, Ireland, Portugal, Spain, Italy, USA, UK and Japan markets on BRIICKS (Brazil, Russia, India, Indonesia, China, South Korea and South Africa) stock markets, during EZDC period, their empirical results indicated that among Eurozone countries, Ireland, Italy and Spain appear to be most contagious for BRIICKS markets compared to Greece. The study also indicated that Brazil, India, Russia, China and South Africa were strongly hit by the contagion shock during the EZDC. However, Ahmad, Sehgal and Bhanumurthy (2013) found that Indonesia and South Korea only experienced interdependence and not contagion.
Hemche, Jawadi, Maliki and Cheffou (2016) studied the contagion hypothesis for ten developed and emerging stock markets (namely France, Italy, UK, Japan, China, Argentina, Mexico, Tunisia, Morocco and Egypt) with respect to the US market in the context of the subprime crisis. Their findings indicated that there was an increase in dynamic correlations following the subprime crisis for most markets under consideration with regard to the U.S. market with regard to the U.S. market.
2.3. Within-BRICS and BRICS-Developed Market Interconnectedness
Emerging markets have borne the brunt of contagions to the greatest extent. Kaminsk, Reinhar, and Végh (2003) identified three crucial components, termed the “unholy trinity”, that render emerging markets susceptible to contagions they are (i) a sudden reversal in capital inflow, (ii) an unforeseen announcement, and (iii) a leveraged common creditor. Concerning the reversal in capital inflow, Kaminsk, Reinhar, and Végh (2003) noted that before financial contagions, markets prone to crises witness a surge in international capital inflow, but subsequent to the initial shock, these affected economies encounter an abrupt cessation in capital inflow. Elaborating on surprise announcements, they highlighted that contagion could be explained by an unexpected announcement that triggers a domino effect that consistently catches the financial market off guard. Addressing the role of a common creditor, Kaminsk, Reinhar, and Végh (2003) emphasised that a leveraged common creditor is often involved, as seen with American banks in Latin American crises or Japanese banks in Asian crises.
Multiple studies have investigated the interconnectedness of BRICS countries, leading to the identification of two distinct lines of research. The first strand primarily delves into the within-group connectedness of BRICS equity markets. Notably, Kumar (2023) examined the volatility of currency and equity markets during the COVID-19 pandemic and the Russia-Ukraine conflict. His research confirmed the presence of cross-border contagion effects among BRICS member nations, with significant volatility spillover across markets. Kumar (2023) also observed that during the Ukraine conflict, Russian influence notably intensified, while increased spillover was observed among other countries during the pandemic and the conflict. Similarly, Ganguly and Bhunia (2022) utilised the GARCH family model and ARDL model, revealing the presence of a leverage effect solely in the Indian stock market and providing a validation fora long-run relationship between the stock market of Russia and China, as well as between the Indian stock market and South Africa. Moreover, the ARDL test suggested a short-run relationship from the Brazil stock market to select other stock markets, from the Indian stock market to the stock markets of Brazil and South Africa, and from the South African stock market to the Indian stock market.
The second strand of research focuses on the interconnectedness of BRICS equity markets with developed markets. Collectively, the findings of these studies indicate a certain degree of integration between the equity markets of BRICS countries and other developed markets. Sehgal, Mittal, and Mittal (2019) utilised the ADCC-EGARCH model and a block aggregation technique, revealing moderate cohesion within BRICS equity markets and increased integration during the global financial crisis. Similarly, Bhar and Nikolova (2009), employing the bivariate EGARCH framework, identified varying levels of integration and a negative relationship between India’s volatility and that of the Asia-Pacific region, suggesting potential diversification opportunities.
2.4. Using Wavelet Analysis to Model Contagion
Several studies have employed wavelet analysis to investigate financial contagion in emerging markets. Kannadhasan and Das (2019), for example, examined changes in the co-movement dynamics between the stock market returns of BRICS countries and the United States before and after the global financial crisis (GFC). The findings revealed co-movement at both high and low frequencies, with contagion effects observed around the GFC in 2008. In another study, Batondo and Uwilingiye (2021) investigated the co-movement across BRICS (Brazil, Russia, India, China, and South Africa) and the US stock market. The research indicated that both BRICS and US markets were exposed to major crises over the past two decades. Additionally, the authors identified specific periods, such as before the US housing bubble and after the EU sovereign debt crises, where certain shocks led to pure contagion. As for Gurdgiev and O’Riordan (2022), they examined cross-contagion between advanced economies and the BRICS markets. Their findings indicated bidirectional spillover between the BRICS and advanced markets, leading them to conclude that arbitrage opportunities continue to exist in the international stock market with respect to BRICS assets.
The aforementioned studies, which utilised wavelet analysis, exclusively employed CWT techniques. CWT offers high frequency and time resolution, making it suitable for capturing fine-grained details and localised changes in non-stationary financial data (Torrence and Compo, 1998). The current study uses an alternative approach to CWT, namely the MODWT technique. MODWT is known for its computational efficiency and ability to strike a balance between frequency resolution and time localisation (Abramovich, Sapatinas, and Silverman, 1998). It is particularly suitable for analysing stationary or weakly non-stationary signals, prioritising precise time localisation of signal components over exact frequency resolution. The selection of MODWT over CWT is justified in this study due to the stationary nature of the data [i]. Additionally, MODWT provides enhanced time-frequency localization, computational efficiency, improved statistical properties, and greater interpretability (Ahmad, Sehgal, and Bhanumurthy, 2013).
2.5. Synopsis
As evidenced in the literature provided above, even though there are various perspectives on the nature and properties of contagion, this phenomenon has been widely covered by research, especially following the Covid-19 crisis. The wavelet approach has been one of the most robust methods used to analyse contagion, and we build on this approach by applying a different type of wavelet analysis in the present study.
3. Data and Methodology
This section provides an overview of the data and econometric models used to study the existence of financial contagion in the BRICS stock market, in the aftermath the EZDC. The analysis focuses on examining the relationships between the pairwise stock indices of the source market or “ground zero” (Eurozone) and the target market (BRICS).
In this study, the MODWT is utilised to decompose the time series data of each market into different frequency scales. This approach facilitates the separation of the time series into high and low-frequency components. To assess the level of similarity or dissimilarity between the frequency components of each market, wavelet correlation is computed. Additionally, wavelet cross-correlation is estimated between the time series of each market pair to identify the degree of association between their frequency components, thereby helping to identify lead-lag relationships between the signals. The presence of financial contagion will be determined based on the presence of high correlation (between the source market and the target market) at lower scales, indicating a shorter time horizon.
3.1. DATA
The data used comprise daily closing stock price indices from BRICS and German stock markets spanning the period from 11th of January 2005 to 26th of December 2017. We employ daily data, considering its alignment with the nature of pure contagion, which typically manifests within a short-term time frame (Rigobon, 2002). The ‘target’ stock market indices examined are those in Brazil (São Paulo Stock Exchange/Bolsa de Valores de São Paulo index, BOVESPA), China (Shanghai Stock Exchange index, SSE), India (Bombay Stock exchange index, SENSEX), Russia (Moscow Exchange index, RTS) and South Africa (Johannesburg Stock Exchange All share index, FTSE/JSE). The daily stock price index of the German DAX Composite index is used as a proxy for ‘source’ (ground zero) markets. The DAX was chosen as a proxy for the Eurozone countries, representing continental Europe, because its performance is widely regarded as an indicator of the German economy’s health. Given that Germany’s economy constitutes nearly one-third of the Eurozone’s total value (Fröhlich, 2021), the DAX serves as a suitable representation of the broader economic health of continental Europe.
3.2. Wavelet Models
The dynamic structure of the relationship between variables in financial markets can vary significantly over different time scales. However, most econometric models focus on a two-scale analysis, namely the short-run and long-run, due to a lack of suitable empirical tools. In recent years, wavelet analysis has gained attention in the fields of economics and finance as a means of addressing this limitation (In and Kim, 2013). Wavelet analysis offers a more comprehensive and nuanced approach to analysing financial contagion by allowing us to see both the forest and the trees (Graps,1995). It provides a way to decompose time series data into different frequency components, enabling a more precise analysis of the time-varying nature of financial markets. Additionally, wavelet analysis can handle non-stationary data, which is typical in financial markets. Wavelet analysis also enables multiscale analysis, meaning that it can identify contagion and interdependence patterns at different levels of granularity. Furthermore, wavelet cross-correlation analysis can identify lead-lag relationships between different markets, which can help in identifying the direction of contagion. Overall, wavelet analysis offers a significant improvement over traditional methods that assume stationarity and ignore the time-varying nature of financial data (Hashim and Masih, 2015).
Wavelet analysis entails estimating an initial series onto a sequence of two basic functions, known as wavelets. The two basic functions are the father wavelet (also known as the scaling function), , and the mother wavelet (known as the wavelet function), ψ. The mother wavelet can be scaled and translated to form the basis for the Hilbert space L2 () of square-integrable functions.
The following functions can define the father and mother wavelets:
where
j = 1, ...,
J is the scaling parameter in a
J-level decomposition, and
k is a translation parameter (
j,
k ). The long-run trend of the time series is depicted by the father wavelet, which integrates to 1. The mother wavelet, which integrates to 0, expresses fluctuations from the trend.
3.3. The Maximal Overlap Discrete Wavelet Transform (MODWT)
The Maximal Overlap Discrete Wavelet Transform (MODWT) is a powerful signal processing technique that builds upon the foundations of the Discrete Wavelet Transform (DWT). Both the MODWT and the DWT are commonly used methods for decomposing time series data, allowing for analysis at different scales. However, the MODWT introduces some distinctive characteristics that set it apart from the traditional DWT. Hashim and Masih (2015) highlight the advantages of MODWT over DWT as follows: (1) the MODWT can handle any sample size regardless of whether or not the series is dyadic (that is of size 2J0, where J0 is a positive integer number); (2) it offers increased resolution at higher scales as the MODWT oversamples the data; (3) translation-invariance ensures that MODWT wavelet coefficients do not change if the time series is shifted in a ‘circular’ fashion; (4) the MODWT produces a more asymptotically efficient wavelet variance than the DWT. The MODWT was chosen for the current study.
The MODWT estimator of the wavelet correlation is specified as follows:
where
represents the scale of the wavelet coefficient
obtained by applying MODWT. The decomposition of the time series using MODWT is done with Daubechies least asymmetric (LA) wavelet filter of length 8.
3.4. Wavelet Variance and Wavelet Correlation
The MODWT can decompose a sample variance of a series on a scale-by-scale basis since MODWT is energy conserving.
From equation 4 above a scale-dependent analysis of variance from the wavelet and scaling coefficients is derived as follows:
Wavelet variance is defined for both stationary and non-stationary processes by letting {
Xt: t = ..., –1, 0, 1, ... } be a discrete parameter real-valued stochastic process whose
d th-order differencing will give a stationary process (Percival and Walden, 2006):
with spectral density function (SDF)
SY(.) and mean
μY. Let S
X(.) denote the SDF for {
Xt}, for which
SX(
f) =
SY(
f)/
Dd(
f), where D(
f) ≡ 4
sin2 (π
f). Filtering {
Xt} with a MODWT Daubechies wavelet filter.
of width
L 2
d, a stationary process of
jth-level MODWT wavelet is derived as follows:
where
is a stochastic process achieved by filtering {
Xt} with the MODWT wavelet filter
and
.
With a series which is the realisation of one segment (with values
X0, ..., X
N – 1) of the process {
Xt}. Under the condition that
Mj ≡
N – Lj + 1 > 0 and that either
L > 2
d or
μx = 0 (realisation of either of these two conditions implies
and therefore
), an unbiased estimator of wavelet variance of scale
is given by (Percival and Walden, 2006):
where
are the
jth-level MODWT wavelet coefficients for time series
It can be proved that the asymptotic distribution of
is Gaussian, which allows the formulation of confidence intervals for the estimate (Percival, 1995; Dajčman, 2013). Given two stationary processes {
Xt} and {
Yt}, whose
jth-level MODWT wavelet coefficients are
and
an unbiased covariance estimator
is specified by (Percival, 1995):
with
being the number of non-boundary coefficients at the
jth-level. The MODWT correlation estimator for scale
τj can be obtained by using the wavelet covariance and the square root of wavelet variances:
where
. The wavelet correlation is analogous to its Fourier equivalent, the complex coherency (Gençay, Selçuk and Whitcher, 2003).
Computation of confidence intervals is based on Percival (1995) and Percival and Walden (2006), with the random interval.
capturing the right wavelet correlation and providing an approximate 100(1 – 2p) % confidence interval.
3.5. Wavelet Cross-Correlation
Cross-correlation is a method in wavelet analysis which consists of estimating the degree to which two time series are correlated. The series can be shifted (either lag [π is then negative] or lead [π is then positive]) and then the correlation between the two-time series computed. Cross-correlation analysis allows us to identify which series return innovations are leading the other’s return innovations, with the latter time series considered as lagging. The size and significance of cross-correlation indicate whether the leading time series has predictive power for the lagging time series. Just as the usual time-domain cross-correlation is used to determine the lead/lag relationships between two time series, the wavelet cross-correlation will provide a lead/lag relationship on a scale-by-scale basis. The MODWT cross-correlation for scale τ
j at lag π is formulated as:
where
are the
jth-level MODWT wavelet coefficients of time series {
Xt}, at time
t, and
are the
jth-level MODWT wavelet coefficients of time series {
Yt} lagged for π time units. Wavelet cross-correlation takes values,
, for all
τ and
j. This can be shown using Cauchy-Schwartz inequality.
3.6. Wavelet Coherence
In this study, a bivariate approach known as wavelet coherence is employed to explore the interplay between two time series and assess the degree to which a linear transformation establishes a connection between them. The aim is to examine the level of association and dependence between the two series using the wavelet coherence framework. The wavelet coherence of two time series is specified as follows:
where
S is a smoothing operator,
s is a wavelet scale,
is the continuous wavelet transform of the time series
X, is the continuous wavelet transform of the time series
Y, and
is a cross-wavelet transform of the two time series
X and
Y (Saiti, Bacha and Masih, 2016).
4. Results of Wavelet Analysis
The MODWT used the Daubechies least asymmetric filter with a wavelet filter length of 8 (LA) to examine financial contagion in the aftermath of the EZDC. The wavelet analysis was performed with eight scales that span from two- day to one-and-a-half year dyadic steps (2-4 days, 4-8 days, 8-16 days, 16-32 days, 32-64 days, 64-128 days, 128-256 days and 256-512 days). Scales are presented on the horizontal axis and correlations on the vertical axis. To analyse statistical significance, 95% confidence intervals are used.
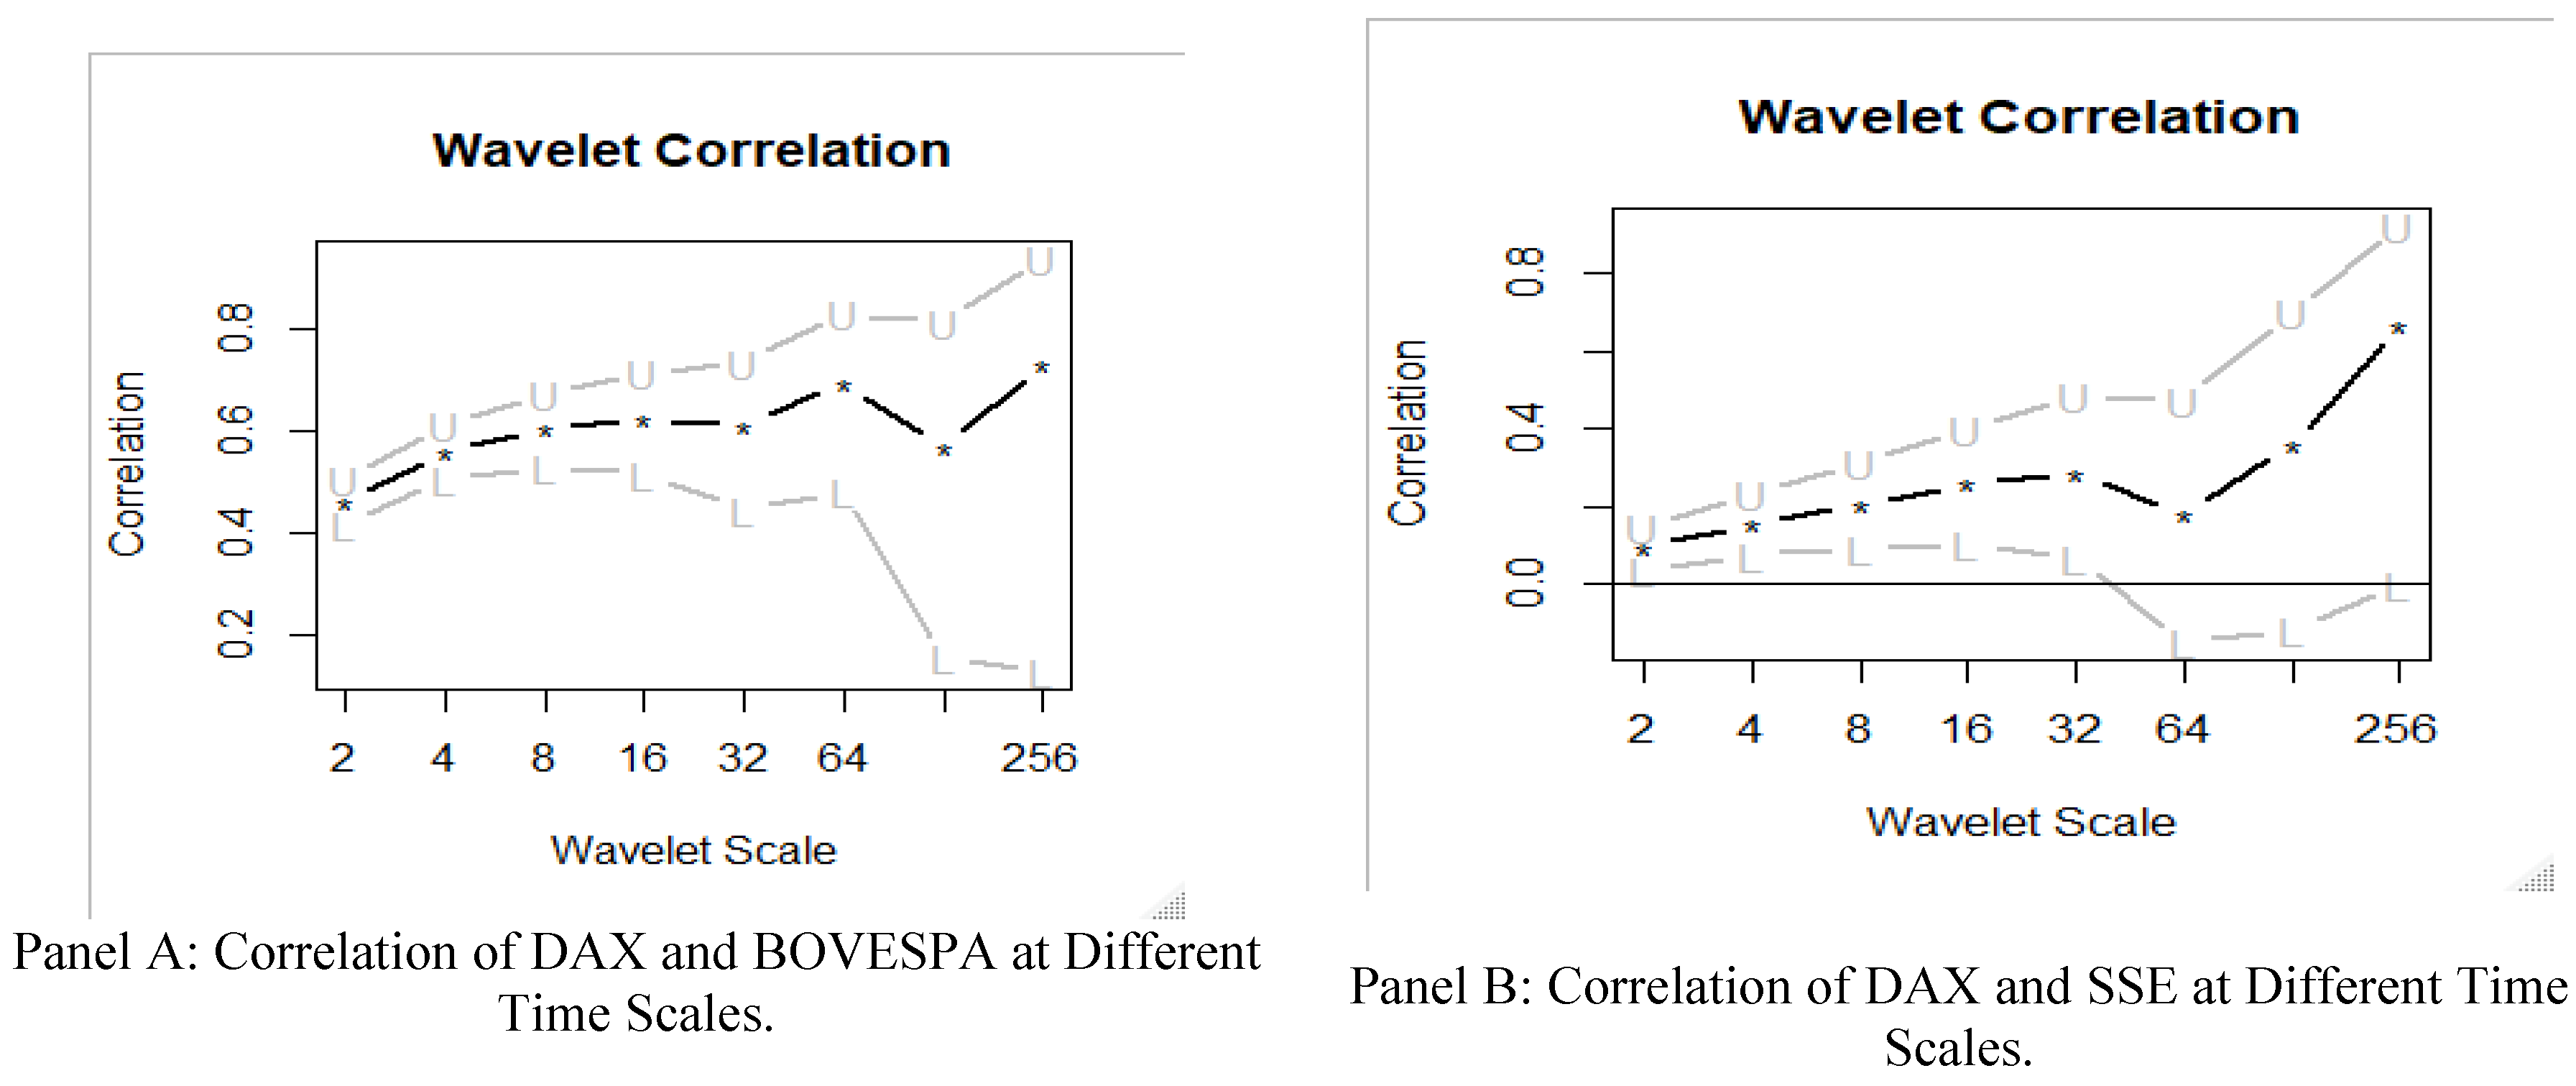
The wavelet correlations between the DAX and BRICS stock indices were found to be significantly positive except for the Chinese stock market. The correlations tend to increase as the scale increases. However, there is a sharp decrease on scale 7 (except for the Russian stock market where the sharp decrease is recorded at scale 5); after that the correlation increases again, reaching values close to unity at scale 8. This implies that dependencies between the Eurozone and BRICS equity market, do not dispel for a period of less than a year. In other words, for the more extended period, the correlation between the Eurozone and BRICS equity markets (except the Chinese market) should not be ruled out. This can also be interpreted as perfect integration between the Eurozone and BRICS equity markets.
Figure 1-depicts the wavelet correlation between the DAX index and two individual BRICS indices: the BOVESPA index of Brazil (panel A) and the SSE index of China (panel B). Illustrations for other BRICS indices can be provided upon request from the authors.
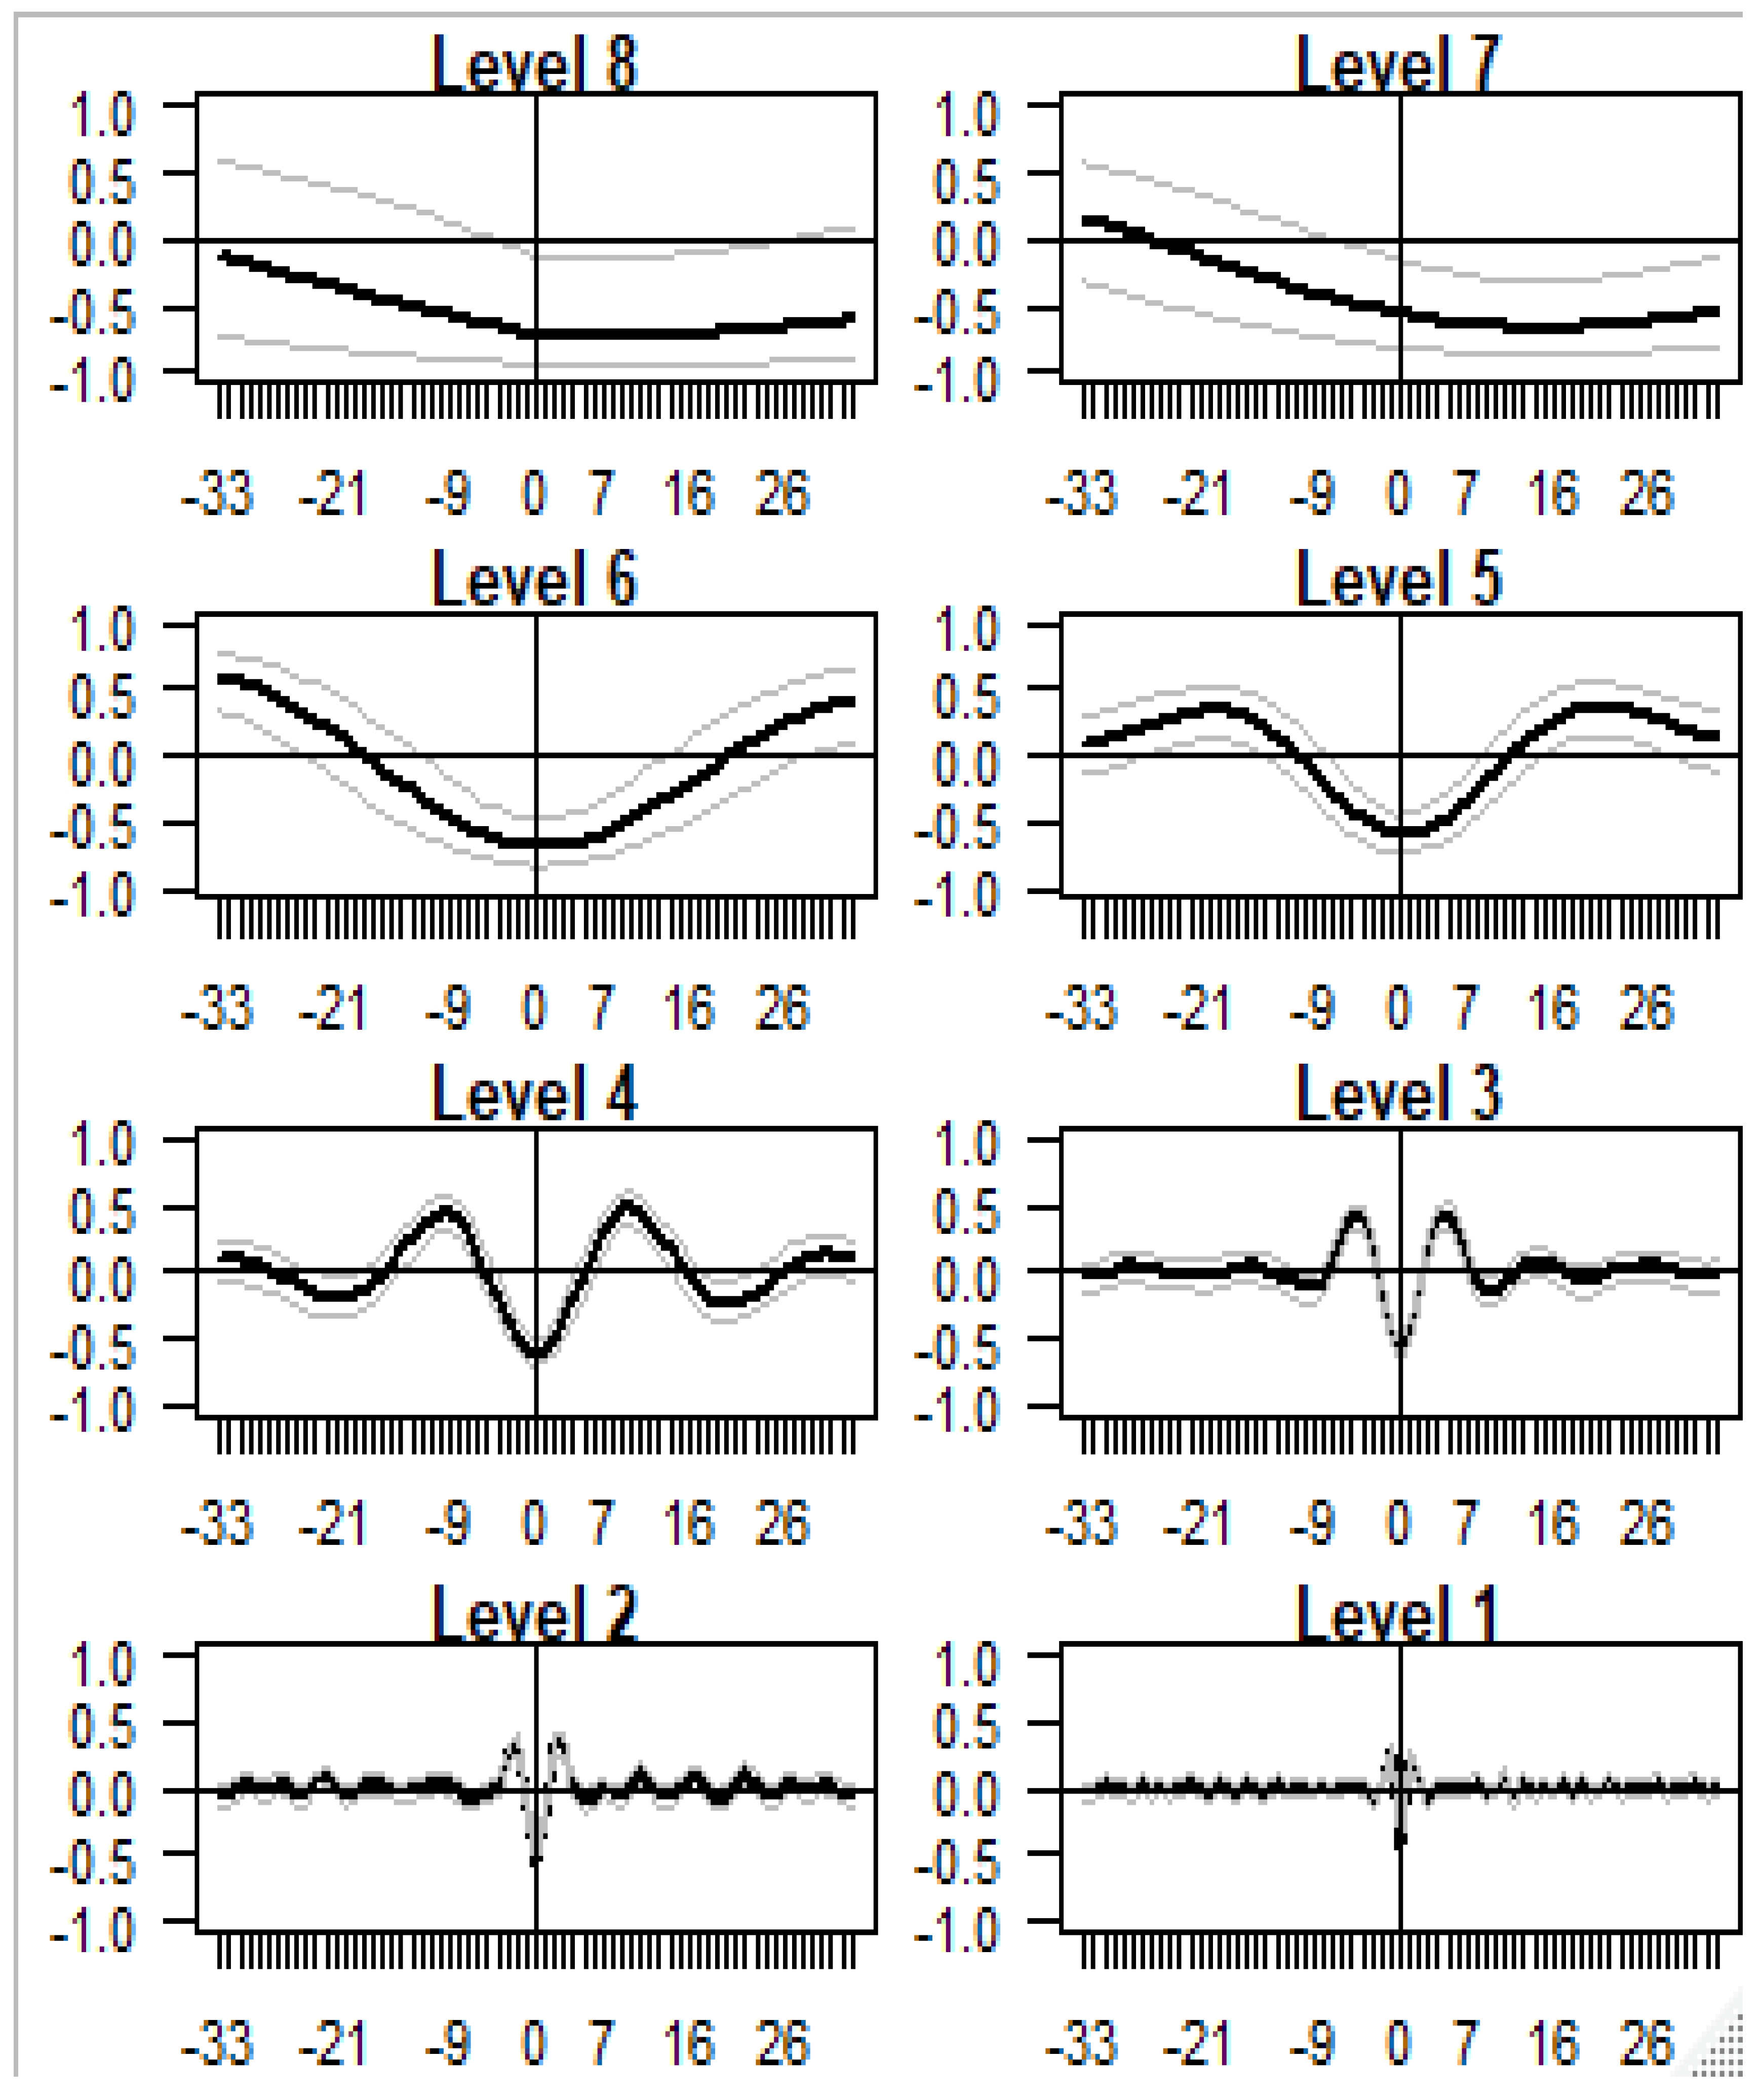
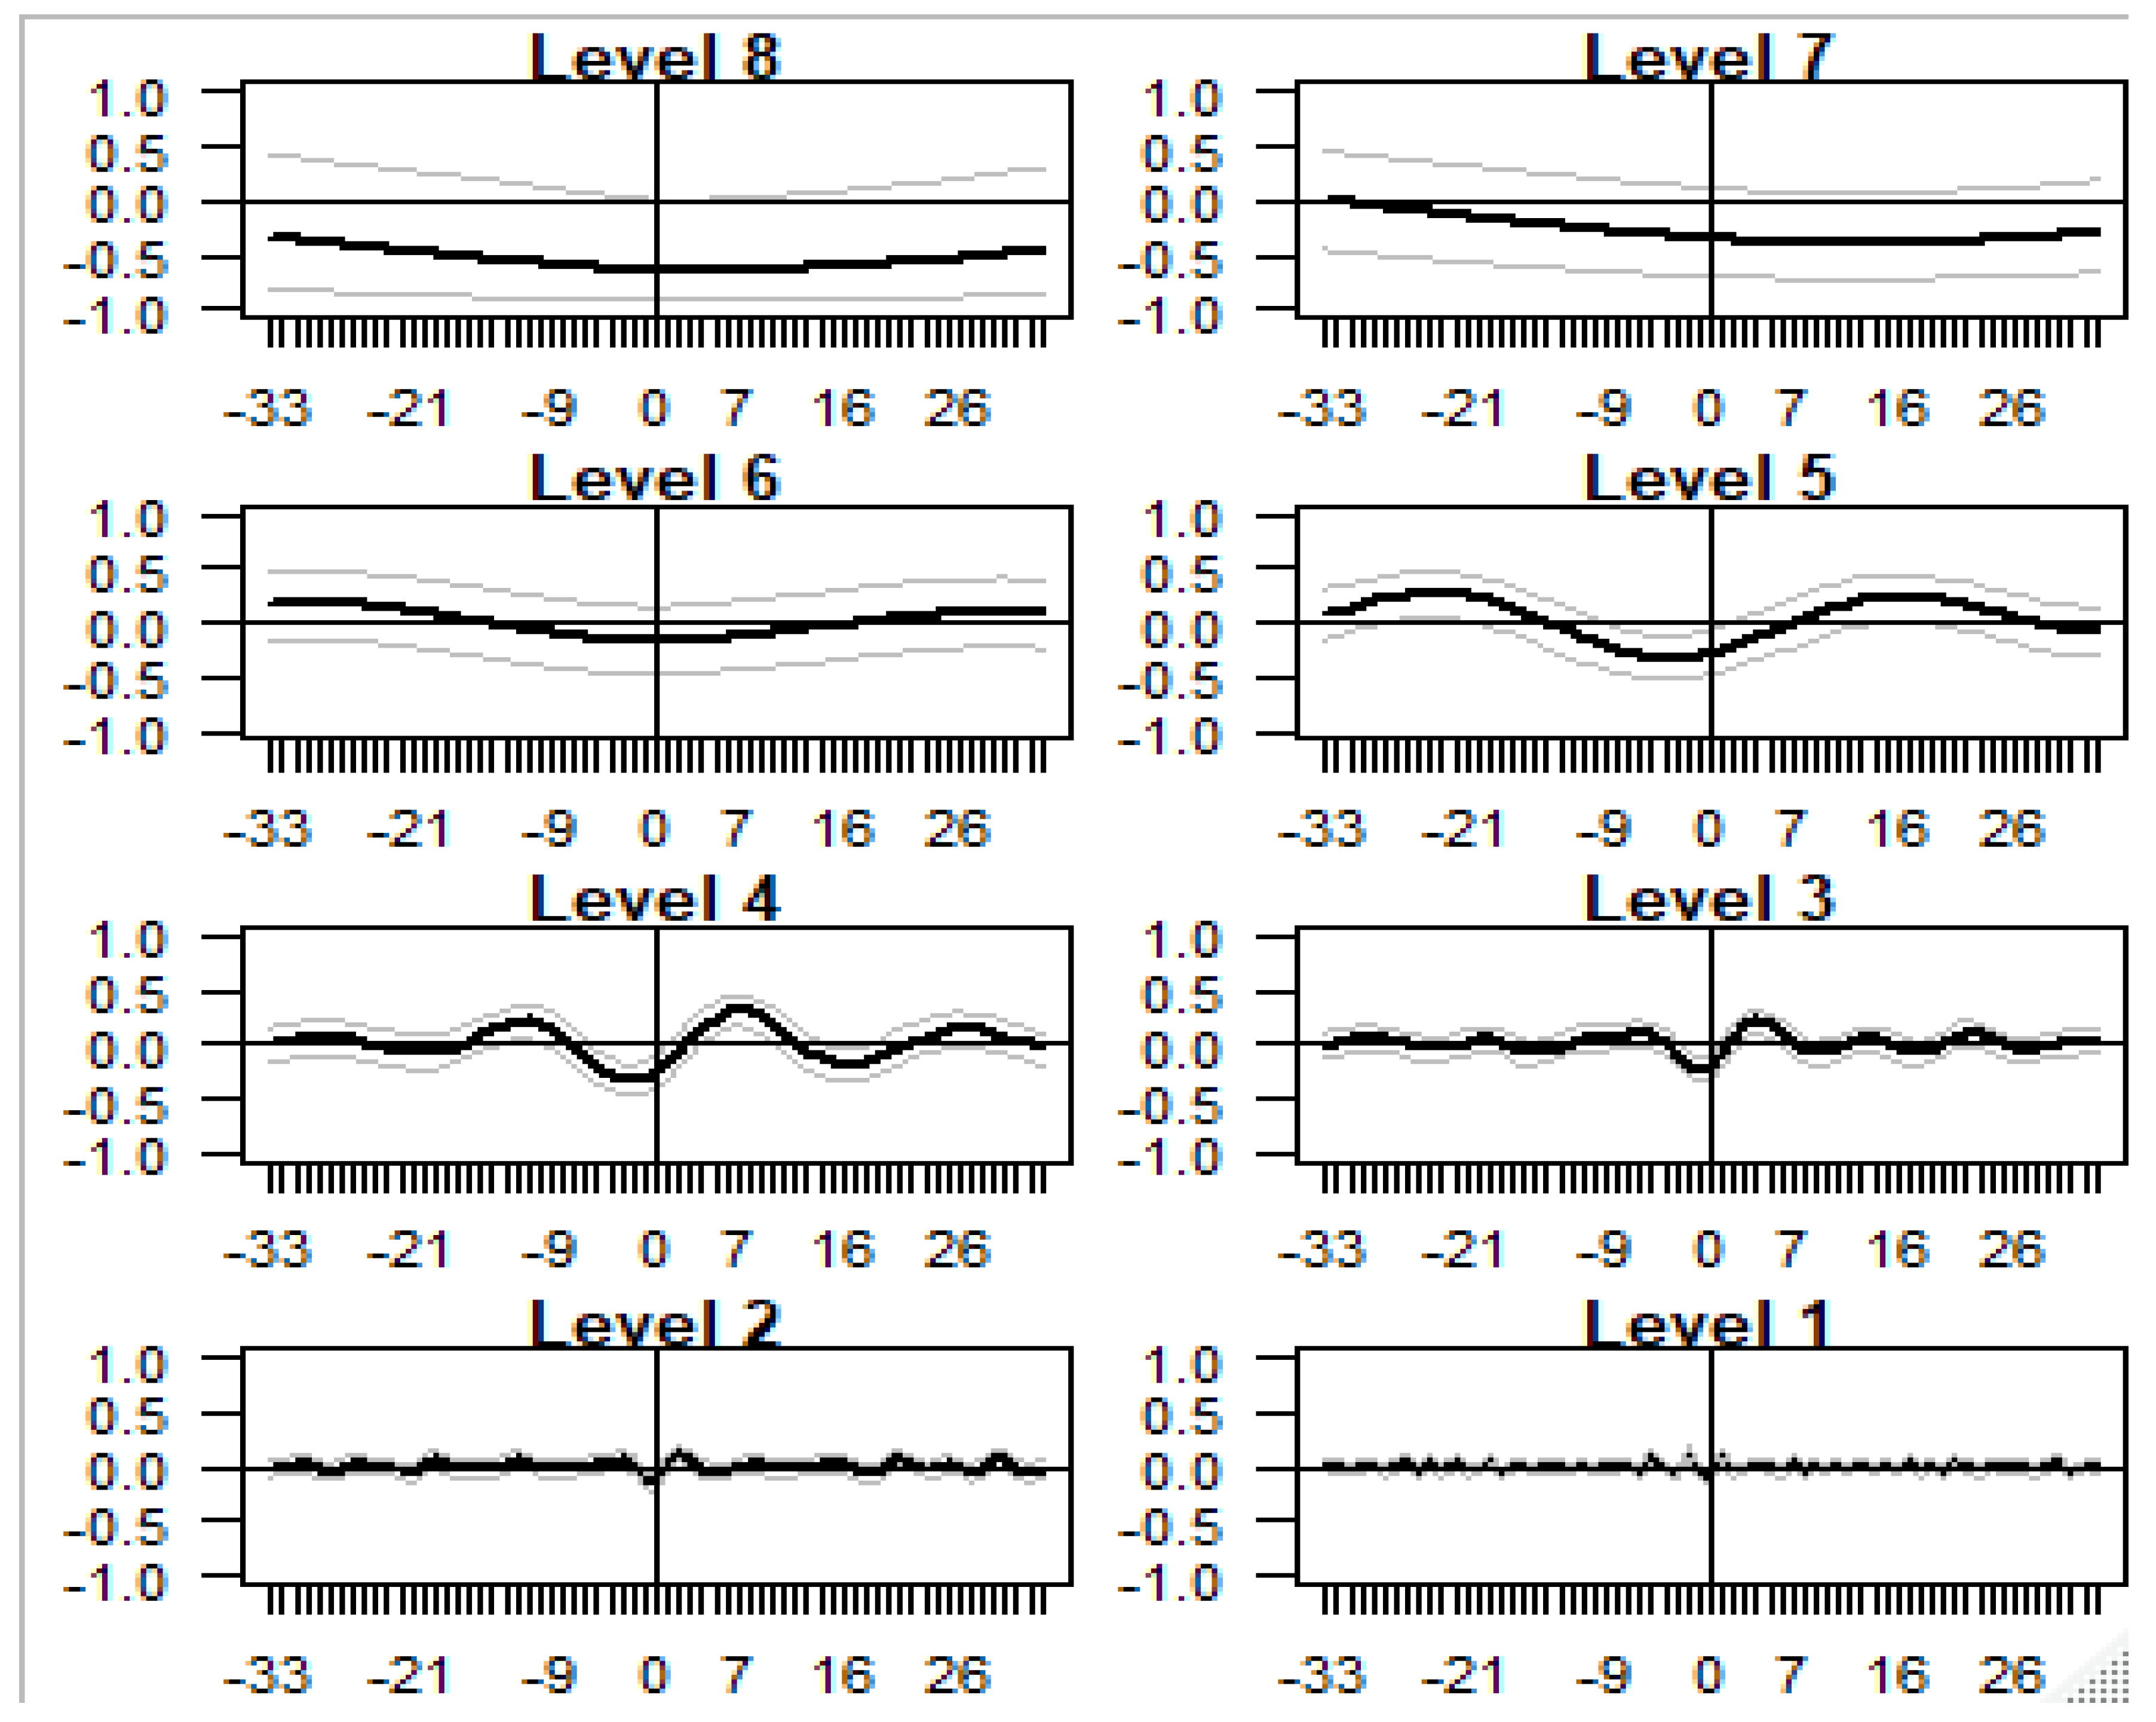
The study also examined pairwise cross-correlations between the DAX and individual BRICS markets indices at all periods with the corresponding approximate confidence interval against lead time and lags for the different wavelet scales to 33 days. The results showed that that at the shortest scales, i.e. scales 1 to 4, the cross-correlations around the time shift of π = 9 and π = – 9 are significant and positive. It can also be seen that at the short scale the graphs are slightly skewed to the right, indicating that the DAX leads individual BRICS indices.
The coarse scales — particularly scales 5 and 6 — achieve the highest correlation at the time shift of π = 21 and π = – 21 (with the Chinese stock market being an exception). It should also be noted that in most instance, scales 5 and 6 have symmetrical distributions; hence, the study could not identify any lead/lag relationship. For pairwise stock indices scale 7, the graph displays a significant negative wavelet cross-correlation on the right-hand side, which implies that the individual BRICS market leads the Eurozone market. As for scale 8 there is no clear evidence of a lead-lag relationship. Finally, the contemporaneous time scale correlation between the series indicates that the values of the wavelet correlation coefficients at lag 0 have an anti-correlation relationship.
Figure 2 and
Figure 3 depict the cross-correlations between the return series DAX index and two individual BRICS indices: the BOVESPA index of Brazil and the SEE index of China. Illustrations for other BRICS indices can be provided upon request from the authors.
Figure 4,
Figure 5,
Figure 6,
Figure 7 and
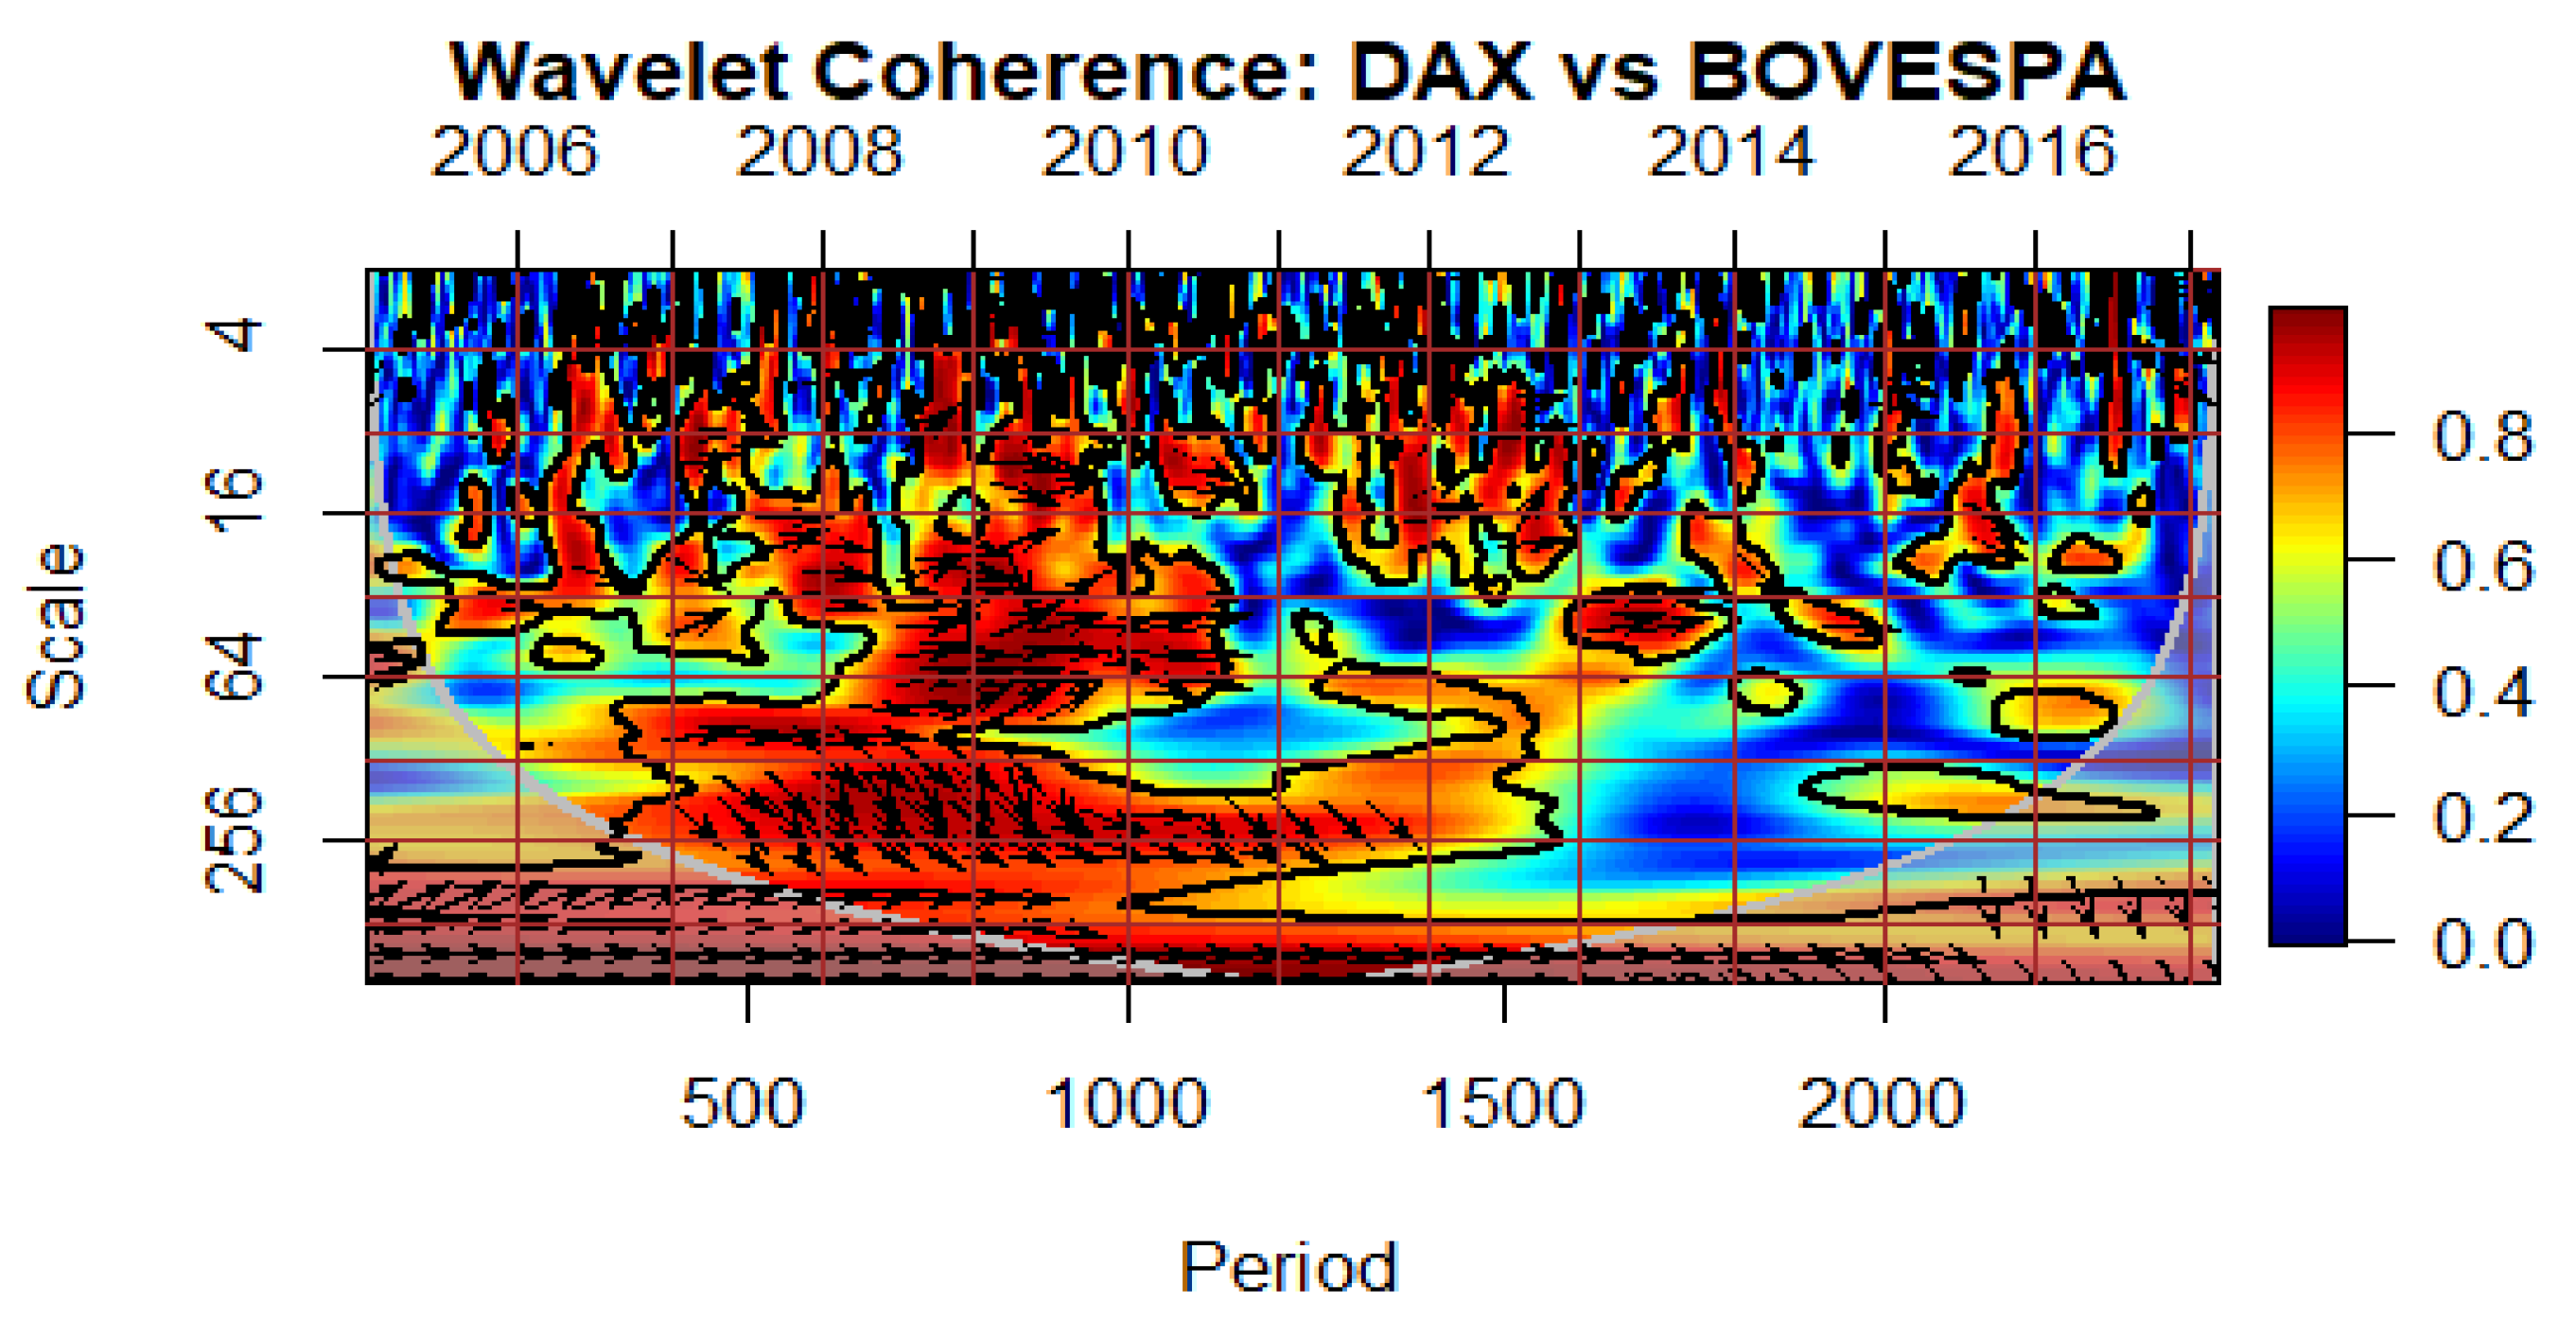
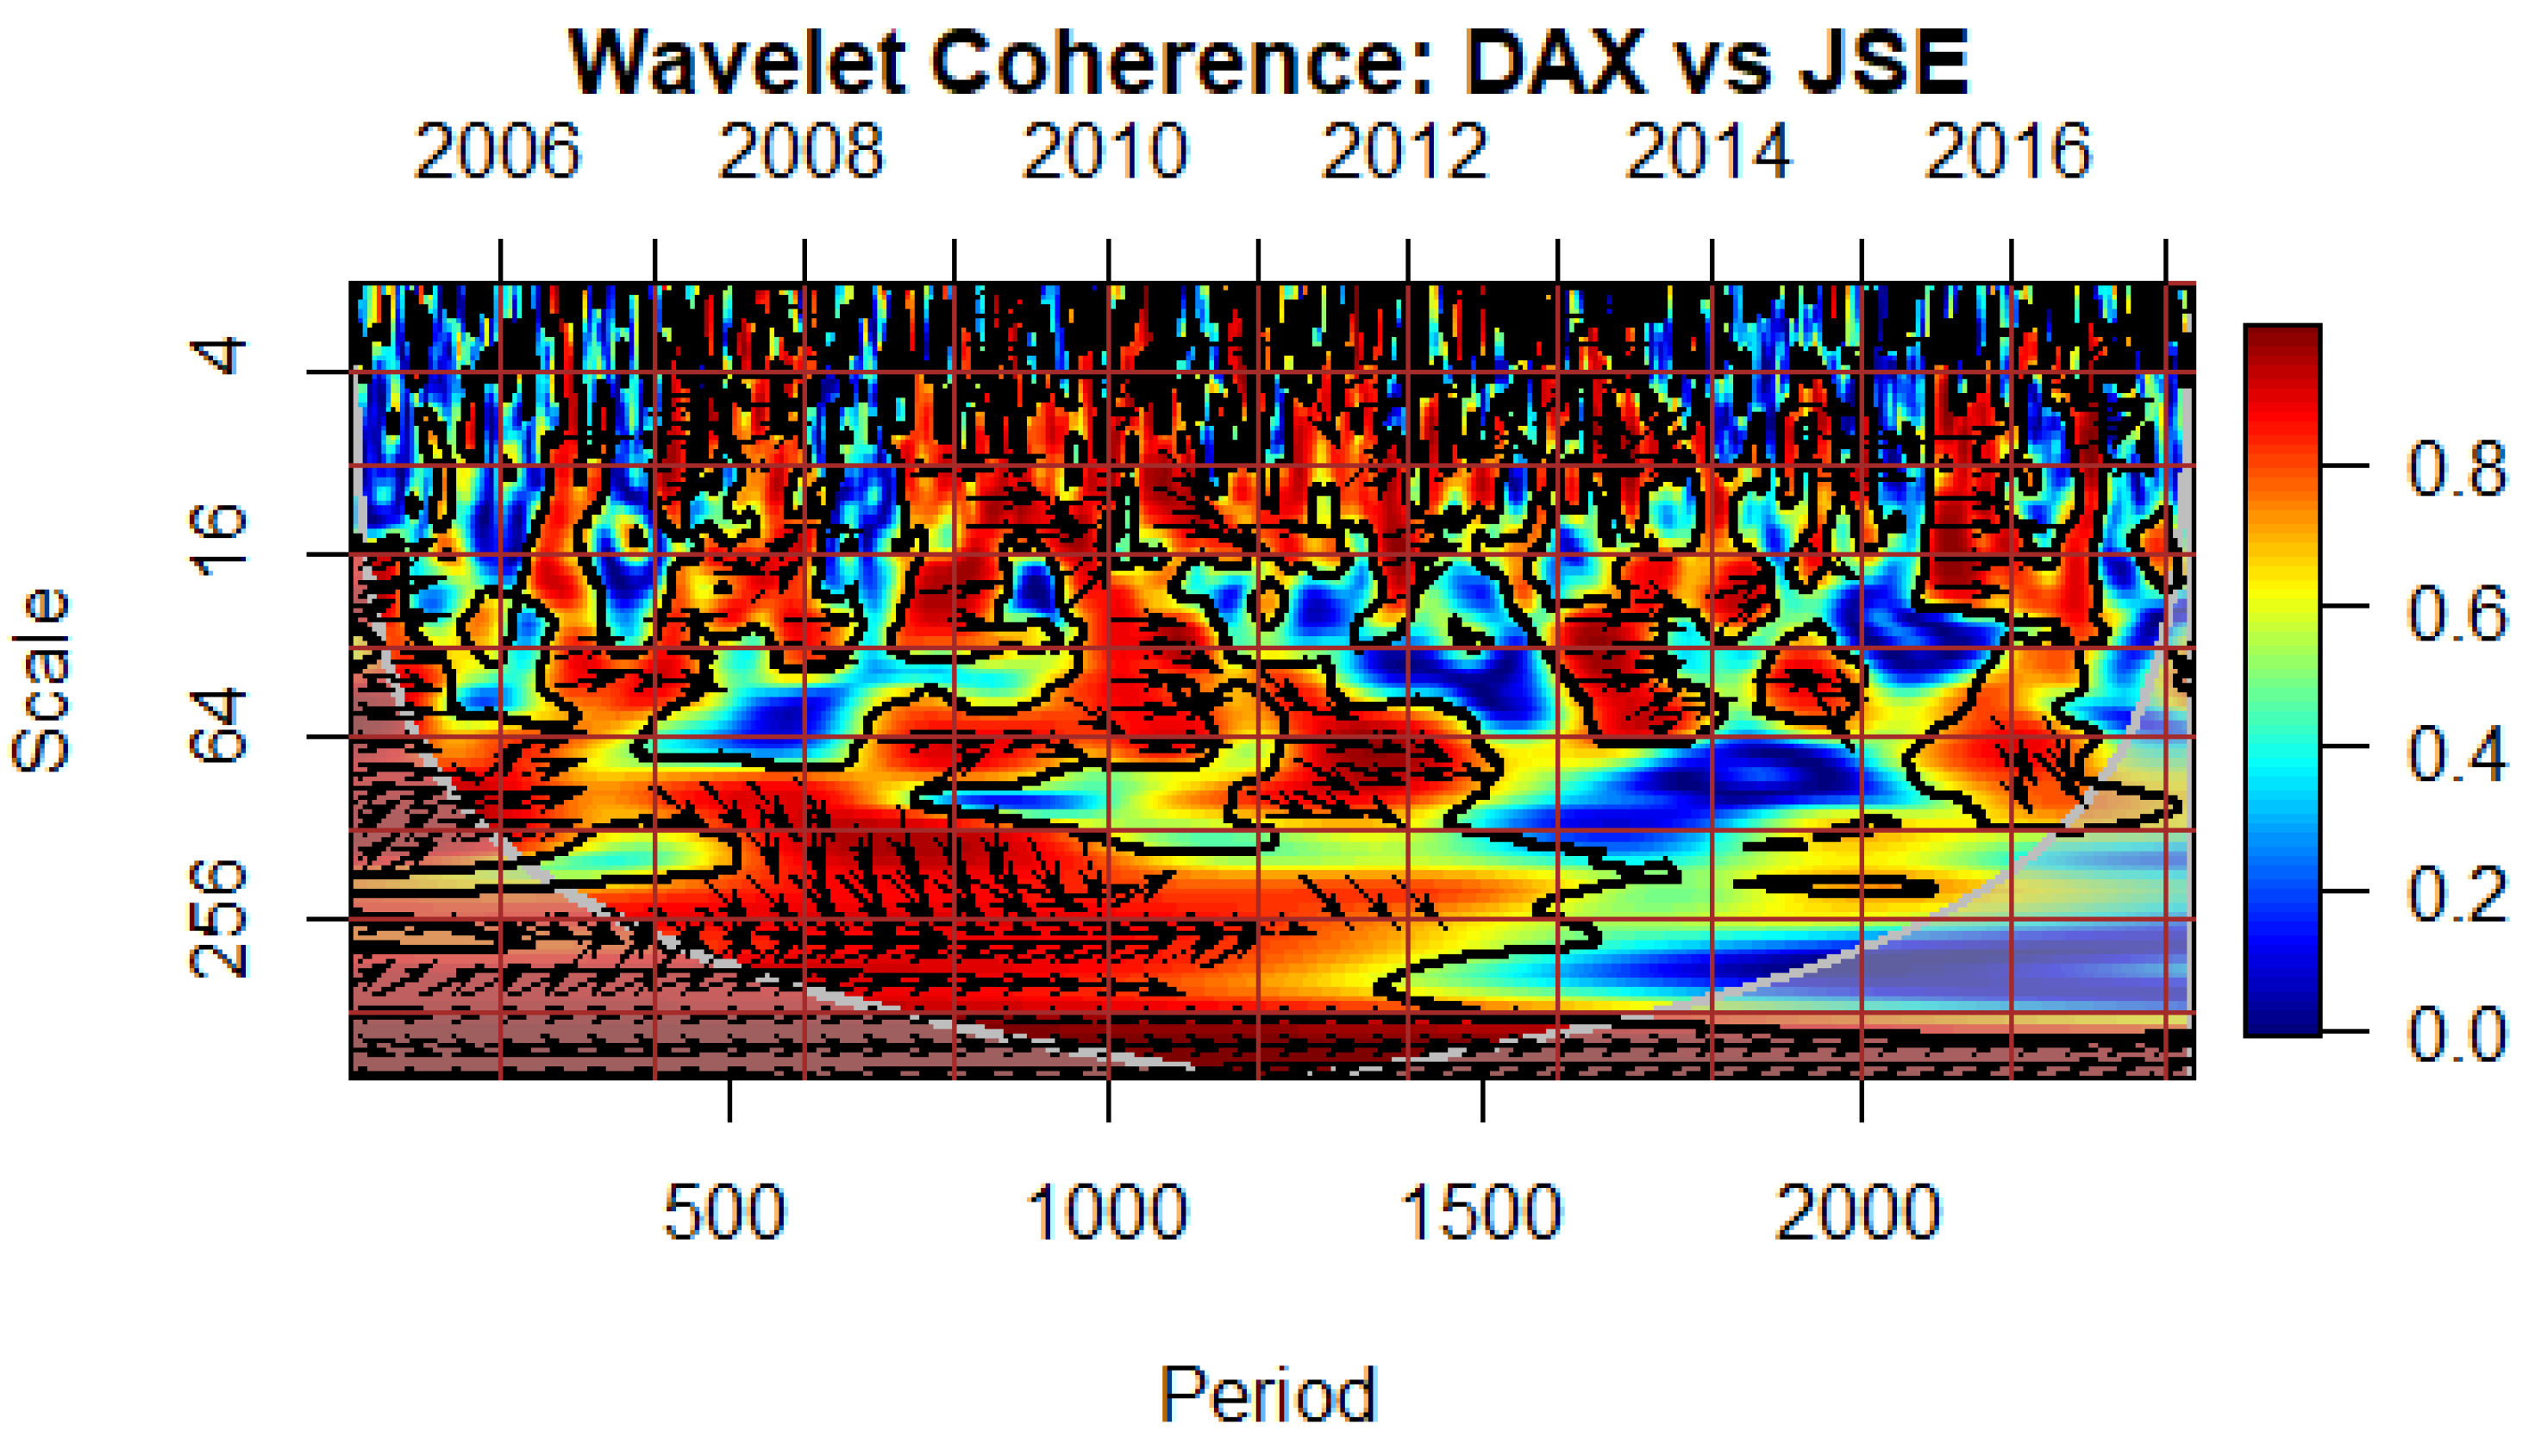
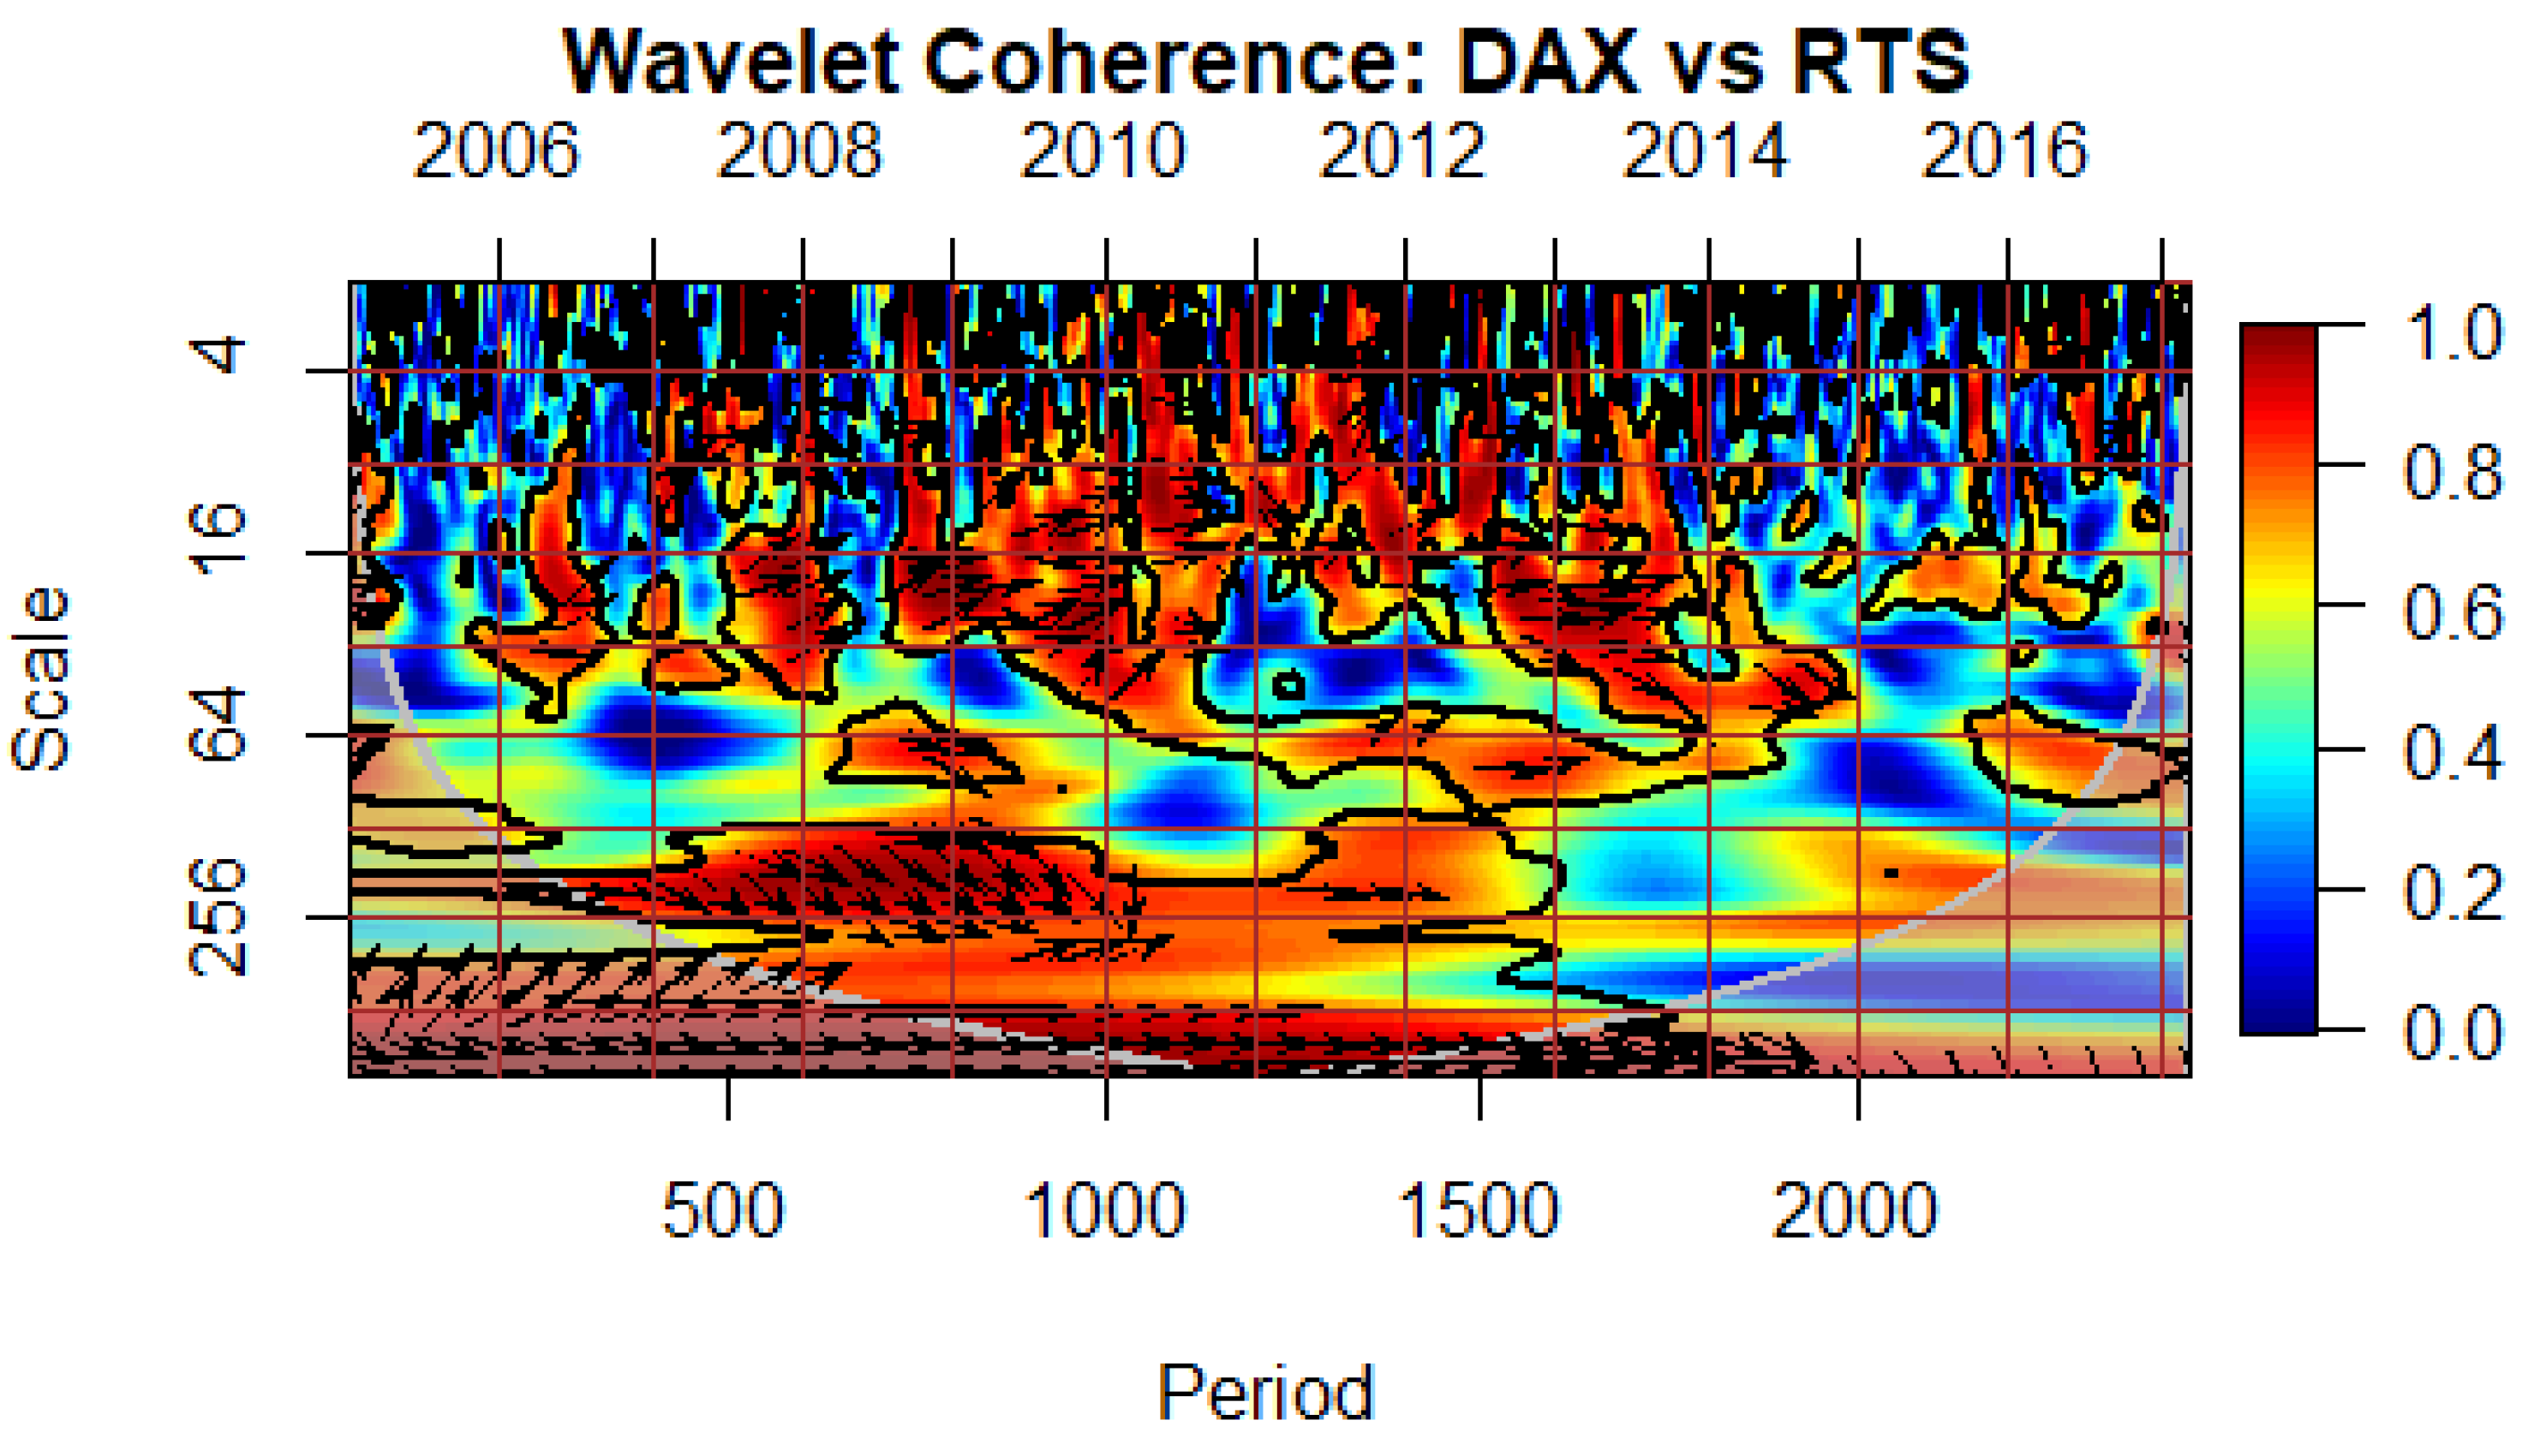
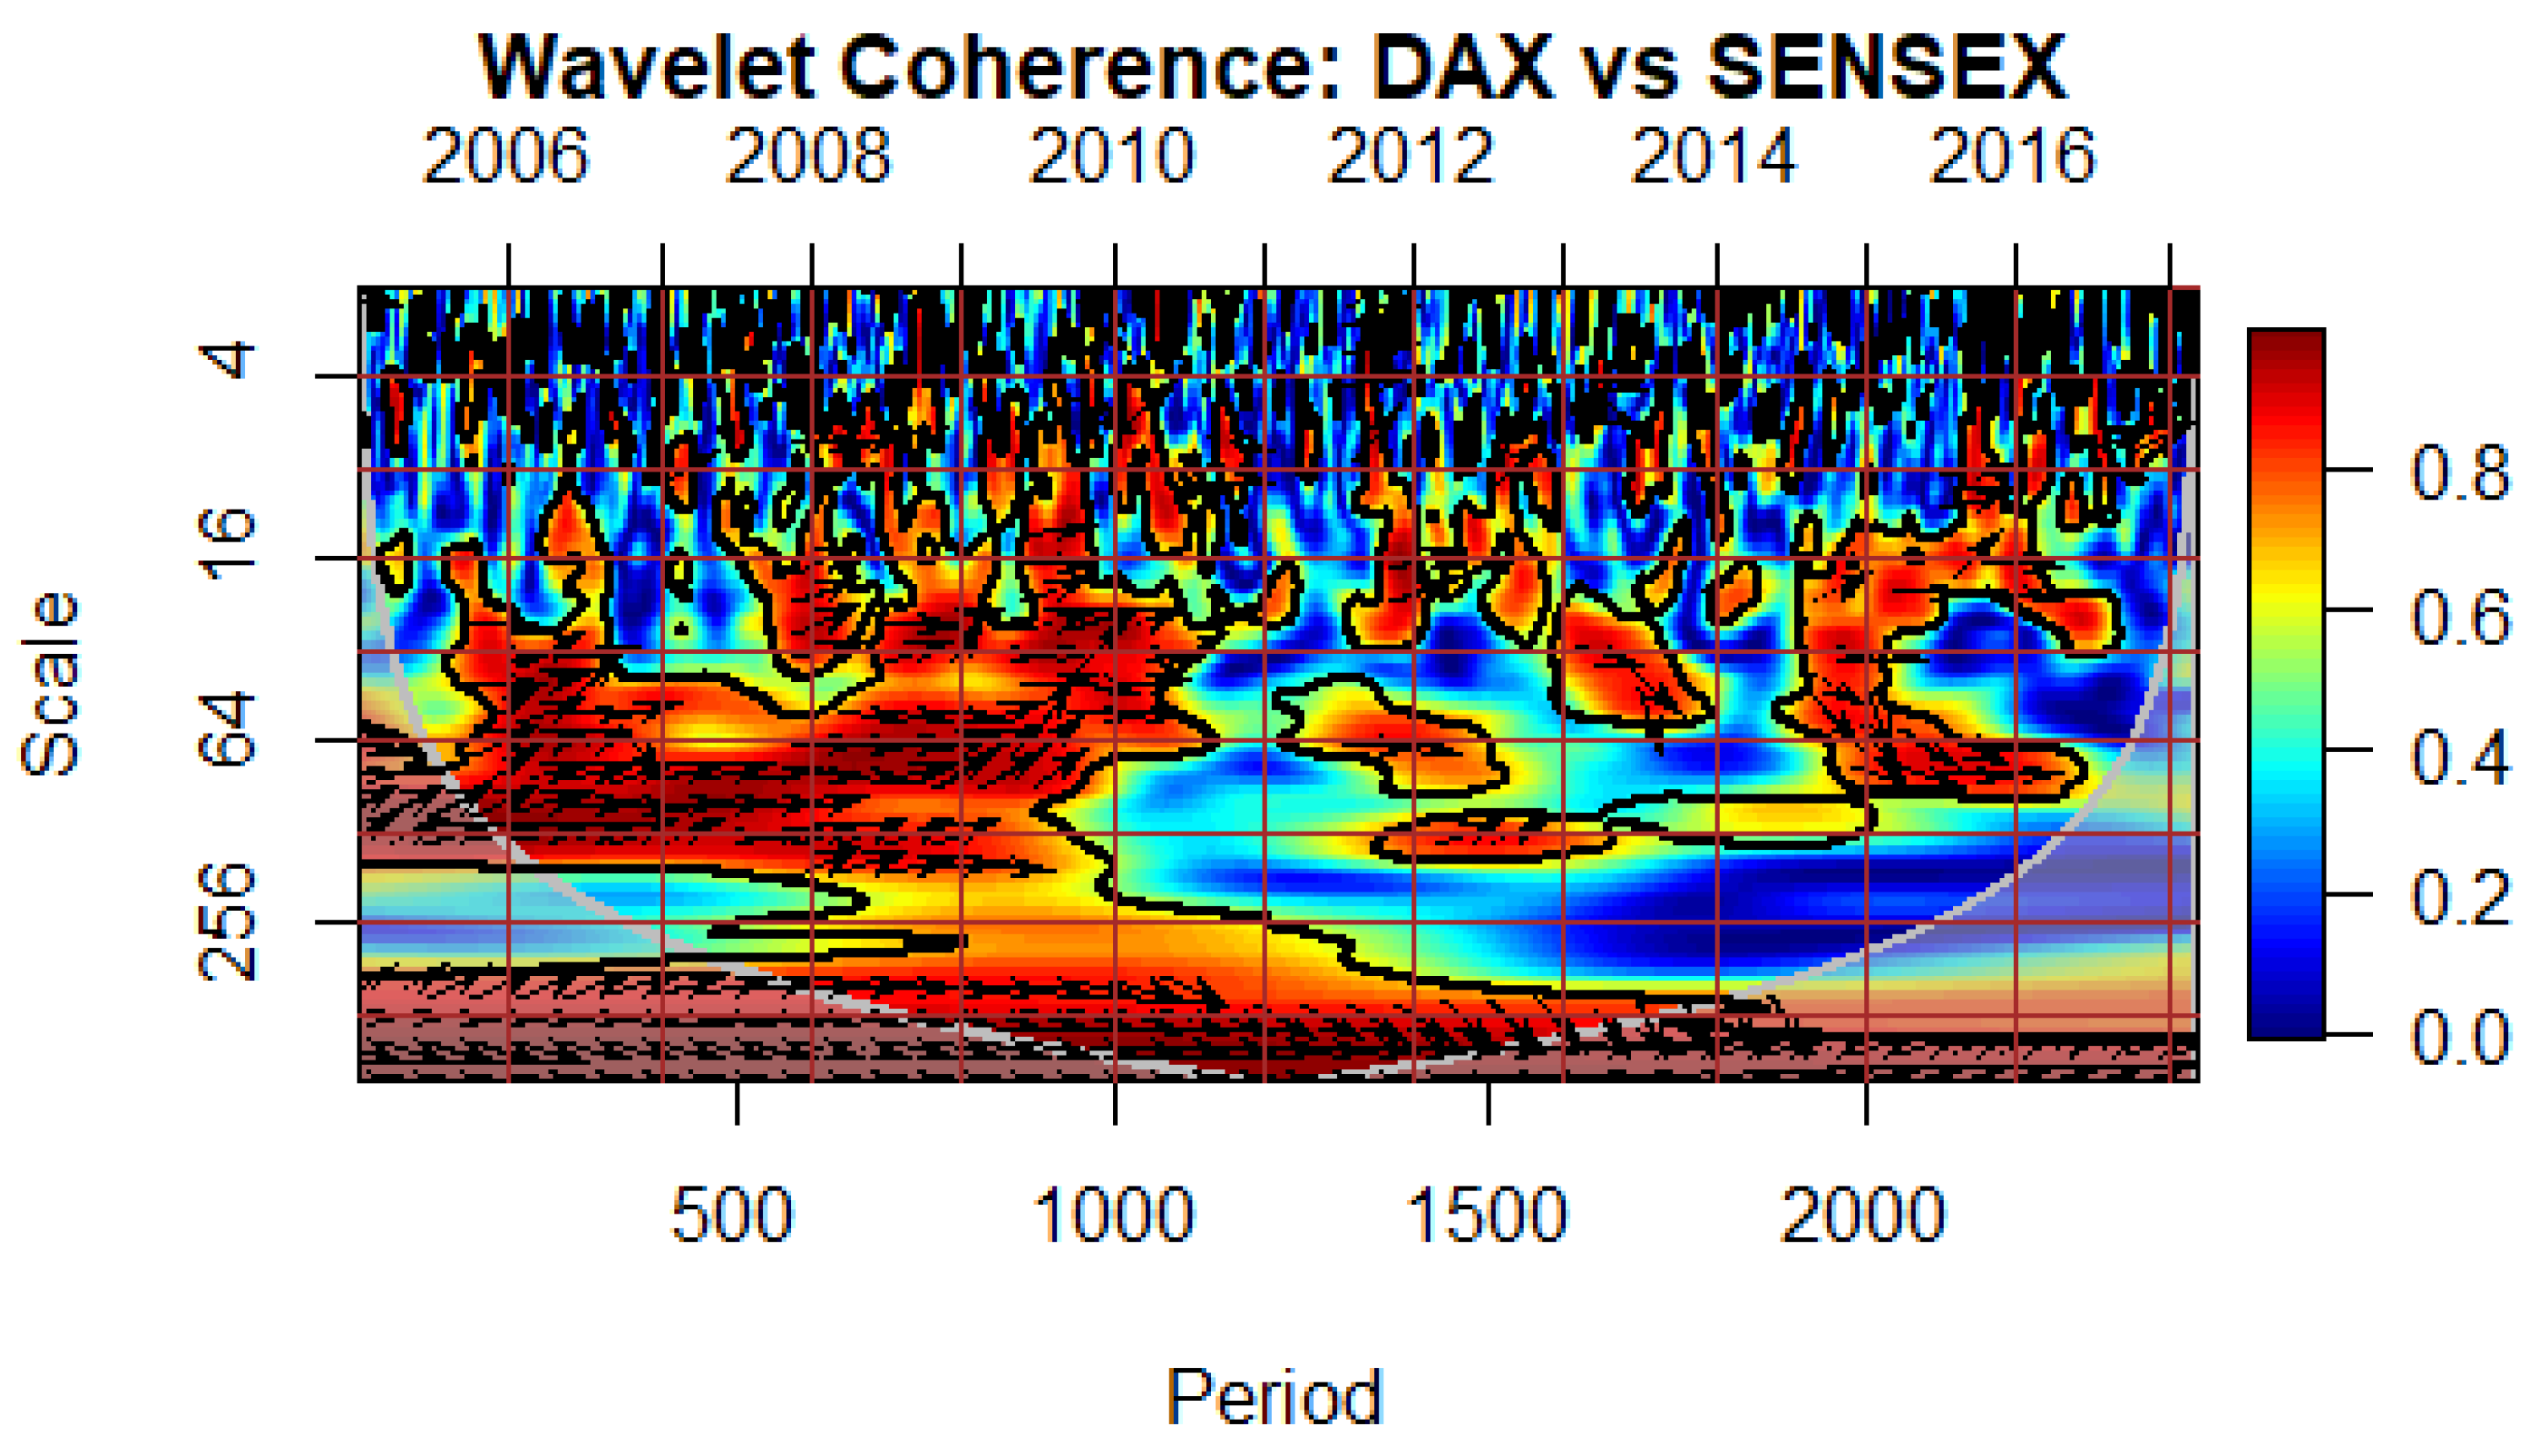
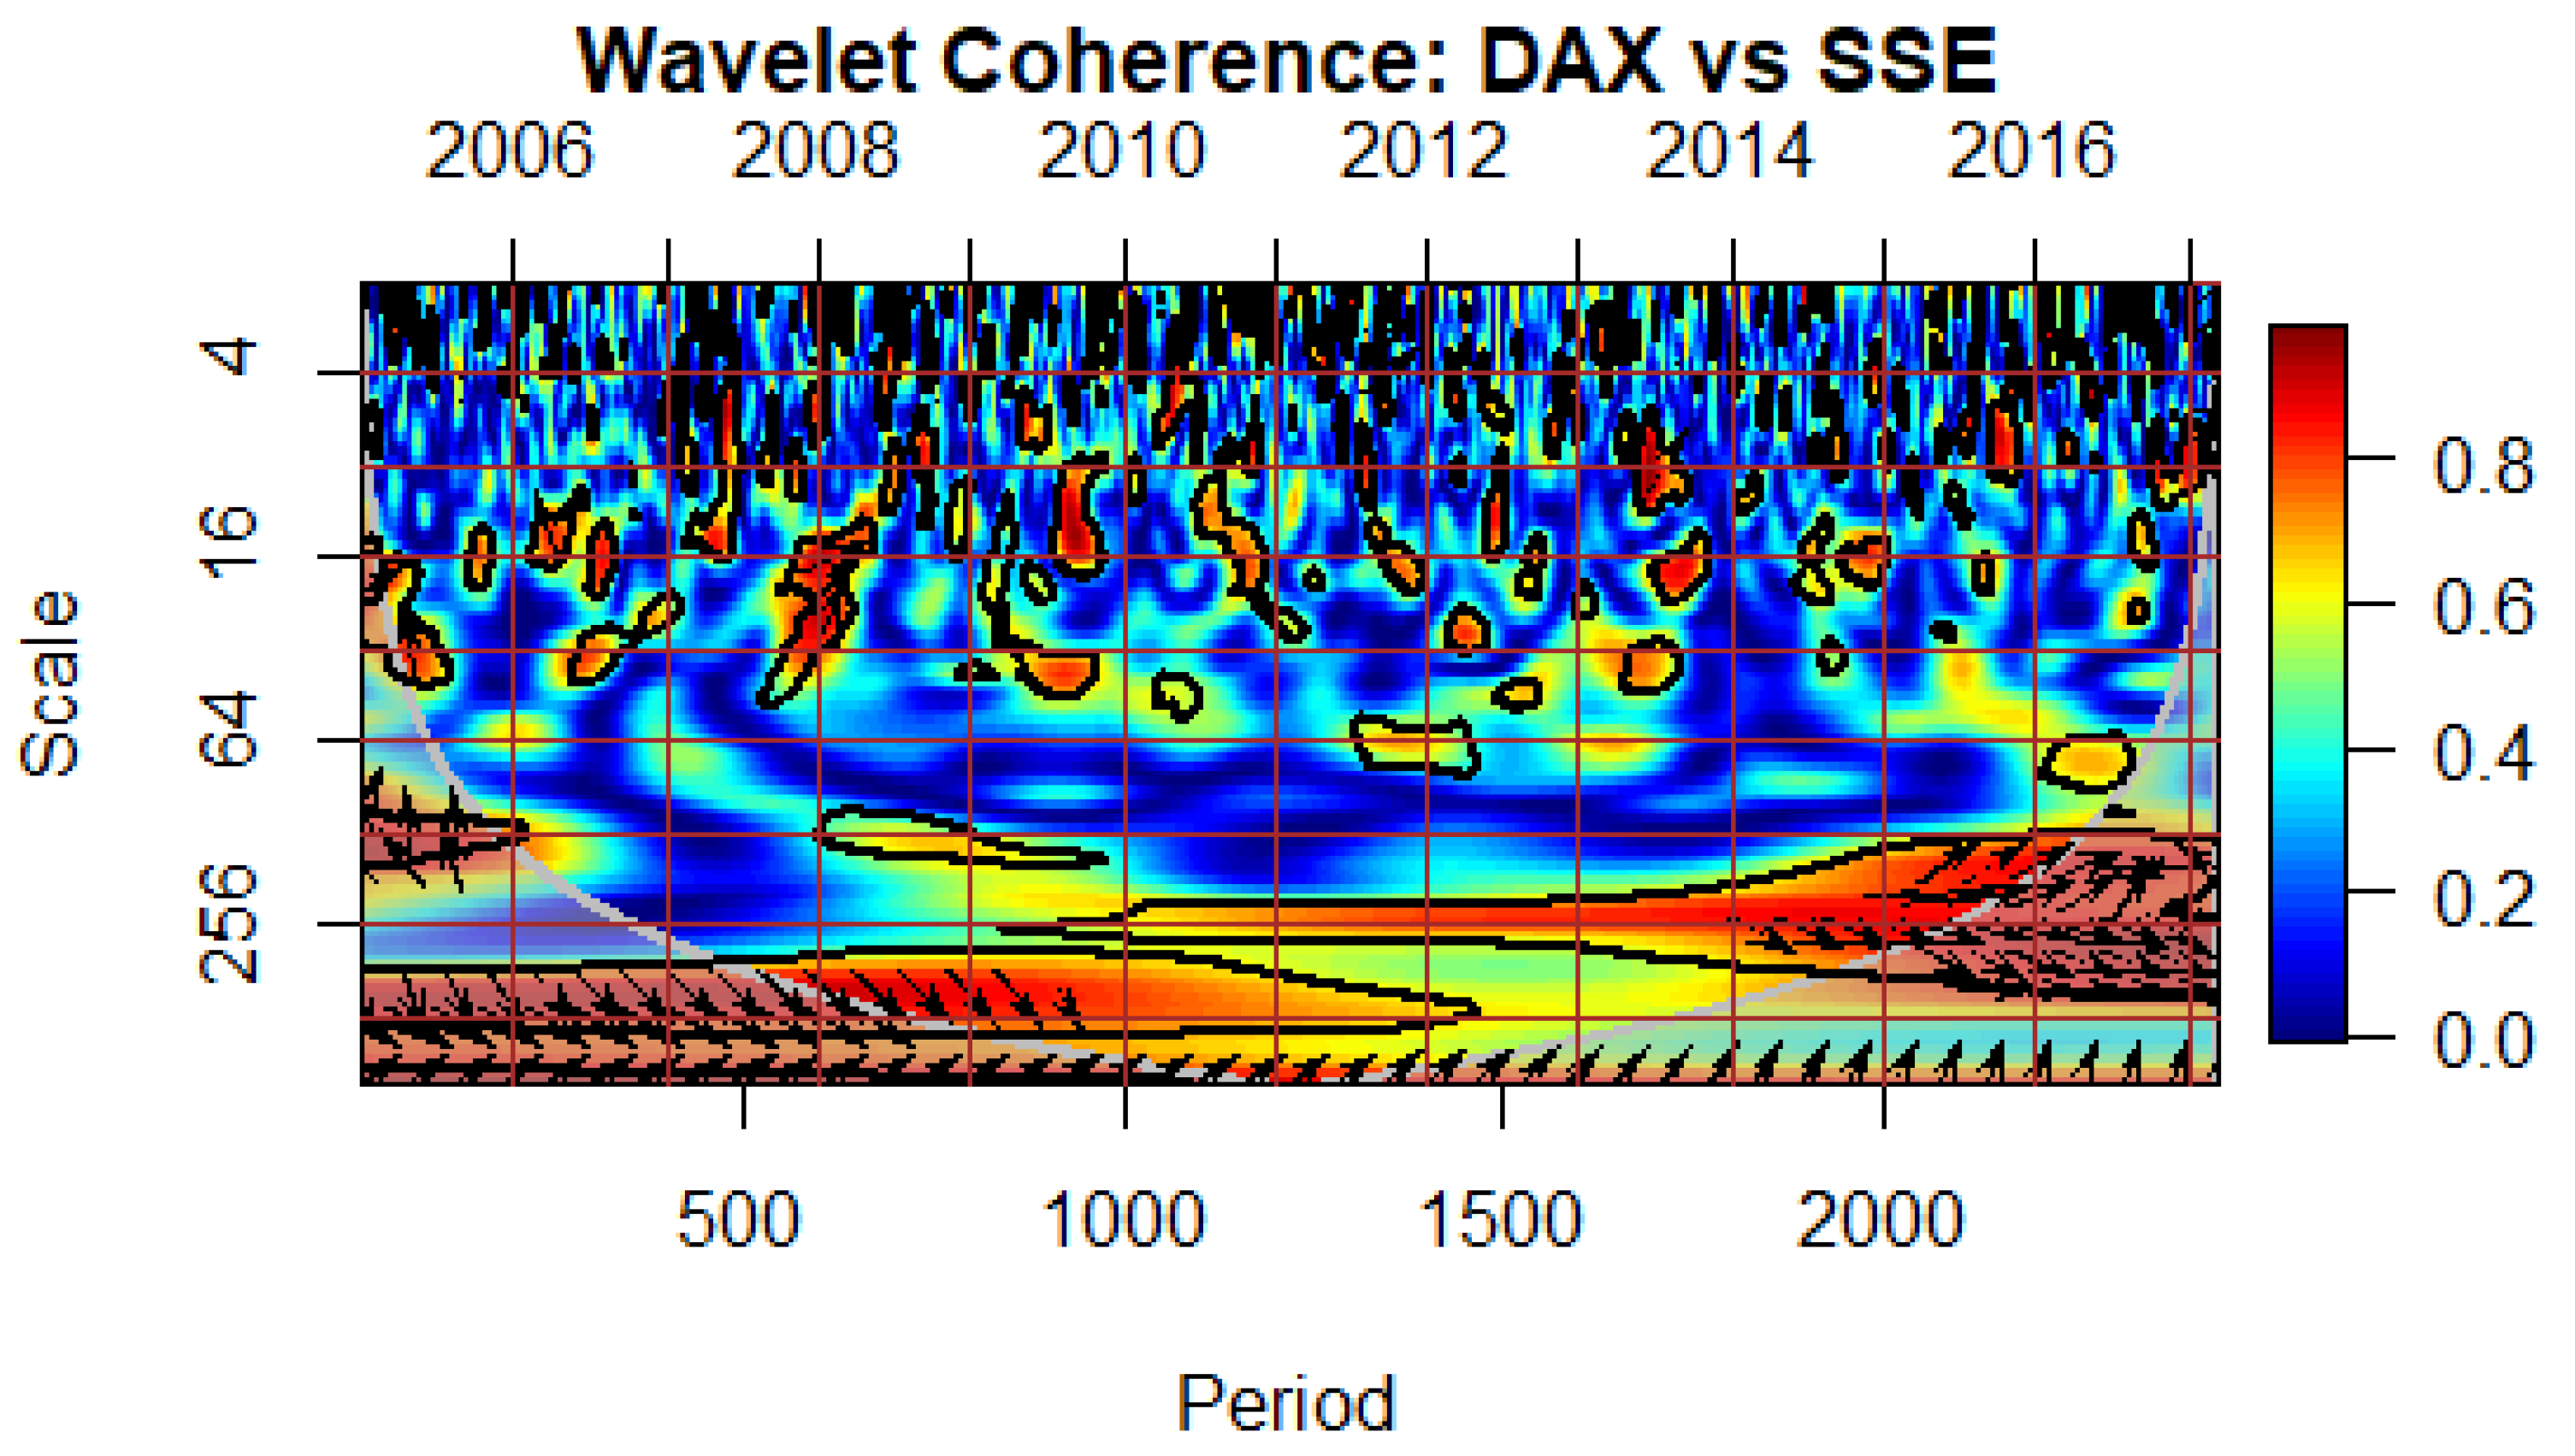
Figure 8 present the estimated wavelet cross-coherence contour plots from the index -pairs of the DAX and individual BRICS equity markets. It can be seen that the Eurozone ‘crisis’ period (between July 2009 and December 2012), is characterised by warmer colours in most of the BRICS stock markets, China being the exception. High correlation in lower scales (short- time horizon) indicates the presence of contagion. One should also note that during these periods, especially in the medium-term horizon, the arrows mainly point South-East, indicating a positive correlation with DAX leading.
It is also worth noting that during the ‘crisis’ period the direction of the arrows points South-East, indicating a positive correlation, with the DAX leading the JSE and the RTS (
Figure 5 and
Figure 6 respectively). In the case of South Africa and Russia, the high correlation in the short-term horizon, which suggests the presence of pure contagion, can be explained by the fact that Eurozone countries have consistently remained significant trading partners for those two countries throughout the study.
As for the contour plots for the pairwise relationships between the index-pairs of DAX with BOVESPA, DAX with SENSEX and DAX with SSE, they display relatively low correlation in the short term-horizon (
Figure 4,
Figure 7 and
Figure 8 respectively). The only significant correlation is recorded in the long-term horizon during the EZDC. The high correlation in the long-term horizon is indicative of co-movement due to fundamentals. Consequently, the current study could not find evidence of pure contagion in these three countries following during the EZDC. Based on our results, it appears that investors in Brazil, China and India have possibly gained advantages from diversifying their portfolios during the EZDC, considering the limited impact of financial contagion from the Eurozone on these markets. These findings contradict Ahmad, Sehgal and Bhanumurthy (2013), who found that Brazil, India and China were also adversely hit by the contagion shock during the EZDC.
5. Conclusion
The present study used the wavelet analysis to examine multiscale interdependence of BRICS equity markets, vis à vis the Eurozone countries as source countries in the aftermath of the EZDC. The wavelet cross-correlation analysis showed evidence of co-movement and volatility spillover in the short scales with the DAX leading the BRICS market indices. For coarse scale, a significant negative wavelet cross-correlation was identified on the right-hand side with implications that the individual BRICS market leads the Eurozone market.
Wavelet coherence results also showed evidence of high correlation at a lower scale between the Eurozone stock market and individual stock markets of South Africa, and Russia. Indicating the presence of financial contagion. For the Brazilian, Indian and Chinese stock markets, no correlation was identified in the short scale period; hence the conclusion that no financial contagion took place in the Brazilian, Indian and Chinese equity markets following the EZDC. During the European sovereign debt crisis, portfolio diversification could have benefited investors in Brazil, China, and India, given the minimal impact of Eurozone financial contagion on these markets.
6. Policy Implications and Recommendations
The literature indicates that the vulnerability of emerging markets to contagion hinges on their degree of financial integration, the robustness of their institutional frameworks, and the nature of the triggering shock. Channels such as exchange rate depreciation and the financial sector play significant roles in the spread of contagion. Policy interventions can offer some relief, yet their efficacy may vary depending on the specific circumstances of each case.
As the study did not detect financial contagion in the Brazilian, Chinese, and Indian stock markets arising from the Eurozone, policymakers should focus on addressing idiosyncratic shock channels when responding to volatility spillover. Lastly, during the European sovereign debt crisis, portfolio diversification could have proved advantageous for investors in Brazil, China, and India, considering the limited impact of Eurozone financial contagion on these markets.
References
- Abramovich, F., Sapatinas, T., & Silverman, B. W. (1998). Wavelet thresholding via a Bayesian approach. Journal of the Royal Statistical Society: Series B (Statistical Methodology), 60(4), 725-749.
- Adrian, T.; Natalucci, F.M.; Qureshi, M.S. Macro-Financial Stability in the COVID-19 Crisis: Some Reflections. Annu. Rev. Financial Econ. 2023, 15, 29–54. [Google Scholar] [CrossRef]
- Ahmad, W.; Sehgal, S.; Bhanumurthy, N. Eurozone crisis and BRIICKS stock markets: Contagion or market interdependence? Econ. Model. 2013, 33, 209–225. [Google Scholar] [CrossRef]
- Ahnert, T.; Bertsch, C. A Wake-Up Call Theory of Contagion. Rev. Finance 2022, 26, 829–854. [Google Scholar] [CrossRef]
- Akhtaruzzaman, M., Boubaker, S., & Sensoy, A. (2021). Financial contagion during COVID–19 crisis. Finance Research Letters, 38, 101604.
- Alqaralleh, H.; Canepa, A. Evidence of Stock Market Contagion during the COVID-19 Pandemic: A Wavelet-Copula-GARCH Approach. J. Risk Financial Manag. 2021, 14, 329. [Google Scholar] [CrossRef]
- Banerjee, A.K. Futures market and the contagion effect of COVID-19 syndrome. Finance Res. Lett. 2021, 43, 102018. [Google Scholar] [CrossRef] [PubMed]
- Bansal, T. (2020). Behavioral finance and COVID-19: Cognitive errors that determine the financial future. Available at SSRN 3595749.
- Batondo, M.; Uwilingiye, J. Comovement across BRICS and the US Stock Markets: A Multitime Scale Wavelet Analysis. Int. J. Financial Stud. 2022, 10, 27. [Google Scholar] [CrossRef]
- Bhar, R.; Nikolova, B. Return, volatility spillovers and dynamic correlation in the BRIC equity markets: An analysis using a bivariate EGARCH framework. Glob. Finance J. 2009, 19, 203–218. [Google Scholar] [CrossRef]
- Cheung, L., Tam, C.S. and Szeto, J., 2009. Contagion of financial crises: A literature review of theoretical and empirical frameworks. Hong Kong Monetary Authority Research Paper, 2.
- Claessens, S. and Forbes, K. eds., 2013. International financial contagion. Springer Science & Business Media.
- Fernández-Macho, J. Wavelet multiple correlation and cross-correlation: A multiscale analysis of Eurozone stock markets. Phys. A: Stat. Mech. its Appl. 2011, 391, 1097–1104. [Google Scholar] [CrossRef]
- Forbes, K.; Rigobon, R. Measuring Contagion: Conceptual and Empirical Issues. In International Financial Contagion; Springer: Boston, MA, USA, 2001; pp. 43–66. [Google Scholar]
- Fröhlich, S. (2021). The Future of the Global Economy and the Euro Area. The End of Self-bondage: German Foreign Policy in a World Without Leadership, 21-45.
- Frýd, L. (2020). Volatility and Skewness Spillover Effects: Multiresolution Analysis. (Unpublished Masters dissertation, Durban: University of Charles University).
- Giordano, R., Pericoli, M., & Tommasino, P. (2013). Pure or wake-up-call contagion? Another look at the EMU sovereign debt crisis. International Finance, 16(2), 131-160.
- Benson, J.N.; Goldstein, M.; Noland, M.; Liu, L.-G.; Robinson, S.; Wang, Z.; Posen, A. The Asian Financial Crisis: Causes, Cures, and Systemic Implications. Can. Public Policy 2000, 26, 502. [Google Scholar] [CrossRef]
- Graps, A. (1995). An introduction to wavelets. IEEE computational science and engineering, 2(2), 50-61.
- Gunay, S.; Can, G. The source of financial contagion and spillovers: An evaluation of the covid-19 pandemic and the global financial crisis. PLOS ONE 2022, 17, e0261835. [Google Scholar] [CrossRef] [PubMed]
- Gurdgiev, C.; O’riordan, C. A Wavelet Perspective of Crisis Contagion between Advanced Economies and the BRIC Markets. J. Risk Financial Manag. 2021, 14, 503. [Google Scholar] [CrossRef]
- Hashim, K. K., & Masih, A. (2015). Stock market volatility and exchange rates: MGARCH-DCC and wavelet approaches. University Library of Munich, Germany.
- Hemche, O.; Jawadi, F.; Maliki, S.B.; Cheffou, A.I. On the study of contagion in the context of the subprime crisis: A dynamic conditional correlation–multivariate GARCH approach. Econ. Model. 2016, 52, 292–299. [Google Scholar] [CrossRef]
- Herman, A., & Klemm, A. (2019). Financial deepening in Mexico. Journal of Banking and Financial Economics, (1 (11), 5-18.
- In, F. & Kim, S., (2013). An introduction to wavelet theory in finance: A wavelet multiscale approach. London: World Scientific.
- Irwin, N. (2018). The Economy Faces Big Risks in 2019. Markets Are Only Now Facing Up to Them. The New York Times. https://www.nytimes.com/2018/12/07/upshot/the-economy-faces-big-risks-in-2019-markets-are-only-now-facing-up-to-them.
- Kaminsky, G. L., & Reinhart, C. M. (2000). On crises, contagion, and confusion. Journal of international Economics, 51(1), 145-168.
- Kannadbasan, M.; Das, D. HAS CO-MOVEMENT DYNAMICS IN BRAZIL, RUSSIA, INDIA, CHINA AND SOUTH AFRICA (BRICS) MARKETS CHANGED AFTER GLOBAL FINANCIAL CRISIS? NEW EVIDENCE FROM WAVELET ANALYSIS. Asian Acad. Manag. J. Account. Finance 2019, 15, 1–26. [Google Scholar] [CrossRef]
- Kenourgios, D.; Dimitriou, D. Contagion of the Global Financial Crisis and the real economy: A regional analysis. Econ. Model. 2015, 44, 283–293. [Google Scholar] [CrossRef]
- Kenourgios, D.; Dimitriou, D. Contagion of the Global Financial Crisis and the real economy: A regional analysis. Econ. Model. 2015, 44, 283–293. [Google Scholar] [CrossRef]
- Krampen (2023). Using Economic Indicators in Analysing Financial Markets. Emerald Group Publishing, Financial Economics, 1(11), 5-18.
- Lam, M.C.-H. Herd behaviour and interest rate defence. J. Policy Model. 2002, 24, 181–193. [Google Scholar] [CrossRef]
- Liow, K. H., Zhou, X., Li, Q., & Huang, Y. (2019). Time–scale relationship between securitized real estate and local stock markets: Some wavelet evidence. Journal of Risk and Financial Management, 12(1), 16.
- Nguyen, T. N., Phan, T. K. H., & Nguyen, T. L. (2022). Financial contagion during global financial crisis and covid–19 pandemic: The evidence from DCC–GARCH model. Cogent Economics & Finance, 10(1), 2051824.
- Percival, D. B. & Walden, A. T. (2006). Wavelet methods for time series analysis (Vol. 4). Cambridge University Press. London.
- Percival, D. P. (1995). On estimation of the wavelet variance. Biometrika, 83(2), 619-631.
- Ranta, M., 2010. Wavelet multiresolution analysis of financial time series. (Unpublished Doctoral dissertation, Vaasa: University of Vaasa).
- Rigobon, R. (2002). International financial contagion: Theory and evidence in evolution. Charlottesville, VA: Research Foundation of AIMR.
- Saiti, B.; Bacha, O.I.; Masih, M. Testing the Conventional and Islamic Financial Market Contagion: Evidence from Wavelet Analysis. Emerg. Mark. Finance Trade 2015, 52, 1832–1849. [Google Scholar] [CrossRef]
- Sehgal, S., Mittal, A., & Mittal, A. (2019). Dynamic linkages between BRICS and other emerging equity markets. Theoretical Economics Letters, 9(07), 2636.
- Torrence, C., & Compo, G. P. (1998). A practical guide to wavelet analysis. Bulletin of the American Meteorological society, 79(1), 61-78.
- Vasileiou, E. Efficient Markets Hypothesis in the time of COVID-19. Rev. Econ. Anal. 2021, 13, 45–63. [Google Scholar] [CrossRef]
- World Bank. (2013). Definitions of contagion. Washington, DC: World Bank Publications.
| 1 |
We posit that the unprecedented nature of the COVID-19 pandemic and its economic fallout led to widespread risk aversion, causing investors to pull out of various markets regardless of their direct exposure to COVID-19. However, we do not consider the financial contagion that ensued to fall under the purview of this analysis, as it was primarily driven by an exogenous systemic shock rather than endogenous linkages between financial markets. Disentangling the contagion effects from the broader pandemic impacts is outside the scope of this study, which aims to isolate episodes of contagion related specifically to crises originating within the financial system itself. |
Figure 1.
Correlation of DAX with BOVESPA (panel A) and SSE (panel B) at different time scales.
Figure 1.
Correlation of DAX with BOVESPA (panel A) and SSE (panel B) at different time scales.
Figure 2.
Cross-correlation Between the Return Series of DAX and BOVESPA.
Figure 2.
Cross-correlation Between the Return Series of DAX and BOVESPA.
Figure 3.
Cross-correlation Between the Return Series of DAX and SSE.
Figure 3.
Cross-correlation Between the Return Series of DAX and SSE.
Figure 4.
: Wavelet Coherence Between the Eurozone and Brazilian Stock Markets. [Directions of arrows and their meaning: → Positively correlated, ← Negatively correlated, ↗ 2nd variable (BOVESPA) leads, ↘1st variable (DAX) leads, ↖ 1st variable (DAX) leads, ↙ 2nd variable (BOVESPA) leads].
Figure 4.
: Wavelet Coherence Between the Eurozone and Brazilian Stock Markets. [Directions of arrows and their meaning: → Positively correlated, ← Negatively correlated, ↗ 2nd variable (BOVESPA) leads, ↘1st variable (DAX) leads, ↖ 1st variable (DAX) leads, ↙ 2nd variable (BOVESPA) leads].
Figure 5.
Wavelet Coherence Between the Eurozone and South African Stock Markets. [Directions of arrows and their meaning: → Positively correlated, ← Negatively correlated, ↗ 2nd variable (JSE) leads, ↘1st variable (DAX) leads, ↖ 1st variable (DAX) leads, ↙ 2nd variable (JSE) leads].
Figure 5.
Wavelet Coherence Between the Eurozone and South African Stock Markets. [Directions of arrows and their meaning: → Positively correlated, ← Negatively correlated, ↗ 2nd variable (JSE) leads, ↘1st variable (DAX) leads, ↖ 1st variable (DAX) leads, ↙ 2nd variable (JSE) leads].
Figure 6.
Wavelet Coherence Between the Eurozone and Russian Stock Markets. [Directions of arrows and their meaning: → Positively correlated, ← Negatively correlated, ↗ 2nd variable (RTS) leads, ↘1st variable (DAX) leads, ↖ 1st variable (DAX) leads, ↙ 2nd variable (RTS) leads].
Figure 6.
Wavelet Coherence Between the Eurozone and Russian Stock Markets. [Directions of arrows and their meaning: → Positively correlated, ← Negatively correlated, ↗ 2nd variable (RTS) leads, ↘1st variable (DAX) leads, ↖ 1st variable (DAX) leads, ↙ 2nd variable (RTS) leads].
Figure 7.
Wavelet Coherence between the Eurozone and Indian Stock Markets. [Directions of arrows and their meaning: → Positively correlated, ← Negatively correlated, ↗ 2nd variable (SENSEX) leads, ↘1st variable (DAX) leads, ↖ 1st variable (DAX) leads, ↙ 2nd variable (SENSEX) leads].
Figure 7.
Wavelet Coherence between the Eurozone and Indian Stock Markets. [Directions of arrows and their meaning: → Positively correlated, ← Negatively correlated, ↗ 2nd variable (SENSEX) leads, ↘1st variable (DAX) leads, ↖ 1st variable (DAX) leads, ↙ 2nd variable (SENSEX) leads].
Figure 8.
Wavelet Coherence between the Eurozone and Chinese Stock Markets. [Directions of arrows and their meaning: → Positively correlated, ← Negatively correlated, ↗ 2nd variable (SSE) leads, ↘1st variable (DAX) leads, ↖ 1st variable (DAX) leads, ↙ 2nd variable (SSE) leads].
Figure 8.
Wavelet Coherence between the Eurozone and Chinese Stock Markets. [Directions of arrows and their meaning: → Positively correlated, ← Negatively correlated, ↗ 2nd variable (SSE) leads, ↘1st variable (DAX) leads, ↖ 1st variable (DAX) leads, ↙ 2nd variable (SSE) leads].
|
Disclaimer/Publisher’s Note: The statements, opinions and data contained in all publications are solely those of the individual author(s) and contributor(s) and not of MDPI and/or the editor(s). MDPI and/or the editor(s) disclaim responsibility for any injury to people or property resulting from any ideas, methods, instructions or products referred to in the content. |
© 2024 by the authors. Licensee MDPI, Basel, Switzerland. This article is an open access article distributed under the terms and conditions of the Creative Commons Attribution (CC BY) license (http://creativecommons.org/licenses/by/4.0/).
