1. Introduction
Wastewater management is perhaps the greatest environmental and health challenge facing our current society. This is due to the population growth over the last century, coupled with the increasing use of contaminants in both industrial and domestic processes, and the rising per capita water consumption, which has not been matched by improvements in purification processes [
1].
This lack of new technology in purification has led to inertia in management, resulting in the allowance of only a single technology applied to all cases, leading to the current situation that causes so many health and environmental problems [
2,
3,
4].
Based on plants with low purification capacity but large size, which collect effluents from a wide area and, due to their deficiencies, produce significant health and environmental nuisances, it is necessary to keep them away from urban areas. This necessitates the transportation of raw wastewater through extensive sewer networks, which result in pollution due to inevitable leaks, and enormous energy consumption, requiring a substantial initial investment. The low quality of the effluent treated by these systems requires the construction of a submarine outfall to dispose of this toxic effluent into the sea, thus escalating the investment needed for the installation of these obsolete systems, with the consequent environmental impact on the coast.
The alternative lies in developing tailored solutions for each case using new technology that enables high-quality purification, facilitating the reuse of treated water in the effluent production area and avoiding the extensive and costly sewer networks that require huge initial and maintenance investments, despite which they continue to cause ongoing contamination of aquifers, continental surface waters, and coasts.
The alternative solution of applying tailored purification to each area, based on the specific characteristics of the effluent, has faced criticism that lacks consistent arguments, driven solely by the desire to maintain the immense business of wastewater management [
5,
6,
7,
8,
9,
10,
11,
12,
13,
14,
15,
16,
17,
18].
This article unequivocally demonstrates the benefits of applying contemporary technology to local problems, enabling the complete reuse of water and sludge without posing any health or environmental risks. Additionally, it highlights the flexibility of the system, which can also provide solutions for small populations, something that is impossible with current standard technology.
The Giniginamar wastewater treatment plant, situated on the island of Fuerteventura in the Canary Islands, provides a clear illustration of the simplicity, speed, and affordability of wastewater management solutions for urban settlements with populations of less than 200 inhabitants. The plant produces treated water that meets the standards set out in the Spanish Royal Decree 1620/2007 of December 7th, which reflects the quality requirements of the European Union for various uses of treated water. This plant serves as an exemplary case study for the treatment of pollutants in any region of the globe, given its high levels of pollutant parameters and considerable variability. Consequently, the inlet BOD5 reaches 1899 mg O2/l, conductivity reaches values of 17970 µS/cm, COD reaches values of 2257 mg O2/l, and suspended solids exceed 1100 mg/l, all of which surpass the design parameters of the plant. However, these are effectively managed by the purification process, resulting in stable output parameters with concentration values below the reuse limit.
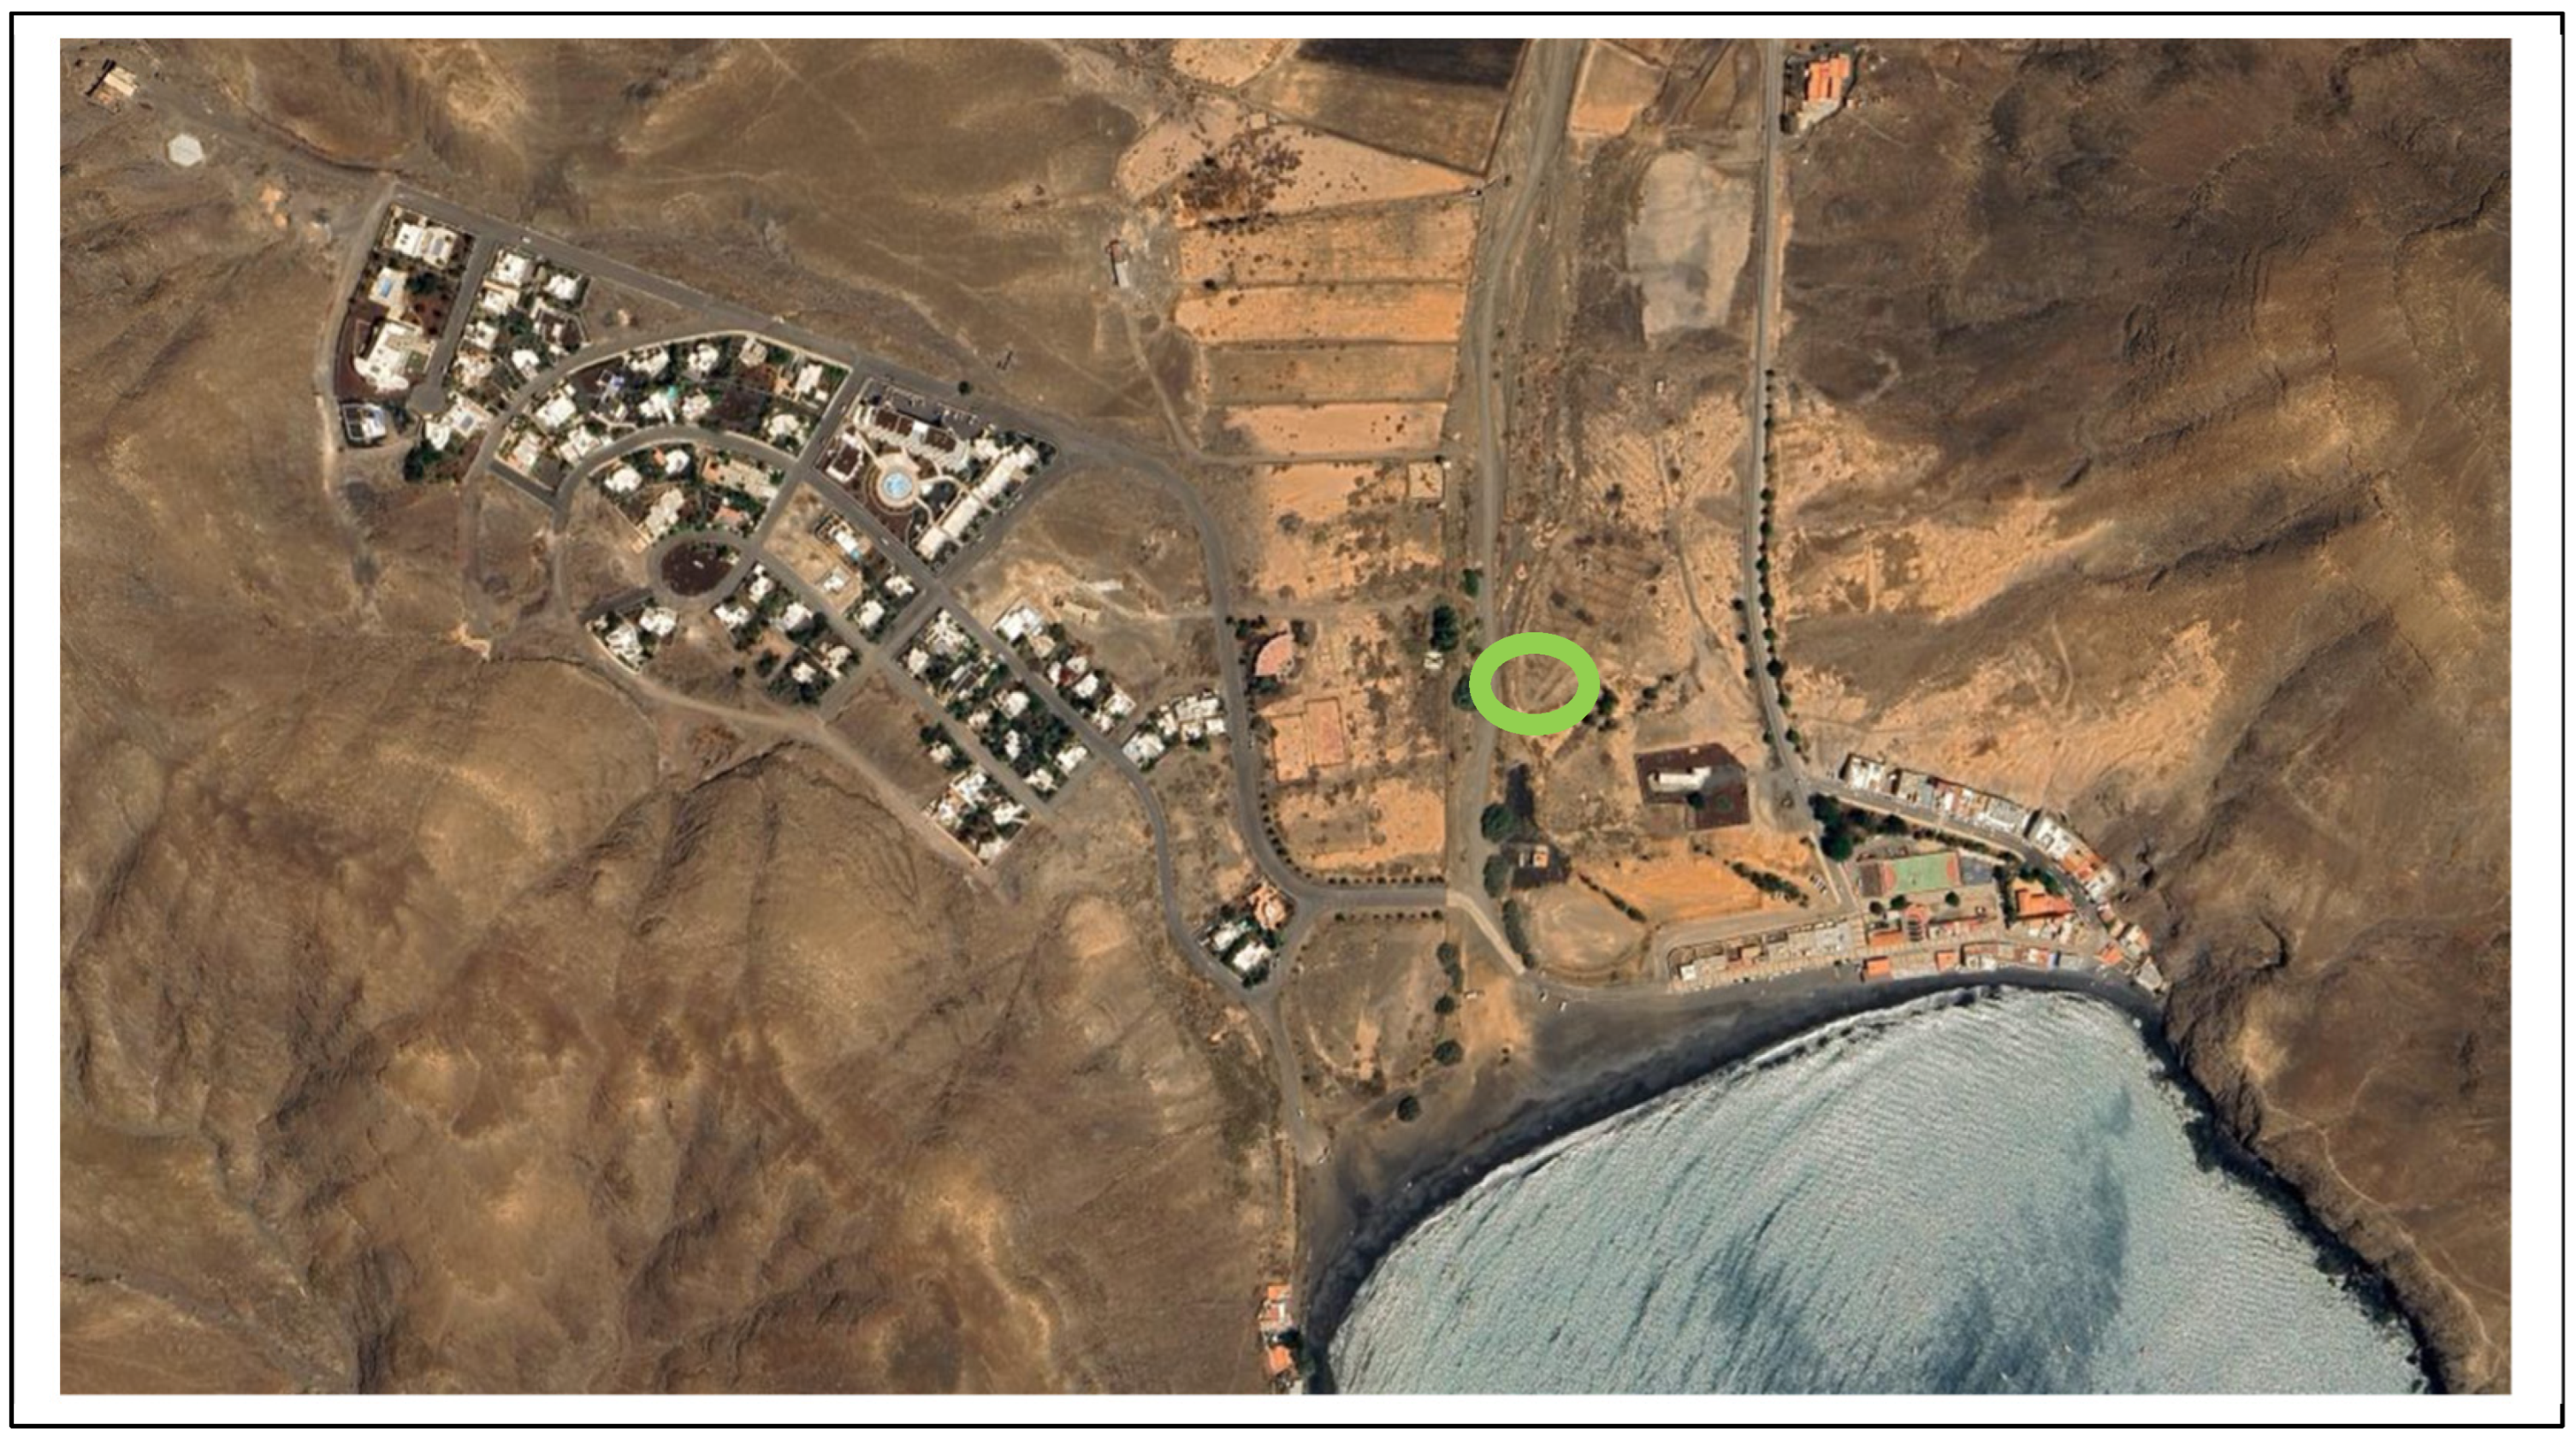
As illustrated in
Figure 1, the plant is situated within the urban core, thereby avoiding any potential nuisances to neighboring residents, such as odors, insect infestations, or noise. This also reduces the visual impact to a negligible level, if such an outcome is desired. The location within the urban core minimizes the need for long sewer pipes, which directly impacts savings in initial investment, reduces the need for pumping, shortens system installation time, and lowers the risk of pollution to the aquifer and the coast due to inevitable leaks that occur in all pipes.
2. Materials and Methods
The plant is designed to be compact, minimizing landscape impact (the plant could be entirely built underground) and civil engineering investment. This ensures that both the plant and the purification processes are robust and highly efficient, with a simple organization that reduces maintenance, the need for chemical products, and ensures the longevity of the infrastructure.
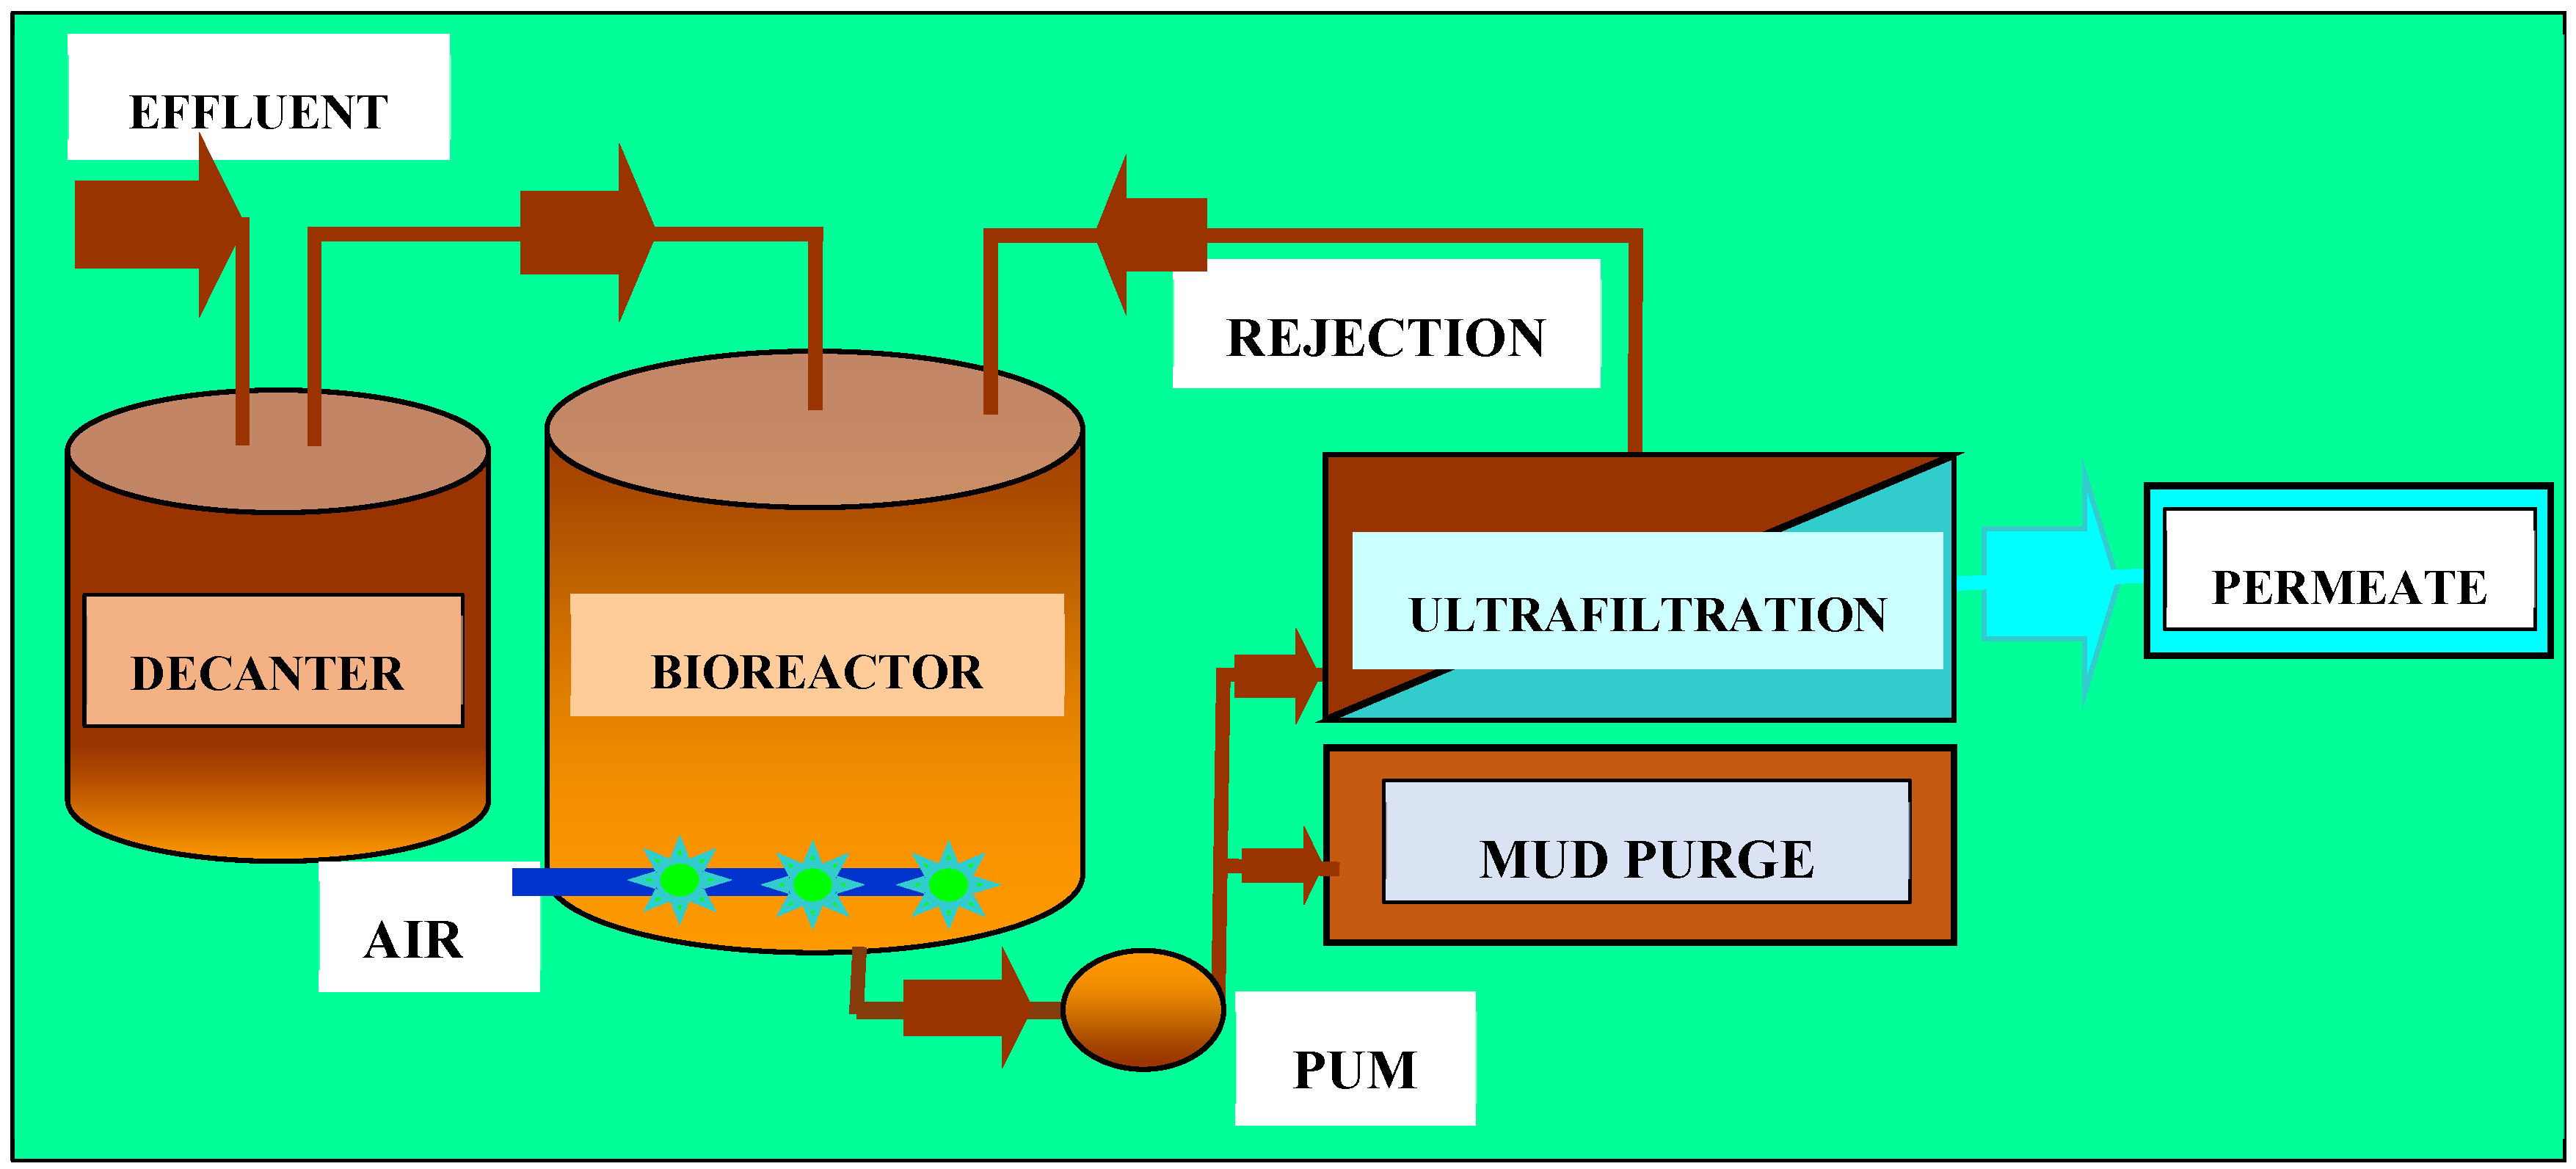
Wastewater is directed to a settling tank before being pumped into the Biological Tank, which maintains a high concentration of active sludge with optimal oxygenation. These working conditions facilitate the complete degradation of organic matter under aerobic conditions, reducing the volume of final sludge to approximately half that of traditional systems. The high sludge concentration eliminates the need for thickening processes, and due to its complete degradation, the resulting sludge is odourless and poses no risk for reuse.
The effluent is then pumped to the ultrafiltration membrane section, which separates dissolved sludge from the treated water. In addition to removing suspended solids, the ultrafiltration process effectively eliminates nearly all bacteria, ensuring that the permeated water consistently maintains primary mechanical disinfection, reducing Escherichia coli concentrations in analyses to zero and achieving low turbidity values without the need for chemical additives.
The ultrafiltration reject is returned to the Biological Tank to maintain sludge concentration, with a sludge purge system in place to prevent indefinite increases in sludge levels.
Figure 2.
Flow diagram description of treatment plant.
Figure 2.
Flow diagram description of treatment plant.
The biodigester operates with a denitrification period involving the cessation of aeration and pumping, calibrated according to the concentrations of organic matter received by the plant.
The system includes a sampling point at the membrane outlet to collect samples of permeated water, which accumulate in two 1500-liter tanks. From these tanks, the water is pumped for municipal garden irrigation, while excess sludge is stored in a tank for subsequent management [
19].
2.1. Settling Tank
The fluid flows directly from the sewer into a settling tank, where fats and coarser sediments are separated. This is the only pre-treatment the plant undergoes and requires cleaning once a year, though the frequency depends on the quantity and quality of the influent. The effluent then moves to another tank of equal capacity, which acts as a buffer tank to mitigate flow rate variations common in small tourist populations. In such areas, population levels can double or even triple on weekends and continuously during the summer season.
2.2. Biological Reactor
The fluid is subsequently pumped to the biological tank, where the purification process occurs. As previously mentioned, the sludge concentration is exceptionally high, reaching 15 kg SS/m3 with a load factor of 0.1 kg BOD5/kg SSV x day. Due to the semi-desert conditions and strong winds in the area, covering this tank has become necessary to mitigate the ingress of sand into the system, thereby extending the lifespan of the plant and its membranes.The aeration system features a unique aerator designed to maintain optimal oxygen concentration for aerobic degradation. Consequently, the water meets legislative limits on organic matter content, making it suitable for reuse. This process reduces sludge by approximately 50% compared to traditional plants. Complete aerobic degradation eliminates the production of noxious odors, rendering this type of plant harmless to neighbouring communities. Thus, it can be installed in urban areas, including enclosed premises such as hotels, factories, and offices.
Due to the high concentration of organic matter in the effluent, it has been necessary to design a nitrogen removal system that operates at regular intervals within the biological tank itself. This eliminates the need for air injection in the diffuser and pumping. Consequently, nitrogen values at the conclusion of the process are significantly reduced.
The membranes are prone to rapid wear due to the presence of sand and dust. To mitigate this, the bioreactor is covered to prevent the ingress of these particles, particularly since it is situated in a semi-desert area with persistent winds. For additional details, please refer to Figure 3.
Figure 3.
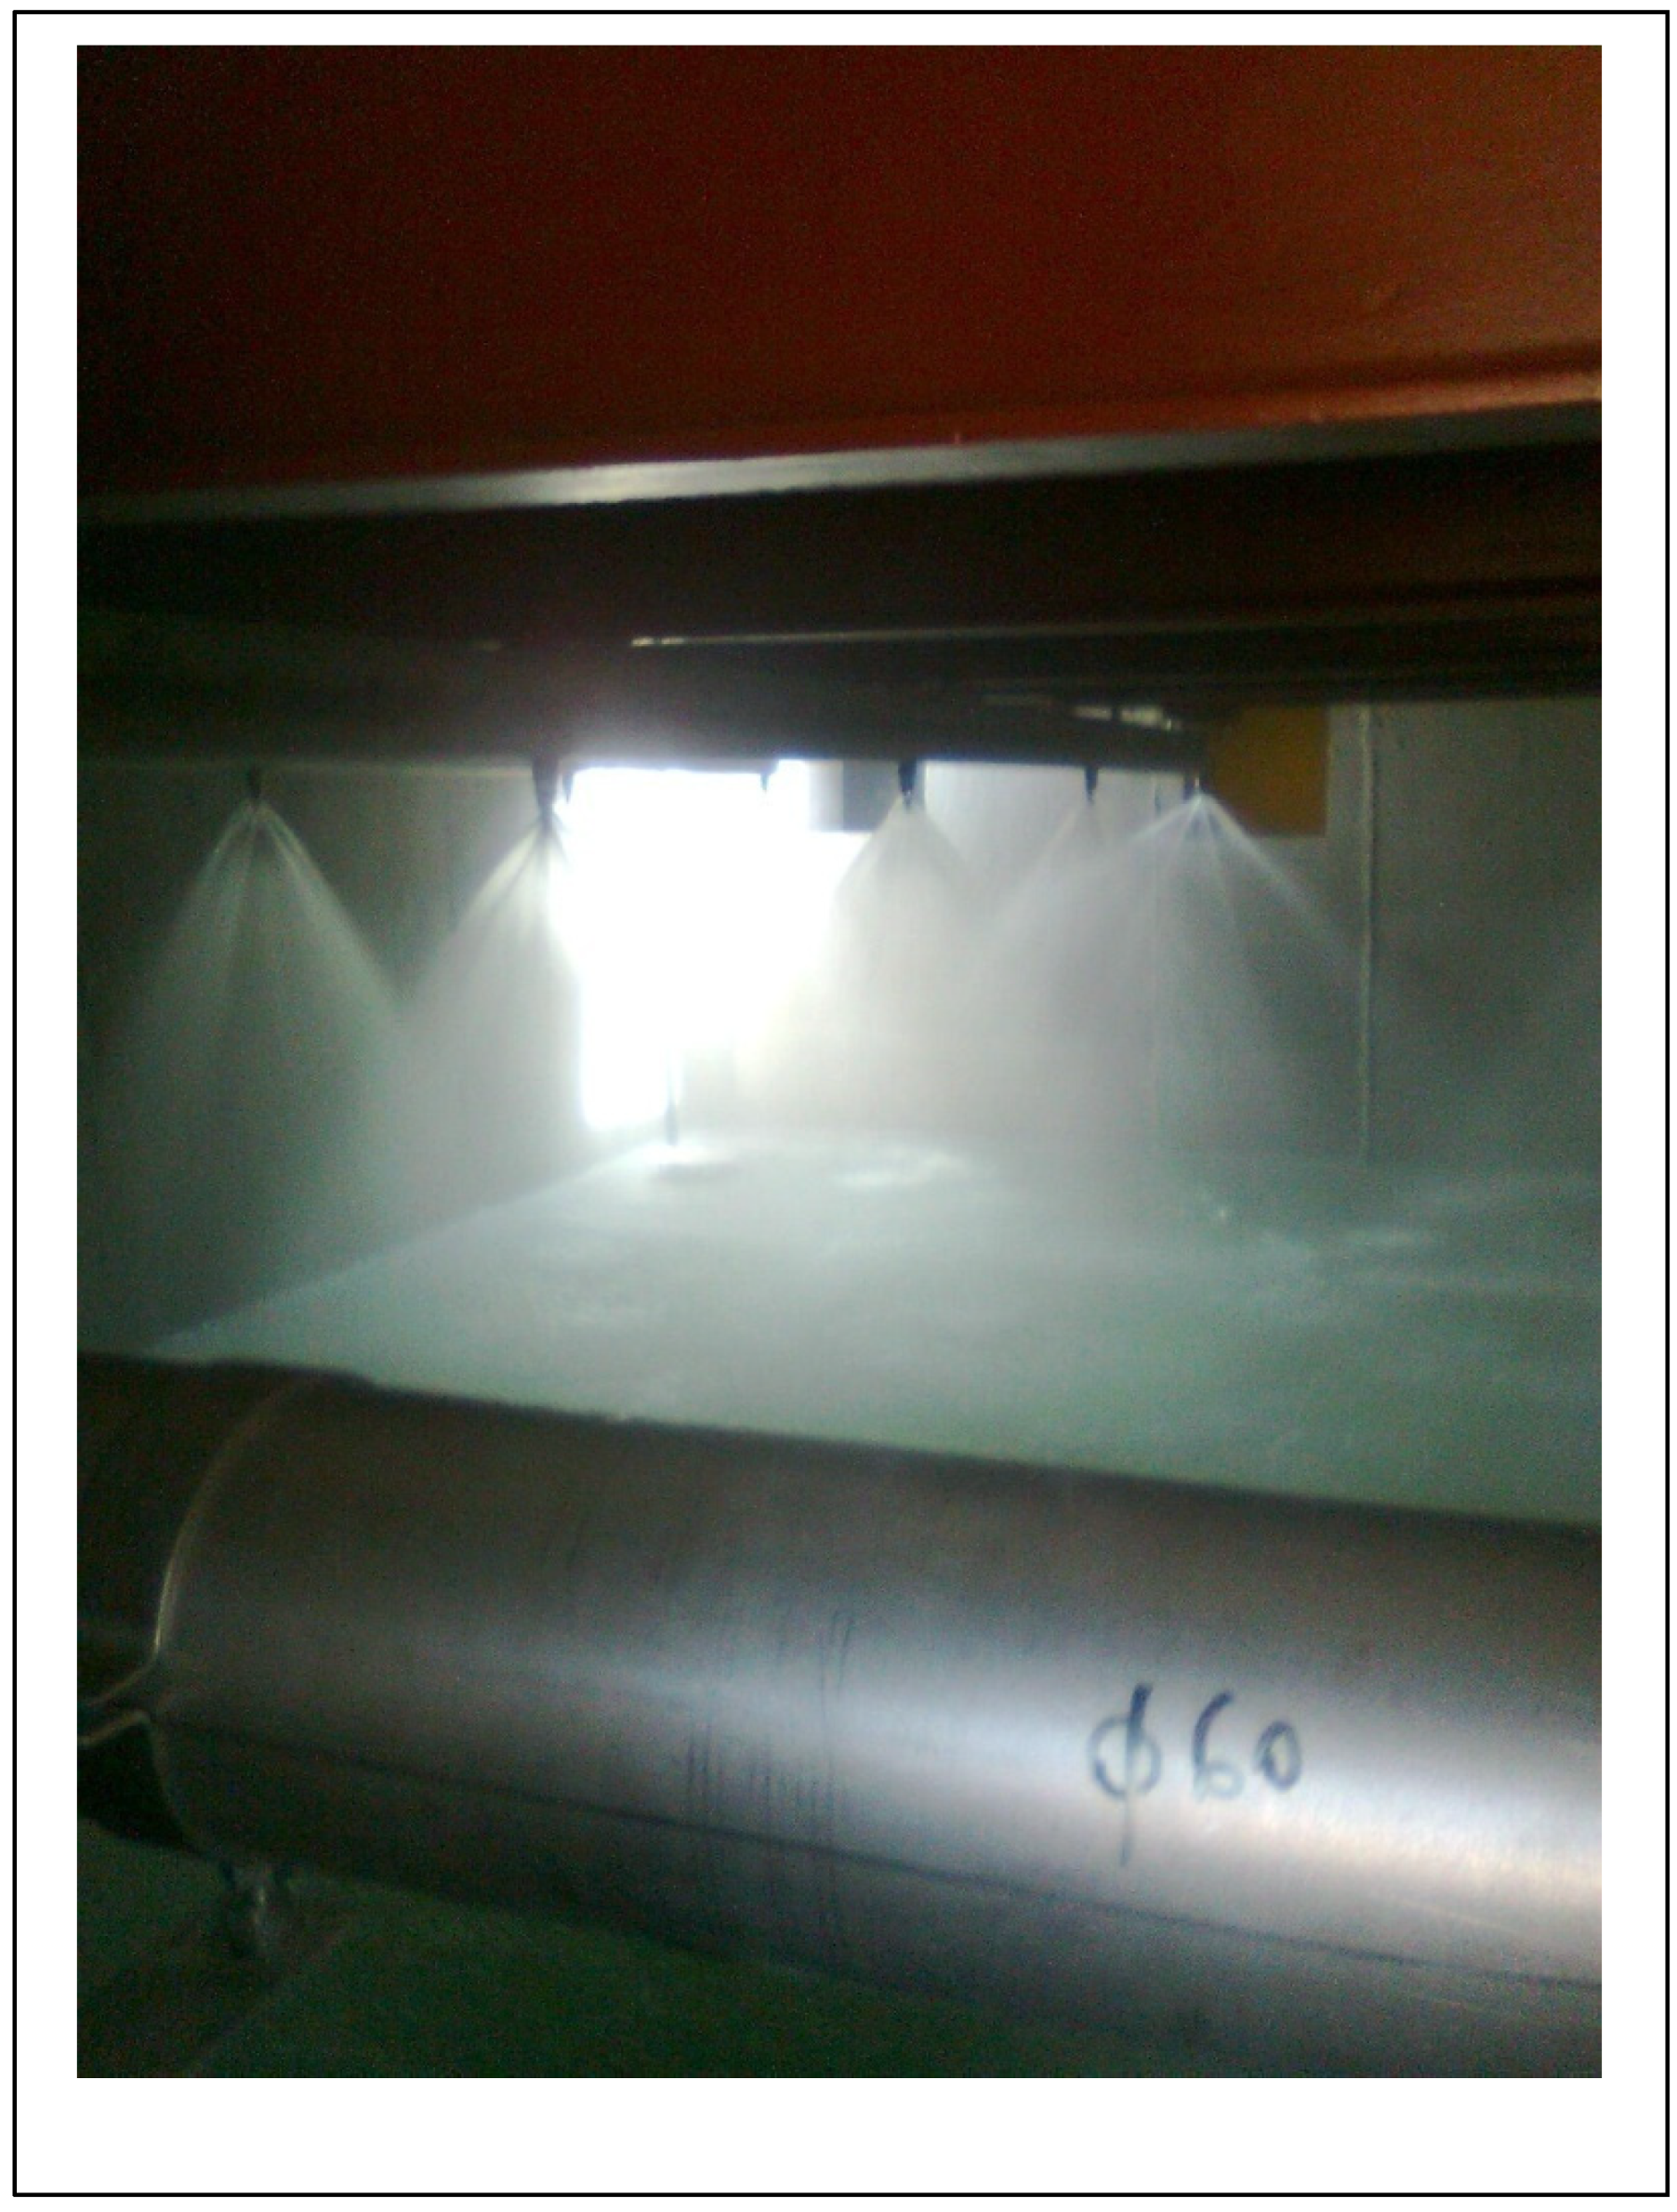
Illustrates the membrane rejectors, which maintain a residual pressure of approximately 1 bar. This pressure is utilized to spray the contents back into the bioreactor, facilitating oxygenation.
Figure 3.
Illustrates the membrane rejectors, which maintain a residual pressure of approximately 1 bar. This pressure is utilized to spray the contents back into the bioreactor, facilitating oxygenation.
2.3. Filtration
The effluent from the biological tank is pumped into the filtration system at a pressure of 3 Bar, where ultrafiltration membranes with a 0.1 µm pore size separate sludge from water. Ultrafiltration prevents the passage of bacteria, thereby eliminating one of the major hazards of wastewater: biological contamination, which poses significant environmental and health risks. This mechanical disinfection eliminates the need for chemical additives, reducing environmental impact, simplifying maintenance, and saving costs, resulting in safe water that can be used for any purpose permitted by law with complete confidence.
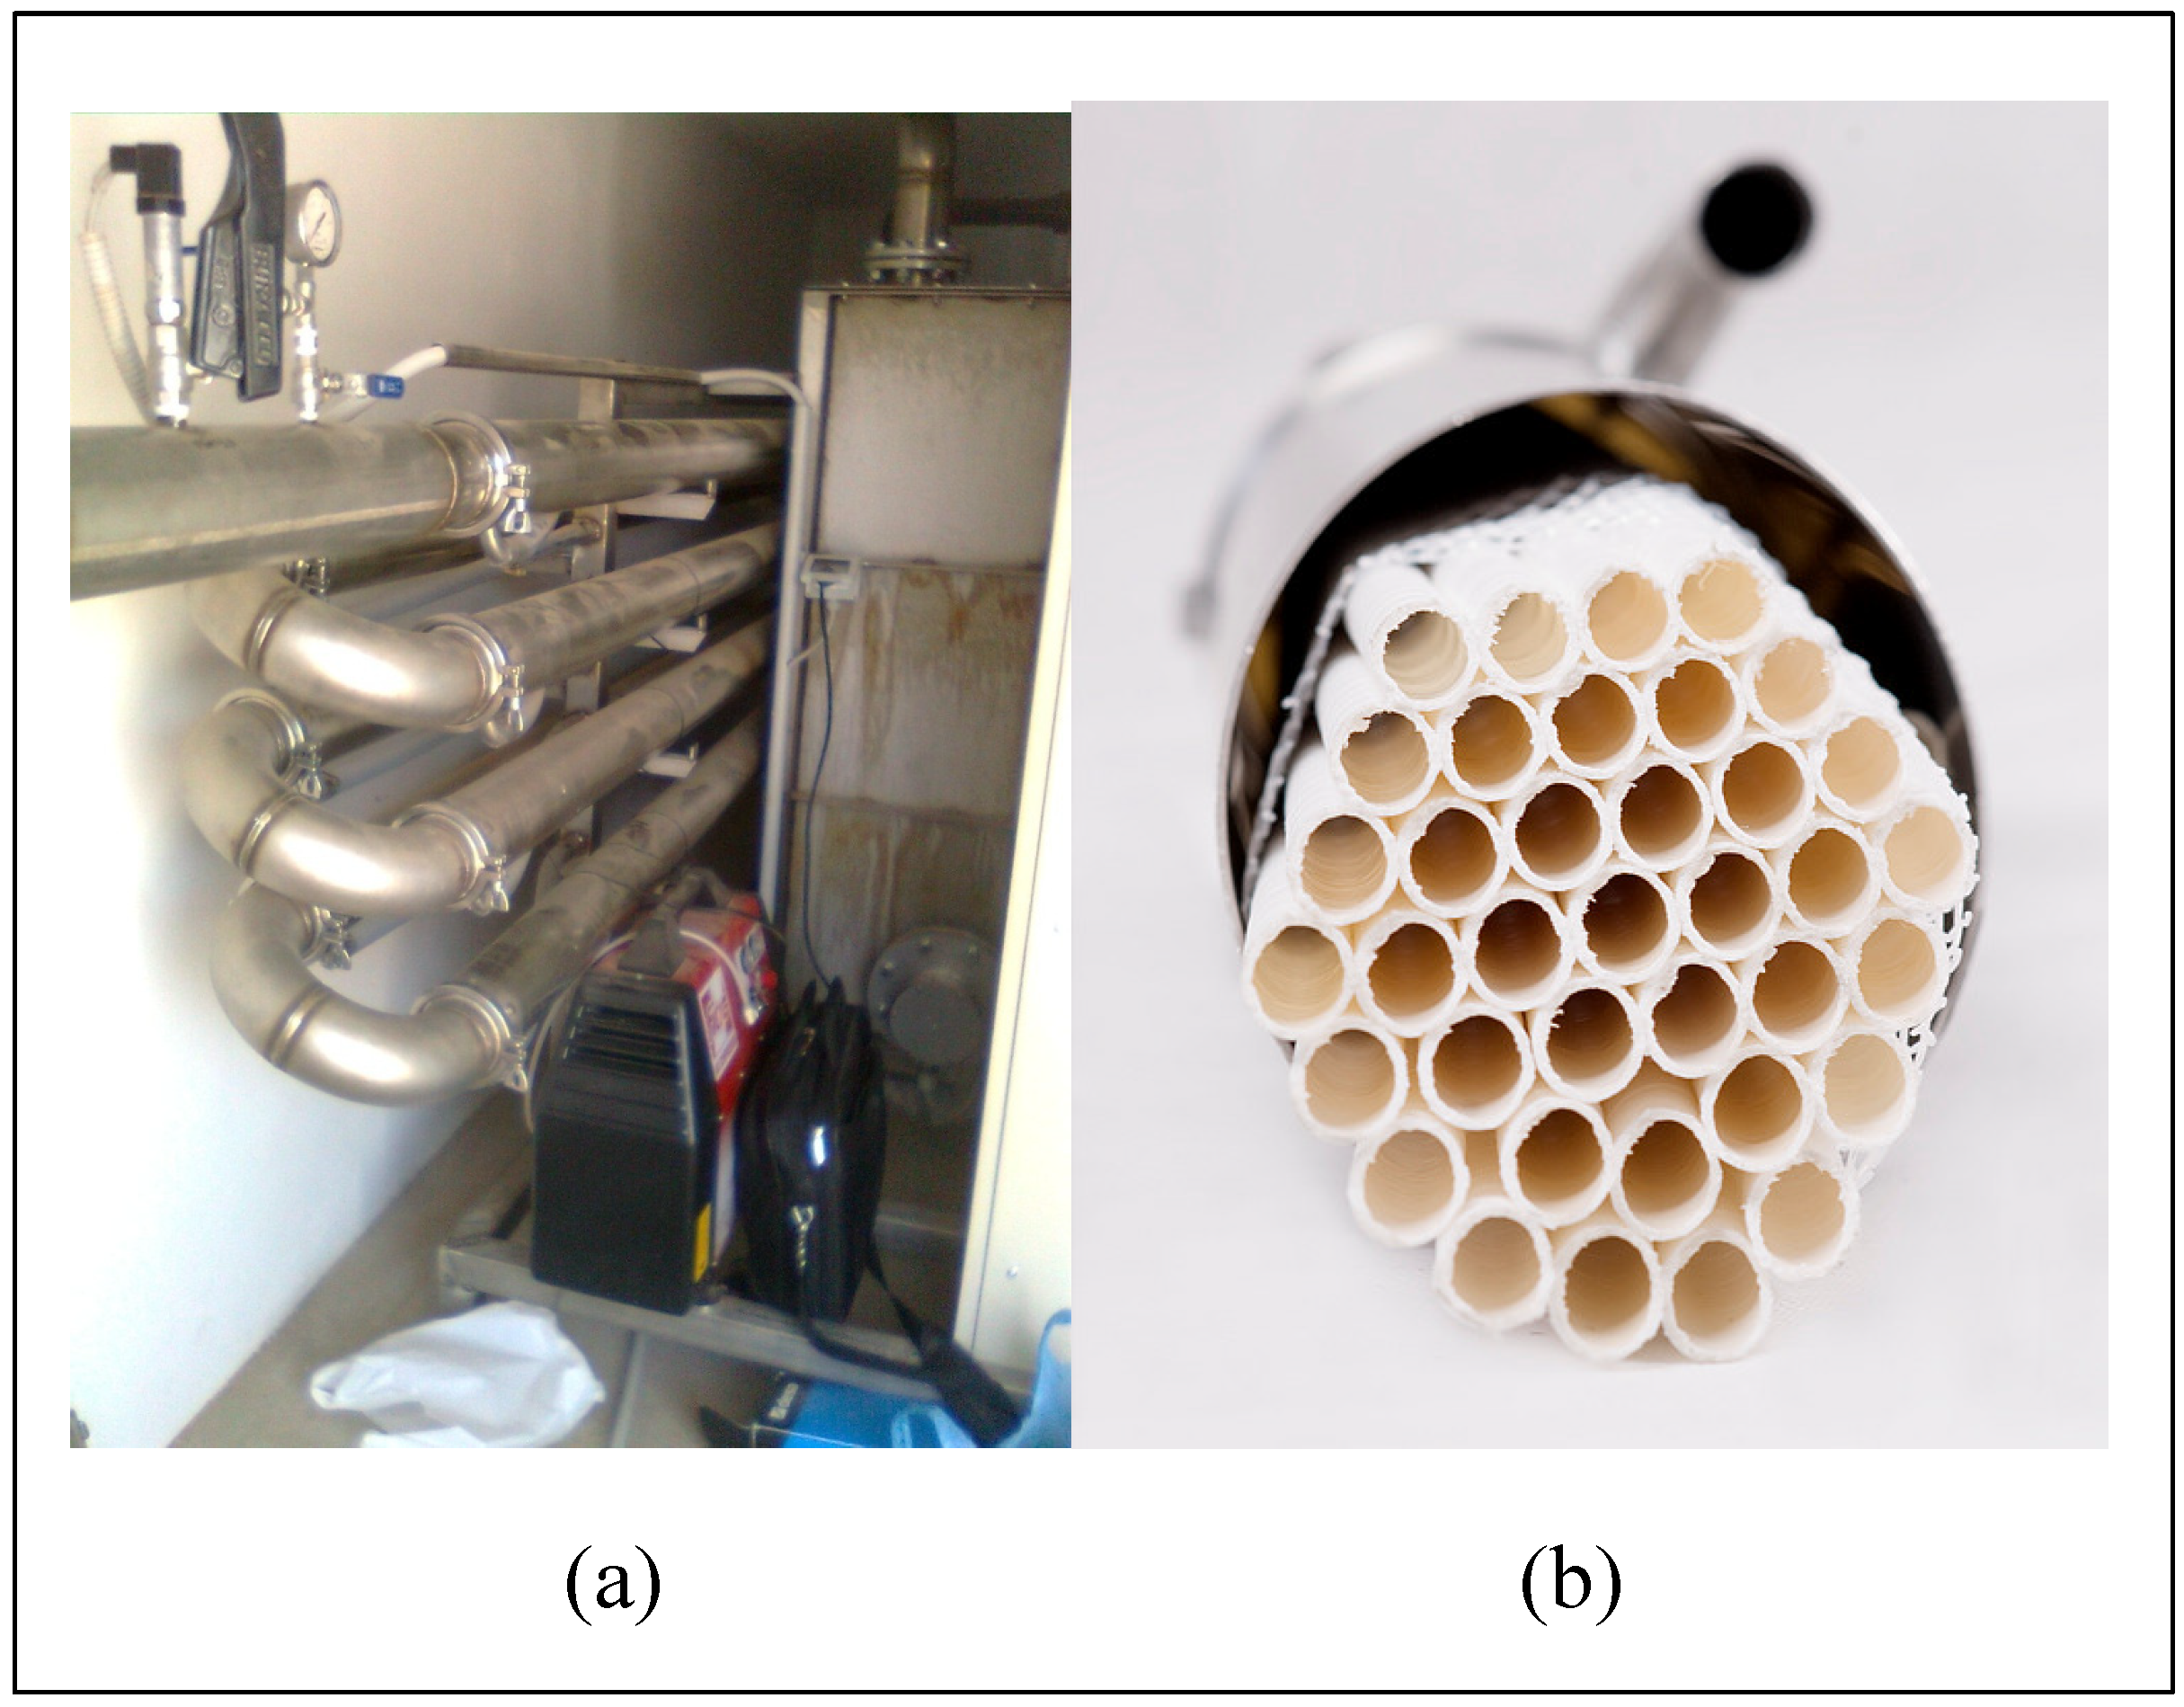
The ultrafiltration system consists of 7 consecutively arranged tubular membranes, which conduct filtration perpendicular to the flow, thus avoiding the risk of blockage and reducing the issues associated with membranes used in MBR processes (Figure 4).
Figure 4.
Depicts a view of the seven ultrafiltration tubular membranes (a) and a section of the tubes in which they are housed (b).
Figure 4.
Depicts a view of the seven ultrafiltration tubular membranes (a) and a section of the tubes in which they are housed (b).
Membranes require periodic cleaning, depending on the conditions of the influent, with rinses and acid and alkali cleanings. The residue from cleaning is directed to the plant’s headworks and included in the purification process as part of the effluent. Membrane cleaning involves redirecting the sludge input to a cleaning tank, where water and acidic and alkaline chemicals are pumped in the same direction as the flow (not counter-current cleaning), aiming to remove any deposits on the membranes and disinfect them to prevent bacterial growth between the fibers of the retaining mesh. Cleaning is carried out under sanitary conditions, with operators avoiding direct contact with the effluent or membranes. Once each cleaning process is completed, the corresponding valve is opened to direct the residue to the headworks.
This rejection, with a residual pressure of 1 bar, is introduced through diffusers located at the top of the bioreactor. The objective is to enhance the oxygenation capacity of the effluent upon reaching the biological reactor (refer to Figure 3).
Under normal conditions, membranes are guaranteed for 4 years, but they typically exceed this period. Replacement is recommended after this period, but due to the plant’s excellent management and the operator’s careful attention, membrane replacement has not been necessary since the plant started operating in 2010. The plant’s performance is easily verified as E. coli concentration remains consistently at zero and turbidity remains low.
One of the Achilles’ heels of membrane filtration plants is maintaining filtration capacity. Membranes installed in MBR systems submerged in the biological reactor require controlled influent pre-treatment, which is challenging and often problematic. These types of membranes alleviate most of the difficulties associated with MBR systems, making maintenance simple and hygienic. They reduce membrane changes, increase reliability, and maintain stable treated water analyses despite fluctuations in influent values.
2.4. Control System
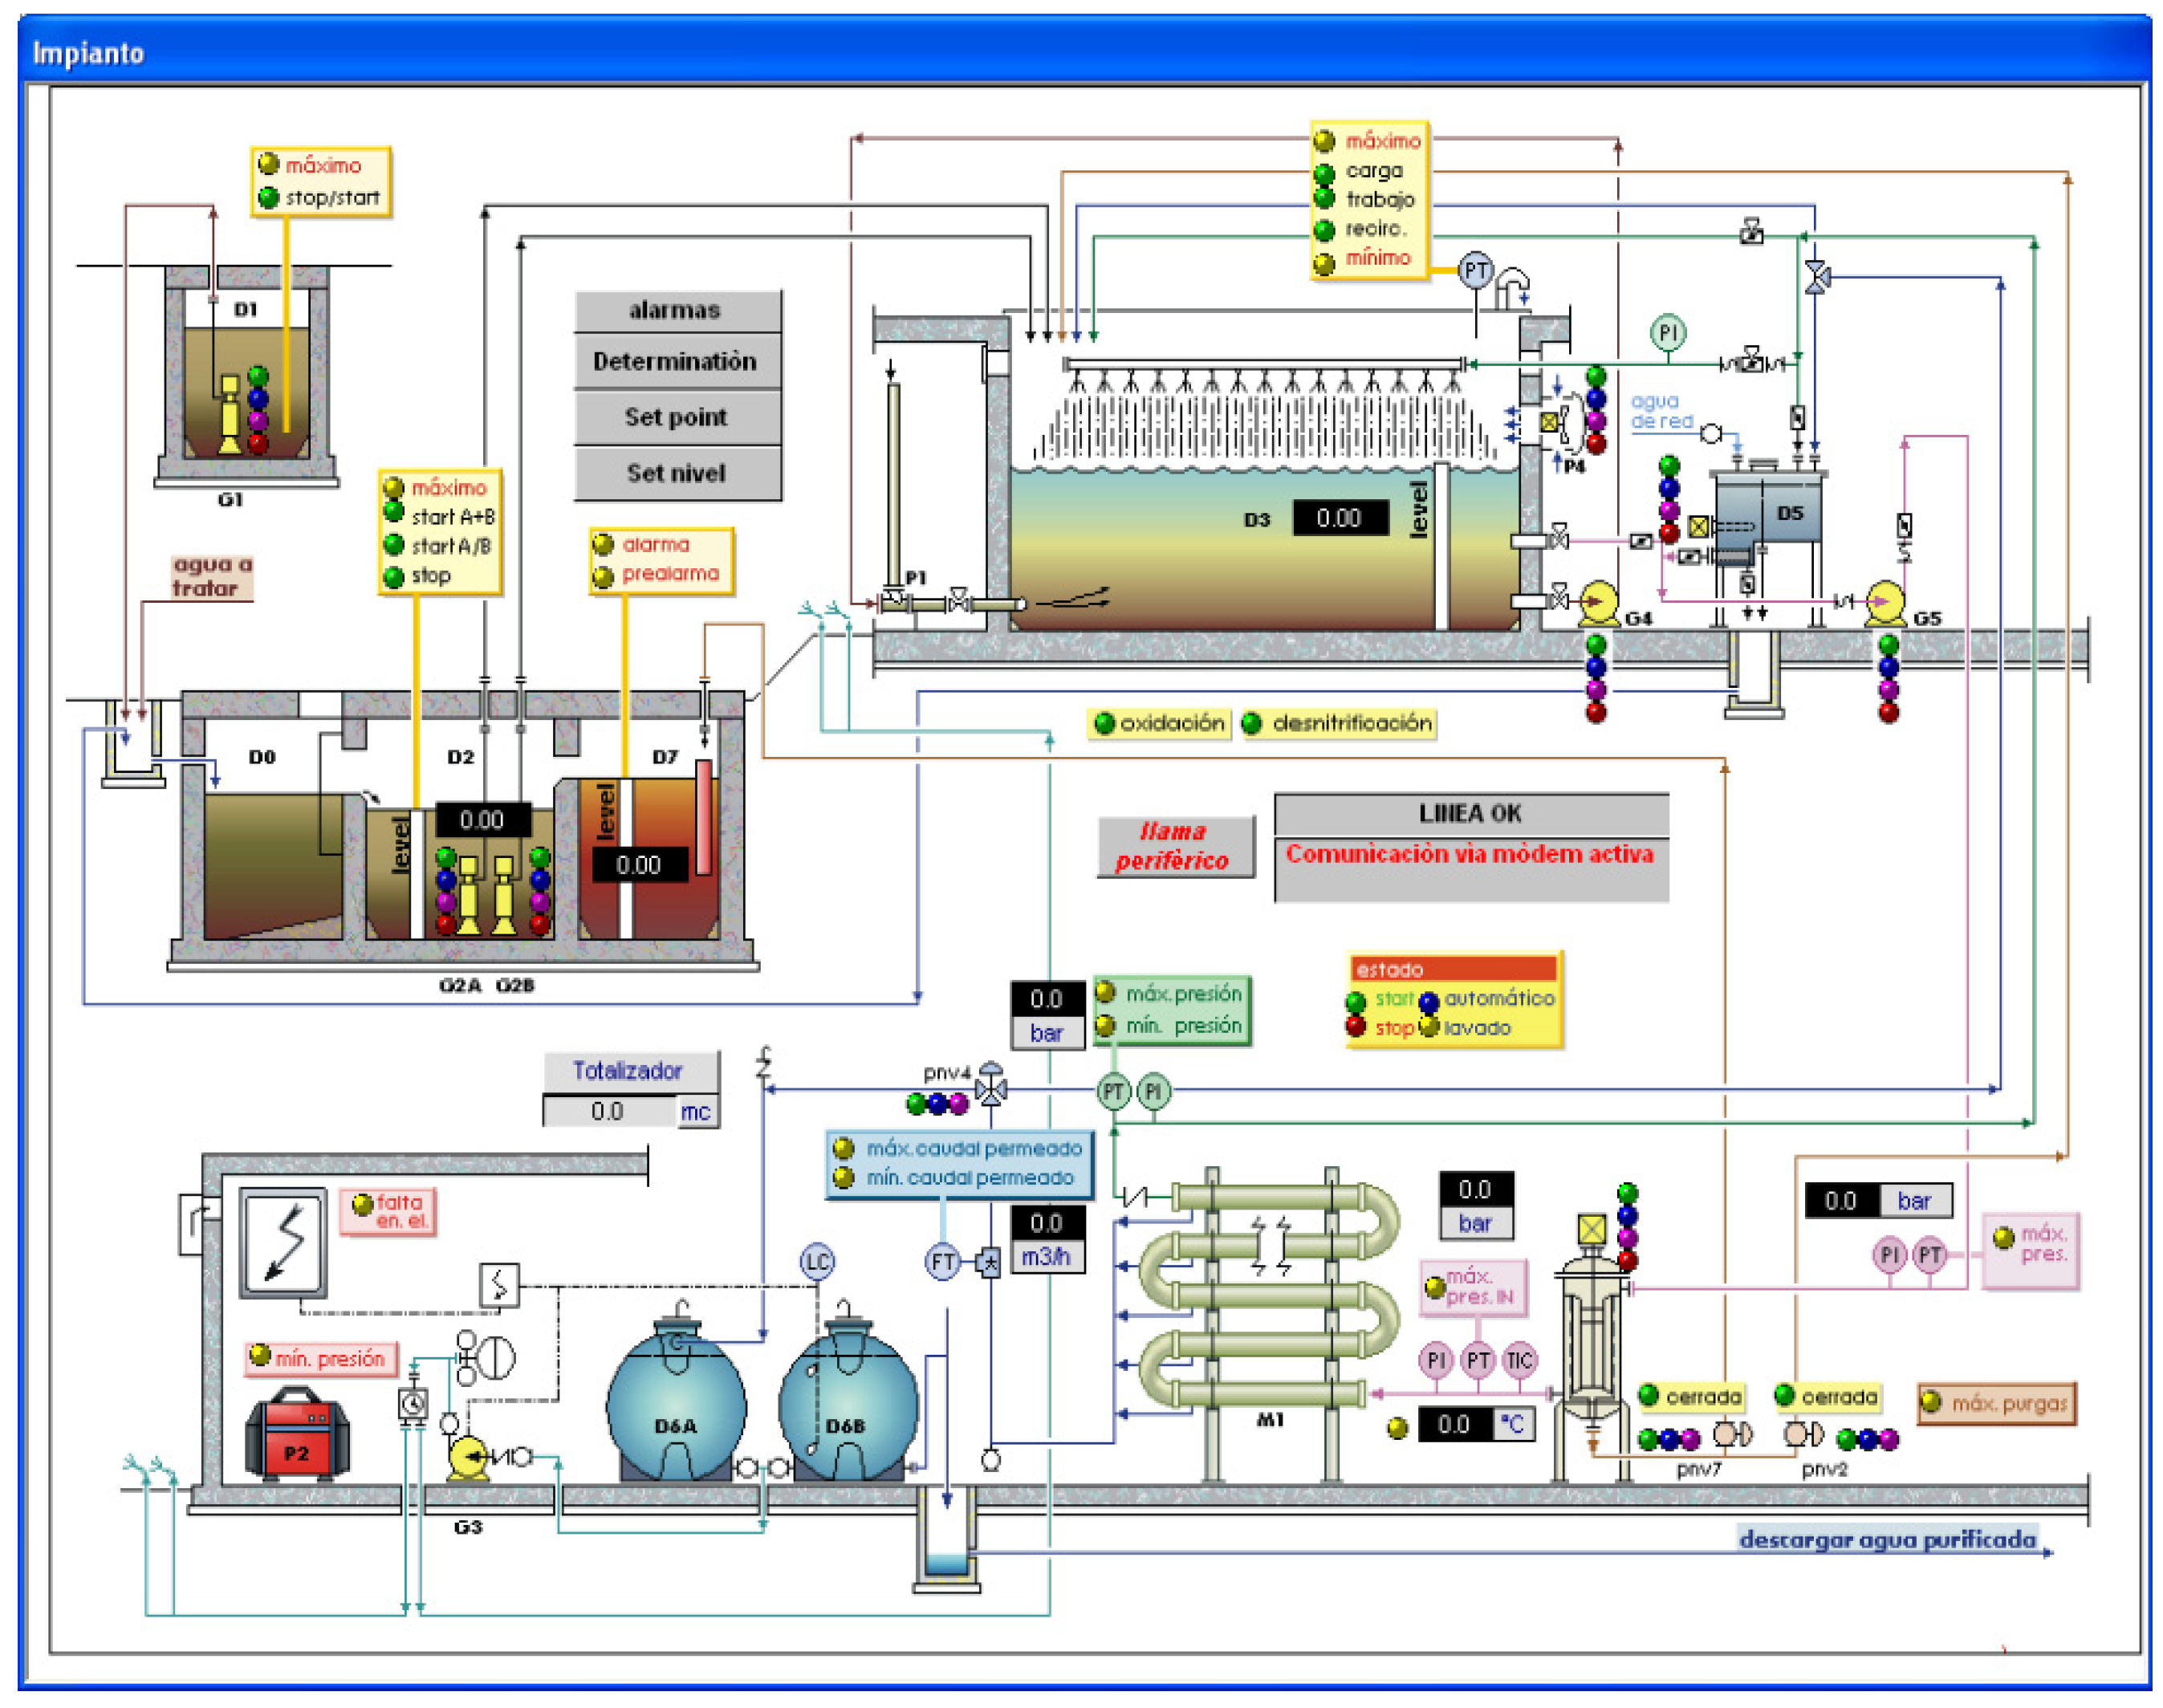
The plant is controlled by a Programmable Logic Controller (PLC) that manages valve openings, level sensors, and pumps according to the calibration parameters established during the first year of operation and verified during operation. This semi-autonomous system significantly reduces the need for labor by minimizing interventions, such as sampling (weekly), sludge tank emptying (annual), and membrane cleaning (monthly). Additionally, the system sends alerts to the operator via text messages to mobile phones about alarms and exceeded levels or operating parameters. This represents important support for plant management, reducing inspection visits and facilitating maintenance planning (See Figure 5).
Figure 5.
Synoptic diagram of the systems of the Giniginamar wastewater treatment plant.
Figure 5.
Synoptic diagram of the systems of the Giniginamar wastewater treatment plant.
The plant can be remotely managed using software that allows adjustments to purification processes, control of pumps, aeration, and continuous monitoring of plant operations through installed sensors.
Figure 2 shows a workflow diagram of a larger treatment plant than the one described in this article, with a control system that manages the plant once calibrated.
This system has a series of alarms and notifications that are also sent to the mobile phones of maintenance personnel, essential for optimizing management, labor, and energy consumption. It also reduces material wear, chemical usage, and membrane degradation, contributing to greater efficiency and lower maintenance costs.
The system allows comprehensive oversight by water regulatory authorities of plant operation, maintaining a record of all incidents and their respective resolutions.
A colour code is utilized for each process to signify its status and convey warnings regarding tank filling, oxygenation time, agitation, operation of pumps, dosing devices, and similar parameters.
3. Results and Discussion
3.1. Analysis of Effluent
The plant was conceived considering approximate values from neighboring areas, as the sewer system relied on septic tanks, making it impossible to extrapolate samples taken at these points to a continuous effluent that could reach the plant.
Decentralized treatment is based on systems that produce high-quality water without causing inconvenience to citizens, with minimal maintenance requirements. To minimize maintenance, in addition to the aforementioned systems such as remote monitoring, alerts, alarms, and automation, it is necessary to design a plant that can mechanically withstand years of operation.
This requires selecting the best materials and machinery, including pumps, membranes, sensors, valves, control systems, wiring, etc. All components of the system are fabricated using type 316L Stainless Steel, known for its high mechanical strength, low corrosion even in marine environments, tolerance to high temperatures and their fluctuations, and minimal formation of precipitates during machining.
The following parameters were provided for the plant design (
Table 1):
In the design of decentralized treatment systems, it is particularly important to anticipate potential fluctuations in flow and effluent quality to prevent under sizing the system, especially when reliable data on the initial situation are lacking and little is known about possible developments.
It is essential to understand water uses and local conditions where these systems will be applied to achieve adequate water quality for reuse while minimizing maintenance. In this case, the most significant constraints were population variations, as the population more than doubled on weekends throughout the year, and during the summer, it became a gathering point for up to 50 caravans, emptying chemical toilet waste into the sewer system.
Another important consideration was the proximity of wastewater conduits to the coastline and the potential domestic cheese production, leading to spikes in salinity that the plant must absorb along with high organic matter loads. As expected, the initial levels are significantly exceeded in the effluent reaching the plant, and due to its small size, variability is substantial, further complicating treatment.
Therefore, this plant is a paradigmatic example of the treatment capacity of treatment plants with these systems, as it encompasses all the difficulties of treatment cases, with very high contaminant levels, including conductivity values, and considerable variability on a daily, weekly, and seasonal basis.
Table 2 presents the maximum, minimum, and mean values found over almost 6 years of operation.
Organic matter measured as BOD5 offers a maximum value of 1899 mg/l of oxygen, a minimum value of 60 mg/l, and an average of 661 mg/l, with a standard deviation of 245 mg/l. With 76.5% of analyses above 500 mg/l, which is the fundamental design parameter of the plant in terms of organic load. Values above the mean (661 mg/l) represent 44.3% of the data obtained in the analyses.
Organic matter measured as COD presents a maximum value of 2257 mg/l, a minimum value of 133 mg/l, an average of 1038 mg/l, and a standard deviation of 325 mg/l. Values above the mean coincide with the percentage obtained in BOD5, i.e., 44.3%.
High conductivity values negatively impact traditional treatment plants, while in systems like the one proposed in this article, their effect on the final treated water quality is low. The maximum value obtained was 17970 µS/cm, with a minimum value of 737 µS/cm, an average of 2398 µS/cm, and a standard deviation of 1820 µS/cm. Salinity variability is high, perhaps the most critical parameter for assessing the plant’s robustness.
Suspended Solids offer a maximum value of 1164 mg/l and a minimum value of 40 mg/l, with an average of 302 mg/l and a standard deviation of 201 mg/l. 32% of the data is above 300 mg/l.
3.2. Treated Water Output Values
Analytical results of the treated water always fall within the limits set by Spanish legislation, reflecting the European directive on the reuse of water from treatment plants, despite the data from the influent, something unthinkable in traditional treatment systems.
Perhaps particularly noteworthy are the variable conductivity values, with peaks exceeding 17,000 µS/cm while the average remains around 2400 µS/cm, as this would render an activated sludge plant inoperable due to its impact on the entire bacterial process in such treatment developments.
However, there are other values that also demonstrate the robustness and high efficiency of the plant in treatment, such as the organic matter value. BOD5 reaches values of 1900 mgO2/l and maintains a high average of 661 mgO2/l, which does not affect the output values, which remain stable despite these concentration spikes.
The considerable variability of the values is also a challenge faced by this plant, as minimum values reach 60 mg/l, which would not allow for proper operation in traditionally designed plants. The COD follows a similar pattern to the BOD5 data, with peak values exceeding 2200 mg/l, and values above the average coincide in both BOD5 and COD.
The available statistics consist of 117 analyses for the past 6 years, approximately one analysis every 15 days for BOD5 and COD values, 500 values for turbidity nephelometry sensor, and 250 for suspended solids filtration in mg/l. For the plant’s health analyses, there are 200 samples analysed. We will analyse the treatment results by parameters.
3.2.1. Microorganisms and Pathogens
One of the most important parameters for assessing the quality of treated water is the presence of microorganisms and pathogens, as they pose significant health risks to humans and the environment in traditional treatment processes.
The plant operates with a filtration system featuring a pore size smaller than 0.1 µm, effectively preventing the passage of bacteria. This mechanical disinfection process eliminates the need for any chemical disinfectants, ensuring high-quality water sanitation without the risk of pathogen proliferation in the environment.
In all 200 analyses conducted, including those for E. coli, Enterococcus sp., Legionella sp., and nematode eggs, the values obtained were consistently zero. This underscores the effectiveness of the mechanical disinfection process. The presence of positive values in any of these parameters would indicate membrane damage, compromising the disinfection process.
3.2.2. Organic Matter (BOD5)
Arguably the most crucial parameter for assessing the capacity and performance of the wastewater treatment plant, organic matter reduction stands as the primary objective in the design of domestic wastewater treatment systems.
Over the years, the recorded values indicate an average of 7.3 mgO2/l, with a standard deviation of 5.03 mgO2/l. Notably, only one value exceeded 20 mgO2/l (24 mgO2/l), with merely 18 values surpassing 10 mgO2/l out of 117 measurements conducted.
3.2.3. Organic Matter (COD)
With regard to Chemical Oxygen Demand (COD), a mean value of 47.5 mg/l was observed, with a standard deviation of 23.6 mg/l. There were 39 samples with values above 50 mg/l and 5 samples with values exceeding 100 mg/l. These figures reflect moderate concentrations of organic matter in the treated effluent. The presence of low levels of organic matter and the absence of microorganisms in the treated water ensure a high sanitary quality. This is critical, as elevated concentrations of organic matter could foster undesired bacterial growth both within the pipes and in the surrounding environmental setting.
3.2.4. Suspended Solids
Turbidity is another fundamental parameter for evaluating the quality of treated water, which, due to ultrafiltration, is very low. The results of 250 analyses conducted over this 6-year period have shown an average of 3.2 mg/l with a standard deviation of 4.8 mg/l, with 29 values out of the 250 available exceeding 5 mg/l.
3.2.5. Turbidity
The water quality values for turbidity have also been measured in Nephelometric Turbidity Units (NTU), with average values of 0.9 NTU and a standard deviation of 1.8 NTU. There are 4 values above 10 NTU and 11 values above 5 NTU out of a total of 501 samples.
Together with the concentration values of microorganisms, turbidity values in the treated water serve as an important indirect reference for evaluating membrane integrity, as any breakage results in high turbidity values.
Table 3 summarizes the treated water quality data from this system compared to the limits established in Spanish and European legislation, as included in Royal Decree 1620 of December 8, 2007. This includes the most restrictive values for agricultural reuse, specifically for vegetable irrigation where water comes into contact with the edible parts consumed fresh (
Section 2.1), such as lettuce. The last column represents values for discharge into surface watercourses.
4. Conclusions
The purification system proposed in this article has been operating for over 15 years without the need to change the membranes, surpassing any expectations regarding the lifespan of membranes of any kind. Proper management with monthly chemical cleanings and a deep cleaning every 2 years has kept the system running perfectly.
The water quality values allow for reuse (according to Spanish Royal Decree 1620/2007) without the need for additional treatments, especially without the need to disinfect the product water, allowing for safe reuse within the same municipality. This system represents significant initial investment savings as it does not require a submarine outfall to discharge the treated water into the sea.
Furthermore, the system has been installed in the town centre because it does not cause discomfort or present health risks, which is a significant advantage over traditionally installed systems. This avoids the need for expensive pipeline installations with continuous pumping to convey water to a sewage treatment plant located several kilometres away from the urban centre.
This measure helps prevent one of the main sources of sewage contamination in aquifers, especially in areas near the coast or sea, where losses in sewer systems and pipelines can be significant and difficult to assess, with losses ranging from 5% to 60% of the total pumped wastewater, depending on the quality of connections between pipes, manholes, intermediate accumulations, and other components of the sewer system.
Eliminating pumping reduces energy consumption compared to traditional systems, as well as maintenance costs, repairs, and material replacement costs, which are generally not included in the official expenses of purification costs. In addition to having high water quality values, these are stable despite the high variability and contamination levels that exceed design forecasts.
The design is highly flexible and can be adapted to the conditions of each case, not only for different effluent qualities with variability and peaks of high values but also for conditions of space limitations or landscape protection. Designs can also be adapted to budgetary constraints by modifying aeration systems or the quality and quantity of tanks or pumps. An interesting feature is the possibility of reusing abandoned facilities with standard technology, allowing the capacity of traditional plants to be multiplied by up to ten times, eliminating odours, improving the sanitary conditions of workers, and obtaining perfectly reusable water quality.
Maintenance costs, both for chemicals and personnel, can be reduced by automating the system, allowing it to be controlled from an office and sending alerts to mobile devices about the need for human intervention in the plant, such as tank emptying, membrane cleaning, or other incidents.
This system offers the opportunity to change the management of centralized purification systems to decentralized systems with remote control, which could address many of the current systemic problems related to public health and water resource degradation.
Acknowledgments
Special thanks to the teams hired by the city council of Tuineje (Fuerteventura) who currently manage the plant, especially Erik Díaz. Special thanks to the teams hired by the city council of Tuineje (Fuerteventura) who currently manage the plant, especially Erik Díaz.
References
- Cisneros-Aguirre J., M. D. Afonso-Correa. Problems of Centralized Depuration Systems. Chapter 3. Sewage Treatement.Sustainable Development. IntechOpen; 2023; pp. 1-30. Book. Available online: http://www.intechopen.com/books/sewage-management (accessed on 17 May 2023).
- Ardern E, Lockett WT. Experiments on the oxidation of sewage without the aid of filters, Part I. Journal of Society Chemical Indigenous. 1914a; 33:523.
- Ardern E, Lockett WT. Experiments on the oxidation of sewage without the aid of filters, Part II. Journal of Society Chemical Indigenous. 1914b; 33:1122.
- Ardern E, Lockett WT. Experiments on the oxidation of sewage without the aid of filters, Part III. Journal of Society Chemical Indigenous. 1915;34:937.
- THirata T, Kawamura K, Sonoki S, Hirata K, Kaneko M, Taguchi K. Clostridium Perfringens, as an indicator microorganism for the evaluation of the effect of wastewater and sludge treatment systems. Water Science Technology. 1991;24:367-372. [CrossRef]
- Tao J et al. Composition of waste sludge from municipal wastewater treatment plant. Procedia Environmental Sciences. 2012;12:964-971.
- Lake DL, Kirk PWW, Lester JN. Heavy metal solids association in sewage sludges. Water Research.1989;23(3):285-291.
- Moreira R, Sousa JP, Canhoto C. Biological testing of a digested sewage sludge and derived composts. Bioresource Technology. 2008;99(17): 8382-8389.
- Adegoke AA, Amoah ID, Stenström TA, Verbyla ME, Mihelcic JR. Epidemiological evidence and health risks associated with agricultural reuse of partially treated and untreated wastewater: A review. Frontiers in Public Health. 2018;6:337. [CrossRef]
- Thompson RC, Swan SH, Moore CJ, Saal FS. Our plastic age. Philosophical Transaction on Royal Society. 2009;364(1526):1973-1976. [CrossRef]
- Deblonde T, Cossu-Leguille C, Hartemann P. Emerging pollutants in wastewater: A review of the literature. International Journal of Hygiene and Environmental Health. 2011;214(6):442-448. Available online: https://www.sciencedirect.com/science/article/pii/S1438463911001325. [CrossRef]
- Zhou Y, Meng J, Zhang M, Chen S, He B, Zhao H, et al. Which type of pollutants need to be controlled with priority in wastewater treatment plants: Traditional or emerging pollutants. Environment International. 2019;131:104982. Available online: https://www.sciencedirect.com/science/article/pii/S0160412019311699. [CrossRef]
- Ivan Muñoz M, Gómez J, Molina-Díaz A, Huijbregts MAJ, Fernández-Alba AR, García-Calvo E. Ranking potential impacts of priority and emerging pollutants in urban wastewater through life cycle impact assessment. Chemosphere. 2008;74(1):37-44. Available online: https://www.sciencedirect.com/science/article/pii/S0045653508011879. [CrossRef]
- Chen Y, Vymazal J, Březinová T, Koželuh M, Kule L, Huang J, et al. Occurrence, removal and environmental risk assessment of pharmaceuticals and personal care products in rural wastewater treatment wetlands. Science of The Total Environment, Volumes. 2016;566-567:1660-1669. Available online: https://www.sciencedirect.com/science/article/pii/S0048969716312426. [CrossRef]
- Hembach N, Alexander J, Hiller C, et al. Dissemination prevention of antibiotic resistant and facultative pathogenic bacteria by ultrafiltration and ozone treatment at an urban wastewater treatment plant. Scientific Reports. 2019;9:12843. [CrossRef]
- Kim S, Aga DS. Potential ecological and human health impacts of antibiotics and antibiotic-resistant Bacteria from wastewater treatment plants. Journal of Toxicology and Environmental Health. 2007;10(8):559-573. [CrossRef]
- Karkman A, Do TT, Walsh F, Virta MPJ. Antibiotic-resistance genes in waste water. Trends in Microbiology. 2018;26(3):220-228. Available online: https://www.sciencedirect.com/science/article/pii/S0966842X1730210X). [CrossRef]
- Rizzo L, Manaia C, Merlin C, Schwartz T, Dagot C, Ploy MC, et al. Urban wastewater treatment plants as hotspots for antibiotic resistant bacteria and genes spread into the environment: A review. Science of the Total Environment. 2013;447:345-360. Available online: https://www.sciencedirect.com/science/article/pii/S0048969713000429. [CrossRef]
- Cisneros-Aguirre, J., Manzanera, M., Bursón, E. (2018). Depuration of Wastewater from Table Olive Industries. In: Kallel, A., Ksibi, M., Ben Dhia, H., Khélifi, N. (eds) Recent Advances in Environmental Science from the Euro-Mediterranean and Surrounding Regions. EMCEI 2017. Advances in Science, Technology & Innovation. Springer, Cham. [CrossRef]
|
Disclaimer/Publisher’s Note: The statements, opinions and data contained in all publications are solely those of the individual author(s) and contributor(s) and not of MDPI and/or the editor(s). MDPI and/or the editor(s) disclaim responsibility for any injury to people or property resulting from any ideas, methods, instructions or products referred to in the content. |
© 2024 by the authors. Licensee MDPI, Basel, Switzerland. This article is an open access article distributed under the terms and conditions of the Creative Commons Attribution (CC BY) license (https://creativecommons.org/licenses/by/4.0/).
