1. Introduction
At present, other developed provinces in China, such as Shanghai and Tianjin, have established cross-departmental joint research centers to carry out scientific exploration of the mutual fusion about medical treatment and meteorology, while in Guizhou province is still in initial stage.According to the latest data and statistics of Guizhou Provincial Center for Disease Control and Prevention(CDC), stroke deaths in Guizhou residents accounted for 23.13% of all deaths, which is higher than the national average. This is directly related to the Guizhou changeable weather in mountainous areas, especially high temperature, high humidity, low atmosphere pressure easy lead to thrombus, while blood pressure dropping and blood flow slowing. More than 80% of stroke can achieve early prevention by controlling risk factors. Through study the relationship between meteorological factors and stroke formation, and combine with the meteorological forecast and early warning, corresponding stroke preventive measures can be taken in advance. For example, pay attention to replenish water and avoid excessive sweating in summer, exercise properly and stimulate blood circulation in winter, thereby reducing the occurrence of stroke.
The outline of the 14th Five-Year Plan (2021-2025) for National Economic and Social Development and the Long-Range Objectives Through the Year 2035 of the People’s Republic of China state that ensuring people’s health should be placed at strategic development location, and adhere to putting the prevention principle first, and implement the Healthy China Initiative thoroughly. In recent years, with the constantly increase of living standards and health conscious, the impact of weather and climate change on people’s health has become common concerns focus of the whole society. “China Stroke Statistics 2019” shows that the mortality rate of stroke in China is 149.49/100000, accounting for 22.3% of the total mortality rate of Chinese residents. At least one of every five dead people died of cerebral stroke, and as many as 13 million patients survived with stroke disease in China. Stroke has become the primary cause of premature death and disease burden. With the increasing incidence and mortality of cerebral stroke, people’s understanding of stroke disease harm has gradually deepened, and discover that the disease incidence has seasonal characteristics.
This study mainly through the way of meteorological and medical interdisciplinary research, conduct researches of cerebral stroke occurrence regularity and early warning model which are based on mountain meteorological factors. It has the very important significance to provide scientific prevention and scientific basis foundation of cerebral stroke in special mountain background for disease prevention and control department. Traditional statistical analysis is often tracking and analysis of a single data source (marketing data, administrative statements, questionnaire survey, population census, etc.).
Analysts have a deep understanding of the data source and structure. In the era of big data, data sources are diverse, naturally formed, and semi-structured or unstructured [
1]. It requires data scientists and analysts to drive a variety of multi-source data, comb and integrate them for data mining and analysis. In this process, data fusion becomes an indispensable step. Owing to different industries and different modes of data collection, resulting in different data structures, the first step to carry out this research is how to integrate different industries data status fusion together and then make corresponding research and analysis. Therefore, it is the most important task to study the data fusion of multi-source gridded meteorological data and cerebral stroke patient data to form the corresponding data set.
2. Backgrounds
Due to the differences in meteorological data and medical data structure, there are sparse and inconsistent in the spatial distribution density of data, and different collection methods, which brings some difficulty in data fusion. In data collection, there are mainly divided into centralized and distributed ways. Centralized data collection is usually based on the data center of the meteorological big data cloud platform. The data is collected and stored in the cloud which is being easy to distribute and dispose. Further more, users are provided with high-quality meteorological data services with the powerful computing and storage capacity of the meteorological big data cloud platform. We make meteorological data with gridded meteorological products and provide services in the cloud, by the use of big data analysis method, the powerful computing and storage capabilities of core nodes and edge nodes [
2,
3]. It is easy to appear follow-up survey medical data island isolation, due to the limitations of user privacy and transmission. Therefore, integrate the meteorological and medical data by the distributed system, making corresponding contributions to the scientific research breakthrough of interdisciplinary data fusion. Laying a scientific data foundation for the project research from studying the spatial and temporal correlation of the cerebral stroke population by ArcGIS through preprocessing meteorological and CDC data. Establish the fusion data set by historical analysis database Gbase in meteorological cloud platform. With the huge number of follow-up population and the shortage of medical staff, many medical institutions have a series of problems, such as imadequate follow-up management mechanism, high follow-up survey cost, difficult follow-up work and low efficiency. Medical follow-up survey data often composed by natural language, which is fully compliance with the characteristics of big data, with a large amount of data, high value and diversified data types. Medical data has very high value, and it is also very private. When provincial CDC staffs carrying on follow-up survey of 12 monitoring points in Guizhou Province, they designed detailed questionnaires, and spend a lot of time to write records for patients, however the valuable data is not well extracted in general.
Therefore, we make corresponding follow-up questionnaires and follow-up plans for targeted patients, to ensure the standardization of follow-up survey and provide a basis for the statistical analysis of follow-up results.
Of course, according to the types and characteristics of patients in different department, we can also customize follow-up rules, set cycles and content. Such as hypertension, diabetes, tumor and other chronic patients, remind discharged patients to take medicine according to the instructions, reasonable diet, healthy exercise, and further consultation with doctor, etc. Meteorological data integrating with medical follow-up survey data, it first needs to analyze and process the data structure. Meteorological and medical follow-up data fusion belongs to multi-source heterogeneous data, which refers to the significant difference in the source of the data. For example, various meteorological elements monitored by meteorological observation stations, meteorological satellites and radars, after transmitted to Guizhou Meteorological Information Center through broadband network, which are stored in the virtual valley database of meteorological big data cloud platform after data decoded. Meteorological gridded data from collected sensor network has strong sequential character, high spatial coverage and high spatiotemporal resolution. Multisource data has significantly different in their spatiotemporal distribution.
Due to the data is not homologous, so the data types is differ in thousands of ways, There are many kinds of meteorological data types, which are divided into structured and unstructured, including: image, video, sound, numerical, text, at the same time, the data quality of multi-source data in the data accuracy, density, data correlation and credibility also exist obvious differences [
4].
In the structure of data, the two kinds of data are also unequal. The data structure of different sources must be different, and obviously exist. There are also data significant differences in the probability distribution, the data density, and the correlation of the properties with in the data.
3. Illustrations
Build cerebral stroke corresponding meteorological elements fusion data set in Gbase historical subject database, and determine the spatial aggregation and temporal correlation of stroke population through ArcGIS, based on the meteorological big data cloud platform of Guizhou Province, which laying a scientific data foundation for interdisciplinary project research. Guizhou provincial Center For Disease Control And Prevention (GZCDC) screened 9280 respondents in Guizhou from 2010 to 2020. According to the preliminary statistics, the number of cerebral stroke illness patients queue in this population was 395 (195 onset cases, 200 no-onset cases), which obtained the data from 12 survey regions (QI XINGGUAN, MEI TAN, HONG HUAGANG, YU PING, SHI BING, FU QUAN, HUA XI, LIU ZHI, JIANHE, DU SHAN, LUO DIAN,CE HENG) of Guizhou Province (
Figure 1) and we extracted the residential address information of these patients, and loaded more than 3,000 meteorological stations of geographical location together into ArcGIS, which sketch out the integrated spatial distribution map. Determine the corresponding meteorology station for each patient case according to the principle of proximity, and extract the onset time information of the patient cases, further targeted to 1 week before onset time of the cerebral stroke population based on the results of spatiotemporal distribution [
11]. Retrieval out the specific elements data of meteorological station corresponding to each patient case in the week before the onset including: (Mean Daily Temperature, Air Temperature Daily Variation Amplitude, Daily Maximum (Minimum) temperature, Daily Maximum (Minimum) Relative Humidity, Daily Maximum (Minimum) atmospheric pressure, Daily Average Vapor Pressure, Daily Maximum (Minimum) Precipitation, Daily Average Sunshine Time, Daily Maximum (Minimum) Wind Speed, etc.).
The graph uses GIS technology to explore the spatial layout characteristics of stroke population data in 12 monitoring points in Guizhou Province, combining geographic information system and spatial point model research methods [
12], and analyzing the spatial distribution characteristics and spatial point patterns of cases in stroke samples. Using the data vectoring tool of ArcGIS to draw the spatial location data of stroke cases about layout point map of stroke population [
13].
3.1. Multi-Source Gridded Meteorological Data
Improving the ability of precise meteorological monitoring, forecasting accurately and service refined, in order to achieve the strategic goal of realizing high-quality meteorological development and building a powerful meteorological country. The meteorological department has built and deployed the meteorological big data cloud platform “Tianqing”, and built a data-centered “cloud + terminal” business technology regime. Multi-source meteorological grid service which provides various comprehensive and accurate integrating data resources for meteorological forecast and services. In order to provide better meteorological services for decision, it is necessary to build standardized basic data set of earth climate system with multi-layer and long sequence and construct meteorological data product system with advanced technology, reliable quality and complete categories. Integrating various observation results, providing real meteorological information at any location to develop multi-source meteorological grid fusion data service, which are the basis of strengthening accurate forecasting and the demand enhancing data management [
5]. Meteorological data is divided into two categories according to the production mode. The first kind is the raw data, which refers to the meteorological data original records obtained from observation monitoring, investigation, scientific research and experimental development, as well as the format change, quality control, data interpolation, unit conversion, measurement transformation, statistical calculation, compilation.
The second class is the product data, which refers to the original data through inversion, gridding, fusion, systematization, simulate calculation, visualization and other processing, obtaining the inversion product, fusion product, reanalysis product [
6]. Our meteorological data uses the multi-source fact analysis technology to calculate the corresponding gridded value.
3.2. Medical Data Cleaning
The collected patient data provided by Chronic Disease Department of Guizhou CDC, data is based on 2010 natural population-based cohort baseline survey study, which take stratified cluster sampling (multi-stage cluster random sampling) method of 12 counties (city, area), 9280 residents which aged at 18, and conduct follow-up of grassroots medical institutions in 2016-2020, wherein cerebral stroke diagnosis of 395 people, median survival time after 6.50 years.
The nearly 400 cases of stroke cerebral patients baseline cross-sectional study survey data, which in the form of questionnaire survey contains more than 1000 columns information, including: basic situation (age, gender, residence), medical insurance, stroke morbidity situation, smoking, diet, drinking, exercise, stroke related diseases (blood pressure, blood sugar, coronary heart disease), and so on. Until the end of follow-up, all respondents signed informed consent by Guizhou Provincial Centers of Disease Control and Prevention approving (number: S2017~02).
Figure 2.
Medical Data Cleaning.
Figure 2.
Medical Data Cleaning.
According to the research needs of this project, we extracted 405 survey factors from this data as the correlation dependence analysis, and sorted statistical data about specific time and place of the onset stroke patients in 395 cases. At the same time, according to the above-mentioned data matched 395 non-stroke patients in the baseline survey cohort. By confirming the date and location of onset stroke patients, we associated with the corresponding meteorological elements forming data set by cleaning and merging, and imported the data set into the Gbase database on meterological cloud platform.
4. Data Fusion Based on Gbase Database
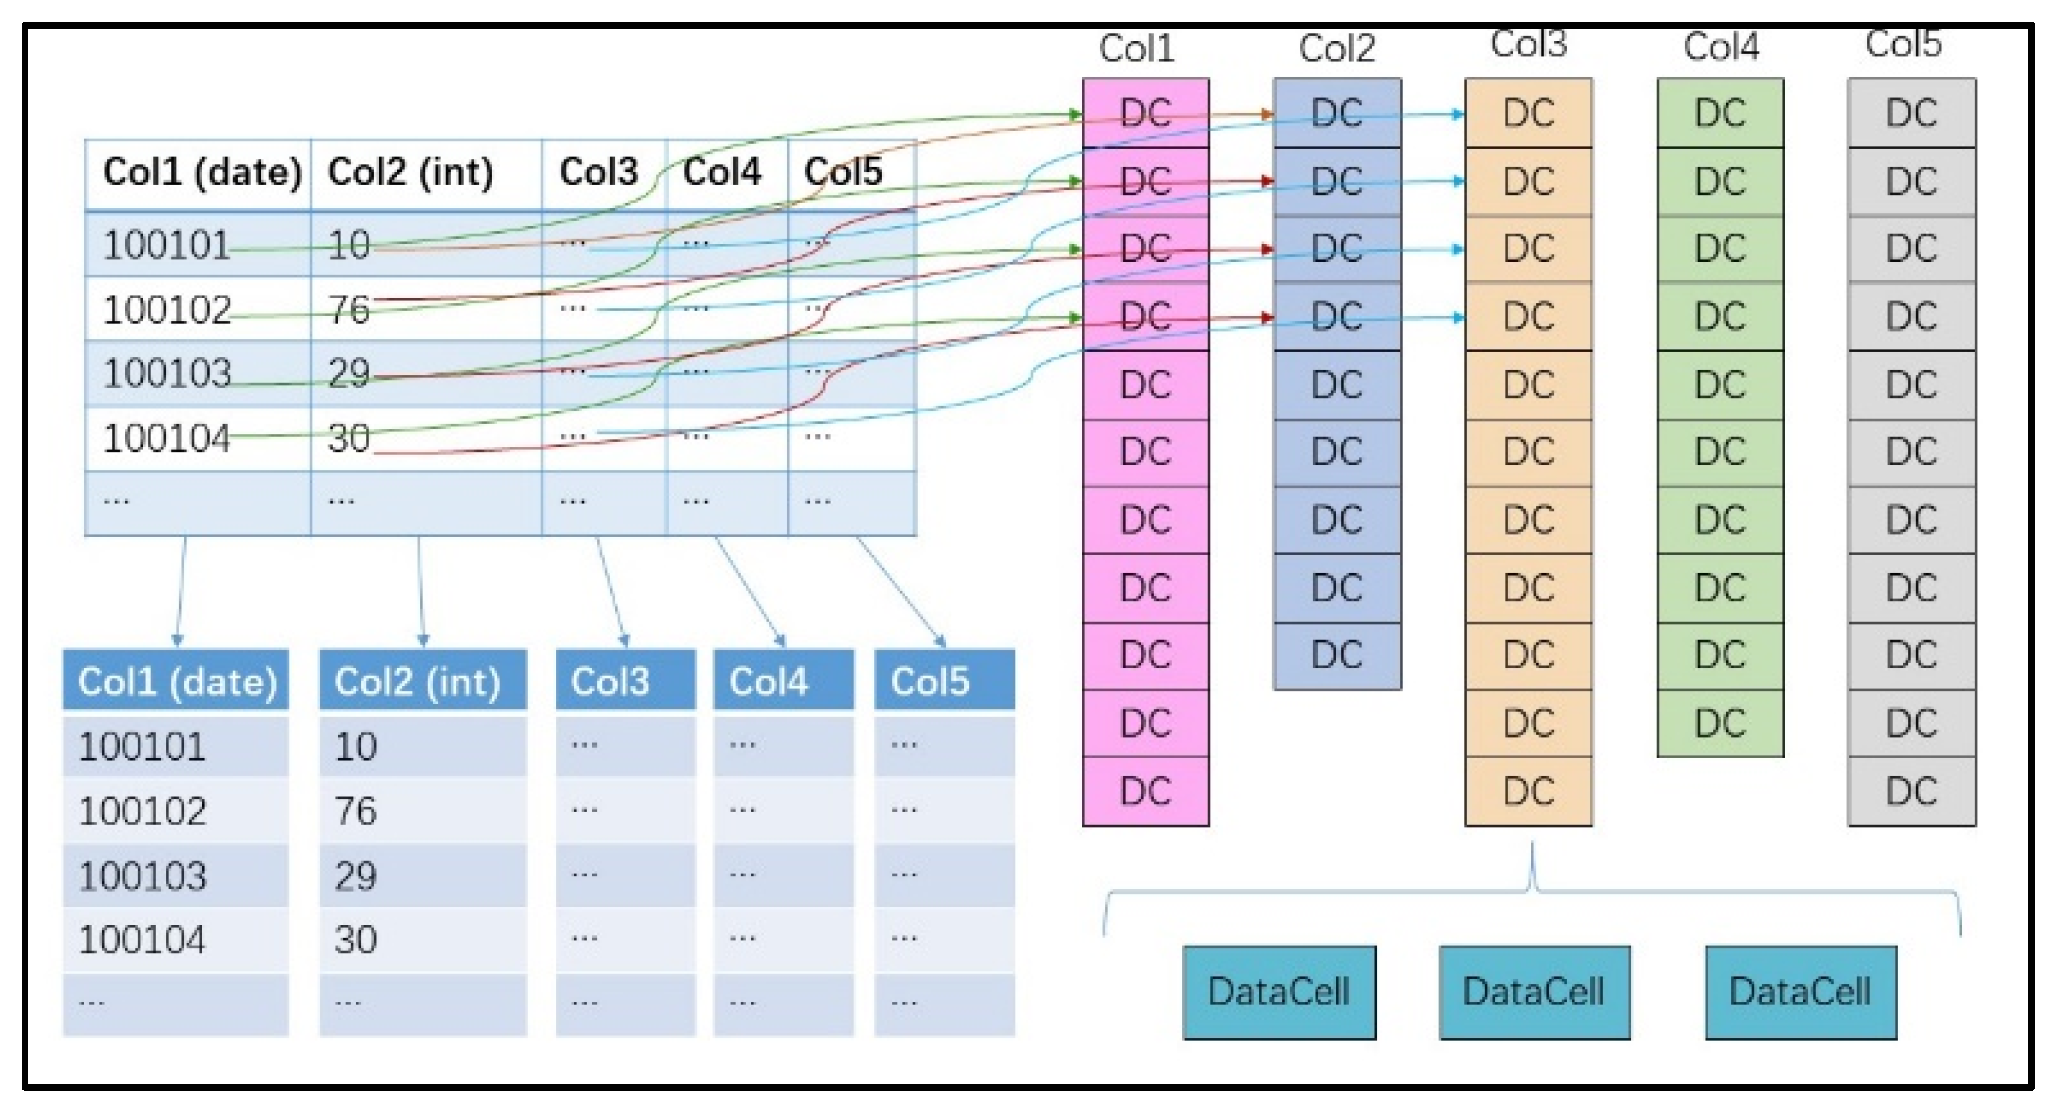
“Tianqing” big data cloud platform used GBase 8a distributed and storage database cluster system as meteorological data platform historical analysis database, which can provide large-scale data fusion and data management high cost-effective computation with high performance, high availability, of data warehouse system, BI system and decision support system.
GBase 8a internally installed data compression algorithms to achieve high compression ratio storage based on a column of the same type of data. High compression ratio save storage investment and power loss for massive meteorological data, and compressed state data reduces data processing disk IO greatly.
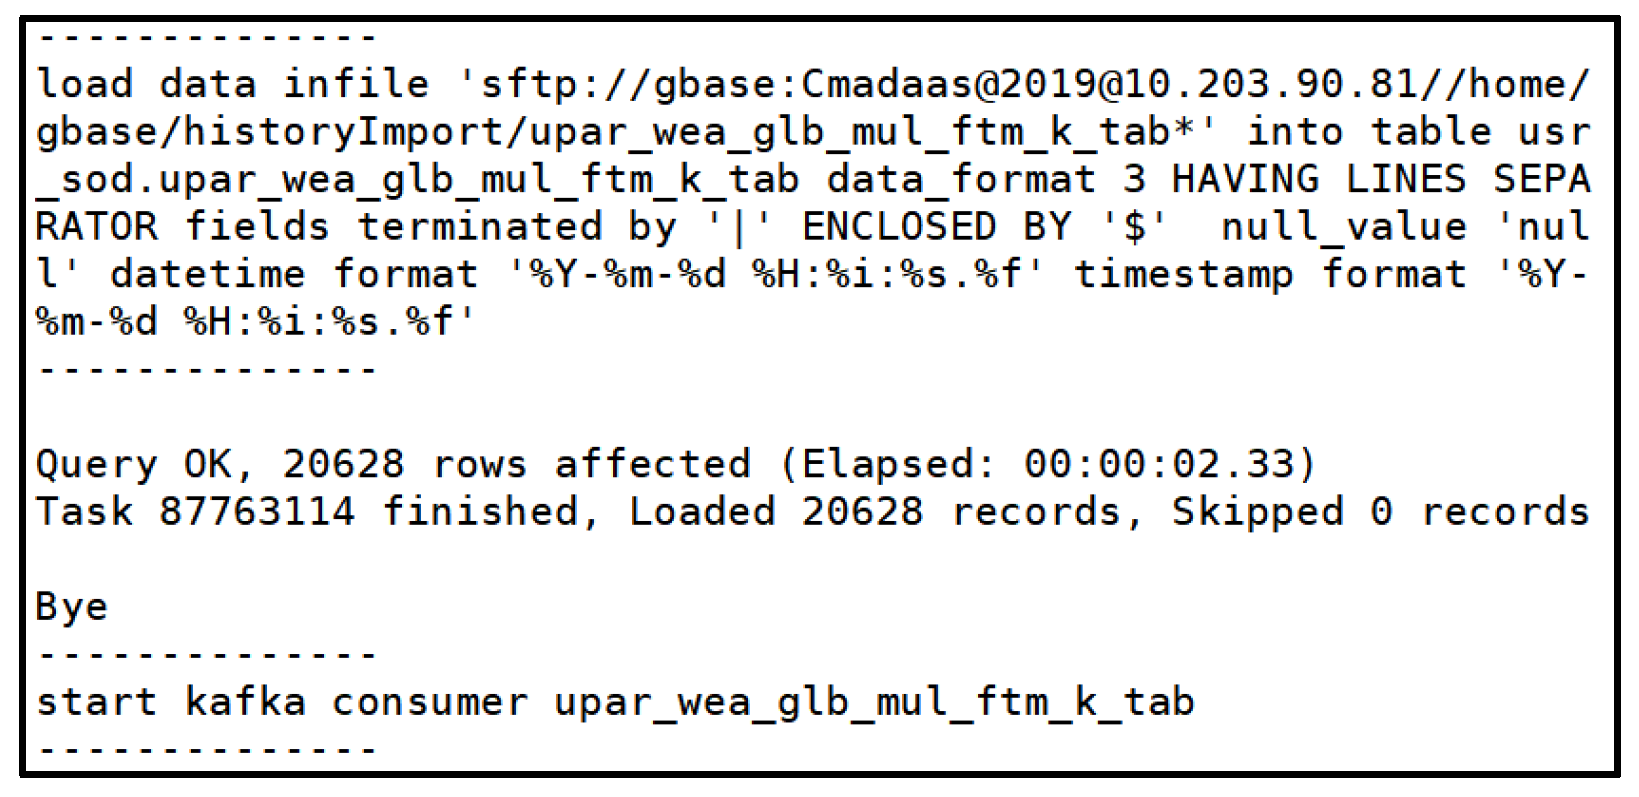
According to the characteristics of GBase 8a high compression and rapid loading, the historical data of the service library is loaded into the historical analysis library at high speed. Through the consumption function to consumer the message sequence in kafka, and complete the pool buffer database data synchronized into the historical analysis library [
7]. According to the characteristics of distributed computing of meteorological big data historical analysis database, long time series data can support the demand for data service and analysis of climate monitoring, prediction and decision service by storing the gridded historical meteorological data.
Figure 3.
Column Family Storage.
Figure 3.
Column Family Storage.
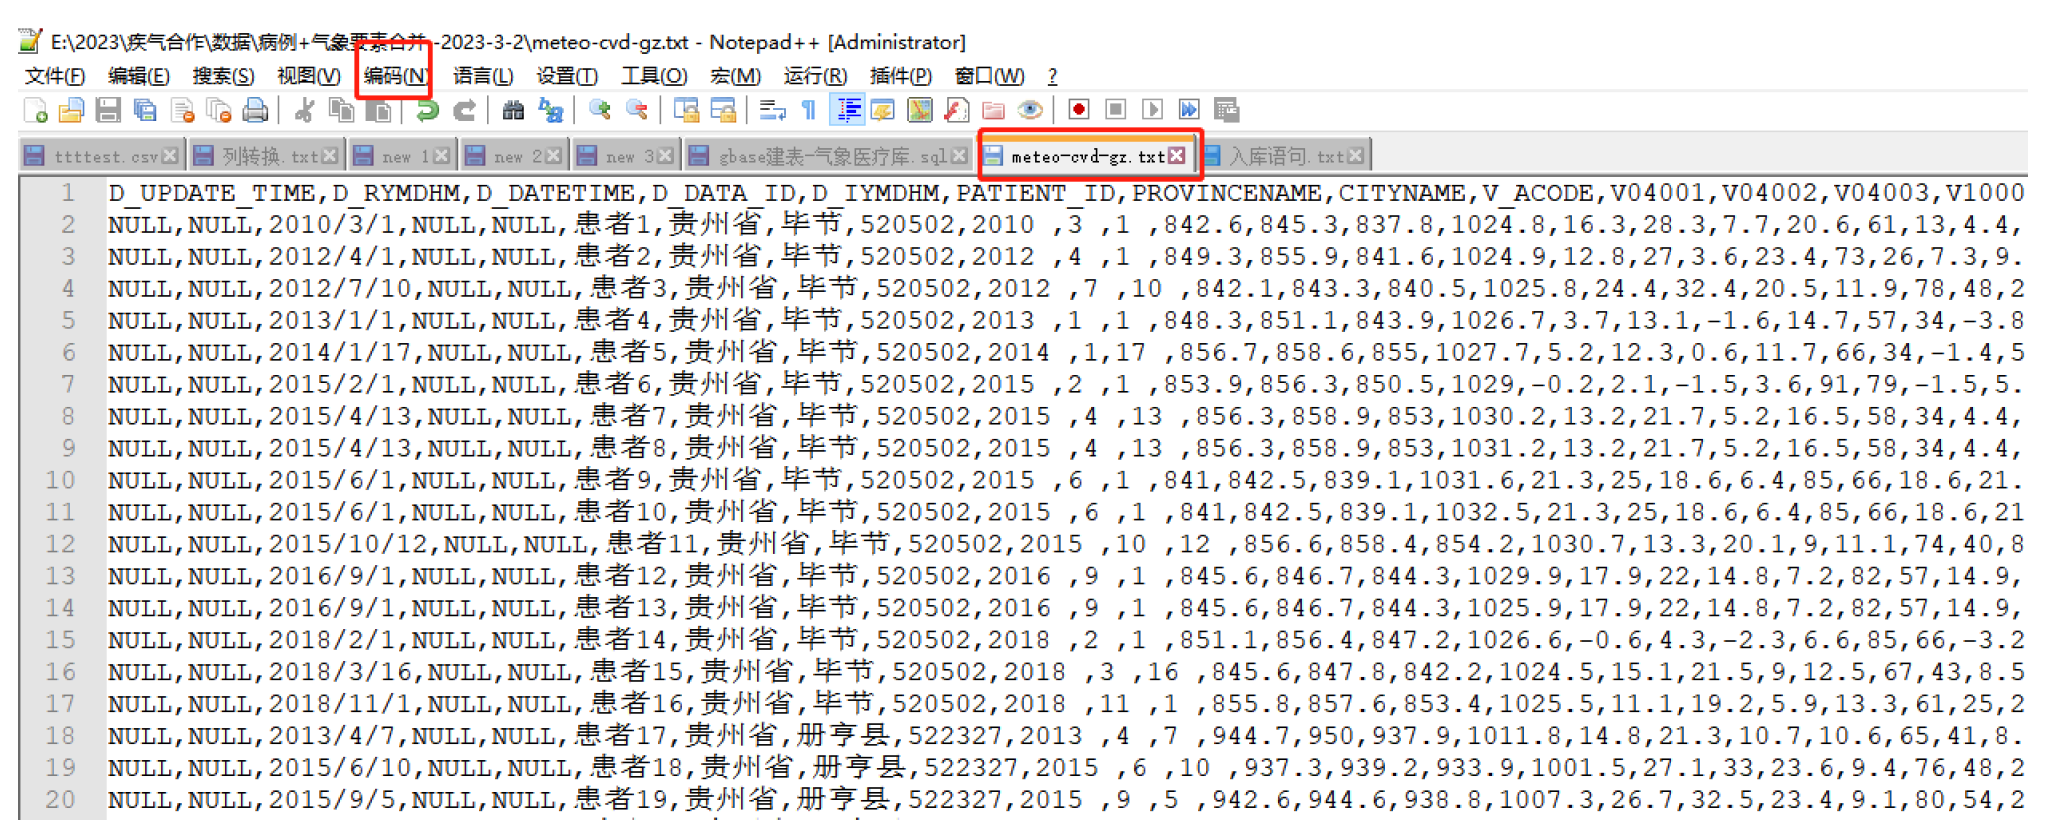
Establish the fusion dataset based on the historical analysis database of meteorological big data cloud platform Gbase by matching 395stroke cerebral patient cases (year 2010-2020) with corresponding meteorological elements. Preprocess meteorological and CDC fusion dataset through ArcGIS, and determine the spatial aggregation and temporal correlation of stroke cerebral population, laying a scientific data foundation for the project research. Design the corresponding database field according to the fusion dataset content, and build table in wide-column database Gbase. Write in respectively the corresponding meteorological elements data (D1) and screening of cerebral stroke population case data (D2). Establish associate view to form meteorological elements and stroke patient cases fusion data set (D3).
4.1. Data Fusion on Gbase
Sorted out the onset date and location of cerebral stroke population of Guizhou CDC, and processed the private data of the patients. Search the quality control multi-source gridded meteorological elements daily data according to the onset corresponding date and location of data set patients. Merge the two kinds of data to form a medical and meteorological fusion data set. According to the corresponding meaning of the existing data, combined with the database fields defined by the logical structure of the database table of “Tianqing” Big Data Cloud platform.
Figure 4.
Load Data to Gbase..
Figure 4.
Load Data to Gbase..
- ➢
loaddata gccli -ugbase -pgbase20110531
- ➢
load data infile ‘sftp://gbase:Cmadaas@2019@10.203.90.81/home/gbase/meteo-cvd-gz.txt.txt’ into table usr_gx.meteo_cvb_gz_tab data_format 3 fields terminated by ‘,’ null_value ‘NULL’ datetime format ‘%Y/%m/%d’ timestamp format ‘%Y/%m/%d’;
Figure 5.
Dataset Fusion.
Figure 5.
Dataset Fusion.
4.2. Dataset Fetch from “Tianqing” Big Data Platform
The integrated meteorological stroke data set is stored in the historical analysis database of “Tianqing” system, in order to facilitate the query and research analysis of project team members. We carry the corresponding data and publish the data set through the unified data environment interface on the meteorological big data cloud platform “Tianqing” (CMADaas).The meteorological big data cloud platform “Tianqing” (CMADaas) has designed a new storage technology, which upgrade function and expand the service version of the China Integrated Meteorological Information Service System(CIMISS) [
8,
9,
10]. “Tianqing” platform is not only fully inherits CIMISS specifications, data types and interface service standards, but also significantly improves data quality, data storage time series, data processing efficiency and other aspects [
14]. Meteorological data service interface provide the national unified, standard and rich data access service and application programming interface (API) for meteorological business and scientific research on “Tianqing” plarform (CMADaas), which provides the only authority data access service for application systems at national, provincial [
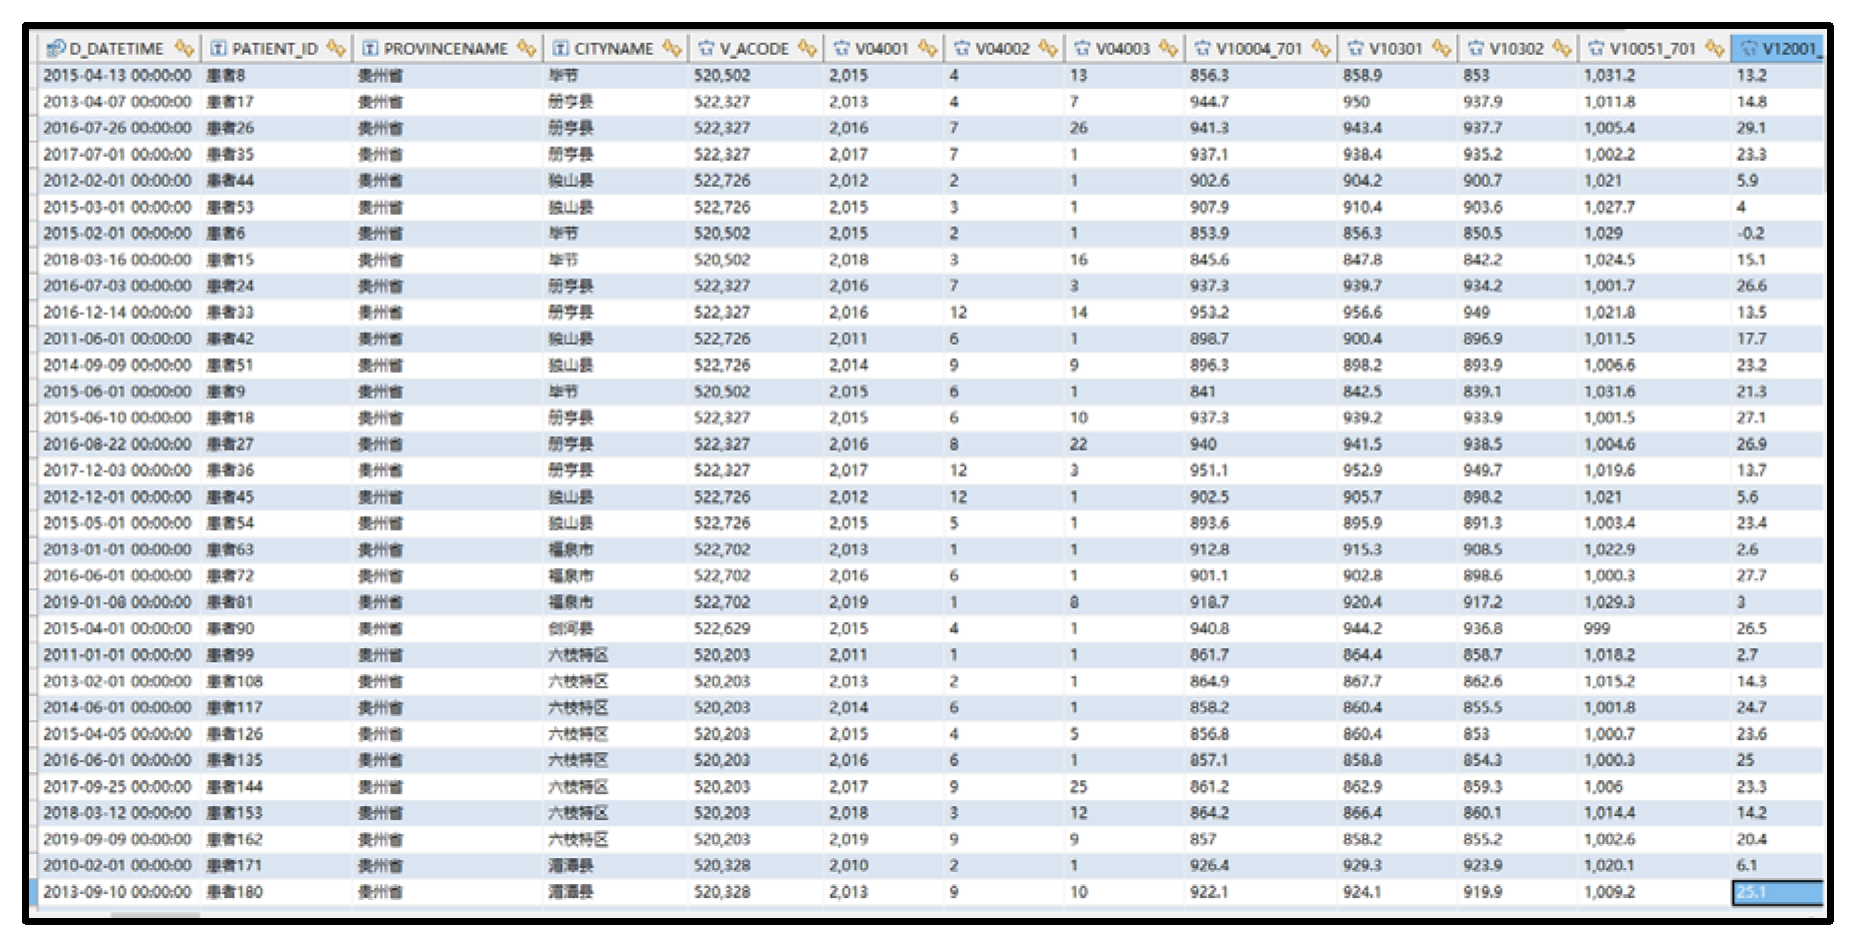
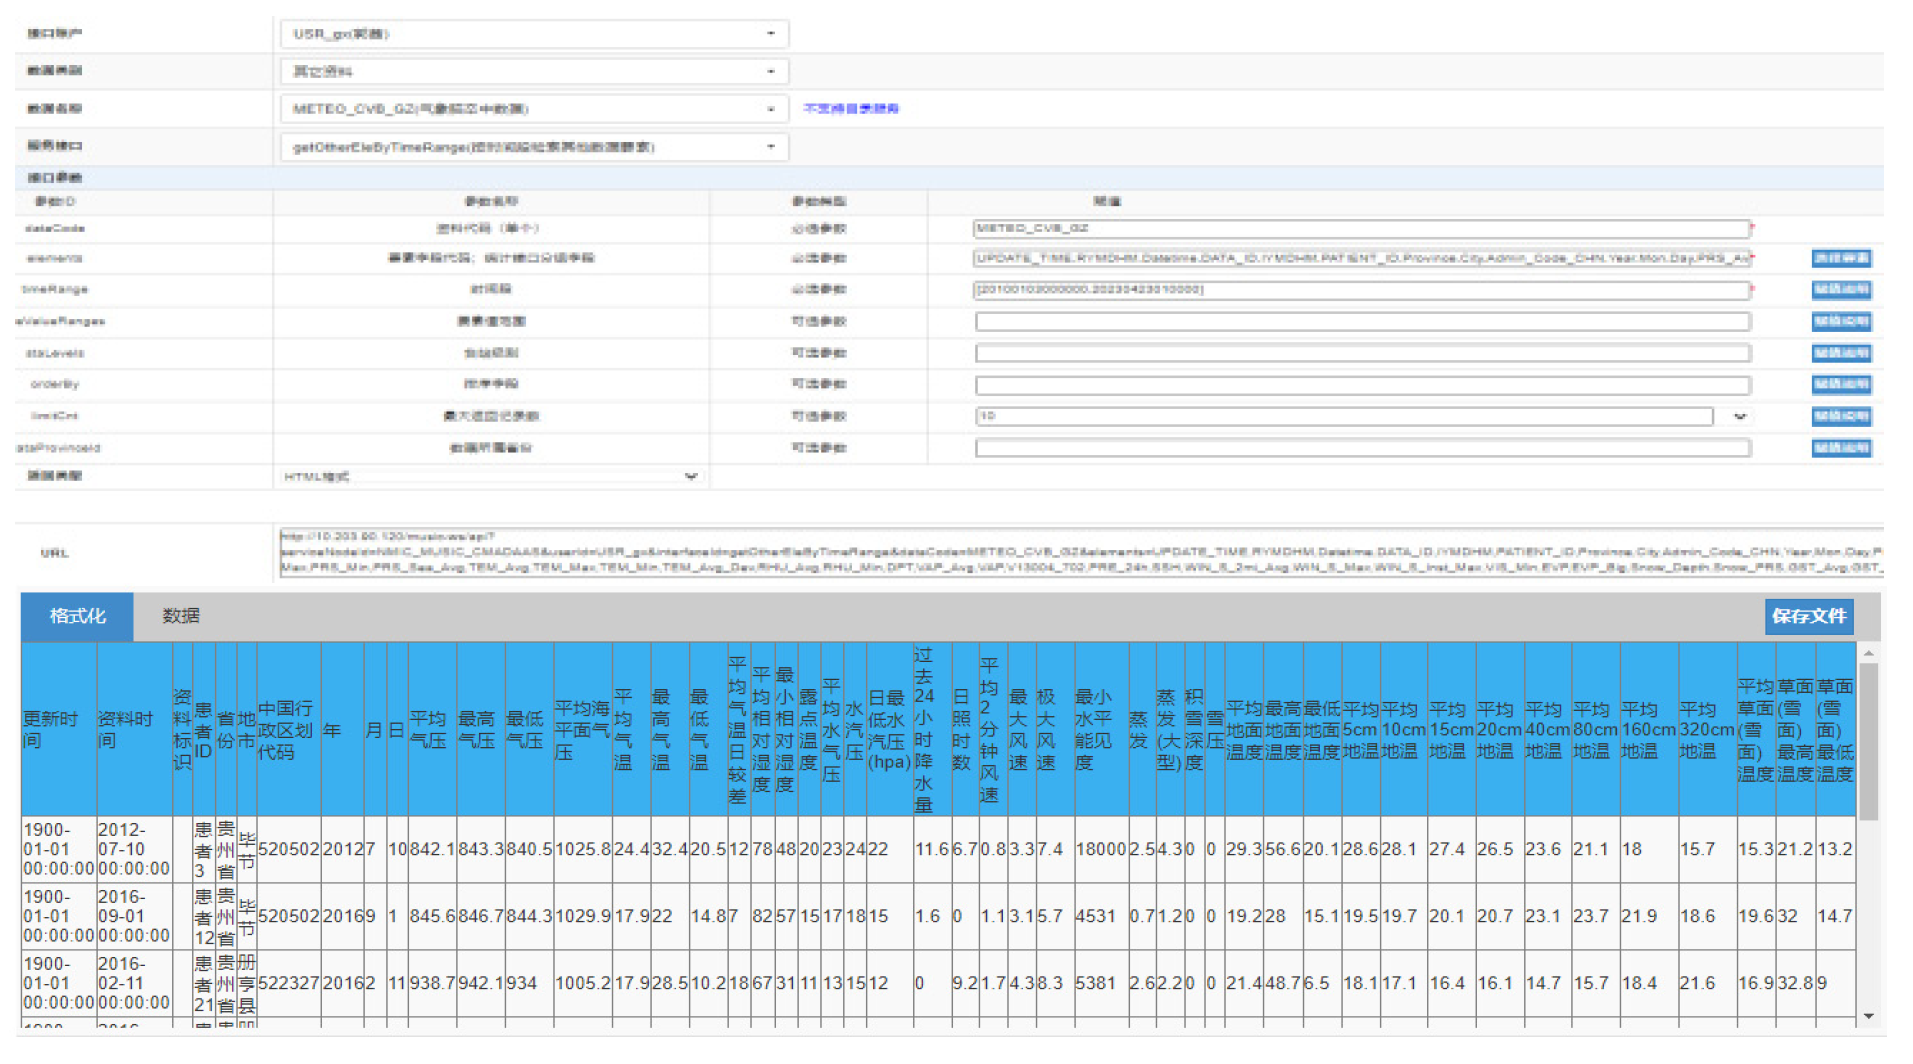
15], local and county levels, and provides the registration and release of mass innovation interfaces. The management of the open data service interface. Project researchers can view the “meteorological stroke” fusion data set stored in the “Tianqing” history analysis database through the interface of the meteorological big data platform [
16].
Figure 6.
MUSIC Interface Read Fusion Dataset.
Figure 6.
MUSIC Interface Read Fusion Dataset.
5. Data Processing and Correlation Analysis
5.1. Feature Evaluation
When applying machine learning, deep learning algorithms to solve practical problems in specific fields, the data collected in actual scenarios often has problems such as outliers, missing values, and inconsistent format [
20], which cannot be directly input into the model as parameters, therefore, the data needs to be preprocessed. It is necessary to conduct a correlation analysis on the data and comprehend the distribution of the data after completing the data preprocessing, which is in order to lay the foundation for model construction [
21].
- (1)
Datasets Introduce
On the basis of the above research results, the data sets used in this study include stroke cases provided by the Guizhou CDC from 2010 to 2020, which covering the key information such as gender, age, time of onset and diagnosis time, and the daily meteorological data from Guizhou meteorological institution, including daily temperature, air pressure, humidity, water pressure, wind speed, cloud cover, visibility, surface temperature, etc.
- (2)
Data Preprocessing
The study uses Pandas process data, which is an open source Python data processing library, providing efficient data structure and data analysis tools. Reading tabular data into DataFrame form is the first step [
22]. DataFrame represents a matrix data table, which containing the sorted columns set. Each column can be a different value type stored in two-dimensional blocks in DataFrame, which has both row index and column index.Tabular data was read by Pandas parsing function
read_excel() from Excel XLS file. Finally, Pandas
concat() function are used to integrate the stroke cases data and meteorological data separately and stack them on the axis in order to complete the merging of the data [
23].
In the process of data acquisition, due to machine input errors or manual errors which lead the original data missing or wrong records, so the data cleaning needs to be done before standardize the data. For meteorological data, there are some missing values of meteorological indicators, such as the daily average sea level pressure and the daily lowest water pressure, etc [
24]. Mean filling method is adopted with Pandas
fillna() method used to complete the missing values, and it is filled as the average value of the meteorological index in the month. In addition, a few uncommonly used meteorological features, such as daily snow depth and 10cm daily average surface temperature exsit situation which missing the whole column [
25,
26,
27]. We replace them with the Numpy null format to facilitate subsequent processing. Because the date format in the data set is not uniform, including year / month / day, year-month-day, day / month / year, etc, these cases are handled by writing programs, and use the
to_datetime() function of Pandas to convert the date into datetime format to facilitate subsequent processing. For some cases where data has a problematic data type after reading as a DataFrame object, use the
astype() function to convert it to the corresponding type, such as int, float, etc. After completing the data cleaning, the case data and the meteorological data need to be correlated in order to build the dataset of the experiment. Here, the date of onset is taken as the associated field, and the
merge() function of Pandas is used to connect with the date of onset as the key. The left-join is used to complete the data fusion of meteorological data and case data. Finally, the data set needs to be labeled, with the labeled logic such as Formula (5-1).
As shown, the label represents incidence rate,
dc represents for number of incidence on one day, and
yc represents the total annual incidence in the current year [
28]. The
groupby() function of Pandas is utilized to categorize according to year and date, and the
count() function is used to calculate the total number of annual incidence cases and the number of daily cases respectively, according to Formula (1), so as to label each sample.
5.2. Visualization of Data
In our study, considering the research kernel is association between meteorological factors and stroke onset, therefore, after completing the pretreatment of the data and aim to exhibit the analysis results more clearly and intuitively through visual analysis of the data [
29]. It is conductive to better understand the distribution, trends, outliers and other information of the data, and then to estimate the potential relationship of the data [
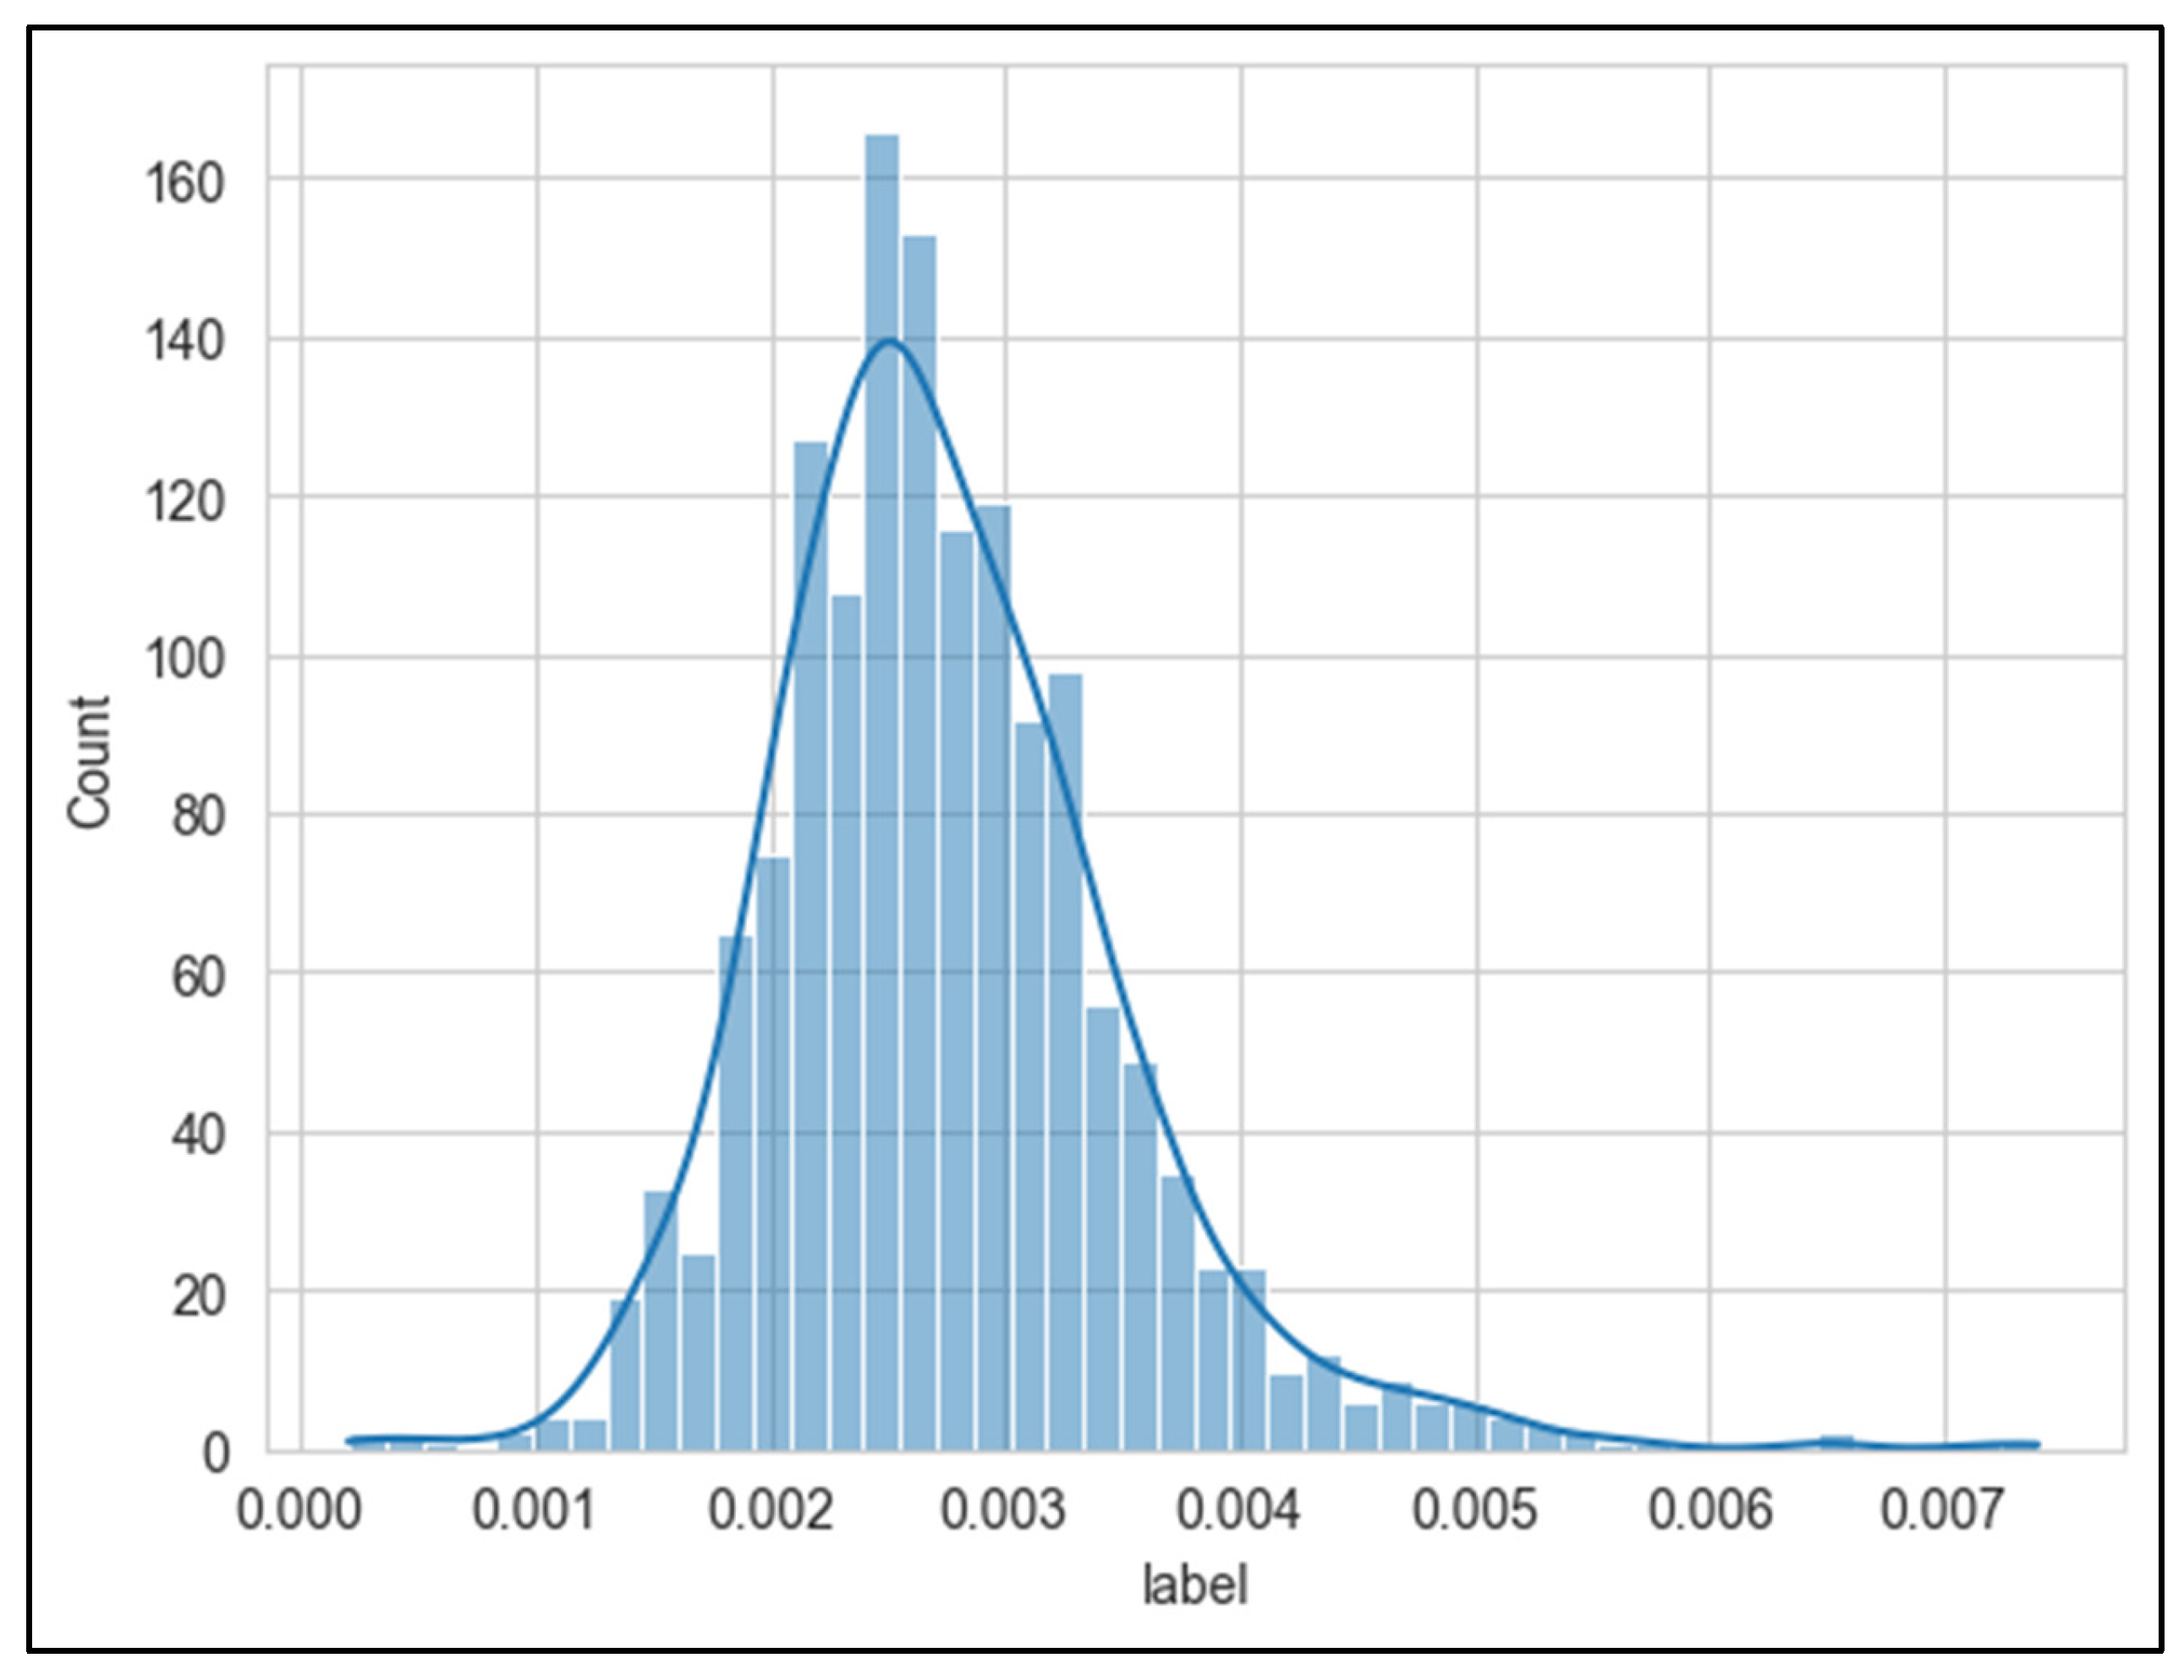
30]. According to the labeling logic of this study, in this paper, we performed a statistical work of the data incidence rate range, and the number of days included in each incidence rate, as shown in
Figure 7. As shown from the figure, the distribution of the incidence rate basically conforms to the normal distribution.
Figure 7.
The distribution of days included in the incidence rate.
Figure 7.
The distribution of days included in the incidence rate.
For the research of association between meteorological factors and stroke incidence rate, we performed a statistical fusion data of 2010-2020 about stroke incidence ratee and meteorological factors respectively, for instance, concerning the mean (Mean), maximum (Max), minimum (Min), median (Median), standard deviation (Std). In this paper, the fields in the table contents are as follows: “Unit” represents unit, “Label” represents stroke incidence rate, “aver_rh” represents the daily average relative humidity, “aver_pres” represents the daily average air pressure, “aver_temp” represents the daily average temperature, “high_pres” represents the daily maximum air pressure, “high_temp” represents the daily maximum temperature, “low_pres” represents the daily minimum air pressure, “low_temp” represents the daily minimum temperature, “min_ rh” represents the daily minimum relative humidity, “diff_temp” represents the daily maximum temperature difference, “diff _pres” represents the daily maximum air pressure difference, as shown in
Table 1.
5.3. Results and Discussion
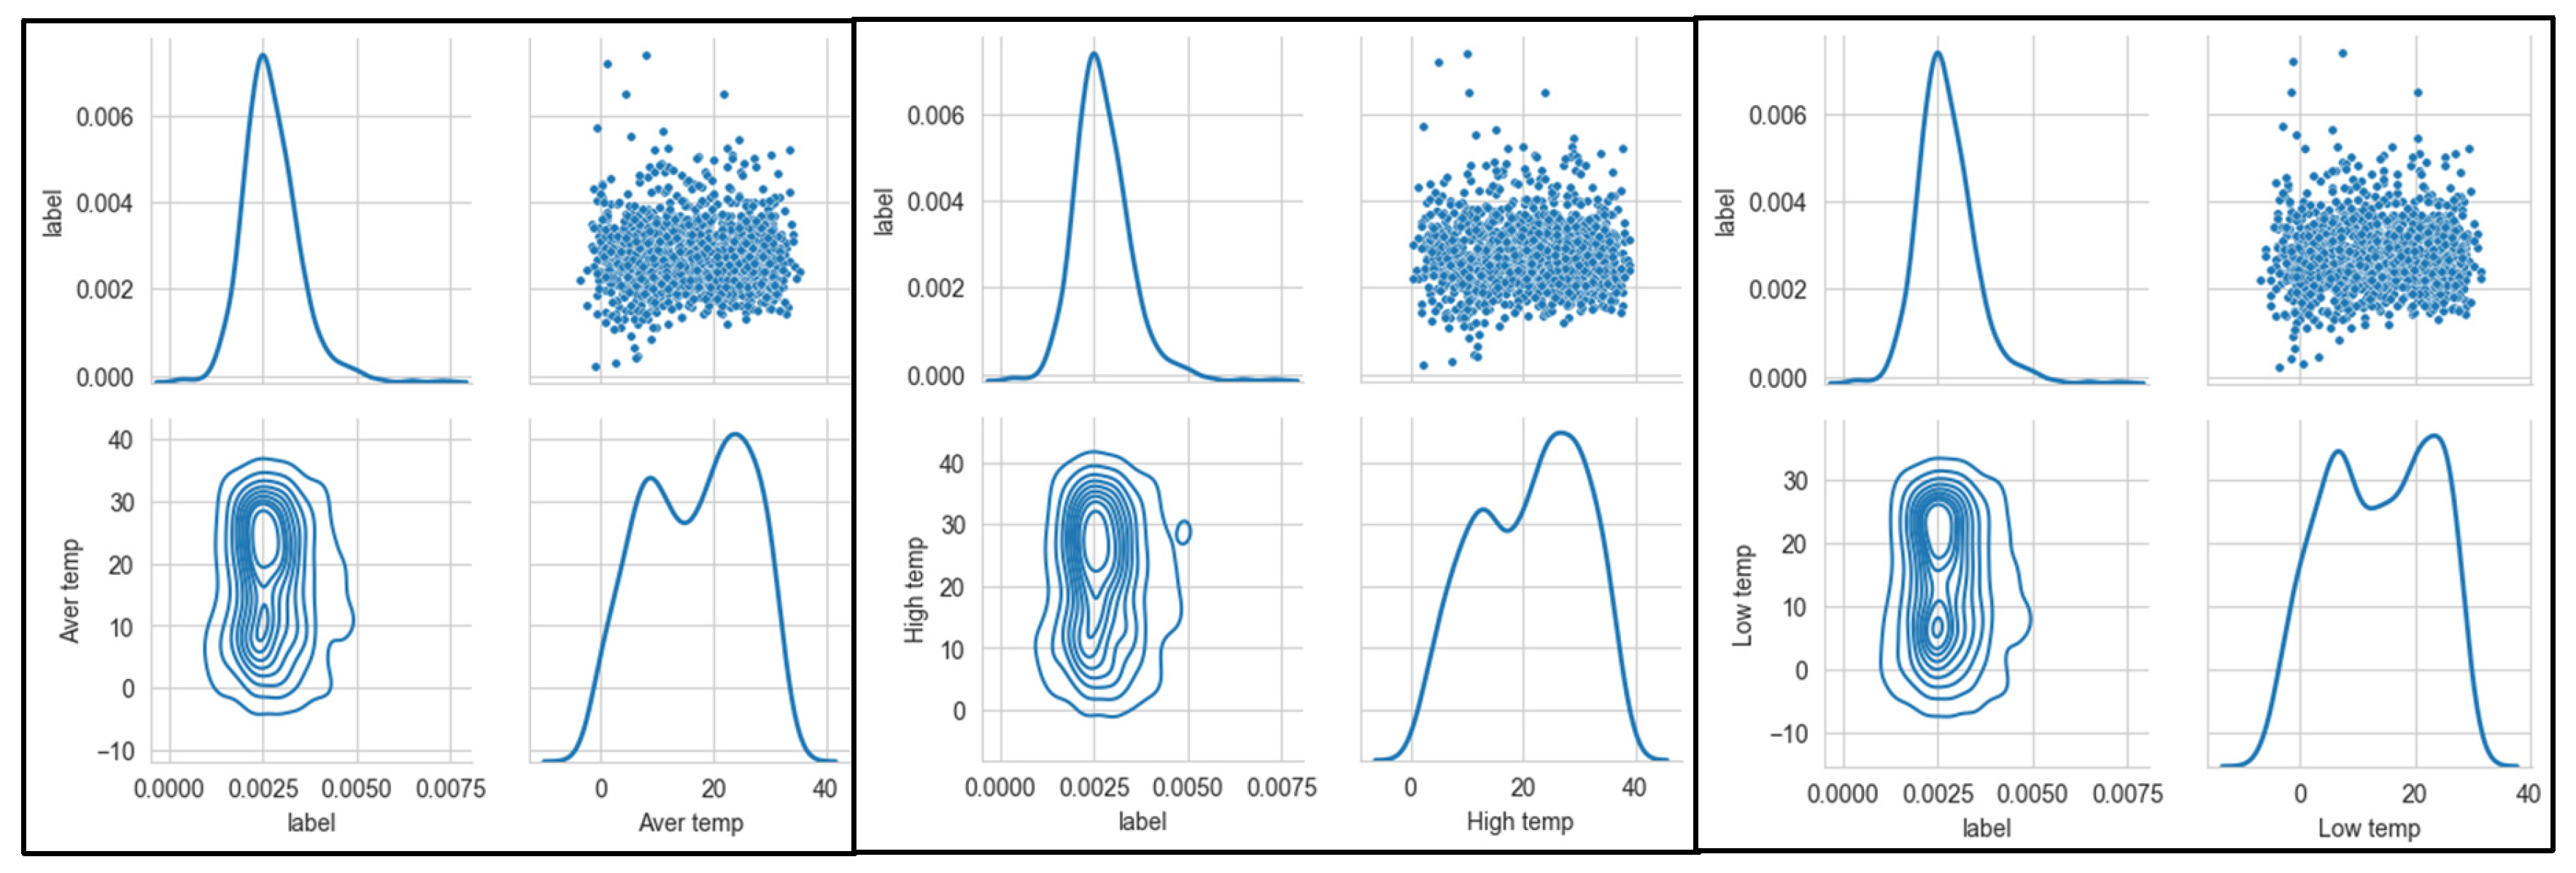
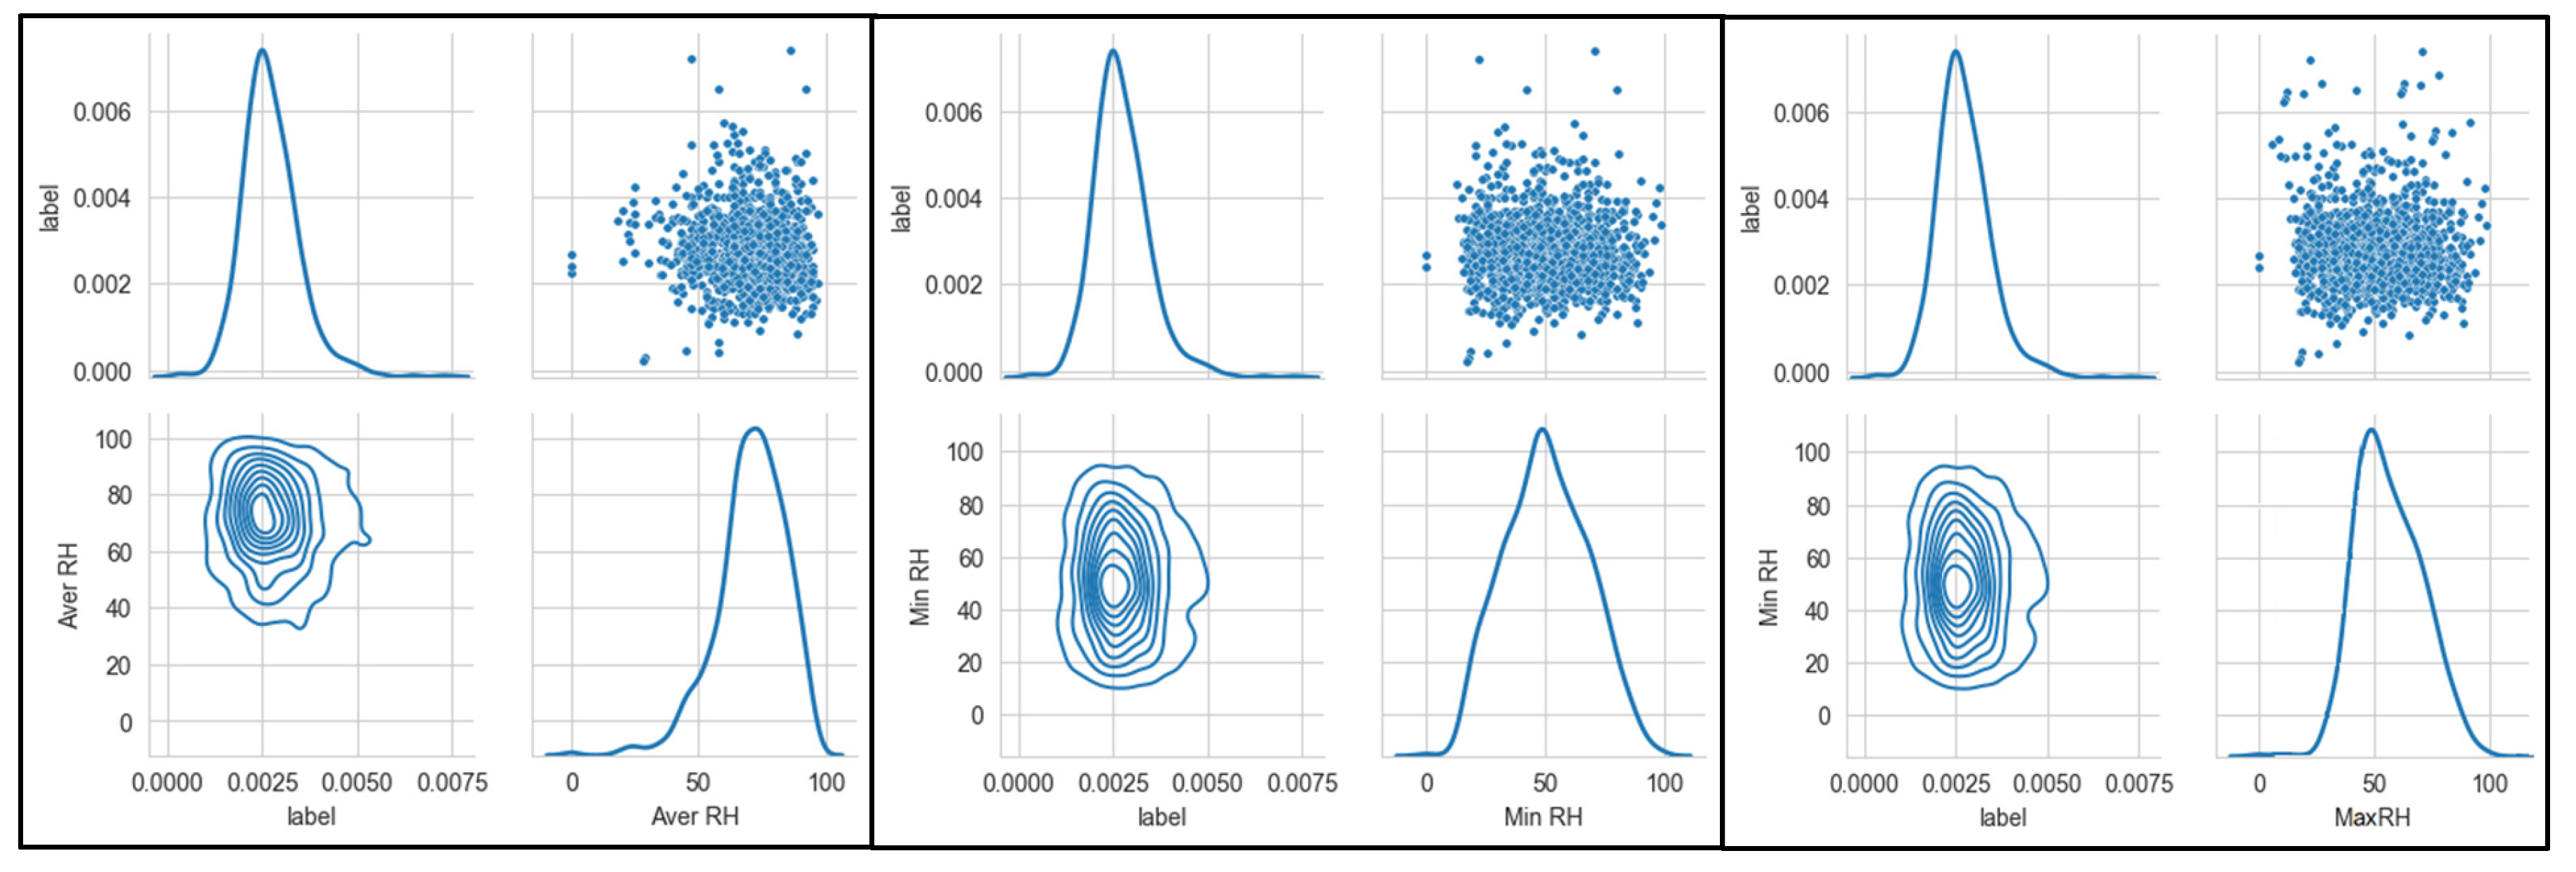
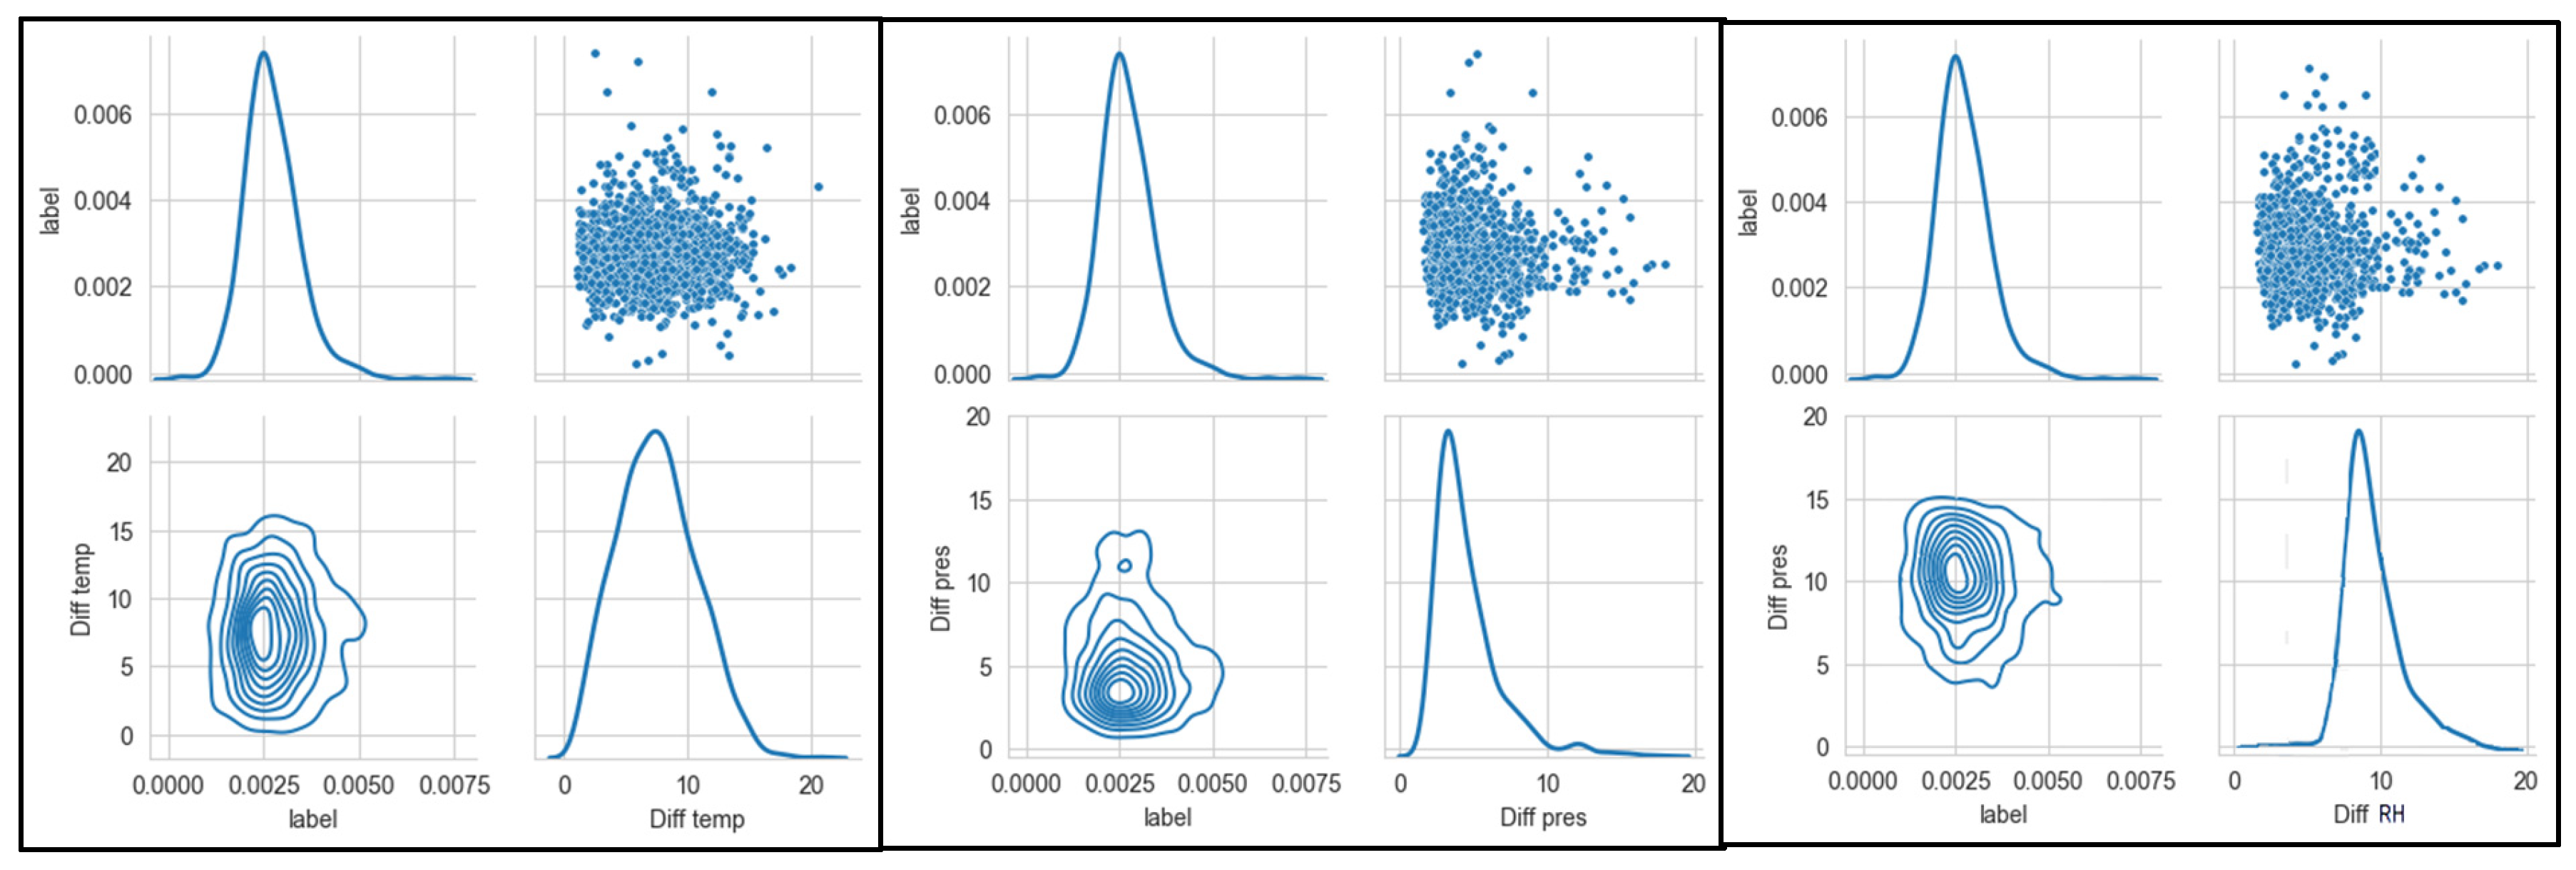
In order to explore the relationship between the incidence stroke and various meteorological indicators, utlizing the Seaborn
PairGrid() function, which is used to explore the linear or nonlinear relationship among multiple factors, and the interaction between the variables. Joint Distribution is a method visualization between two or two variables, often need to use in data analysis, an excellent joint distribution can make our data analysis more visibility at the moment. As shown in
Figure 8,
Figure 9,
Figure 10 and
Figure 11. Seaborn is used to realize the drawing of the joint distribution map, which is a Python data visualization module based on matplotlib, drawing all kinds of moving pictures. The influence of each meteorological feature on the incidence rate can be intuitively seen from the distribution map. In addition, regarding the distribution of each meteorological feature is basically in line with the normal distribution with no long-tail distribution, therefore, not any special treatment is necessary.
Figure 11 shows the stroke incidence rate is directly proportional to the daily temperature difference. The value range of the difference between daily air pressure is between 0 and 20 degrees Celsius. It is seen that, as the value of the daily temperature difference exhibits variation larger, the incidence rate is gradually increasing. From the PairGrid relationship chart between stroke incidence and meteorological factors, it can be seen that daily highest air temperature, daily lower air pressure difference and daily lower air temperature difference are mainly attributed to the high correlation of meteorological factors. The correlation coefficient is positive and negative with the variable temperature and pressure, which indicating that both the temperature reduction and the temperature-rise period cause an increase in the incidence of stroke.
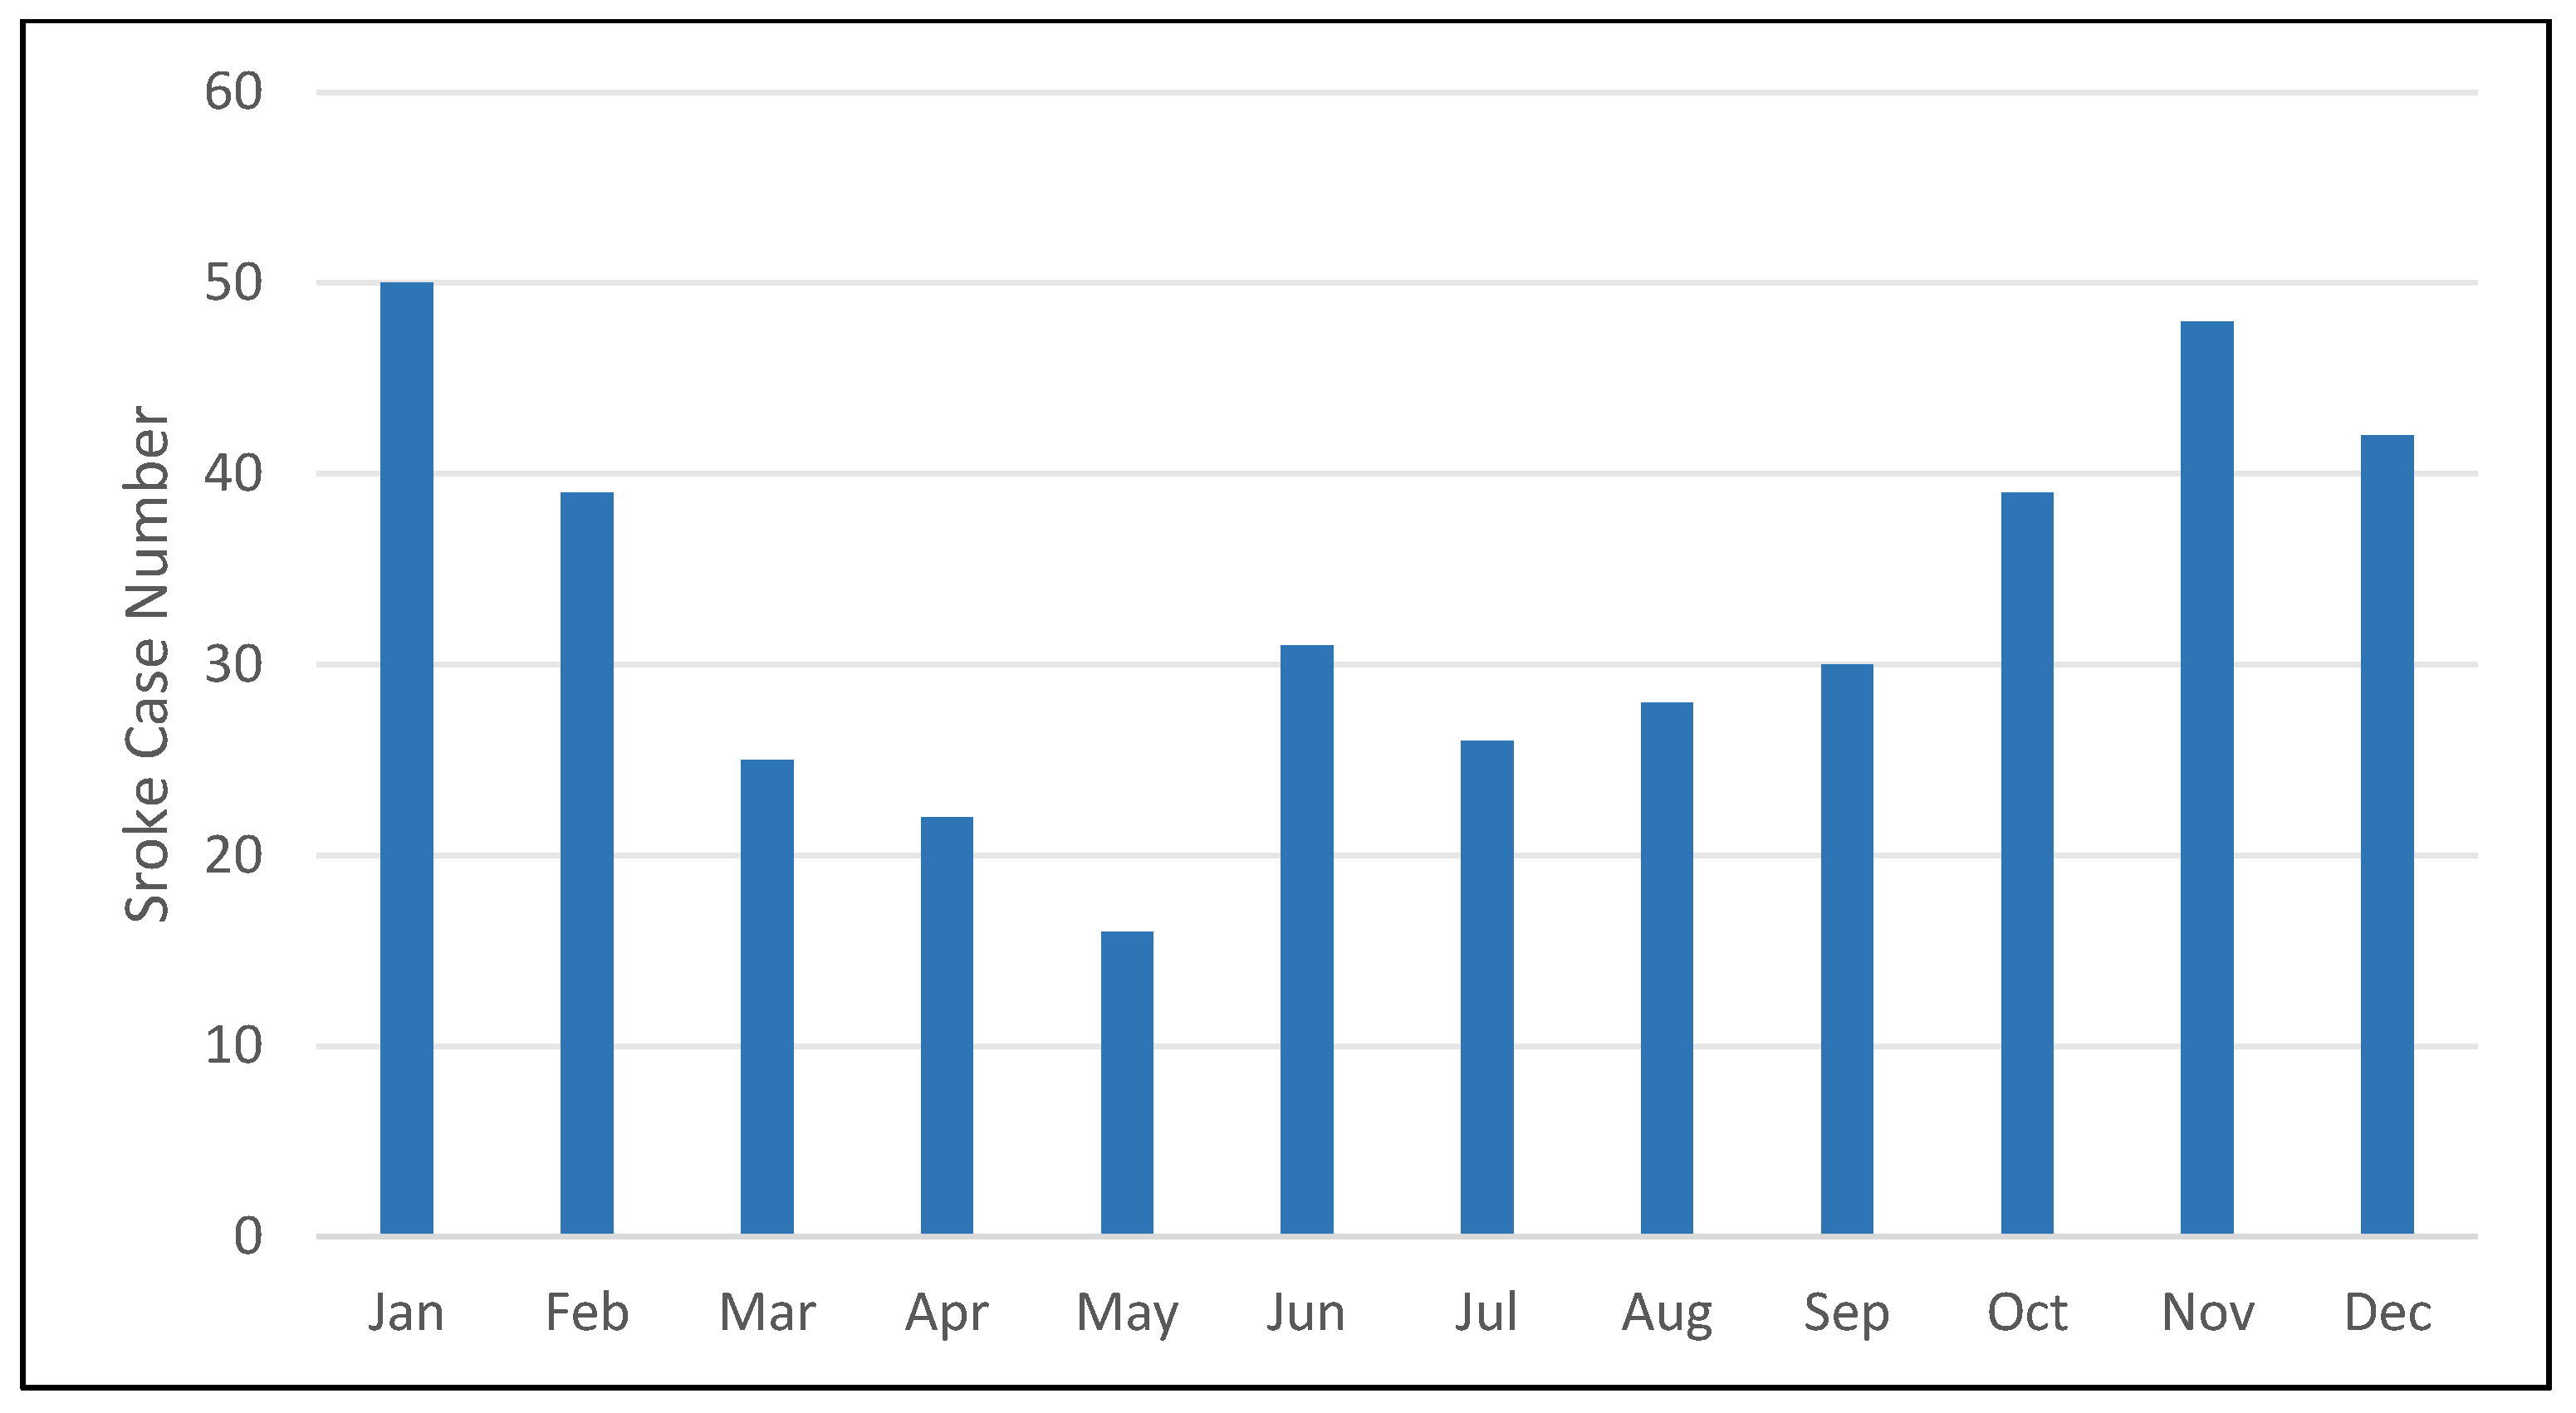
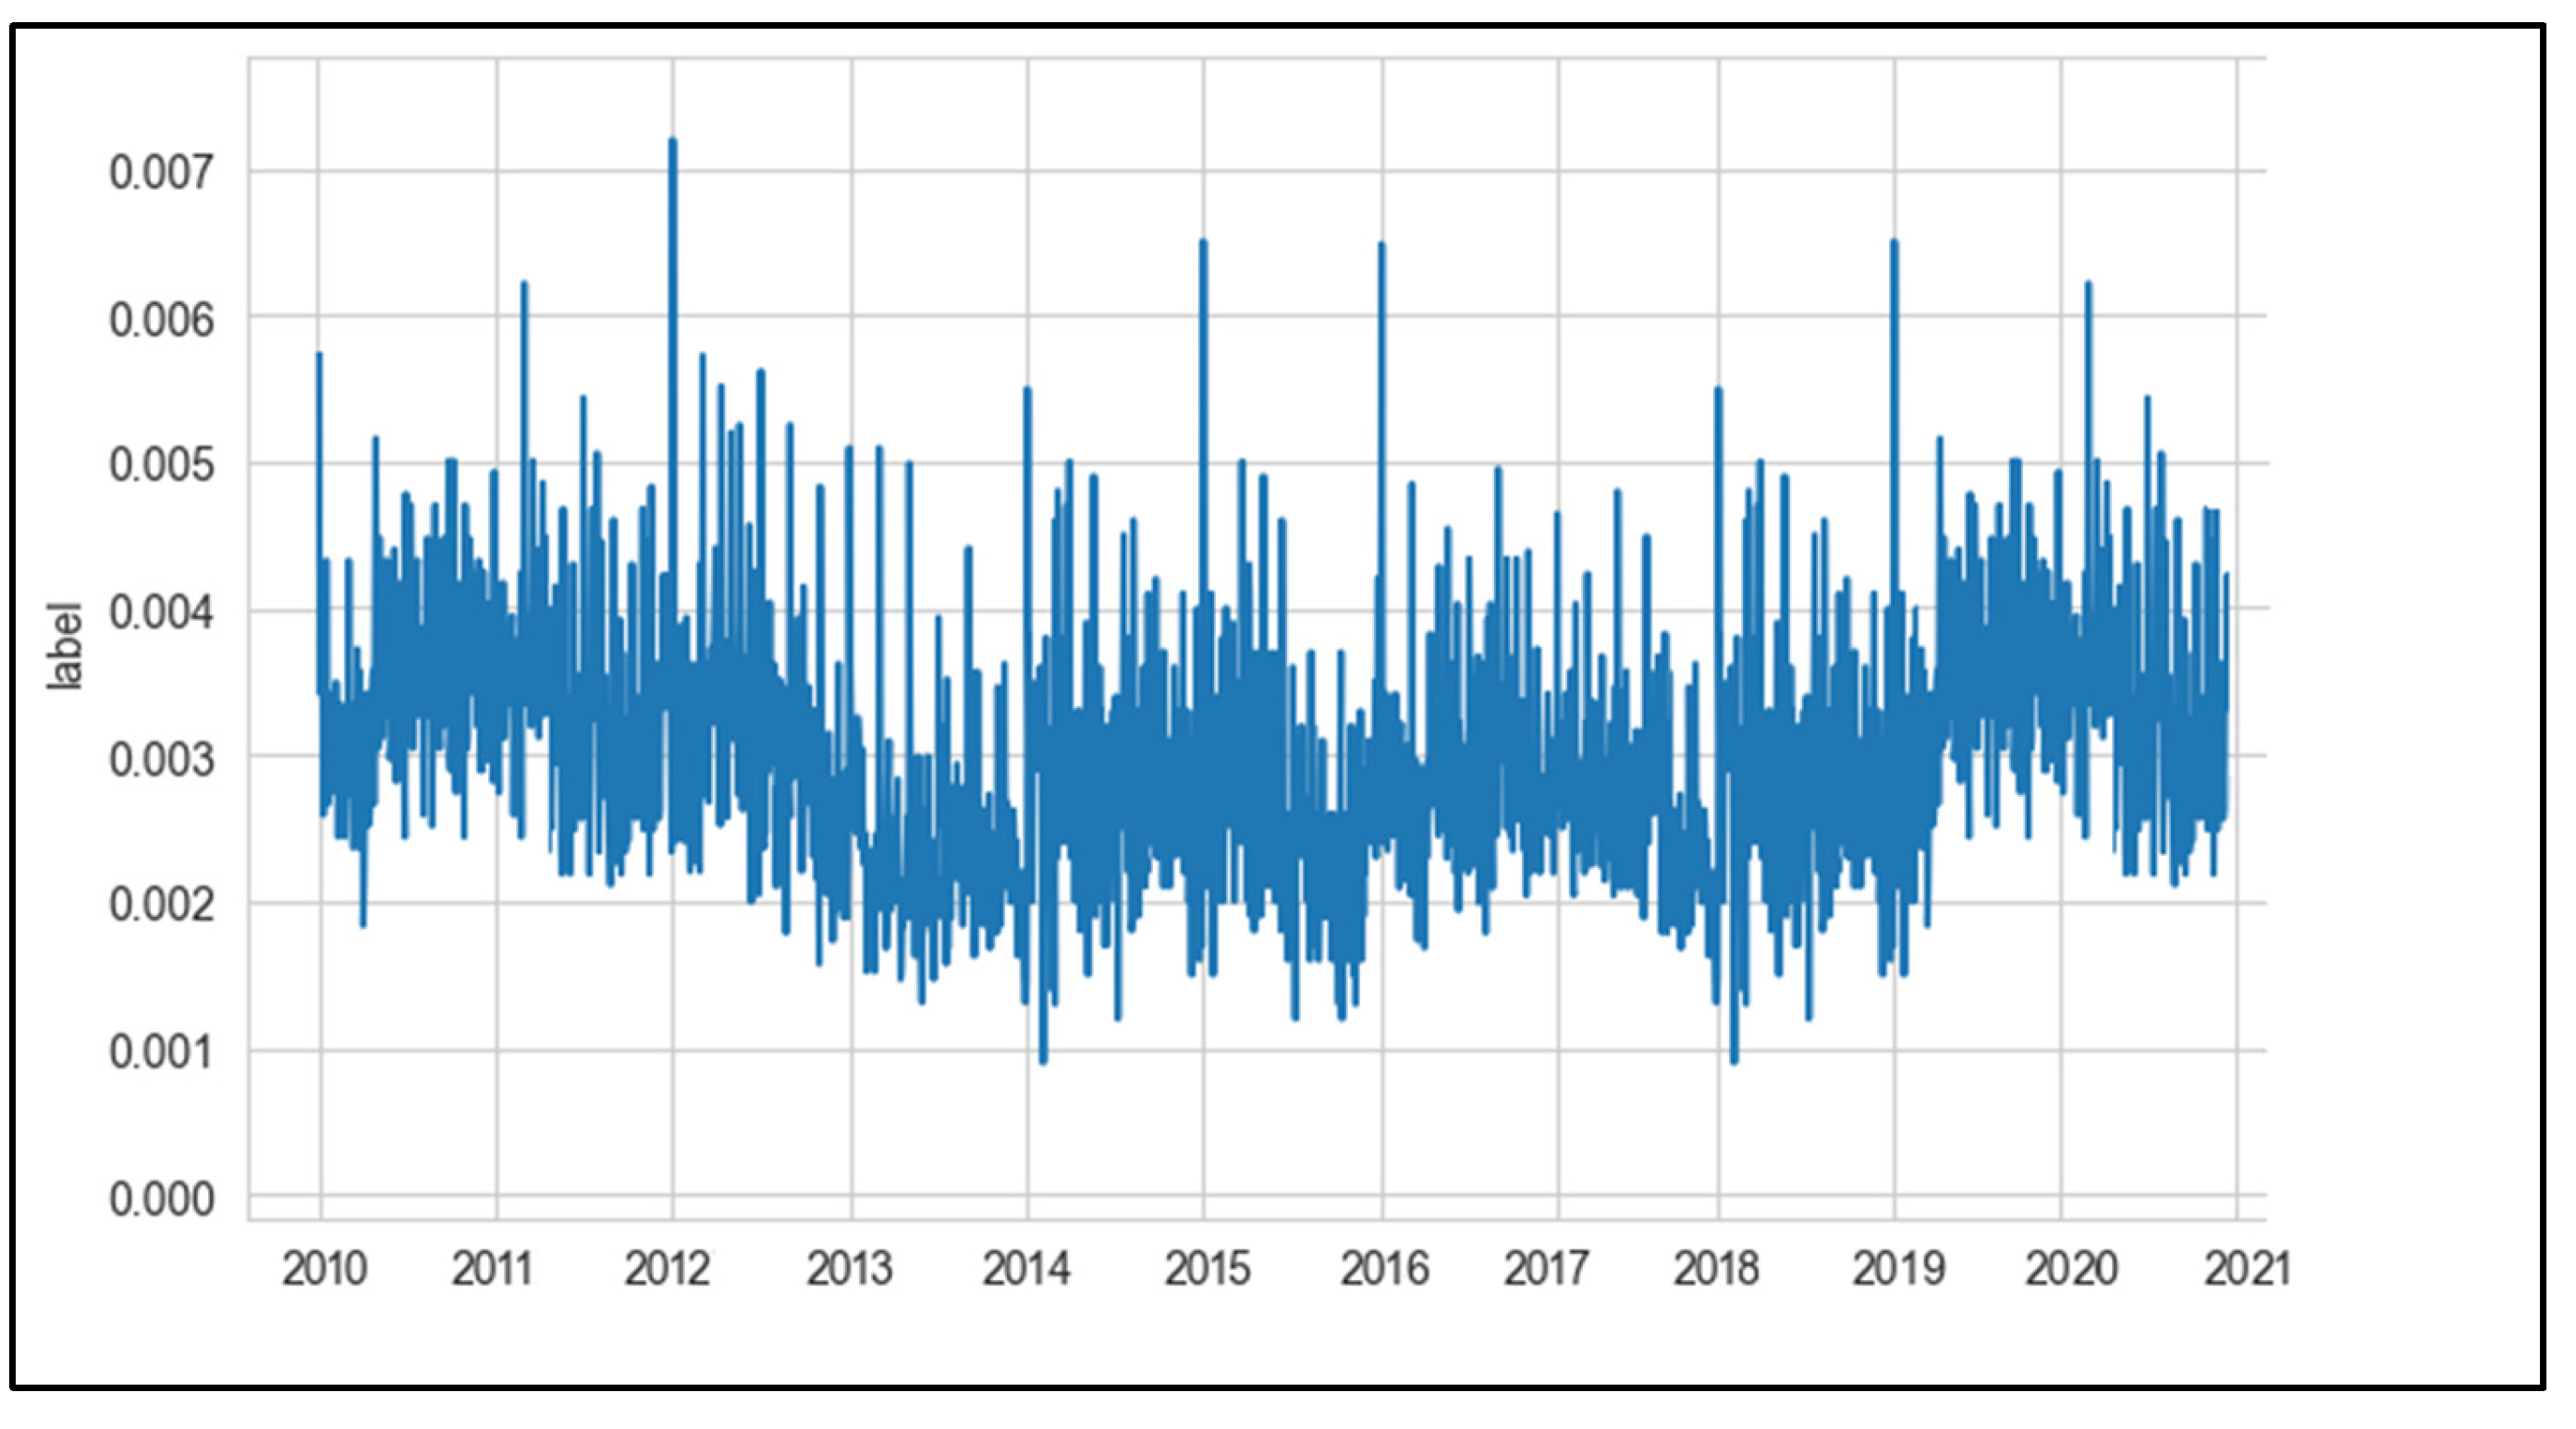
In this study, to visually observe the change of stroke incidence over time, the incidence of each month in the dataset was statistical counted, as shown in Figure 16. At the same time, this study also completed statistics the total number of cases each month during the four years in the data set, as shown in
Figure 11 and
Figure 12. It can be seen that the incidence of stroke is affected by seasonal and meteorological factors. Generally, the characteristics of the data basically satisfy the assumption of normal distribution, which provides a theoretical basis for the subsequent model building using machine learning, deep learning and other algorithms.
As shown from Figure 16, the influence of stroke diseases in spring is not obvious; the occurrence of stroke disease easily appear with the high temperature and humidity; Cold air activity will lead to significant cooling and increased pressure, bringing strong wind in autumn and winter. These meteorological elements impacts the induction of stroke diseases. At the same time, the highest temperature in summer also has a very negative impact on the number of cases, and there is no such correlation in other seasons.
5.4. Feature Evaluation
Pearson Correlation Coefficient (PCCs) can be used to explore the association between the predictive value (stroke incidence) and the characteristic variables (meteorological factors). The Pearson’s coefficient is a widely used method to measure the degree of correlation between two variables, and to be able to simultaneously assess the correlation between multiple meteorological features and stroke onset.
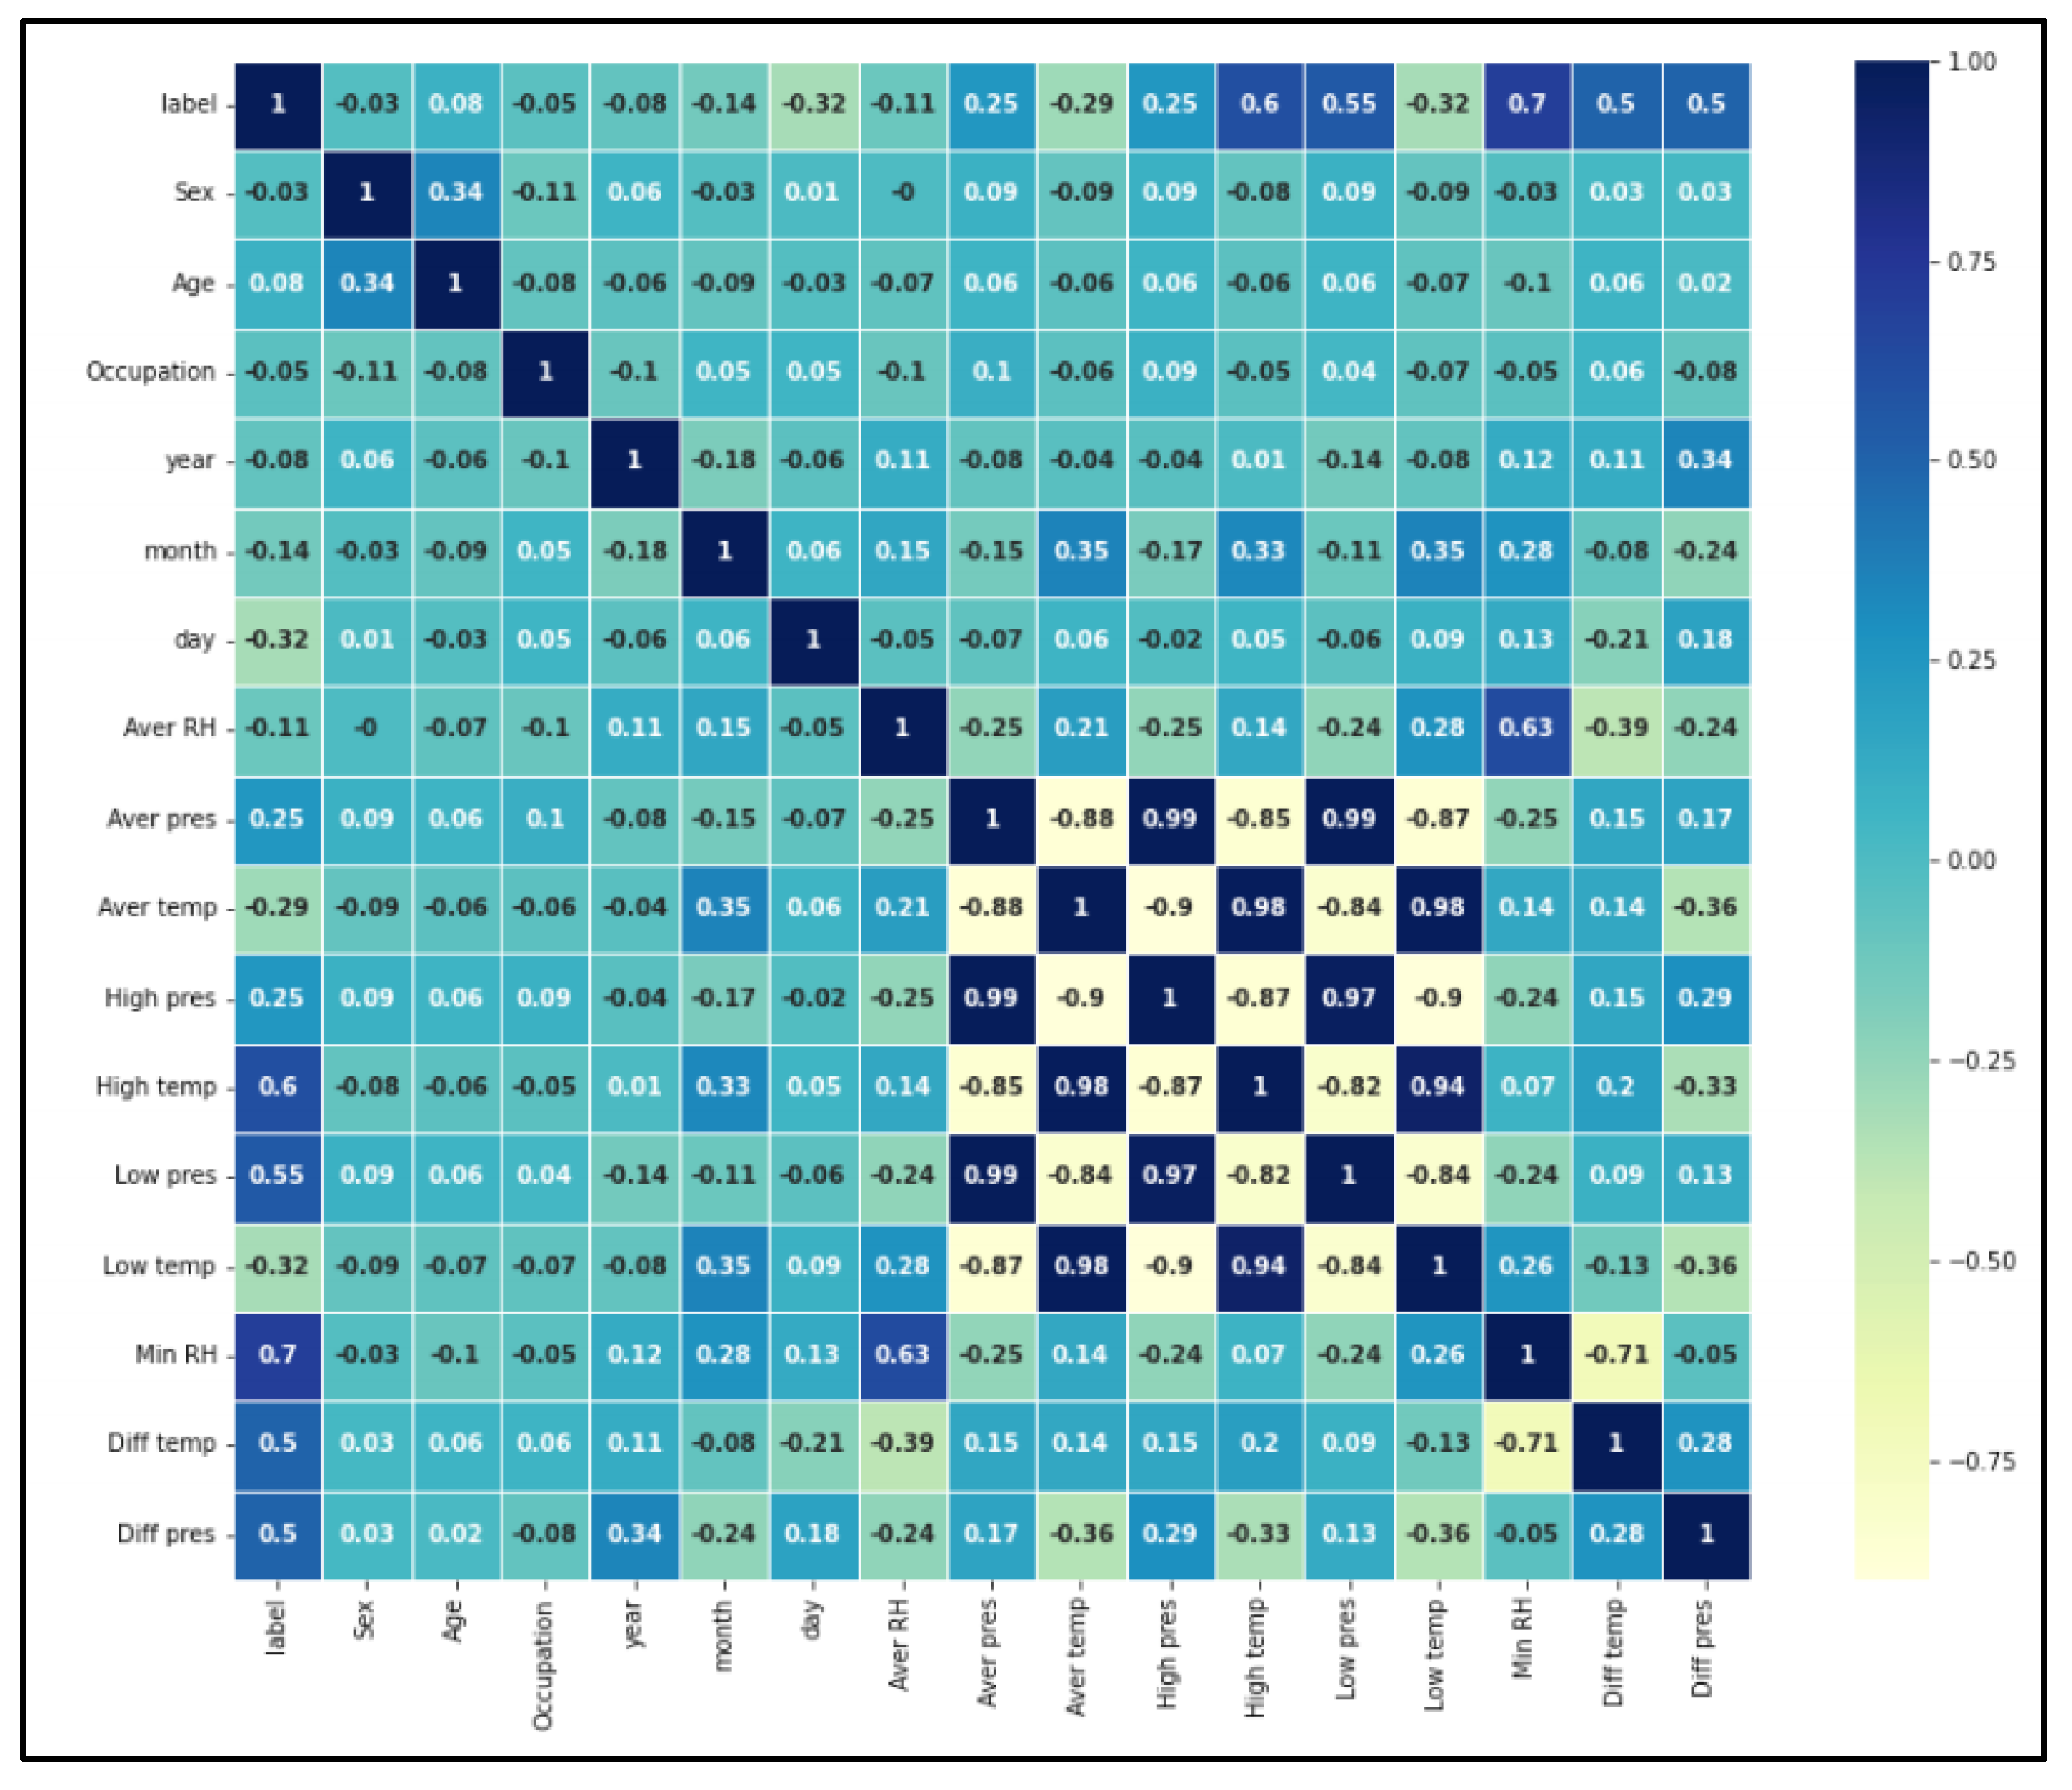
Figure 13 shows the Pearson coefficient thermal maps of the various meteorological characteristics and stroke incidence in this study. The Pearson correlation coefficient formula is shown as following (2):
The Pearson correlation coefficient is calculated as the quotient of covariance and standard deviation between two features, x and y are different features, represents the expectation and represents the standard deviation.
To visually present the correlation between multiple variables,
Figure 13 shows the Pearson coefficient thermodynamic map of individual meteorological features as well as stroke incidence (label) in this study. Each cell in the matrix graph represents the correlation between its corresponding horizontal and vertical two feature variables, and the darker the color, the stronger the correlation. By observing this thermodynamic map, it can be found that the Pearson coefficient of stroke incidence (label) and minimum relative humidity(min RH), maximum temperature(max TEMP), minimum air pressure(min pres) and other characteristics can be regarded as meteorological factors significantly associated with the incidence of stroke, and they show weak correlation themselves.
Combined with the above analysis, we see that stroke incidence increasing when meteorological factors at low humidity (less than 40% (RH<40%)), high temperature (temperature higher than 34℃), high humidity (relative humidity greater than 80% (RH >80%), temperature higher than 31℃); the 24-hour daily temperature difference varies between 6 and 10℃ (6 <△Tmax24h<10) and 60-80% at 60% (60%< RH <80%).
Figure 13.
The Pearson correlation coefficients among various meteorological feature variables and correlations with cerebral stroke incidence.
Figure 13.
The Pearson correlation coefficients among various meteorological feature variables and correlations with cerebral stroke incidence.
6. Conclusion and Discussion
This paper extract and clean the Guizhou province 12 monitoring follow-up cerebral stroke population time span for 10 years data, daily meteorological elements data and geographic digital elevation model (DEM) data. Based on Guizhou meteorological data cloud platform with history analysis library distributed column storage Gbase and unified data service interface [
17,
18,
19], realized the interdisciplinary multi-source data fusion, successfully established a complete detailed meteorological data set of cerebral stroke population.
At the same time, the data fusion of meteorological medical makes full use of the redundancy, complementarity and cooperation of cross-multi-source data, making the fusion data set more refined and richer [
31]. This data set has the characteristics of diverse spatial types and long time span, and this paper integrates better the multi-source data in time and space, solving the problem that there is no benchmark data set in this field [
32]. The first follow-up historical data of meteorological cerebral stroke in Guizhou Province has been accumulated, which lays a solid foundation for meteorological factor screening of meteorological cerebral stroke and modeling analysis based on the study of meteorological factors in mountainous areas, and is of great help to the extended research and subsequent application of medical treatment [
33].
On the basis of significant production of the medical meteorological fusion data set, this paper explores the association between the predictive value (stroke incidence) and the characteristic variables (meteorological factors) through the Pearson coefficient analysis and Seaborn PairGrid, while we obtain the following conclusions: the stroke incidence rate is directly proportional to the daily temperature difference. The value range of the difference between daily air pressure is between 0 and 20 degrees Celsius. Observations revealed that, as the value of the daily temperature difference exhibits variation larger, the incidence rate is gradually increasing.
In order to explore the relationship between the incidence stroke and various meteorological indicators, utlizing the Seaborn PairGrid, which is used to explore the linear or nonlinear relationship among multiple factors, and the interaction between the variables. Joint Distribution is a method visualization between two or two variables, often need to use in data analysis, a excellent joint distribution can make our data analysis more visibility at the moment.
From the PairGrid relationship chart between stroke incidence and meteorological factors, we further investigate that daily highest air temperature, daily lower air pressure difference and daily lower air temperature difference are mainly attributed to the high correlation of meteorological factors. The correlation coefficient is positive and negative with the variable temperature and pressure, which indicating that both the temperature reduction and the temperature-rise period cause an increase in the incidence of stroke. In this study, we observed from stroke incidence by month that influence of stroke diseases increasing obviously in December and January each year, which is the peak of the annual incidence rate, indicating that stroke occurence in spring is not obvious.
Meanwhile, Stroke disease easily appear with the high temperature and humidity, normally, cold air activity lead to temperature significant cooling and increased pressure, in addition, bringing strong wind in autumn and winter. These meteorological elements impacts the induction of stroke diseases. At the same time, the highest temperature in summer also has a very negative impact on the number of cases, and there is no such correlation in other seasons.
Author Contributions
X.G. and FX.Z. contributed to the design and data analysis. X.G. wrote the draft of the manuscript and received valuable comments from XP.C., FX.Z., GQ.L. and SC.M all authors have read and agreed to the published version of the manuscript.
Funding
This study was supported by Guizhou Provincial Basic Research Program “Study of Cerebral Stroke Regularity and Early Warning Model based on Mountain Meteorological Factors”, Qiankehe Foundation -ZK [2022] General 244; Guizhou Provincial Supporting Program “Research on Vertical Observation of Yunnan-Guizhou Quasi-stationary Front based on Remote Sensing Technology”, Qiankehe Foundation -ZK [2023] General 165.
Institutional Review Board Statement
Not applicable.
Informed Consent Statement
Not applicable.
Data Availability Statement
The analysis between cerebral stroke and meteorology factors relationship supporting the conclusions in this study was obtained from programme coorperation about Guizhou Provincial Meteorological Bureau and Guizhou Center for Disease Control and Prevention.
Conflicts of Interest
The authors declare no conflict of interest.
References
- Haobin Xu, Liang Zhao, Biyu Xu, et al. Meteorological data monitoring service system based on cloud platform. Journal of ShanXi Meteorology,2020; vol 2, 59-63.
- Xiaona Liu, Hua Zhang, Genming Zhao, et al. Development of chronic disease prevention and control in China. Journal of Public Health and Proventive Medicine, 2015; 26(02): 79-83.
- Yicen Lu, Weishi An, Shuang Wei, Shucheng Wu, et al. Research on Quality Control of Temperature Elements of External Department Fusion Data. Bulletin of Science and Technology, 2021;37(5): 22-26.
- Yuanyuan Liu, Wenchun He, Yan Wang, et al. Design and Implementation of Meteoroogical Big Data Cloud Platform Archive Storage System. Meteorological Science and Technology, 2021;49(5): 697-706.
- Chunxiang Shi, Yang Pan, Junxia Gu, et al. A review of Multi-Source Meteorological Data Fusion Products. Acta Meteorological Sinica, 2019; 77(4):774-783.
- Ju Qiu, Yan Wang, Peizhuo Huang, et al. Discussion on Construction of the Electric Power Enterprise based on Gbase Distrivuted Data Warehouse. Computer Applications and Software, 2018(5),35(5):184-189.
- Yangyong Zhu, Jing Sun. Recommender System: Up to Now. Journal of Frontiers of Computer Science and Technology, 2015;9(5): 531-525.
- Liangmiao Dong, Yuzong Li, Yuefeng Qin, et al. Development and Interface Application Skills of Meteorological Service Client System based on CMADaaS Platform. Meteorological Science and Technology,2022; 4,50(2): 297-302.
- National Meteorological Information Center. Development Manual of “Tianqing” 1.0 of Meteorological Big Data Cloud Platform.2020;3-4,64-67.
- Youlin Yang, Haibo Chen, Jianlin Wang, et al. Design and Implementation of NingXia Intelligent Integrated Meteorological Business Service Sharing Mnagement Platform.Meteorological Monthly, 2018; 44-7:961-968.
- Peng Li. Study on the Construction of Image Control Point Database Based on ArcGIS Platform. Geomatics and Spatial Information Technology,2022;45(11).
- Jieqiong Wang, Zetian Fu, Biao Zhang, et al. Decomposition of influencing factors and its spatial-temporal characteristics of vegetable production: A case study of China. Information Processing in Agriculture, 2018;5- 477–489.
- Xiang Gao, Tao Liu, Keren Zheng, et al. Spatio-temporal analysis of peste des petits ruminants outbreaks in PR China (2013–2018): Updates based on the newest data. Transboundary and Emerging Diseases,2019;5-66:2163-2170.
- Xinji Zeng, Tao Li, Liqun Zhan, et al. A method research on CIMISS based on MUSIC characteristic data and product write-back. Journal of Meteorological Research and Application, 2018; 39-1.
- Zhi Huang, Heng ]Huang, Weiliang Liang, et al. Design and application of business integration based on CMADaaS DPL. Journal of meteorological research and application, 2022;43-1.
- Yongqing He, Yixuan Song, Jin Chen, et al. Optimization of automatic acquisition method based on “Tianqing” meteorological data. Science and Technology & Innovation,2023; 16-1.
- Guoqiang Liu, Wei Xiong, Hua Wang. Optimization of meteorological core business support system based on the “Tianqing”. HeBeiNongJi,2021;9.
- Zhenglong Xia, Chenghao Fu, Liang Zhu, et al. Research and Implementation of Model Product Cloud Technology Based on CMADaaS. Modern Computer, 2021;27-34.
- Yongcheng Yu, Xiao Wang, Xialu Wei. Technical Scheme Design and Implementation of Fujian Meteorological Integrated Operation Platform Integrated into CMADaaS. Meteorological Science and Technology, 2022;50 -5.
- Abdul Salam, Saadat Kamran, Rubina Bibi, et al. Meteorological Factors and Seasonal Stroke Rates: A Four-year Comprehensive Study, Journal of Stroke and Cerebrovascular Diseases, Volume 28, Issue 8, 2019, Pages 2324-2331, ISSN 1052-3057.
- Toyoda K, Koga M, Yamagami H, et al. Seasonal variations in neurological severity and outcomes of ischemic stroke - 5-year single-center observational study. Circ J 2018;82:1443-1450.
- Cevik Y, Dogan NO, Das M, et al. The association between weather conditions and stroke admissions in Turkey. Int J Biometeorol 2015;59:899-905.
- Arbuthnott K, Hajat S, Heaviside C, et al. Changes in population susceptibility to heat and cold over time: assessing adaptation to climate change. Environ Health 2016;15(Suppl) 1):33.
- Liu C, Yavar Z, Sun Q. Cardiovascular response to thermoregulatory challenges. Am J Physiol Heart Circ Physiol 2015;309:H1793-H1812.
- Lavados PM, Olavarría VV, Hoffmeister L. Ambient temperature and stroke risk: evidence supporting a short term effect at a population level from acute environmental exposures. Stroke 2018;49:255-261.
- Chen R, Wang C, Meng X, et al. Both low and high temperature may increase the risk of stroke mortality. Neurology 2013 17;81:1064-1070.
- Katsuki M, Narita N, Ishida N,et al. Preliminary development of a prediction model for daily stroke occurrences based on meteorological and calendar information using deep learning framework (Prediction One; Sony Network Communications Inc., Japan). Surg Neurol Int. 2021 Jan 28;12:31.
- Fujita T, Ohashi T, Yamane K, et al. Relationship between the number of samples and the accuracy of the prediction model for dressing independence using artificial neural networks in stroke patients. Jpn J Compr Rehabil Sci. 2020;11:28–34.
- Hui L, Ruan Y, Liang R, Liu X, Fan Z. Short-term effect of ambient temperature and the risk of stroke: A systematic review and meta-analysis. Int J Environ Res Public Health. 2015;12:9068–88.
- Azimi P, Mohammadi HR, Benzel EC, Shahzadi S, Azhari S. Use of artificial neural networks to decision making in patients with lumbar spinal canal stenosis. J Neurosurg Sci. 2017;61:603–11.
- Kun Li, Lantao Wang, Maohui Feng. Relationship between built environments and risks of ischemic stroke based on meteorological factors: A case study of Wuhan’s main urban area. Science of The Total Environment,Volume 769,2021,144331,ISSN 0048-9697.
- Ikefuti, P.V., Barrozo, L.V., Braga, A.L.F., 2018. Mean air temperature as a risk factor for stroke mortality in São Paulo, Brazil. Int. J. Biometeorol. 62, 1535–1542. [CrossRef]
- Cui, Y., Ai, S., Liu, Y., Min, Z., Wang, C., Sun, J., et al., 2020. Hourly associations between ambient temperature and emergency ambulance calls in one central Chinese city: call for an immediate emergency plan. Sci. Total Environ. 711, 1–8. [CrossRef]
|
Disclaimer/Publisher’s Note: The statements, opinions and data contained in all publications are solely those of the individual author(s) and contributor(s) and not of MDPI and/or the editor(s). MDPI and/or the editor(s) disclaim responsibility for any injury to people or property resulting from any ideas, methods, instructions or products referred to in the content. |
© 2024 by the authors. Licensee MDPI, Basel, Switzerland. This article is an open access article distributed under the terms and conditions of the Creative Commons Attribution (CC BY) license (http://creativecommons.org/licenses/by/4.0/).
