1. Introduction
Abell 30 (A30) is a well known and interesting Planetary Nebula (PN) that has a few different nomenclatures including PNG 208.5+33.2 (usual name) and PK 208+33.1. It was known as PN A66 30 when it was first discovered in 1964 [
1,
2]. A30 belongs to a highly ionized PN class arising from its very hot core. In the work of Jacoby, 1979, it was emphasized that A30 had a hydrogen rich outer shell and a hydrogen poor inner knot system in close proximity to the central star. This is rare in PNe systems [
3]. A secondary envelope ejection was suspected as being responsible for the inner hydrogen poor nebula. However, this has yet to be confirmed. [
4] suggested the possibility of a binary companion and evidence of a variable light curve with a period of 1.060 days was discovered in 2020 [
5]. More peculiar features of A30 that cannot by explained by a possible binary companion lie in the chemical inhomogeneity among the observed knots, creating a more complicated scenario. In general, a main sequence star of mass ranging from 1 to 8 solar masses will only eject its outer atmospheric layer once the object enters the AGB phase. The ejected material then becomes ionized by the hot core causing it to glow in emission lines across much of the electromagnetic spectrum. This short evolutionary stage is collectively known as the PN phase. Its typical life span is about 5,000-25,000 years [
6]. PNe are generally hydrogen rich. Observational data for A30 suggests an interval of 12,000- 18,000 years between the first and second ejection of the outer hydrogen rich nebular shell and the inner hydrogen deficient knot system [
3,
7]. The evolutionary pathway that leads to the formation of multiple layers of a nebula over different time scales remains illusive. Here we present the IFU spectroscopic study for A30 to investigate the distribution of ionic species across the gas clumps in the inner knots system and the kinematic structure observed in a series of spectral lines.
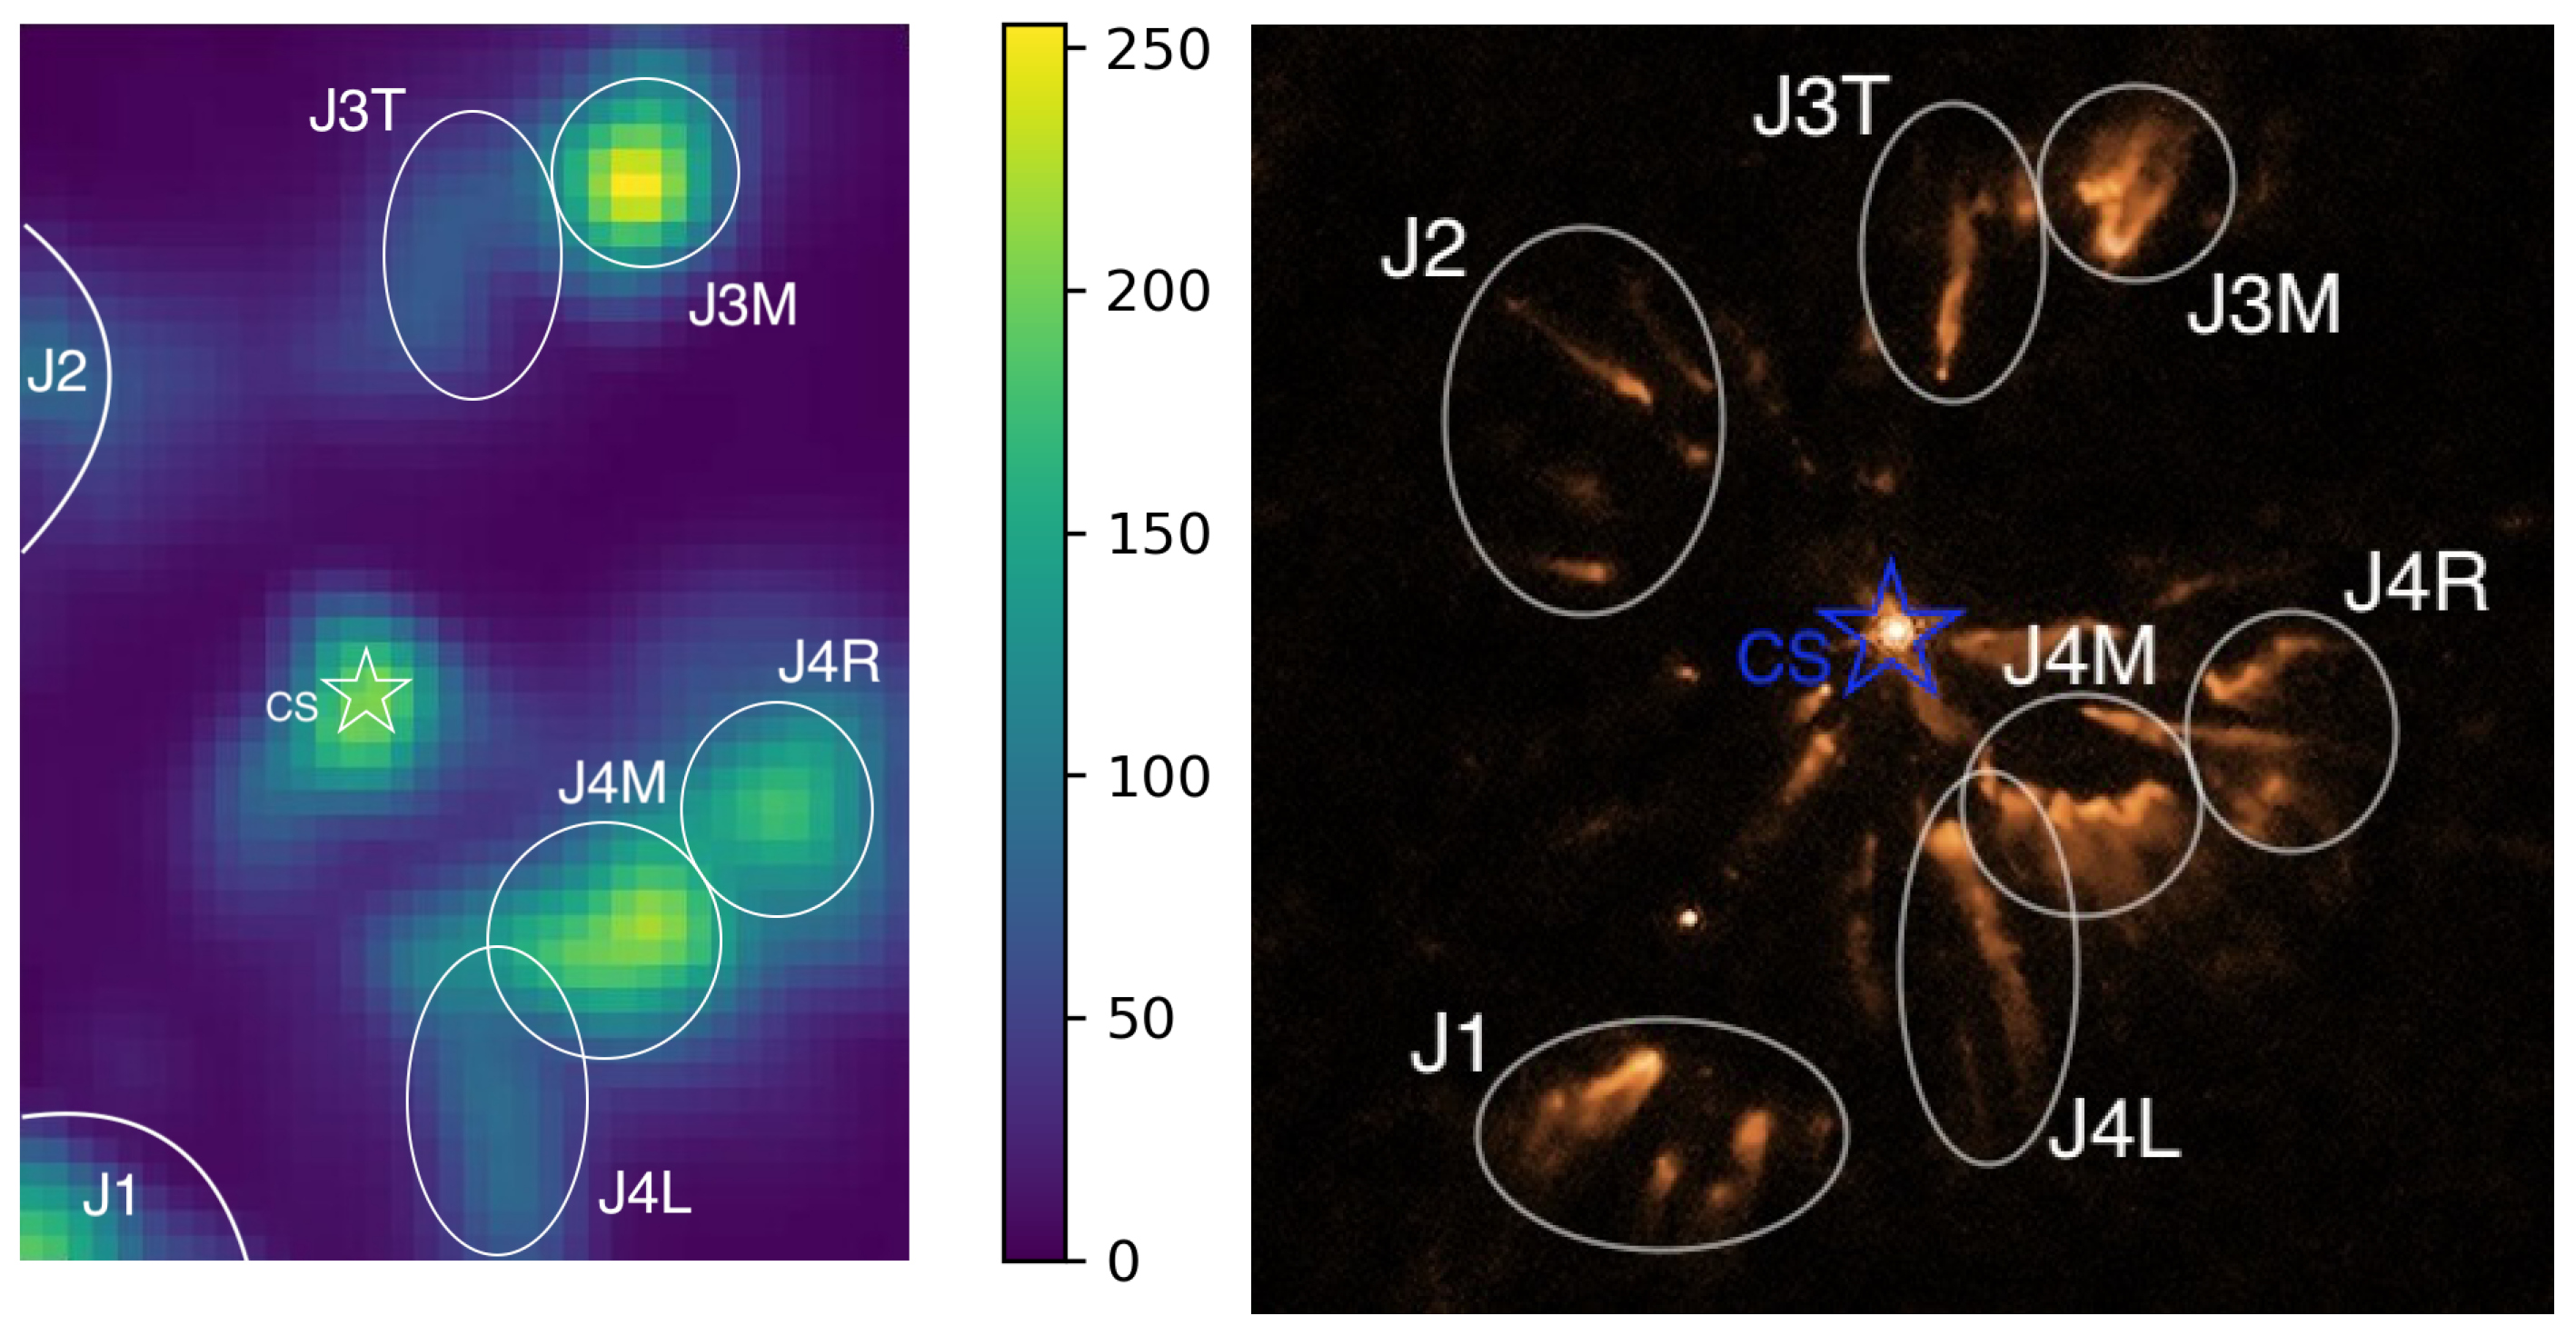
The hydrogen poor inner knot A30 system referred to in this work is divided into four main parts. These are knots J1, J2, J3 and J4 starting from the lower left nebula structure counting clockwise around the central star (
Figure 1). Knots J2 and J4 are collectively known as the equatorial system and knots J1 and J3 as members of the so-called polar knots. Studies of the knot system of A30 have been carried out by different groups in the past, including the earliest work of Jacoby (1979 [
3]) up to the latest work of Simpson (2022 [
8]) where the equatorial knot J4 was the focus. Here, we further divide the knots J3 and J4 into J3 tail (J3T) and J3 main (J3M); J4 right (J4R), J4 main (J4M) and J4 left (J4L). respectively. The circled areas in
Figure 1 show the aforementioned segregated regions of gas clumps that compose knots J3 and J4.
2. Emission Line Flux Mapping—Distribution of High and Low Ionization Zones
The dynamical nebular and chemical environment within the inner system of A30 creates extra challenges to conventional slit spectroscopy. The distribution of light and matter is non-uniform and unpredictable so chemical inhomogeneities among different parts of the structure become likely. Consequently a complete map of the entire inner system of A30 is needed to assess this issue in terms of emission line flux, chemical characteristics, and physical conditions between the complex structures to gain an accurate and meaningful picture.
Spectroscopic integral-field unit (IFU) observations have the capacity to provide spatially resolved spectroscopic data across a projected 2-D nebula on the sky while simultaneously providing decent spectral coverage and combined wavelength and angular resolution. IFU spectroscopy maps can be built from the flux collected from different locations across the nebula as sampled by the resolution of the spaxel grid. IFU data can be understood as a data cube that can carry perhaps thousands of stacked wavelength slices, each at a different wavelength. On our case the IFU data ranges from 3800 Åto 6600 Å. At the spectral lines of interest, the distribution of the specified ion can be interpreted from the flux collected across the IFU’s FoV and revealed by spatial variations in the map and also the associated wavelength variations for that ion depending on the extant kinematic properties.
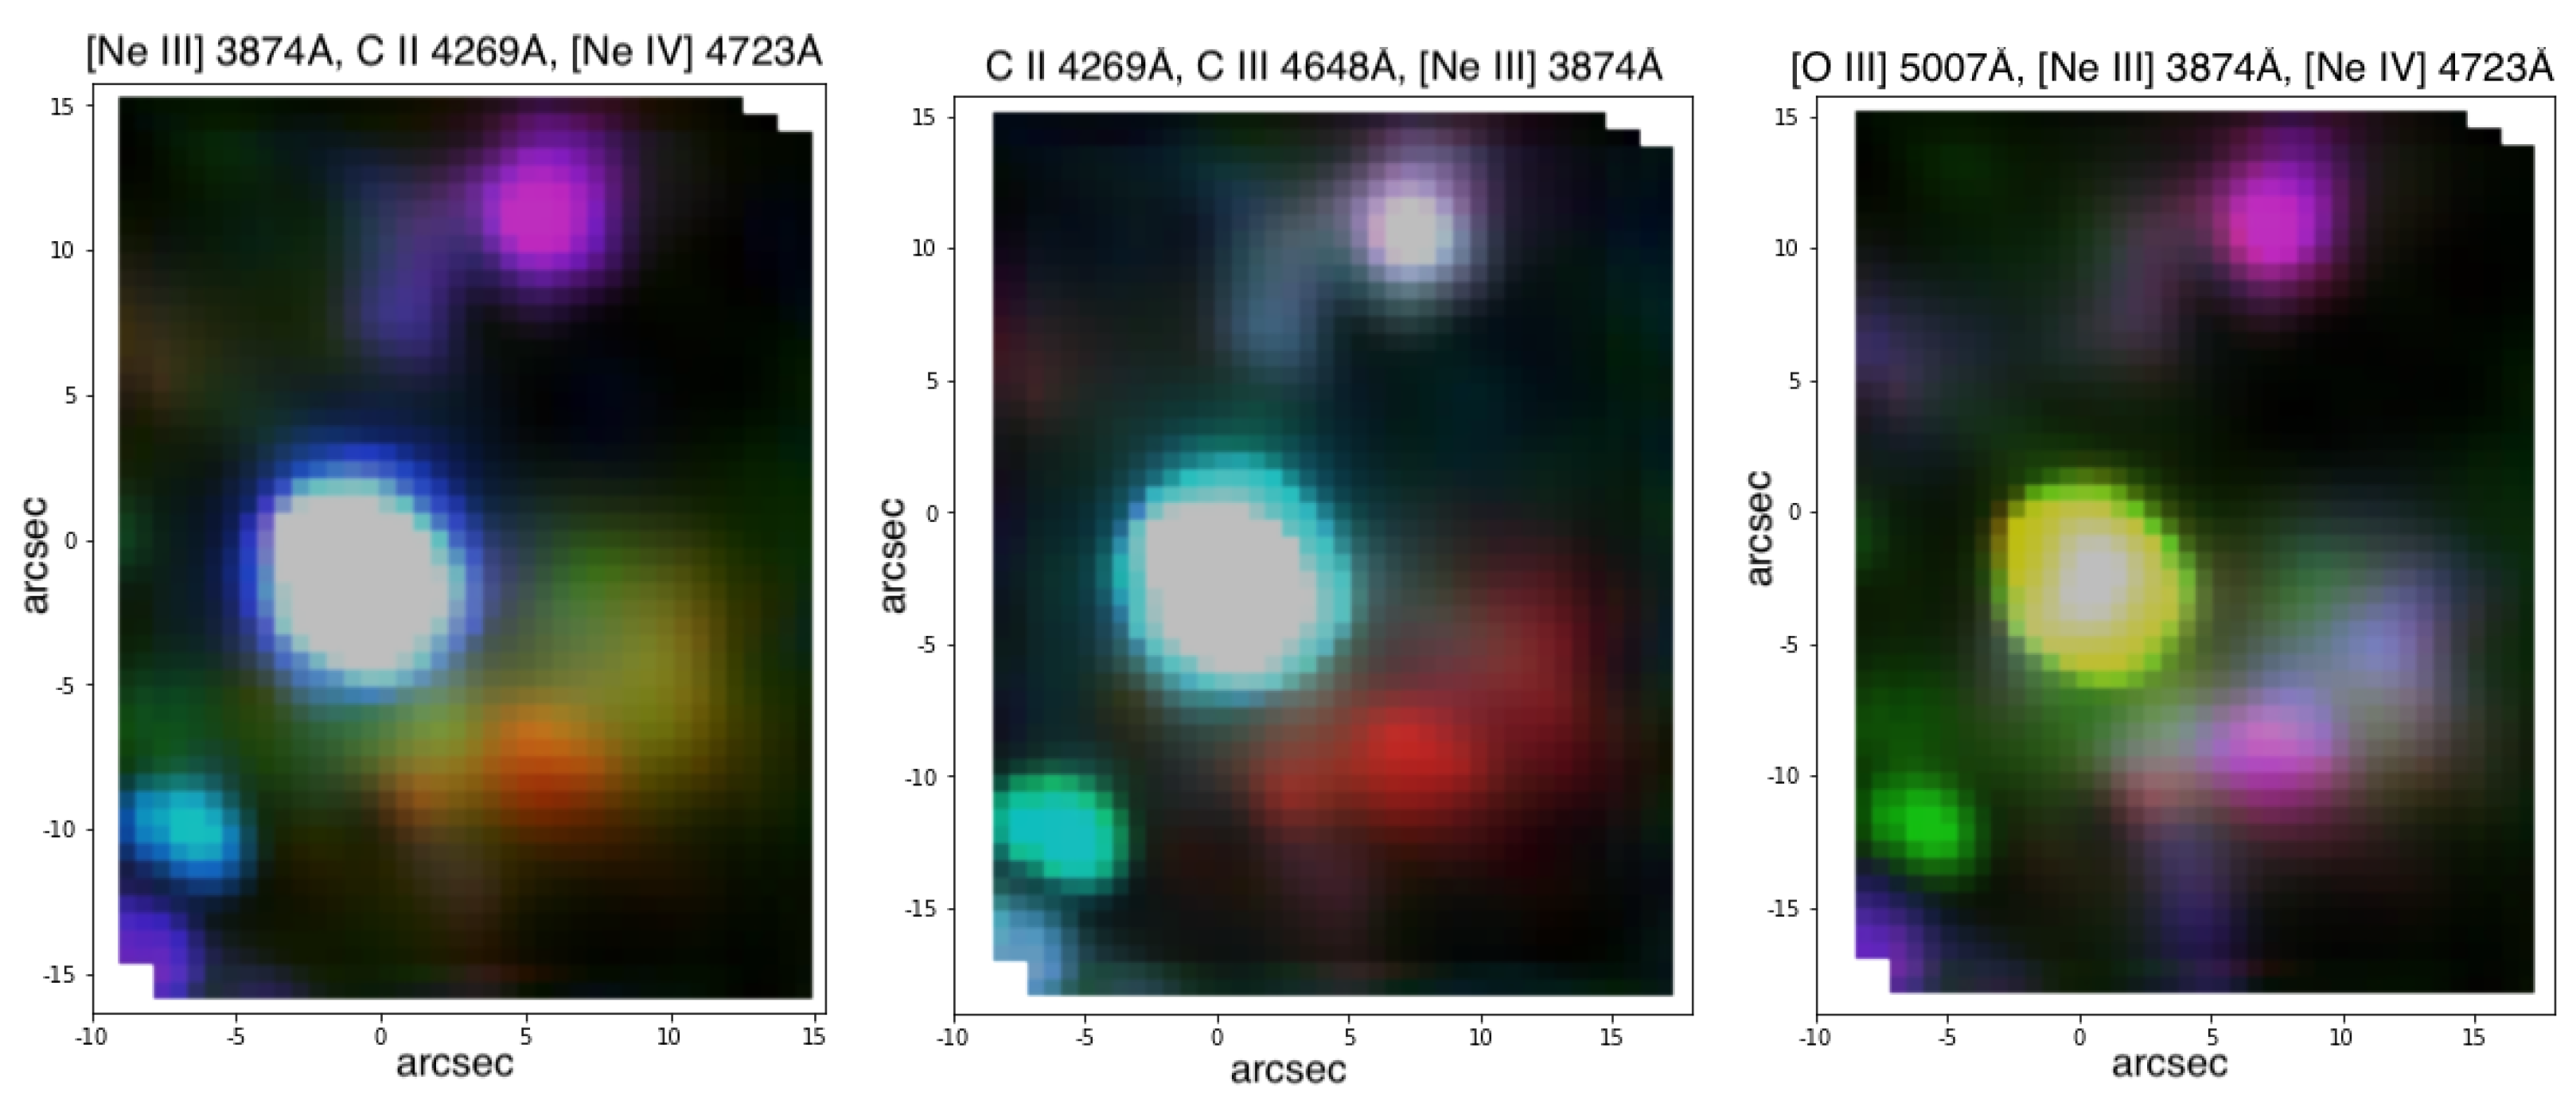
Figure 2 shows 3 combined spectral line maps in RGB (red, green and blue) where each primary colour represents a different ionized species. The left panel shows [Ne III] 3874 Å (R), [Ne IV] 4723 Å (G) and C II 4269 Å (B). The middle panel shows [Ne III] 3874 Å (R), C III 4648 Å (G), and C II 4269 Å (B). Finally, the right panel shows [Ne III] 3874 Å (R), [Ne IV] 4723 Å (G), and [O III] 5007 Å (B). Visualizing the ionic species distribution across the system permits a better understanding of the dynamics of high and low ionization zones among the gas clumps. The complex ionization zones manifest themselves by turning into a different colour; for instance an overlapped distribution between a red and blue map (two different ionic species) turns into purple in this method. The circular structure at (0, 0) in the labelled X-Y co-ordinates is the central star. Another near by star can also be seen at (-6, -10). The partially covered knots J1 at (-8, -15) and J2 at (-8, 5) will not be discussed in this section due to the incomplete coverage. J3M is centred at (6,12) and J3T at the region that extends from about (2, 6) to (5, 12) where J4M is located. J4L and J4R are located around the bottom right with respect to the central star (0, 0).
3874 Å, C II 4269 Å, [Ne IV] 4723 Å (
Figure 2 left): This map shows the distinctive distribution of recombination and forbidden species among knots J3 and J4. The red colour parts in knots J4 correspond to [Ne III]. There is a complete absence of C II in the knot. The green colour adjacent to the red resembles areas occupied by [Ne IV] in regions between knot J4 and the central star with little to no [Ne III] and [Ne IV]. The purple/pink colour region observed in knot J3 resembles mixing between blue and red colour maps of C II and [Ne III], respectively, where the ionic species distribution in knot J3M and J3T coincide. No trace of [Ne IV] is found in knot J3.
C II 4269 Å, C III 4648 Å, [Ne III] 3874 Å (
Figure 2 middle): Red colour parts of the map show no mixing of C II or C III with [Ne III] in knot J4. [Ne III] is predominantly found in knot J4, a colour of grey white in knot J3 means mixing between the green and blue maps of C II and C III where the species is being ionized exclusively in knot J3 and the strength of flux of [Ne III] in knot J3 being comparatively much weaker.
3874 Å, [O III] 5007 Å, [Ne IV] 4723 Å (
Figure 2 right): The pink or purple colour regions show overlapping distributions in knots J3 and J4 for the forbidden species [O III] and [Ne III] which share similar ionization energy levels. Some parts of the red in the lower region to J4M and J4L resemble presence of [Ne III] where [O III] being less prominent. Regions of green resemble absence of overlapping between [Ne IV] to [O III] and [Ne III]. The presence of [Ne IV] in the region between the central star and knot J4 where no other ionic species is being observed may indicate an ionization zone of higher excitation level compared to the knots.
3. Kinematic Structure and Relative Velocity
The outer shell of A30 expands at a velocity of about 30 - 40
while the inner knots move at more than 200
[
10]. We reveal the complex kinematic structure of the inner knot system by mapping their variation across selected spectral lines from the velocity at which the line first appears through until the end of the gas motion where the line fades from view in velocity space. Here we refer to the kinematic structure maps as velocity maps. Due to the slight differences in observed wavelength for each segregated region in the knots for this study, velocities were determined from the extracted spectrum of each of the gas clumps J3M, J3T; J4M, J4R and J4L where it has the peak flux value instead of the observed wavelengths at the kinematic frames shown in this section. Kinematic structure in these maps can be understood as slices of spectral wavelengths that gradually approach peak flux at the observed wavelength normally revealed in slit spectral data and slowly reduces as the slices carry on towards another spectral range either side. Knowing their kinematic structure permits a more accurate sense of motion across the gas clumps as they are moving in different velocities and directions as revealed by the observed variations in line intensity and spatial location as a function of wavelength (and so velocity).
Line [Ne III] 3968.50 Å (
Figure 3 left): The kinematic structure of [Ne III] 3968.50 Å extends from 3968.20 Å to 3975.55 Å: The strongest flux was observed in frame 3 at 3971.15 Å. Velocity of gas clump J3M reaches
- the highest among the knots. Velocity observed in J3T is
; J4M is
and J4R
.
Line He I 3889.75 Å (
Figure 3 right): The strongest flux observed in J3M corresponds to a velocity of
. There is little to no kinematic structure observed in knot J4.
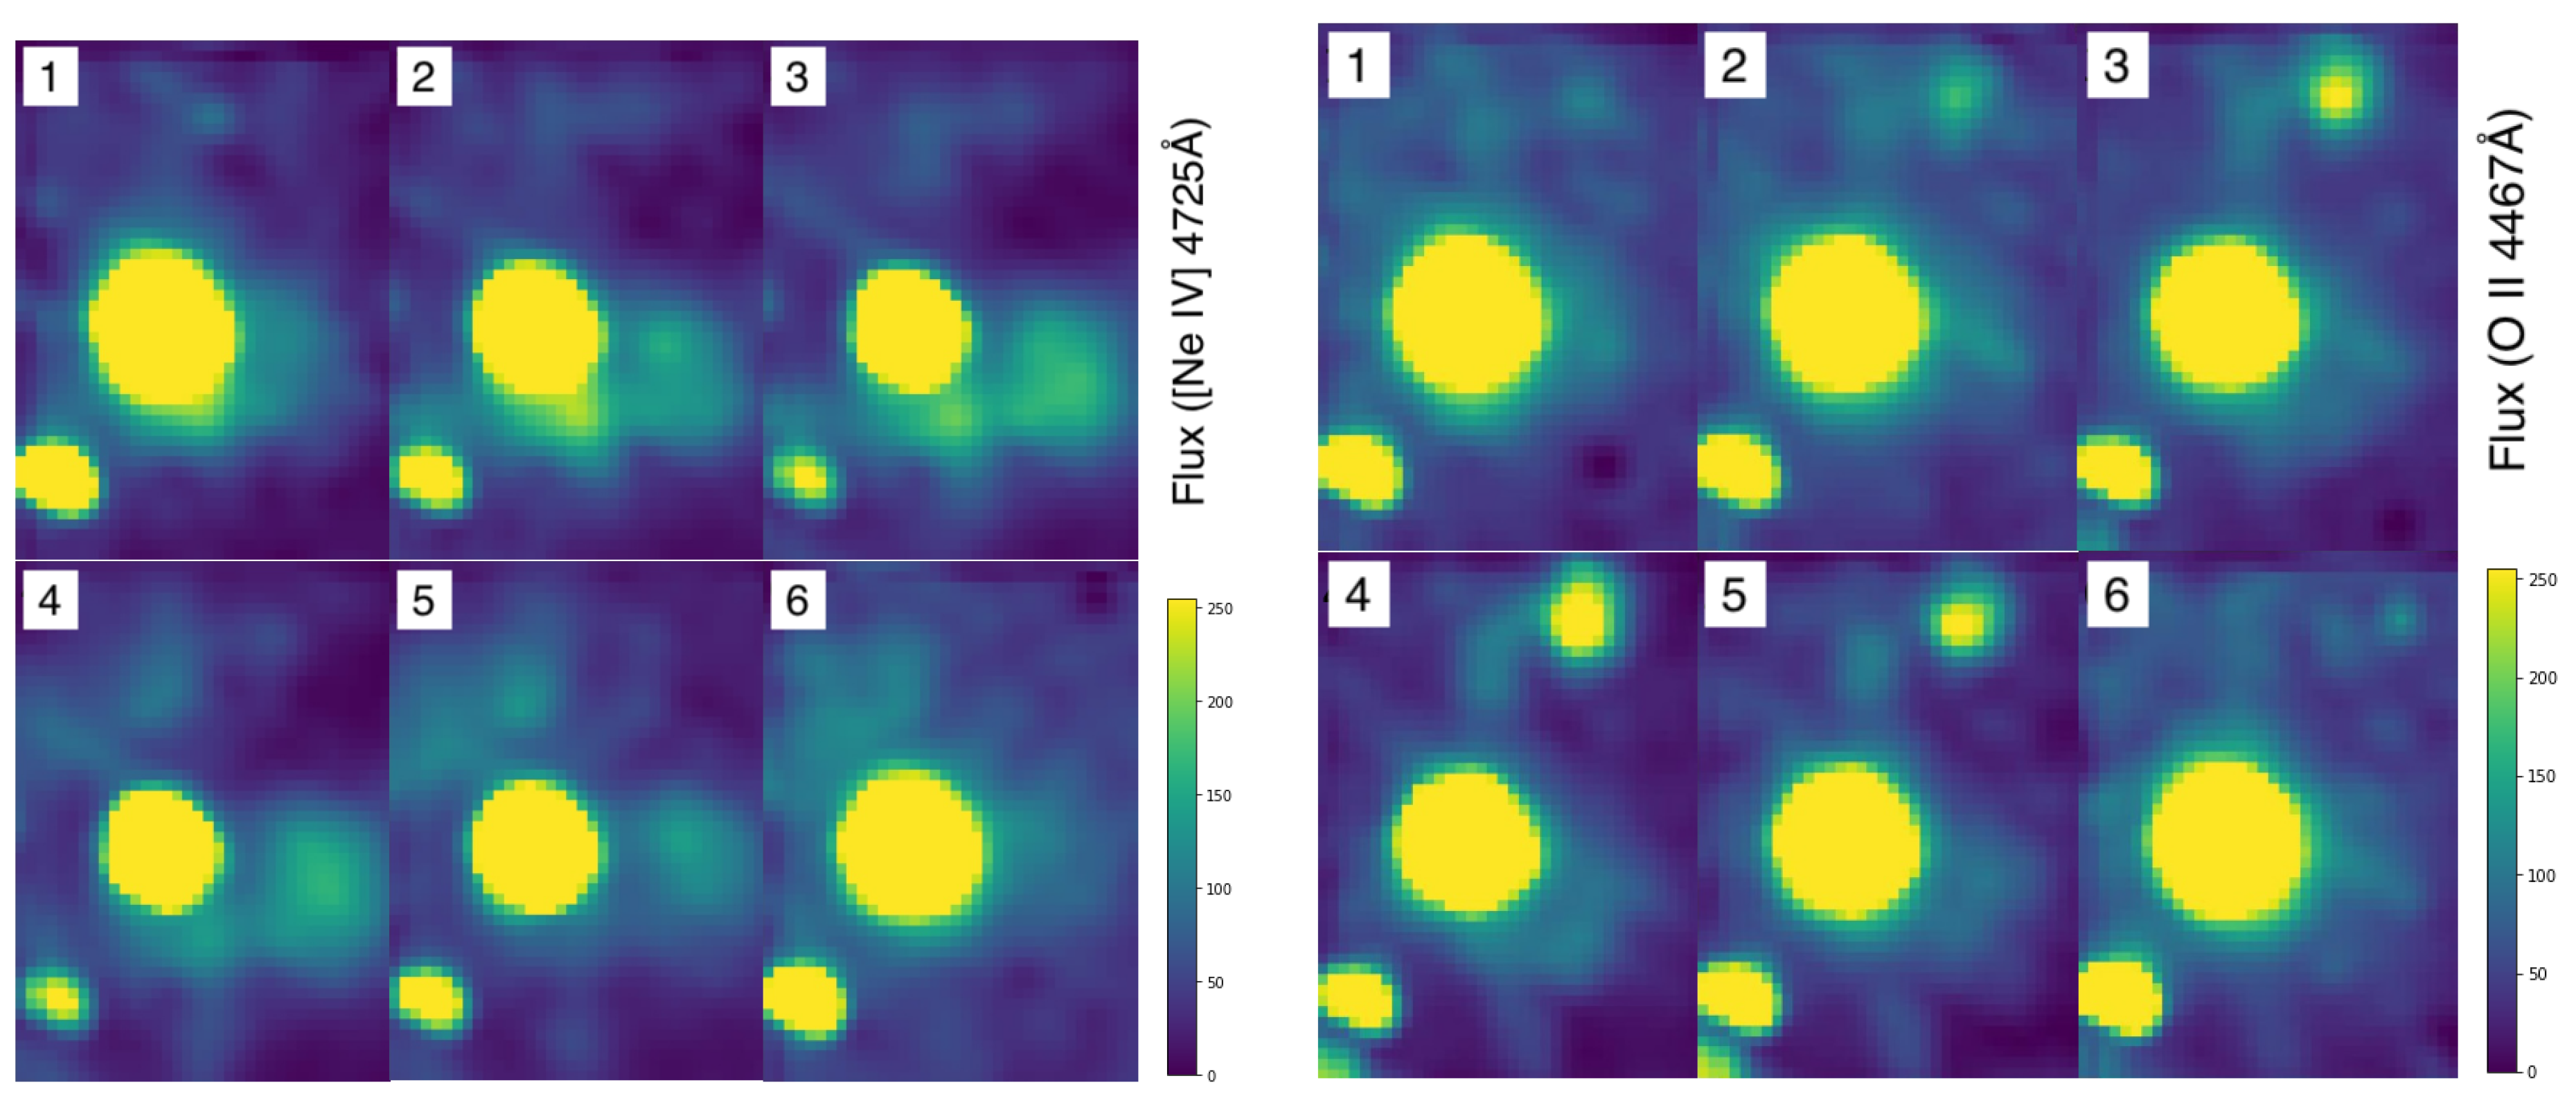
Line [Ne IV] 4725 Å (
Figure 4 left): The kinematic structure as seen at the [Ne IV] 4725 Å line shows a feature that is absent in other spectral lines where the species is relatively weak in the polar regions (knots J1 and J3). As the ion comes into play, peak values are observed in knot J4 and regions surrounding the central star, as well as close to knot J1. Other regions in which [Ne IV] ions are observed are J4M and J4R where the peak fluxes are observed at velocities of
and
respectively.
Line O II at 4467.0 Å (
Figure 4 right): The kinematic structure at O II 4467.0 Å is more prominent among knot J3M where its velocity reaches
. Note there is little to no kinematic structure observed in knot J4 or other regions.
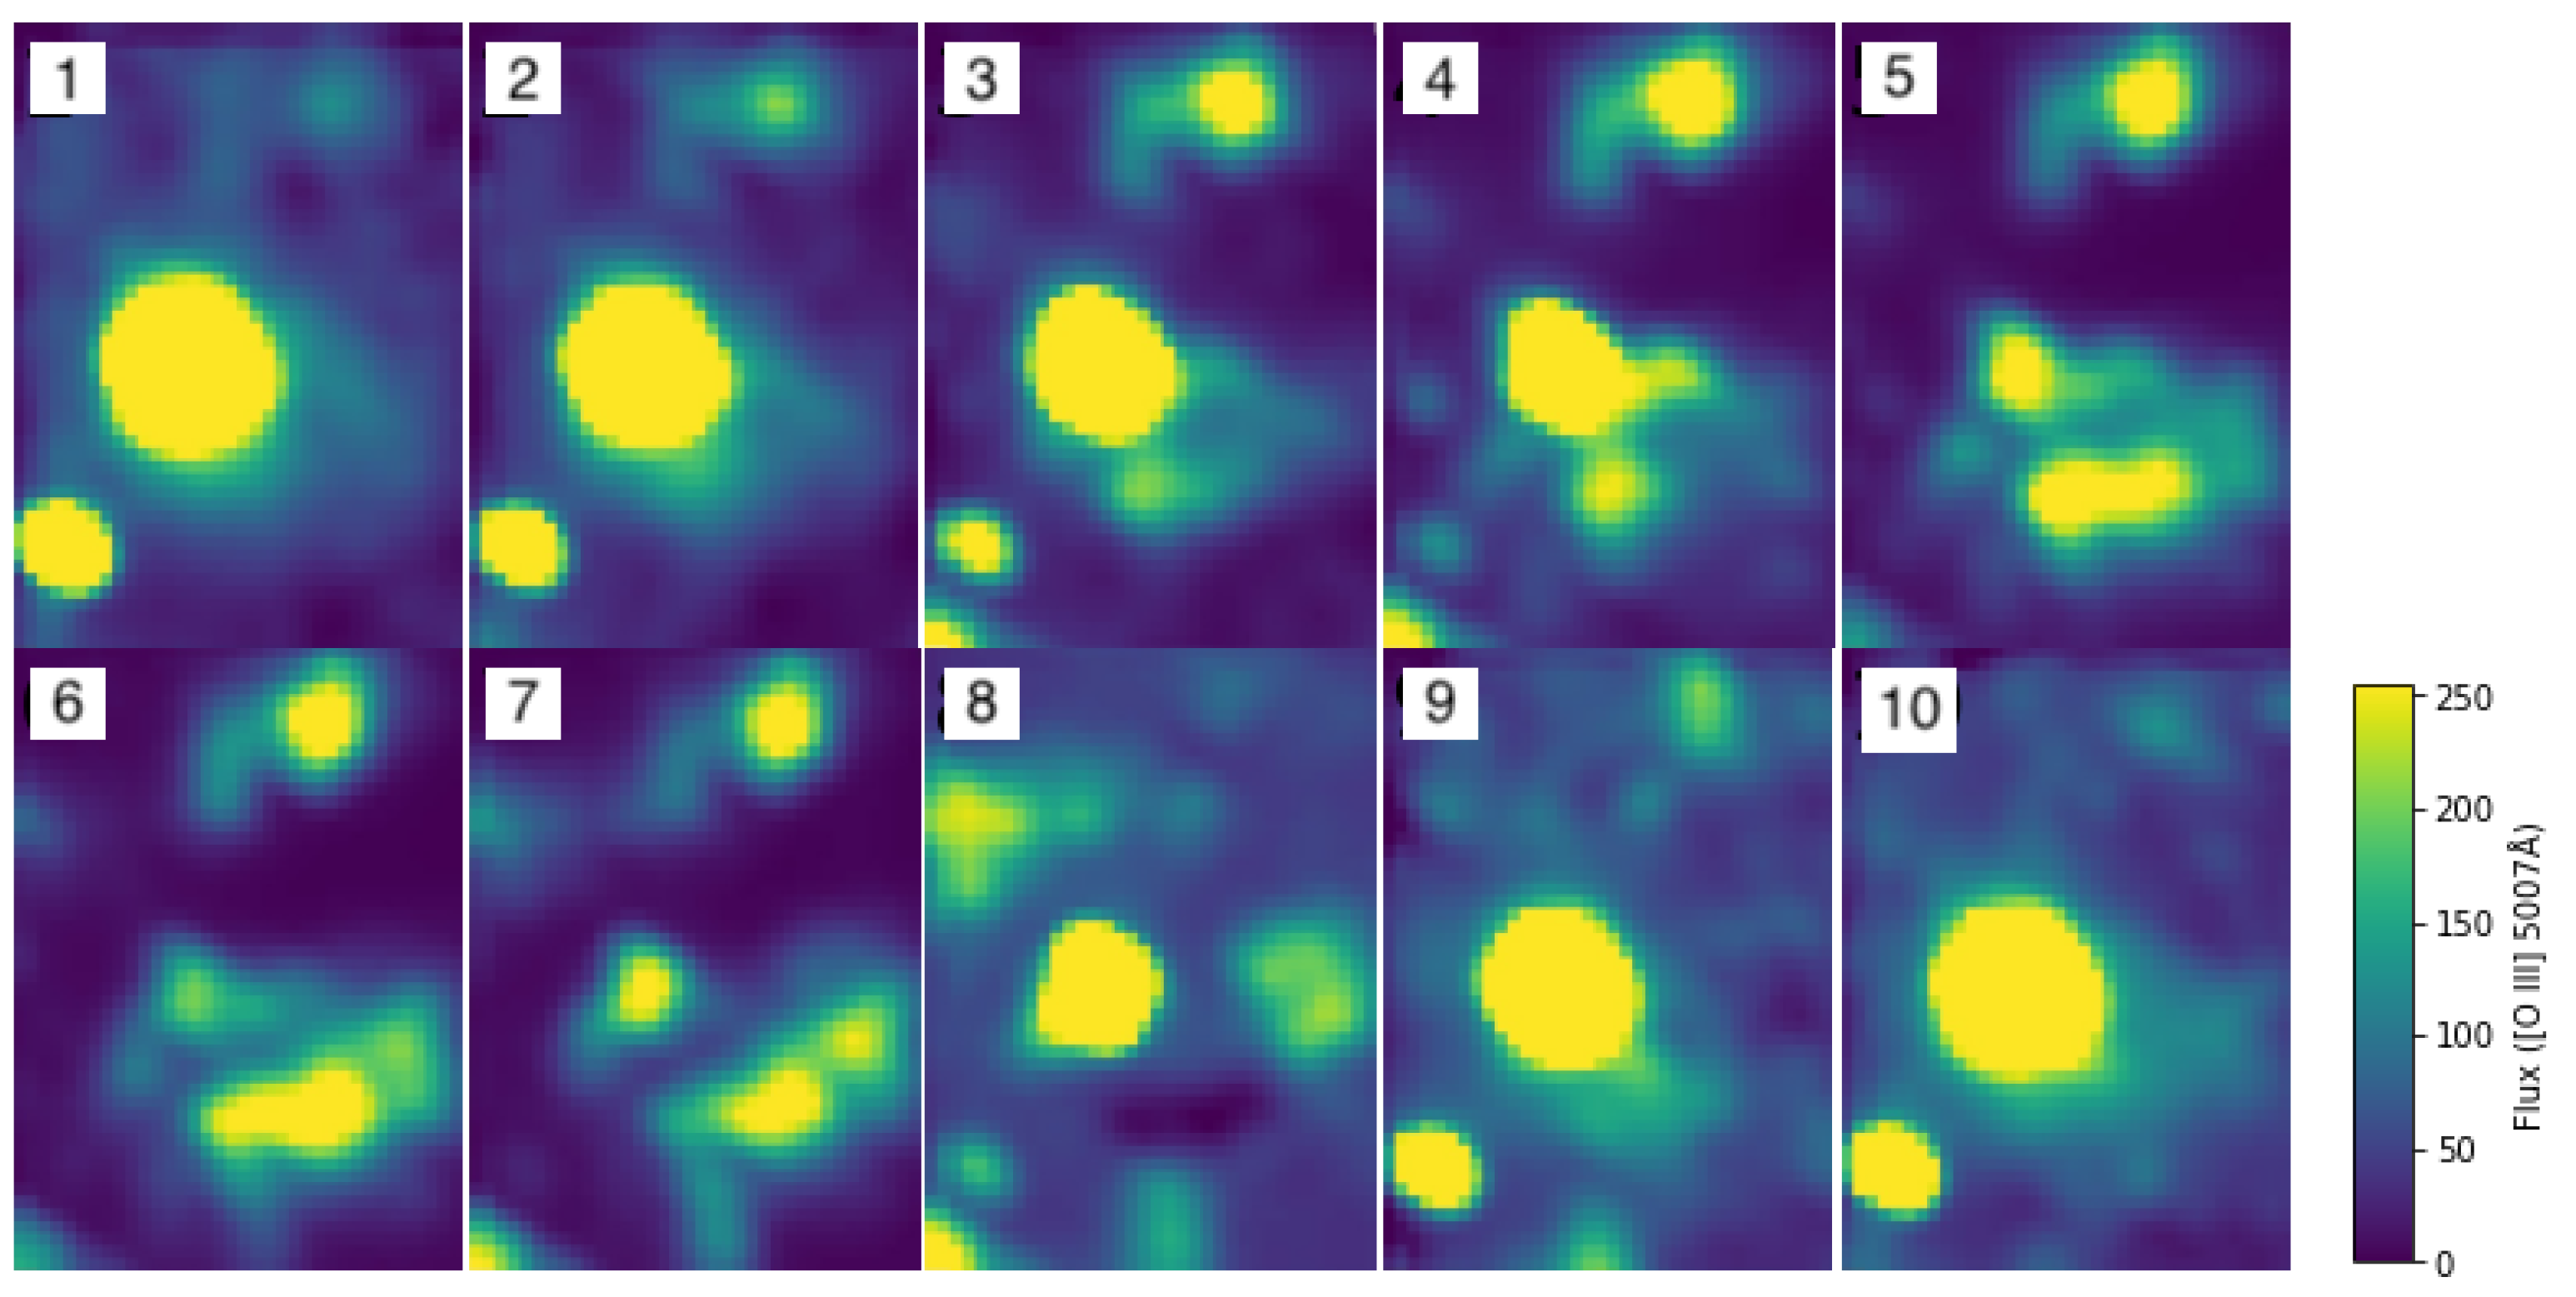
Line O III 5007.0 Å (
Figure 5): O III 5007 Å shows clear velocity structures located at knots J3 and J4 that start to appear from the region in between the lower right of the central star and knot J4 at frame 3. These kinematic structures last for 5 frames before they disappear again. The strongest flux is observed in frame 5. Velocity measured from spectral line fitting revealed knot J3T and J4M share the same velocity of
. Knot J3M shows the flux maximum at a velocity of
and J4R at
.
4. Discussion
Based on the work on A30 for the inner knot kinematic structure by [
11], the knots possess significant velocity components as confirmed by our IFU data. The better resolved studies by [
12] and [
10] permits them both to reach similar conclusions where the knots are not generated from a single episode of matter outflow but several. The observed kinematical structures suggest a rather complex process that hint at multiple ejection events in the star’s evolutionary history. Our work on emission line flux and kinematic structure mapping based on our IFU data supports such a hypothesis.
Our 5007 Å velocity map demonstrated similar velocities observed in gas clumps J3T and J4M. J3M possesses a slightly higher velocity and J4R the lowest. Variation of velocity among the gas clumps stays within 2 percent of the highest velocity observed for this ion of about observed in knot J3M. This ion can be understood as one segregated component among knots J3 and J4 in the system. Slightly lower velocity was observed in [Ne IV]. The negative velocity observed at both [O III] and [Ne IV] suggests a motion towards the observer while other ions including [Ne III], O II, He I are moving in a positive velocity that is up, towards the opposite direction. Variation in travelling speed and direction among different ions in the knots suggests different physical conditions and triggering events for where theses ions might have originated.
Our IFU emission line flux maps demonstrate the regional distribution of recombination and forbidden line species concentrated across different parts of the IFU’s FoV. Emission line maps of line species C II and C III were readily observable in knot J3 but it is completely absent in knot J4 or regions surrounding knot J4. Forbidden line species [Ne III] and [O III] are both present in knot J3 and J4. The species [Ne IV] is found in regions in between J4M, J4R and J4L and lower regions surrounding the central star, basically extending from close to knot J1 but stops at J4R.
The presence of forbidden lines species in areas with and without dust suggests that the nebula may have undergone multiple phases of ionization and cooling. The equatorial knots were found to coincide with regions believed to be dominated by the presence of dust [
13] [
14]. The absence or less prominent recombination lines in dusty regions could be due to the fact that these lines require higher densities to form.
5. Conclusions
Study of the chemical composition and velocity structure of A30 via IFU mapping of ions that arise from different ionization mechanisms reveals the dynamics of the ionization structure of the inner knots. In this work, we present IFU data with a field of view of 16"×12.3" that have been used to construct emission line flux and velocity maps covering partial knots J1 and J2 and complete knots J3 and J4.
Combining both our velocity and emission line flux maps, it is found that recombination species C II, C III, He I, O II and forbidden line species [O III], [Ne III] and [Ne IV] of high excitation level are distributed differently across the knots. They exhibit velocity variations with kinematic motions towards and away from the observer. Recombination line species C II, C III, He I, O II are observed to be most prominent in knot J3 and little to no detection in knot J4. Forbidden line species [O III], [Ne III] are distributed in both knots J3 and J4. However, they show different maximum velocities in opposite directions wrt the observer. Despite variations in ion species distribution the kinematic structures seen for [Ne IV] and [O III] are similar with the same bulk motions travelling in the same direction. Other species [Ne III], He I, and O II share similar velocities of 200 km s−1 up that travel in opposite direction to [Ne IV] and [O III]. Given the kinematic complexity of the knots revealed by this work, our data strongly implies multiple triggering events for A30 that created different physical conditions responsible for creation of these ionic species and their spatial and kinematic variation. Visualizing the gas motion across spectral lines for A30 via IFU observations provides a reliable basis for modelling the observed inner knots that have resulted via the complex interplay of physical processes that govern their formation and enrichment history.
Given the binary system suggestive light curve of A30 [
5], we will extend our work to the mapping of this region based on our IFU data in a future paper to gain a better understanding of the dynamics in its core central star region. We will further investigate the stellar spectrum itself which has extremely strong O VI emission and its connection to binary dynamics and possible evolutionary pathways for Wolf Rayet spectral type central stars.
Author Contributions
Conceptualization, QAP and KLC; methodology, QAP,KLC; software, KLC, AR; validation, KLC; formal analysis KLC; investigation, QAP, KLC, AR; resources, QAP; data curation, KLC, AR; writing—original draft preparation, KLC; writing—review and editing, QAP, AR, KLC; visualization, KLC; supervision QAP; project administration, QAP; funding acquisition QAP. All authors have read and agreed to the published version of the manuscript.
Funding
This research was funded by Hong Kong University Grants Council grant numbers 17326116 and 17300417.
Data Availability Statement
The datasets presented in this article are not readily available because the data are part of an ongoing study. Requests to access the datasets should be directed to QAP.
Acknowledgments
The IFU cubeset data reduction was performed by the ESO software HIPE - Herschel interactive processing environment and data analysis including spectral analysis, emission line flux mapping was done by python 3.11 and DS9.
Conflicts of Interest
The authors declare no conflicts of interest. The research funders had no role in the design of the study; in the collection, analyses, or interpretation of data; in the writing of the manuscript; or in the decision to publish the results.
References
- Greenstein, Jesse L., & Minkowski, R. (1964). The central stars of planetary nebulae of low surface brightness. The Astrophysical Journal, 140, 1601. [CrossRef]
- Abell, G. O. (1966). Properties of some old planetary nebulae. The Astrophysical Journal, 144, 259. [CrossRef]
- Jacoby, G. H. (1979). Unusual structure in the planetary nebulae Abell 30 and Abell 78. Publications of the Astronomical Society of the Pacific, 91, 754. [CrossRef]
- Jacoby, G. H., & Ford, H. C. (1983). The hydrogen-depleted planetary nebulae Abell 30 and Abell 78. The Astrophysical Journal, 266, 298. [CrossRef]
- Jacoby, George H, Hillwig, T. C., & Jones, D. (2020). Abell 30 - a binary central star among the born-again planetary nebulae. Monthly Notices of the Royal Astronomical Society: Letters, 498(1). [CrossRef]
- Badenes, C., Maoz, D., & Ciardullo, R. (2015). The progenitors and lifetimes of planetary nebulae. The Astrophysical Journal, 804(1). [CrossRef]
- Guerrero, M. A., & Manchado, A. (1996). The chemical abundances of the hydrogen-poor planetary nebulae A30 and A58. The Astrophysical Journal, 472(2), 711–722. [CrossRef]
- Simpson, J., Jones, D., Wesson, R., & García-Rojas, J. (2022). Abundance analysis of the J4 equatorial knot of the born-again planetary nebula A30. Research Notes of the AAS, 6(1), 4. [CrossRef]
- Photo album:: Abell 30:: November 15, 2012. Chandra. (n.d.). https://chandra.harvard.edu/photo/2012/a30/.
- Fang, X., Guerrero, M. A., Marquez-Lugo, R. A., Toalá, J. A., Arthur, S. J., Chu, Y.-H., Blair, W. P., Gruendl, R. A., Hamann, W.-R., Oskinova, L. M., & Todt, H. (2014). Expansion of hydrogen-poor knots in the born-again planetary nebulae A30 and A78. The Astrophysical Journal, 797(2), 100. [CrossRef]
- Jacoby, George H., & Chu, Y.-H. (1989). Kinematics of abell 30. Planetary Nebulae, 183–183. [CrossRef]
- Meaburn, J., & López, J. A. (1997). The dramatic kinematics of the hydrogen deficient planetary nebula Abell 30. Planetary Nebulae, 261–261. [CrossRef]
- Kerber, F., Roth, M., Rauch, T., Ageorges, N., Clayton, G. C., De Marco, O., & Koller, J. (2009). On the Distribution of Dust in the “Born-again’’ Planetary Nebula A 30. In The Biggest, Baddest, Coolest Stars ASP Conference Series vol 412 (pp. 235–235). Tennessee; Astronomical Society of the Pacific.
- Dinerstein, H. L., & Lester, D. F. (1984). Evidence for an infrared disk in the core of the extraordinary planetary nebula Abell 30. The Astrophysical Journal, 281, 702. [CrossRef]
Figure 1.
Left panel: IFU sampled area with a FoV of 16" x 12.3". IFU Spectra for each knot were extracted from the outlined regions in white overlaid on this 2-D emission line flux map centred on the spectral line [O III] 5007Å; Right panel: gas clump identification of the knots J1 - J4 overlaid on a high resolution optical image of the central inner region of A30 [
9].
Figure 2.
From left to right: emission line maps for the inner knots of A30 are presented, each specified with the spectral line species shown in the title of each panel. The primary colour bases - Red, Green and Blue were applied to each of these maps. [Ne III] in red; C III, [Ne IV] in green; CII, [O III] in blue.
Figure 3.
Left panel: Kinematic structure of [Ne III] 3968.5 Å shown in sequence from frame 1 to frame 6 corresponding to observed wavelengths (velocities) 3968.20 Å (), 3969.68 Å (), 3971.15 Å (), 3972.61 Å (), 3974.02 Å (), 3975.55 Å (). The strongest fluxes observed in frames 3 to 4 correspond to spectral wavelengths 3971.15 Å and 3972.61 Å with radial velocities of and , respectively. Right panel: Kinematic structure of He I 3889.75 Å demonstrated in sequence from frame 1 to frame 6 corresponding to observed wavelengths (velocities) 3888.91 Å (), 3890.38 Å (), 3891.84 Å (), 3893.31 Å (), 3894.78 Å () and ends at 3896.25 Å (). The strongest fluxes are observed in frames 4 to 5 corresponding to observed wavelengths 3893.31 Å and 3894.78 Å with radial velocities of and , respectively.
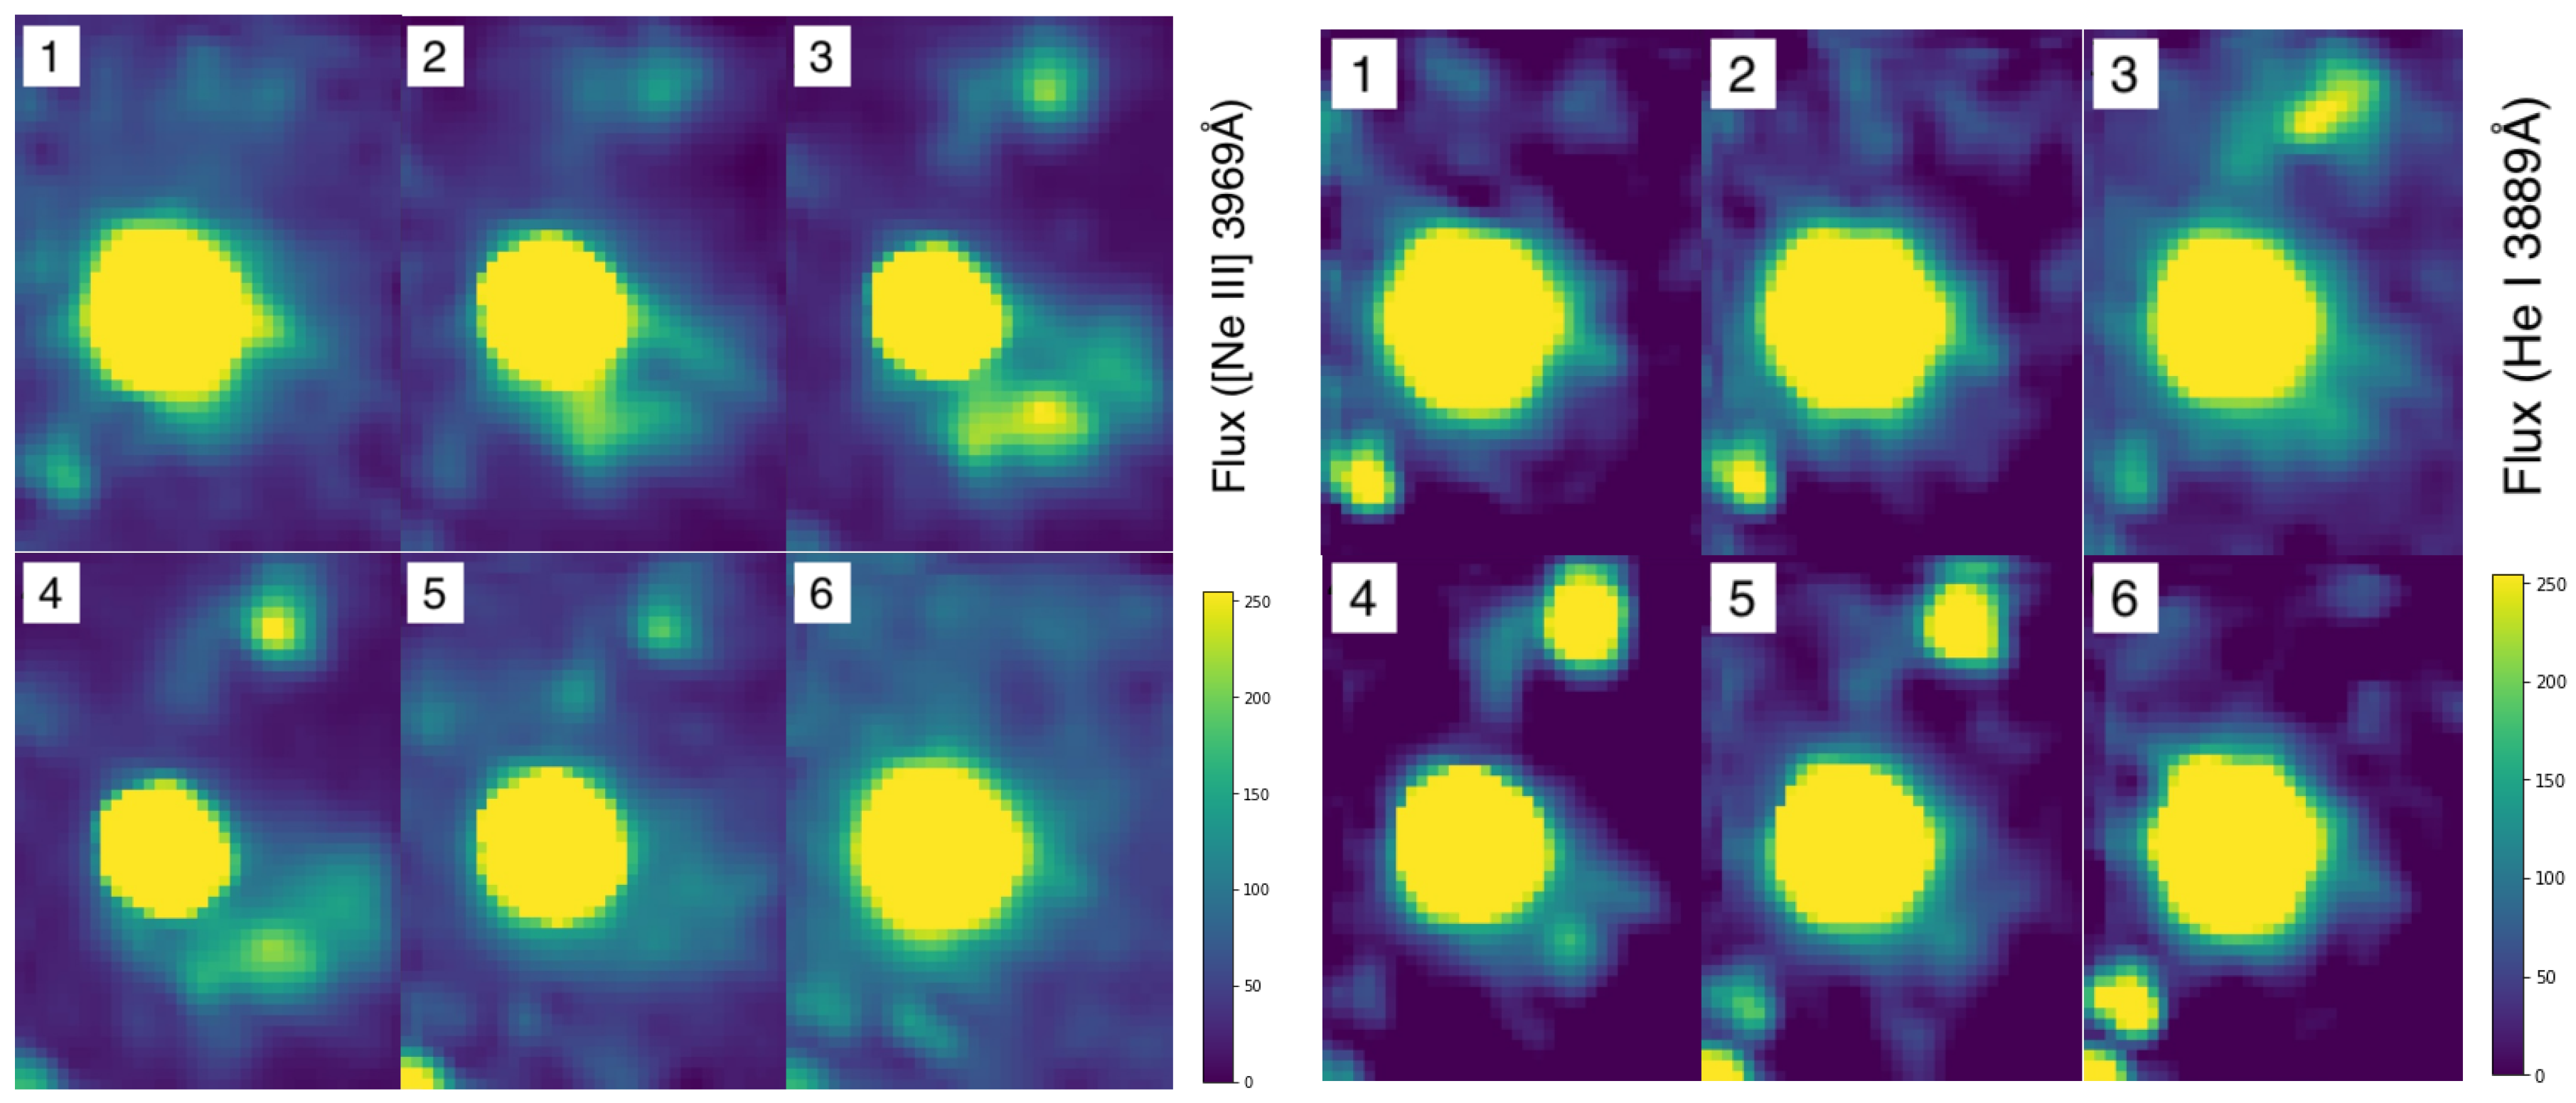
Figure 4.
Left panel: Kinematic structure of [Ne IV] 4725 Å shown in sequence from frame 1 to 6 corresponding to observed wavelengths (velocities) 4720.10 Å (), 4721.56 Å (), 4723.03 Å (), 4724.50 Å (), 4725.97 Å () and ends at 4727.44 Å (). Right panel: Kinematic structure of O II 4467 Å shown in sequence from frame 1 to frame 6 corresponding to observed wavelengths (velocities) 4467.51 Å (), 4468.98 Å (), 4470.45 Å (), 4471.91 Å () and ends at 4473.38 Å (). The strongest flux was observed in frame 4 and corresponds to an observed wavelength of 4471.91 Å ().
Figure 5.
Kinematic structure of [O III] 5007 Å shown from frame 1 to frame 10 corresponding to observed wavelengths (velocities) 4997.65 Å (), 4999.12 Å (), 5000.59 Å (), 5002.05 Å (), 5003.52 Å (), 5005.0 Å (), 5006.46 Å (), 5007.93 Å (), 5009.40 Å () and ends at 5010.87 Å (). The strongest fluxes observed in frames 5 to 6 correspond to spectral wavelengths 5003.52 Å and 5005.0 Å with velocities of and , respectively.
|
Disclaimer/Publisher’s Note: The statements, opinions and data contained in all publications are solely those of the individual author(s) and contributor(s) and not of MDPI and/or the editor(s). MDPI and/or the editor(s) disclaim responsibility for any injury to people or property resulting from any ideas, methods, instructions or products referred to in the content. |
© 2024 by the authors. Licensee MDPI, Basel, Switzerland. This article is an open access article distributed under the terms and conditions of the Creative Commons Attribution (CC BY) license (http://creativecommons.org/licenses/by/4.0/).
