
Submitted:
30 May 2024
Posted:
30 May 2024
You are already at the latest version
Abstract
Phytophthora cinnamomi is a devastating soil-borne plant pathogen. The primary source of P. cinnamomi infection is the soil, where the pathogen can persist for long periods. Effective prevention and management of this pathogen in tree crops require an early and reliable detection method. In this study, we develop a simple, fast, reliable, and sensitive method based on real-time quantitative PCR (qPCR) for P. cinnamomi detection and quantification directly in plant or soil samples. Primers were developed targeting the nuclear single-copy ras-related protein gene Ypt1, suitable for Phytophthora-specific PCR. The specificity of the assay was confirmed by testing it against genomic DNA from 50 isolates across 8 different Phytophthora clades, including very similar P. parvispora. The efficiency and reliability of the qPCR protocol were evaluated on challenging environmental samples, such as plant tissue of different host trees (walnut, chestnut, oak) and naturally infected soils in walnut orchards. The main outcome was the development of a qPCR method for the specific identification and quantification of P. cinnamomi in natural soil samples. Additionally, this study established a systematic and repeatable soil sampling method and developed an efficient soil DNA extraction technique to apply the developed qPCR in naturally infested soils of walnut orchards.
Keywords:
real-time PCR
; tree decline
; diagnostic
; early detection
; soil detection
1. Introduction
Phytophthora, a genus prominent among oomycetes, encompasses over 150 species, with the majority acting as plant pathogens causing collar and root diseases in various plant species. These diseases often lead to the decline and eventual demise of the afflicted plants [1].
Phytophthora cinnamomi is the causal agent of several epidemics across Europe and globally and it is considered one of the most devastating plant pathogens in the world [2]. Its impact spans forestry, horticulture, and nursery industries [3,4]. With a host range encompassing approximately 5,000 woody plant species across 70 countries, P. cinnamomi poses a substantial threat [5,6,7,8].
Although initially prevalent in tropical and subtropical regions, P. cinnamomi has demonstrated adaptability to cooler and drier environments [6,7]. Its ability to thrive saprophytically in soil or persist asymptomatically in non-host plants significantly contributes to its long-term survival. P. cinnamomi is reported particularly damaging to oaks [9,10], to chestnuts where it causes ink disease [11] and common walnuts (Juglans regia L.). This pathogen has led to substantial economic losses in all walnut growing regions like southern Europe, the USA, and Chile, [5,7,12,13,14,15]. Italy alone has witnessed the uprooting of over 150 hectares of common walnut orchards due to P. cinnamomi attacks [16].
Efforts to combat P. cinnamomi include research on resistant walnut rootstocks [17], the exploration of control strategies such as phosphite application [12,18] and containment and/or eradication of spot infections [19]. Early detection remains pivotal in managing P. cinnamomi diseases, especially in tree cultivation where plant diagnosis often occurs late. A timely diagnosis, in these cases, could be performed identifying the pathogen directly in soil surrounding plants, thus, allowing prevention and control of primary sources of infection.
The attention surrounding this pathogen is demonstrated by the number of identification methods developed over the years, starting from the first PCRs in 2003 up to sniffer dogs in 2023 [20]. Molecular genetic assays designed for P. cinnamomi detection, include polymerase chain reaction (PCR) [21], nested [22] and real-time PCR [23,24,25], loop-mediated isothermal amplification (LAMP) and Recombinase Polymerase Amplification Assay (RPA) [26,27]. However, many lack specificity, [28] and only a few based on real-time PCR capable of quantifying pathogens [24,25].
Naturally infested soils were not quantified in these previous studies; one soil type was usually studied following inoculation with the pathogens. Thus, there are no reports on how P. cinnamomi population in soil fluctuate in actual production fields.
The selection of diagnostic methods is typically driven by application needs, it depends on specificity and/or sensibility required, on necessity to have field application and/or pathogen quantification, moreover a suitable DNA extraction should be implemented, especially for environmental samples. For the correct management of tree cultivation, like walnut orchards in Northern Italy, we need a new P. cinnamomi early detection method especially efficient for soil samples analysis, specific enough to distinguish P. cinnamomi from other Phytophthora present in soil, sensible enough to detect the pathogen in very low amount typical of soil samples and with the possibility to quantify the pathogen biomass to know the level of infection.
In this context, the choice of genetic locus and in silico sequence analysis are crucial. While the internal transcribed spacer (ITS) of nuclear DNA is commonly used, it may not effectively discriminate between closely related Phytophthora species. For diploid organisms like Phytophthora, nuclear single-copy genes, like the ras-related Ypt1 gene [29], offer advantages for phylogenetic analysis and species discrimination. Moreover, this kind of genes, devoid of intergenomic concerted evolution, could provide accurate quantification of pathogen biomass, when analyzed in quantitative real-time PCR.
Successful molecular diagnostics hinge on obtaining sufficient, high-quality DNA from samples. Soil DNA extraction is often challenged by the low amount of DNA of single organism present in soil and by the presence of polymerase inhibitors such as polyphenols, polysaccharides, and humic acids [30].
Overcoming these obstacles, a highly sensitive and specific qPCR methodology based on the ras-related Ypt1 gene was developed. The objectives of this study were to (i) develop a qPCR assay for the sensitive and specific detection and quantification of P. cinnamomi, (ii) adapt the assay to the analysis of soil samples by improving DNA extraction method and sampling procedure for early detection of P. cinnamomi in field, (iii) validate the qPCR assays in walnut orchards infected by P. cinnamomi.
2. Materials and Methods
2.1. Phytophthora Isolates and Isolation
The isolates used in this study are listed in Table 1. A total of 50 Phytophthora isolates belonging to clades 1, 2 ,4, 6, 7, 8, 9, 10 plus two Pythium species (Table 1) were used to test the specificity and sensitivity of the primers set developed for P. cinnamomi diagnosis. Several P. cinnamomi isolates obtained from woody plants (walnut, oak, or chestnut) were used (Table 1). DNA of the P. cinnamomi isolate CREADC-Om274 from walnut was used as reference to set up real-time PCR conditions.
P. cinnamomi isolates were isolated from symptomatic plants from several Italian regions. Most of them were obtained from naturally infected common walnut (Juglans regia L.) trees grown in commercially fruit orchards of northern Italy. Stock cultures are preserved in the dark both in sterile distilled water at room temperature and at 10 °C, as well as in oatmeal agar (OA - Sigma-Aldrich, Saint Louis, MI, USA) slant tubes with mineral oil at 15 ± 2°Cat CREA-DC culture collection in Rome. Pure cultures were obtained by transferring single hyphal tip from the edge of the colonies onto potato dextrose agar (PDA) (Oxoid, Basingstoke, UK).
Tissue fragments were obtained from collars or stems of infected woody material cut from the margins of necrotic lesions. Tissue fragments obtained from healthy plants were used as control. Small tissue fragments of about 3-5 mm × 3-5 mm previously surface disinfested for 1 min in a 1 % NaOCl solution, rinsed for 5 min in sterile distilled water, were either plated onto P5ARPH selective medium [31] or placed in a 1.5 ml Eppendorf ® tube for DNA extraction and stored at -20 °C until use.
2.2. DNA Extraction from Pure Colony and Plant Tissue
For all Phytophthora and Pythium isolates used in this study, mycelial DNA was extracted from pure cultures grown on PDA at 25 °C for 5 days in the dark. Mycelium was scraped and ground to a fine powder under liquid nitrogen, placed in a 1.5 ml sterile Eppendorf® tube, and stored at -20 °C until use. Total DNA was extracted using Wizard genomic DNA purification kit (Promega, Madison, WI, USA) following manufacturer’s instructions.
DNA extraction from plant tissue was performed on approximately 100 mg of tissue fragments. Samples were homogenized by grinding in liquid nitrogen and total DNA was extracted using the DNeasy Plant Mini kit (QIAGEN GmbH, Hilden, Germany) following the manufacturer’s instructions.
2.3. Real-Time PCR Primer and Probe Design for P. cinnamomi
The single copy ras-related protein gene Ypt1 was chosen to design primers and probe. For this purpose, 51 Ypt1 gene sequences of Phytophthora spp. representing all ten clades of Phytophthora philogeny and one Ypt1 sequence of Pythium aphanidermatum, were retrieved from NCBI GenBank Database (Table S1) and aligned using the multiple sequence comparison by log-expectation (MUSCLE) method [32], to find the unique polymorphic regions of P. cinnamomi. Based on these regions, primers and probes were designed by PRIMER3 0.4.0 (http://frodo.wi.mit.edu/primer3/) [33].The probe was labelled at the 5′ end with 6-carboxyfluorescein (FAM) as a reporter dye and modified at the 3′ end with the quencher Black Hole Quencher1 (BHQ1). Primers and probe melting temperatures (TM), were calculated with PRIMER 3 software [34].
2.4. qPCR Conditions
All Real-time PCR reactions were run in MultiplateTM PCR Plates 96-well clear (Bio-Rad, UK), using a CFX96 C1000 Thermal Cycler Real-Time System (Bio-Rad- Hercules, California, USA). Data acquisition and analysis were obtained by the supplied Bio-Rad CFX Manager software version 3.0 (3.0.1224.1015) according to the manufacturer’s instructions.
Each 15-μl reaction contained 1μl of genomic DNA,1x GoTaq® G2 Hot Start Buffer (Promega), 5 mM MgCl2, 0.2 mM each dNTP, 0.33 μM of each primer, 0.13 μM of the probe, and GoTaq® G2 Hot Start DNA Polymerase (Promega). Negative control reactions contained 1µl of sterile distilled water. Reactions were performed under the following conditions: 10 min at 95 °C, followed by 40 cycles at 95 °C for 20 s, and 62 °C for 20 s. Fluorescence was monitored in each PCR cycle during the annealing–extension phase at 62 °C. The cycle threshold (Ct) value was calculated automatically using software version 3.0 (3.0.1224.1015) by determining the PCR cycle number at which the reporter fluorescence exceeded the background. Triplicate reactions were performed in each assay, and each assay was repeated at least twice.
Nested real-time PCR conditions were as follow: first-round PCR was performed with primers YPh1-fwd and YPh1-rev (Table 3) for Phytophthora spp. amplification in conventional PCR following conditions described by Schena [21]. The second round was carried out with 1μl of the first-round PCR product as template in real-time PCR using the primer pair and the probe developed in this study at the conditions described above.
2.5. Validation of the Real-TimePCR Method
To assess the analytical sensitivity a log-linear standard curve was generated with the following concentrations of P. cinnamomi isolate CREADC-Om274 genomic DNA: 5, 2, 1 ng/μl, 500, 200, 100, 50, 20, 10, 5, 2, 1 pg/μl, 500, 200, 100, 50 fg/μl, by plotting logarithms of known concentrations of target DNA against the Ct values, considering three replicates for each concentration level. The resulting regression equations were used to calculate P. cinnamomi DNA amount in unknown samples.
The limit of detection (LOD, expressed in ng) was determined as the lowest amount of target genomic DNA that is amplified in 100% of the replicates. Linearity of the method was evaluated on three different P. cinnamomi isolates: CREADC-Om274 from walnut, CREADC-Om139 from chestnut, and CREADC-Om144 from oak.
To determine the Ct Cut-off value, i.e. the Ct above which signals are considered negative, we have analyzed serial dilutions, i.e. 10, 1 ng/μl, 100, 10, 1 pg/μl, 100, 50, 10 fg/μl, of P. cinnamomi isolate CREADC-Om274 genomic DNA, each concentration (group) with five replicates. The cut-off cycle was obtained from the mean Ct of the last group of samples with at least 3 replicates positive for DNA concentration out of five, plus 0.5 (to consider the difference in threshold chosen between runs).
The analytical specificity of the qPCR was tested using 1ng/μl DNA gDNA from the 50 Phytophthora spp. and the two Pythium spp. isolates listed in Table 1. Prior to specificity test, all DNA samples were subjected to a conventional PCR with primers ITS6 and ITS4 according to Cooke [35] to check their ability to be amplified. For pathogen quantification, a standard curve with tenfold dilutions from 1 ng/μl to 100 fg/μl of P. cinnamomi isolate CREADC-Om274 genomic DNA is performed.
2.6. Soil DNA Extraction and Sampling
For soil DNA extraction from pot plants, Quick-DNATM Fecal/Soil Microbe Midi Prep Kit (Zymo Research, Irvine, CA, USA) on 3-5 g of soil was used following manufacturer’s instructions. For field soil samples the following modifications were made: 15g of soil for each sample were placed in a 50 ml Falcon® containing Bashing BeadsTM, 100 µl of Proteinase K (20 mg/ml; Sigma, Saint Louis, MO, USA), and 27 ml of lysis buffer (0.1 M Tris-HCl pH 8, 0.1 M EDTA, 0.1 M Na2HPO4, 1.5 M NaCl, 1% CTAB (hexadecyltrimethylammonium bromide; pH 8). Homogenization was performed by Fast-Prep 24 5G (MP Biomedicals, USA) at the speed of 6.0 m/s, using Adapter BigPrep for 50 ml Falcon®, for 40 s. Then, 6 ml of 10% SDS were added, and samples were incubated for 2 hours at 65 °C followed by centrifugation at 6,000 × g for 10 min. The supernatant was taken and filtered with the Zymo Spin V-E columns, provided by the Quick-DNATM Fecal/Soil Microbe Midi Prep Kit (Zymo Research, Irvine, CA, USA). Subsequent DNA purification steps were performed following Zymo Research kit manufacturer’s instructions. Total DNA was suspended in 150 µl DNA Elution Buffer. This volume was concentrated to 45 µl by ethanol precipitation. Soil DNA extractions was performed in 3 replicates per sample. After the extraction procedures, the concentration and quality of DNA was checked by Qubit with the dsDNA HS Assay Kit (Invitrogen, Carlsbad, CA, USA) and by Nanodrop ND-1000 (Thermo Fisher scientific Inc., USA). DNA was stored at -20 °C until use.
To test the effect of the matrix on the amplification efficiency, DNA extraction of the different soils analysed were spiked with known concentrations of P. cinnamomi isolate CREADC-Om274 genomic DNA, namely from 1 ng/μl to 100 fg/μl, as standard curves.
Sampling: Soil samples (250 g) were collected as shown in Figure 1. In the orchard, walnut trees are arranged in rows, at 4-5 m from each other, with approximately 7-8 m between one row and the other. Soil samples were collected at 0,5 m, 1,5 m, 2,5 m, and 3,5 m from the tree along the row at the two different depths: 20 cm and 40 cm (Figure 1). Soil samples were also collected between one row and the other (inter-row) at 1,5m from the tree at the two depths of 20 cm and 40 cm.
Non-dried soil samples were extracted upon arrival to the laboratory or after storage at -80 °C. Diseased plant material as well as soil samples were collected in spring and fall.
3. Results
3.1. Primers and Probe Design
The Ypt1 gene region amplified by YPh1-fwd and YPh1-rev (Figure 2) showed a high interspecific variability allowing differentiation of P. cinnamomi from all the other species considered. Based on the multiple sequence alignments of this region, conducted with MUSCLE, primers were designed in the polymorphic region intron 3 (Figure 2; Table 2). Phytophthora sequences present in GenBank were used for comparison. A total of 51 Ypt1 gene sequences representative of 48 different Phytophthora species and two Pythium species were compared (Table S1).
3.2. qPCR Sensitivity and Linearity
Optimized parameters for reagents mix and real-time PCR conditions (e.g., primer’s and MgCl2 concentration, temperature, etc.) have been described in material and methods. Analytical standard curve with dilutions from 5 ng/μl to 50 fg/μl of P. cinnamomi isolate CREADC-Om274 genomic DNA was performed (Figure 3). Results showed that the sensitivity limit of this qPCR assay is 50 fg, since no reaction was observed for lower amount. The limit of detection (LOD) was 200 fg (Figure 3). In these conditions, cut-off Ct value threshold for positive amplification, calculated as described in material and methods, was Ct 37.43. The combination of the above-described primer pair and probe showed high qPCR efficiency rates (97.7%) with high linear relationship (y = –3.381x + 42.82, R2 = 0.9937) (Figure 3) between P. cinnamomi genomic DNA dilutions (log transformed) and Ct values. Reaction’s linearity did not change among different isolates of P. cinnamomi obtained from different hosts, i.e. P. cinnamomi CREADC-Om274 from walnut, CREADC-Om139 from chestnut, and CREADC-Om144 from oak (Figure S1). Consequently, standard curves, set from 1 ng/μl to 100 fg/μl, were used to quantify the amount of P. cinnamomi genomic DNA in samples.
Figure 3 shows the sensitivity of the detection assay when run under optimal conditions with DNA from pure culture of the pathogen diluted in pure sterile distilled water. When environmental samples are run, especially soil samples, a reduction of sensitivity could be observed that is dependent from soil to soil. To prevent inhibitor effects of environmental samples we have used an inhibitor-resistant Taq Polymerase like GoTaq® G2 Hot Start DNA Polymerase (Promega), that really sometimes makes the difference between amplification or not. Nevertheless, a modification of standard curve could occur.
3.3. Specificity
Specificity was tested on genomic DNA of 50 isolates belonging to 8 different Phytophthora clades and all the results obtained have been summarized in Table 1. Detection in qPCR occurred only for the expected sequences of P. cinnamomi. None of the other Phytophthora species showed cross amplifications neither the closely related ones belonging to clade 7. P. alni subsp. alni, P. alni subsp. multiformis, P. alni subsp. uniformis, P.cambivora (subclade 7a), P. niederhauserii (subclade 7b) and P. parvispora (subclade 7c as P. cinnamomi) did not amplify with our method, neither at high DNA concentrations (10 ng).
3.4. Analysis of Naturally Infected Samples
3.4.1. Plant Material
Plant material was obtained both from symptomatic and asymptomatic P. cinnamomi host trees in different Italian regions: tissue fragments were obtained from collars or stems of infected woody material cut from the margins of necrotic lesions for symptomatic plants or from healthy collar woody material for healthy plants. Each sample has been analysed by isolation and by the real-time PCR developed in this study. All samples obtained from symptomatic plants were positive for P. cinnamomi in qPCR runs showed a range going from 24,1 to 1,6 pg of P. cinnamomi DNA per mg of plant tissue. Control samples obtained from healthy plants were all negative (Table 3). P.cinnamomi was isolated from most of the same symptomatic samples, however isolation method is not always successful .
3.4.2. Soil
DNA extraction from peat soils, present in Rhododendron potted plants was performed with the commercial Kit (Zymo Research) following the manufacturer’s instructions, easily obtaining good DNA amount (average 60 ng/µl). Testing field soil samples result completely different. First of all, DNA extractions from field soil samples resulted far less efficient: low level of total DNA (down to 2-5 ng/µl) and high levels of polymerase inhibitors were obtained. Therefore, a modified extraction method was developed adding a home-made step before proceeding with the commercial kit (Zymo Research). In this additional step aimed at obtaining higher DNA yields, we used higher amount of starting soil material (from 3-5 grams up to 15 grams) and exploited harsher conditions for DNA extraction using proteinase, SDS and a step of incubation time of two hours at 65 °C.
Moreover, different soil samples tested, especially those coming from agricultural exploited field samples, cause reduction in qPCR sensitivity when spiked with known amount of P. cinnamomi DNA. Figure 4 shows some examples: DNA extraction solutions from b) and d) soils clearly cause a shift in sensitivity of the standard curve compared to the standard curve created with distilled water (a); the DNA extraction solution from c) soil, instead, has very low or no impact on the ‘optimal’ standard curve (a).
Since different soils affect qPCR efficiency in different extent, qPCRs of environmental samples are normalized with standard curves prepared in the DNA extract of a healthy sample of the soil under examination.
To define the best sampling procedure for soil samples, distribution of P. cinnamomi in soils of infected walnut orchards was analyzed by systematically sampling soils around infected walnut trees following the schema shown in Figure 1.
Results of the sampling experiment are shown in Table 4. Soil samples (250 g) around two infected trees, Zn3/18 and Zn8/19 (see Table 3) were collected following the schema in Figure 4, both in spring and in autumn, each position being collected two times 15 days apart to verify repeatability over time. The only position that shows the presence of P. cinnamomi in a repeatable manner, both spring and in autumn, for both samples collected 15 days apart, at 20 and 40 cm, in both trees, was the position at 50 cm (0,5m) from the tree. Therefore, for field soil samples, 250 g of soil were collected right and left along the row at 50 cm from the trunk, of diseased or healthy trees and pooled to reach 0.5 kg. This procedure was applied at two different depths: 20 and 40 cm.
Phytophthora cinnamomi quantification method was firstly tested on potted soil samples from symptomatic Rhododendron plants obtaining average quantifications ranging from 140,4 to 390,1 pg of P. cinnamomi DNA /gram soil (Table 5).
The qPCR developed method was used to assess P. cinnamomi occurrence and inoculum amount in soils where symptomatic walnut plants were present. Soil samples collected from 4 different walnut orchards (Zn, Tas, Dossei and BD) were analyzed in these conditions of sampling, DNA extraction and qPCR/nested qPCR analysis. Results are shown in Table 5.
Soil samples around symptomatic trees were always positive for the presence of P. cinnamomi, both at 20 and 40 cm depth, but not always in direct qPCR, in some cases nested PCR is needed. The qPCR method had a limit of sensitivity of 50 fg/μl comprehensive of technical limits, including the size of soil sample, since it detects up to 0,25 pg target DNA/gram soil. Below this value, the potential presence of the pathogen results undetected in direct qPCR. To improve sensitivity, all undetected samples have been previously amplified with YPh1F/YPh2R primers (Table 2) and then subjected to the real-time PCR described above. This resulting nested qPCR, if on one side compromised quantification, on the other side allowed the detection of P. cinnamomi presence (Table 5) beyond the above-mentioned limit. In most cases soil samples around symptomatic walnut trees result positive to direct qPCR, ranging from 2,49 to 267.0 pg P. cinnamomi DNA/gram soil (Table 5). Except few walnut trees, like Tas 16/12 and Tas 11/18, amount of P. cinnamomi DNA/gram soil is very low, often below 10 pg.
Soil samples around asymptomatic trees in Table 5 (Tas 10/8, 3/9 and 7/12) were negative when tested in qPCR or nested qPCR in the conditions described. These threes were chosen in the same orchard (Tas) of symptomatic trees under study far away from infection site present in the orchard and considered healthy. Only one asymptomatic walnut tree, Dossei 2, between two symptomatic plants, Dossei 1 and Dossei 3, gave positive results, only in nested qPCR. This plant one year later showed typical symptoms of P. cinnamomi disease. Also, the other asymptomatic plants with negative results (Table 5) were monitored one year later and did not show any symptom.
4. Discussion
Soilborne diseases are a major limiting factor for the cultivation of most crops and are costly and difficult to manage. Practical and economic methods of disease control are limited once a crop has been established. Detecting plant pathogens in soil is a critical aspect of plant disease management and agricultural sustainability. Plant pathogens, including bacteria, fungi, oomycetes, nematodes, and viruses, can reside in the soil and pose significant threats to crops by causing diseases that reduce yield and quality. Early detection and accurate identification of soil-borne pathogens result thus essential for implementing effective control measures and minimizing economic losses.
P. cinnamomi, is a very invasive soil-borne plant pathogen affecting thousands of known hosts, including ornamental plants, horticultural and tree crops, and natural ecosystems. In tree crops like walnut or chestnut, the decline caused by P. cinnamomi starts from roots often remaining unnoticed for years. When symptoms like wilting, yellowing, and retention of dried foliage become visible on the tree crown, rot of feeder roots, larger roots, crowns, and stems [5] are so severe to be fatal. Plant detection analysis at the crown and stems level is destructive, often tardive and can exacerbate disease spread, resulting in significant economic losses.
Early detection of P. cinnamomi in soil is a promising approach to managing infected tree orchards. However, detecting plant pathogens in soil presents several challenges: i) Pathogen Diversity: The soil is a complex environment with diverse microbial communities. Phytophthora populations in soils exhibit significant variability in terms of diversity and species richness due to the polyphagy of these species and their ability to adapt to different environments, [36]. Distinguishing P. cinnamomi from other Phytophthora species requires highly specific methods; ii) Low Abundance: Pathogens are often present in low numbers, making detection difficult. Sensitive techniques like real-time PCR or Next Generation Sequencing are essential for identifying these low-abundance pathogens; iii) Soil Interference: Soil components can inhibit detection methods. Sample preparation and DNA extraction techniques must minimize these interferences to ensure accurate results; iv) Environmental Variability: Soil properties such as pH, moisture, and organic matter content can affect pathogen survival and detection. Standardizing sampling and analysis protocols is crucial for reliable detection.
To address these challenges, we developed a detection procedure, including a new qPCR assay, for early detection of P. cinnamomi in field soil samples from tree crop orchards.
To assure specificity, the qPCR developed here has been based on the ras-related protein gene Ypt1 [37]. which exhibits high interspecific genetic variability and low intraspecific variation, facilitating diagnostic assays [37].
In addition, this gene is well represented in GenBank Database providing reference material for Phytophthora species identification. In the present study, the alignment of 51 Ypt1 gene sequences belonging to 48 different Phytophthora species and two Pythium species (Table 2) has shown that the intron 3 region of Ypt1 gene is the most suitable one for designing primers and probes that specifically identify P. cinnamomi. Specificity was tested in vitro against 50 isolates belonging to 21 Phytophthora species of clades 1, 2 ,4, 6, 7, 8, 9, and 10, including 10 isolates of P. cinnamomi (Table 1).[28] underlined the importance to directly test the efficiency and specificity of the primers against the most closely related species. Particular attention was given to Phytophthora species of clade 7, with emphasis on the same subclade (7c) of P. cinnamomi such as P. parvispora, to avoid false positives.
The qPCR method’s lower limit of detection (LOD) is 200 fg of total genomic DNA, comparable to other real-time diagnostic tools for Phytophthora [24,37,38].
We perform a nested real-time PCR approach to increase sensitivity. However, the increase in sensitivity was not so significant likely because single copies of a target DNA were amplified by a single round of PCR, and the nested PCR only improved the signal strength without increasing sensitivity, as already reported by Schena [37]. Further lowering the sensitivity limit was deemed impractical; instead, improving DNA extraction methods was more effective.
The presence of interference components is a problem of DNA extractions from all environmental samples. DNA extraction from plant material can be challenging, especially from woody plants like walnut or chestnut, containing high amount of tannins that inhibit DNA polymerase in PCR reactions. Our extraction method and the qPCR assay effectively detect P. cinnamomi in woody host plants obtaining values around 10-20 pg of pathogen DNA /mg host tissue (Table 3). Sexual oospores, asexual chlamydospores, intracellular hyphal aggregates and lignituber formations are thought to enable P. cinnamomi survival for long periods under adverse conditions [39]. Expression of pathogen amount as DNA amount would encompass all these different forms of the pathogen including mycelium.
Soil DNA extraction is even more challenging, due to variability in soil physical and chemical composition and microbiome profile. Main problems are the occurrence of Taq polymerase inhibitors and the low concentration of the target pathogen DNA. We improved DNA extraction by analyzing larger soil samples (10-15 grams). Actually, a further improvement in soil DNA extraction could be obtained by increasing the amount of starting soil material even further, like 20-100 gram of soil. The problem of Taq polymerase inhibitors that were not eliminated with the DNA extraction procedure has been minimized by using Taq polymerase specifically resistant to inhibitors in the qPCR assay. Despite these improvements, still a reduction in sensitivity of the method can occur, especially in agricultural exploited field samples, characterized by low biomass (low DNA) and high inhibitors (Figure 4). The solution has been to normalize the sensitivity of each specific soil by building standard curve in presence of soil extracts.
Moreover, standardizing sampling protocols for soil sample collection is essential for consistent results. We studied the pathogen distribution around infected walnut trees in Northern Italy orchards, to check if there were typical patterns of P. cinnamomi presence associated with infected trees and to optimize sampling procedures. Results show that infected trees were consistently associated with P. cinnamomi DNA while no pathogen DNA was detected around healthy plants. Infected trees were always associated with P. cinnamomi at 50 cm from the tree both at 20 cm and 40 cm in depth. At furthest distances from the infected tree, the presence of P. cinnamomi seem more casual, changing at 15 days apart or in spring/autumn. Phytophthora species seem to stay quite above ground, for example P. infestans did not percolate through the soil but instead remained at the surface [40].
Quantifying pathogens in open field soils is challenging due to soil complexity and environmental factors. Precisely because of this complexity, simulation in controlled environment with artificial inoculation in pots couldn't have reflected situation in open field (already just analysis of P. cinnamomi DNA in pot with Rhododendron show us that in pot the pathogen remains more confined and concentrate and detection is easier). Thus, we worked directly in field, necessarily with natural infections.
Results show that P. cinnamomi infective soil could contain different amount of the pathogen ranging from the qPCR detection limit, set at 0,25 pg of pathogen DNA/g of soil, to 267 pg of pathogen DNA/g of soil (Table 5). Walnut Tas 11/18 is an exception with so high value of P. cinnamomi DNA amount (Table 5), with much lower (<10pg) amount of pathogen DNA/g of soil being the rule. With nested qPCR we show that even lower amount of P. cinnamomi in soil, <25 pg of pathogen DNA/g of soil (Table 5), is associated with P. cinnamomi infected tree.
Correlation between pathogen populations amount and development of symptoms as number of lesions on the plant has already been showed for a Phytophthora species [40]. More studies would be needed to establish the correlation between amount of P. cinnamomi and rate of disease on walnut, even if in case of tree this correlation would be difficult to study since the disease develop within years. Anyhow the availability of a quantification method represents the starting point for such studies. Moreover, the use of a quantification method may help the management of samples with DNA values straddling the detection limit, very common for soil samples.
This work shows that the presence of P. cinnamomi DNA is associated with walnut infected trees, and this already helps growers to make informed walnut management decisions.
In conclusion, we developed a qPCR method to detect and quantify P. cinnamomi DNA in mycelium, plant tissue, and especially in field soil samples. Pathogen quantification may contribute to estimate disease potential risk and to set up adequate control strategies avoiding pathogen dissemination This molecular approach is a valuable tool for managing P. cinnamomi in agricultural commercial activities including walnut production. In addition, this method allows the detection of P. cinnamomi in soil prior to plantation/cultivation to prevent future damage.
Supplementary Materials
The following supporting information can be downloaded at the website of this paper posted on Preprints.org. Table S1: Accession numbers of Ypt1 gene sequences from different Phytophthora and Pythium species used in this study, Figure S1: Standard curves of different P. cinnamomi isolates.
Author Contributions
Conceptualization: A.H. and A.B.; Methodology A.H., L.L. and L.T.; Investigation: A.H., L.L. and S.V.; Data Curation: A.H., L.T., S.V. and L.L.; Writing-original draft: A.H.; Writing-review and editing: A.H. and L.L.; Supervision A.H. and A.B.; Funding acquisition: A.B. All authors have read and agreed to the published version of the manuscript.
Funding
This work was funded by Italian Ministry of Agriculture (MiPAAF prot. 48606- 8/11/2018), project PORT NOC: Valutazione di portainnesti per la tolleranza/resistenza a Phytophthora e black-line e valorizzazione di varietà di Juglans regia compatibili. The part on chestnut was also funded by Italian Ministry of Agriculture (MASAF DM n. 667521 del 30/12/2022) Project VALO.RE IN C.A.M.P.O: Azioni di VALOrizzazione e REcupero per le filiere Italiane di Nocciolo, CAstagno, Mandorlo, Pistacchio e carrubO”.
Institutional Review Board Statement
Not applicable.
Data Availability Statement
The original contributions presented in the study are included in the article, further inquiries can be directed to the corresponding author.
Conflicts of Interest
The authors declare no conflicts of interest.
References
- Yang, X.; Tyler, B.M., Hong, C. An expanded phylogeny for the genus Phytophthora. IMA Fungus 2017, 8, 355–384. [CrossRef]
- Hardham, A.R.; Blackman, L.M. Phytophthora cinnamomi . Mol. Plant. Pathol. 2018, l19(2), 260–285. [Google Scholar] [CrossRef] [PubMed]
- Erwin, D.C.; Ribeiro, O.K. Phytophthora diseases worldwide. APS Press, St. Paul, MN (USA), 1996; pp. 562, ISBN 978-0-89054-212-5.
- Kamoun, S.; Furzer, O.; Jones, J.D.G.; Judelson, H.S.; Ali, G.S.; Dalio, R.J.D.; Roy, S.G.; Schena, L.; Zambounis, A.; Panabières, F.; et al. The Top 10 oomycete pathogens in molecular plant pathology. Mol. Plant Pathol. 2015, 16, 413–434. [Google Scholar] [CrossRef]
- Belisario, A.; Maccaroni, M.; Vettorazzo, M. First Report of Phytophthora cambivora Causing Bleeding Cankers and Dieback on Beech (Fagus sylvatica) in Italy. Plant Dis. 2006, 90(10), 1362. [Google Scholar] [CrossRef]
- Burgess, T.I.; Scott, J.K.; Mcdougall, K.L.; Stukely, M.J.C.; Crane, C.; Dunstan, W.A.; Brigg, F.; Andjic, V.; White, D.; Rudman, T.; et al. Current and projected global distribution of Phytophthora cinnamomi, one of the world's worst plant pathogens. Glob. Change Biol. 2017, 23, 1661–1674. [Google Scholar] [CrossRef] [PubMed]
- Jung, T.; Orlikowski, L.; Henricot, B.; Abad-Campos, P.; Aday, A.G.; Aguín Casal, O.; Bakonyi, J.; Cacciola, S.O.; Cech, T.; Chavarriaga; et al. Widespread Phytophthora infestations in European nurseries put forest, semi-natural and horticultural ecosystems at high risk of Phytophthora diseases. For. Pathol. 2016, 46, 134–163. [CrossRef]
- Scanu, B.; Hunter, G.C.; Linaldeddu, B.T.; Franceschini, A.; Maddau, L.; Jung, T.; Denman, S.; A taxonomic re-evaluation reveals that Phytophthora cinnamomi and P. cinnamomi var. parvispora are separate species. For. Pathol. 2013, 44, 1–20. [CrossRef]
- Frisullo, S.; Lima, G.; Magnano di San Lio, G.; Camele, I.; Melissano, L.; Puglisi, I.; Pane, A.; Agosteo, G.E.; Prudente, L.; Cacciola, S.O. Phytophthora cinnamomi Involved in the Decline of Holm Oak (Quercus ilex) Stands in Southern Italy. For. Sci. 2018, 64, 290–298. [Google Scholar] [CrossRef]
- Vettraino, A.M.; Barzanti, P.; Bianco, M.C.; Ragazzi,A.; Capretti, P.; Paoletti, E.; Luisi, N.; Anselmi,N.; Vannini, A. Occurrence of Phytophthora species in oak stands in Italy and their association with declining oak trees. For Pathol. 2002, l32, 19–28. [CrossRef]
- Westbrook, J.W.; James, J.B.; Sisco, P.H.; Frampton, J.; Lucas, S.; Jeffers, S.N. Resistance to Phytophthora cinnamomi in American Chestnut (Castanea dentata) Backcross Populations that Descended from Two Chinese Chestnut (Castanea mollissima) Sources of Resistance. Plant Dis. 2019, 103(7), 1631–1641. [Google Scholar] [CrossRef]
- Belisario, A.; Galli, M.; Wajnberg, E. Evaluation of Juglans species for resistance to Phytophthora cinnamomi: differences in isolate virulence and response to fosetyl-Al. For. Pathol. 2009, 39(3), 168–176. [Google Scholar] [CrossRef]
- Browne, G.T.; Leslie, C.A.; Grant, J.A.; Bhat, R.G.; SchmidtL, S.; Hackett, W.P.; Kluepfel, D.A.; Robinson, R.; McGranahan, G.H. Resistance to Species of Phytophthora Identified among Clones of Juglans macrocarpa ×J. regia. HortScience 2015, 50, 1136–1142. [CrossRef]
- Guajardo, J.; Saa, S.; Camps,R.; Besoain, X. Outbreak of Crown and Root Rot of Walnut Caused by Phytophthora cinnamomi in Chile. Plant Dis. 2017, 101, 636. [CrossRef]
- Matheron, M.E.; Mircetich, S.M. Pathogenicity and relative virulence of Phytophthora spp. from walnut and other plants to rootstocks of English walnut trees. Phytopathology 1985, 75(9), 977–981. [Google Scholar] [CrossRef]
- Vitale, S.; Scotton, M.; Vettraino, A.M.; Vannini, A.; Haegi, A.; Luongo, L.; Scarpari, M.; Belisario, A. Characterization of Phytophthora cinnamomi from common walnut in Southern Europe environment. For. Pathol. 2018, l49, e12477. [Google Scholar] [CrossRef]
- Vitale, S.; Luongo, L.; Scarpari, M.; Tizzani, L.; Garaguso,I .; Galli, M.; Belisario, A.; Scotton, M.; Mughini, G.; Gras, M.; Haegi, A. Sources of resistance to Phytophthora cinnamomi in Juglans spp. for potential rootstocks. Hortscience 2021, 56(6), 667–671. [CrossRef]
- Akinsanmi, O.A.; Drenth, A. Phosphite and metalaxyl rejuvenate macadamia trees in decline caused by Phytophthora cinnamomi. Crop Prot. 2013, 53, 29–36. [Google Scholar] [CrossRef]
- Dunstan, W.A.; Rudman, T.; Shearer, B.L.; Moore, N.A.; Paap, T.; Calver, M.C.; Dell, B.; Hardy, G.E.St.J. Containment and spot eradication of a highly destructive, invasive plant pathogen (Phytophthora cinnamomi) in natural ecosystems. Biol. Invasions 2010, 12, 913–925. [Google Scholar] [CrossRef]
- Carter, Z.T.; McNaughton, E.J.; Fea, M.P.; Horner, I.; Johnson, K.; Killick, S.; Glen, A.S. Evaluating scent detection dogs as a tool to detect pathogenic Phytophthora species. Conserv. Sci. Pract. 2023, 5(9). [CrossRef]
- Schena, L.; Duncan, J.M.; Cooke, D.E.L. Development and application of a PCR-based ‘molecular toolbox’ for the identification of Phytophthora species damaging forests and natural ecosystems. Plant Pathol. 2008, 57, 64–75. [Google Scholar] [CrossRef]
- Langrell, S.R.H.; Morel, O.; Robin, C. Touchdown nested multiplex PCR detection of Phytophthora cinnamomi and P. cambivora from French and English chestnut grove soils. Fungal Biol. 2011, l115, 672–682. [Google Scholar] [CrossRef] [PubMed]
- Engelbrecht, J.; Duong, T.A; van den Berg, N. Development of a Nested Quantitative Real-Time PCR for Detecting Phytophthora cinnamomi in Persea americana Rootstocks. Plant Dis. 2013, 97, 1012–1017. [Google Scholar] [CrossRef] [PubMed]
- Bilodeau, G.J.; Martin, F.N.; Coffey, M.D.; Blomquist, C.L. Development of a Multiplex Assay for Genus- and Species-Specific Detection of Phytophthora Based on Differences in Mitochondrial Gene Order. Phytopathology 2014, 104, 733–748. [Google Scholar] [CrossRef] [PubMed]
- Kunadiya, M.; Dunstan,W.A.D.; White, D.; Hardy, G.E.StJ.; Grigg, A.H.; Burgess, T.I. Assay for the Detection of Phytophthora cinnamomi Including an mRNA Protocol Designed to Establish Propagule Viability in Environmental Samples. Plant Dis. 2019, 103(9), 2443–2450. [CrossRef] [PubMed]
- Dai, T.; Yang, X.; Hu, T.; Li, Z.Y.; Xu, Y.; Lu, C.C. A novel LAMP assay for the detection of Phytophthora cinnamomi utilizing a new target gene identified from genome sequences. Plant Dis. 2019, 103(12), 3101–3107. [Google Scholar] [CrossRef] [PubMed]
- Dai, T.; Wang, A.; Yang, X.; Yu, X.; Tian, W.; Xu, Y.; Hu, T. PHYCI_587572: An RxLR Effector Gene and New Biomarker in A Recombinase Polymerase Amplification Assay for Rapid Detection of Phytophthora cinnamomi. Forests 2020, 11, 306. [Google Scholar] [CrossRef]
- Kunadiya, M.; White, D.; Dunstan, W.A.D.; Hardy, G.E.StJ.; Grigg, A.H.; Andjic, V.; Burgess, T.I. Pathways to false-positive diagnoses using molecular genetic detection methods; Phytophthora cinnamomi a case study. FEMS Microbiol. Lett. 2017, 364(7). [CrossRef]
- Ioos, R.; Laugustin, L.; Schenck, N.; Rose, S.; Husson, C.; Frey, P. Usefulness of single copy genes containing introns in Phytophthora for the development of detection tools for the regulated species P. ramorum and P. fragariae. Eur. J. Plant Pathol. 2006, 116, 171–176. [Google Scholar] [CrossRef]
- Schrader, C.; Schielke, A.; Ellerbroek, L.; Johne, R. PCR inhibitors – occurrence, properties and removal. J. Appl. Microbiol. 2012, 113, 1014–1026. [Google Scholar] [CrossRef] [PubMed]
- Jeffers, S.N.; Martin, S.B. Comparison of two media selective for Phytophthora and Pythium species. Plant Dis. 1986, 70, 1038–1043. [Google Scholar] [CrossRef]
- Edgar, R.C. MUSCLE: multiple sequence alignment with high accuracy and high throughput. Nucleic Acids Res. 2004, 32(1), 1792–1797. [Google Scholar] [CrossRef]
- Untergasser, A.; Cutcutache, I.; Koressaar, T.; Ye, J.; Faircloth, B.C.; Remm, M.; Rozen, S.G. Primer3-new capabilities and interfaces. Nucleic Acids Res. 2012, 40(15), e115. [Google Scholar] [CrossRef] [PubMed]
- Rozen, S.; Skaletsky, H.J. Bioinformatics Methods and Protocols: Methods in Molecular Biology. In: Primer 3 on the WWW for general users and for biologist programmers, Krawetzand, S., Misener, S., Eds.; Humana Press, Totowa, NJ (USA), 2000, pp 365–386, ISSN 1064-3745.
- Cooke, D. E. L.; Drenth, A.; Duncan, J. M.; Wagels, G.; Brasier, C. M. A molecular phylogeny of Phytophthora and related oomycetes. Fungal Genet. Biol. 2000, 30(1), 17–32. [Google Scholar] [CrossRef] [PubMed]
- Riolo, M.; Aloi, F.; La Spada, F.; Sciandrello, S.; Moricca, S.; Santilli, E.; Pane, A.; Cacciola, S.O. Diversity of Phytophthora communities across different types of mediterranean vegetation in a nature reserve area. Forests 2020, 11, 1–21. [Google Scholar] [CrossRef]
- Schena, L.; Hughes, J.D.; Cooke, D.E.L. Detection and quantification of Phytophthora ramorum, P. kernoviae,P. citricola, and P. quercina in symptomatic leaves by multiplex real-time PCR. Mol. Plant Pathol. 2006, 7, 365–379. [Google Scholar] [CrossRef] [PubMed]
- Nowakowska, J.A.; Malewski, T.; Tereba, A.; Oszako, T. Rapid diagnosis of pathogenic Phytophthora species in soil by real-time PCR. For. Pathol. 2016, l47, e12303. [Google Scholar]
- Jung, T.; Colquhoun, I.J.; Hardy, G.E.S.J. New insights into the survival strategy of the invasive soilborne pathogen Phytophthora cinnamomi in different natural ecosystems in Western Australia. For. Pathol. 2013, l43, 266–288. [Google Scholar] [CrossRef]
- Osawa, H.; Suzuki, N.; Akino, S.; Araki, H.; Asano, K.; Akai, K.; Kondo, N. Quantification of Phytophthora infestans population densities and their changes in potato field soil using real-time PCR. Sci. Rep. 2021, 11, 6266. [Google Scholar] [CrossRef]
Figure 1.
Scheme of sampling experiment. 250g of soil were collected in a walnut orchard at different distances from an infected tree (the central tree in the scheme) along tree row and at 1,5m in the inter-row. At each distance point two samples were taken, at 20 cm and 40 cm.
Figure 1.
Scheme of sampling experiment. 250g of soil were collected in a walnut orchard at different distances from an infected tree (the central tree in the scheme) along tree row and at 1,5m in the inter-row. At each distance point two samples were taken, at 20 cm and 40 cm.
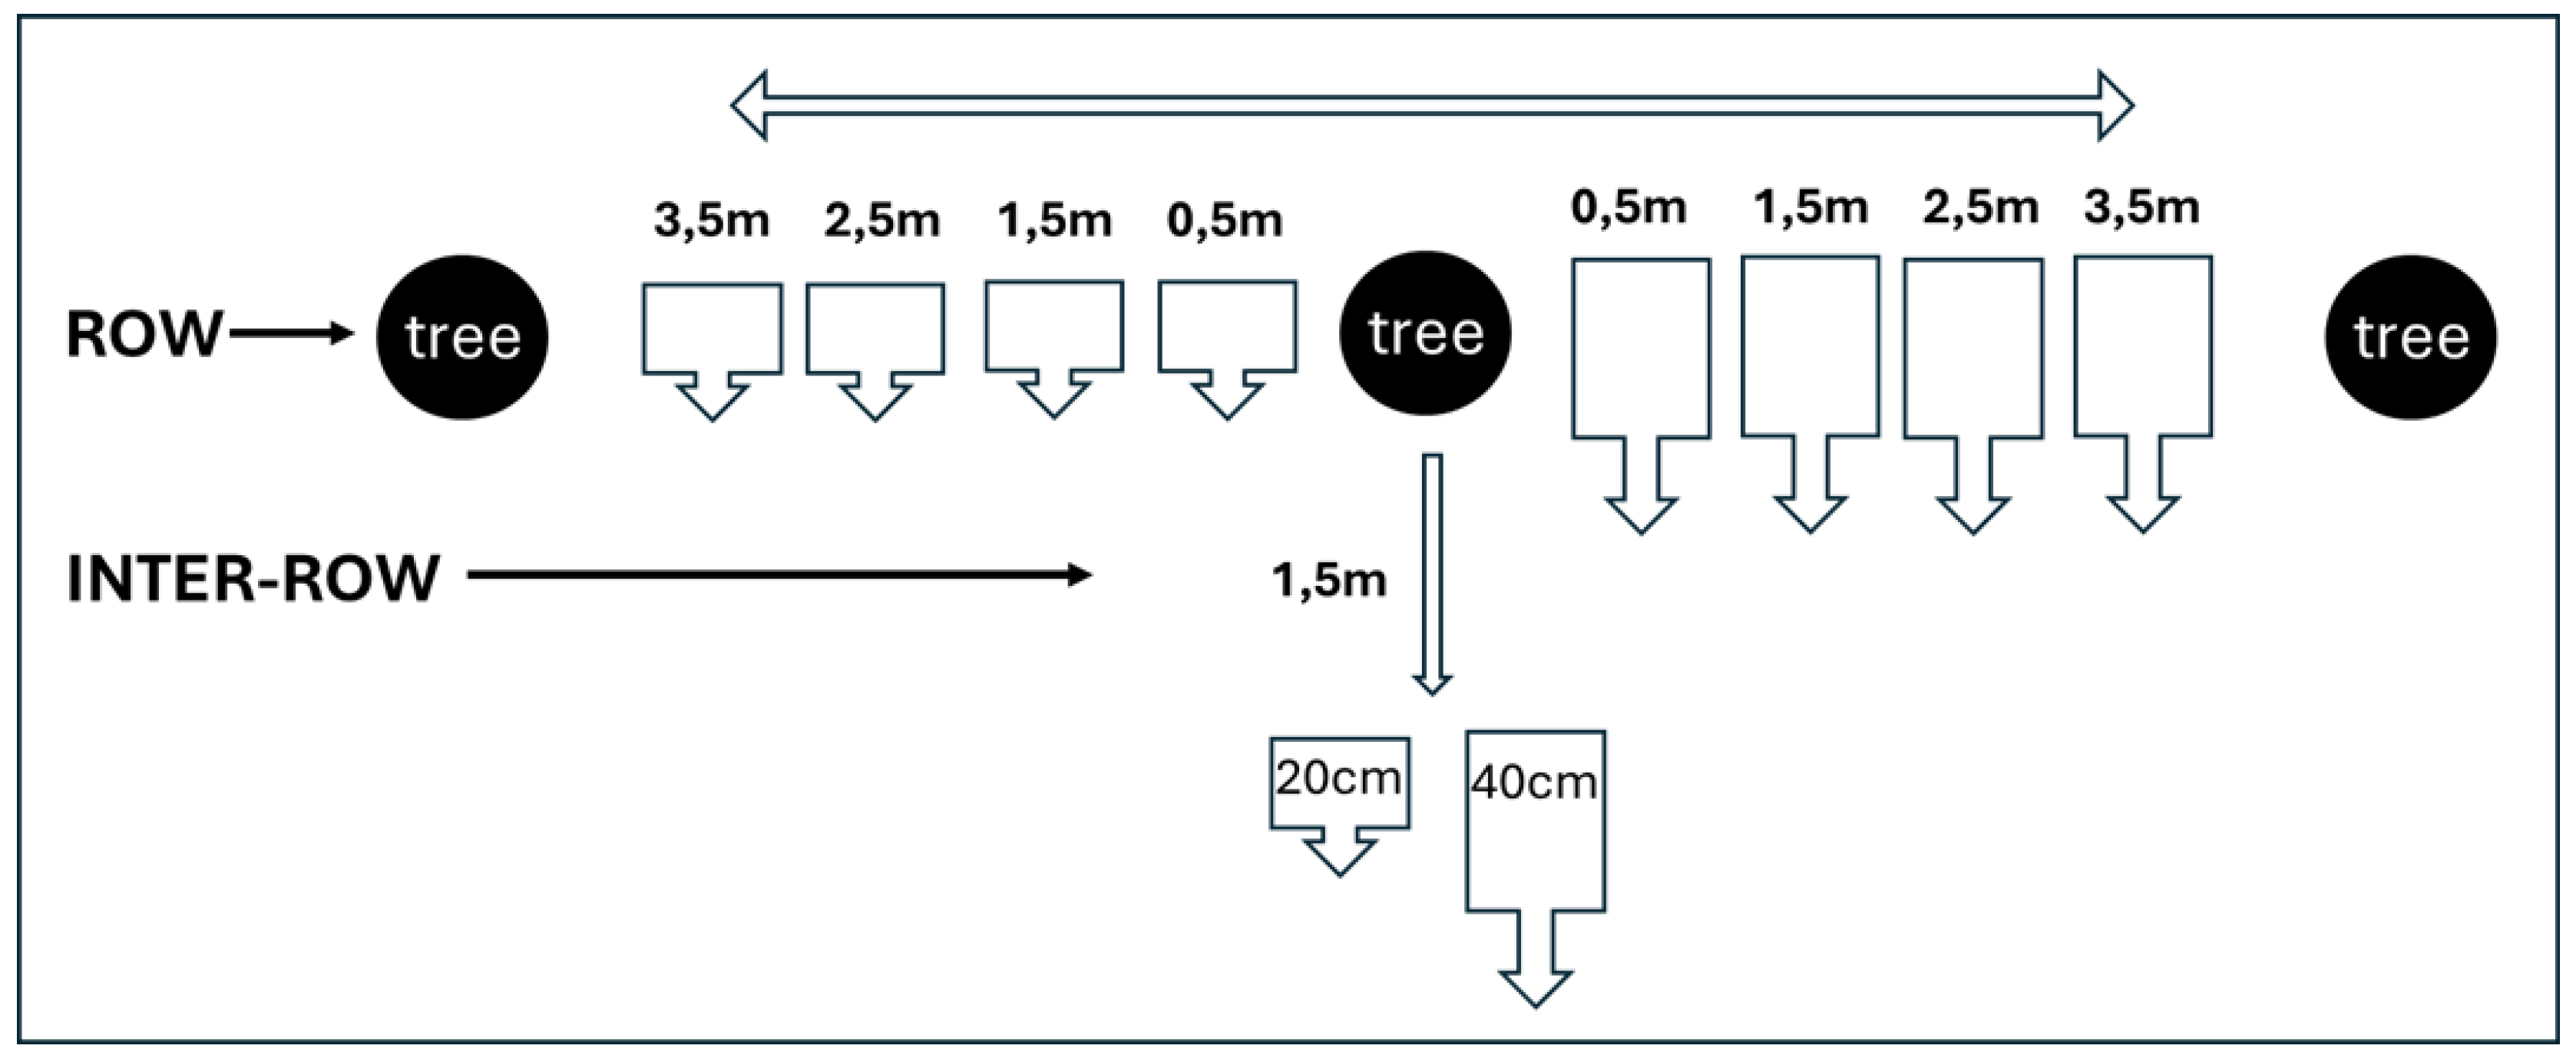
Figure 2.
Schematic representation of the DNA region of the ras-related protein gene Ypt1 amplified by the primers YPh1F and Yph2R containing introns 3,4 and 5, with location of primers P. cinn3.4F and P. cinn3.78R, and probe P. cinn3.31 designed on intron 3 for Phytophthora cinnamomi identification and quantification in real time PCR. Arrows indicate primer orientation.
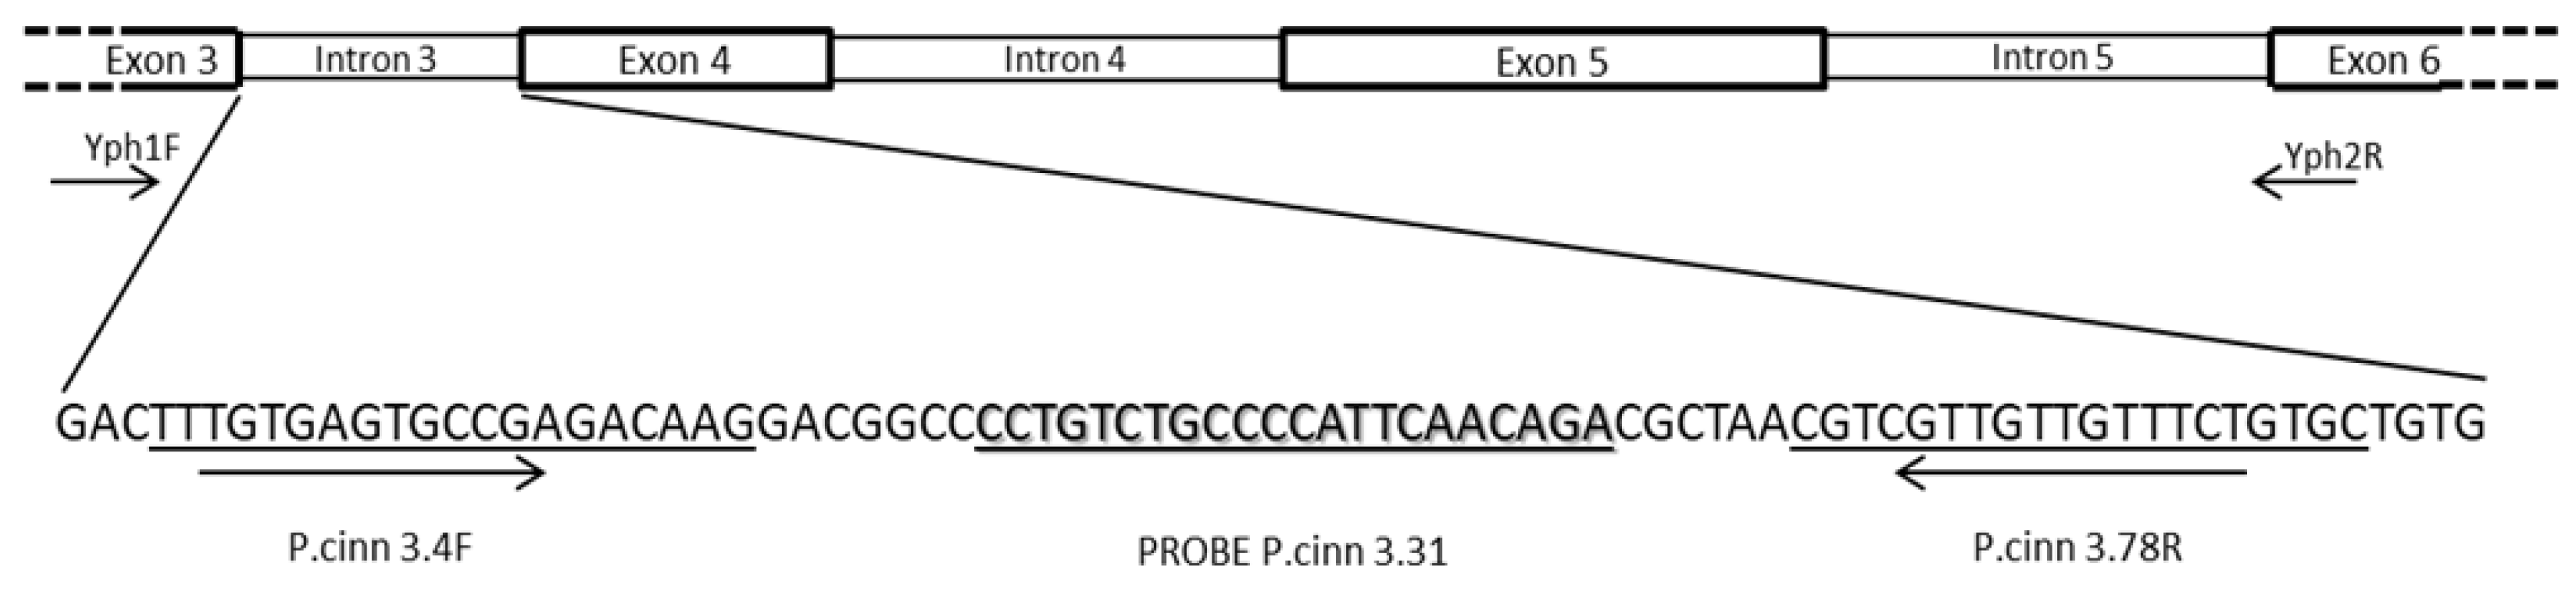
Figure 3.
Standard curve for quantification (fg) by qPCR of Phytophthora cinnamomi strain CREADC-Om274 genomic DNA obtained with GoTaq ® G2 Hot Start DNA Polymerase (Promega). The sensitivity was 50 fg, while the lower limit of detection (LOD) was 200 fg. Three technical repeats for each P. cinnamomi genomic DNA dilution were used, averaged values are reported in the graph. Bars represent standard deviations of each point.
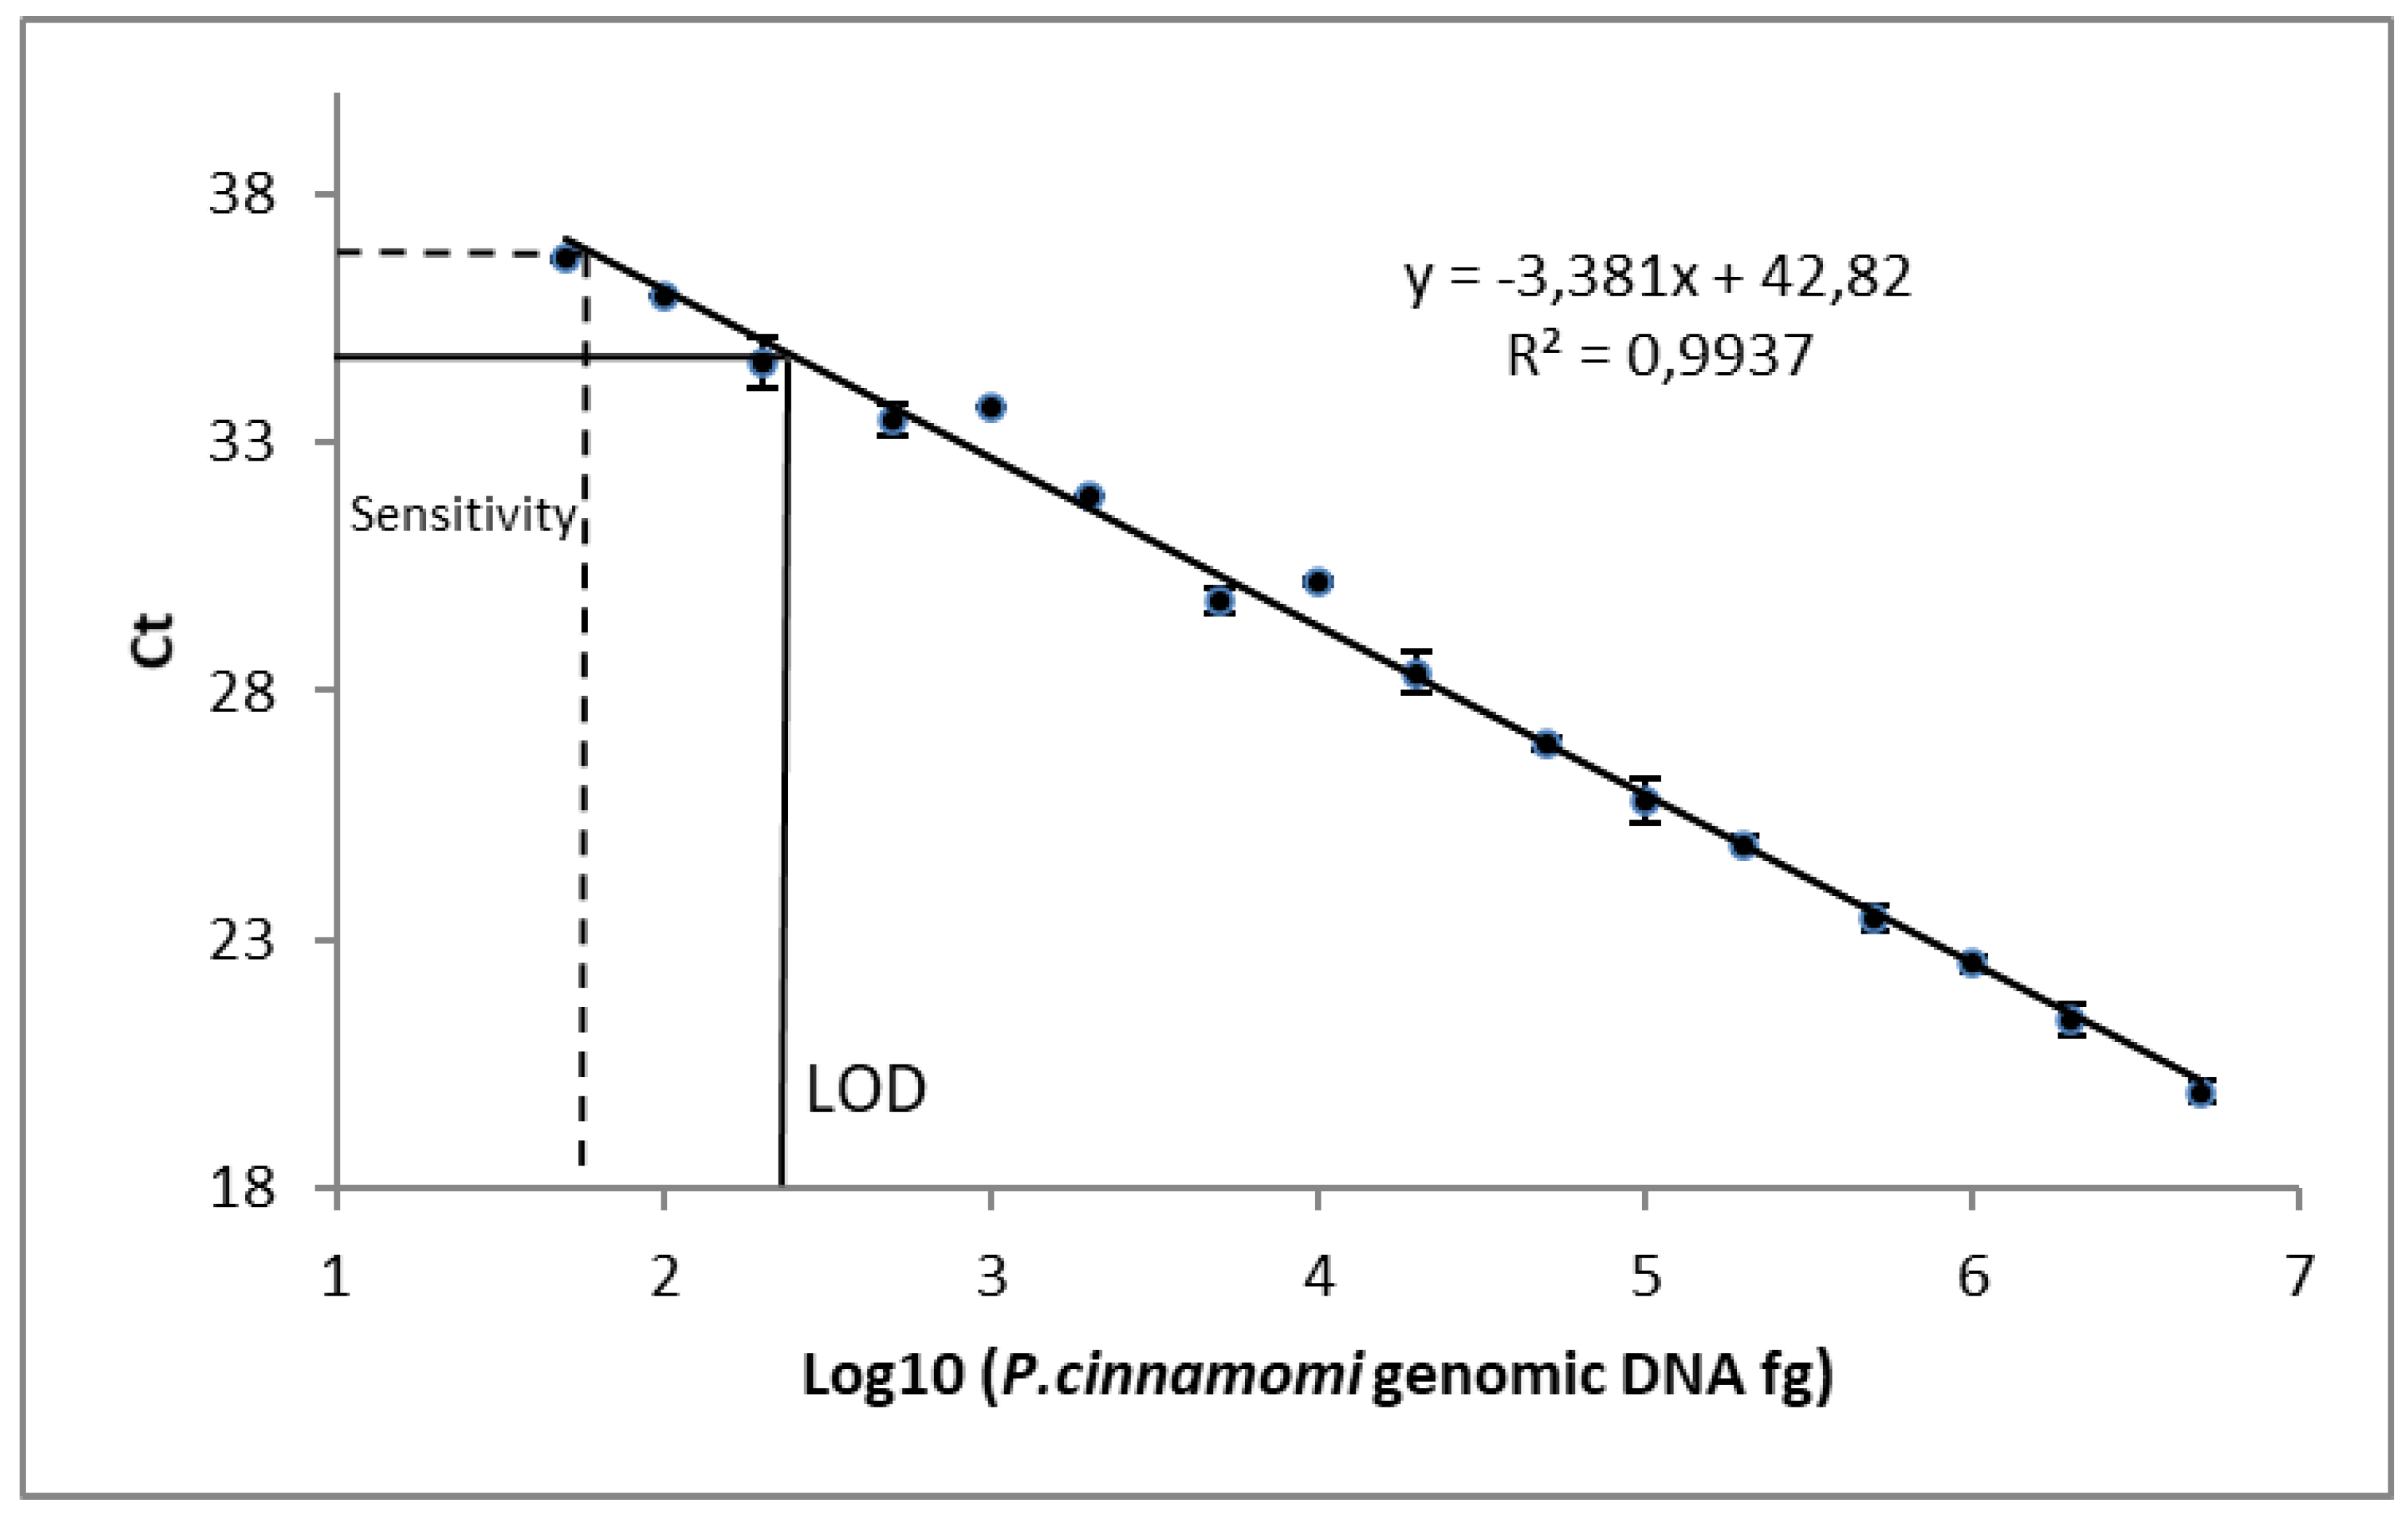
Figure 4.
Comparison between qPCR standard curves obtained with a ten-fold dilutions series of Phytophthora cinnamomi strain CREADC-Om274 genomic DNA diluted in sterile distilled water (a) or in different soil extracts coming from Veneto’s orchards soils (b and c), or a soil (d) from Latium region. qPCR experimental conditions are described in materials and methods. All samples, in triplicate, have been analysed on the same qPCR plate, to avoid differences between runs.


Table 1.
Isolates of Phytophtora and Pythium isolates used in this study.
| Species | Isolate numbera | Phylogenetic | Host | Country | Real time PCR result |
|---|---|---|---|---|---|
| clade b | |||||
| P. x alni subsp. alni | CREADC-Om293 | 7a | Alnus glutinosa | Germany | - |
| P. x alni subsp. multiformis | CREADC-Om294 | 7a | Alnus glutinosa | The Netherlands | - |
| P. x alni subsp. uniformis | CREADC-Om295/BBA7/03-2.3 | 7a | Alnus glutinosa | Germany | - |
| P. cactorum | CREADC-Om60 | 1a | Juglans regia | Italy | - |
| CREADC-Om61 | Juglans regia | Italy | - | ||
| P. cambivora | CREADC-Om133 | 7a | Fagus | Italy | - |
| CREADC-Om134 | Fagus | Italy | - | ||
| P. capsici | CREADC-Om246 | 2b | Capsicum annum | Italy | - |
| P. cinnamomi | CREADC-Om69 | 7c | Quercus rubra | France | + |
| CREADC-Om70 | Juglans regia | Italy | + | ||
| CREADC-Om74 | Juglans regia | Italy | + | ||
| CREADC-Om76 | Juglans regia | Italy | + | ||
| CREADC-Om119 | Juglans regia | Italy | + | ||
| CREADC-Om194 | Juglans regia | Italy | + | ||
| CREADC-Om202 | Juglans regia | Italy | + | ||
| CREADC-Om274 | Juglans regia | Italy | + | ||
| CREADC-Om281 | Juglans regia | Italy | + | ||
| CREADC-Om283 | Juglans regia | Italy | + | ||
| CREADC-Om139 | Castanea sativa | Spain | + | ||
| CREADC-Om141 | Castanea sativa | Spain | + | ||
| CREADC-Om142 | Castanea sativa | Spain | + | ||
| CREADC-Om144 | Quercus sp. | Italy | + | ||
| CREADC-Om145 | Quercus sp. | Italy | + | ||
| P. citricola | CREADC-Om161 | 2c | Juglans regia | Italy | - |
| P. cryptogea | CREADC-Om26 | 8a | Actinidia deliciosa | Italy | - |
| CREADC-Om28 | Actinidia deliciosa | Italy | - | ||
| P. drechsleri | CREADC-Om41/CBS292-35 | 8a | NA | NA | - |
| CREADC-Om220 | NA | Germany | - | ||
| P. gonapodyides | CREADC-Om261 | 6b | Juglans regia | Italy | - |
| P. hedraiandra | CREADC-Om68 | 1a | Viburnum tinus | Italy | - |
| P. hydropathica | CREADC-Om234 | 9a1 | Viburnum tinus | Italy | - |
| CREADC-Om236 | Viburnum tinus | Italy | - | ||
| P. kernoviae | CREADC-Om273/CBS 122049 | 10 | England | - | |
| P. megasperma | CREADC-Om198 | 6b | Juglans regia | Italy | - |
| CREADC-Om199 | Juglans regia | Italy | - | ||
| CREADC-Om239 | Celtis australis | Italy | - | ||
| CREADC-Om284 | Juglans regia | Italy | - | ||
| P. nicotianae | CREADC-Om263 | 1c | Vinca | Italy | - |
| CREADC-Om265 | Capsicum annuum | Italy | - | ||
| P. niederhauserii | CREADC-Om153 | 7b | Hedera helix | Italy | - |
| CREADC-Om154 | Hedera helix | Italy | - | ||
| CREADC-Om242 | Heuchera sp. | Germany | - | ||
| BBA NB 10045 | Hedera helix | Norway | - | ||
| P. palmivora | CREADC-Om19 | 4 | Pittosporum tobira | Italy | - |
| CREADC-Om22 | Pittosporum tobira | Italy | - | ||
| P. parvispora | BBA 65507/ CREADC-Om298 | 7c | Beaucameare curvata | Mexico | - |
| P. ramorum | CREADC-Om229 | 8c | Viburnus tinus | Italy | - |
| P. tropicalis | CREADC-Om210 | 2b | Rhododendron sp. | Italy | - |
| CREADC-Om212 | Rhododendron sp. | Italy | - | ||
| CREADC-Om237 | 2b | Albizia julibrissin | Italy | - | |
| Pythium chamaehyphon | CREADC-Om162 | Juglans regia | Italy | - | |
| Pythium sterilum | CREADC-Om164 | Juglans regia | Italy | - | |
| a Isolates present in CREA-DC collection and tested in vivo. Julius Kuehn-Institute (JKI, derived from the former Federal Biological Research Centre for Agriculture and Forestry [BBA]); Centraal Bureau voor Schimmelcultures (CBS); Consiglio per la Ricerca in Agricoltura e l’Analisi dell’Economia Agraria (CREA)-Centro di Ricerca Difesa e Certificazione (CREA-DC) cultures (Om) | |||||
| b In accordance with Yang et al. [1] | |||||
Table 2.
Primers and hydrolysis probe used in this study.
| Primers or Probe | Sequences (5’-3’) | Tm (°C) | DNA region | Positiona (bp) |
Product size (bp) | Reference |
| P. cinn 3.4F |
TTTGTGAGTGCCGAGACAAG |
58,42 |
Intron3/Ypt1 |
4-23 |
75 |
This study |
| P. cinn 3.78R |
GCACAGAAACAACAACGACG |
58,55 |
Intron3/Ypt1 |
31-52 |
75 |
This study |
| P. cinn 3.31Probeb |
[FAM]-CCTGTCTGCCCCATTCAACAGA-[BHQ] |
63,48 |
Intron3/Ypt1 |
59-78 |
-- |
This study |
| YPh1F |
CGACCATKGGTGTGGACTTT | ̴ 450 | [21] |
|||
| YPh2R | ACGTTCTCMCAGGCGTATCT | ̴ 450 | [21] | |||
|
a Position of the primer or probe considering GenBank accession no. DQ162959as reference sequence. b FAM 6-carboxyfluorescein, BHQ1 Black Hole Quencher 1, registered trademark of Bioresearch Technologies, Inc. |
||||||
Table 3.
qPCR results for Phytophthora cinnamomi detection and quantification in tissue samples from naturally diseased trees.
Table 3.
qPCR results for Phytophthora cinnamomi detection and quantification in tissue samples from naturally diseased trees.
| Host | Tree condition | qPCR | Mean quantity* pg of pathogen DNA /mg host tissue |
|---|---|---|---|
| Walnut Zn 3/18 | Symptomatic | Positive | 24,1 |
| Walnut Zn 8/19 | Symptomatic | Positive | 19,6 |
| Walnut Tas10/8 | Asymptomatic | Negative | UD |
| Walnut Tas 3/9 | Asymptomatic | Negative | UD |
| Walnut Tas 7/12 | Asymptomatic | Negative | UD |
| Walnut Tas 9/20 | Symptomatic | Positive | 18.1 |
| Walnut Tas11/18 | Symptomatic | Positive | 14,5 |
| Walnut Tas13/13 | Symptomatic | Positive | 9,4 |
| Walnut BD5/6 | Symptomatic | Positive | 12.75 |
|
Chestnut |
Symptomatic | Positive | 15,4 |
|
Chestnut |
Symptomatic | Positive | 2,3 |
|
Chestnut |
Symptomatic | Positive | 10,1 |
|
Oak |
Symptomatic | Positive | 1,6 |
|
Oak |
Symptomatic | Positive | 17,3 |
UD = undetected; * Mean quantity is calculated from Mean Ct by CFX Manager Version software version 3.0 (BioRad). Results shown are from different qPCR plates. qPCR was performed as described in the text, 3 replicates per sample. Walnut trees are from three different orchards (Zn, TAS, BD, double number indicate plant/row), chestnuts and oaks are from forest.
Table 4.
Nested qPCR analysis for P.cinnamomi presence in soils surrounding infected walnut trees.
| Walnut tree | Distance from the tree | Depth | Sample I | qPCR result | Sample II | qPCR result |
|---|---|---|---|---|---|---|
| Zn 3/18 | ||||||
| 0,5m | 20 | 3A | P1 P2 | 3.1 | P1 P2 | |
| 1,5m | 20 | 3B | P1 P2 | 3.2 | P1 X2 | |
| 2,5m | 20 | 3C | X1 X2 | 3.3 | X1 X2 | |
| 3,5m | 20 | 3D | P1 X2 | 3.4 | X1 P2 | |
| inter-row 1,5m | 20 | 3E | X1 X2 | 3.5 | X1 P2 | |
| 0,5m | 40 | 3F | P1 P2 | 3.6 | P1 P2 | |
| 1,5m | 40 | 3G | X1 P2 | 3.7 | P1 P2 | |
| 2,5m | 40 | 3H | X1 X2 | 3.8 | X1 X2 | |
| 3,5m | 40 | 3I | X1 X2 | 3.9 | X1 X2 | |
| Inter-row 1,5m | 40 | 3L | P1 P2 | 3.10 | P1 P2 | |
| Zn 8/19 | ||||||
| 0,5m | 20 | 8A | P1 P2 | 8.1 | P1 P2 | |
| 1,5m | 20 | 8B | X1 X2 | 8.2 | P1 P2 | |
| 2,5m | 20 | 8C | P1 X2 | 8.3 | P1 X2 | |
| 3,5m | 20 | 8D | P1 X2 | 8.4 | P1 X2 | |
| Inter-row 1,5m | 20 | 8E | P1 X2 | 8.5 | X1 X2 | |
| 0,5m | 40 | 8F | P1 P2 | 8.6 | P1 P2 | |
| 1,5m | 40 | 8G | P1 X2 | 8.7 | P1 X2 | |
| 2,5m | 40 | 8H | X1 P2 | 8.8 | X1 P2 | |
| 3,5m | 40 | 8I | X1 P2 | 8.9 | P1 X2 | |
| Inter-row 1,5m | 40 | 8L | X1 P2 | 8.10 | X1 X2 |
P = positive nested qPCR detection of P. cinnamomi; X= absence of P. cinnamomi. The analyses were performed on soils surrounding infected walnut tree Zn3/18 and Zn8//19 (see Table 3) collected in spring (Sample I) and in autumn (Sample II), each sample was collected twice (1-2) 15 days apart. Soils surrounding plants considered healthy (asymptomatic and far away from infection site) have been always negative for P. cinnamomi.
Table 5.
qPCR results for Phytophthora cinnamomi detection and quantification on potted and field soil samples.
Table 5.
qPCR results for Phytophthora cinnamomi detection and quantification on potted and field soil samples.
| Plant for soil samples | Tree Condition | Soil Sample and Depth | qPCR results | Mean Ct and standard deviation | Mean quantity* pg of pathogen DNA /g of soil |
|---|---|---|---|---|---|
| Rhododendron | Symptomatic | Potted soil sample | Positive | 29,95 ± 0,08 | 140,4 |
| Rhododendron | Symptomatic | Potted soil sample | Positive | 30,18 ± 0,03 | 123,5 |
| Rhododendron | Symptomatic | Potted soil sample | Positive | 28,47 ± 0,18 | 390,1 |
| Walnut Zn 7/18 | Symptomatic | 20 cm | positive | 37,98 ± 0,51a | <0,25 |
| 40 cm | positive | Pos nested qPCR | <0,25 | ||
| Walnut Tas 10/8 | Asymptomatic | 20 cm | Negative | UD | - |
| 40 cm | Negative | UD | - | ||
| Walnut Tas 3/9 | Asymptomatic | 20 cm | Negative | UD | - |
| 40 cm | Negative | UD | - | ||
| Walnut Tas 7/12 | Asymptomatic | 20 cm | Negative | UD | - |
| 40 cm | Negative | UD | - | ||
| Walnut Tas 9/20 | Symptomatic | 20 cm | positive | 36,99 ± 1,47 | 0,61 |
| 40 cm | positive | Pos nested qPCR | < 0,25 | ||
| Walnut Tas 11/18 | Symptomatic | 20 cm | positive | 30,47 ±0,07 | 134 |
| 40 cm | positive | 29,21 ±0,16 | 267 | ||
| Walnut Tas 13/13 | Symptomatic | 20 cm | positive | 34,47 ±1,028 | 15 |
| 40 cm | positive | 34,99 ±1,57 | 13,9 | ||
| Walnut Tas 16/12 | Symptomatic | 20 cm | positive | 35,47 ± 1,19 | 8,7 |
| 40 cm | positive | 31,21 ± 0,14 | 89,8 | ||
| Walnut Dossei 1 | Symptomatic | 20 cm | Positive | 38,06 ± 1,05a | <0.25 |
| 40 cm | positive | Pos nested qPCR | < 0.25 | ||
| Walnut Dossei 2 | Asymptomatic | 20 cm | positive | Pos nested qPCR | < 0.25 |
| 40 cm | positive | Pos nested qPCR | < 0.25 | ||
| Walnut Dossei 3 | Symptomatic | 20 cm | positive | Pos nested qPCR | < 0.25 |
| 40 cm | positive | 35,32 ± 1,56 | 2,8 | ||
| Walnut BD 5/6 | Symptomatic | 20 cm | positive | 35,47 ± 0,27 | 2,49 |
|
Walnut BD 9/10 |
Symptomatic | 20 cm | positive | 33,99 ± 0,12 | 6,67 |
| 40cm | positive | 35,16 ± 0,81 | 3,03 |
* Mean quantity is calculated from Mean Ct by CFX Manager Version software version 3.0 (BioRad). UD = undetected; <0,25 = pathogen DNA is below the limit of detection of direct qPCR, (in soil is 0.25 pg pathogen DNA/ g soil), but the nested qPCR is positive (Pos nested qPCR). a sample within the 40 cycles of qPCR but over the Cut-off Ct value. = undetectable <0,25pg, positive in nested qPCR. All negative results shown in the table were also subjected to nested qPCR resulting negative. Results shown are from different qPCR plates. qPCR was performed as described in the text, 3 replicates per sample.
Disclaimer/Publisher’s Note: The statements, opinions and data contained in all publications are solely those of the individual author(s) and contributor(s) and not of MDPI and/or the editor(s). MDPI and/or the editor(s) disclaim responsibility for any injury to people or property resulting from any ideas, methods, instructions or products referred to in the content. |
© 2024 by the authors. Licensee MDPI, Basel, Switzerland. This article is an open access article distributed under the terms and conditions of the Creative Commons Attribution (CC BY) license (http://creativecommons.org/licenses/by/4.0/).
Copyright: This open access article is published under a Creative Commons CC BY 4.0 license, which permit the free download, distribution, and reuse, provided that the author and preprint are cited in any reuse.


