1. Introduction
Wildfires have been increasing in California and broader western US over the last two to three decades [
1]. The surge in wildfire occurrences led to increased research aiming at understanding contributing factors such as weather and long-term climate conditions that increase the likelihood of these events [
2]. Persistent, large, synoptic-scale teleconnections leading to prolonged drought can significantly influence wildfire frequency and intensity [
3,
4,
5]. In this paper, we intend to investigate the role and contributions of increased temperatures and drought conditions to California wildfires, in more detail, particularly in conjunction with the teleconnections.
California's wildfire regime is shaped by several factors, ranging from local weather conditions to large-scale climate patterns [
6,
7,
8]. Short term extreme weather on a particular day (e.g., Santa Ana wind conditions in Southern California) to longer-term shifts in climate patterns can favor or exacerbate wildfire conditions. While local factors such as vegetation type, land use, and meteorological conditions play a crucial role, a large body of research indicates that large-scale climate fluctuations may directly or indirectly affect the likelihood of wildfires [
9,
10]. Keeley & Syphard [
11] studied how yearly changes in burned areas in California mountains relate to seasonal weather. They found that in lower elevations and areas with fewer forests, the yearly temperature variability didn't affect the burn area. However, they showed that in forested mountains, spring and summer temperatures can influence wildfire activity [
11], and that precipitation deficit increases wildfire risks, but this wasn't the case in California's lower elevation mountains [
12]
Further studies show that the El Niño Southern Oscillation (ENSO) [
13,
14,
15] is a crucial driver of climatic variability in California by significantly influencing the precipitation process, which in turn influences wildfire activity. During the La-Niña phase of ENSO, typically characterized by cooler-than-average sea surface temperatures (SSTs) in the equatorial central and eastern Pacific Ocean, California often experiences reduced rainfall, leading to drier conditions that heighten the risk of wildfires [
13]. Lower precipitation during La-Niña events can lead to soil moisture deficiencies and reduced vegetation viability, increasing the risk of wildfires [
16].
On the other hand, the El Niño phase, marked by warmer than average SSTs in the equatorial central and eastern Pacific Ocean, is often associated with increased rainfall in California [
17], which can alleviate drought conditions and lower the immediate risk of wildfire by providing more moisture to soils and vegetation. However, the effects of El Niño are not uniformly beneficial; increased rainfall can lead to rapid vegetation growth, which, after drying, can provide ample fuel for wildfires in later dry months [
18]. This cycle of growth and die-off can exacerbate wildfire conditions in subsequent seasons.
In addition, the interaction between ENSO and other climate phenomena, such as the Pacific Decadal Oscillation (PDO) and the Madden-Julian Oscillation (MJO), can modulate the effects of ENSO on California’s climate, making the state’s wildfire dynamics even more complex [
14]. For example, when a negative PDO phase coincides with a strong El Niño, the warmer waters in the North Pacific can enhance the wet conditions in California, potentially reducing wildfire risks more significantly than during El Niño events alone. A notable connection is observed between unusual sea surface temperatures and sea level pressures in the central and eastern Pacific and the extent of wildfires in Florida [
19]. This is shown by a strong correlation between the average SST anomaly and the variations in the burned areas as suggested in Goddrick et al. [
20]. Past work suggested a significant relationship between the prior year's ENSO conditions and the area and size of fires in subsequent years [
19], suggesting the potential for an ENSO-based wildfire prediction model for California.
Apart from its interaction with ENSO, the PDO itself is a prominent large-scale climate oscillation that can potentially impact wildfire activity in California [
21,
22,
23]. The PDO is a crucial climate pattern that primarily affects the mid-latitude Pacific basin. While it is often compared to the ENSO phenomenon, the PDO differs in its duration (20 to 30 years) and its significant impact on the North Pacific and North American regions. The PDO has differential effects on large-fire occurrence across different regions of the Rocky Mountains [
14]. Kitzberger et al. [
22] suggested that ENSO and PDO are the main influencers of wildfire variations on interannual to decadal scales, reflecting the interplay between drought, wildfires, and SST modes. However, these modes can be modulated by the alternating phases of the intraseasonal oscillation, potentially amplifying or mitigating their impacts on wildfire risk [
24,
25]. While the PDO and ENSO modes operate on interannual to decadal timescales, another prominent climate oscillation that may influence wildfire activity in California is the Boreal Summer Intraseasonal Oscillation (BSISO), active during the boreal summer months.
Research suggests that the BSISO, which is dominated by the MJO, plays a crucial role in driving sub-seasonal variability in the tropics throughout the boreal summer. Its convection patterns exhibit a notable upward propagation over the northern Indian Ocean and western North Pacific regions [
26]. The MJO, predominantly active during the winter, exhibits a less complex spatiotemporal structure compared to the BSISO [
26]. Previous studies have demonstrated that the BSISO significantly impacts the North American monsoon and influences seasonal activities in California, specifically rainfall [
24,
27,
28].
BSISO consists of alternating phases of enhanced and suppressed convection and rainfall. The enhanced convection phase leads to stronger and more convergent wind patterns in the region [
29], which lead to increased rainfall. Conversely, during the suppressed phase, high-pressure systems and anticyclonic circulation dominate, leading to weaker winds and reduced upward motion, which diminishes cloud formation and leads to drier conditions. Along with changes in wind patterns, BSISO stages also influence the transport of moisture. In the enhanced convection phase, strong winds associated with cyclonic circulation transport more moisture from the ocean to the land, contributing to increased humidity and precipitation. In contrast, during the suppressed phase, the anticyclonic circulation pattern results in reduced moisture transport from the ocean, leading to decreased humidity and lower chances of precipitation. BSISO can lead to significant shifts in the large-scale monsoon circulation [
30] and, depending on its phase, can either enhance or suppress the atmospheric flow pattern, thereby affecting the transport of moisture. Prolonged dryness during the suppressed phase of the BSISO can stress plants and lower soil moisture, increasing the danger of wildfires and highlighting the importance of understanding fire weather conditions.
Fire weather is also a function of other prevailing meteorological conditions, such as wind speed and direction, and lightning activity [
31]. The complex interaction of these conditions with the topographic features can either suppress or enhance the potential for wildfire ignition and spread [
32,
33,
34,
35]. Elevated land-based temperatures combined with low relative humidity (RH) imply drier air [
2]. While humidity levels are inversely related to wildfire potential, strong wind condition aids combustion and carries heat and embers to new areas, enabling the fire to spread rapidly [
2]. High wind speeds can cause a small fire to quickly escalate into a large, uncontrollable inferno [
36,
37,
38,
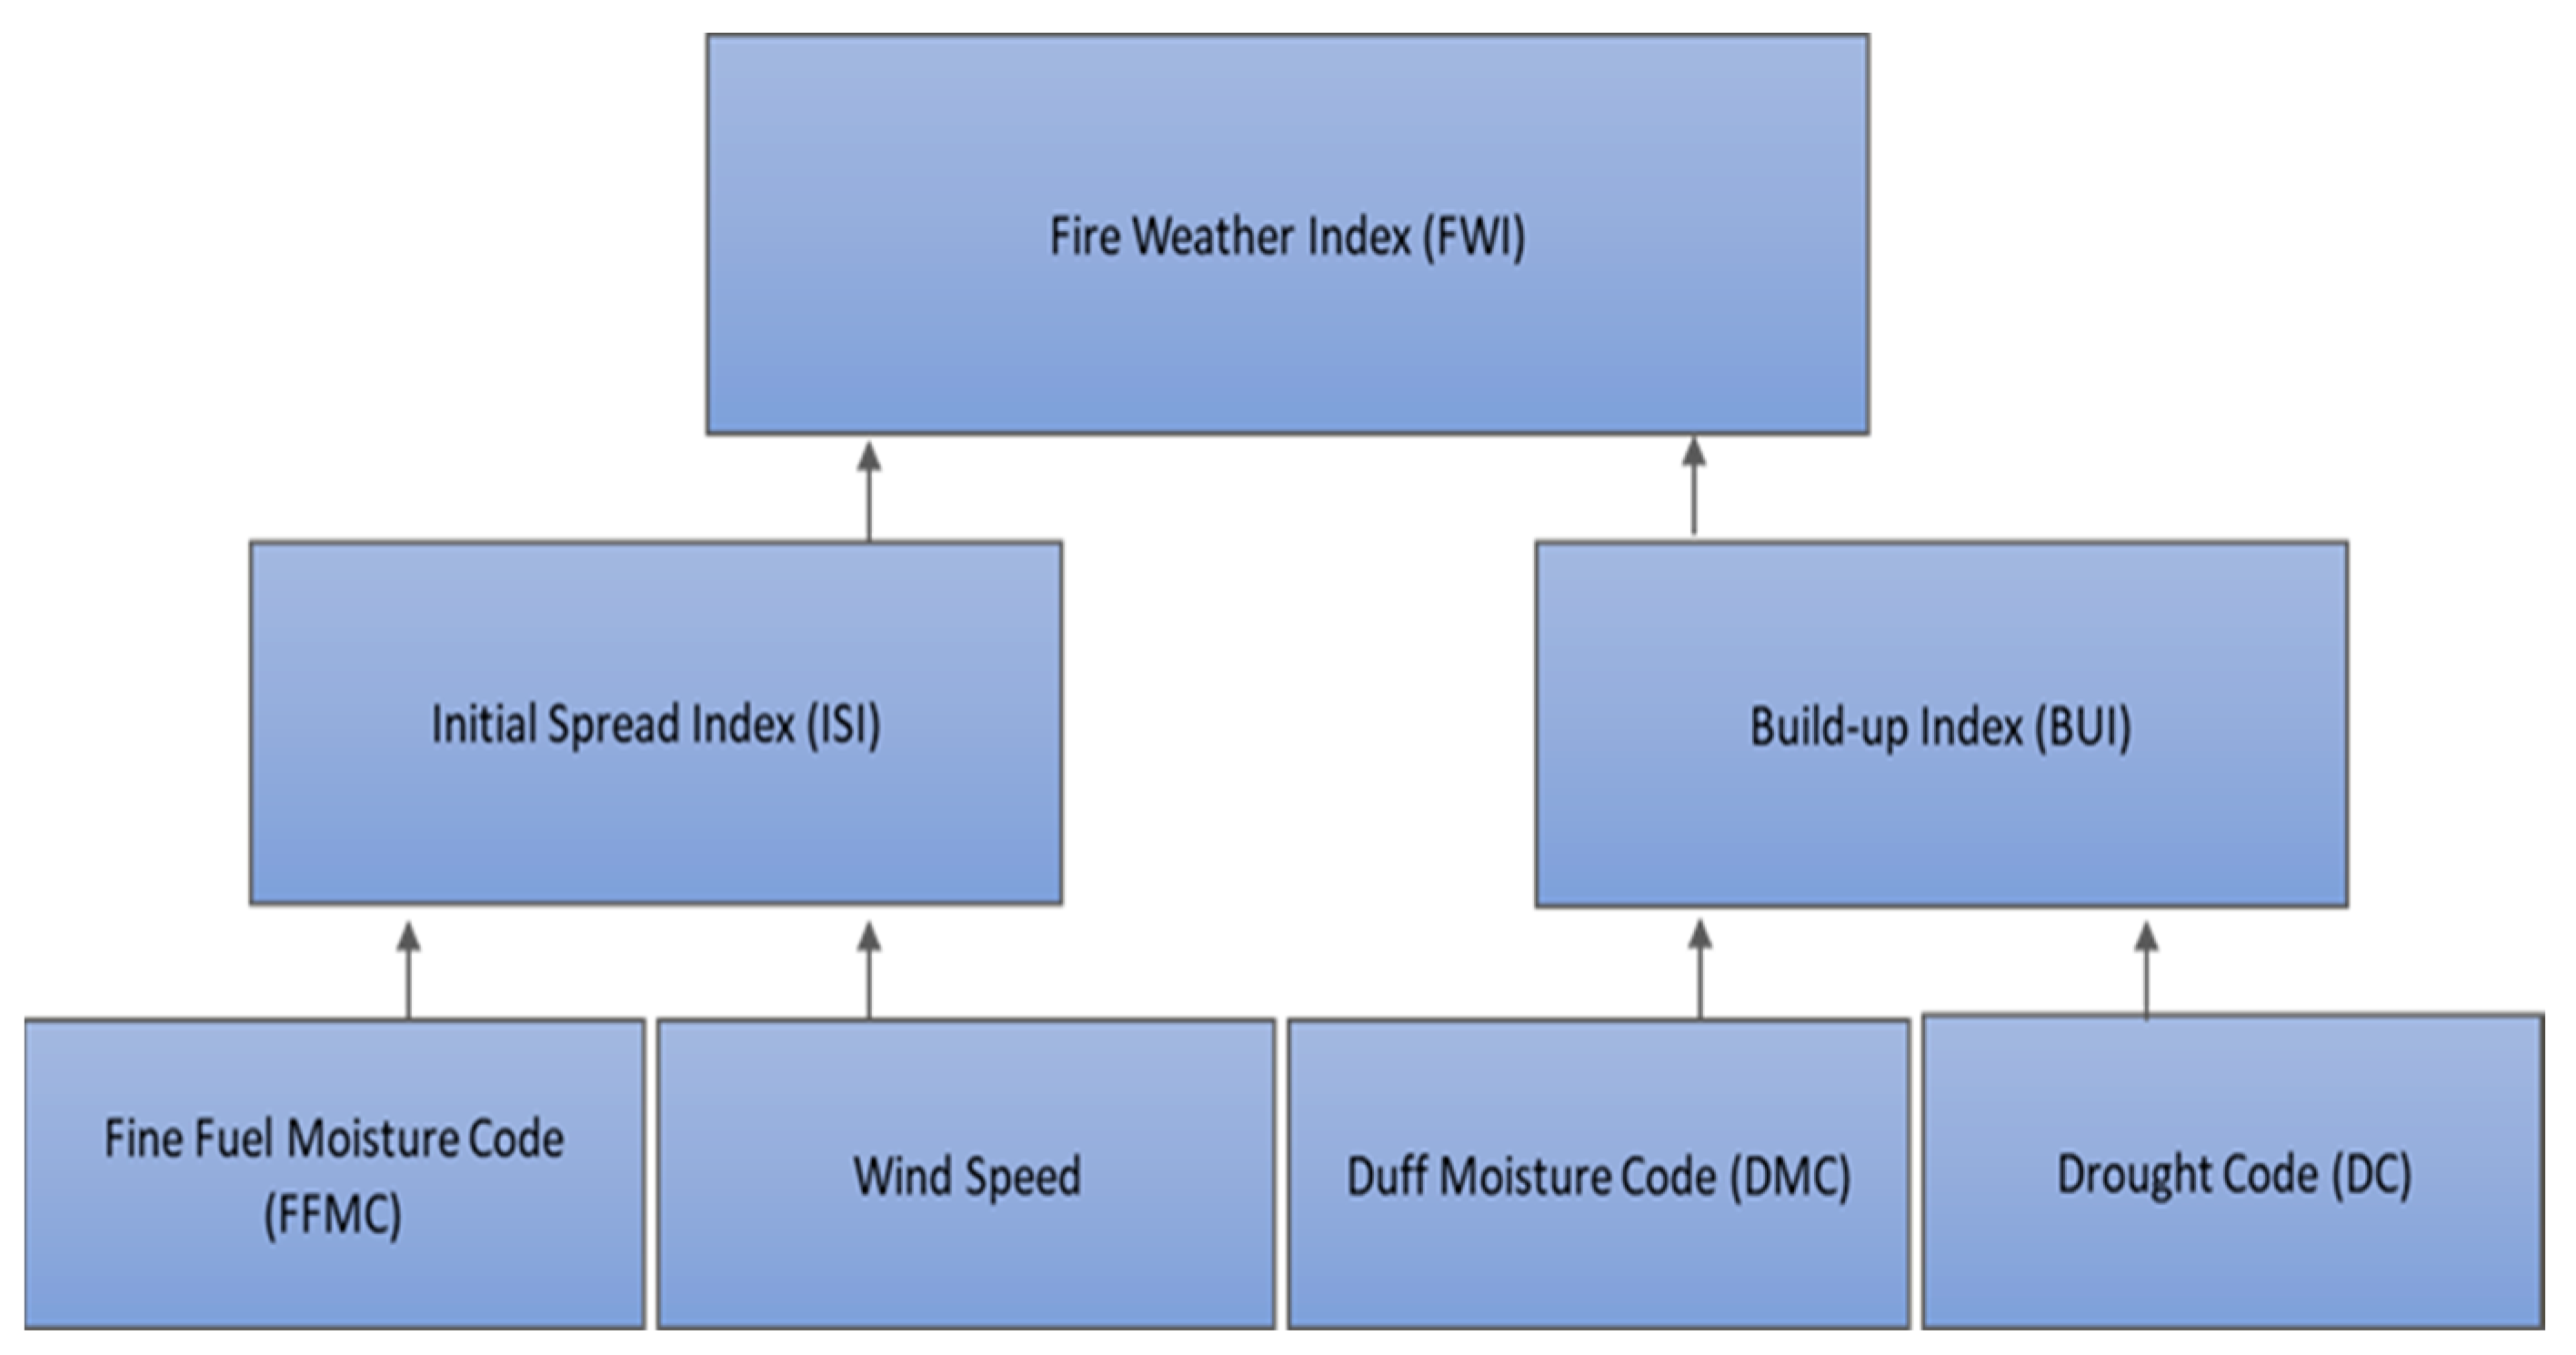
39]. Understanding the dynamics of fire weather has led to the development of predictive models and indices (e.g., fire weather indices), that help authorities anticipate fire risks and allocate resources accordingly. These tools are invaluable in proactive wildfire management and resource allocation, with the Fire Weather Index (FWI) being one of the most widely used and effective systems.
The FWI serves as an essential tool for predicting and assessing wildfire risks, and are based on meteorological data [
40,
41]. Fire management agencies use the FWI for various operational activities, including fire prevention, preparedness planning, daily fire suppression decisions, and allocation of firefighting resources. The FWI can help guide decisions on burning bans, fire crew staging, and aircraft deployment [
42]. While the FWI system was initially developed for Canadian forests, its application has expanded globally. It has been adapted for various ecosystems, demonstrating its versatility and relevance in different climatic and vegetation conditions [
43]. With the increasing impacts of climate change, the FWI is also being used in research to predict future wildfire likelihood by integrating it with climate models [
44]. Observation-based studies such as this one help in understanding how wildfire danger might change in the future and allow for better preparedness. In light of the effectiveness and adaptability of the FWI system, this research intends to utilize FWI as an important tool for a comprehensive assessment such that predicting wildfire behavior in California is possible.
In this study, we investigate the impact of large-scale and long-term climate oscillations, atmosphere-ocean anomalies, moisture and temperature conditions on wildfire dynamics in California. We analyze the multiscale interactions and dependencies among various atmospheric-oceanic state fluctuations and their combined influence on exacerbating drought and temperature conditions, with the aim to better understand wildfire dynamics in the state of California. We also employ the BSISO and other indices in the annual and decadal ranges, focusing on the boreal summer season. Although wildfires occur in all seasons, the occurrences and intensity of CA wildfire increase during the summer period (June-August).
Additionally, we utilize Vapor Pressure Deficit (VPD) to investigate wildfire risks. VPD is the difference between the amount of moisture in a unit of air and how much moisture that air can hold when saturated. It is a climatological parameter used to understand the influence of temperature on atmospheric moisture demand to identify wildfire risks [
45,
46]. This measure is crucial in assessing the drying power of the air, as it directly influences evaporation rates. Higher VPD values indicate a greater propensity for moisture to evaporate from surfaces, potentially drawing it away from vegetation and soil [
47], making the landscape drier and more susceptible to wildfires. In our study, the role of VPD becomes particularly relevant in the context of California’s wildfire dynamics. Given the observed and projected increases in VPD based drought index across the United States [
48], it is imperative to consider its impact on drought conditions and temperature fluctuations, which in turn significantly influence wildfire risks.
In light of the complex interplay between various climatic factors and wildfire dynamics in California, this study seeks to address several scientific questions:
How do large-scale climate oscillations like ENSO, PDO, and BSISO impact drought conditions and temperature fluctuations in California?
How do the combined effects of PDO and BSISO influence intraseasonal changes in the fire weather conditions?
What is the relationship between FWI, RH, VPD, and temperature in determining wildfire risks in California?
Does the relationship between FWI and climatic factors like temperature and moisture content vary geographically within California?
We analyzed California wildfire, weather, and climate data over a 40-year span, focusing on boreal summer. We scrutinized the patterns and severity of California wildfires during prolonged Pacific Ocean fluctuations. Following this, we computed VPD and moisture deficit (see
Section 2.2) and utilized temperature and RH to establish linear relationships with the FWI across varying oscillation scales (e.g. BSISO, ENSO and PDO).
3. Results
3.1. Frequency and Severity of CA Wildfires
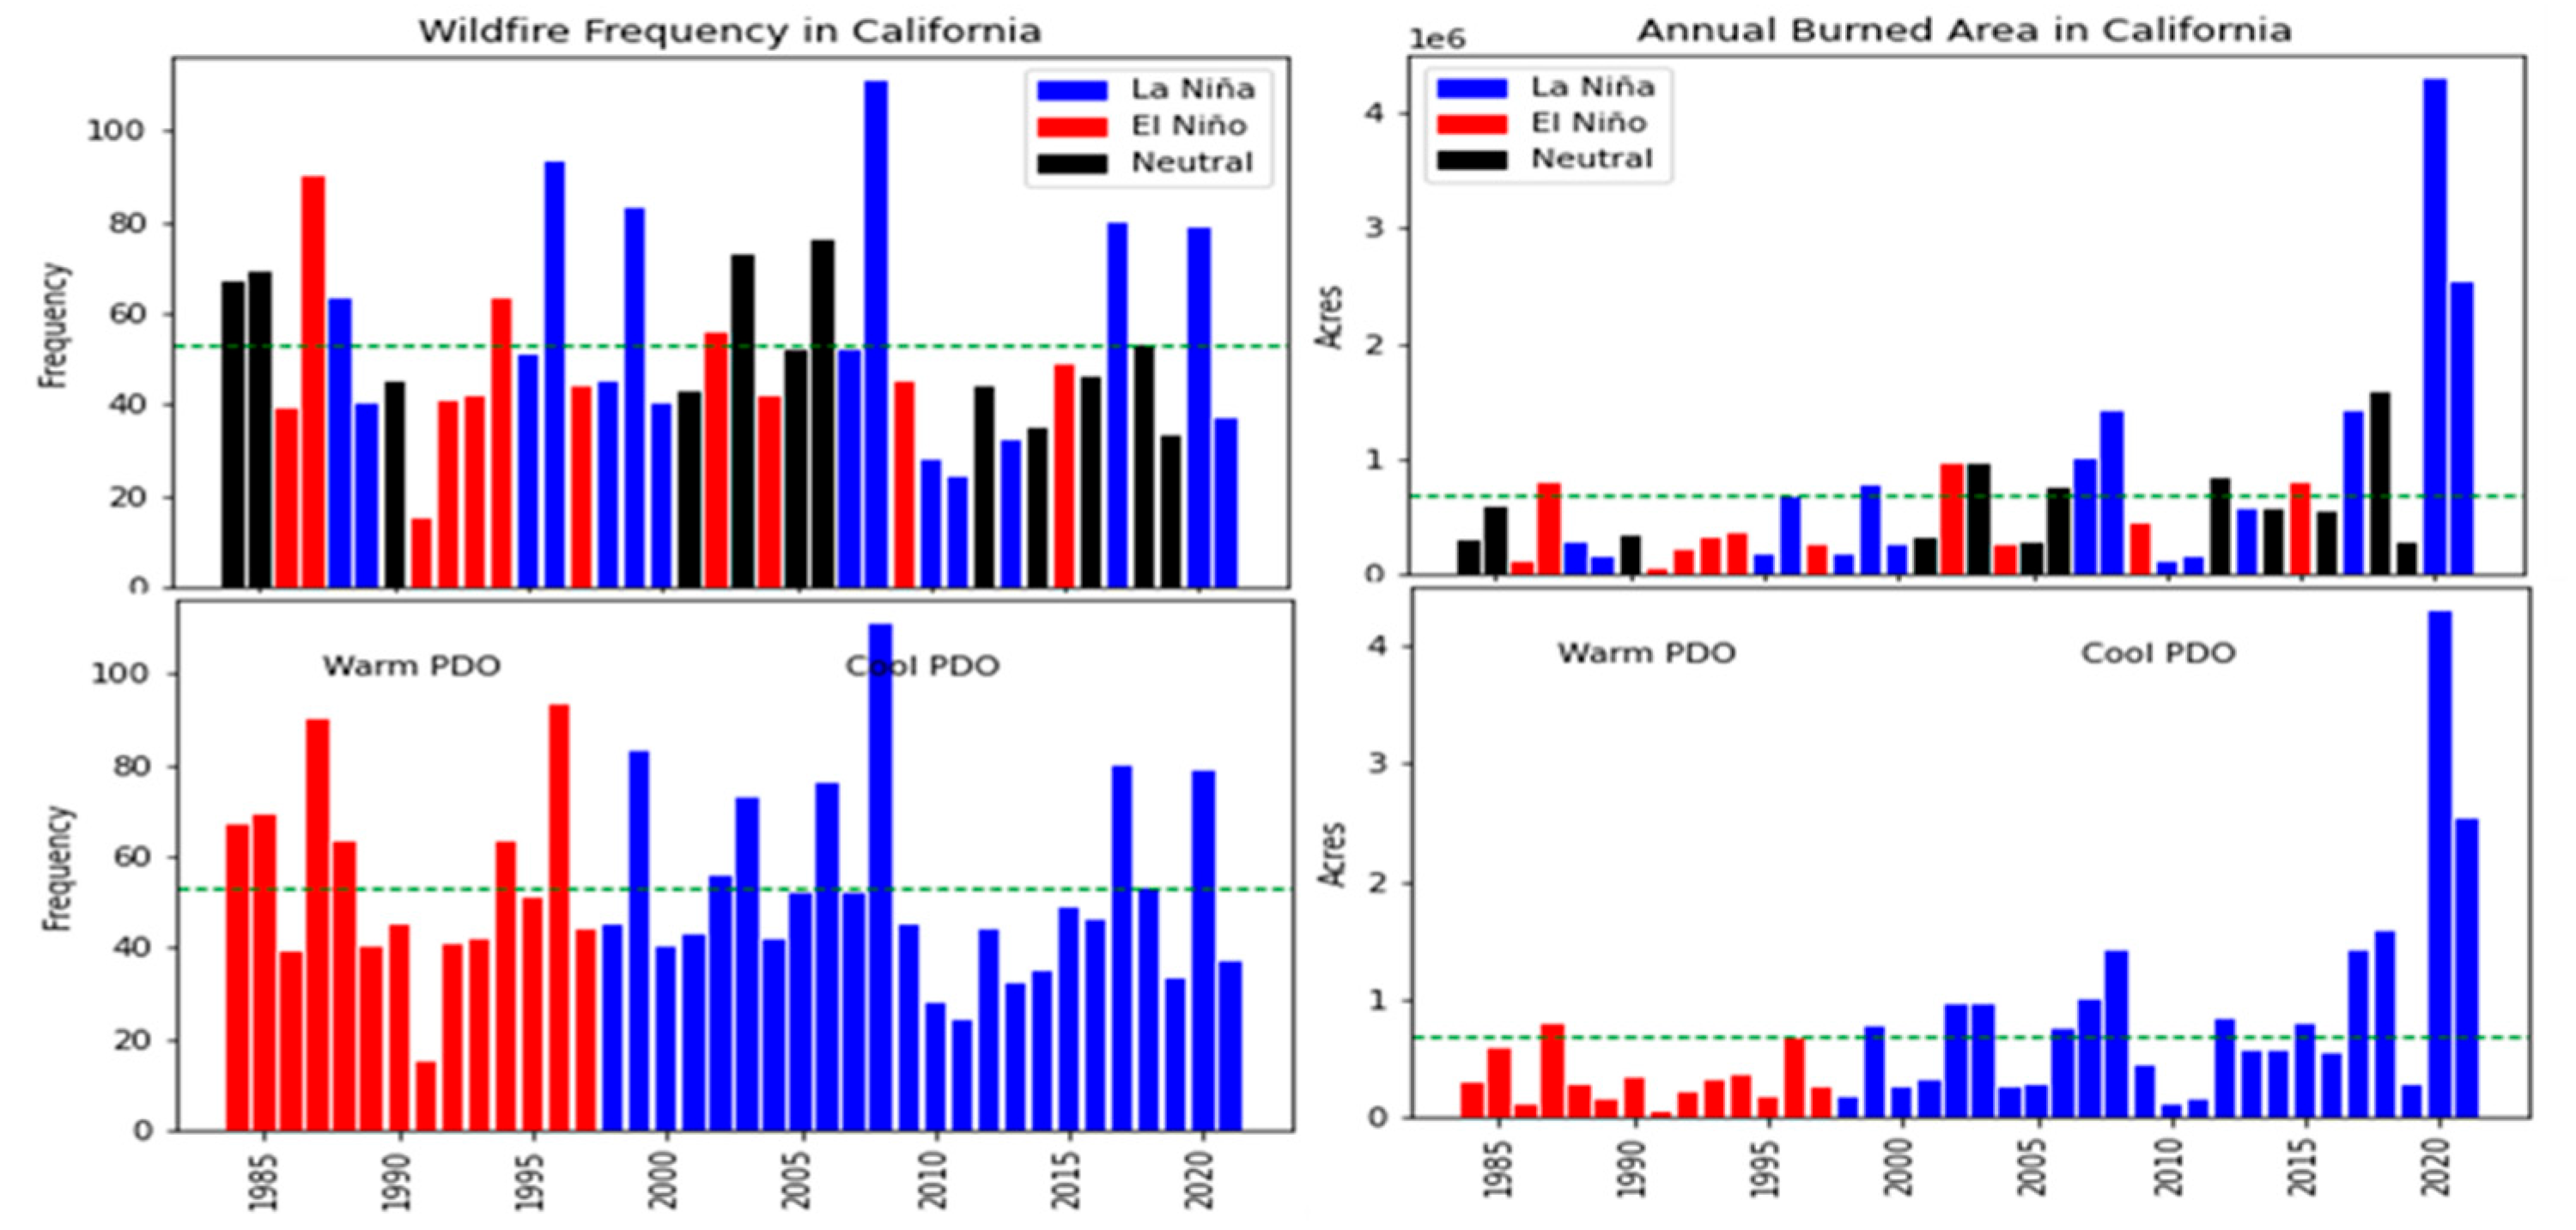
Figure 3 illustrates the interannual variability of wildfire frequency and area burned in California during boreal summer (June – August). This includes wildfire events that occurred during El Niño (red), La-Niña (blue), and Neutral (black) periods, and during warm and cool PDO phases.
The top panels in
Figure 3 show wildfire frequency (left) and area burned (right) under each ENSO phase. Very high, more than 100, wildfire events were observed in 2008 during the negative phases of ENSO and PDO. The 2008 wildfire events ravaged over one million acres. Additionally, large burned areas and high frequency occurred during the negative phases of ENSO and PDO during the 2020 and 2021 wildfire events. Of the instances where burned areas exceed the average, twice as many wildfire events occur during La-Niña compared to El Niño and Neutral: 50% during La-Niña and 25% during El Niño and Neutral phases. This is consistent with drier and warmer conditions during the La-Niña episodic phases, as summarized in
Section 1 [
13].
When investigating wildfire frequency and extent across California, wildfire occurrence and area burned are not statistically significantly correlated. This, in part, suggests that not all local and large-scale factors determining wildfire initiation and containment methods are similar. As suggested above, the highest number of wildfire incidents was reported in 2008, but with lower frequency of occurrences, the area burned in 2020 was much higher than in 2008 (
Figure 3).
Figure 3 (the lower panels) also illustrate the years corresponding to the warm and cool phases of the PDO. It is important to note that the wildfire data represented by the red bars are during a relatively brief warm PDO period (1984-1997), influenced by the constraints of available data, while those with blue bars represent a more extended cool PDO phase (1998-2021). During the 38 years, more than 50 above-average wildfire events were recorded in 14 years, predominantly during the cool PDO phase. Additionally, over time, an increase in the burned area occurred during the cool PDO phase. While areas burned before 1998 (warm PDO) are mostly below average, those after 1998 (cool PDO) are mainly above average. Above average burn area occurs in 50% of years during the cool PDO years, compared to ~7% during the warm PDO years.
Increasing burned areas during the cool PDO phase is noteworthy. The cool phase is typically associated with cooler sea surface temperature anomalies along western North America in the eastern North Pacific, and warmer sea surface temperature anomalies in the central North Pacific. These temperature patterns can result in lower sea level pressure along the northeast Pacific coast, affecting weather patterns across western North America [
59]. During the summer, the cooler SST anomalies along the west coast promotes reduced water vapor capacity in the atmosphere, and as such produces drier air. Such a seemingly counter-intuitive condition suggests the complex nature of wildfire mechanisms over CA.
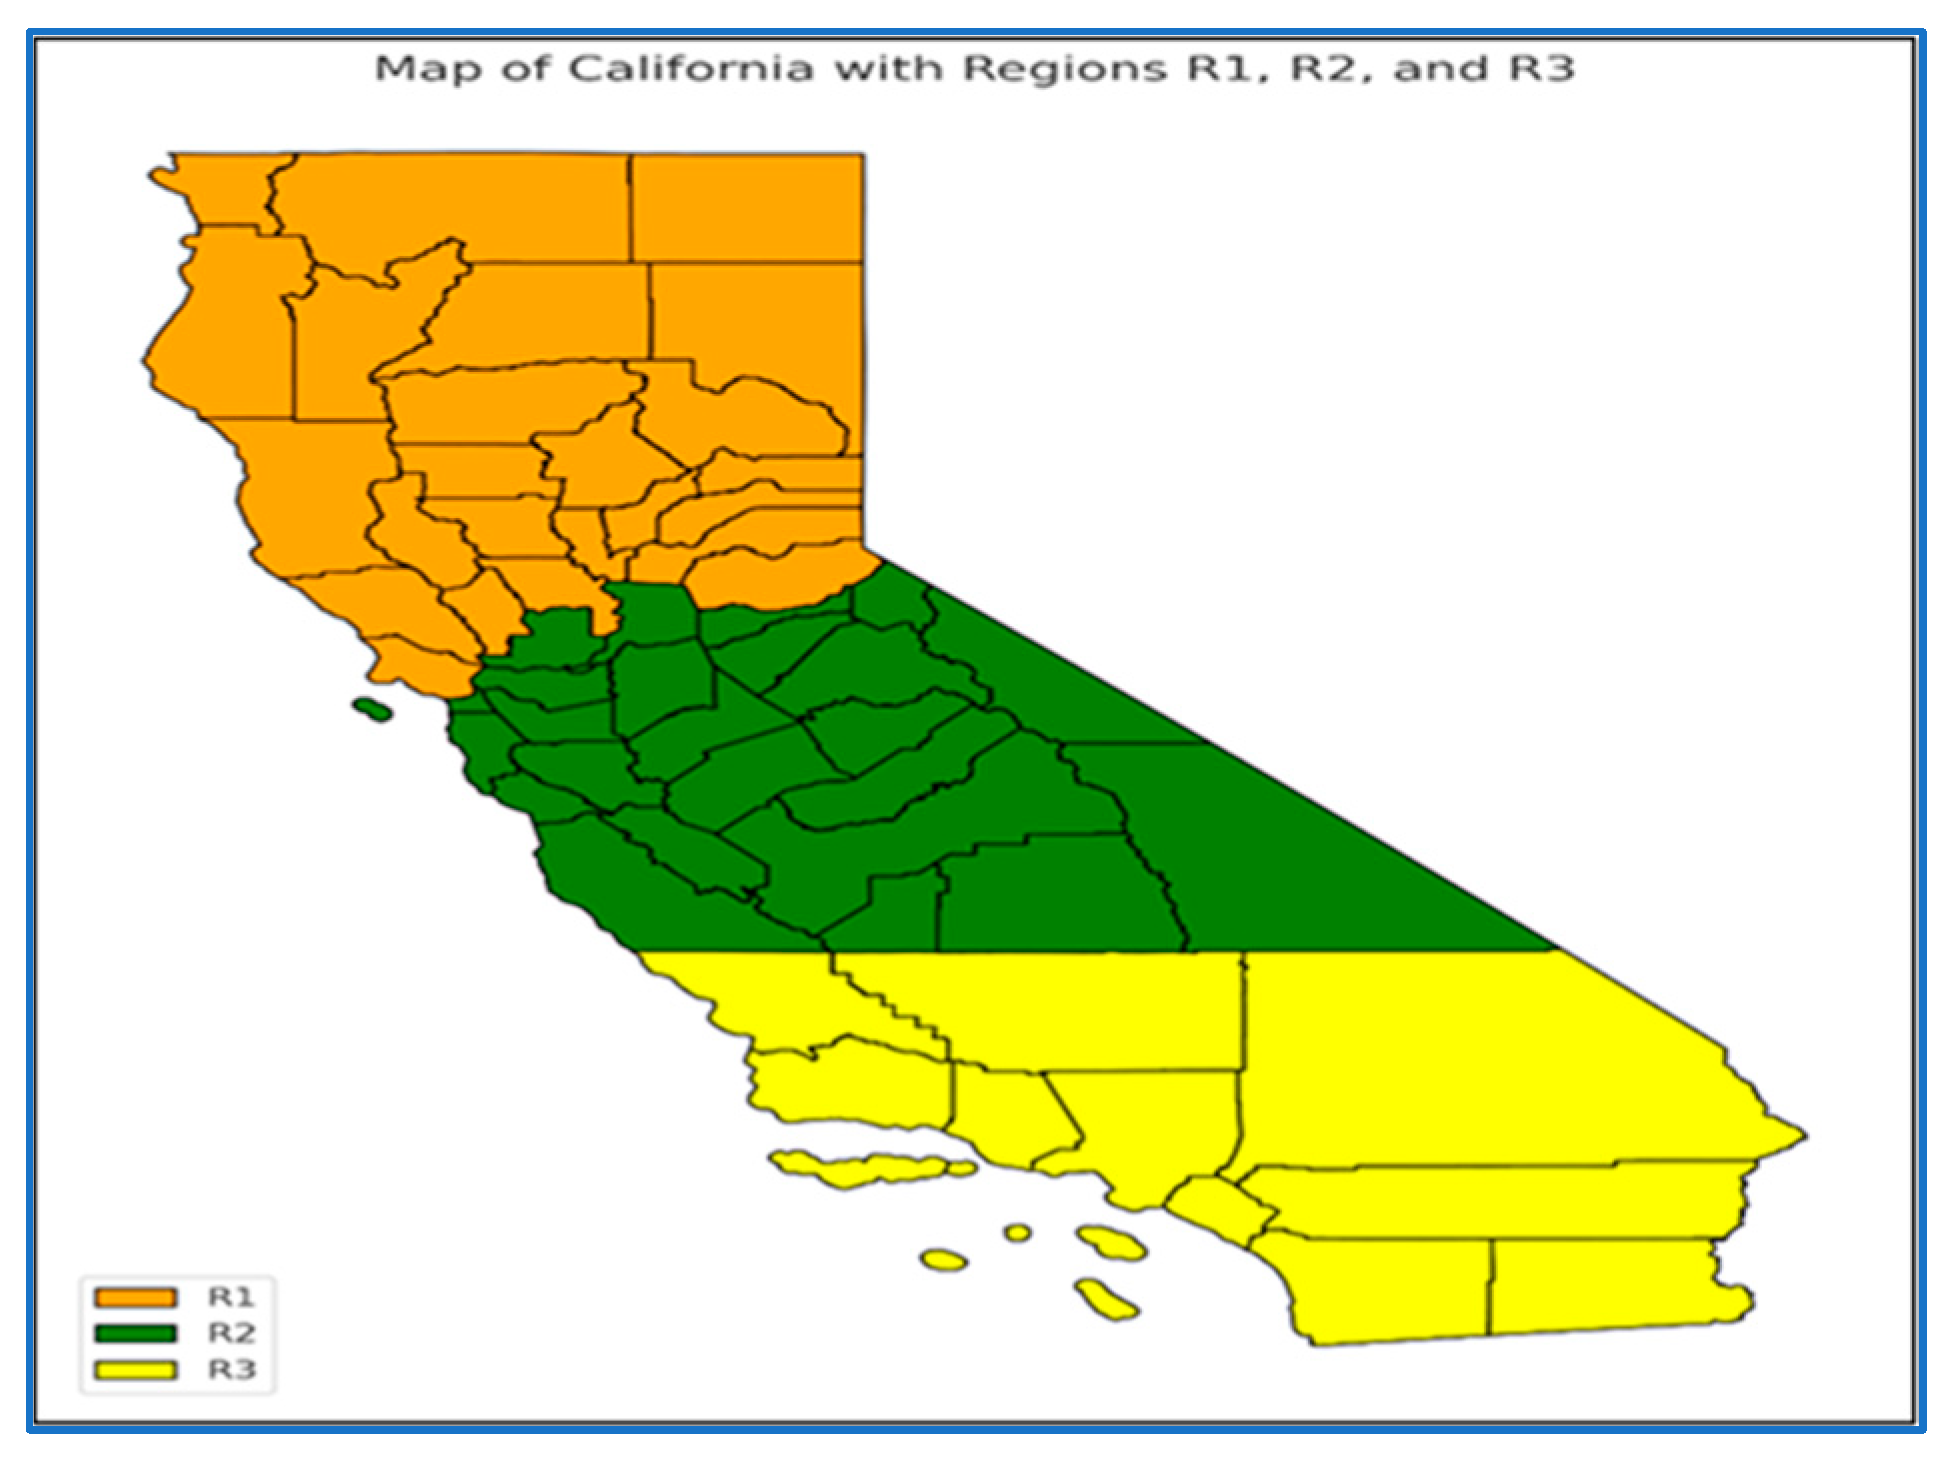
Next, we assess annual wildfire occurrence for the partitioned regions R1, R2, and R3 (described in
Section 2). Each region exhibits unique terrain and wildfire patterns and dotted with rolling hills and deep valleys. The local terrain features have a strong control on flow patterns. This is revealed in
Figure 4, which presents the summer interannual wildfire frequency over R1, R2, and R3.
Above average wildfire frequency is observed 35% of the time in R1, 51% of the time over R2, and 42% of the time over R3. We note that in R1, 80 wildfire events were observed in 2008. Because the 2008 anomalously high occurrence was in the R1 region only (
Figure 3 and
Figure 4), we treat 2008 as an outlier, and as a result, we reproduced R1 without 2008 for the comparative analysis (
Figure 4; lower right panel), in order to investigate wildfire patterns in each region.
The variability in wildfire activities across California's regions can be attributed to a combination of factors, including local topographic and climatic conditions, vegetation types, and anthropogenic influences.
As suggested in [
60], in R1 region, a series of dry lightning storms ignite most wildfires during the summer of 2008 [
60]. The 2008 events coincided with a La-Niña phase during a cool PDO, and combined effect reinforce each other and further exacerbated the fire risk. It is to be noted that the region's rugged topography, characterized by steep slopes and deep canyons, accelerated the spread of wildfires and could make wildfire management and firefighting efforts more challenging and its nature may have contributed to the frequent occurrences. Additionally, R1 experienced a severe drought in the years leading up to 2008, resulting in low soil moisture and dry vegetation, which increased fire risk. According to the California Department of Water Resources (DWR), water years 2007-2009 were the 12th driest three-year period in recorded climatic history [
61], creating ideal conditions for the ignition and spread of wildfires.
The combination of dry lightning storms [
62], La-Niña conditions, a cool PDO phase, rugged topography, and severe drought [
61] created a perfect storm for widespread wildfire activity in R1 during the summer of 2008.
Similar conditions were observed in R2 during the summer of 2020, resulting in the largest recorded wildfire in California's history. In August 2020, a series of lightning storms sparked hundreds of fires across R1 and R2, particularly in the Coast Ranges and the Sierra Nevada foothills. These fires, collectively known as the August Complex [
62], burned over 1 million acres. The lightning storms occurred during a period of extreme heat, with record-breaking temperatures and low humidity [
63], creating ideal conditions for fire ignition and spread.
3.2. Patterns of Moisture Deficit and FWI BSISO, ENSO and PDO
This section presents moisture deficit and FWI patterns for climate variabilities at intraseasonal, interannual, and interdecadal scales (
Figure 5,
Figure 6,
Figure 7 and
Figure 8).
3.2.1. The Boreal Summer Intraseasonal Oscillation (BSISO)
To investigate the effect of intraseasonal variability on wildfire dynamics, we began by analyzing FWI and dry air anomalies related to BSISO. This was carried out using the BSISO index to determine the geographical position of the oscillation pattern (phase) and the strength of the oscillation (amplitude). Past work suggested that the BSISO plays an important role on northward propagation of convection over the western North Pacific Ocean which effects atmospheric circulation patterns and influence weather systems over a wider region, including California [
26].
It is well documented that enhanced cloudiness and precipitation are associated with enhanced convective phases of the BSISO (for example, phases 1-2 linked with increased convection and unstable atmosphere over the northern Indian Ocean [
25]. Studies (e.g., [
60]) suggested that enhanced precipitation occurs over the west coast of the US when convective activity is stronger over the Indian Ocean [
64].
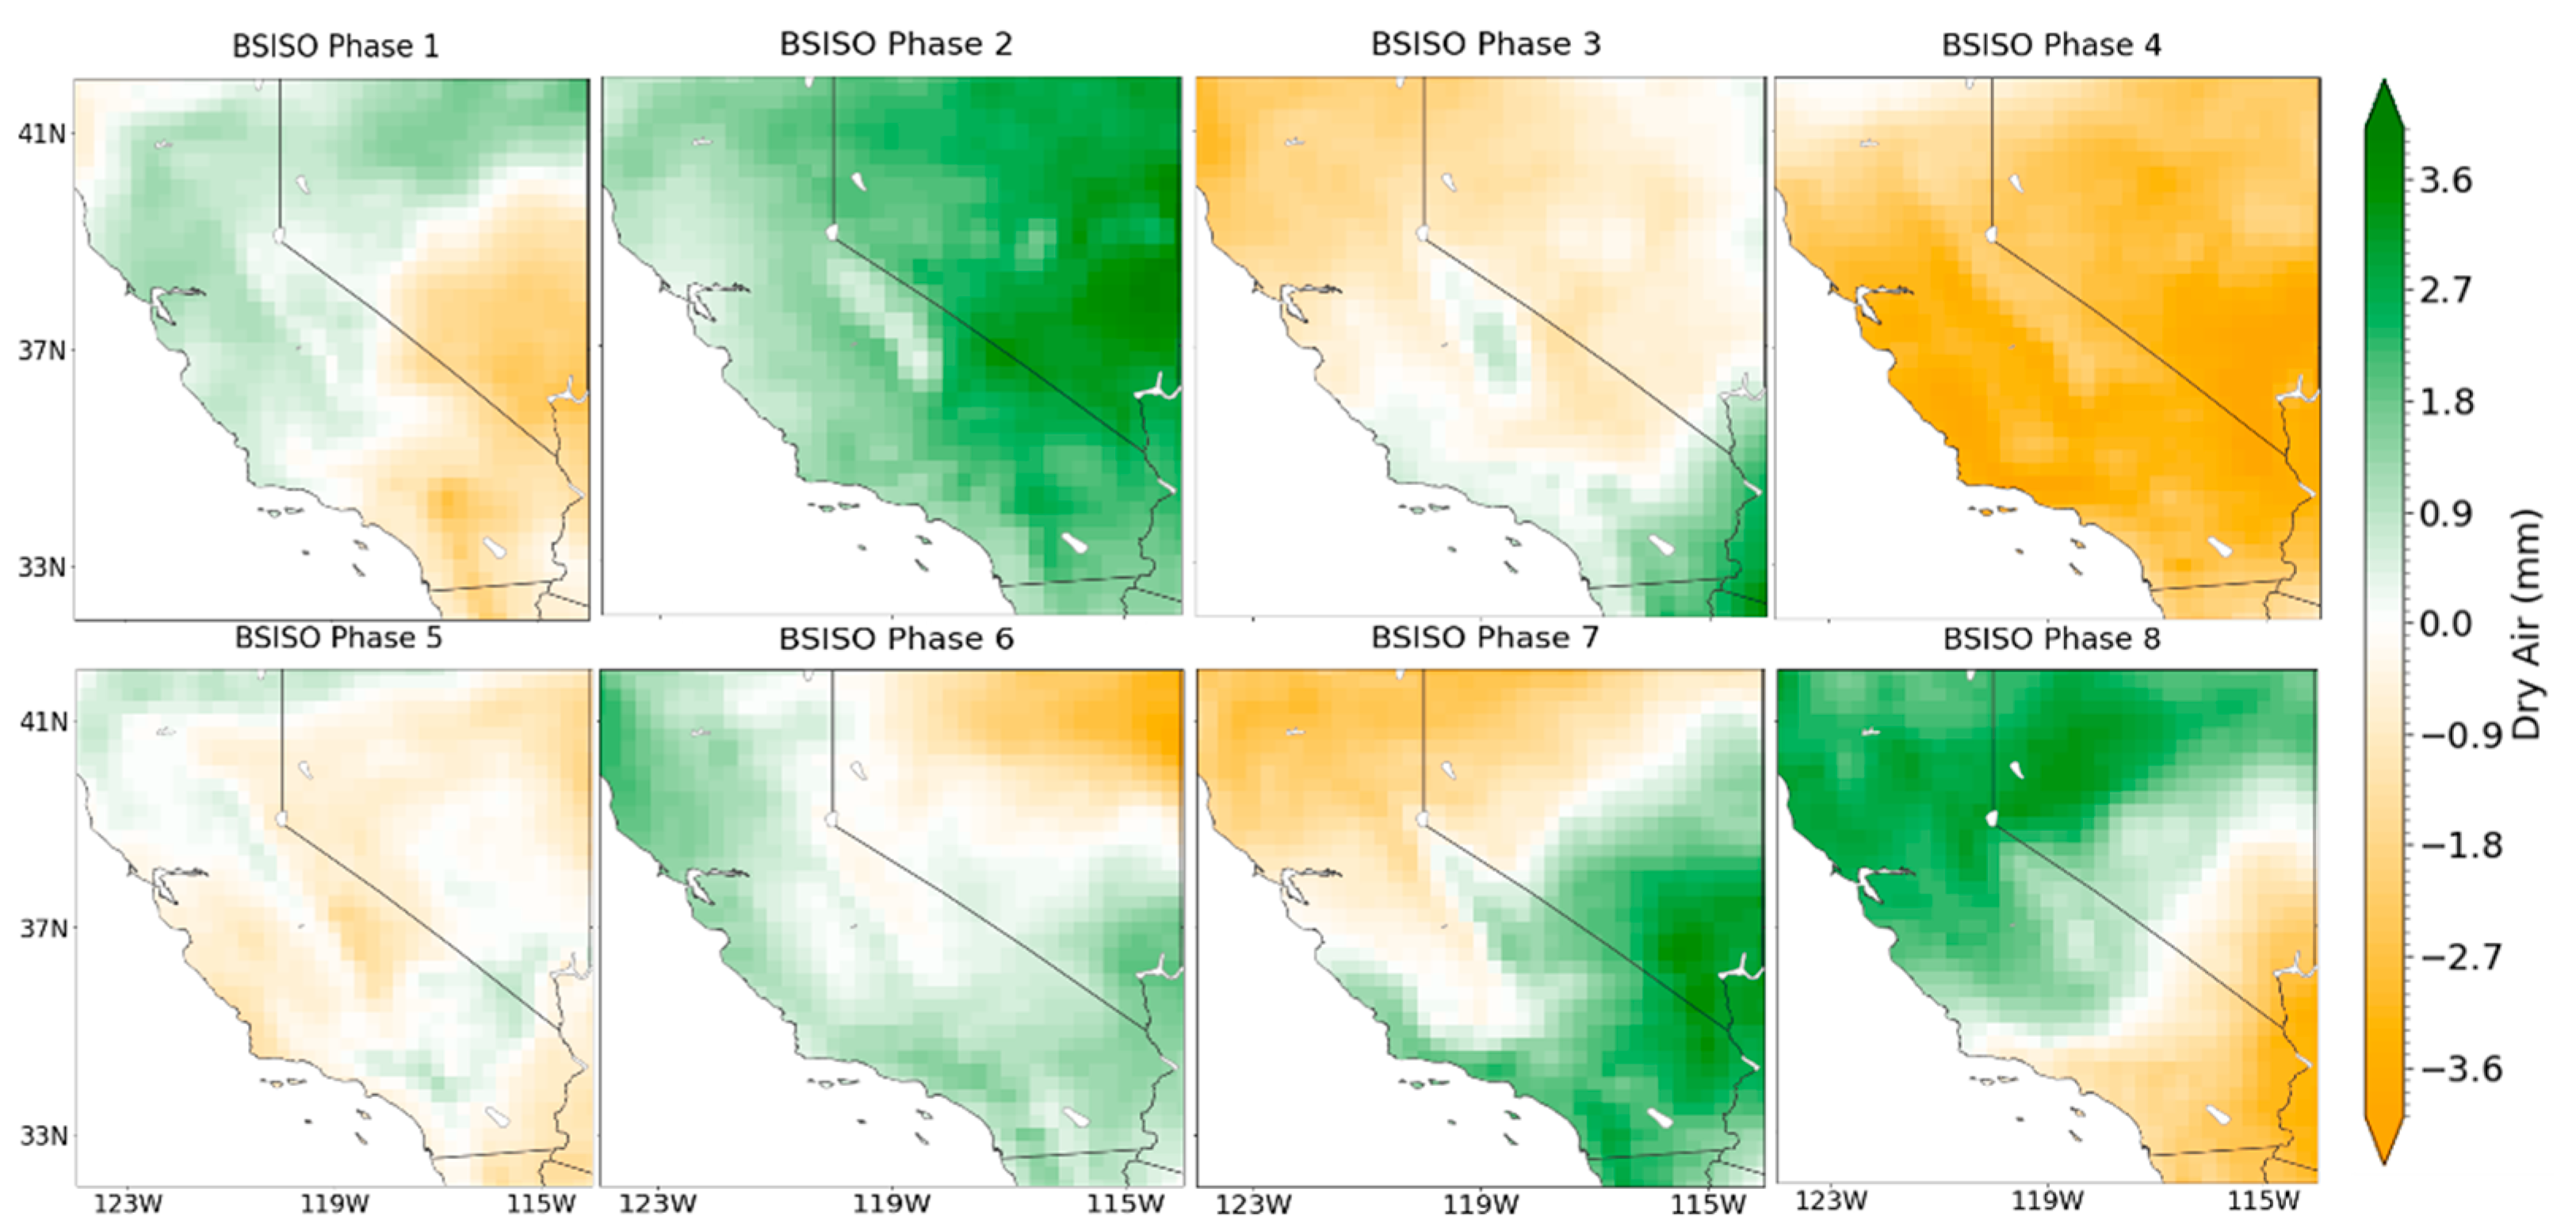
We analyzed anomalies in dry air and the FWI by determining deviations from the June–August average over the 1980–2021 study period for each BSISO phase (
Figure 5 and
Figure 6).
Figure 5 presents composite dry air anomalies for the eight BSISO phases, drier than normal air is represented by the orange shading.
Marked variability in the moisture content of the atmosphere is observed during the BSISO progression (
Figure 5). In the shift from phase 2 to 3, we observed drier air especially in Northern California, parts of the Central coastal ranges and Death Valley. However, in phase 4, predominant dryness envelops the entire state of California, signifying a notable departure from mean moisture levels. The dry anomalies in phase 4 cover a larger spatial extent compared to the other phases, with most of California experiencing drier than normal conditions. This widespread aridity, resulting from fluctuation in atmospheric moisture linked to the BSISO's spatial-temporal evolution [
65], sets the stage for heightened wildfire risk.
In the region R1, there is a marked tendency for extremely dry conditions during BSISO phases 3, 4, and 7. The dry anomalies in R1 during these phases range from -1.8 to -3.6 mm, indicating significantly drier conditions compared to the average. This pattern is most likely due to alterations in air circulation and moisture transportation that occur during these specific stages of the BSISO cycle. Such changes can include reduced humidity and increased aridity, laying the groundwork for these dry conditions. In region R2, severe dryness is seen during phase 4, with dry anomalies less than -3.6 mm, while moderate to light dryness is observed during phases 3, 5, and 7, with anomalies ranging from -0.9 to -2.7 mm. In region R3, drier conditions are observed during phases 1, 4, and 8, with dry anomalies being most pronounced in phase 4 (values less than -2.7 mm).
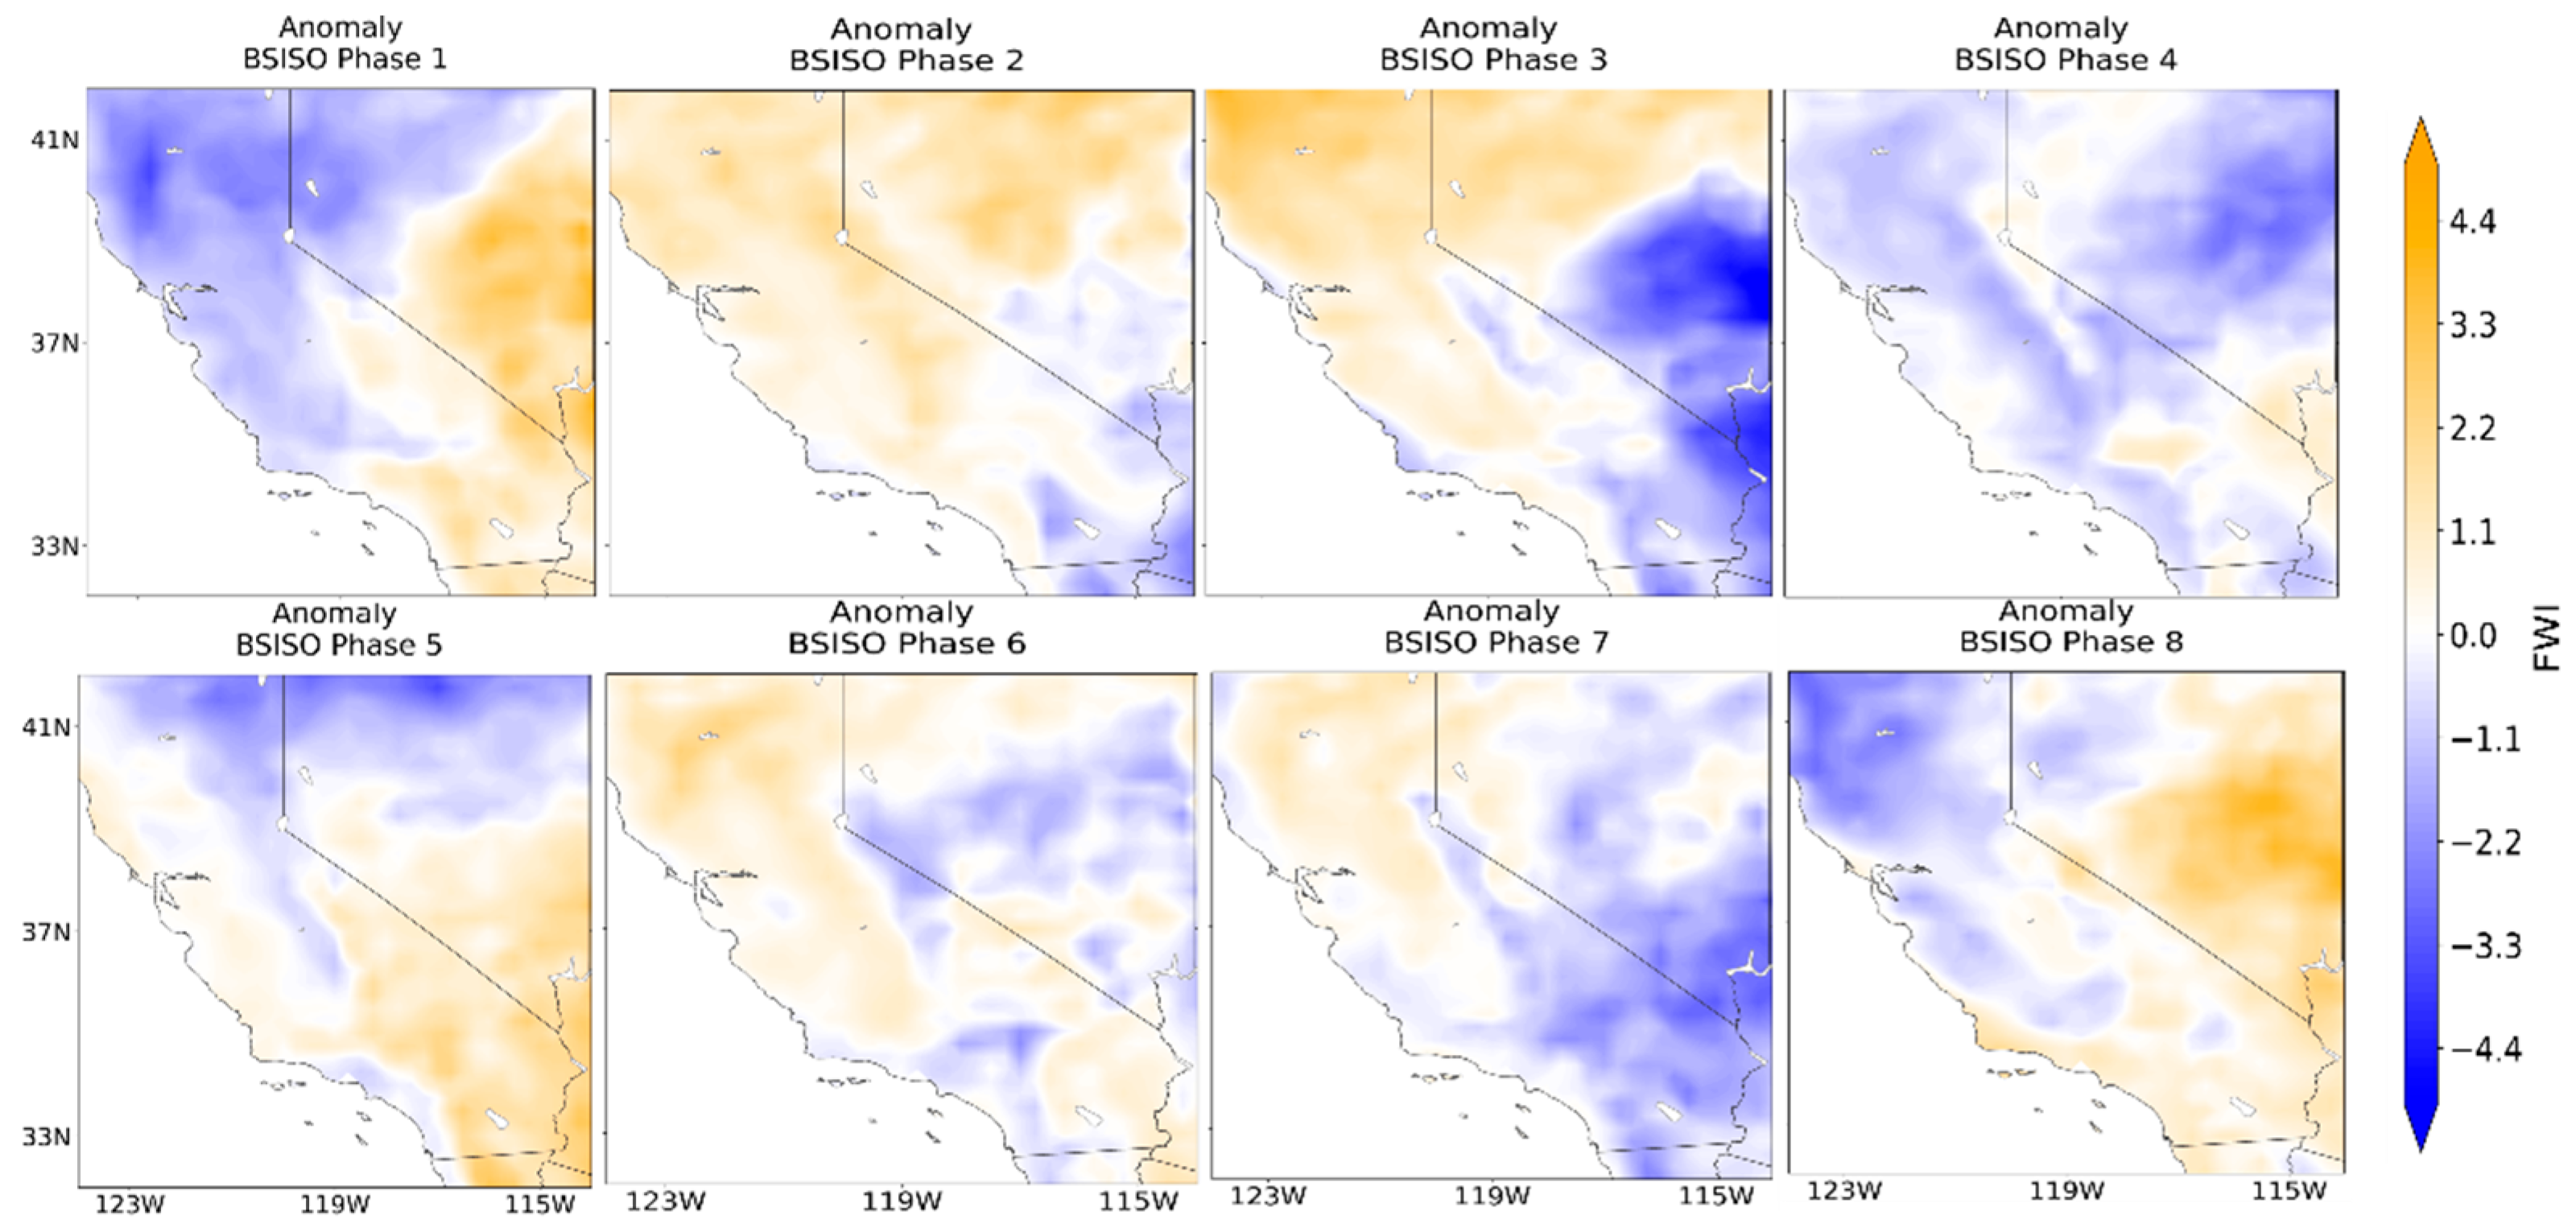
In
Figure 6, the percentage anomaly of FWI is presented, showing the variability of wildfire risk across the eight BSISO phases. The results show that regions R1 and R2 experience increased wildfire risk, particularly in the Klamath Mountains of region R1 during phase 3. As phase 4 moves over the region, the wildfire risk reduces in the entire state. However, during phase 5, the Coastal Ranges, Sierra Nevada Mountains, and parts of elevated Southern California all exhibit heightened wildfire risk. As the BSISO advances to phase 6, regions R1 and R2 continue to exhibit positive FWI anomalies, indicating higher-than-normal fire risk. During phase 7, the elevated fire risk becomes more restricted to parts of the Northern mountains. Progressing to phase 8, the Southern coast experiences an increased potential for wildfires, as evidenced by the positive FWI anomalies in this region.
The BSISO adds another layer of complexity to the climatic interplay, such that its influence on moisture distribution and wildfire risks may vary from region to region [
29]. While Northern California experiences drier than average conditions during phases 3, 4, and 7, the FWI anomalies do not always align with the dry air anomalies. For instance, in phase 4, despite the extremely dry conditions, the FWI anomalies indicate lower than average wildfire risk in Northern California. Conversely, during phase 2, when dry conditions are less pronounced, the FWI anomalies suggest higher than average wildfire risk in this region. Phase 4 shows a pronounced dry impact on California and parallels some studies that explored the atmospheric anomalies stemming from BSISO's evolution [
26]. The regional complexity, particularly the distinct patterns in northern and southern California, highlights the interplay between large-scale climate drivers and local factors, a phenomenon also discussed by Nicholas et al. (2020) [
66]. Their study examined the various drivers of wildfire severity and spatial variability of the 2013 Rim Fire in the Sierra Nevada mountain range in eastern California, highlighting the multi-scale nature of their influences. Recognizing the disparities in the effects of climatic oscillations across different regions can aid in developing more targeted preventive strategies in California.
3.2.2. ENSO
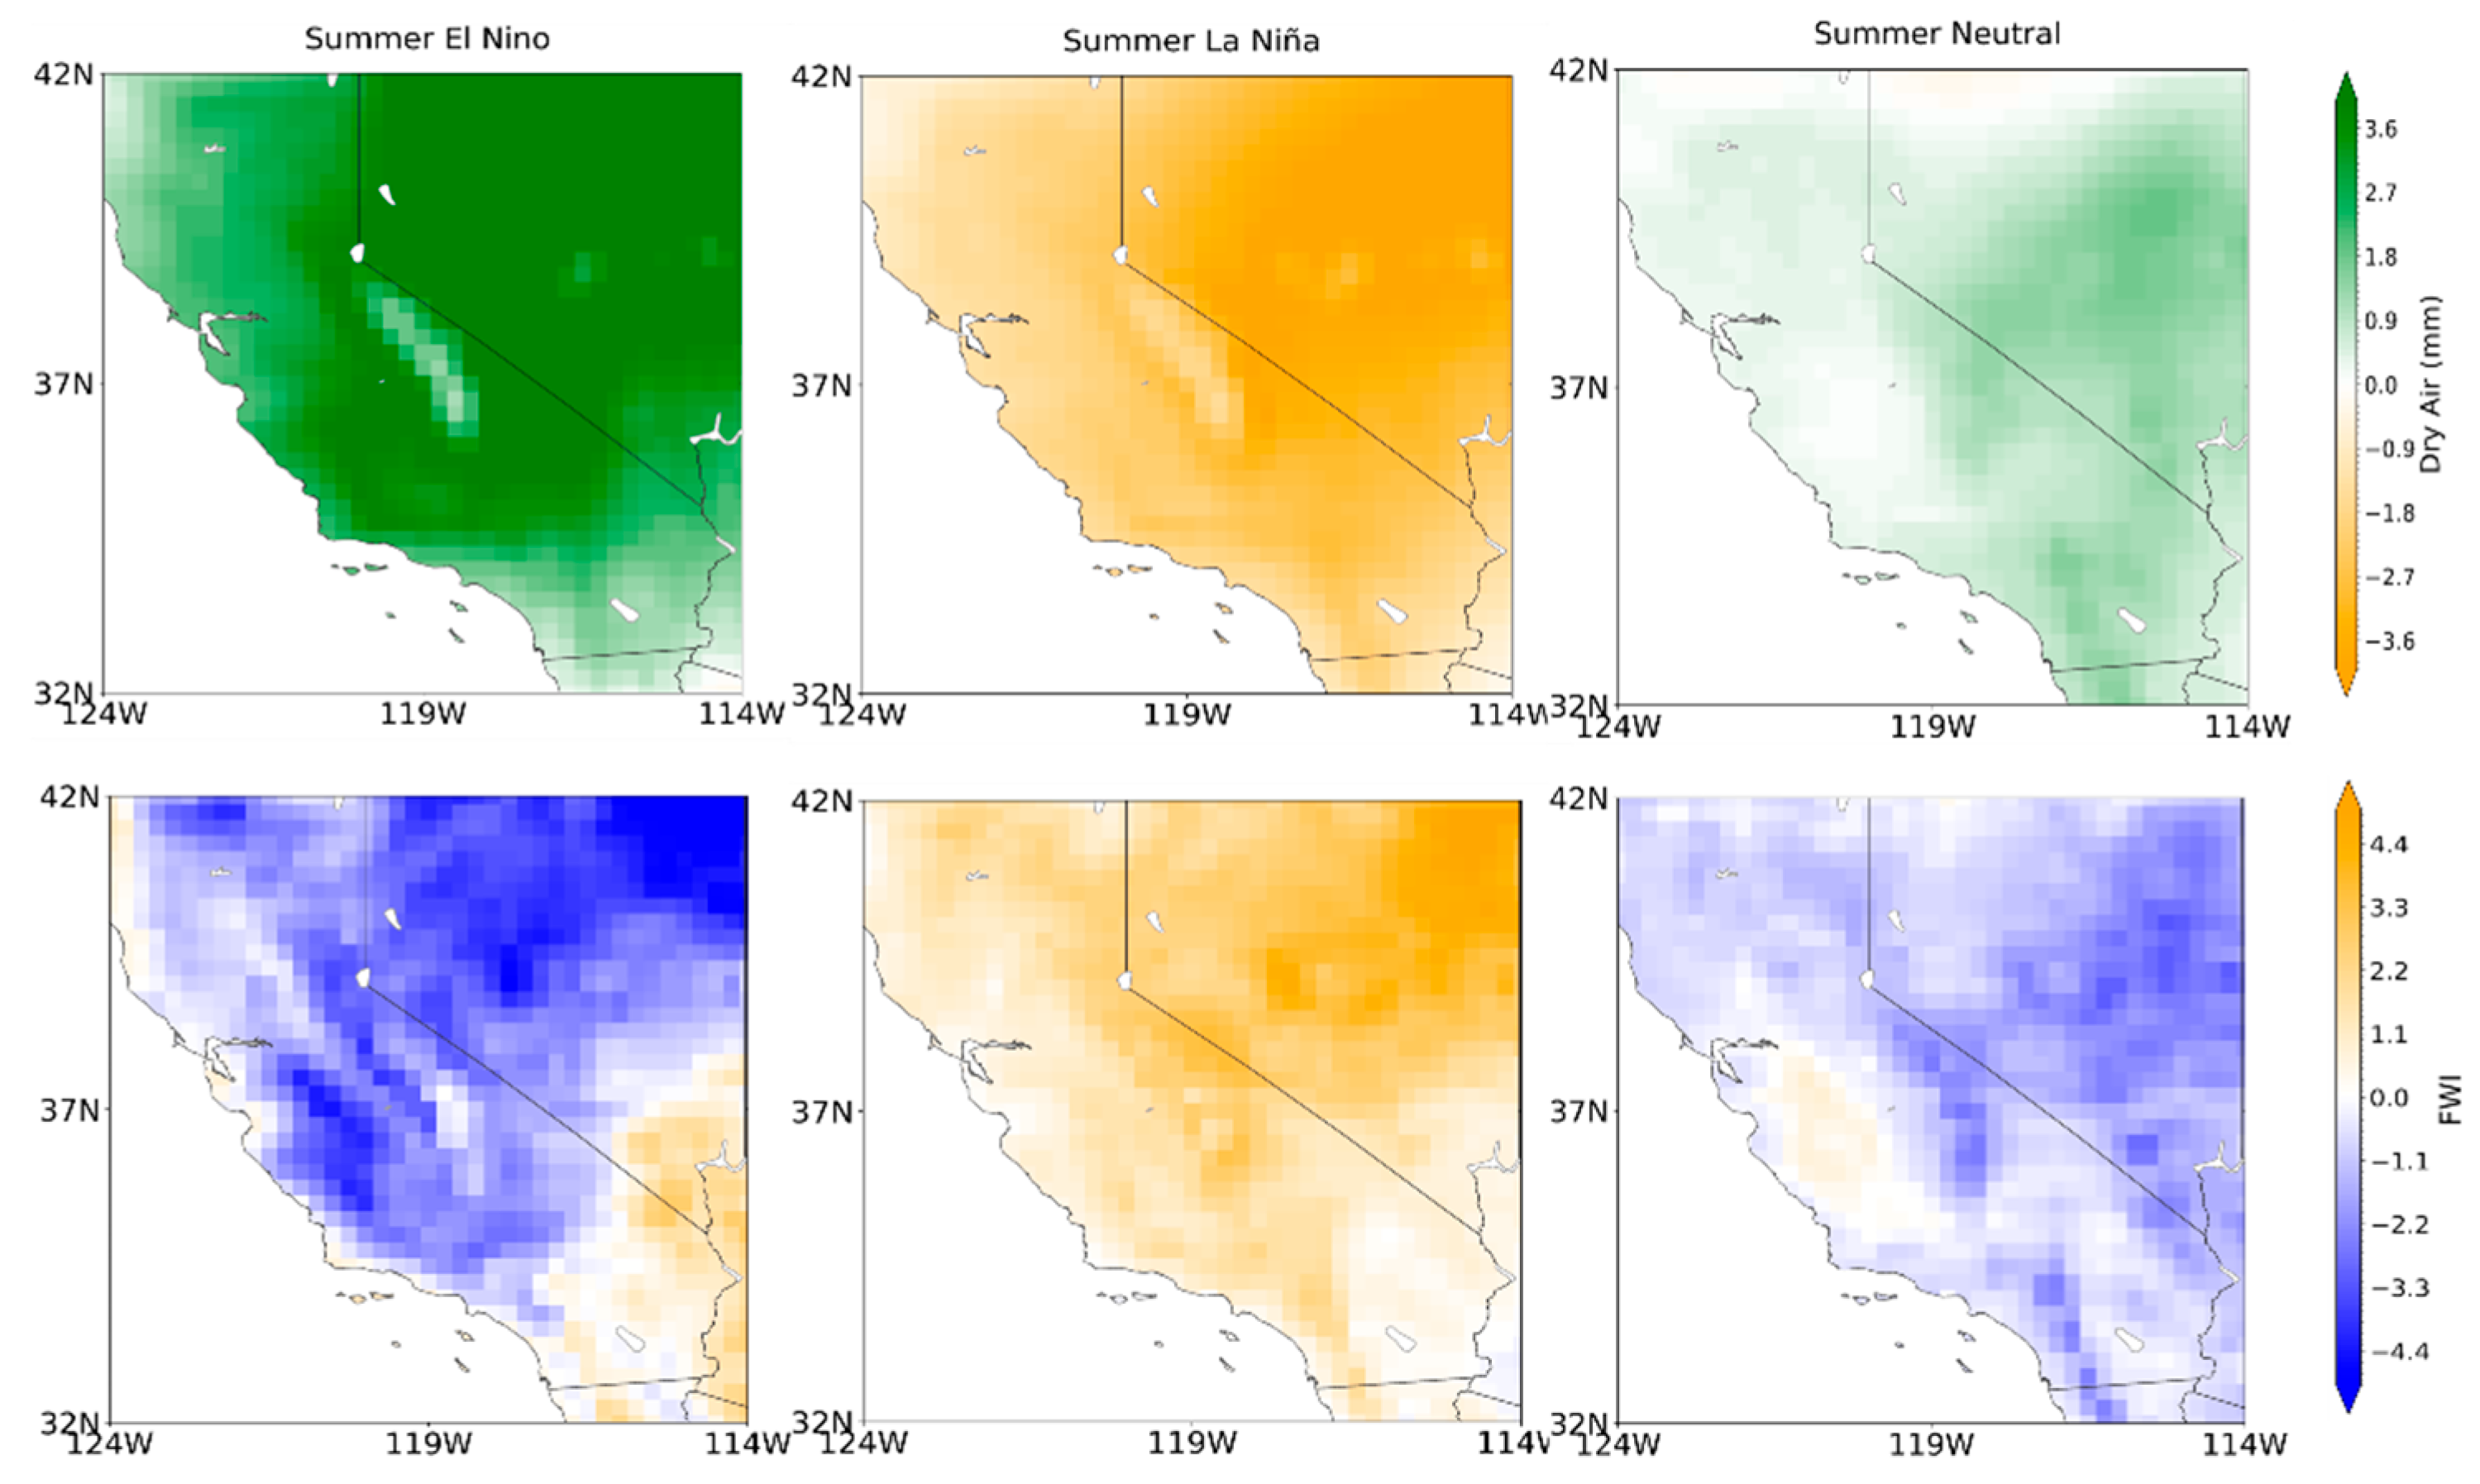
Figure 7 shows composites of Dry Air anomalies and FWI anomalies during ENSO phases. Orange color shows drier conditions and more proneness to wildfires. During the El Niño phase, there is a decrease in moisture deficit and FWI values. This observation supports the findings of Hoell et al. [
67], who highlighted that during strong El Niño events, the easterly trade winds weaken or even reverse in the Pacific Ocean. This allows warm water to move eastward, increasing the SST in the eastern Pacific and leading to increased evaporation and higher chances of precipitation over California. Additionally, this finding is also in line with the results of Cole et al. [
68], who found that during La-Niña events, significant dry periods were associated with decreased moisture due to the upwelling of cooler waters in the eastern Pacific. This phenomenon coincides with the strengthening of easterly trade winds across the Pacific Ocean during La-Niña episodes.
Our findings revealed a notable decrease in the moisture deficit (top panel) and FWI (bottom panel) during El Niño (left column). Previous research has shown that during a strong El Niño, CA is expected to be wetter than normal [
15], reducing very large fires. Similarly, in the study region the atmosphere exhibits increased moisture content, nearing a level that significantly lowers the likelihood of wildfires, as indicated by a decrease in the Fire Weather Index (FWI). However, during the La-Niña phase (middle), we observed an increasing moisture deficit, indicating drier atmospheric conditions and increased risk for wildfires. These patterns are consistent with the typical climatological behavior associated with these phases: El Niño often brings about increased rainfall and wetter conditions [
67], while La-Niña tends to usher in drier conditions [
68].
3.2.3. Pacific Decadal Oscillation (PDO)
We now highlight the influence of the Pacific Decadal Oscillation (PDO) on moisture deficit and wildfire risk.
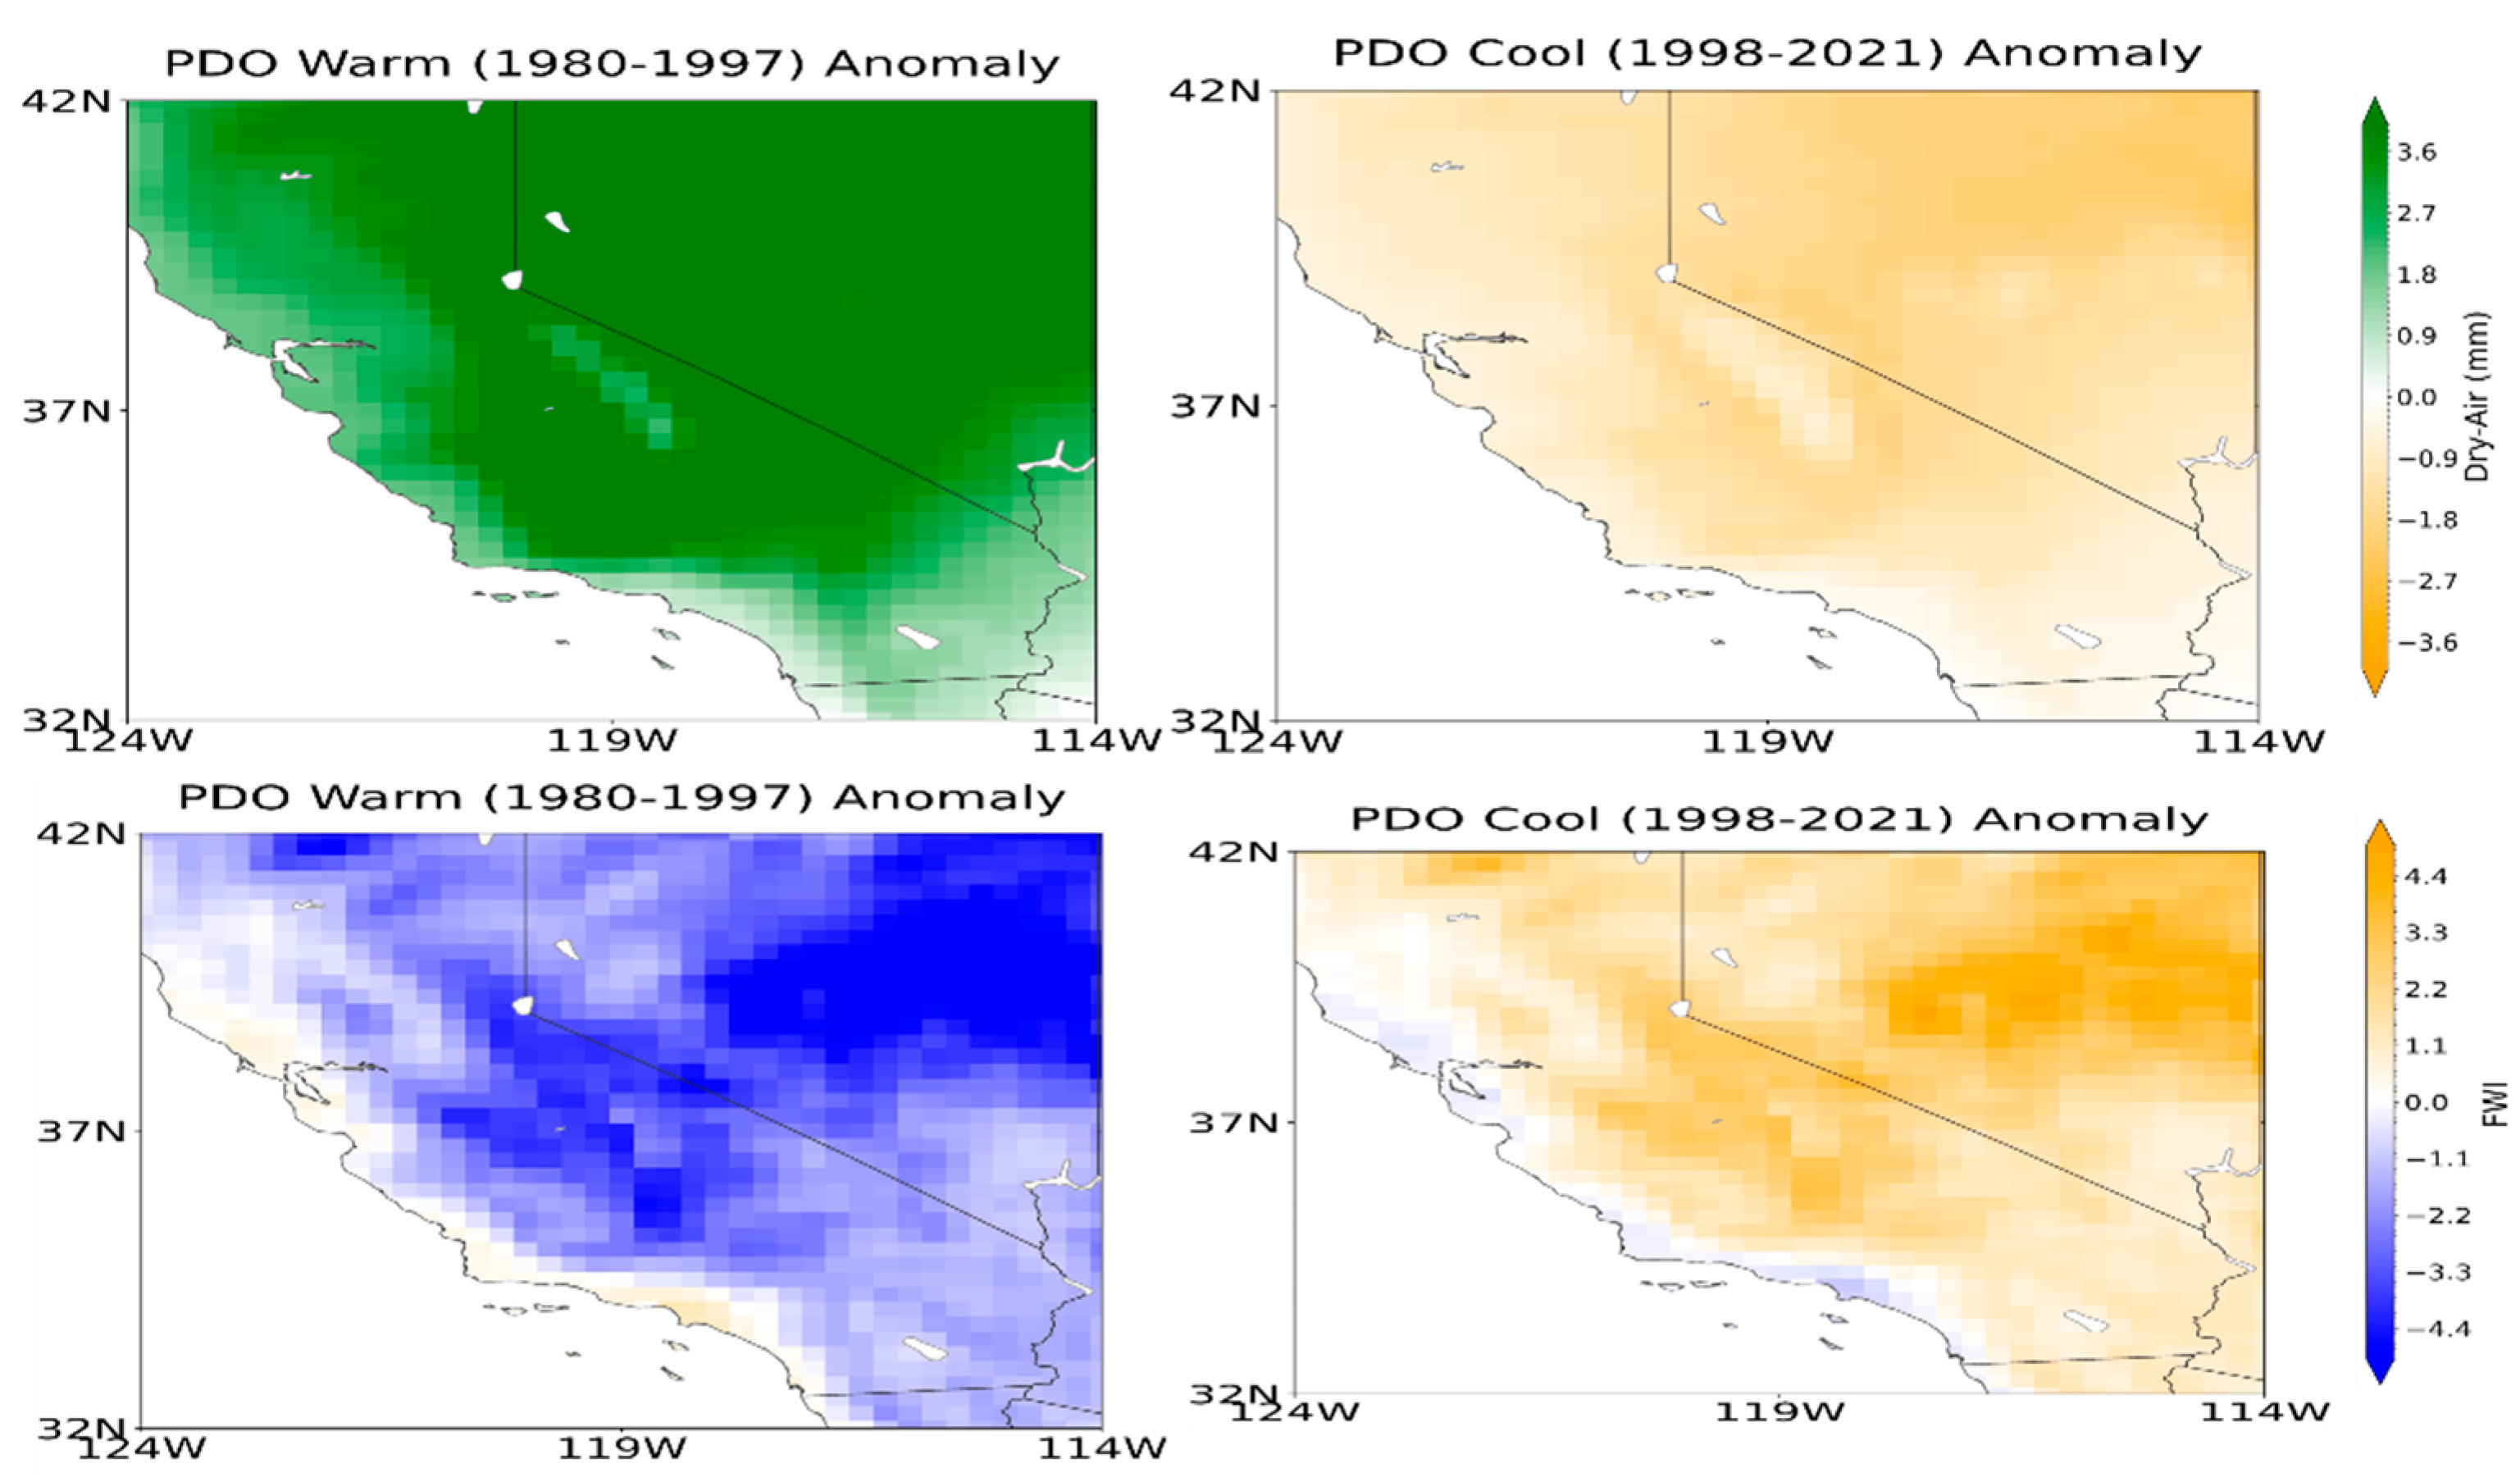
Figure 8 presents the climatology of moisture deficit (top panels) and the Fire Weather Index (FWI) (bottom panels) under different phases of the PDO. It is important to note that the anomalies depicted in the figure on the left are averaged during the most recent warm PDO period (1980-1997) while those on the right represent the current, predominately cool PDO phase (1998-2021). Wet conditions are observed during the warm PDO phase while the cool PDO phase is associated with conditions that are drier than the long-term average. These dry conditions often result from variability in sea surface temperature patterns and subsequent atmospheric responses and may lead to decreased soil moisture and reduced surface humidity [
69]. There are higher wildfires risks due to these dry circumstances, as depicted earlier (
Figure 3 and
Figure 4), where we observed above average wildfire conditions during the cool phase. Our study shows that the cool PDO is linked with increased wildfire potential, and moisture below the mean condition. Not only is there less precipitation, but there may be more fuel accessible owing to parched vegetation, which further increases wildfire risk.
The PDO's influence on drought and wildfire propensity, as depicted in this study, is consistent with the observations of Schoennagel et al. [
14]. Schoennagel et al. noted that almost 70% of significant wildfires in the southern Rockies occurred during a combination of La-Niña and negative PDO phase. Their study over the Rocky Mountain showed that the PDO, especially when considered in conjunction with ENSO phases, plays a significant role in influencing drought-induced wildfires, which is consistent with our study. However, the impact of the co-occurrence of BSISO phases with cool or warm phases of the PDO on wildfire risks has not yet been demonstrated.
3.3. An Analysis of Wildfire Risk under Combined PDO and BSISO Conditions
We have shown individual large-scale conditions on wildfire risk, we now investigate the combined effect of PDO and BSISO. This exploration is crucial since longer-term teleconnections like PDO can influence intraseasonal changes in fire weather conditions and modulate the effect of seasonal to intraseasonal oscillation/teleconnections (e.g. BSISO and ENSO), an area still under-researched.
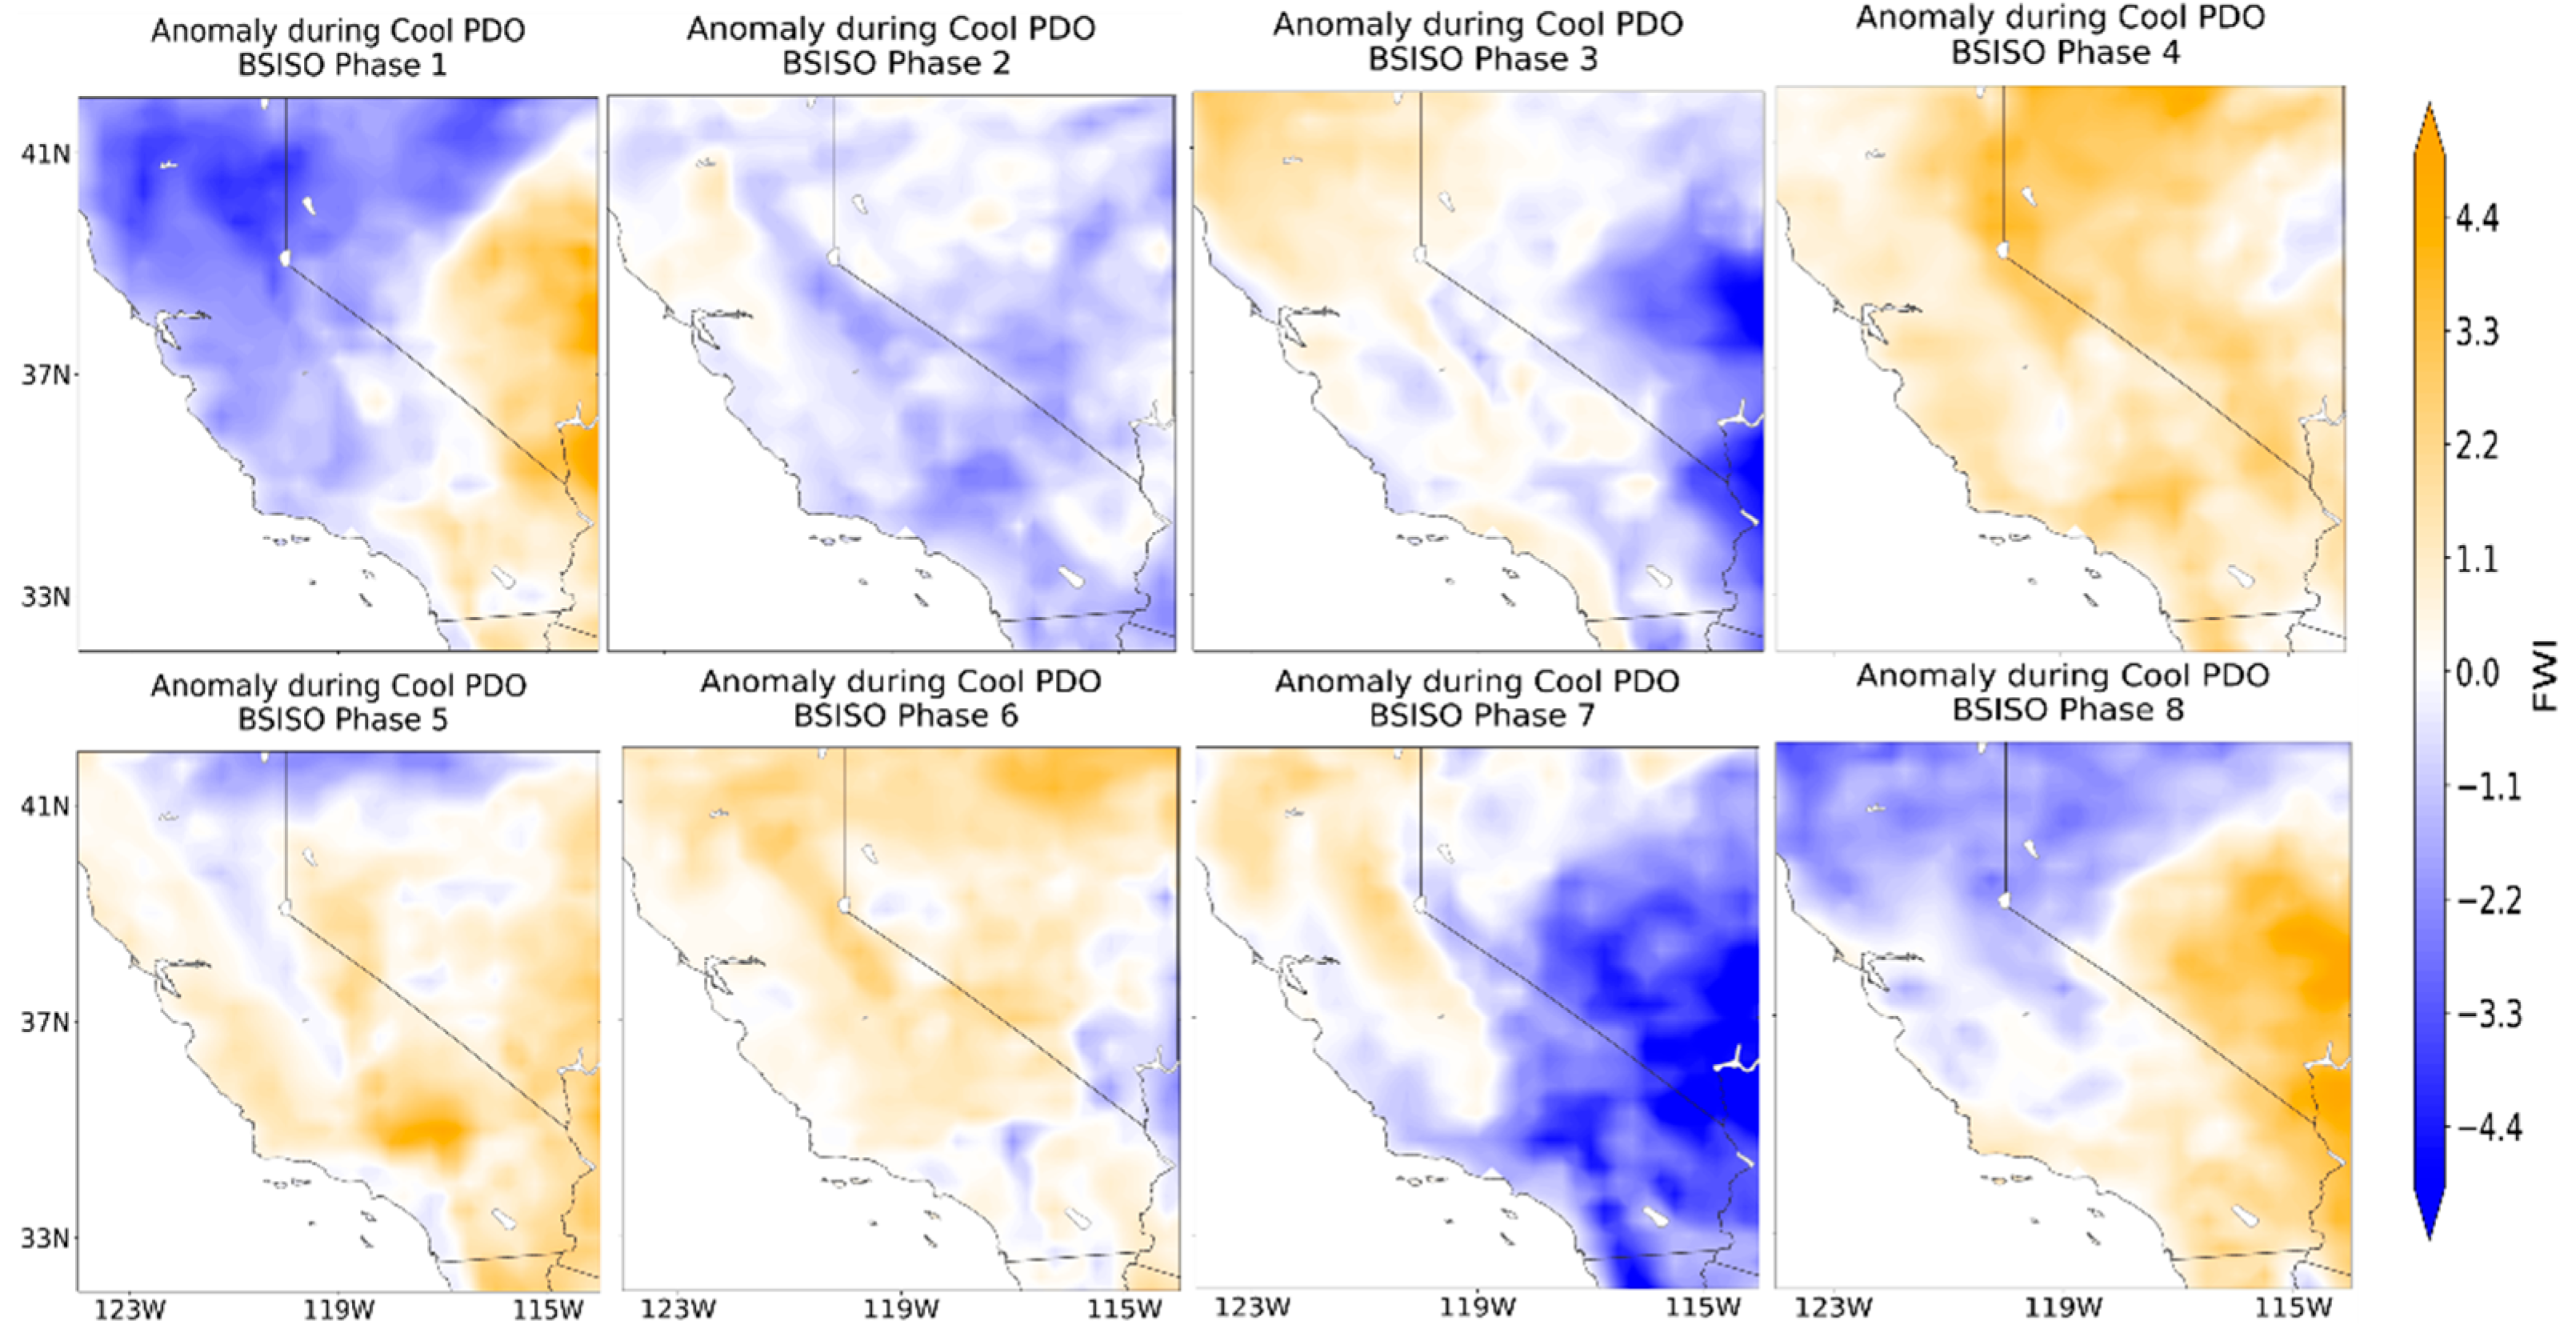
Figure 9 presents the FWI anomalies for each BSISO phase during the recent cool PDO period (1998 to 2021).
Figure 10 presents the FWI anomalies for each BSISO phase within the warm PDO period from 1980 to 1997. The plots illustrate the anomalies of the FWI for each BSISO phase, indicating the deviations of the FWI from the average conditions throughout the cool or warm PDO. The purpose of this analysis is to investigate the conditions associated with different BSISO phases under the influence of the warm or cool PDO and to compare them with those observed when considering the BSISO independently.
During the warm PDO period, BSISO Phase 2 is characterized by a persistent positive sea surface temperature anomaly across the equatorial Pacific Ocean and a simultaneous negative anomaly in the central northern Pacific Ocean. The interaction between these anomalies and the atmospheric and climatic conditions typical of BSISO Phase 2 results in a substantial increase in wildfire risk conditions (
Figure 10). In contrast, during the cool PDO phase, which features negative sea surface temperature anomalies along the equatorial Pacific, there is a significant reduction (
Figure 9) in the conditions that usually enhance wildfire risks during BSISO Phase 2. The cooler ocean temperatures and the associated atmospheric patterns tend to mitigate or weaken the typical influences of this BSISO phase, resulting in more subdued or less pronounced FWI patterns.
The cool phase of the PDO is generally associated with drier conditions in California (see
Figure 8). During BSISO phases 1, 7, and 8, we observed a negative anomaly that counteracts the typically dry signal from cool PDO and La-Niña phases. These BSISO phases appear to reduce fire weather risk in R1 and R2 during phases 1 and 8, and in region R3 during phase 7.
Moreover, the impact of the co-existent of the cool PDO with the BSISO is evident in phase 2 across the Sierra Nevada and Southern mountain regions. Initially, when examining the BSISO independently, positive FWI anomalies were observed in regions R1 and R2, with only a weak positive anomaly in parts of R3. However, during the cool PDO phase, these anomalies transition toward normal to negative values, indicating a diminished wildfire risk.
In
Figure 9, phases 1, 4, and 8 of the BSISO show contrasting results between the cool PDO phase and when the BSISO phases occur independently of the PDO cycle (
Figure 6). During phases 1 and 8, the cool PDO phase exhibits more pronounced negative anomalies compared to when these BSISO phases operate alone. This is particularly evident in areas such as the Sierra Nevada and the northern California mountains, where the interaction between phases 1 and 8 of the BSISO and the cool PDO appears to suppress the wildfire risk more than when these BSISO phases occur independently.
However, during phase 4, the relationship between the BSISO and the cool PDO phase is notably different. In
Figure 6, phase 4 is characterized by lower than average FWI (blue shading) across most of California. In contrast,
Figure 9, which represents the cool PDO phase, exhibits strongly higher than average FWI (dark orange shading) in R1. This stark difference suggests that the interaction between BSISO phase 4 and the cool PDO amplifies the wildfire risk in R1, as opposed to the suppressing effect observed in phases 1 and 8.
The findings reveal that the conditions experienced during each BSISO phase vary between the cool and warm PDO periods. Interestingly, there is a reversal in the sign of anomalies in the Sierra Nevada Mountains during BSISO phases 1, 2, 4, and 8. A comparison of the FWI anomalies associated with the independent occurrence of the BSISO (
Figure 6) and those during the warm PDO (
Figure 10) shows that BSISO Phases 1, 2, 3, and 8 intensify the potential for wildfires in region R1. Furthermore, Phase 6 is associated with an increased wildfire potential in the Klamath Mountains region.
Wildfire risk is reduced across all regions of California during BSISO Phase 4. Moreover, this reduction in wildfire risk persists into BSISO Phases 5, 6, and 7 in areas that already exhibit negative anomalies, as indicated by the FWI data. In summary, during the cool PDO, wildfire risks in region R1 are reduced during all BSISO phases except phase 4, when they are enhanced. In R2, wildfire risks are mostly suppressed during BSISO phases 1 to 3 and 6 to 8, enhanced during phases 4, and near normal during phase 5. Finally, in R3, wildfire risks are suppressed during phases 1, 2, 5, 7, and 8, enhanced during phases 4, and near normal during phases 3 and 6.
In summary, during the cool PDO, wildfire risks in region R1 are reduced during all BSISO phases except phase 4, when they are enhanced. In R2, wildfire risks are mostly suppressed during BSISO phases 1 to 3 and 6 to 8, enhanced during phases 4, and near normal during phase 5. Finally, in R3, wildfire risks are suppressed during phases 1, 2, 5, 7, and 8, enhanced during phases 4, and near normal during phases 3 and 6.
Consistent with previous studies (e.g., [
14]), results in this study suggest that the PDO can enhance or suppress the characteristics of specific BSISO phases, thereby influencing FWI patterns.
3.4. Synoptic to Large-Scale Impact on Moisture, Temperature, and Wildfire Risk
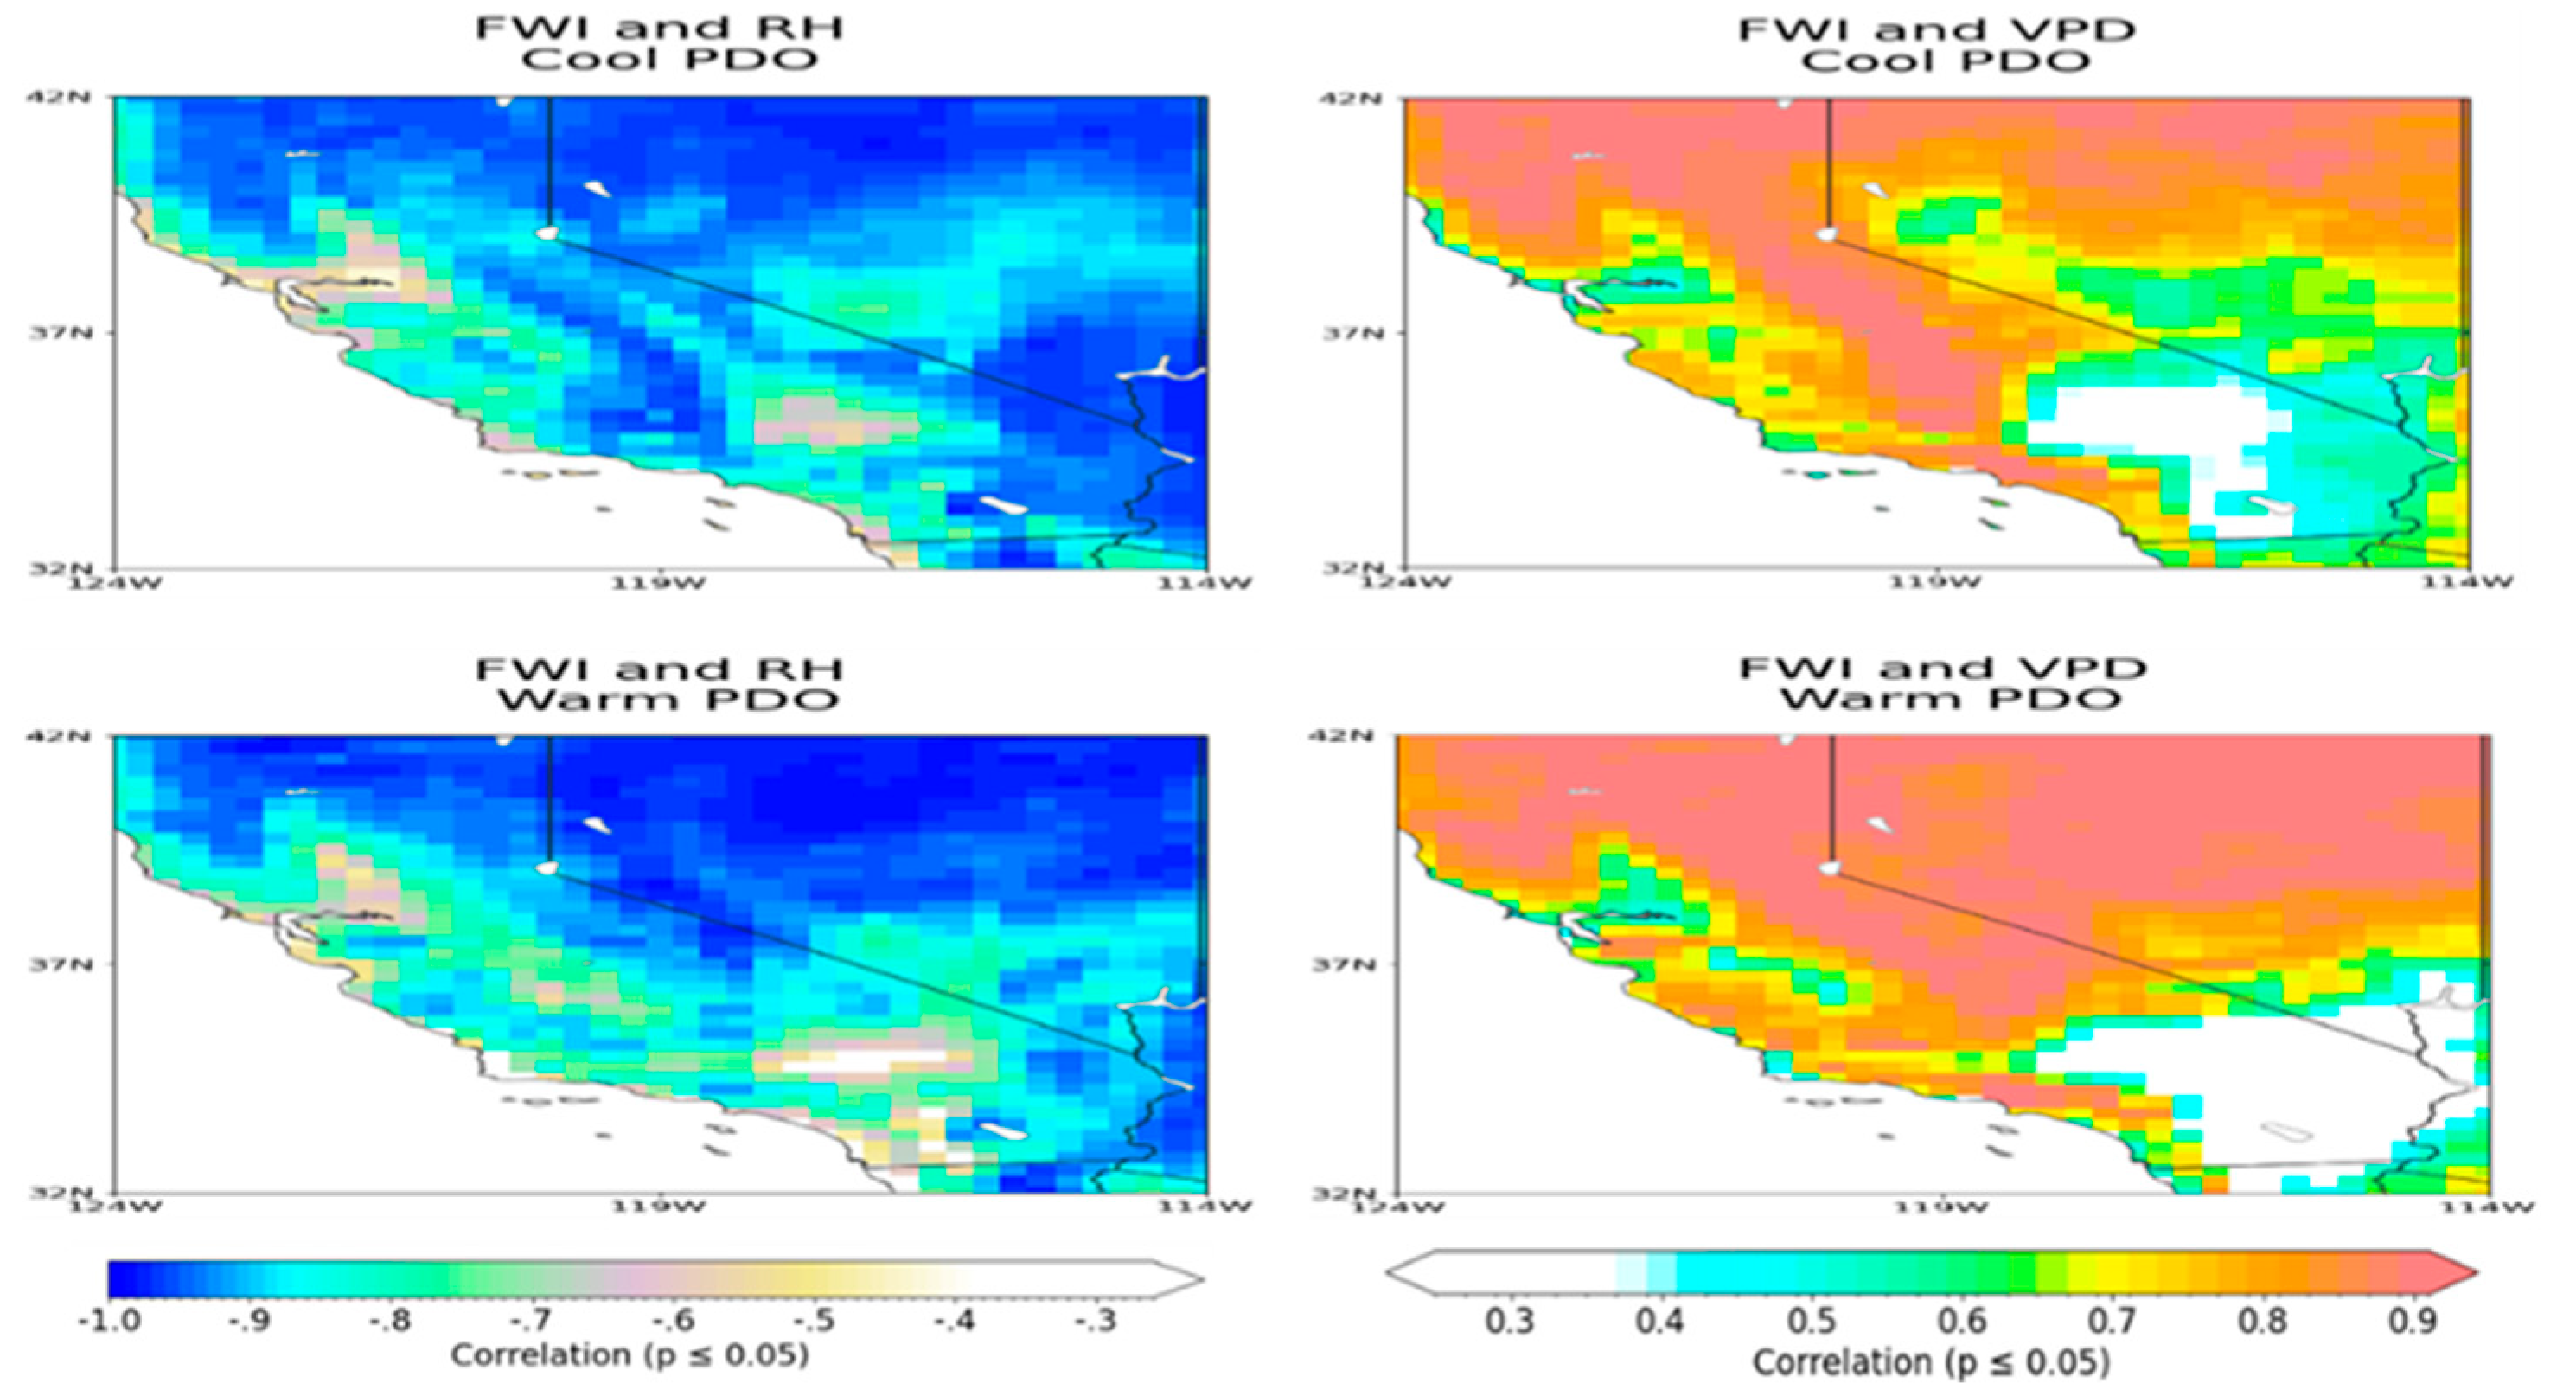
In this section, we explore how FWI is influenced by moisture conditions, utilizing both relative humidity (RH) and vapor pressure deficit (VPD) as indicators. While RH quantifies the moisture level in the atmosphere relative to its maximum capacity at a given temperature, VPD measures the atmospheric moisture demand independent of temperature. Both metrics play distinct roles in assessing wildfire risk through the FWI.
RH offers insights into the ambient air moisture, which directly affects the moisture content of dead and live fuel. Lower RH values indicate drier air, leading to increased evaporative demand and faster drying of fuels, thereby increasing the overall wildfire potential. As evident from the strong negative correlation between FWI and RH (left column,
Figure 11), areas with lower RH exhibit higher FWI values and, consequently, elevated wildfire risk.
On the other hand, VPD provides information on the potential for moisture loss from vegetation and soil due to the atmospheric moisture demand. Higher VPD corresponds to drier vegetation and soil, increasing the availability of dry fuel for wildfires. The strong positive correlation between FWI and VPD (right column,
Figure 11) in regions R1, R2, and coastal mountains in R3 highlights how elevated VPD is associated with an increased risk of wildfires in these areas.
It is important to note that in the desert region of R3, correlations between FWI and VPD are weak or not significant. This can be attributed to the lack of vegetation in these arid areas, where fuel availability is limited, making the region less susceptible to wildfire risk despite potential changes in VPD.
While both RH and VPD contribute to the FWI's assessment of wildfire risk, they capture distinct aspects of the moisture dynamics influencing fuel conditions. RH directly reflects the moisture content of fuels, while VPD indicates the potential for further drying of fuels due to atmospheric moisture demand. Together, these metrics provide a comprehensive understanding of the complex interplay between atmospheric conditions and wildfire risk, as reflected in the strong correlations with FWI across different climatic phases.
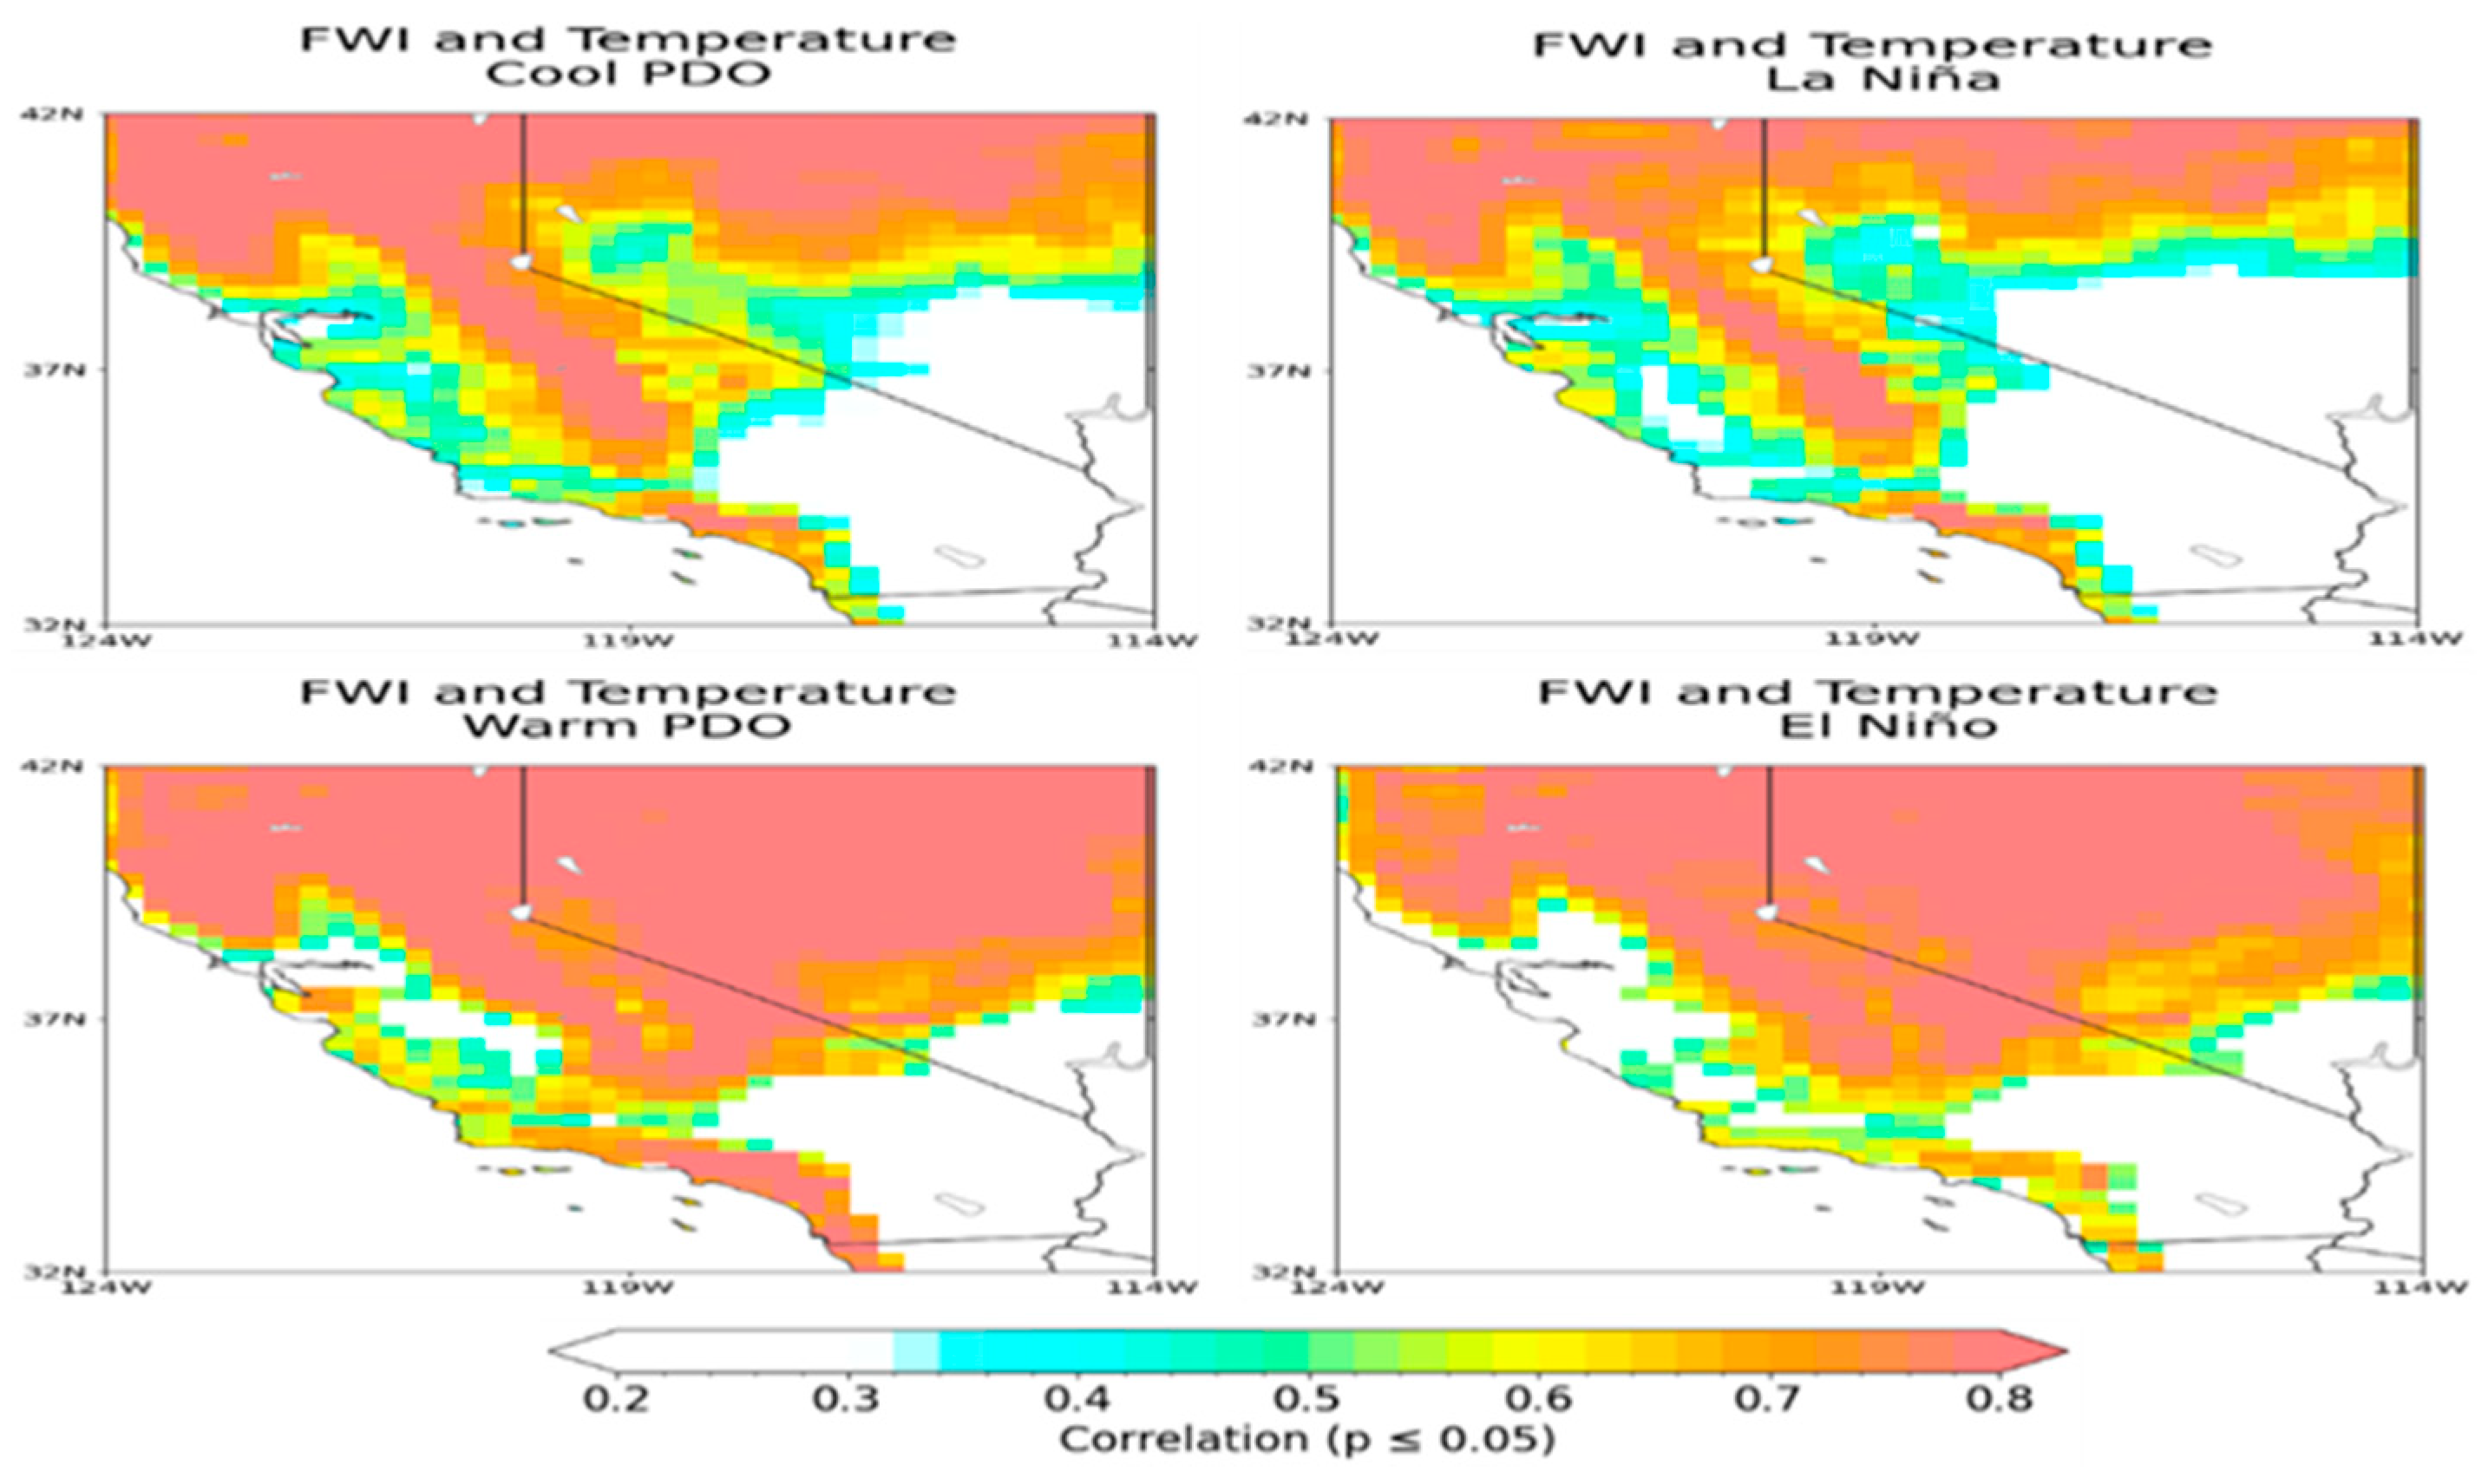
Next, we examined the relationship between 2m temperature and FWI during ENSO and PDO phases across the regions.
Figure 12 presents the correlation between FWI and temperature during PDO phases (left): cool PDO (top) and warm PDO (bottom), and during ENSO phases (right): La-Niña (top) and El Niño (bottom). Strong positive correlations are observed in the Northern mountains and Sierra Nevada mountains of R1 and R2 while R3 shows no correlations except along the coastlines. As previously stated, the deserts in R3 are characterized by low fuel due to sparse vegetation and very low winds and exhibit no correlations. This reflects the reduced wildfire risk despite potential temperature increases. This aligns with the understanding that lower fuel availability in these arid regions significantly mitigates the likelihood of wildfires, even under warmer conditions. Conversely, along the coastlines in R3 region, the strong positive correlation can be attributed to higher vegetation density, which provides more fuel, especially after a winter with increased precipitation, and when coupled with increased temperatures, wildfire risk is elevated.
Our findings show that during the PDO phases, the relationship between FWI and temperature becomes more prominent, particularly in elevated regions. Mountainous regions often have unique microclimates, where temperature variations can significantly impact vegetation dryness and, consequently, wildfire risks.
In
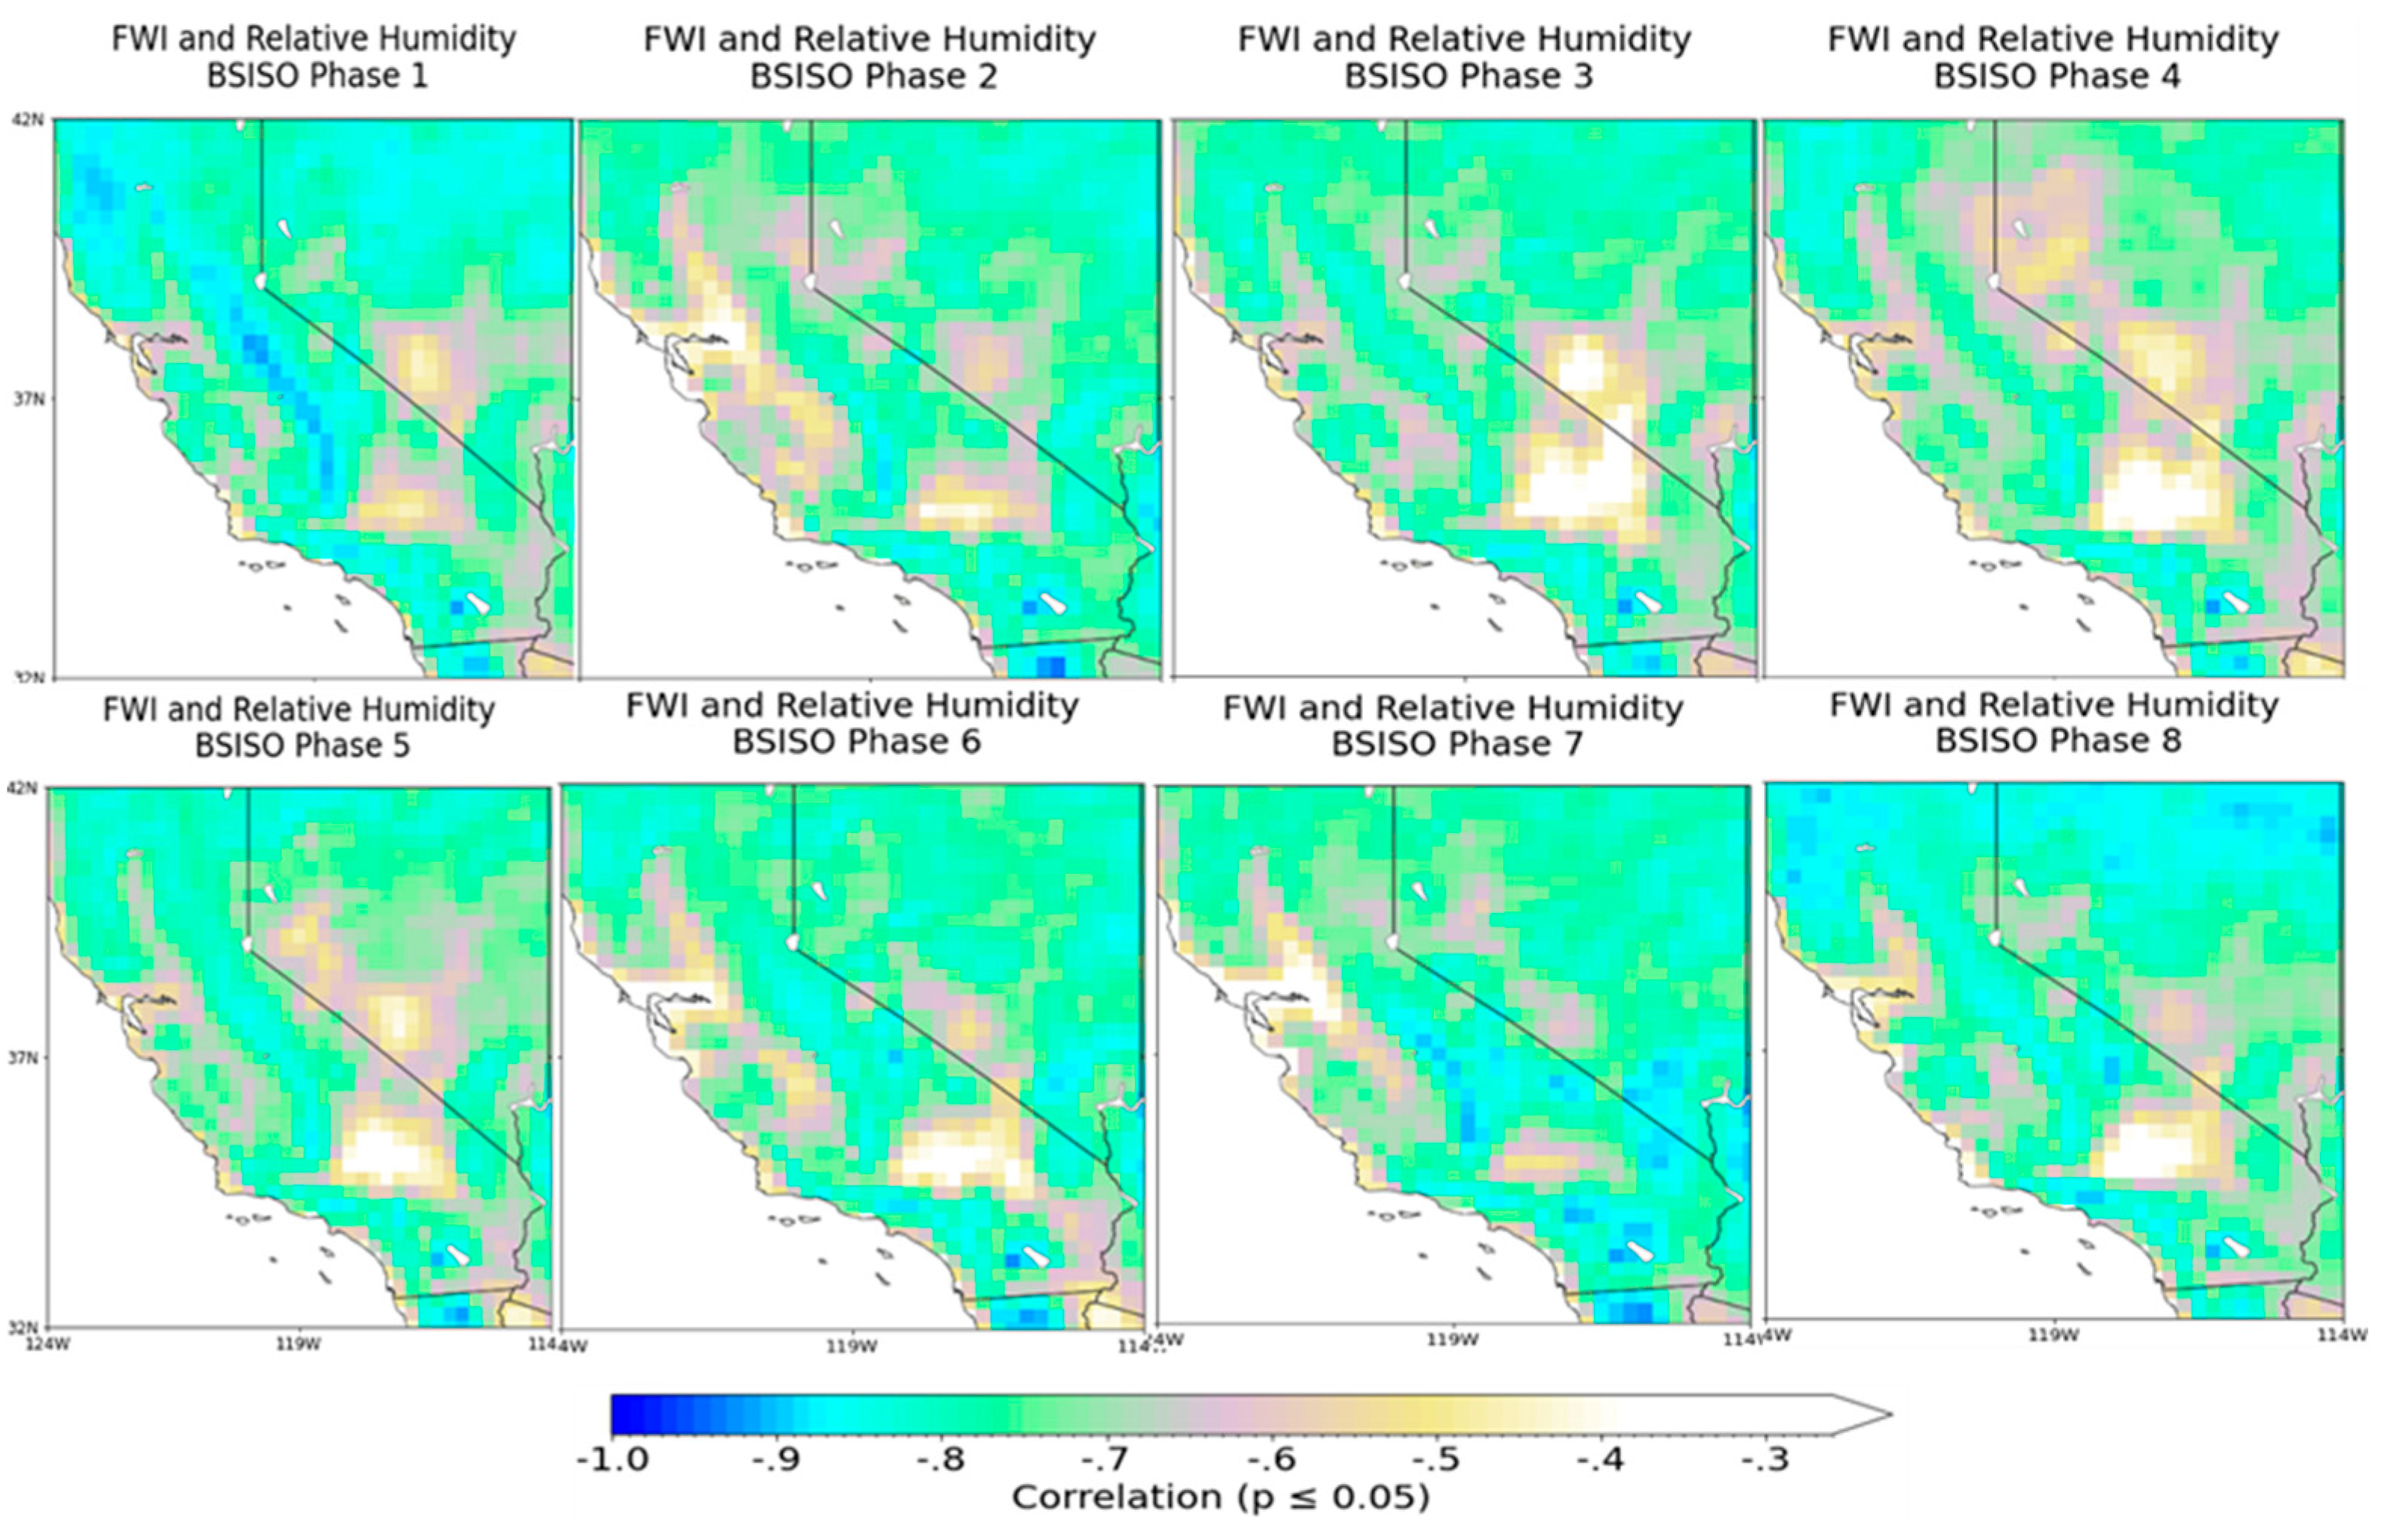
Figure 13, we observe the correlation between FWI and RH during the phases of the BSISO. The correlation patterns vary significantly across the different BSISO phases and regions of California.
During phases 1 and 8, a very strong negative correlation between FWI and RH is evident in the northern and central regions of California, particularly in the Klamath Mountains, southern Cascade Range, and Sierra Nevada. This strong negative correlation indicates that a decrease in relative humidity is strongly associated with an increase in wildfire potential in these mountainous areas during these phases. The Coastal Ranges and the Central Valley also show a linear relationship between the variables, although not as strong as in the previously mentioned areas.
The Sierra Nevada Mountains, a crucial region for California's water resources and biodiversity, consistently show strong to very strong negative correlations throughout all BSISO phases. This persistent strong correlation suggests that the Sierra Nevada is particularly sensitive to changes in relative humidity, with lower humidity levels consistently leading to higher wildfire potential. The strong relationship between FWI and RH in the Sierra Nevada highlights the importance of monitoring and managing this region during the fire season, as it may be more prone to wildfire outbreaks under favorable conditions.
In contrast, a weaker linear relationship is observed along the Sacramento Valley and parts of the San Joaquin Valley during phases 2, 3, and 7. This suggests that the influence of relative humidity on wildfire potential is less pronounced in these regions during these specific BSISO phases.
The Klamath and Cascade Mountains also exhibit strong to very strong negative correlations throughout the BSISO phases, indicating that these regions are similarly sensitive to changes in relative humidity and have a higher wildfire potential when humidity levels decrease.
In summary, the correlation analysis reveals that the Sierra Nevada, Klamath, and Cascade Mountains are the most sensitive to changes in relative humidity, consistently showing strong to very strong negative correlations with the FWI across all BSISO phases. This finding emphasizes the need for heightened wildfire monitoring and management efforts in these regions, particularly during periods of low relative humidity. The spatial and temporal variability of the relationship between FWI and RH across California also underscores the importance of considering regional differences and BSISO phases when assessing and mitigating wildfire risks.
4. Conclusion and Final Remarks
This study investigates the impacts of climate patterns, such as ENSO, PDO, and BSISO, on wildfire risk and behavior in the wildfire-prone region of California.
The La-Niña phase of ENSO and the cool phase of PDO are found to be associated with reduced atmospheric moisture and higher air temperatures, intensifying drought conditions. On the other hand, the El Niño phase and warm PDO are linked to increased atmospheric moisture, which can mitigate immediate wildfire risks but may contribute to long-term wildfire potential through the vegetation growth and subsequent drying. Additionally, during the BSISO's progression, significant variability in atmospheric moisture is observed across its phases, profoundly impacting California's moisture content. From phase 2 to 3, a notable decrease in humidity is seen, particularly affecting Northern California, the Central Coastal Ranges, and Death Valley. This dryness intensifies during phase 4, where nearly all of California experiences significantly drier than usual conditions, showing the most extensive dry anomalies. Such widespread aridity due to BSISO-related atmospheric changes notably heightens the state's wildfire risk. In more detail, region R1 (Northern California) experiences severe dryness during phases 3, 4, and 7, with dry anomalies ranging significantly above average, suggesting profound changes moisture transport. In Region R2 (Central California), phase 4 brings severe dryness, markedly exceeding typical conditions, while phases 3, 5, and 7 show moderate to light dryness. Similarly, Region R3 (Southern California) sees its driest conditions during phases 1, 4, and 8, with the most extreme dryness occurring in phase 4.
The interaction between PDO and BSISO phases has a complex and region-specific effect on fire weather conditions. PDO enhances or suppresses the fire weather conditions of BSISO phases, thereby influencing FWI patterns. During the cool PDO, BSISO phases 1, 7, and 8 are characterized by a marked reduction in wildfire risk across various regions of California. This trend is particularly pronounced in regions R1 (Northern California) and R2 (Central California) for phases 1 and 8, and in region R3 (Southern California) for phase 7, highlighting the cool PDO’s significant role in dampening conditions conducive to wildfires. The influence of the cool PDO also extends to BSISO phase 2, covering the Sierra Nevada and Southern mountains, where it moderates FWI anomalies from positive towards neutral or negative. This modification indicates a reduced wildfire risk, contrasting sharply with scenarios where the BSISO functions independently, showing positive FWI anomalies in regions R1 and R2. The differences between the cool PDO and BSISO phases operating alone are particularly noticeable in phases 1, 4, and 8. In phases 1 and 8, the cool PDO enhances the negative FWI anomalies, indicating a stronger suppression of wildfire risks compared to when these phases occur without the influence of the PDO. However, phase 4 presents a distinct scenario under the cool PDO, rather than a decrease, there is a significant increase in wildfire risk in region R1 as indicated by marked higher FWI anomalies. This represents a clear deviation from the suppression of wildfire risks typically observed in other phases under the cool PDO. During the warm PDO period, BSISO phases 1, 2, 3, and 8 intensify the potential for wildfires in the northern region of California (R1), with phase 6 increasing the risk in the Klamath Mountains. Furthermore, wildfire risk is diminished across all regions of California during BSISO phase 4, with this reduction persisting into phases 5, 6, and 7 in areas already exhibiting negative FWI anomalies.
The study shows that the Fire Weather Index (FWI), relative humidity (RH), vapor pressure deficit (VPD), and temperature are closely intertwined and serve as crucial indicators of wildfire risk in California. Lower RH and higher VPD values are strongly correlated with increased FWI, signifying higher wildfire potential. Temperature also plays a vital role, particularly in mountainous regions like the Sierra Nevada, Klamath, and Cascade Mountains, where variations can substantially influence fuel moisture content and, consequently, wildfire potential. These mountainous areas have unique microclimates where temperature variations can significantly impact vegetation dryness, and the relationship between FWI and temperature becomes more prominent during the PDO phases. Furthermore, the Sierra Nevada, Klamath, and Cascade Mountains consistently exhibit a strong linear relationship between FWI and RH throughout all phases of the BSISO, indicating that these regions are highly sensitive to changes in RH, regardless of the BSISO phase.
The relationship between FWI and climatic factors like temperature and moisture content varies geographically within California. In elevated regions, such as the Sierra Nevada, Klamath, and Cascade Mountains, there is a strong positive correlation between FWI and temperature (r > 0.7, p ≤ 0.05). The study also emphasizes the complex interaction between California's diverse topography and wildfire behavior, especially the significant role of strong downslope winds, such as the Santa Ana winds, in exacerbating wildfire conditions. Elevated areas, like the Sierra Nevada Mountains, are particularly susceptible to temperature variations which can lead to heightened wildfire risks when combined with large-scale climatic influences. Along the Sierra Nevada Mountains, there is a strong negative correlation between FWI and relative humidity (r ≤ -0.7, p ≤ 0.05). This indicates that these regions are highly sensitive to changes in relative humidity, with lower humidity levels consistently leading to higher wildfire potential. In the Sacramento Valley and parts of the San Joaquin Valley, the influence of relative humidity on wildfire potential is less pronounced during specific BSISO phases, suggesting that the relationship between FWI and relative humidity varies depending on the region and the prevailing BSISO phase. In the desert regions of Southern California (R3), there is a weak or non-significant correlation between FWI and VPD, primarily due to the area's lack of vegetation, which makes it less susceptible to wildfire risk despite potential temperature increases. These geographical variations in the relationship between FWI and climatic factors, along with the influence of topography and local wind patterns, emphasize the importance of region-specific wildfire risk assessments and management strategies that take into account local climatic and topographic conditions. Understanding these regional differences is crucial for developing effective wildfire prevention, preparedness, and response measures across California.
Our study provided information based on current climate, which will be valuable for long-term wildfire risk management and considerations of climate change adaptation strategies. We recommend that future research should also focus on incorporating additional variables, such as land use changes and human activities, to develop more comprehensive wildfire risk assessment tools.
In conclusion, this study provides a comprehensive analysis of the complex interactions between large-scale climate oscillations, drought conditions, temperature fluctuations, and wildfire dynamics in California. The findings highlight the importance of considering the interplay between these factors and the geographical variations in wildfire risk assessment across the state. By advancing our understanding of these relationships, this research contributes to the development of more effective wildfire management strategies and climate change adaptation efforts in California.
