Preprint
Article

Quantifying the Shading Effects of a Small Scale Rooftop Installed Linear Fresnel Reflector in Cyprus

Altmetrics

Downloads

70

Views

25

Comments

0

A peer-reviewed article of this preprint also exists.

Submitted:

31 May 2024

Posted:

03 June 2024

You are already at the latest version

Alerts
Abstract
The Linear Fresnel Reflectors are a solar concentration technology that is versatile and can serve many industrial processes or thermal conditioning. Such collectors entail a certain footprint, generating shading on the surface where they are installed. This effect is rarely quantified but may play an indirect role on the surface below. When installed on a roof, the solar radiation heats the building less. In places where the annual heating demand is higher than the cooling demand, this constitutes an asset. However, this becomes a disadvantage when the cooling demand is higher annually than the heating demand. Essentially, the reduced solar radiation allows the growth of plants that would not grow without the shade provided by the collector. The present paper is a quantitative analysis of such shading based on the Linear Fresnel Reflector of the Cyprus Institute. The work was conducted using the Tonatiuh++ ray-tracing software to determine the annual radiation blocking. A total of four years of actual meteorological measurements were applied directly to the ray-tracing model.
Keywords: 
Subject: Engineering  -   Energy and Fuel Technology

1. Introduction

Four main types of collectors constitute the solar concentration technologies: central receiver systems (CRS), parabolic trough collectors (PTC), linear Fresnel reflectors (LFR), and parabolic dish-Stirling [1,2]. The solar concentration technologies (CST) use mirrors to concentrate the light on receivers. The LFRs reflect the solar light onto a linear receiver or absorber tubes [3,4], in which a heat transfer fluid or steam flows. One of their assets resides in the fact that they can be compact and integrated into limited areas such as roofs [5,6], whether they are residential at the district level [7,8], commercial, or industrial at the building level or for industrial process-heat [9,10]. CST manufacturers can determine the optical efficiency of their collectors at the design phase with the use of specialised software called ray-tracers based on Monte-Carlo principles [11]. They help to support designers in extracting the best optical efficiency of the collectors. Jakica reviewed in depth the state of the art of modelling tools for solar collector designs including PV technologies. Such tools usually throw rays from a solar plane onto a set of optics and track the rays up to the receiver, by reflection. This allows the calculation of the optical efficiency, based on pure geometry, before considering the thermal losses. Regarding the LFRs, it is possible, among others, to discriminate the different contributors: cosine losses, blocking, shading, tracking errors, etc., as described in [13] . Extensive work has been documented in the academic literature about the optical efficiency of LFRs for decades, with the objective of increasing performance by harvesting the highest number of rays coming from the solar plane up to the absorber [14,15,16,17,18]. The current publication also concerns the U-LEAF LFR in Cyprus, which has also been the scope of ray-tracing studies in Tonatiuh [19] and Tonatiuh++ [20]. Thus, the common denominator of these studies is to increase the efficiency of the linear collector. However, little attention is paid to the side effects of the collectors on the place where they are installed. The structure of a collector itself is a radiation blocker that has an indirect effect on the ground or the roof where it is installed. When on top of a roof, for instance, less heat will be conducted, which is relevant in hot countries. However, this offsets the direct radiation that would heat a building in winter. Therefore, it is paramount to check the balance between the radiation blocked in summer and the one lost in winter. Usually, these aspects are not taken into account in ray-tracing studies, while they have a clear impact on the consumer or beneficiary underneath, like building occupants. As highlighted in [21], building shading in hot countries is important in order to reduce the cooling needs of spaces. The work in the latter reference summarises all the different methods to increase shading to avoid heating by radiation. Shading tools can also be active and produce energy, such as PV [22]. Building integrated photovoltaics (BIPV) is actually the most common strategy, as they can be easily integrated onto roofs and facades [23]. Bot et al. listed the different strategies for artificial shading with solar collectors. While BIPV solutions prevail, building integrated solar thermal (BIST) systems are listed but they do not involve concentration. Concentration is mentioned but for PV (also called concentrated PV). The combination of thermal and PV energies for building shading purposes has not been investigated. Thus, the present paper deals with the shading quantification of an existing LFR. This is a novelty for purely thermal solar concentration collectors in a ray-tracing environment. The present paper aims to identify the losses of direct radiation of the plant in Nicosia at different heights: the current one at 0.63 m, 1.5 m, 2 m, 2.5 m, 3 m, 3.5 m, and 4 m. According to the height, different kinds of use can be envisaged: at low heights, it can be used on a roof, at higher heights it can be used as a solar parking or for agricultural purposes. The work is led in a ray-tracing environment with Tonatiuh++ [25]. The next section deals with the definition of the ray-tracing model. The Results section quantifies the amount of energy that is blocked at different heights based on local meteorological data. It is followed by the Discussion section and the Conclusions.
Figure 1. Areal view of the Urban LinEAr Fresnel reflector (U-LEAF) in tracking mode in Aglantzia, Cyprus [26].
Preprints 108068 g001

2. Materials and Methods

2.1. Ray-tracing modelling

2.1.1. Ground mesh

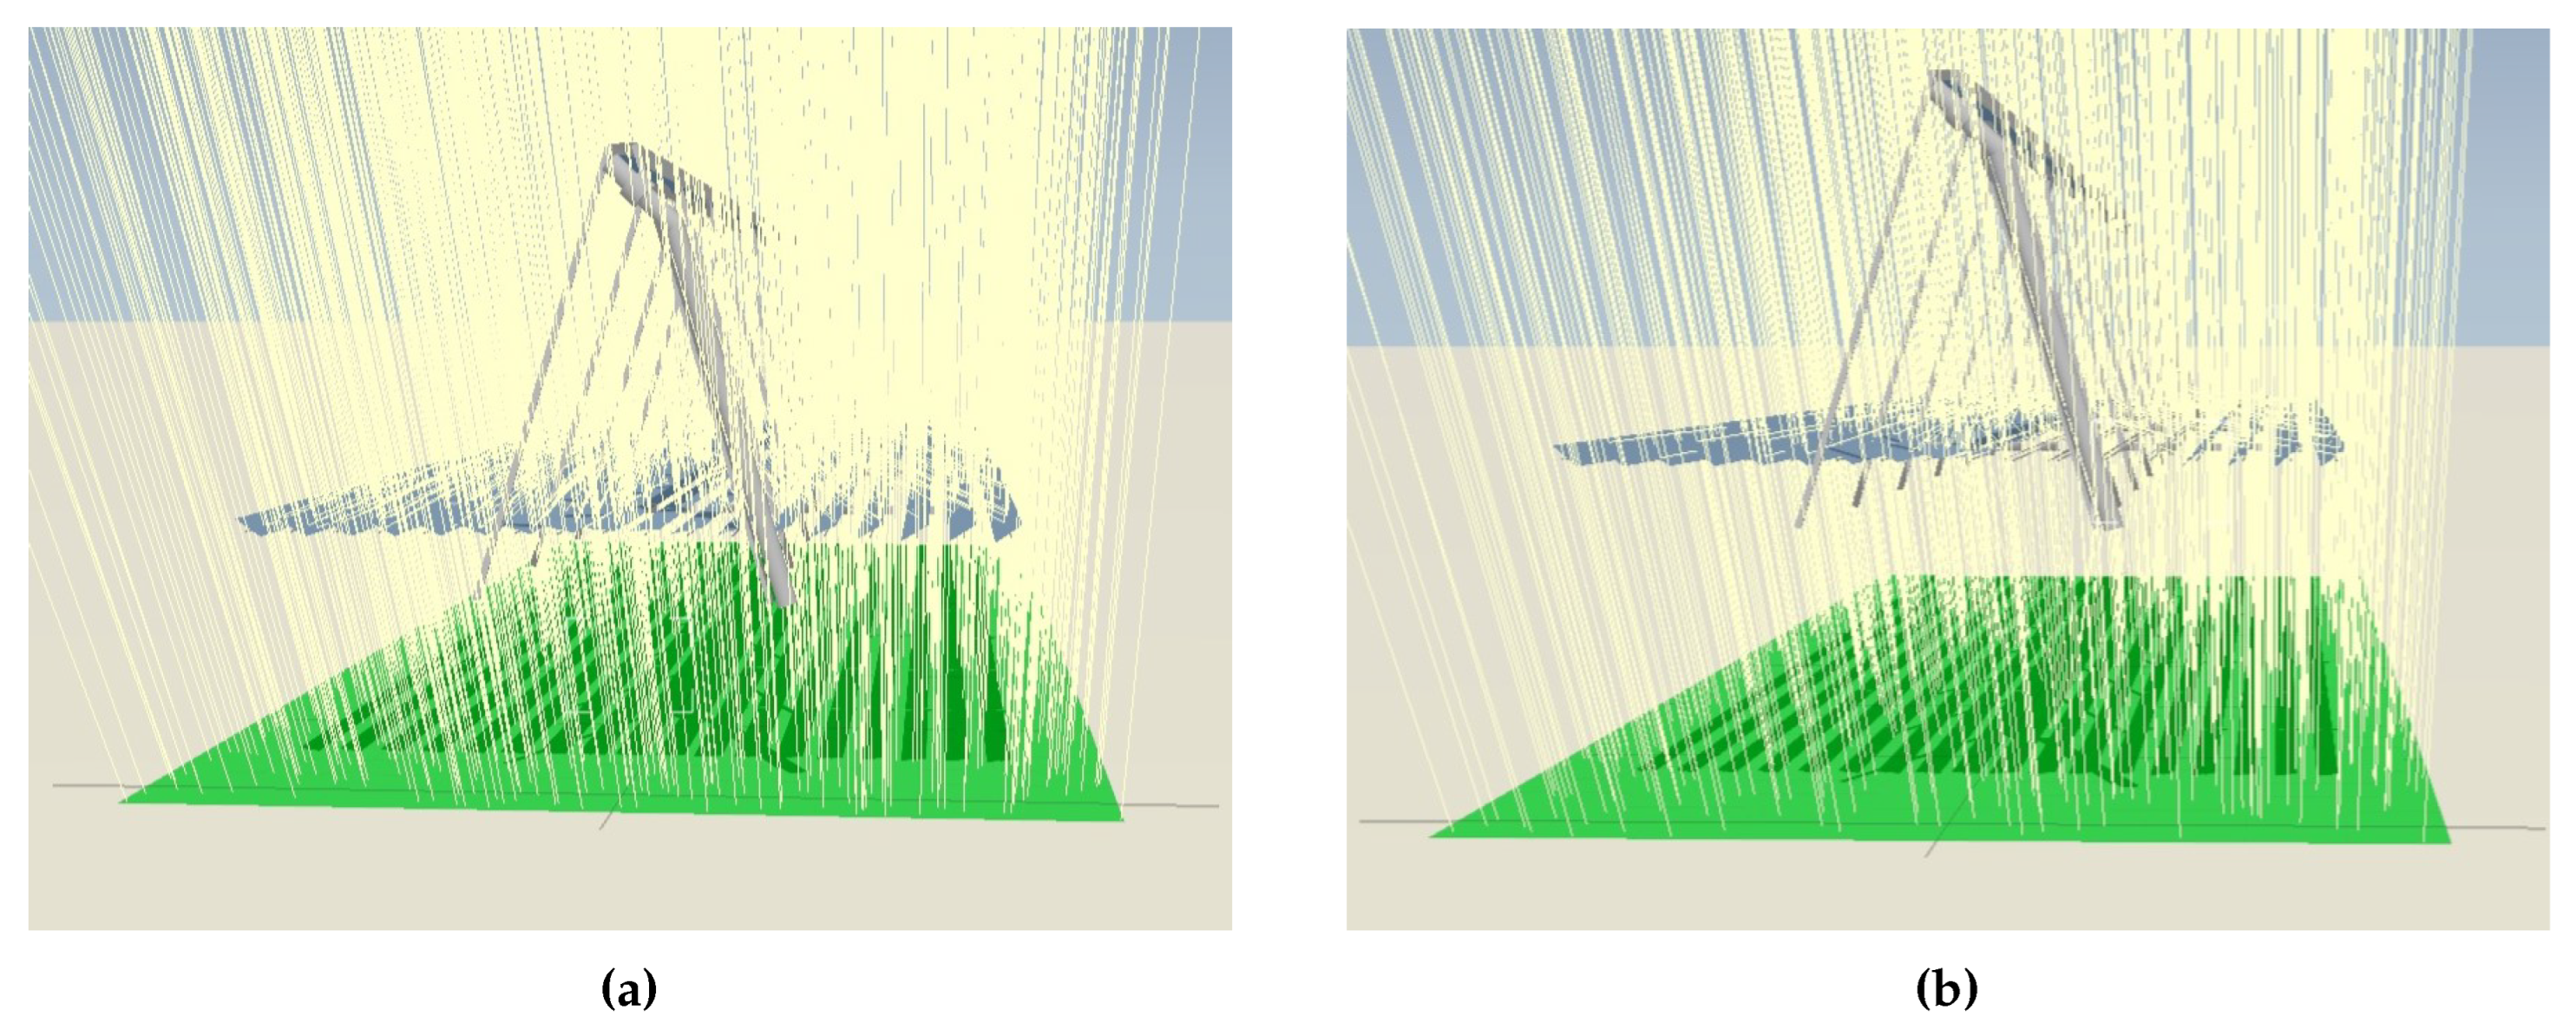
The Linear Fresnel collector (U-LEAF) of the Cyprus Institute is made of 288 tracking mirrors, covering a net area of 184 m   2 and a 32 m long receiver (see Figure 1). Two extensive ray-tracing studies to assess its performance have already been done, first in Tonatiuh [27] and second in Tonatiuh++ [20]. These two latter works were thus targeting the direct use for heat production: photons issued from the sun which impinge on the absorber after reflection(s). In the present study, the focus is on the energy performance of the collector in indirect use. LFRs are not intended for their capacity as shading systems. Nonetheless, the shading shield that they represent has an effect on the energy to be absorbed beneath, which is relevant for a roof, for instance. This may lead to attenuation of heating by solar radiation in the summer, but also the loss of the heating benefit in the winter by solar rays. Tonatiuh++ software has been used as a continuation of [20]. The collector has been modelled with a meshed ground in unit squares of 1 m   2 underneath. In Figure 2, a unit square is represented in red. The whole ground is distributed in a mesh of 34 by 10 squares for a global meshing of 34 m by 10 m (approximately the area of the roof underneath hosting the collector). The ray-tracing methodology will consist of quantifying the number of rays, leading to calculation of the solar flux reaching the ground for seven different heights above the ground: (i) the actual height of 0.63 m, (ii) the height of 1.5 m, (iii) the height of 2.0 m, (iv) the height of 2.5 m, (v) the height of 3 m, (vi) the height of 3.5 m, and (vii) the height of 4 m above the ground. The shift to higher positions is intended for the use of the LFR on a parking space, greenhouse cover, or for other agricultural uses such as agrivoltaics in the case of PV in association with crops [28]. The 2 m and 3 m height configurations with rays are displayed in Figure 3, with the meshed ground in green. The work presented in the next section focuses on the confidence level of the results from the ray tracing.

2.1.2. Convergence threshold

Before starting the analysis, the confidence level of the results is determined. To perform this the following steps have been pursued:
  • Creation the mesh as described previously by unit square of 1 m by 1 m;
  • Set the sun at an elevation of 90°;
  • Launch rays from the solar pane on each of the squares repeatedly with increasing number of rays.
The simulations have been performed with rays numbers increasing by 1000 rays per square metre to 15,000 with an incremental step of 1000 rays and this, 100 times, for the whole ground embedding 34 squares. For each of the squares, 100 flux values have been calculated and statistics analysis performed.
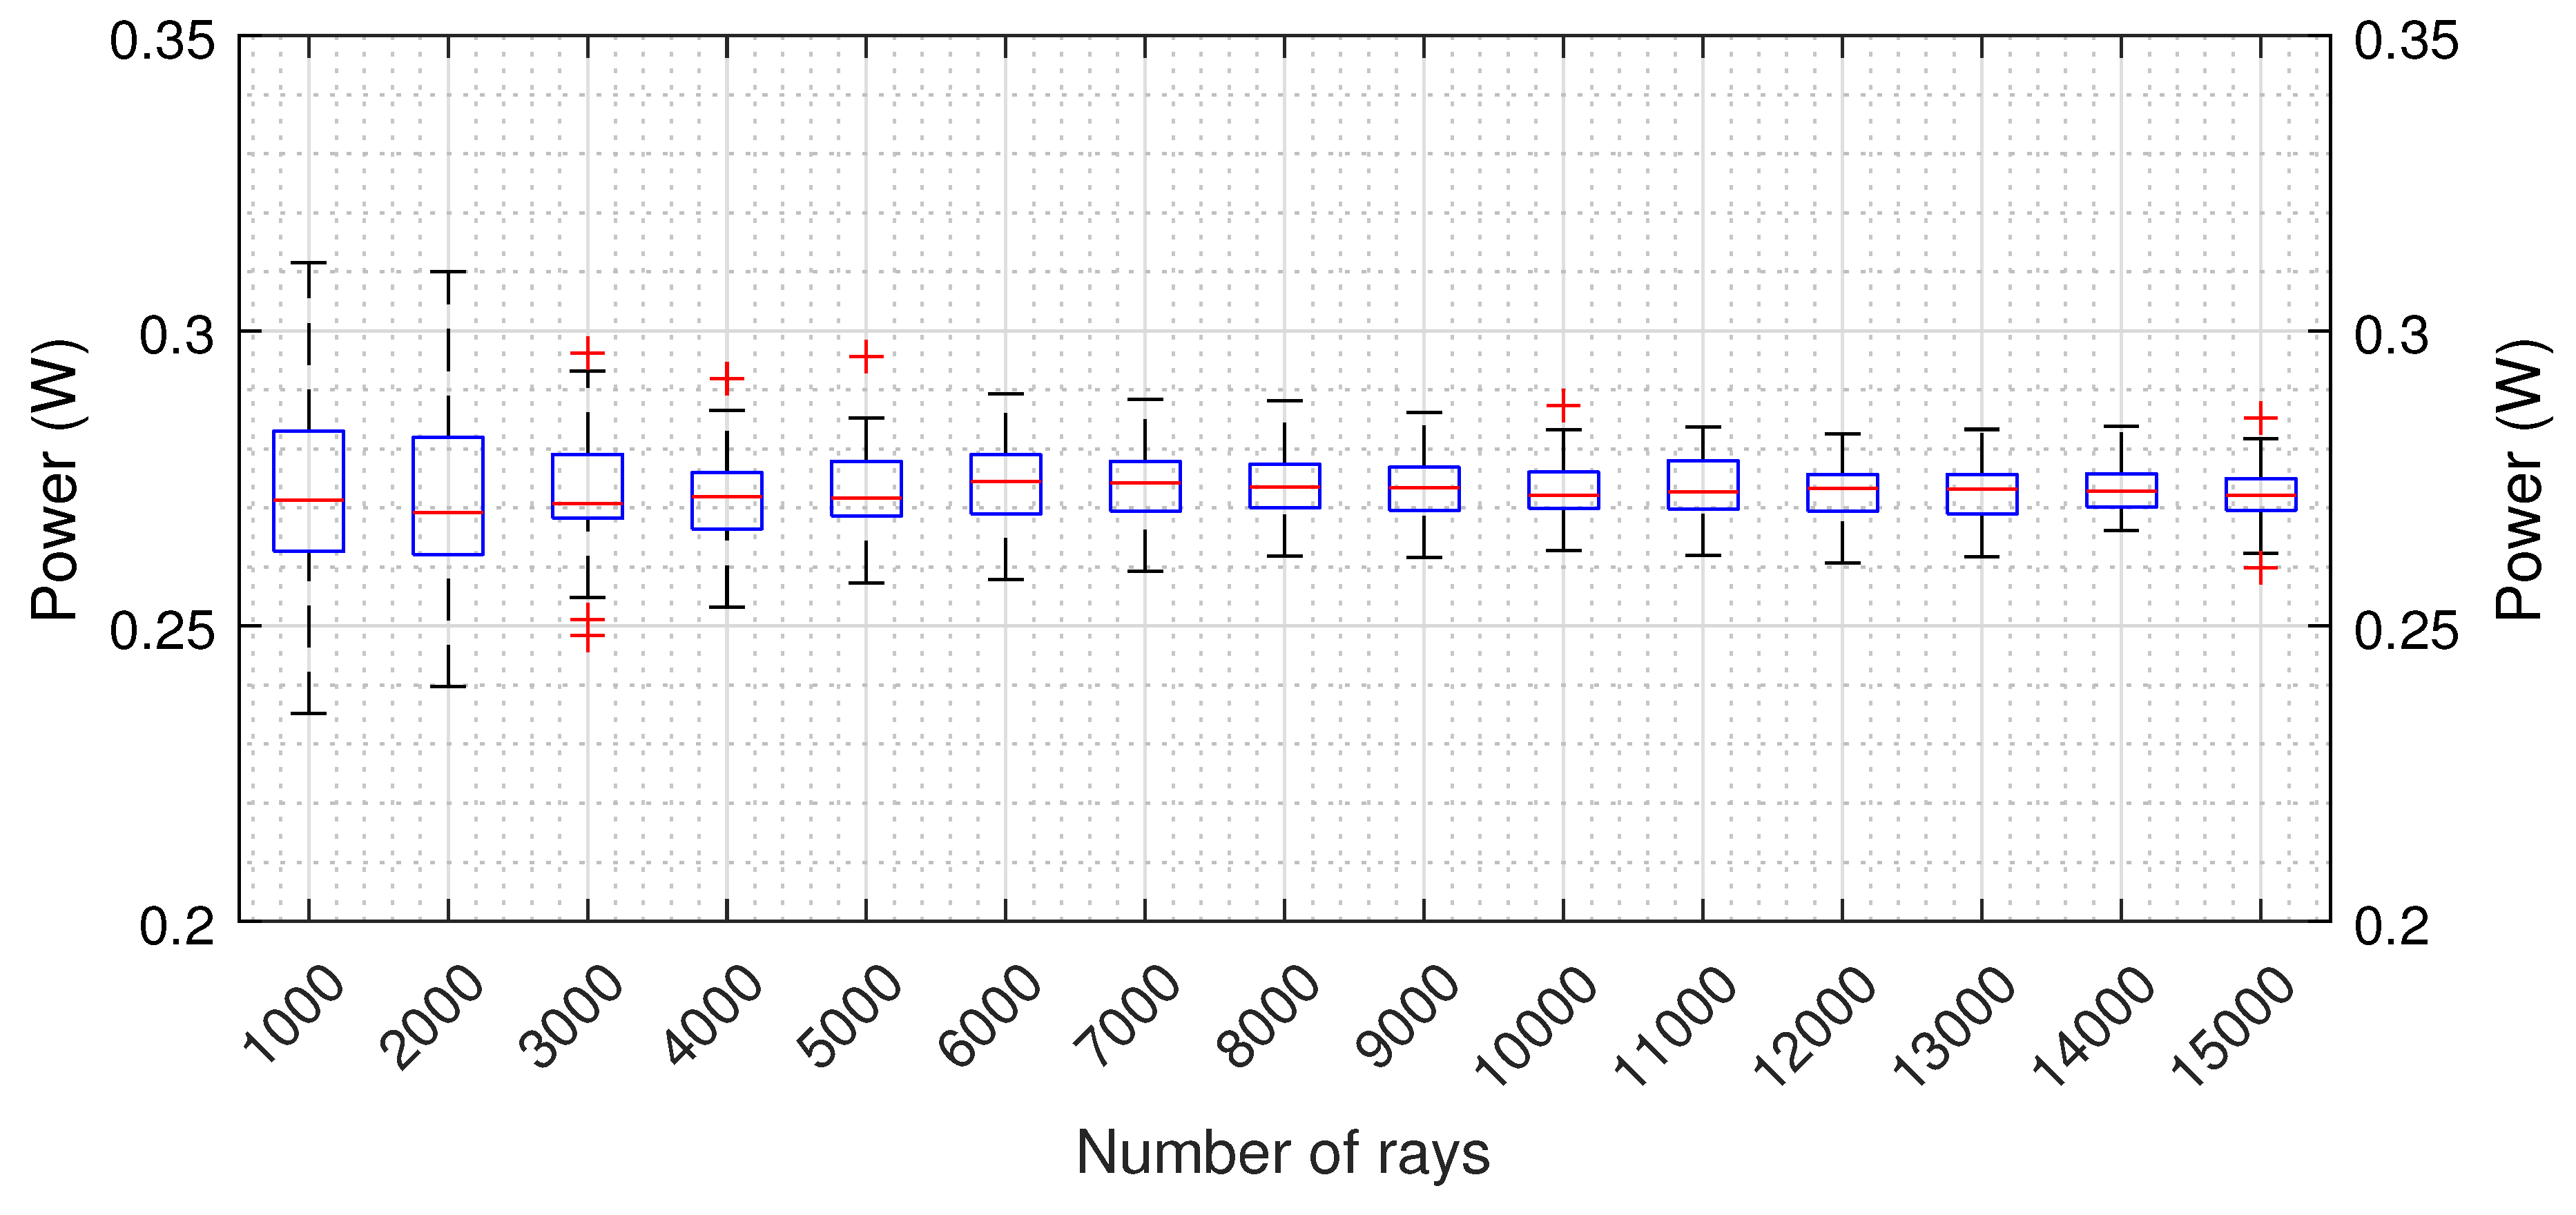
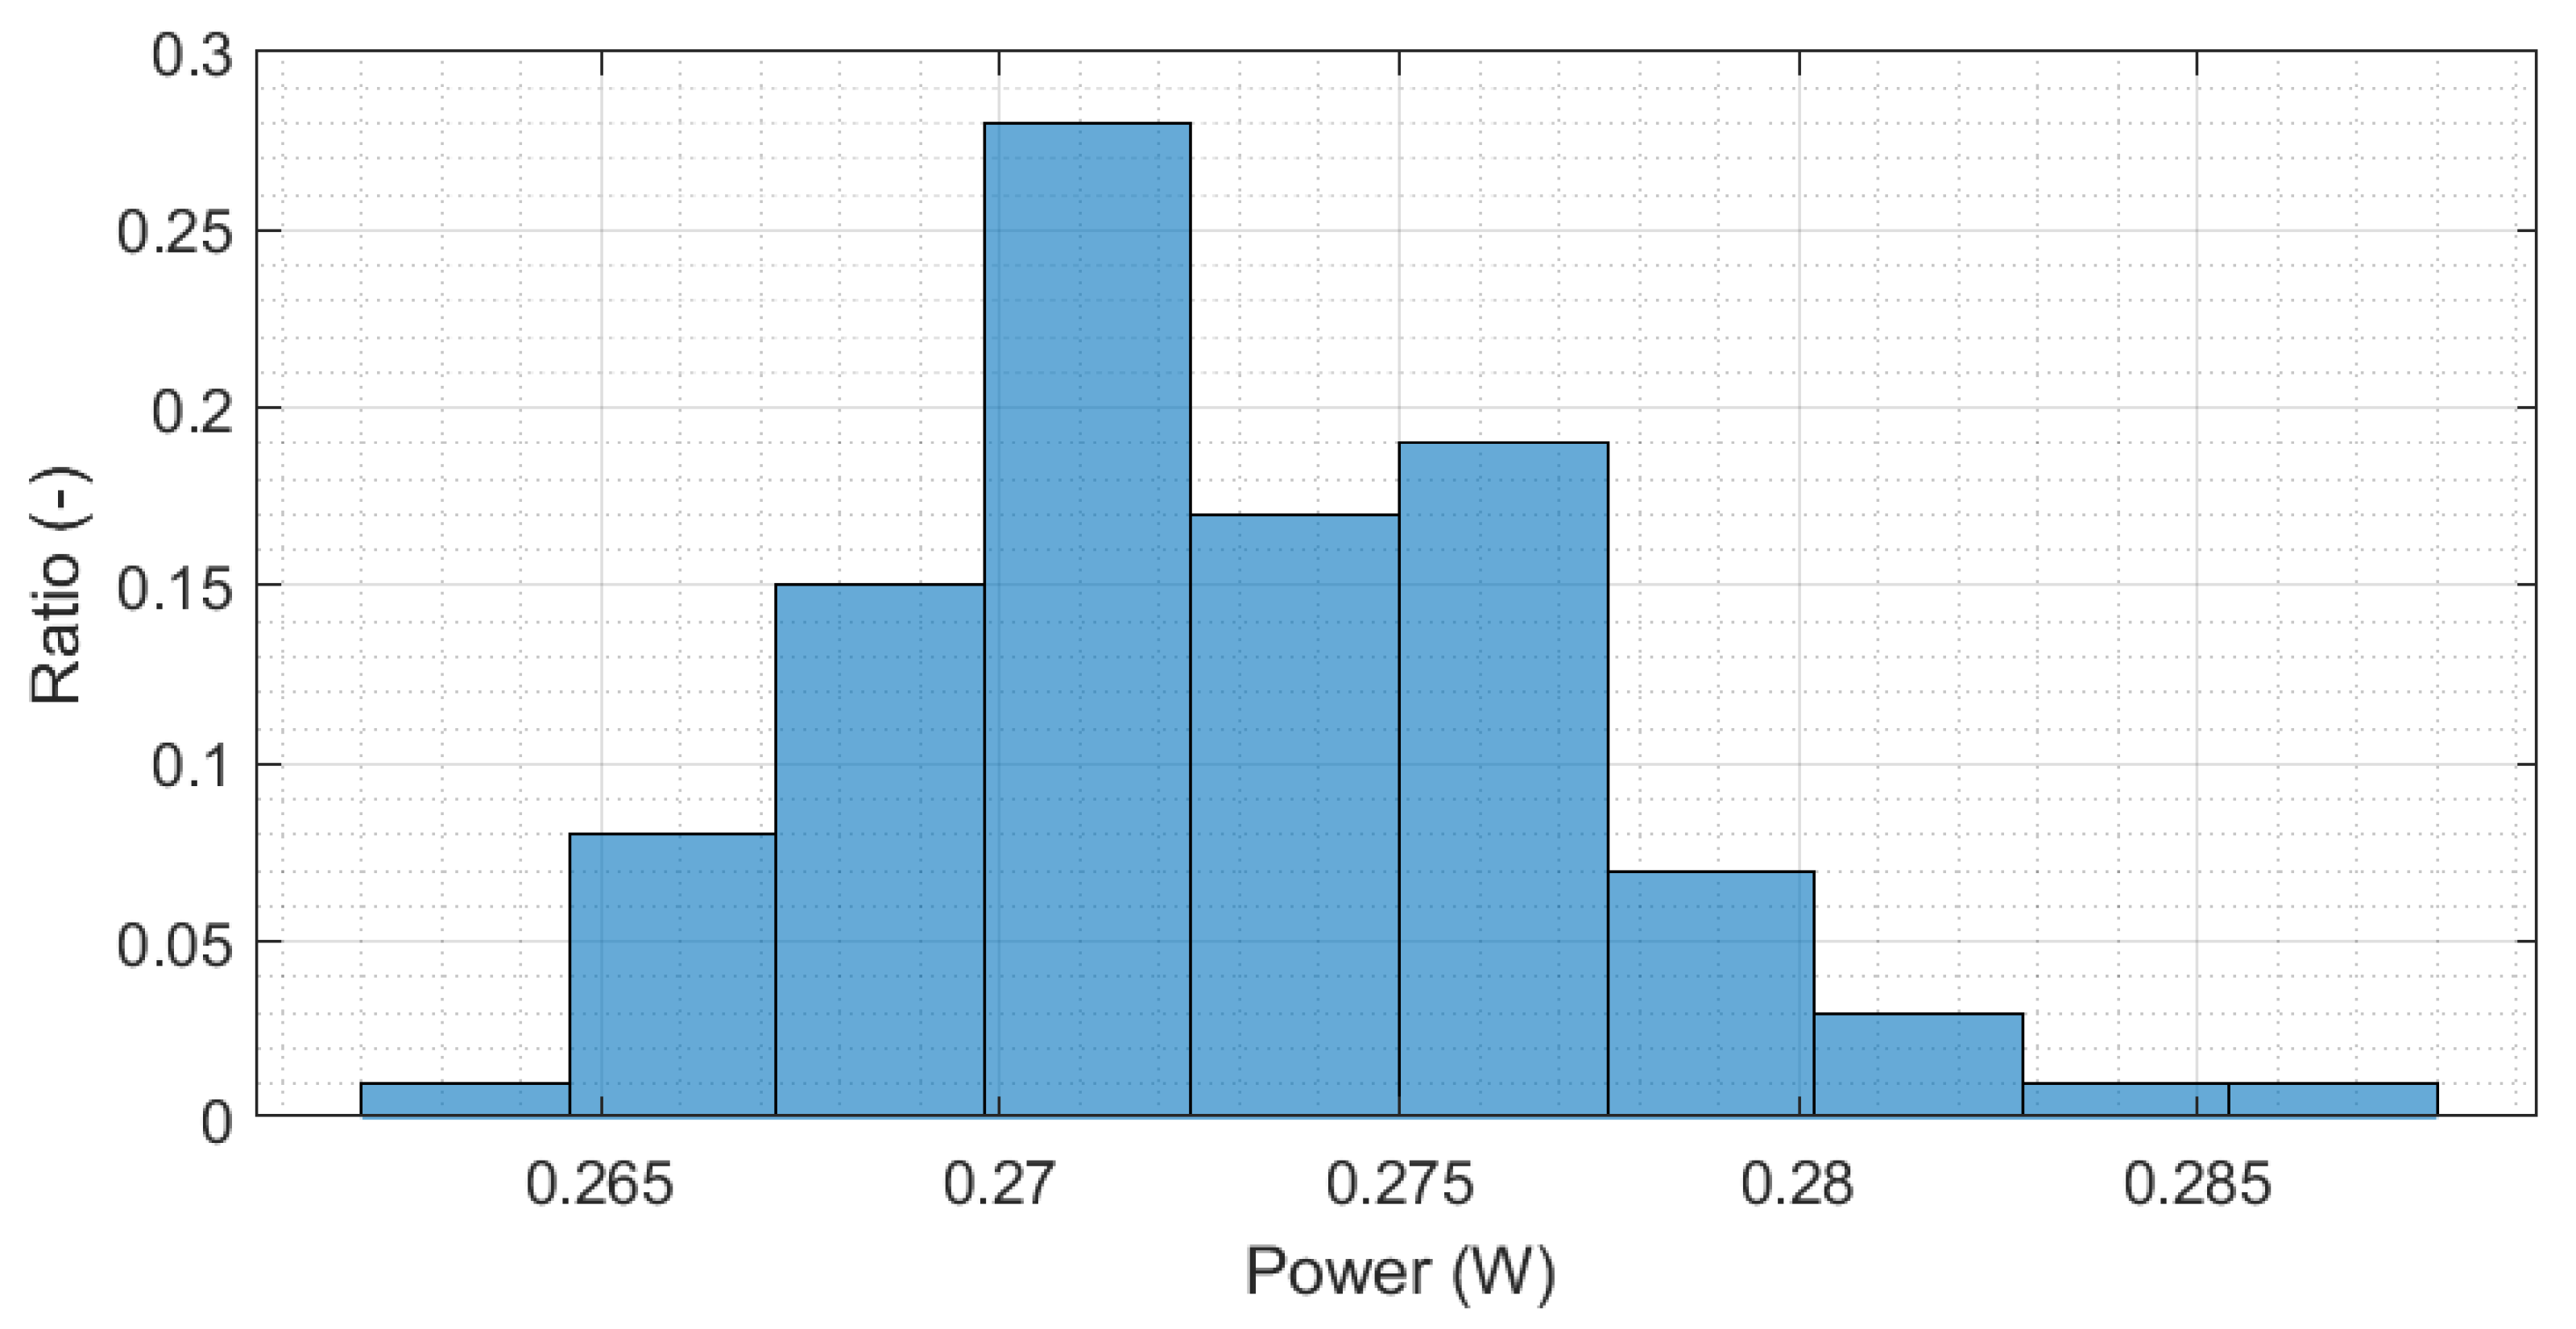
Figure 4 represents the distribution of the amount of energy reaching the ground of the square (5,10) for varying numbers of rays emitted by the sun between 1,000 and 15,000. Each number of rays has been repeated 100 times, representing 1,000 simulations to produce Figure 4. As can be observed, the median value, represented in red, does not vary significantly for the different numbers of rays; however, the spread narrows towards an increasing number of rays per square metre. The blue box represents the ±25% boundaries. Due to the numerous and lengthy simulations to be performed, it was considered that 10,000 rays per square metre would be used for the tolerance boundaries. For the specifically selected square (5,10), the median power reached is 0.2721 W. The specific square is located in the centre of the collector, slightly towards the north. The (5,10) square is quite representative of the squares underneath the collector, avoiding edge effects. The maximum and furthest value from the median was found to be 0.28737 W. Since an outlier value has been found, this means that 99% of the values fall within a distance to the median of 5.6%. More emphasis is given in the histogram in Figure 5, where the distribution spread is represented in 10 bars. As can be seen, 97% of the simulations fall within 4% of the distance to the median value. This gives a reasonable account of the precision of the simulations at 10,000 rays per square metre. The relative root mean square error (RRMSE) (in %) has been calculated at 10,000 rays for the 340 squares of the meshing following the equation:
RRMSE = 1 N i = 1 N y i y ^ i y i 2 × 100
where y i represents the power for simulation i 1 , 30 , y ^ i represents the median value, and N = 100 is the number of simulations.
The results are illustrated in Figure 6. The errors fluctuate between 0.8% and 2.2%. This also indicates that the selection of 10,000 rays is robust enough given such values after 100 simulations. This gives an understanding of the tolerance values of the results to be presented further in the present paper. The next part will now describe the sky vault meshing rationale.

2.1.3. Meshing of the sky vault

Once the number of rays to launch in a sky-scanning operation on all possible positions of the sun in the celestial vault is determined, the sky hemisphere itself needs to be meshed. The sky has been meshed in 31 elevation positions, from 0° to 90°, equally distributed with a step Δ of 3°. The number of azimuth positions has been distributed linearly as a decreasing function of the elevation: 360 azimuths for 0° of elevation and 4 positions for an elevation of 87°. The elevation of 90° has been treated with only one position, as when the solar elevation is at its peak, the solar position remains unchanged regardless of the azimuth elevation. The points for ray-tracing are P k , n , defined by their respective Elevation E l k , n and Azimuth A z k , n , as follows:
P k , n ( E l k , n , A z k , n ) , E l k , n = 90 n · Δ , A z k , n = 360 · ( k 1 ) 4 n n 1 , 30 , k 1 , 4 n E l 0 , 0 = 90 , A z 0 , 0 = 0
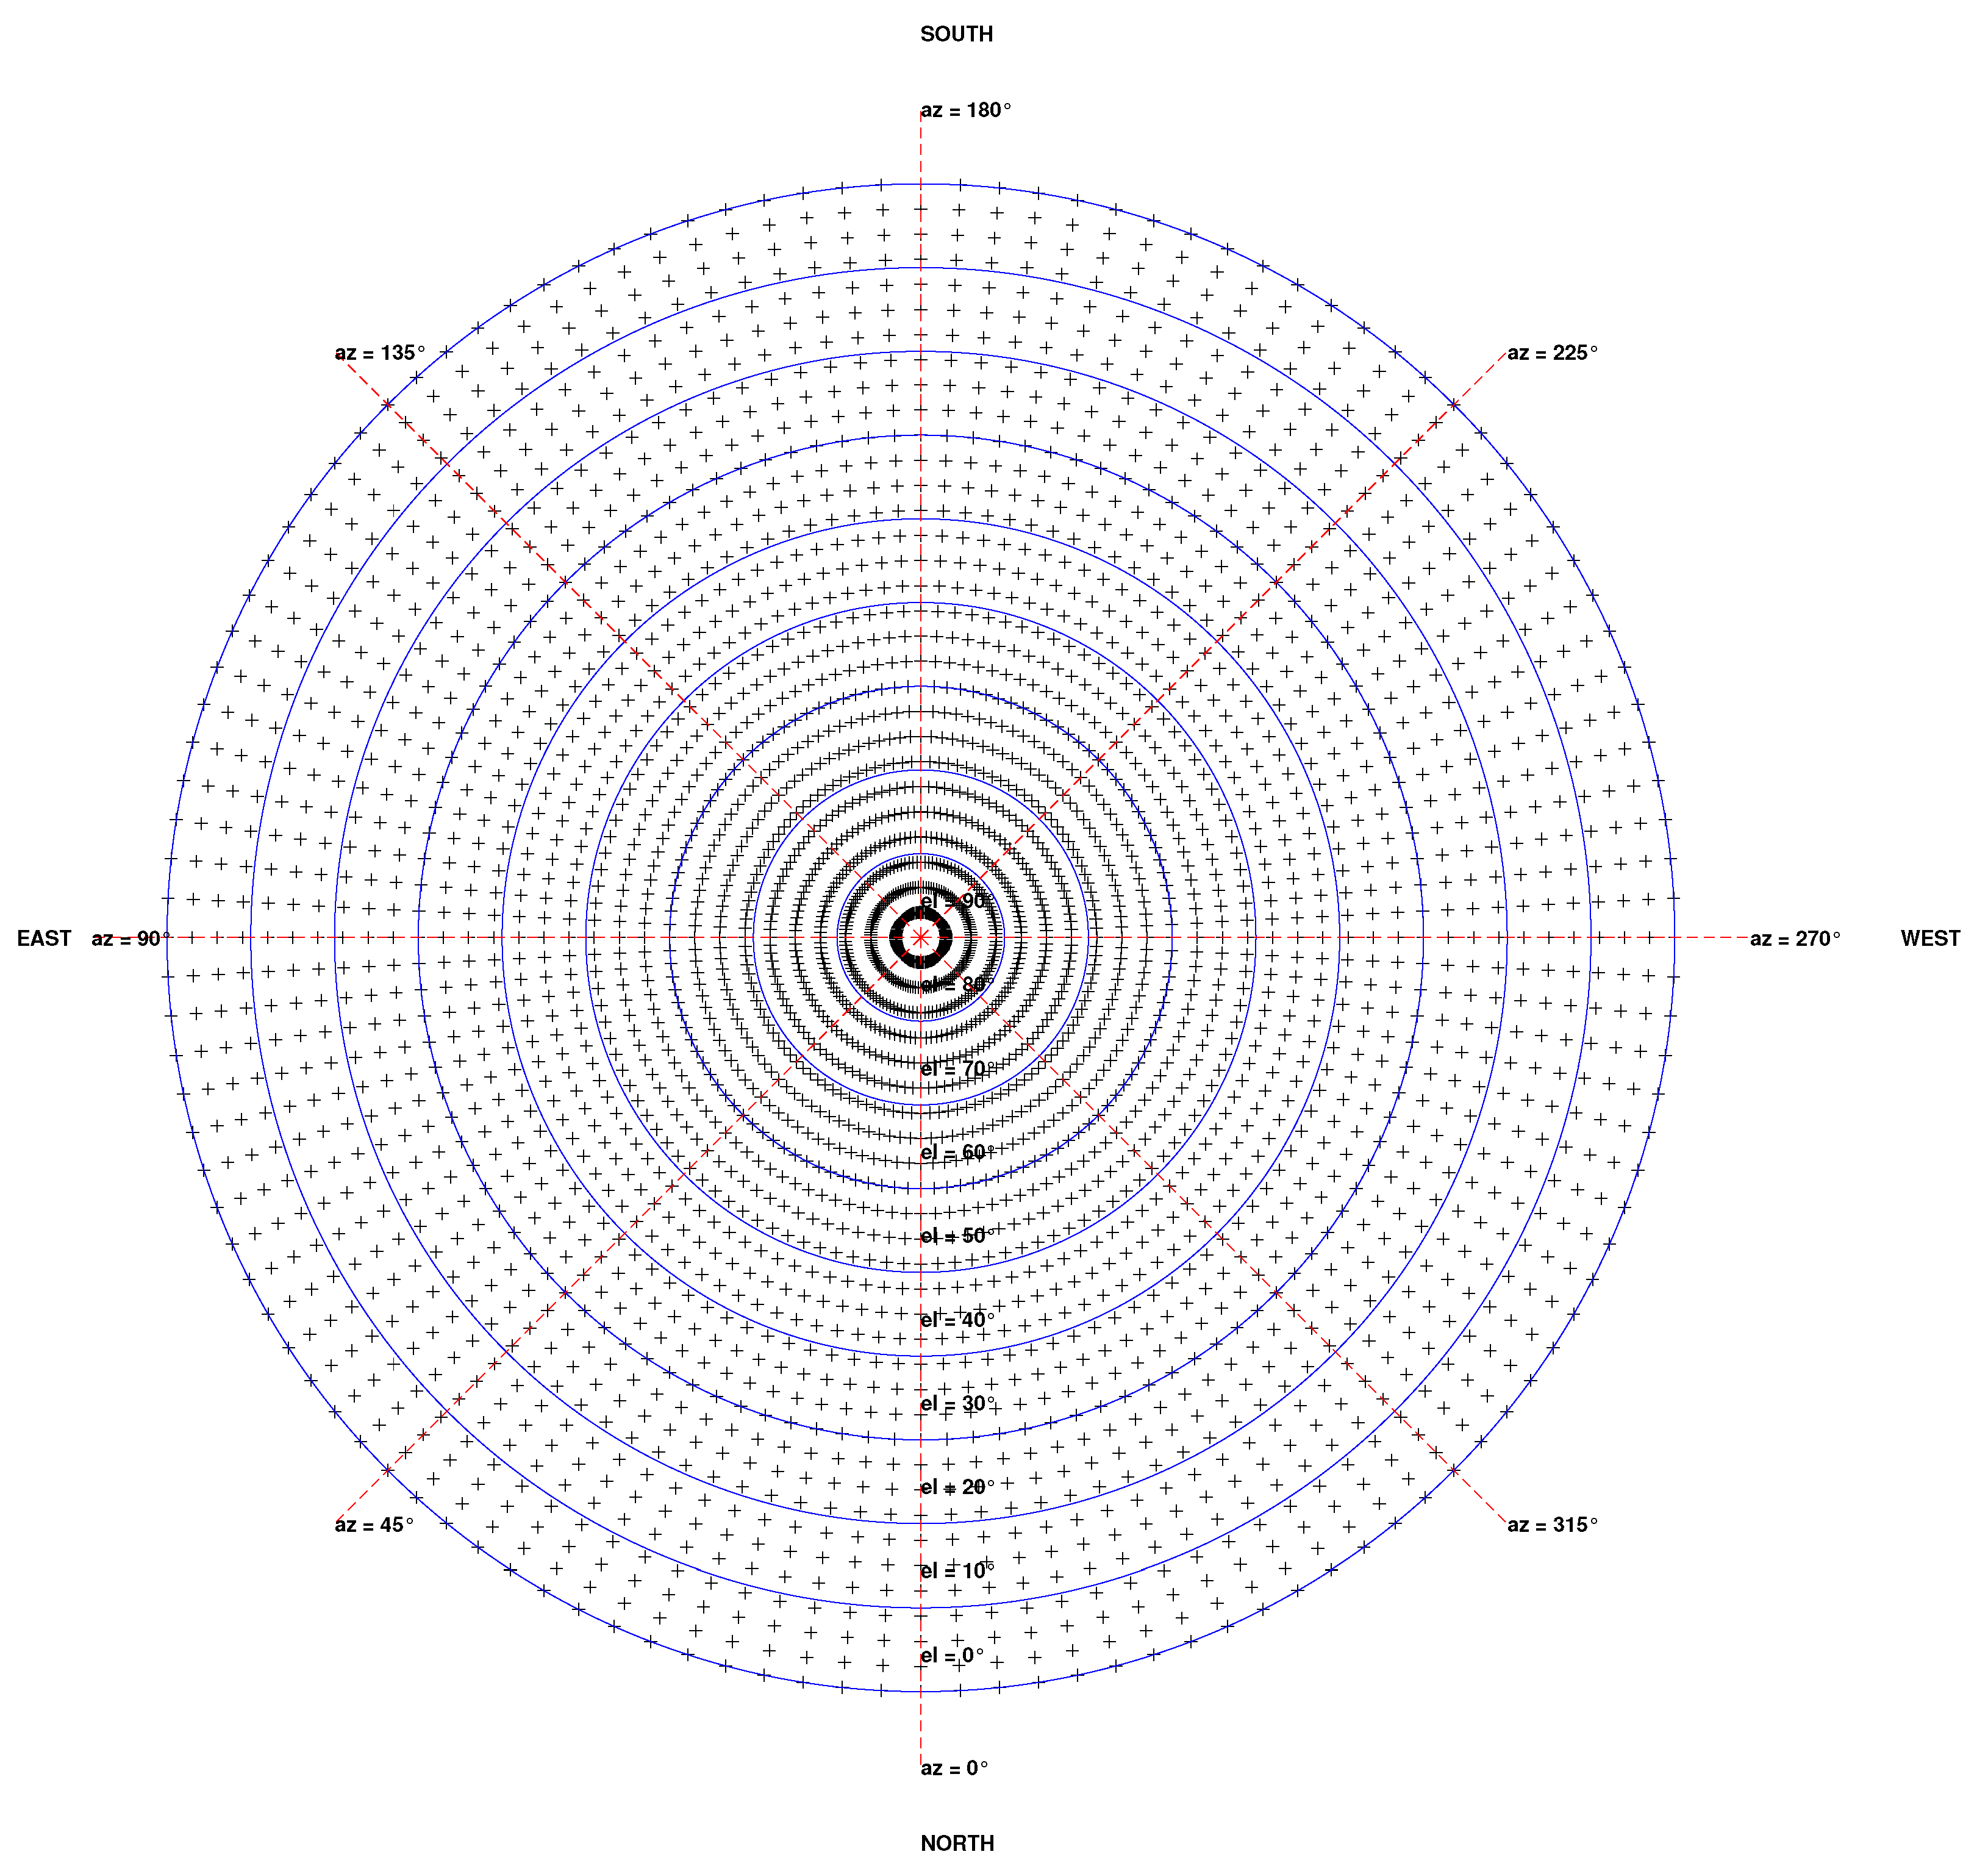
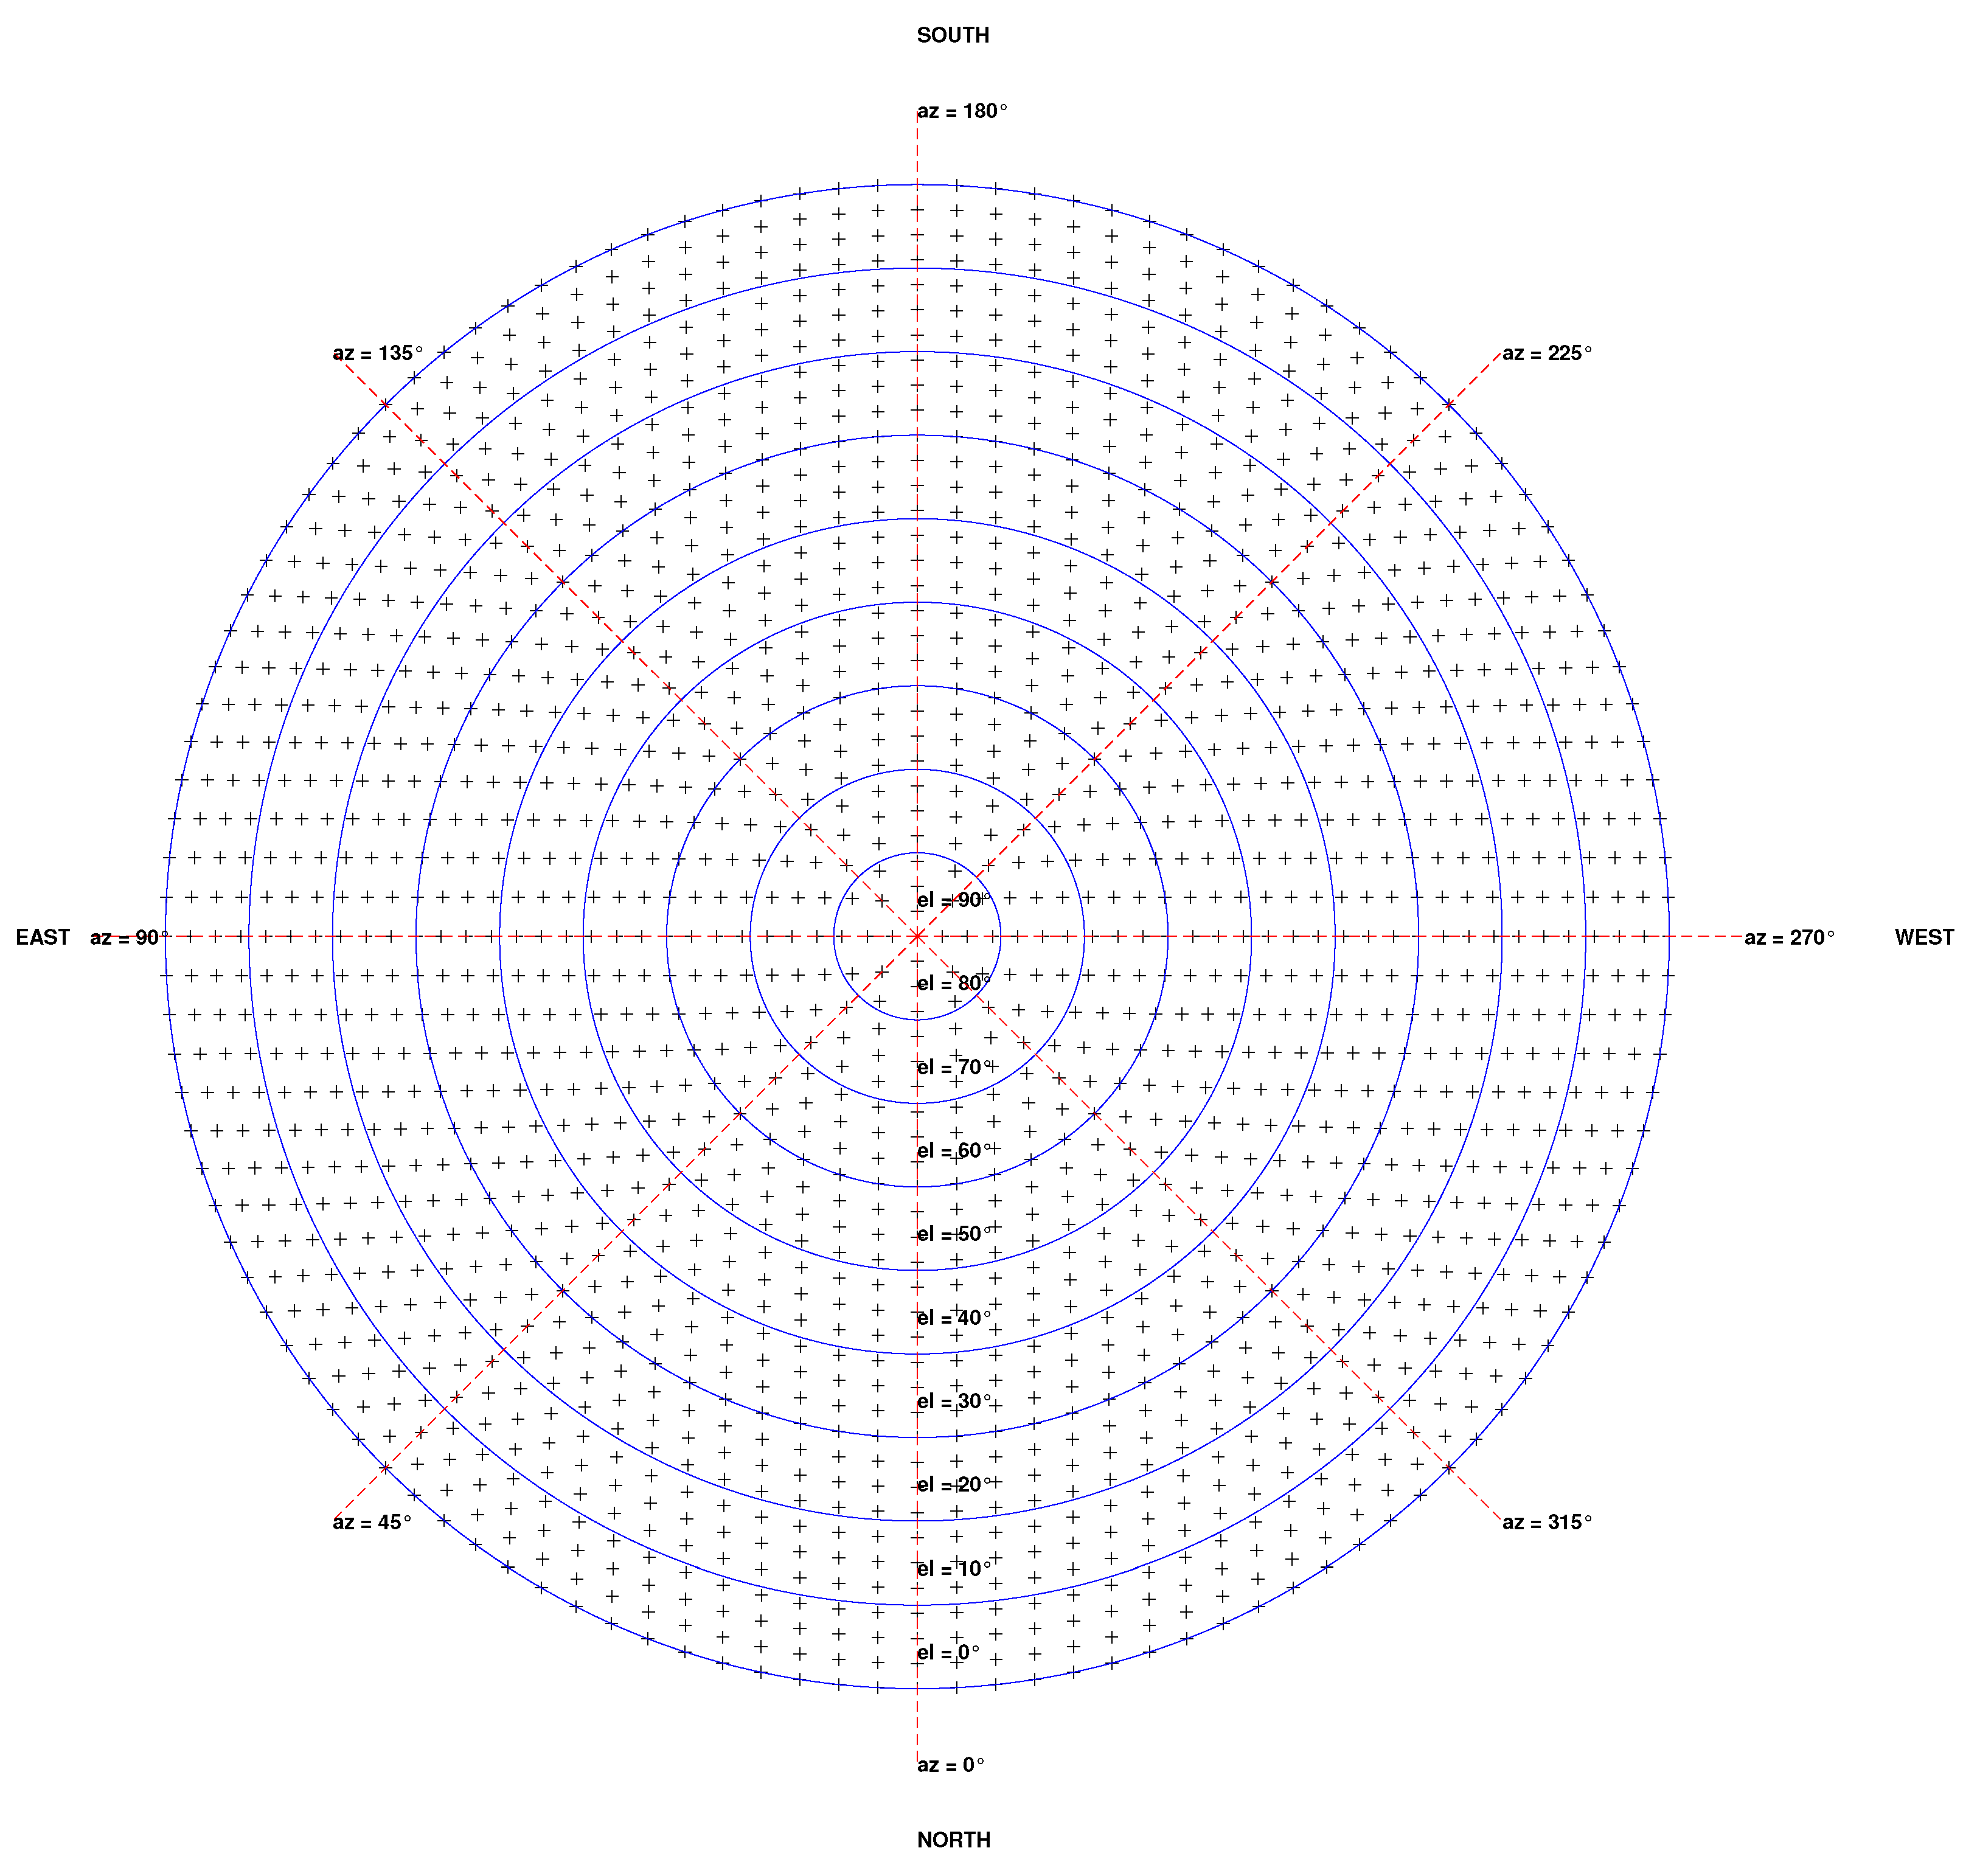
As seen in Figure 7, this is a more homogeneous distribution than one consisting of scanning the sky with a constant step in elevation and in azimuth, which leads to a higher concentration of points closer to the zenith (Appendix A). This is an improvement compared to [27].

3. Results

The present section details the yield for every square presented in Figure 2 of the solar energy harvested.

3.1. Shade at different heights

The sun path in the sky at the exact coordinates of the LFR has been computed, as well as the cosine factor of the impinging solar rays. Additionally, the DNI (direct normal irradiation) has been registered with a time-step of 1 s for 4 full calendar years between 2017 and 2020 [29]. This led to the construction of Figure 8, where the North-South orientation is displayed from left to right.
The annual DNI harvested at ground level is presented and reaches 1240 k W h · m 2 , meaning without any solar collector on top of it. The same exercise has been done with the inclusion of the collector as it currently stands and illustrated in Figure 9. As one may expect, the level of radiation reaching the ground annually is much lower, especially in the inner rows. The lateral rows are mildly affected, with accumulated radiation averaging 1210 k W h · m 2 , which can be explained by the fact that on these specific rows, no mirror is installed on their top. The path of the sun in Cyprus is mainly distributed in the southern direction. Thus, the southern squares are less impacted (column 34). The average energy is 1190 k W h · m 2 . The inlet pipe shadows the underneath square, where solar radiation reaches 940 k W h · m 2 (Row 5, column 34). Towards the central rows, the energy density decreases to values close to 300 k W h · m 2 . A similar pattern is followed for 2 metres of height as illustrated in Figure 10, but with less intensity. While the lowest value in the centre with the current configuration is 301.5 k W h · m 2 at the current height, if the collector were at 2 m, the minimum value reached would be 480.4 k W h · m 2 . Figure 11 and Figure 12 correspond respectively to heights of 3 m and 4 m. As can be seen, as the height increases, the shading has less and less effect. The collector at the 3 different heights defines a red U-shape or horseshoe in Figure 9, Figure 10, and Figure 11, with the thickness increasing with the height of the collector. The minimal value at higher heights in the central rows is increasing. For all configurations, the first row (Row 1) has a bit higher radiation than Row 2, as the sun is on the northern side at the end of the day and rays penetrate directly on the northern edge. In order not to overload the main body of the present paper, height configurations of 1.5 m, 2.5 m, and 3.5 m are presented in Appendix B. The work of the present section is further analysed in the next part per row and per month.

3.2. Shading for the different rows

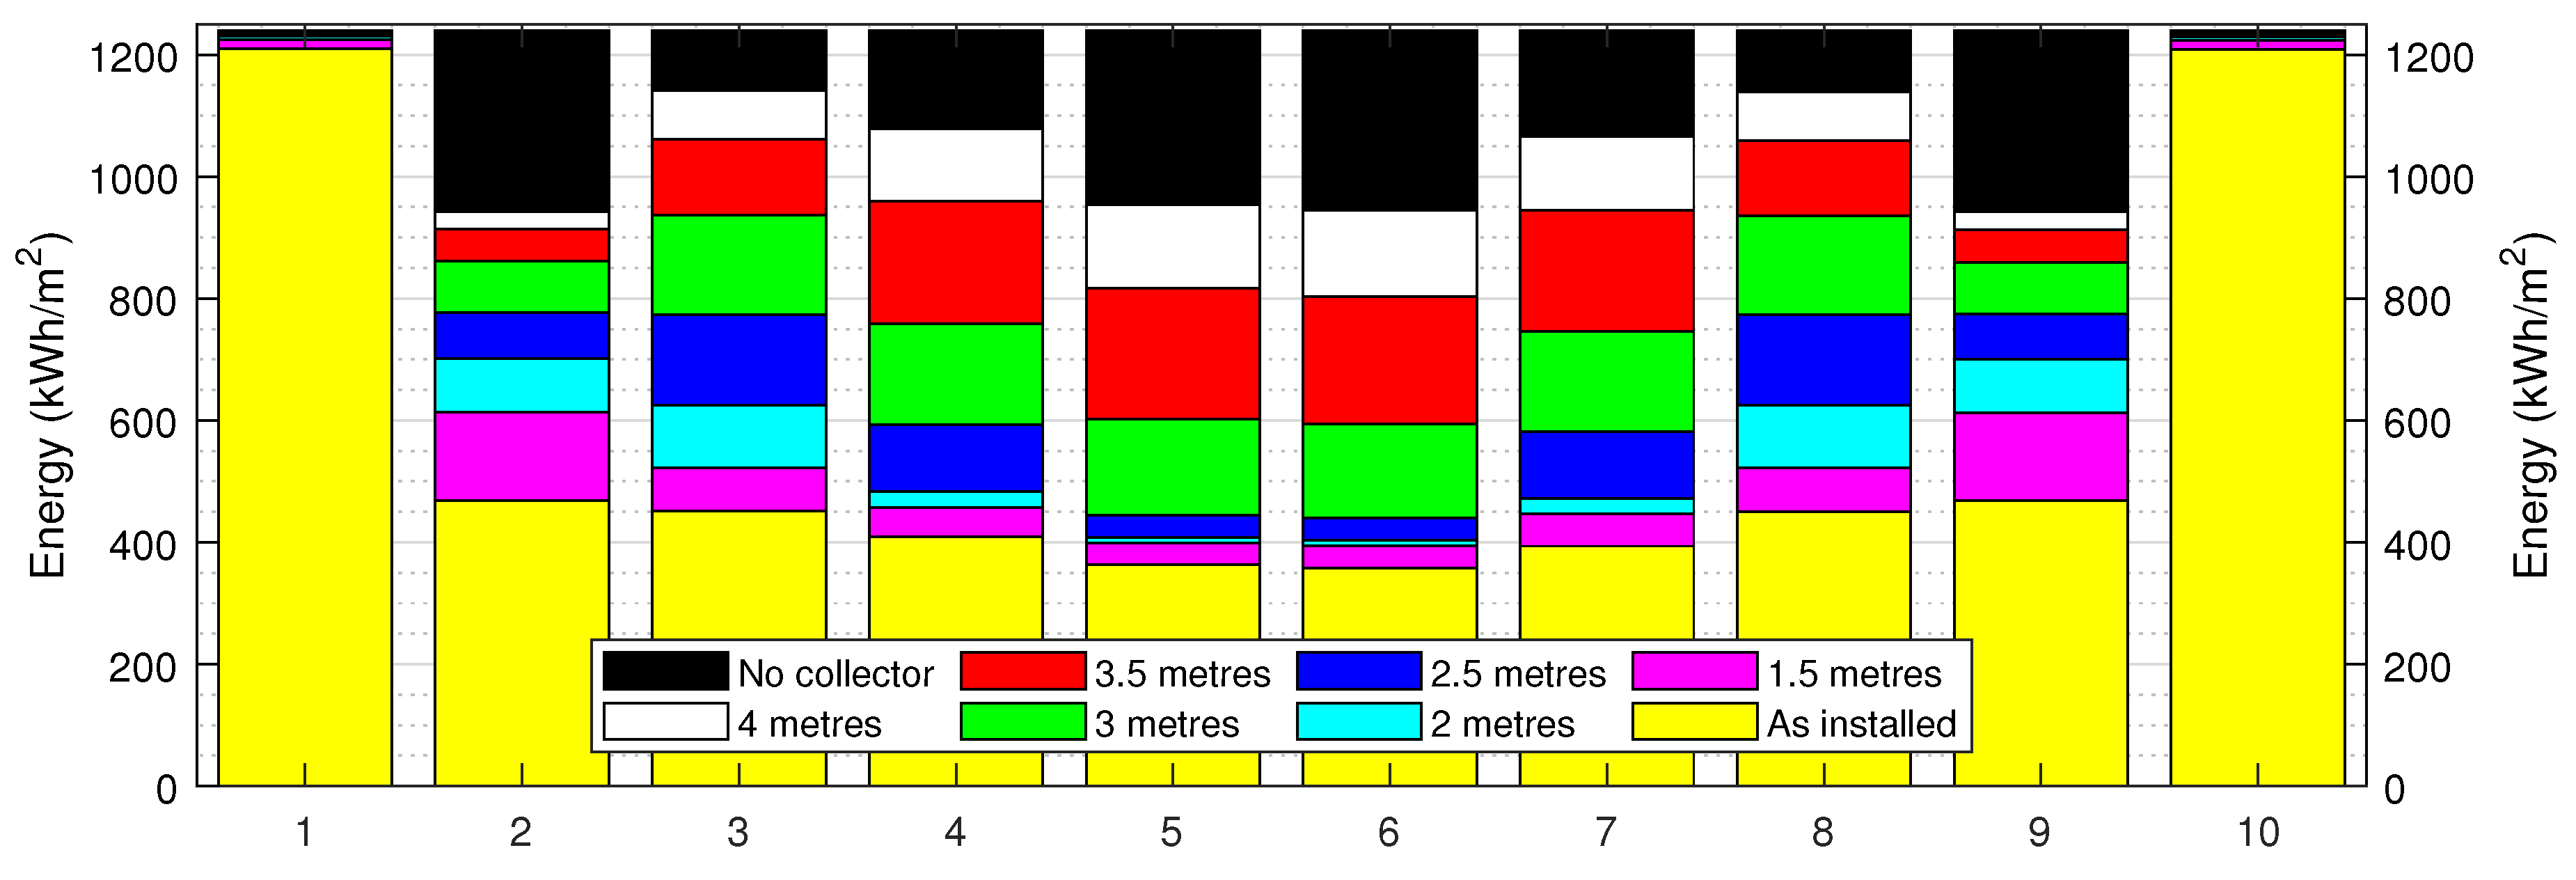
Figure 13 displays the average per row. On the external rows (1, East and 10, West), the impact compared to bare ground is almost null, whatever the height of the collector. Differences start with rows 2 and 9. For all the inner rows, the ’as installed’ configuration blocks the rays by two-thirds, around 400 k W h · m 2 . The shading ratio decreases smoothly on all the inner rows. For heights from 1.5 m up to 2.5 m, the transparency ratio decreases smoothly as the rows are closer to the centre. However, for higher installations, the radiation increases again at rows 3 and 8. This is due to the fact that at the end of the day, when the sun is on the northern side at low heights, the direct radiation still penetrates under the primary optics. Generally, the acceptance angle for the direct solar rays is higher with a higher height of the roof. A solar parking or agrivoltaics setup would better suit heights of 2.5 m and higher, but with less blocking effect. For a simpler cleaning process, i.e., primary reflector, a 2 m height and lower are more convenient with better shielding efficiency.

3.3. Monthly radiation assessment

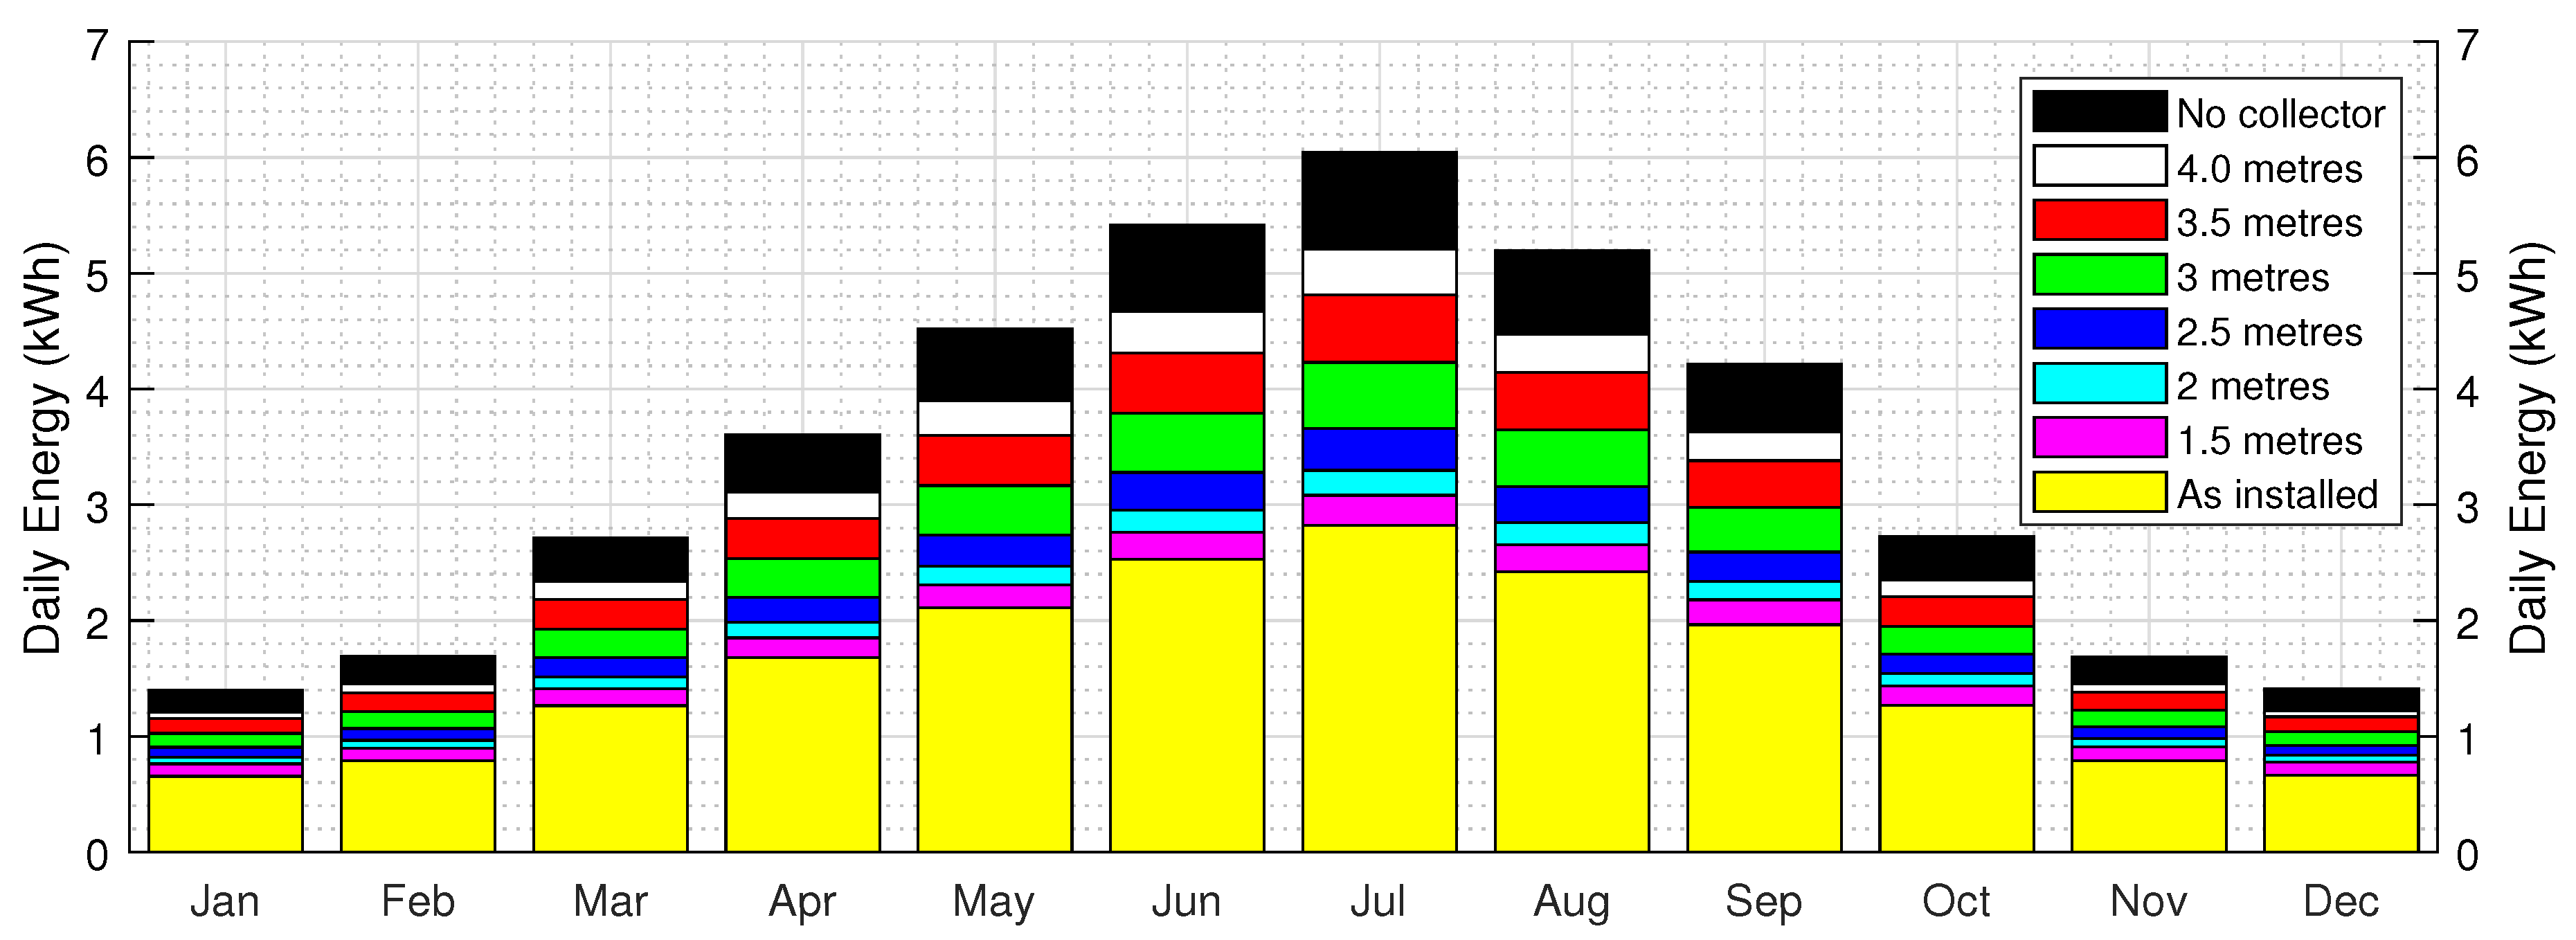
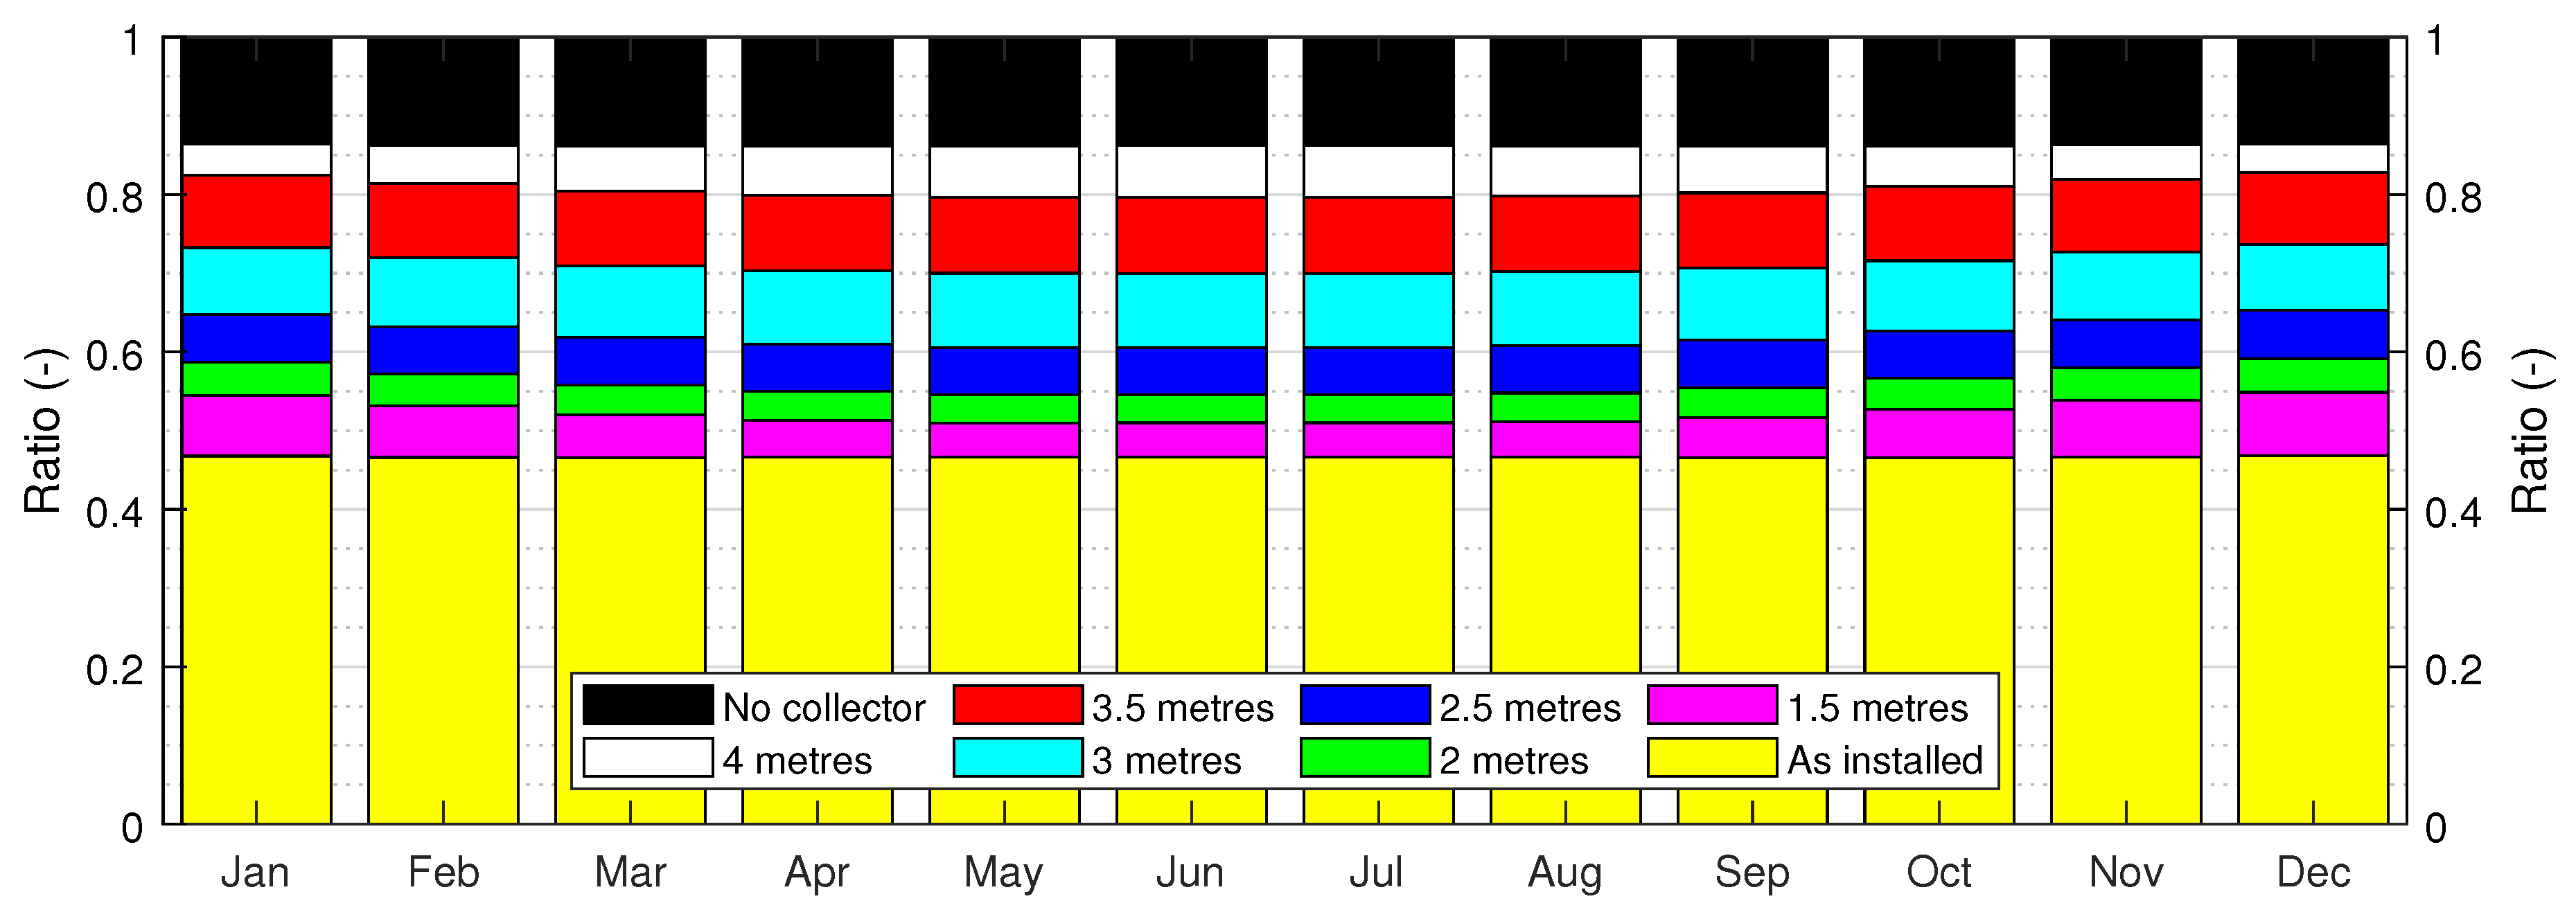
The shade array is organised into 10 rows and 34 columns. The direct radiation resource is depicted as the average daily value per month in Figure 14. A significant observation is the substantial difference in radiation income between summer and winter. Without any collector on the roof, the highest daily average in July reaches 6.04 kWh · m   2 , while in January, it remains at 1.40 kWh · m   2 , the lowest value. Therefore, even without a collector, the radiation in July is more than four times that in January. Figure 14 also illustrates the radiation income for various collector heights. Generally, as the height increases, the harvested radiation on the roof also increases. Figure 14 is further explained by Figure 15, in which transparency ratios are referred to. The ’as installed’ configuration has a transparency ratio of around 47% whatever the month of the year. The 1.5 m configuration has a transparency ratio varying between 51% in July and slightly higher at 54% in winter. The 2.0 m configuration has a transparency ratio varying between 55% in July and slightly higher at 59% in winter. The 2.5 m configuration has a transparency ratio varying between 61% in July and slightly higher at 65% in winter. The 3.0 m configuration has a transparency ratio varying between 70% in July and slightly higher at 73% in winter. The 3.5 m configuration has a transparency ratio varying between 80% in July and slightly higher at 82% in winter. The 4.0 m configuration has a transparency ratio of 86% whatever the month of the year. For all 7 configurations, the transparency ratio remains unchanged, so the effect is proportional to the DNI values in Figure 14. In conclusion, the effect of the collector on the shade is minor for heights beyond 3 m. Half of the radiation is blocked in the ’as installed’ setup.

4. Discussion

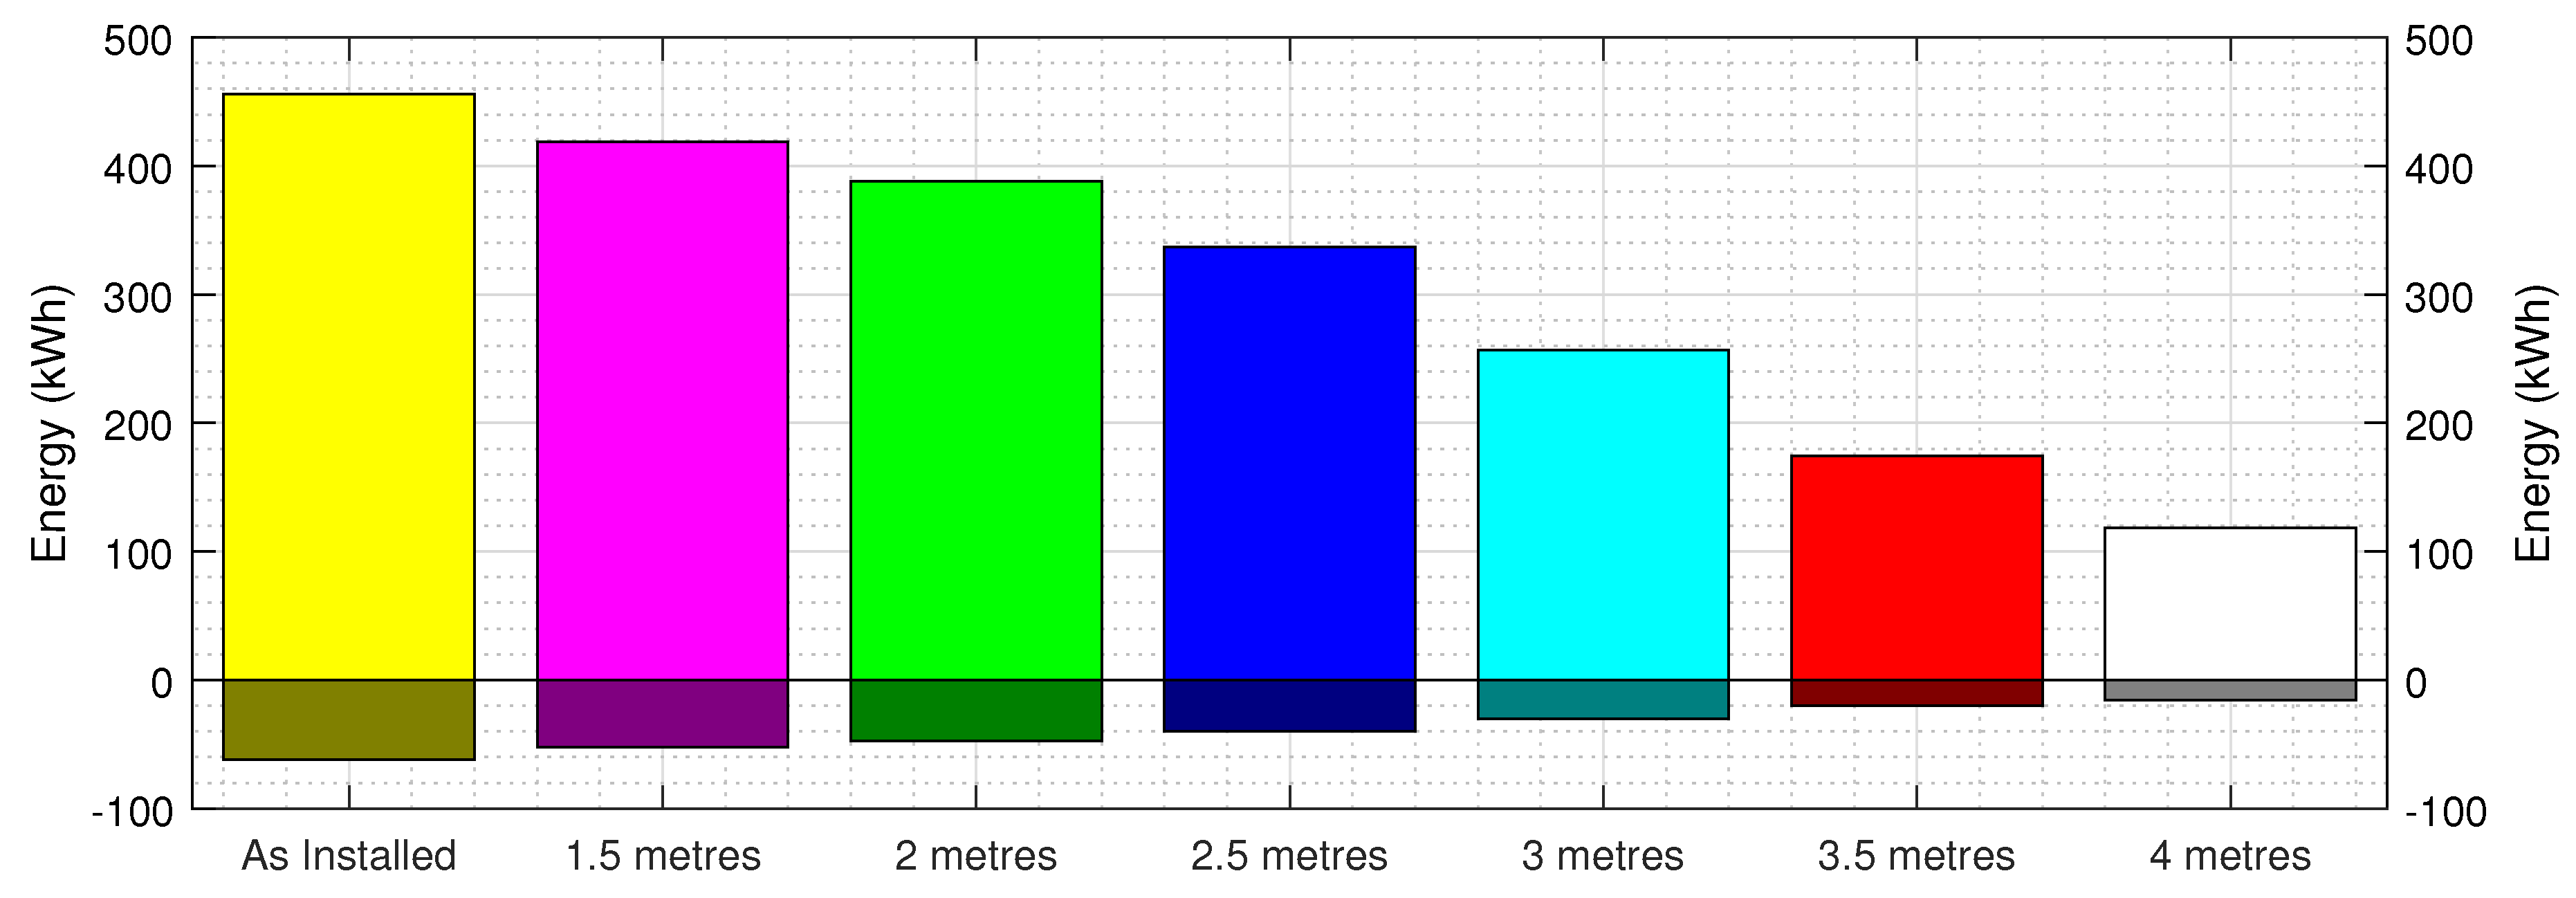
In summer, the solar radiation is blocked by the structure of the collector. Thus, the radiation that would reach a bare roof would heat it up and, by conduction, heat the space underneath, potentially requiring cooling supplied by an electric appliance. An electric appliance first consumes electricity and, second, depending on the electricity grid that supplies it, may be responsible for emissions contributing to global warming. This is the case in Cyprus, where the collector is installed and where 85% of the electricity is produced with petrol [30]. However, in winter, the radiation that would impinge on the roof but is instead blocked does not contribute to heating the building through its roof, thus requiring artificial heating. Figure 16 displays, for the 7 installation heights, the radiation blocked by the collector per year per square metre in bright colours with positive values. The basic assumptions are:
  • Activation of cooling mode whenever the average temperature in the previous hour is higher than 27 °C;
  • Activation of heating mode whenever the average temperature in the previous hour is lower than 18 °C;
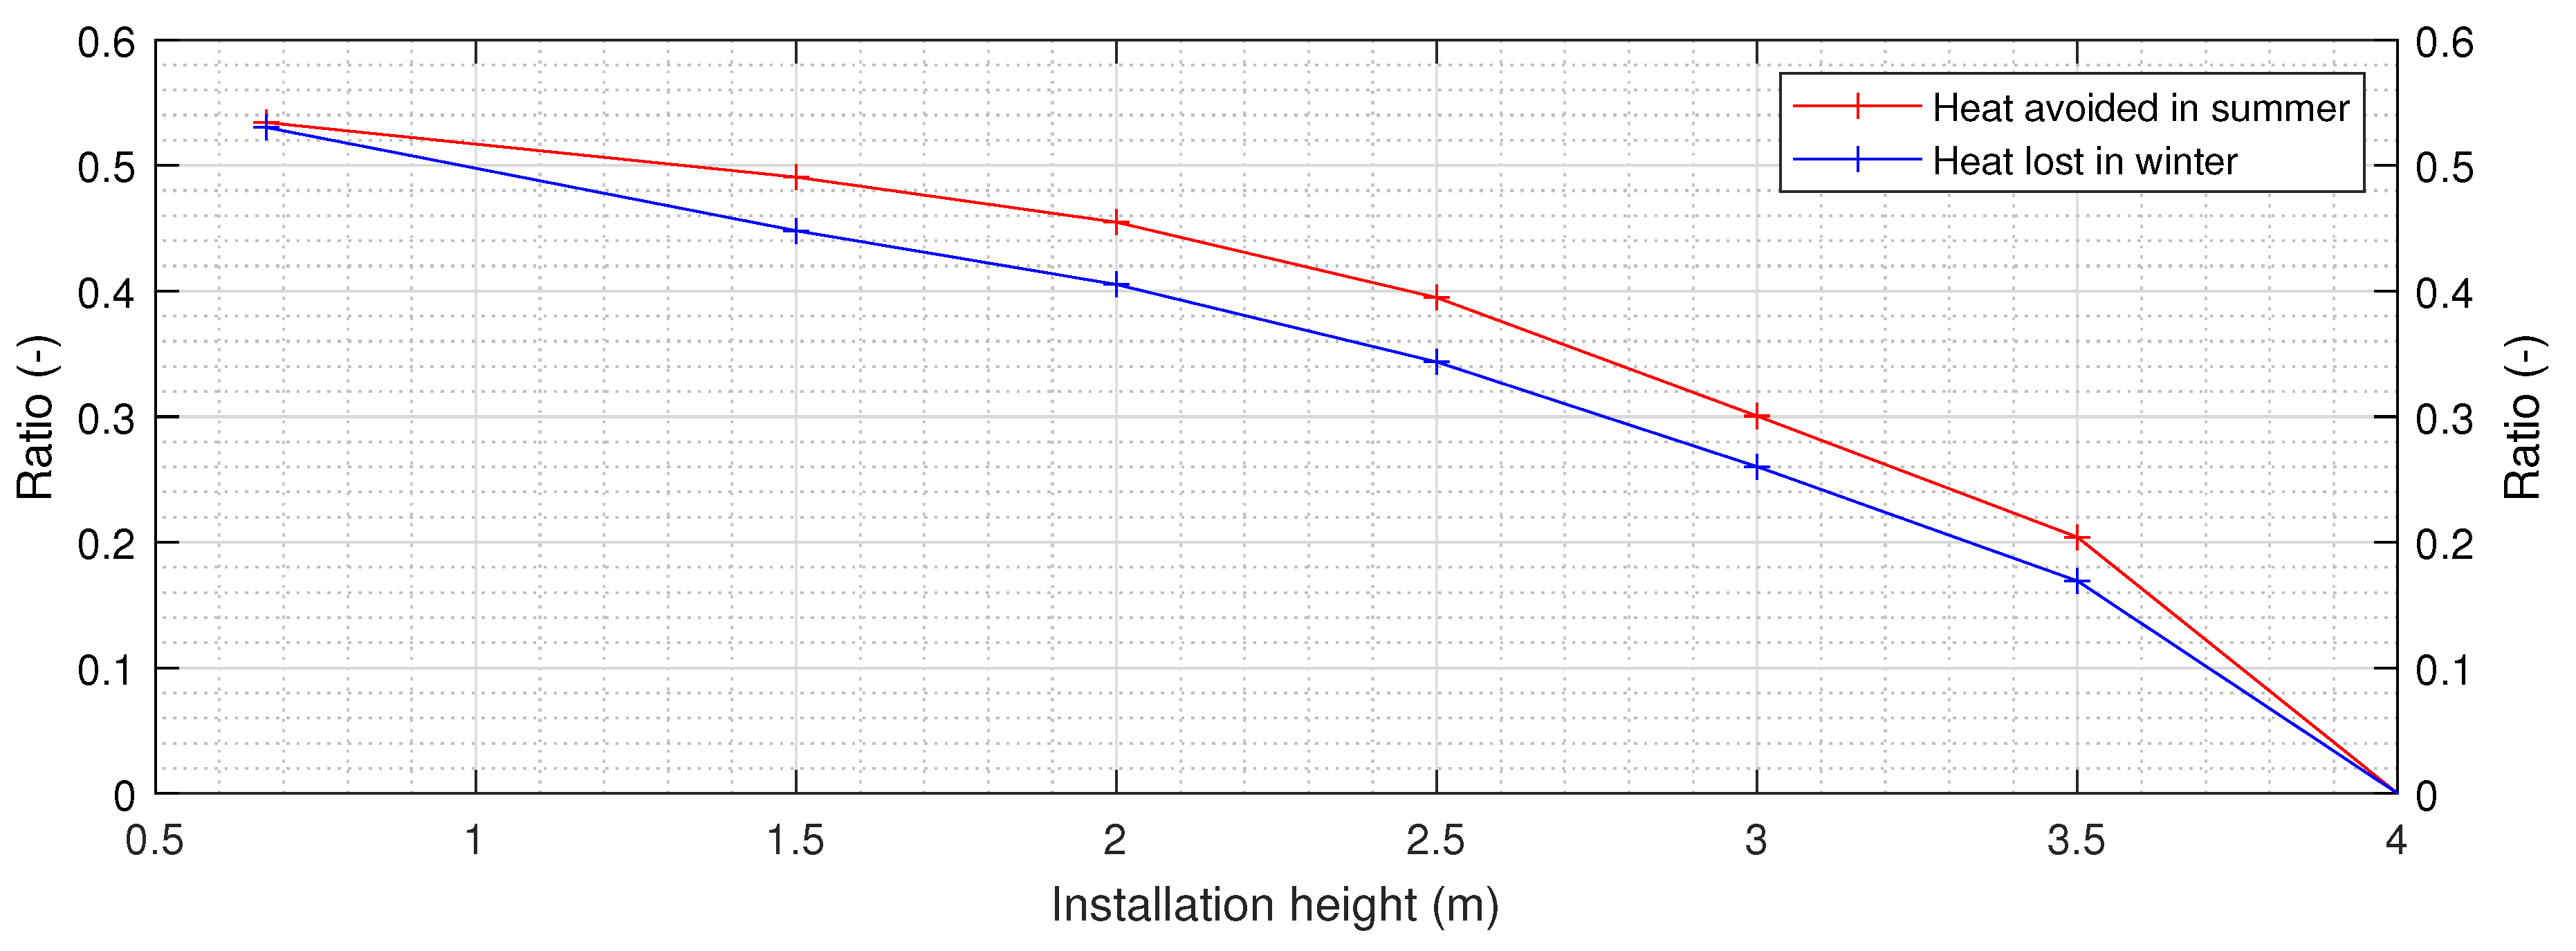
Trends in Figure 16 are shown in Table 1. In summer, the radiation blocked increases as the installation height decreases, from 456 kWh. m 2 ’as installed’ to 119 kWh. m 2 at 4 m. Thus, the blocking benefit is around 4 times lower. In winter, the same trend occurs but at a lower amount, from 62 kWh. m 2 ’as installed’ to 16 kWh. m 2 at 4 m. In that case, the blocking has a negative effect, but as seen in Table 1, the balance always highlights the benefit of the collector shade. Eventually, ’as installed’, the gain, meaning summer benefit minus the winter deficit, is 394 k W h · m 2 in the ’as installed’ configuration and 103 k W h · m 2 at 4 m. So, reasonably, from Table 1, the natural heating avoided is between 7 and 9 times the heating benefit in winter. The impact of higher heights is minimal. Lifting the collector to a higher plane would reduce the actual benefits. This is justified in Figure 17 and in Table 1, where the ratio of radiation blocked for cooling and heating seasons is displayed. In the current configuration, ’as installed’, more than half of the radiation (53%) is beneficially blocked in summer, while the same ratio is blocked in winter. However, as seen in Figure 14, the amount of DNI reaching the roof underneath is up to 4 times higher in summer than in winter. Thus, this also explains the beneficial balance annually for this set-up, but also for the others, decreasingly at higher heights. Hence, the ratios decrease for the higher heights of installation and become null at 4 m with a similar trend, albeit as seen in the red curve, the ratio is slightly higher for the summer radiation blocking effect (winter is represented in blue). As the height increases, the benefit in terms of ratio is better, which is exacerbated with the higher DNI in summer.
The findings of the presented optical study will form the basis for the continuation of this work. In the next stage, a transient thermal model of the roof will be employed in order to simulate the heat flux taking place between the indoor air and the ambient. This heat flux will more accurately reflect the required contribution of the heating and cooling systems, in order to maintain the temperature at the desired level. According to the employed heating and cooling technologies, their thermal contribution will be translated to primary energy consumption, carbon emissions, and monetary cost. The model will take into account all heat transfer mechanisms occurring on the roof. This will allow the quantification of the influence of the LFR on the roof during the night, since it will block the thermal radiation exchange with the nocturnal sky. The latter effect tends to cool down the roof; thus, it is positive during the summer and negative in the winter. Still, this can be mitigated by setting a horizontal stow position of the rows in order to block the radiation in the winter and in a vertical position in the summer to increase the view factor towards the sky vault. In the summer, it has been optically demonstrated that the radiation is blocked throughout the analysis of the paper. Therefore, the need for nocturnal cooling would be less demanding. Moreover, the impact of the thickness of the roof insulation will be studied.

5. Conclusions

The present paper dealt with the energy balance of radiation due to the presence of a tracking linear Fresnel Reflector on a roof. The case study is the U-LEAF in Cyprus. Firstly, due to cosine effects, the average energy received on the roof without a collector would be 1240 k W h · m 2 . This amount is decreased to almost a quarter in the inner rows of the ’as installed’ configuration (300 k W h · m 2 ). The effect is unbalanced depending on the 10 rows on which the meshing has been designed. The external rows are hardly impacted as no mirror is topping them. The southern column facing south remains close to the values of the bare roof. The square under the inlet pipe presents lower annual radiation. The studied collector is used for both heating and cooling purposes. Considering activation of cooling at 27 °C and heating at 18 °C, the blocking effect decreases with increasing height of installation, while after 4 m of height, the effect is almost null. Heights in between present a blocking benefit in summer, offsetting the valuable radiation lost in winter by a factor of 7 to 9. Generally, the lower heights do not allow for another use such as parking below 2.5 m, due to access constraints. In places like Cyprus, where the annual DNI is high and water resources are low, an additional study could investigate the relevance of LFRs for agricultural use with the consideration of the radiation underneath. The present study shall be completed with a transient thermal analysis in order to fully validate the work done presently in a purely optical environment, as discussed in the previous section.

Author Contributions

Conceptualization, A.C.M.; methodology, A.C.M.; software, A.C.M. and K.I.; validation, A.C.M. and G.P.; formal analysis, A.C.M., and G.P. and K.I.; investigation, A.C.M.; resources, A.C.M. and K.I.; data curation, A.C.M.; writing—original draft preparation, A.C.M. and G.P.; writing—review and editing, A.C.M. and G.P.; visualization, A.C.M. and G.P.; supervision, A.C.M.; project administration, A.C.M.; funding acquisition, A.C.M. All authors have read and agreed to the published version of the manuscript.

Funding

This project has received funding from the European Union’s Horizon Europe research and innovation programme under grant agreement No 101136140.

Institutional Review Board Statement

Not applicable.

Informed Consent Statement

Not applicable.

Acknowledgments

Authors would like express their deepest thanks to Dr Victor Grigoriev who developed Tonatiuh++ at the Cyprus Institute.

Conflicts of Interest

The authors declare no conflict of interest.

Abbreviations

The following abbreviations are used in this manuscript:
BIPV Building Integrated Photovoltaics
BIST Building Integrated Solar Thermal
CRS Central Receiver System
CST Concentrated Solar Technology
DNI Direct Normal Irradiation
LFR Linear Fresnel Reflector
PTC Parabolic Trough Collectors
PV Photovoltaics

Appendix A. Meshing

Figure A1. Meshing of the sky vault with fixed step
Preprints 108068 g0a1

Appendix B. Shading at extra heights

Figure A2. Radiation at 1.5 metres above the ground.
Preprints 108068 g0a2
Figure A3. Radiation at 2.5 metres above the ground.
Preprints 108068 g0a3
Figure A4. Radiation at 3.5 metres above the ground.
Preprints 108068 g0a4

References

  1. Siva Reddy, V.; Kaushik, S.; Ranjan, K.; Tyagi, S. State-of-the-art of solar thermal power plants—A review. Renewable and Sustainable Energy Reviews 2013, 27, 258–273. [Google Scholar] [CrossRef]
  2. Alami, A.H.; Olabi, A.; Mdallal, A.; Rezk, A.; Radwan, A.; Rahman, S.M.A.; Shah, S.K.; Abdelkareem, M.A. Concentrating solar power (CSP) technologies: Status and analysis. International Journal of Thermofluids 2023, 18, 100340. [Google Scholar] [CrossRef]
  3. Zhu, G.; Wendelin, T.; Wagner, M.J.; Kutscher, C. History, current state, and future of linear Fresnel concentrating solar collectors. Solar Energy 2014, 103, 639–652. [Google Scholar] [CrossRef]
  4. Haberle, A. Linear Fresnel Collectors. In Solar Thermal Energy; Alexopoulos, S., Kalogirou, S.A., Eds.; Springer US: New York, NY, 2022; pp. 55–62. [Google Scholar] [CrossRef]
  5. Serag-Eldin, M.A. Thermal design of a roof-mounted CLFR collection system for a desert absorption chiller. International Journal of Sustainable Energy 2013, 33, 506–524. [Google Scholar] [CrossRef]
  6. Barbón, A.; Barbón, N.; Bayón, L.; Sánchez-Rodríguez, J. Optimization of the distribution of small scale linear Fresnel reflectors on roofs of urban buildings. Applied Mathematical Modelling 2018, 59, 233–250. [Google Scholar] [CrossRef]
  7. Esfanjani, P.; Jahangiri, S.; Heidarian, A.; Valipour, M.S.; Rashidi, S. A review on solar-powered cooling systems coupled with parabolic dish collector and linear Fresnel reflector. Environmental Science and Pollution Research 2022, 29, 42616–42646. [Google Scholar] [CrossRef] [PubMed]
  8. Guerrero Delgado, M.; Sánchez Ramos, J.; Castro Medina, D.; Palomo Amores, T.R.; Cerezo-Narváez, A.; Álvarez Domínguez, S. Fresnel solar cooling plant for buildings: Optimal operation of an absorption chiller through inverse modelling. Energy Reports 2022, 8, 3189–3212. [Google Scholar] [CrossRef]
  9. Pulido-Iparraguirre, D.; Valenzuela, L.; Serrano-Aguilera, J.J.; Fernández-García, A. Optimized design of a Linear Fresnel reflector for solar process heat applications. Renewable Energy 2019, 131, 1089–1106. [Google Scholar] [CrossRef]
  10. Hofer, A.; Büchner, D.; Kramer, K.; Fahr, S.; Heimsath, A.; Platzer, W.; Scholl, S. Comparison of Two Different (Quasi-) Dynamic Testing Methods for the Performance Evaluation of a Linear Fresnel Process Heat Collector. Energy Procedia 2015, 69, 84–95, International Conference on Concentrating Solar Power and Chemical Energy Systems, SolarPACES 2014. [Google Scholar] [CrossRef]
  11. Disney, M.; Lewis, P.; North, P. Monte Carlo ray tracing in optical canopy reflectance modelling. Remote Sensing Reviews 2000, 18, 163–196. [Google Scholar] [CrossRef]
  12. Jakica, N. State-of-the-art review of solar design tools and methods for assessing daylighting and solar potential for building-integrated photovoltaics. Renewable and Sustainable Energy Reviews 2018, 81, 1296–1328. [Google Scholar] [CrossRef]
  13. Rungasamy, A.; Craig, K.; Meyer, J. A review of linear Fresnel primary optical design methodologies. Solar Energy 2021, 224, 833–854. [Google Scholar] [CrossRef]
  14. Said, Z.; Ghodbane, M.; Hachicha, A.A.; Boumeddane, B. Optical performance assessment of a small experimental prototype of linear Fresnel reflector. Case Studies in Thermal Engineering 2019, 16, 100541. [Google Scholar] [CrossRef]
  15. Negi, B.; Mathur, S.; Kandpal, T. Optical and thermal performance evaluation of a linear fresnel reflector solar concentrator. Solar & Wind Technology 1989, 6, 589–593. [Google Scholar] [CrossRef]
  16. Bellos, E.; Tzivanidis, C.; Moghimi, M. Reducing the optical end losses of a linear Fresnel reflector using novel techniques. Solar Energy 2019, 186, 247–256. [Google Scholar] [CrossRef]
  17. Cheng, Z.D.; Zhao, X.R.; He, Y.L.; Qiu, Y. A novel optical optimization model for linear Fresnel reflector concentrators. Renewable Energy 2018, 129, 486–499. [Google Scholar] [CrossRef]
  18. Zhu, J.; Chen, Z. Optical design of compact linear fresnel reflector systems. Solar Energy Materials and Solar Cells 2018, 176, 239–250. [Google Scholar] [CrossRef]
  19. Montenon, A.C.; Tsekouras, P.; Tzivanidis, C.; Bibron, M.; Papanicolas, C. Thermo-optical modelling of the linear Fresnel collector at the Cyprus institute. AIP Conference Proceedings 2019, 2126, 100004, https://pubs.aip.org/aip/acp/article-pdf/doi/10.1063/1.5117613/14190431/100004_1_online.pdf. [Google Scholar] [CrossRef]
  20. Montenon, A.C.; Santos, A.V.; Collares-Pereira, M.; Montagnino, F.M.; Garofalo, R.; Papanicolas, C. Optical performance comparison of two receiver configurations for medium temperature Linear Fresnel Collectors. Solar Energy 2022, 240, 225–236. [Google Scholar] [CrossRef]
  21. Bellia, L.; Marino, C.; Minichiello, F.; Pedace, A. An Overview on Solar Shading Systems for Buildings. Energy Procedia 2014, 62, 309–317, 6th International Conference on Sustainability in Energy and Buildings, SEB-14. [Google Scholar] [CrossRef]
  22. Sun, L.; Lu, L.; Yang, H. Optimum design of shading-type building-integrated photovoltaic claddings with different surface azimuth angles. Applied Energy 2012, 90, 233–240, Energy Solutions for a Sustainable World, Special Issue of International Conference of Applied Energy, ICA2010, April 21-23, 2010, Singapore. [Google Scholar] [CrossRef]
  23. Taşer, A.; Koyunbaba, B.K.; Kazanasmaz, T. Thermal, daylight, and energy potential of building-integrated photovoltaic (BIPV) systems: A comprehensive review of effects and developments. Solar Energy 2023, 251, 171–196. [Google Scholar] [CrossRef]
  24. Bot, K.; Aelenei, L.; da Glória Gomes, M.; Silva, C.S. A literature review on Building Integrated Solar Energy Systems (BI-SES) for facades - photovoltaic, thermal and hybrid systems. Renewable Energy and Environmental Sustainability 2022, 7, 7. [Google Scholar] [CrossRef]
  25. Institute, T.C. Tonatiuh ++ software, 2023. Accessed: 2023-09-23.
  26. Montenon, A.C.; Papanicolas, C. Economic Assessment of a PV Hybridized Linear Fresnel Collector Supplying Air Conditioning and Electricity for Buildings. Energies 2021, 14. [Google Scholar] [CrossRef]
  27. Montenon, A.C.; Fylaktos, N.; Montagnino, F.; Paredes, F.; Papanicolas, C.N. Concentrated solar power in the built environment. AIP Conference Proceedings 2017, 1850, 040006, [https://pubs.aip.org/aip/acp/article-pdf/doi/10.1063/1.4984402/13745652/040006_1_online.pdf]. [Google Scholar] [CrossRef]
  28. Mamun, M.A.A.; Dargusch, P.; Wadley, D.; Zulkarnain, N.A.; Aziz, A.A. A review of research on agrivoltaic systems. Renewable and Sustainable Energy Reviews 2022, 161, 112351. [Google Scholar] [CrossRef]
  29. Montenon, A.C. Direct solar Radiation (DNI) data in Aglantzia Cyprus July 2016- December 2020, 2024. [CrossRef]
  30. Cyprus, Energy mix. https://www.iea.org/countries/cyprus/energy-mix. Accessed: 2024-05-22.
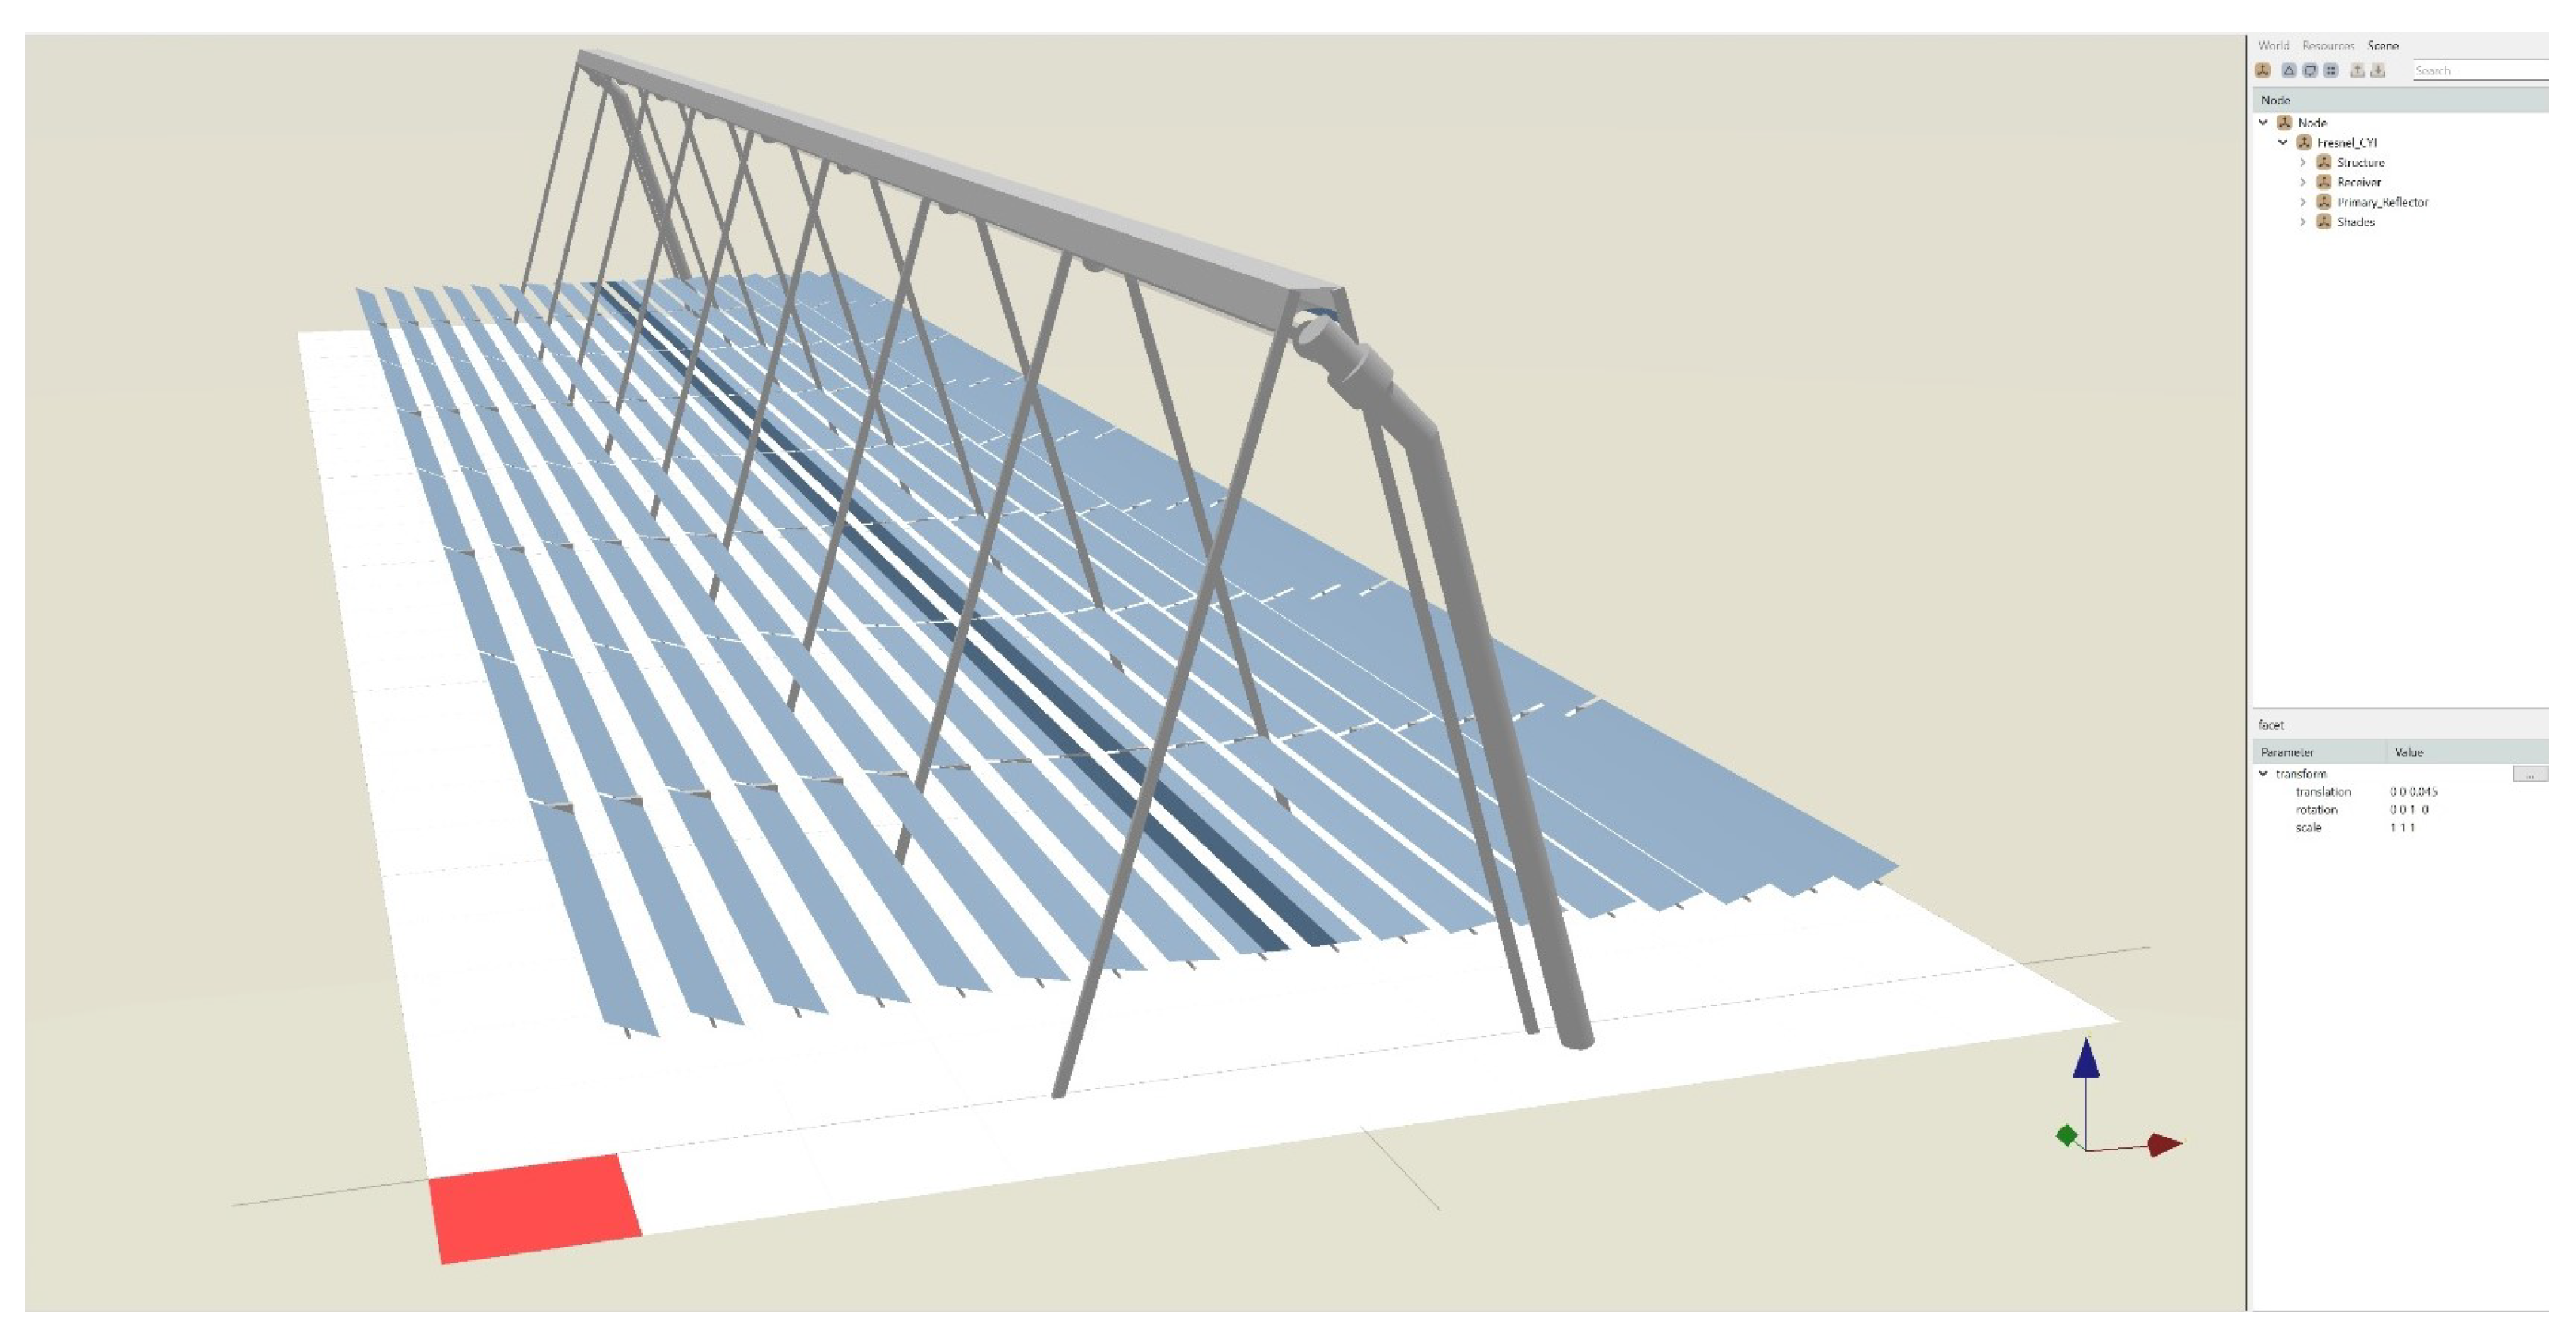
Figure 2. Meshing of the ground with a unit red square on the ground as currently installed at the Cyprus Institute.
Preprints 108068 g002
Figure 3. Modelled collector at different heights: (a) 2 metres above its ground and (b) 3 metres above its ground.
Preprints 108068 g003
Figure 4. Box plot for the square with coordinates (5,10), longitudinally and transversely.
Preprints 108068 g004
Figure 5. Distribution of the power for the 100 simulations for 10,000 rays at square (5,10).
Preprints 108068 g005
Figure 6. Relative root mean square error for the whole meshing after 100 simulations per square with 10,000 rays per square metre.
Preprints 108068 g006
Figure 7. Meshing of the sky vault resulting in a height gap of 3°.
Preprints 108068 g007
Figure 8. Radiation without the collector.
Preprints 108068 g008
Figure 9. Radiation in the current position.
Preprints 108068 g009
Figure 10. Radiation at 2 metres above the ground.
Preprints 108068 g010
Figure 11. Radiation at 3 metres above the ground.
Preprints 108068 g011
Figure 12. Radiation at 4 metres above the ground.
Preprints 108068 g012
Figure 13. Annual average per row.
Preprints 108068 g013
Figure 14. Monthly average radiation per day.
Preprints 108068 g014
Figure 15. Annual transparency ratio per month for the different heights.
Preprints 108068 g015
Figure 16. Radiation blocked for heating (negative dark colours) and cooling season (bright positive colours) at different heights.
Preprints 108068 g016
Figure 17. Ratio of radiation blocked during cooling and heating periods.
Preprints 108068 g017
Table 1. Radiation blocking balance by the collector per square metre in summer and winter for an activation of cooling at 27 ° C and heating at 18 ° C.
Installation height As installed 1.5 m 2.0 m 2.5 m 3.0 m 3.5 m 4.0 m
Summer Radiation blocked ( k W h · m 2 ) 456 419 388 337 257 174 119
Ratio Radiation blocked 0.53 0.49 0.45 0.39 0.30 0.20 0
Winter Radiation blocked ( k W h · m 2 ) 62 52 47 40 30 20 16
Ratio Radiation blocked 0.53 0.45 0.41 0.34 0.26 0.1 0
Difference Summer vs Winter ( k W h · m 2 ) 394 367 341 297 227 154 103
Disclaimer/Publisher’s Note: The statements, opinions and data contained in all publications are solely those of the individual author(s) and contributor(s) and not of MDPI and/or the editor(s). MDPI and/or the editor(s) disclaim responsibility for any injury to people or property resulting from any ideas, methods, instructions or products referred to in the content.
Copyright: This open access article is published under a Creative Commons CC BY 4.0 license, which permit the free download, distribution, and reuse, provided that the author and preprint are cited in any reuse.
Prerpints.org logo

Preprints.org is a free preprint server supported by MDPI in Basel, Switzerland.

Subscribe

© 2024 MDPI (Basel, Switzerland) unless otherwise stated