Preprint
Article

Effects of Salinity on Physicochemical Properties, Flavor Compounds, and Bacterial Communities in Broad Bean Paste-Meju Fermentation

Altmetrics

Downloads

70

Views

21

Comments

0

A peer-reviewed article of this preprint also exists.

Submitted:

03 June 2024

Posted:

03 June 2024

You are already at the latest version

Alerts
Abstract
Broad bean paste (BBP) is a traditional fermented soy food, and its high salt content not only prolongs the fermentation time but also threatens human health. In this study, three BBP-meju with different salt concentrations were prepared, and the effects of varying salinity on the fermentation process were comprehensively compared. The results showed that salt-reduced fermentation contributed to the accumulation of amino acid nitrogen, reducing sugars, free amino acids, and organic acids. Alcohols, esters, aldehydes, and acids were the main volatile flavor compounds in BBP-meju, and the highest total volatile flavor compounds were found in medium-salt meju. Bacillus, Staphylococcus, Aspergillus, and Mortierella were the dominant microbial communities during fermentation, and there were also three opportunistic pathogens, Enterobacter, Pantoea, and Brevundimonas, respectively. According to Spearman correlation analysis, Wickerhamomyces, Bacillus, Staphylococcus, and Mortierella all showed highly significant positive correlations with ≥3 key flavor compounds, which may be the core functional flora. Furthermore, the dominant microbial genera worked synergistically to promote the formation of high-quality flavor compounds and inhibit the production of off-flavors during salt-reduced fermentation. This study provides a theoretical reference for the quality and safety control of low-salt fermented soy foods.
Keywords: 
Subject: Biology and Life Sciences  -   Food Science and Technology

1. Introduction

In recent years, there has been an increasing consumer demand for rational diets. Fermented soy foods have garnered widespread attention globally due to their nutritional and health benefits [1]. Broad bean paste (BBP), also known as Pixian-douban or Doubanjiang, is a primary traditional fermented soy food in China, recognized as a Chinese geographical indication protected product and a national intangible cultural heritage [2]. The production of BBP mainly involves three stages: (1) chopped chili peppers are naturally fermented to produce moromi, (2) broad beans are inoculated with Aspergillus oryzae and then converted to meju by fermentation, and (3) moromi-meju mixture was exposed to sunlight, sheltered from rain, regularly stirred during the day and left to ferment through dew at night until mature [3]. During the BBP-meju fermentation, vigorous microbial metabolism converts macromolecules such as proteins and starch into amino acids, peptides, flavonoids, and free sugars, imparting rich flavor and various physiological functions, which significantly impact the final quality of BBP [4,5]. Reports suggested that BBP exhibited excellent anti-inflammatory, antioxidant, anti-hypertensive, and anti-obesity functions [6,7]. However, according to the Chinese national standard, the salinity of commercial BBP is 15-22% (w/w), while the amount of salt added in BBP-meju is 12-13% (w/w) [8]. Numerous studies indicated that a high-salt diet could induce hypertension, osteoporosis, cardiovascular and cerebrovascular diseases, and kidney diseases [9,10], and was also a risk factor for Alzheimer’s disease [11]. World Health Organization member states co-signed a global target in 2013 to reduce 30% salt intake by 2025 [12], and the “National Nutrition Plan of China (2017-2030)” explicitly aims to reduce 20% salt intake by Chinese residents by 2030 [13]. Therefore, reducing BBP salt concentration is crucial to promote further development in this industry.
Currently, strategies used for salt reduction in BBP are mainly based on the replacement of NaCl by other substances, including CaCl2, MgCl2, KCl, yeast extracts, and phosphates [14]. However, reducing salt in fermented foods must be done with great caution. Salt serves multiple functions, significantly influencing the growth of microorganisms and the accumulation of flavor compounds, ultimately affecting the quality of the fermented foods [15]. Studies have shown that salt-reduced fermentation accelerates BBP fermentation, promotes the production of organic acids (OAs) and free amino acids (FAAs), and increases the accumulation of flavor compounds and alkaloids [4]. Nevertheless, a decrease in salt concentration causes an increase in undesirable flavor compounds such as acetic acid, butyric acid, 2-phetylfuran, decanal, and (Z)-2-heptenal, which makes BBP exhibit acidity and irritation [16]. Furthermore, reducing salt during BBP fermentation can increase Klebsiella, Cronobacter, and Acinetobacter [17]. They are opportunistic pathogens that pose a food safety threat to BBP. Therefore, understanding the role of salinity on microorganisms and flavor compounds during BBP fermentation is crucial for achieving salt reduction in BBP. Currently, BBP-related studies have focused on the flavor profile, microbial community structure, and functional properties [18], while the influence of salt concentration on BBP, especially during the fermentation process, remains unclear.
Based on the critical role of the BBP-meju fermentation stage, three BBP-meju with different salt concentrations were prepared in this study. The impact of salt concentration on BBP-meju quality was comprehensively explored through E-nose, headspace solid-phase microextraction combined with comprehensive two-dimensional gas chromatography-mass spectrometry (HS-SPME-GC×GC-MS) technology, and high-throughput sequencing technology, integrating physicochemical indexes, volatile flavor compounds, and microbial community succession. Furthermore, the relationship between key microbial communities and flavor compounds during salt-reduced fermentation was elucidated through correlation network analysis, providing theoretical guidance for the industrial production of low-salt BBP. Meanwhile, the results can guide the salt reduction strategies for traditional fermented soy foods similar to BBP, contributing to the reduction of global salt intake.

2. Materials and Methods

2.1. Fermentation of Broad Bean Paste-Meju under Different Salt Concentrations

Freshly shelled broad beans were soaked and boiled in water at high temperatures (115 °C) and high pressure (0.1 MPa) for 20 min. The cooked broad beans were cooled to room temperature and then mixed with wheat flour sieved through 80 mesh at 3:1 (w/ w), and then added with Aspergillus oryzae HN3.042 spore suspension to give a final inoculum of 1×10⁷ CFU/g. The mixture was incubated at 35 °C, 90% humidity for 48 h until green spores coated the surface beans, resulting in mature koji. Different salt concentrations were added to the matured koji to give a final concentration of 4%, 8%, and 12% (w/w) (defined as low, medium, and high concentrations, respectively). This mixture was transferred to a ceramic jar for anaerobic fermentation, sealed with distilled water, and left at 30 °C for 49 days. The samples were collected on days 0, 3, 5, 7, 14, 21, 28, 35, 42, and 49.
5 g of the BBP-meju sample was accurately weighed, and the distilled water was added to a total volume of 50 mL, homogenized, and then extracted with ultrasound at 35 °C for 30 min. Centrifuged at 10,000 g for 15 min at 4 °C, the supernatant was filtered through a 0.45 μm microporous filter, and the filtrate was collected. The filtrate was freeze-dried and diluted with distilled water for subsequent analysis.

2.2. Physicochemical Properties

Direct desiccation was employed to determine the moisture content. The pH was assessed utilizing a pH meter (METTLER TOLEDO Instruments Co., Shanghai, China). Salinity was determined via the silver nitrate titration [19]. Total acidity was titrated with sodium hydroxide [20]. The amino acid nitrogen (AAN) content analysis was carried out using the formaldehyde titration method [21]. Reducing sugars were quantified using the 3,5-dinitrosalicylic acid technique [22], while total sugars were determined with the phenol-H2SO4 technique [23].
The FAA content of BBP-meju samples was analyzed following the method outlined by Ding et al. with slight modifications [24]. The samples (5 g) were homogenized thrice for 10 s in 20 mL of distilled water at 10,000 g. Subsequently, 20 mL of 5% (v/v) trichloroacetic acid was added and mixed thoroughly. The mixture was then filtered through a 0.22 μm filter, and the FAA concentration was determined using an automatic amino acid analyzer (L-8900, Hitachi, Japan).
OAs were measured using HPLC (LC-16, Shimadzu, Japan) with Venusil MPc18 (250 mm × 4.6 mm, 5 μm) and a SPD-16 detector as per the method developed by Lin et al. [25].

2.3. E-Nose Analysis

An E-nose analysis was conducted using a portable electronic nose 3 (PEN3) system (Ensoul Technology LTD., Beijing, China). The detailed information of each sensor was shown in Table S1. 2 g of BBP-meju samples were accurately weighed and placed in the headspace vials and equilibrated in a constant temperature water bath at 25 °C for 30 min. The parameters of the E-nose were set as follows: sampling interval of 1 s, cleaning time of 120 s, zero point adjustment time of 10 s, pre-sampling time of 5 s, testing time of 80 s, and an injection volume flow rate of 400 mL/min. Each test group was measured in triplicate, and the average value was taken for data analysis [26].

2.4. Volatile Flavor Compounds Analysis

2.4.1. SPME Method

2 g of BBP-meju sample was mixed with 2 g of NaCl and added to 8 mL of distilled water, followed by 50 μL of 2-octanol as an internal standard (0.822 mg/mL dissolved in distilled water). The mixture was placed into a headspace vial (20 mL) (Supelco, Inc., Bellefonte, PA, USA). Then, the headspace vial was ultrasonicated in a water bath at 30 °C for 30 min, followed by ramping up to 60 °C and equilibrium for 25 min, inserting a 75 μm SPME fiber (50/30 μm DVB/CAR/PDMS) (Supelco, Inc., Bellefonte, PA, USA) for extraction for 25 min. The fiber was then desorbed for 1 min and inserted into the GC injection port.

2.4.2. GC×GC-MS Instrumental Analysis Method

The analysis was performed using a comprehensive two-dimensional gas chromatography-mass spectrometer (GCMS-QP2020NX, Shimadzu, Kyoto, Japan).
The injection port temperature was 230 °C, and the injection was carried out in non-split mode using helium (purity >99.9999%) as the carrier gas with a column flow rate of 1 mL/min. The 1D column was a DB-WAX quartz capillary column (30 m × 0.25 mm × 0.25 μm), and the 2D column was a DB-17MS capillary column (1.2 m × 0.18 mm × 0.18 μm), along with a solid-state thermal modulator HV (C5-C30). The temperature program was as follows: started at 40 °C and held for 3 min, ramped up to 150 °C at a rate of 4 °C/min and held for 2 min, then ramped up to 230 °C at a rate of 4 °C/min and held for 6 min. The modulation cycle for the two-dimensional analysis was 4 s. The source temperature of the mass spectrometer was 230 °C, the interface temperature was 200 °C, the data acquisition was performed in SCAN mode for qualitative analysis, and the scanning range was 41-330 m/z.
The volatile compounds were identified by comparing retention index (RI) and mass spectra with reference standards from the National Institute of Standards and Technology (NIST) mass spectral library. Subsequently, quantitative analysis was carried out using 2-octanol as an internal standard. The relative concentrations of volatile compounds were then calculated by comparing the peak areas with the internal standard.

2.5. DNA Extraction and High-Throughput Sequencing Analysis

Microbial DNA was extracted following the protocol provided by the E.Z.N.A® soil DNA kit (OmegaBio-Tek, Norcross, GA, USA). Subsequently, DNA quality, concentration, and integrity were evaluated using 1% agarose gel electrophoresis. The amplification of the V3-V4 region of the bacterial 16S rRNA gene employed primers 338F (5’-ACTCCTACGGGGAGGCAGCA-3’) and 806R (5’-GGACTACHVGGGTWTCTAAT-3’), while amplification of the fungal ITS gene sequences utilized primers ITS1F (5’-CTTGGTCATTTAGAGAGGAAGTAA-3’) and ITS2R (5’-GCTGCGTTCTTCATCGATGC-3’). PCR amplification followed the method outlined by Xu et al. [27]. Following purification, quantification, and storage at -80 °C, amplification products underwent raw sequencing data filtering by Trimmomatic v0.33 software. Primer sequences were eliminated using cutadapt 1.9.1 software to obtain high-quality sequences (Clean Reads). Subsequently, sample clean reads were spliced using Usearch v10 software and length-filtered according to specific region length ranges. The data underwent removal of low-quality and chimeric sequences and classification of high-quality sequences. The OTU representative sequences were taxonomically classified utilizing the Silva 138 16S rRNA database (http://www.arb-silva.de) and the Unite 8.0 ITS database (http://unite.ut.ee/) for taxonomy annotation.

2.6. Statistical Analysis

Three identical experiments (n = 3) were established for each trial. Statistical analysis was conducted through one-way ANOVA and Duncan‘s Multiple range test utilizing SPSS 25.0 software (SPSS Inc., Chicago, IL, USA). A significance level of 0.05 was employed to determine statistically significant variances. The research findings were represented graphically using Origin 2024 software (OriginLab Corporation, Northampton, MA, USA).

3. Results and Discussion

3.1. Physicochemical Properties during Fermentation of BBP-Meju with Different Salt Concentrations

Physicochemical parameters are vital indicators affecting the quality of fermented soy foods. In this study, moisture content, pH, salinity, total acid, AAN, and reducing sugar during the fermentation of BBP-meju with different salt concentrations were determined (Figure 1). The salinity of the 4%, 8%, and 12% salt addition samples was in a stable state and reached 2.48±0.12 g/100 g, 5.91±0.10 g/100 g, and 8.10±0.22 g/100 g, respectively, on day 49. The moisture content of the BBP-meju with different salt concentrations decreased during fermentation, with higher moisture content observed with lower salt concentrations, consistent with Li et al. [28]. The research indicated that the moisture content is a crucial indicator during the fermentation of BBP, which not only provides a transport medium for microbial growth but also participates in microbial metabolism and reproduction, thus influencing the microbial activity and the occurrence of Maillard reaction in the fermentation system [29]. Therefore, the higher moisture content in low-salt samples reflected more vigorous microbial growth and metabolism internally. Additionally, the pH of BBP-meju decreased first, then increased, and decreased again, stabilizing at 4.89±0.03 (L), 5.14±0.04 (M), and 5.19±0.06 (H), respectively, showing an opposite trend to the total acid. Overall, pH increased as salinity decreased, while total acid levels decreased, with total acid levels of 2.67±0.01 g/100 g and 2.06±0.09 g/100 g in low and medium-salt samples, respectively, exceeding the requirement of total acid (in terms of lactic acid) ≤ 2.0 g/100 g as specified in the Chinese national standard [8]. It is known that salt-reduced fermentation promotes the growth of microorganisms such as LAB, Staphylococci, and Bacillus, further decomposing carbohydrates, proteins, and fats in the raw materials, leading to the accumulation of OAs, resulting in an increase in total acid levels and a decrease in pH [24]. Meanwhile, pH is considered a critical factor in controlling the growth of pathogens in fermented foods and a vital hygiene indicator for BBP [30]. Therefore, lower salt concentration can be used to some extent to achieve inhibition of pathogenic microorganisms through low pH. AAN is another important parameter for measuring the quality of BBP, reflecting the degree of hydrolysis of broad bean protein during fermentation [31]. The results showed that in the early stage of fermentation, the AAN levels in BBP-meju samples showed an increasing trend and reached the highest value on day 7, which was 1.25 ± 0.02 g/100 g (L), 1.12 ± 0.02 g/100 g (M), and 1.03 ± 0.07 g/100 g (H), respectively. In the middle and late stages of fermentation, the AAN levels decreased gradually and reached 0.77±0.01 g/100 g (L), 0.69±0.01 g/100 g (M), and 0.60±0.01 g/100 g (H) on day 49. In the early stage of fermentation, broad bean protein underwent extensive hydrolysis by microorganisms, leading to a rapid increase in AAN. However, in the middle and late stages of fermentation, the growth of microorganisms and the Maillard reaction consumed a large amount of AAN, leading to a decrease, which in turn led to a change in the flavor of BBP [32]. Similarly, microorganisms such as Aspergillus oryzae secreted large amounts of amylase to degrade starch in broad beans, causing a rapid increase in the level of reducing sugars in the early stages of fermentation, which is consumed as a substrate for microbial growth and Maillard reaction in the middle and late stages of fermentation leading to a decrease in the level of reducing sugars [33], and on day 49 it reached 8.86 ± 0.01 g/100 g (L), 7.57 ± 0.17 g/100 g (M), and 7.41 ± 0.03 g/100 g (H). Overall, the salt reduction caused the accumulation of AAN and reducing sugars, positively affecting the overall quality of BBP-meju. In addition, multiple physicochemical indicators used day 7 as a critical turning point, followed by continuous fluctuations. Therefore, the fermentation samples from days 7, 21, 35, and 49 were selected for subsequent analysis.

3.2. Changes of FAA Composition during Fermentation of BBP-Meju with Different Salt Concentrations

FAAs are crucial flavor compounds in fermented foods, closely associated with BBP-meju fermentation [34]. The changes in FAAs during BBP-meju fermentation with different salt concentrations were shown in Figure 2. It can be seen that the total amount of FAAs increased with fermentation at all three salt concentrations (Figure 2B). Meanwhile, the total amount of FAAs decreased slightly with increasing salt concentration, indicating that salt-reduced fermentation could further promote the accumulation of amino acids in BBP-meju. Studies have shown that salt reduction can enhance protease activity, resulting in higher levels of FAAs [35]. This is in agreement with the results of this study. Specifically, the levels of umami amino acids (glutamate and aspartate) decreased with decreasing salt concentration, with a total reduction of 16.04%. On average, the glutamate (Glu) level decreased from 90.00±1.88 mg/100 g in the high-salt sample to 80.43±1.44 mg/100 g in the low-salt sample, while the aspartate (Asp) level decreased from 45.20±1.71 mg/100 g in the high-salt sample to 36.09±1.57 mg/100 g in the low-salt sample. Similarly, the sweet amino acid threonine (Thr) decreased with decreasing salt concentration. However, the levels of alanine (Ala), glycine (Gly), and proline (Pro) increased with decreasing salt concentration by 31.76%, 11.25%, and 24.35%, respectively. Consequently, the total amount of sweet amino acids increased by 14.06% with salt reduction. Likewise, the total amount of bitter amino acids showed an increasing trend, with an increase of 16.30%. Thus, the salt reduction during BBP-meju fermentation led to a decrease in umami amino acids and an increase in bitter amino acids, resulting in flavor dissonance.

3.3. Changes of OA Composition during Fermentation of BBP-Meju with Different Salt Concentrations

OAs are closely related to the flavor and nutrition of various fermented foods and have been shown to play an essential role in BBP-meju fermentation [36]. The dynamic changes of malic acid, citric acid, succinic acid, lactic acid, tartaric acid, and acetic acids during BBP-meju fermentation with different salt concentrations were shown in Figure 3. The levels of total OAs in BBP-meju with different salt concentrations increased and reached 28.17±1.43 mg/g (L), 22.72±0.18 mg/g (M), and 16.69±1.02 mg/g (H), respectively, on day 49. During the fermentation, the levels of total OAs in BBP-meju increased with salt reduction. This result is consistent with the study by Li et al. [4]. Specifically, malic acid, citric acid, and succinic acid were the major OAs in high-salt meju. In contrast, malic acid, lactic acid, and citric acids were the major OAs in medium and low-salt meju. Malic acid, citric acid, and succinic acid were known to be key acidulants in BBP fermentation, imparting a natural sour flavor to BBP and inhibiting the growth of undesirable microorganisms, thereby prolonging the shelf life [37]. The average content of lactic acid was 7.77±0.18 mg/g (L), 5.55±0.04 mg/g (M), and 0.95±0.05 mg/g (H) at the three salt concentrations, showing significant variation with salt concentration. Meanwhile, the average content of acetic acid increased significantly from 0.56±0.01 mg/g under high-salt conditions to 2.38±0.03 mg/g under low-salt conditions. Lactobacillus has been reported to convert oxaloacetate and pyruvate to acetic or lactic acid [4]. Therefore, the high levels of lactic acid and acetic acid in low-salt meju may be related to the accumulation of Lactobacillus in the fermentation system.
Based on these results, FAAs and OAs exhibited continuous changes during the BBP-meju fermentation. Hence, the samples from day 7 and 35 were further selected for subsequent analysis.

3.4. Analysis of E-Nose Response during BBP-Meju Fermentation with Different Salt Concentrations

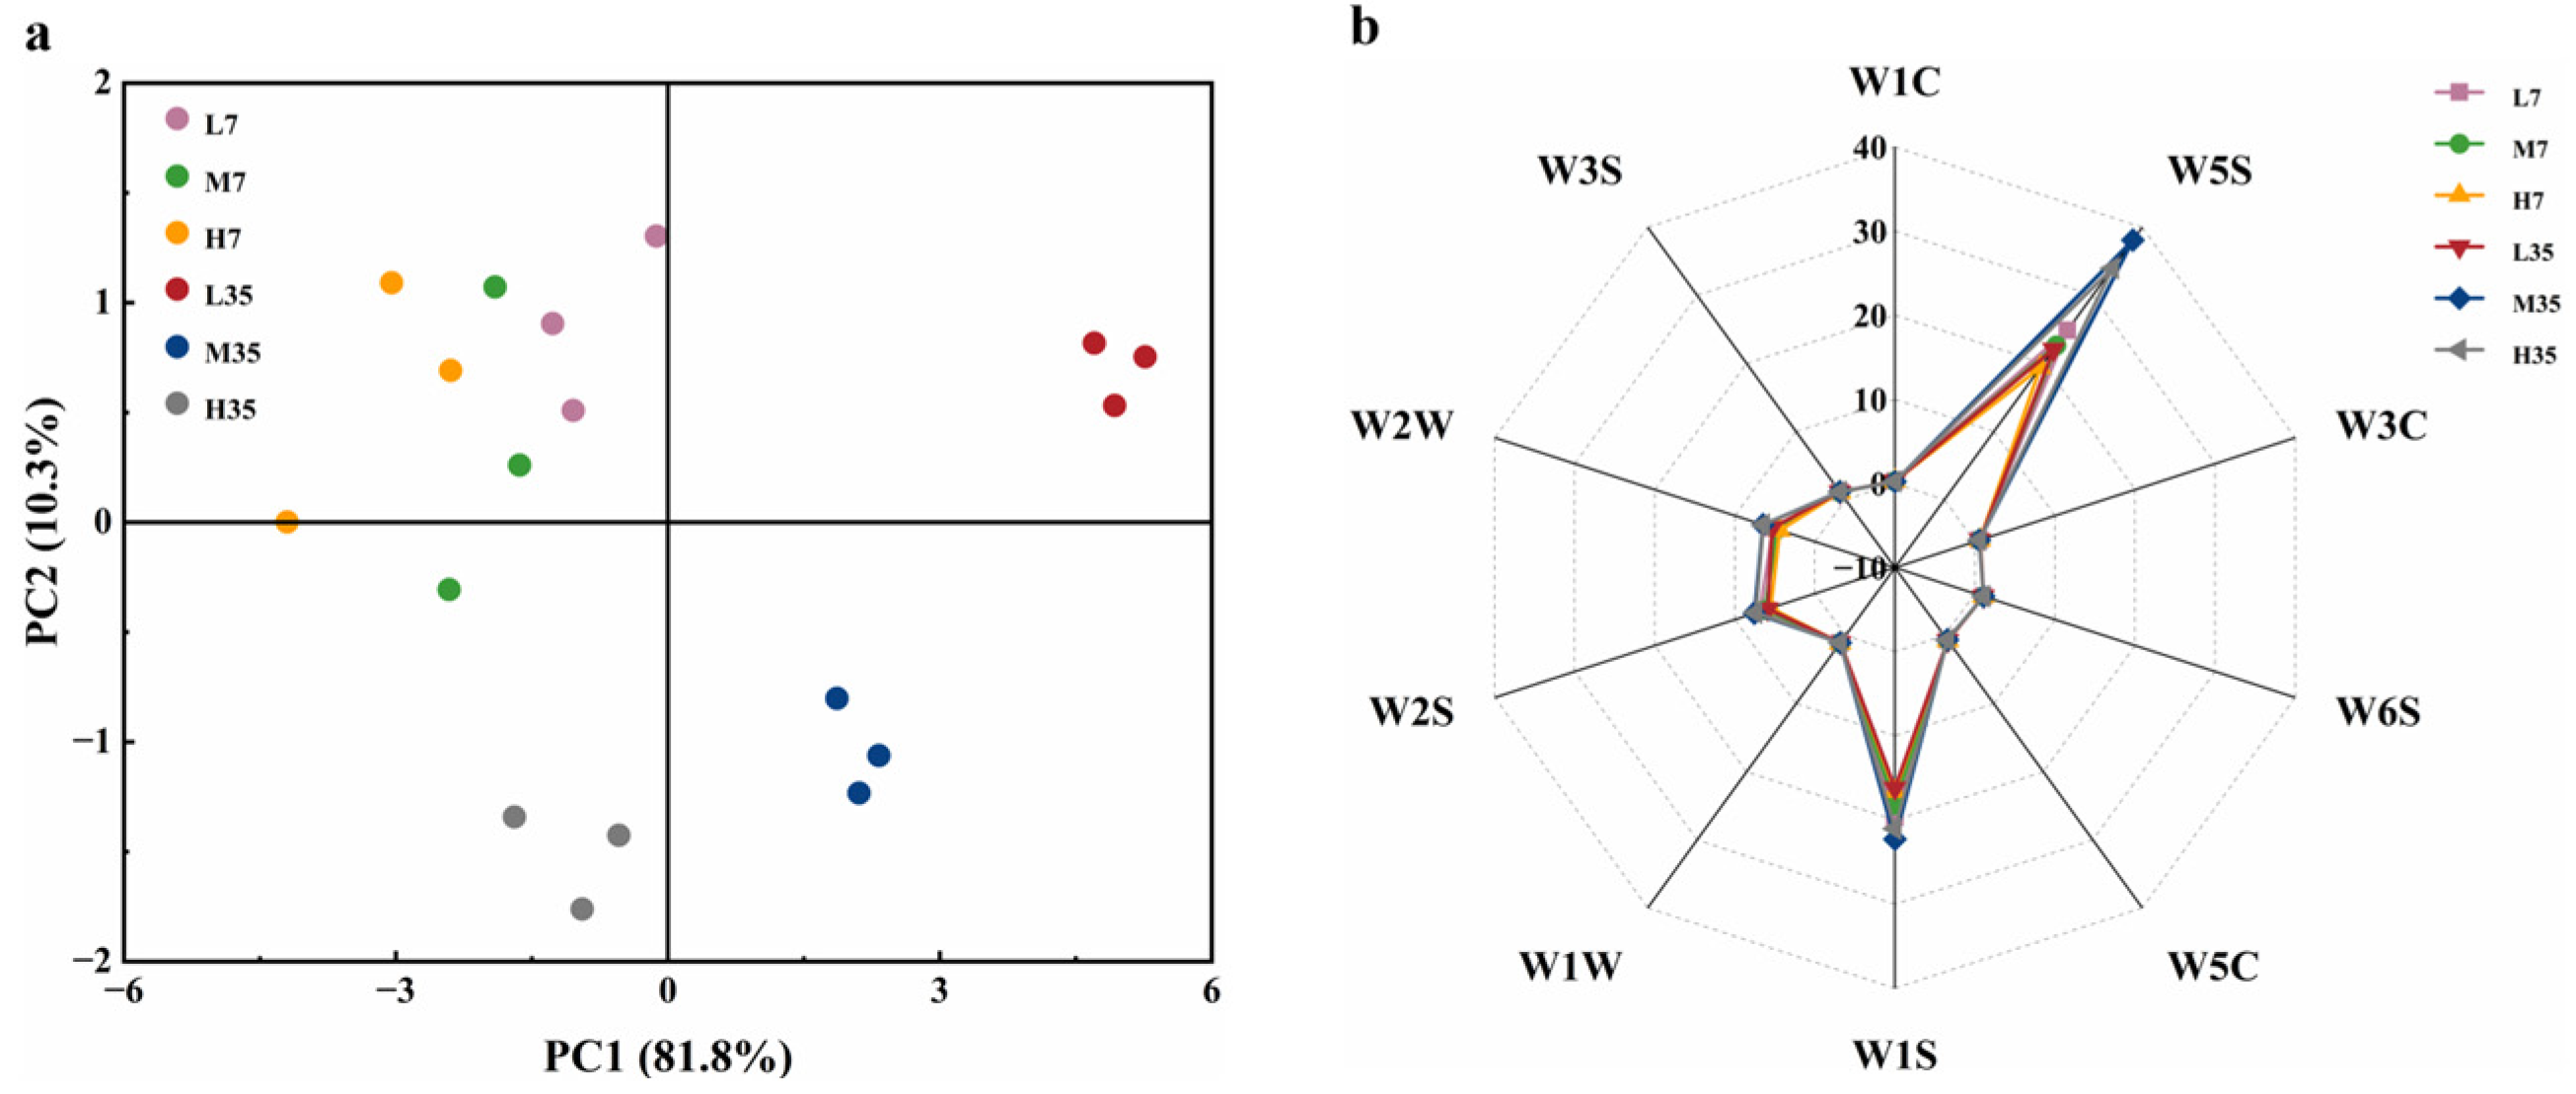
The E-nose can acquire the flavor characteristics of the sample to be tested by simulating the human olfactory system, thus avoiding the subjectivity of sensory evaluation, and it is widely used in flavor identification [38]. In this study, an E-nose was used to analyze the flavor characteristics of BBP-meju during fermentation with different salt concentrations, capturing subtle differences in flavor compounds through the differences in sensor response values. Principal component analysis (PCA) was first conducted on the E-nose data, and the results were shown in Figure 4. The results indicated that PC1 and PC2 contributed 10.3% and 81.8% of the variance, respectively, explaining 92.1% of the total variance. Therefore, these two principal components were sufficient to reflect the flavor response information of different sensors for different samples [39]. According to the PCA score plot, samples L35, M35, and H35 were distributed in the first, fourth, and third quadrants, respectively, while all samples on day 7 were distributed in the second quadrant. On day 7, the flavor characteristics of the three samples with different salt concentrations were similar. As the fermentation progressed, the flavor differences among meju samples with different salt concentrations became more pronounced.
The flavor profiles of the different meju samples were further elucidated more intuitively and clearly by radar charts. Overall, the radar chart profiles of all meju samples were relatively similar. However, there were differences in the response of each sensor for different samples. Sensors W1C, W3C, W6S, W5C, W1W, and W3S showed weak responses to all the samples, while sensors W5S, W1S, W2S, and W2W have strong responses. As fermentation progressed, sensors W5S, W1S, W2S, and W2W significantly enhanced in response to meju samples, and their responses decreased with increasing salt concentration. The results indicated that the various flavor compounds in meju continuously accumulated during fermentation, ultimately forming the rich aroma of BBP-meju. Additionally, salt-reduced fermentation could further increase the level of the flavor compounds, enhancing the characteristic flavor of BBP-meju.

3.5. Volatile Flavor Profile during BBP-Meju Fermentation with Different Salt Concentrations

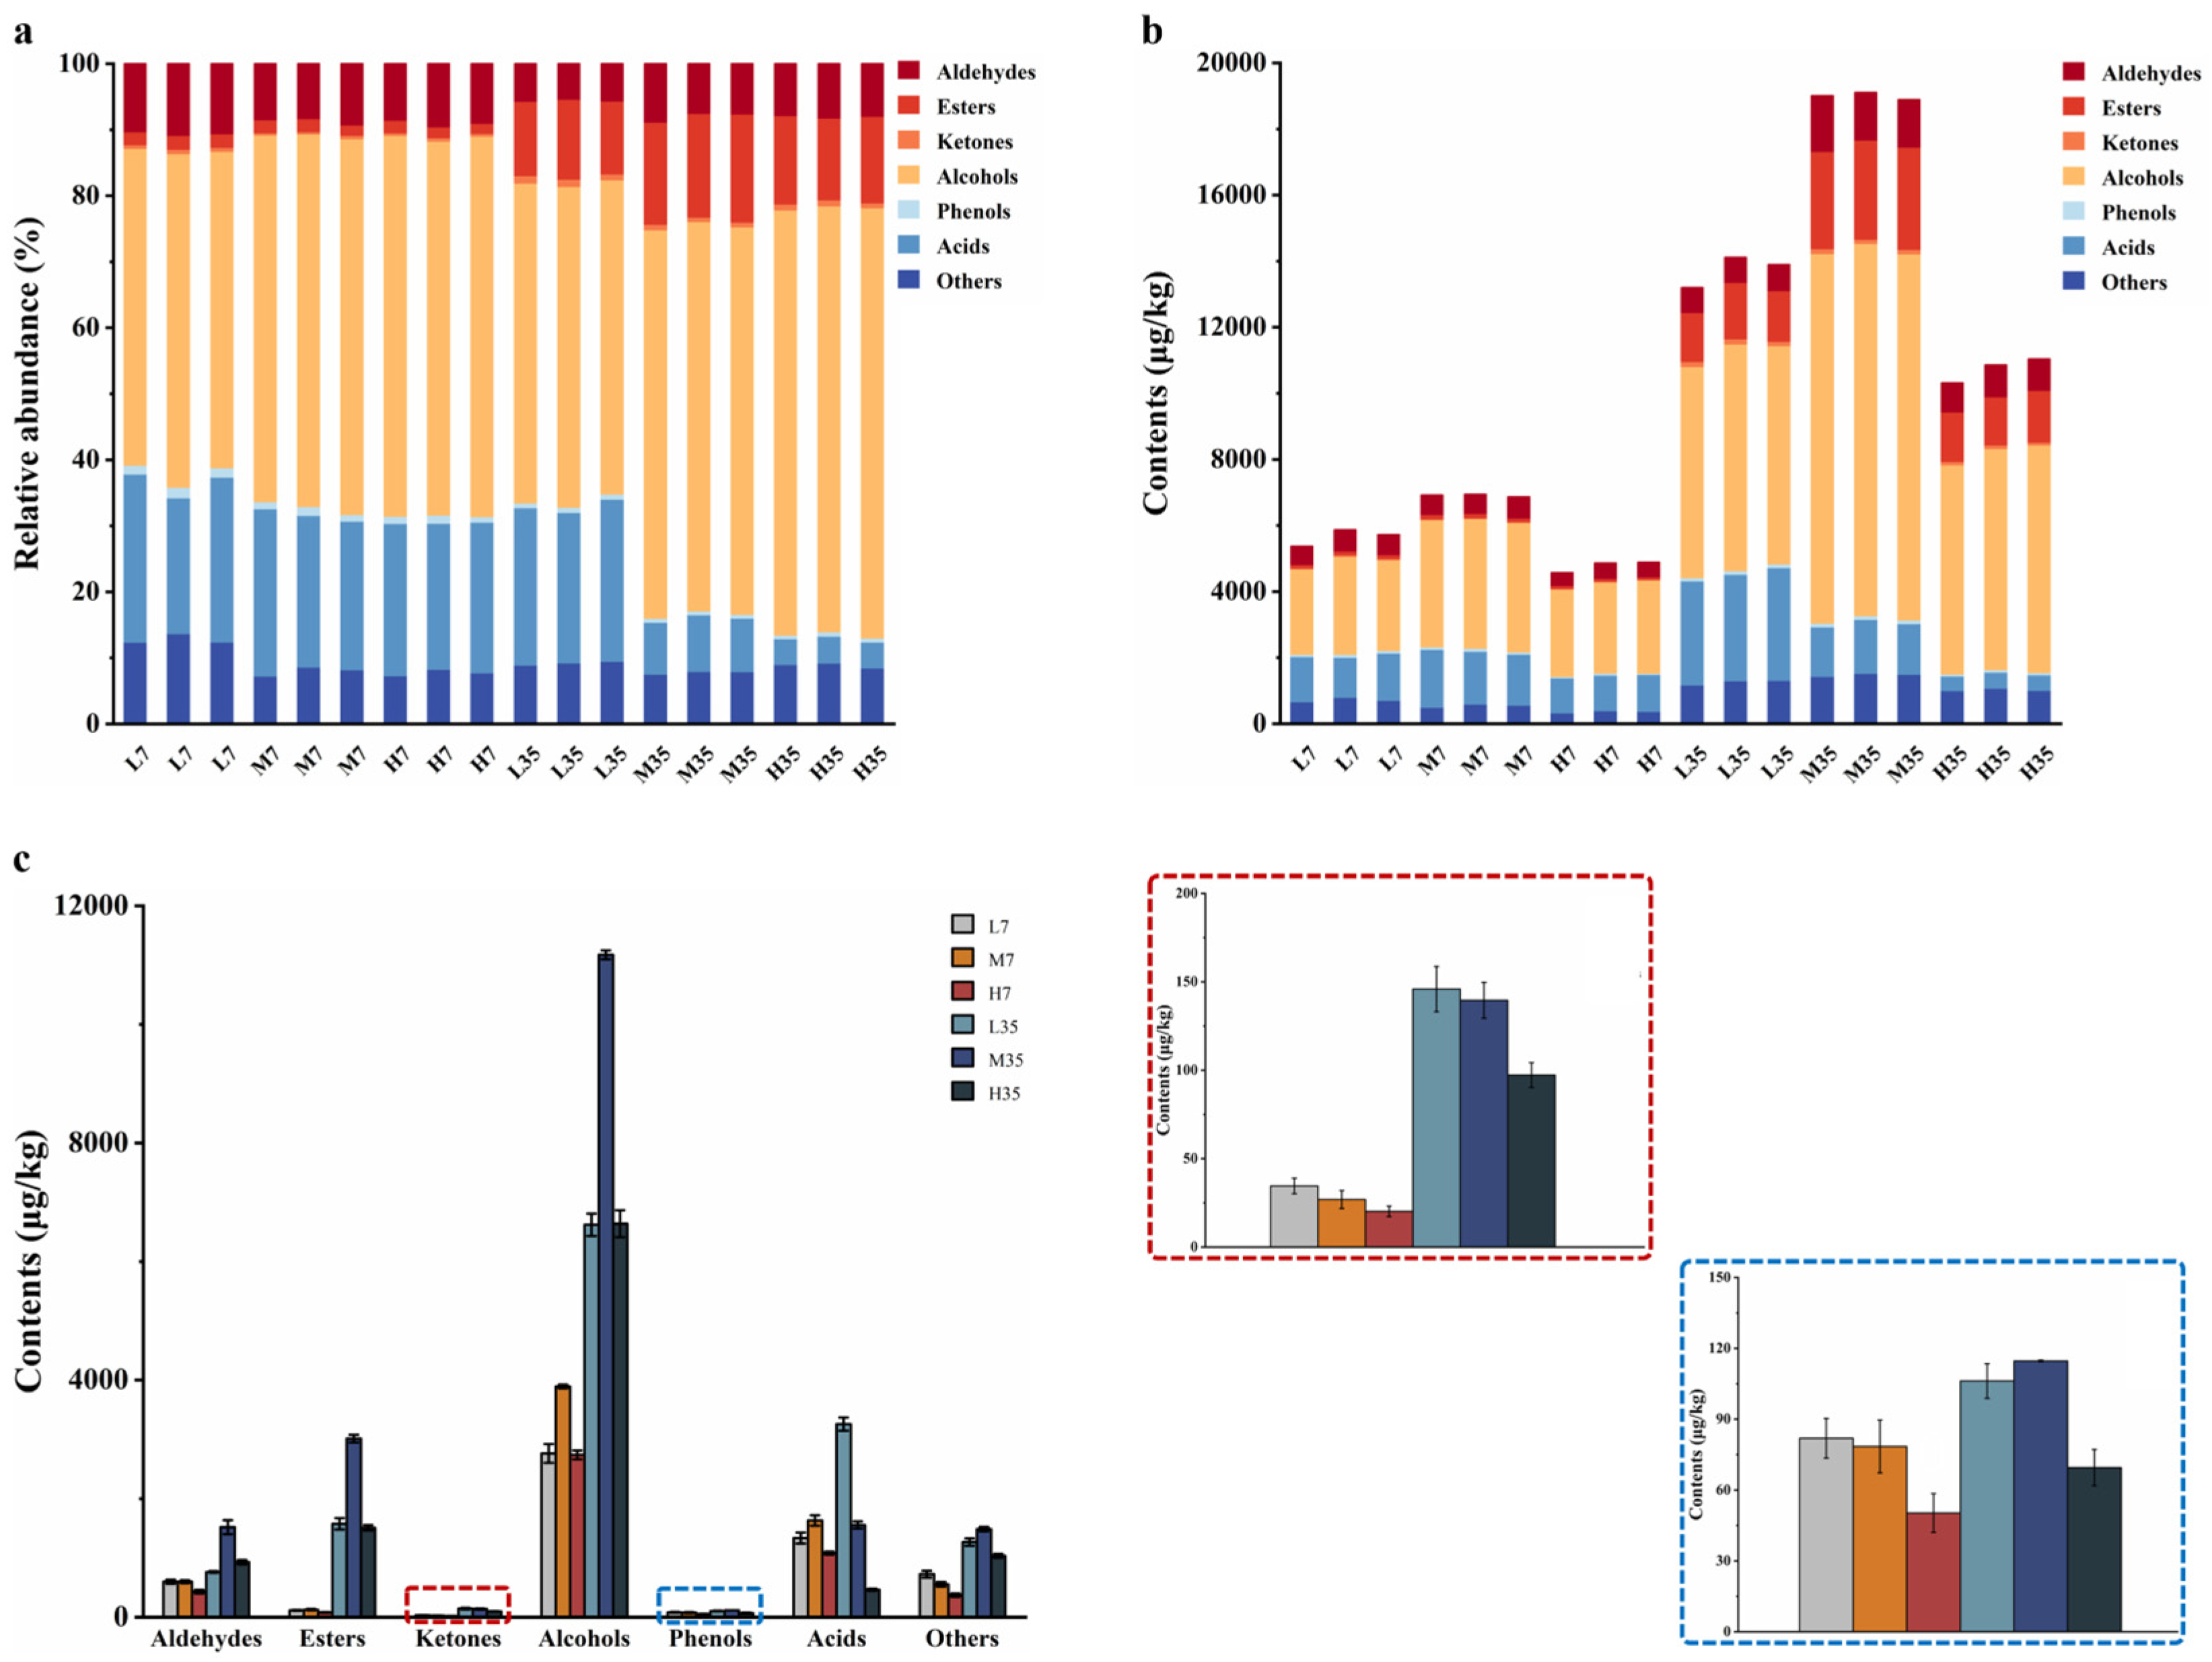
Volatile flavor compounds play a crucial role in determining the flavor and texture of fermented foods and are essential for their quality and consumer acceptance [40]. To further elucidate the differences in flavor compounds during the fermentation of BBP-meju with different salt concentrations, HS-SPME-GC×GC-MS was employed for detection and analysis in this study. The results showed that a total of 66 volatile flavor compounds were identified, which could be classified into 7 major groups, including 11 aldehydes, 12 esters, 4 ketones, 22 alcohols, 5 phenols, 6 acids, and 6 other compounds (Table 1). The relative abundance of the 7 groups of volatile flavor compounds in different meju samples, as well as the changes in their contents, were statistically presented in Figure 5. The total amount of volatile flavor compounds increased significantly during BBP-meju fermentation, with increases of 143.19% ± 4.14% (L), 174.94% ± 0.23% (M), and 124.90% ± 1.11% (H), respectively. Alcohols, esters, aldehydes, and acids consistently remained the main volatile flavor compounds in BBP-meju, and alcohols were always absolutely dominant. At the three different salt concentrations, the medium-salt (8%) meju had the highest content of volatile flavor compounds, while the high-salt (12%) meju had the lowest content (p<0.05), which differed from the reported by Yang et al. [17]. Specifically, the content of alcohols, acids, esters, ketones, and phenols in low and medium-salt meju was higher than that in high-salt meju. This result agreed with the study of Li et al. [4].
Alcohols in fermented foods originate from the metabolism of sugars and amino acids during microbial fermentation and are essential components that determine the flavor characteristics of BBP [41]. Compared to fermentation on day 7, the alcohol content in meju samples on day 35 significantly increased, from 2673.02±158.77 μg/kg (L), 3981.63±32.83 μg/kg (M), and 2937.76±74.01 μg/kg (H) to 6620.24±189.14 μg/kg (L), 11175.72±75.63 μg/kg (M), and 6637.19±226.84 μg/kg (H), respectively. 3-Methyl-1-butanol, 1-nonanol, 1-octen-3-ol, heptaethylene glycol, and glycerol were the most abundant alcohols in the meju samples on day 35. Among them, 3-methyl-1-butanol and 1-octen-3-ol were the key aroma-active compounds in BBP [40]. By day 35, the contents in the three different meju were medium-salt > low-salt > high-salt, characterizing that high-salt conditions inhibited the microbial growth associated with forming these two flavor compounds. 3-Methyl-1-butanol has a fatty aroma, while 1-octen-3-ol has a mushroom and fruity odor, and thus, salt-reduced fermentation may contribute to the accumulation of these two flavors in BBP-meju. However, 2,3-butanediol has intense creamy and fruity aromas, and its content increased with increasing salt concentration, suggesting that high-salt environments aided in forming and accumulating specific high-quality flavors.
Ethanol and fatty acids produced by microbial metabolism undergo esterification to generate ethyl acetate. Therefore, the higher level of ethanol in BBP-meju could explain the abundance of ethyl esters [32]. On the other hand, the esterification of fatty alcohols with acetic acid or the alcoholysis pathway with acetyl-CoA can generate acetate esters [42]. High levels of ethyl esters and acetate esters were detected in BBP-meju samples, including ethyl acetate, ethyl palmitate, ethyl phenylacetate, phenethyl acetate, ethyl isovalerate, isobutyl acetate, isoamyl acetate, collectively contributing to the fruity, sweet, and floral flavors in BBP-meju, while masking the bitter and pungent odors due to fatty acid and amino acid accumulation [43]. Among them, ethyl acetate was not detected on day 7. By day 35, higher levels of ethyl acetate were detected in both medium and low-salt meju samples at 4.04 ± 0.86 μg/kg (M) and 115.82 ± 4.42 μg/kg (L), respectively, while still not detected in high-salt meju. These results indicated that the gradual formation and accumulation of ethyl acetate accompanied the fermentation of BBP-meju. However, the high-salt environment inhibited the activity of the relevant microorganisms, thereby suppressing the accumulation of ethyl acetate in high-salt meju. Besides, ethyl phenylacetate, ethyl isovalerate, isobutyl acetate, isoamyl acetate, and ethyl palmitate all had the highest content in medium-salt meju, characterizing the promotion of specific salinity on the activity of associated microorganisms.
Acids and phenols have been reported to be the dominant flavor compounds in low-salt fermented BBP [4]. During fermentation, microorganisms degrade peptides, amino acids, and sugars in raw materials, converting them to pyruvate. Pyruvate is a critical intermediate in organic acid metabolism, further transforming into a large number of volatile organic acids, thereby significantly impacting the flavor of BBP [31]. By day 35, acetic acid and 3-methylbutanoic acid levels were higher in both low and medium-salt meju than in high-salt meju. Acetic acid and 3-methylbutanoic acid both have a sour taste and an unpleasant pungent odor, with 3-methylbutanoic acid being a typical sour and sweaty compound in BBP [40], affecting the taste and flavor of the final product. Similarly, the levels of phenol and 2,4-di-t-butylphenol in low and medium-salt meju were significantly higher than in high-salt meju, enhancing the pungent odors of BBP-meju. However, 4-hydroxy-3-methoxystyrene and 1-naphthalenol have sweet, floral, and smoky flavors, with the highest contents in the low and medium-salt meju, respectively, contributing to the high-quality flavor of low-salt fermented BBP-meju.
It is known that aldehydes and ketones have lower odor thresholds, significantly influencing the flavor characteristics of fermented foods [44]. Benzaldehyde, the most predominant aldehyde in BBP-meju, accumulated rapidly during fermentation and reached a concentration of 375.42 ± 26.64 μg/kg (L), 901.52±142.5 μg/kg (M), and 590.74±18.71 μg/kg (H), respectively, on the day 35. It was evident that the benzaldehyde content in high-salt meju was significantly lower than that in medium-salt meju (p < 0.05), consistent with the studies of Li et al. [4]. Additionally, phenylacetaldehyde, 2-phenyl-2-butenal, and hexanal had the highest abundance in medium-salt meju, with levels exceeding 100 μg/kg, contributing sweet, honey, and fruity flavors to BBP-meju, positively impacting the flavor of the final product. 3-Octanone was the major ketone in BBP-meju, with its content increasing as salt concentration decreased, imparting sweet and fruity flavors to low-salt fermented BBP-meju.
To identify the significantly different volatile flavor compounds during the fermentation of BBP-meju samples with different salt concentrations, partial least squares discriminant analysis (PLS-DA) was conducted, as shown in Figure S1. The values of R2X, Q2Y, and R2Y all exceeded 0.90, indicating the reliability of the PLS-DA model. According to the results, the different salt concentrations of BBP-meju samples exhibited good repeatability, with significant differences among samples on day 35 but no significant differences among samples on day 7. This result was in agreement with the results of the E-nose analysis. Furthermore, based on the threshold (i.e., p < 0.05 and Variable important in projection (VIP) > 1), 22 volatile flavor compounds were selected, including 9 alcohols, 5 aldehydes, 3 phenols, 2 esters, 1 acid, 1 ketone, and 1 ether, considered to play a key role in differentiating on the flavor of low-salt fermented BBP-meju.

3.6. Analysis of Microbial Community during Fermentation of BBP-Meju with Different Salt Concentrations

3.6.1. Analysis of Abundance of Microbial Community

To elucidate the effect of salt-reduced fermentation on the microbial community during BBP-meju fermentation, 18 meju samples with different salt concentrations were subjected to high-throughput sequencing using the Illumina NovaSeq platform. After quality filtering, primer sequence identification and removal, assembly, and removal of chimeras, the high-quality sequences for bacteria and fungi were 37,236 -70,391 and 61,232-77,852, accounting for 80.27%-91.45% and 95.04%-97.50% of the effective sequences, respectively, as shown in Table 2. The Shannon index curve and rarefaction curve can reflect the microbial diversity of each sample at different sequencing depths and indirectly indicate species abundance. A flat curve indicates a sufficient sequencing depth where the feature abundance does not increase with additional sequencing. In contrast, a non-flat curve indicates unsaturation, suggesting that increasing data volume may reveal more features [45]. The results showed that the Shannon index curve and the rarefaction curve flattened for the different salt concentrations of BBP-meju, indicating that the sequencing depth could characterize the microbial diversity within the samples (Figure S2).
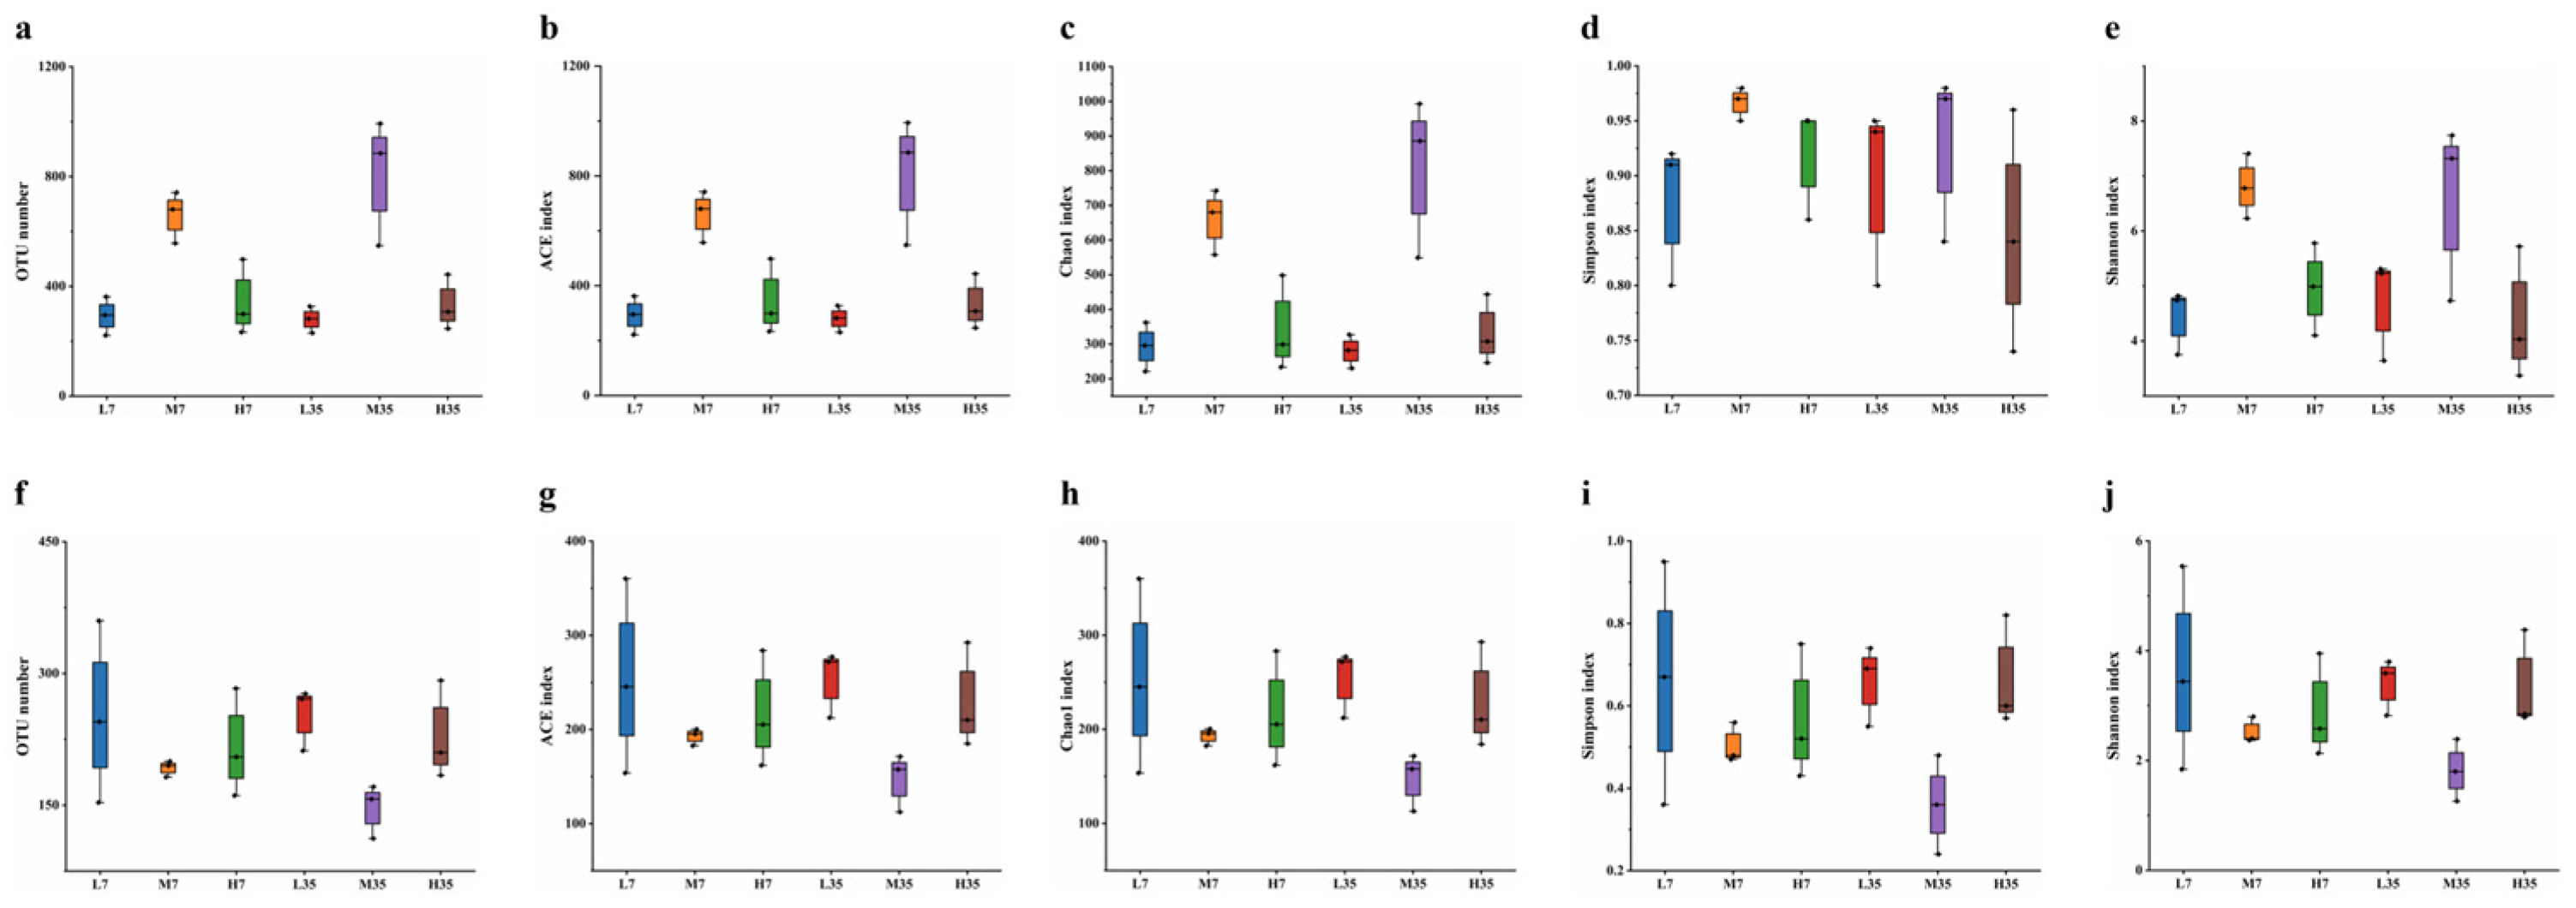
At a similarity level of 97% using USEARCH, sequences were clustered. OTUs were filtered at a threshold of 0.005% of all sequences, resulting in a total of 8,148 bacterial OTUs and 3,870 fungal OTUs. The coverage of all BBP-meju samples exceeded 99.90%, indicating that almost all sequences in the samples were detected. This result could effectively reflect the microbial community characteristics of BBP-meju samples with different salt concentrations (Table S2 and Figure 6). The species abundance of microbial communities in BBP-meju samples with different salt concentrations was further characterized by the ACE index and Chao1 index, while the species diversity was characterized by Simpson and Shannon indices [46]. The results indicated that bacterial OTUs were greater than fungal OTUs in all meju samples, suggesting a higher abundance of bacteria than fungi, consistent with previous reports [17]. During the fermentation, the abundance and diversity of bacterial communities in medium-salt meju were consistently higher than those in low and high-salt meju. In contrast, the highest abundance and diversity of fungal communities were found in low-salt meju, followed by high-salt meju, and the lowest in medium-salt meju. These findings suggested that moderate salt-reduced fermentation contributed to the proliferation and succession of bacterial and fungal communities in BBP-meju, while deficient salt levels could lead to dysbiosis of the internal flora of the meju, resulting in reduced levels of abundance and diversity.

3.6.2. Analysis of Microbial Community Structure

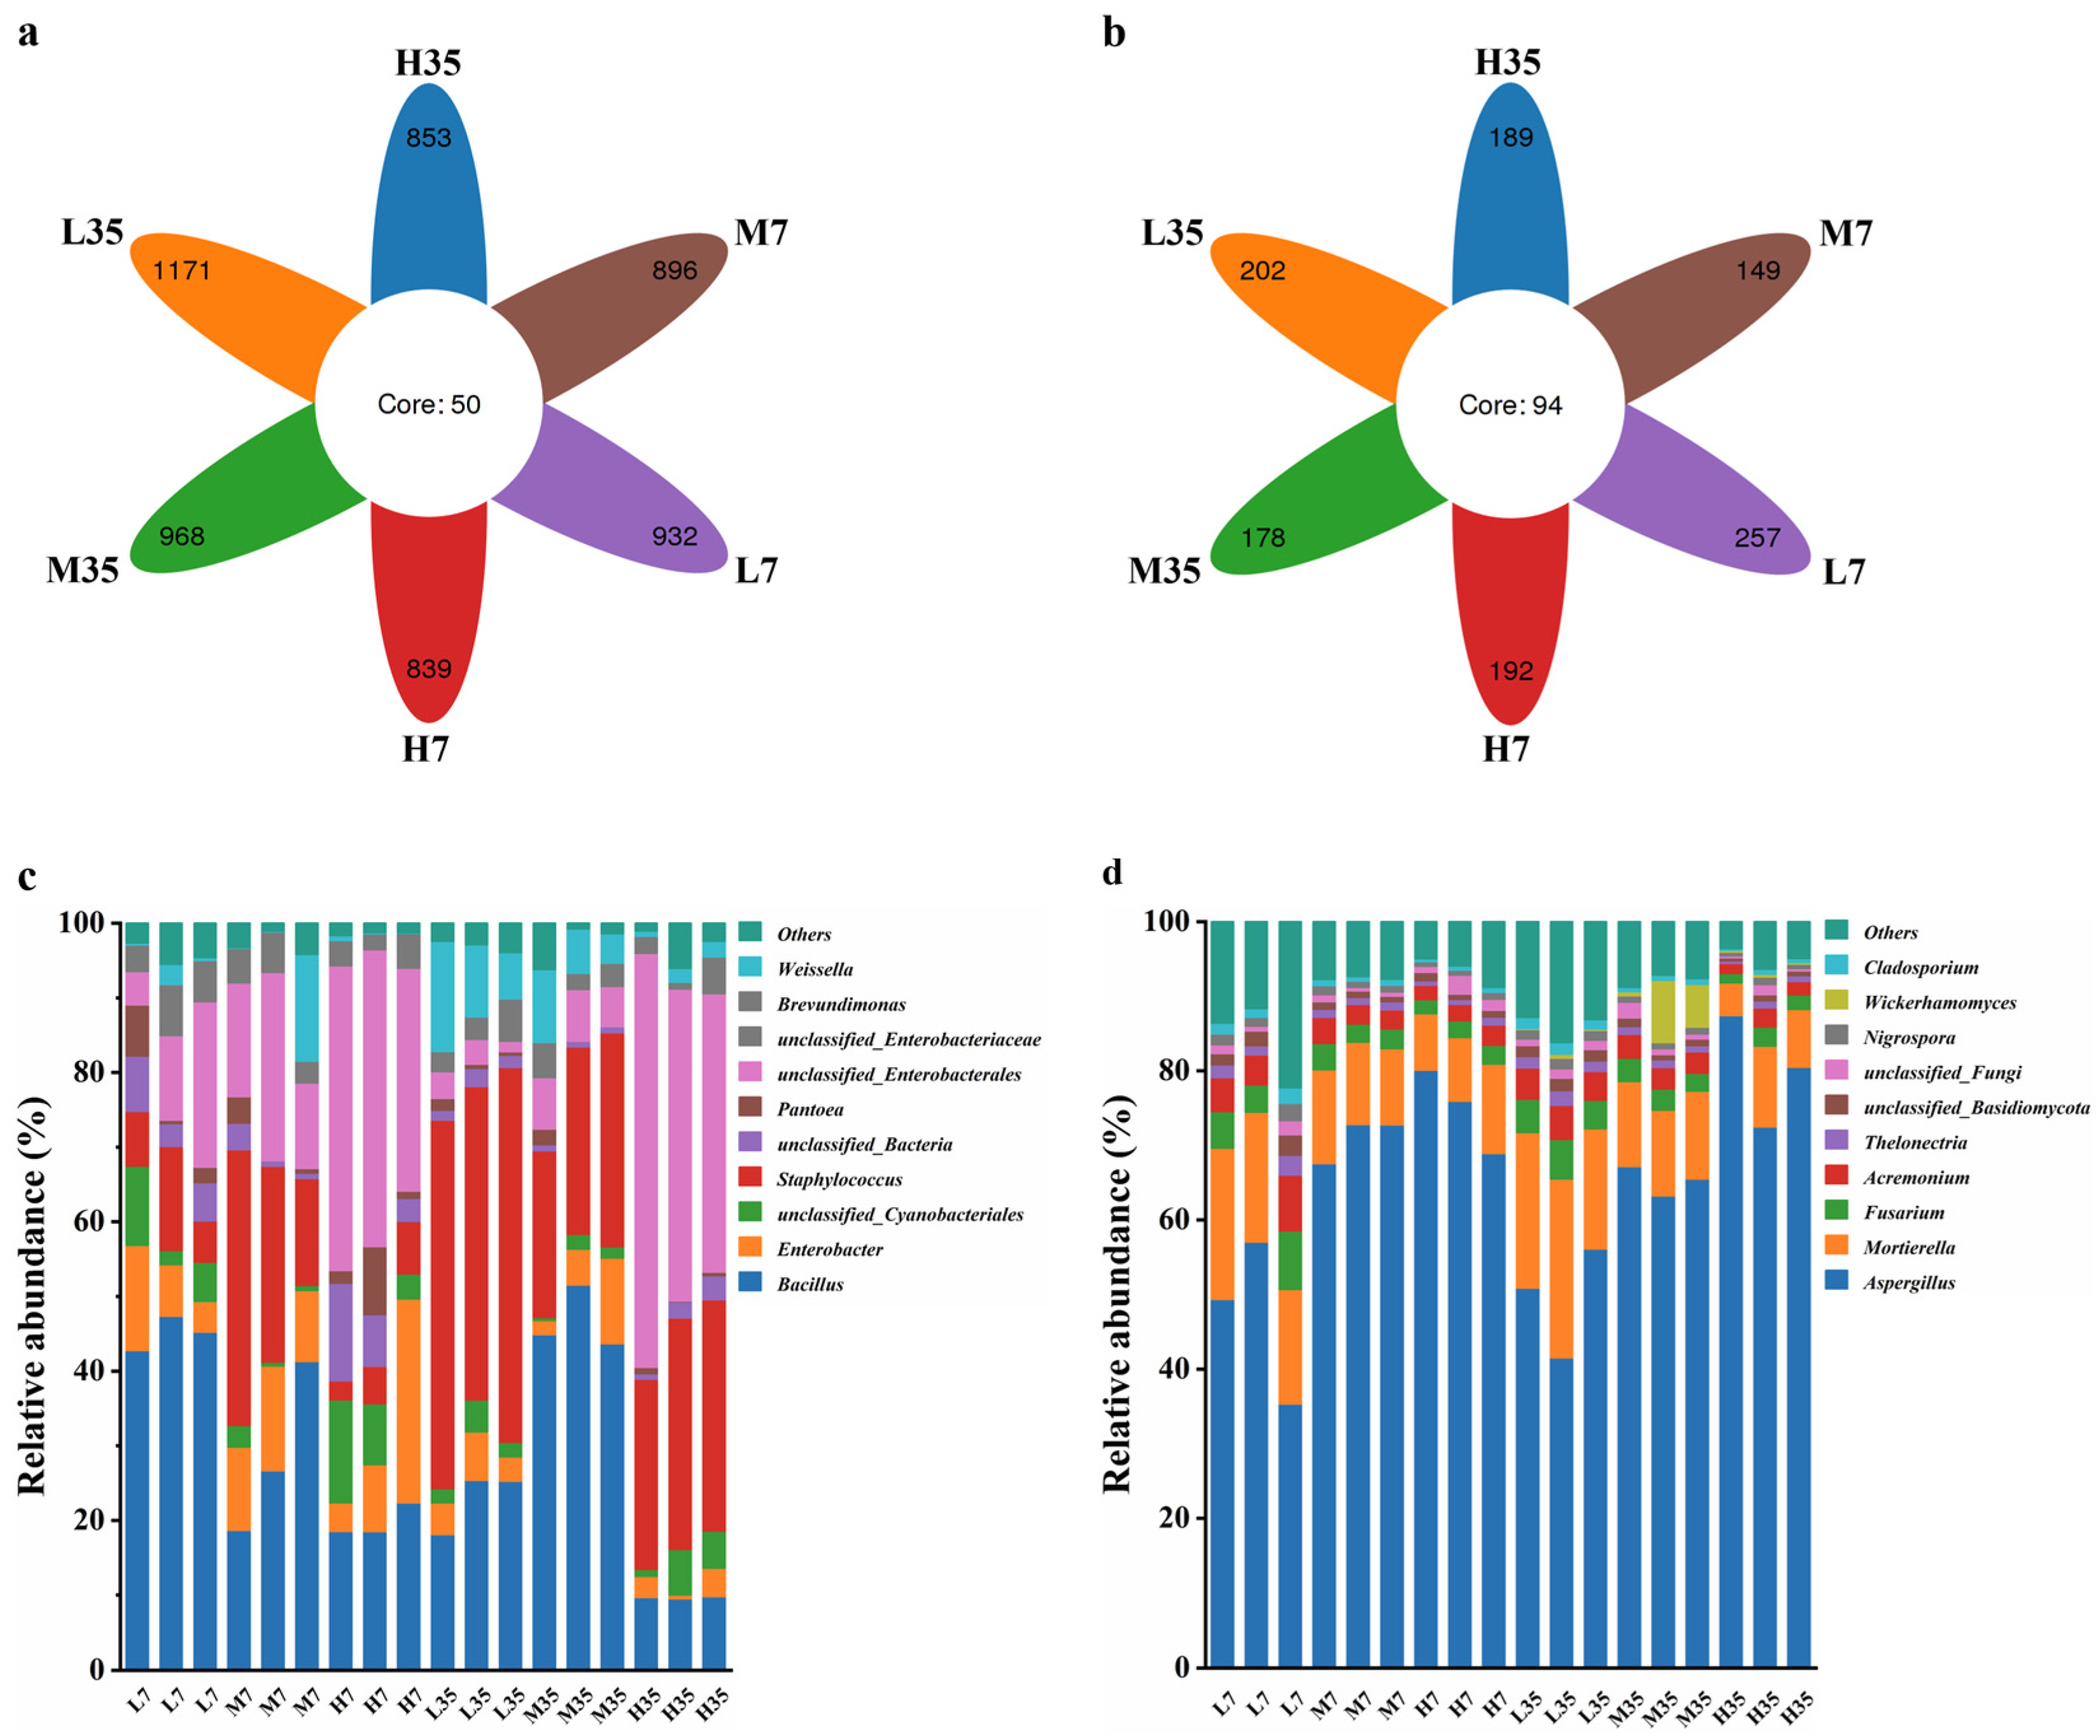
Differential analysis of OTUs for BBP-meju samples with different salt concentrations was conducted, and the results were shown in Figure 7. It can be seen that the unique bacterial OTU numbers in L7, M7, H7, L35, M35, and H35 samples were 932, 896, 839, 1171, 968, and 853, respectively, while the shared bacterial OTU number was 50. Relative to fungi, the number of unique fungal OTUs in each BBP-meju sample was notably lower than in bacteria, however, the shared fungal OTU number was 94, significantly higher than the bacterial community. This result suggested a higher similarity in the fungal community during the fermentation with different salt concentrations. Nevertheless, the overall abundance of the bacterial community was significantly higher than the fungal community, with more pronounced differentiation across different salt concentrations.
According to the histograms of the distribution of bacterial communities at genus level during BBP-meju fermentation with different salt concentrations, the top 10 relatively abundant bacterial genera were Bacillus, Enterobacter, unclassified_Cyanobacteriales, Staphylococcus, unclassified_Bacteria, Pantoea, unclassified_Enterobacterales, unclassified_Enterobacteriaceae, Brevundimonas, and Weissella. Among them, Bacillus was the dominant bacterial community in all BBP-meju samples. On day 7, Bacillus exhibited the highest relative abundance in low-salt meju, ranging from 42.76% to 47.34%, whereas its highest abundance was reached in medium-salt meju on the 35 (43.66%-51.51%). Bacillus was reported to be a functional core microbial community during BBP fermentation, which secreted abundant proteolytic enzymes, leading to the accumulation of flavor compounds, such as amino acids, crucial for the distinctive flavor formation of BBP [41]. Thus, the high abundance of Bacillus on day 7 may explain the rapid increase in AAN levels in early-stage fermentation, while the decrease in Bacillus abundance on day 35 corresponded to the decline in AAN levels in middle and late fermentation. Meanwhile, the low-salt conditions could alleviate the osmotic stress of salt concentration on microorganisms and their secreted proteases, which caused the elevation of amino acid levels in low-salt meju. Aside from Bacillus, Staphylococcus is also a core dominant microbiota during BBP fermentation, which is one of the key factors influencing the flavor and quality of the BBP [47]. The relative abundance of Staphylococcus in BBP-meju increased significantly as fermentation progressed. On day 7, the relative abundance of Staphylococcus in medium-salt meju ranged from 14.32% to 36.92%, the highest among the three salt concentrations. However, by day 35, the relative abundance of Staphylococcus in low-salt meju reached 41.93%-50.21%, significantly higher than that in medium and high-salt meju (p < 0.05). It is known that the growth of Staphylococcus can cause the accumulation of large amounts of acids during BBP fermentation [48], explaining the consistency of the differential succession of Staphylococcus in BBP-meju at different salt concentrations with the trend of acid substances shown in Figure 5. Notably, three opportunistic pathogens, Enterobacter, Pantoea, and Brevundimonas, were also found among these genera. The relative abundance of all three bacterial genera showed a decreasing trend during BBP-meju fermentation and further decreased with increasing salt concentration. This result suggested that high-salt conditions could effectively inhibit the propagation of pathogenic microorganisms, while the salt-reduced fermentation of BBP will provide a favorable environment for the growth of opportunistic pathogens, posing a threat to human health and increasing food safety risks of BBP products.
In terms of fungi, the 10 fungal genera with the highest relative abundance were Aspergillus, Mortierella, Fusarium, Acremonium, Thelonectria, unclassified_Basidiomycota, unclassified_Fungi, Nigrospor, Wickerhamomyces, and Cladosporium. Aspergillus and Mortierella constituted the dominant fungal communities in all BBP-meju samples. The high levels of Aspergillus in BBP-meju were mainly due to its use as a starter for koji production. Aspergillus is known to secrete amylases, proteases, and other enzymes, leading to the formation and accumulation of numerous flavor compounds during BBP fermentation, while also creating suitable conditions for the growth of other microorganisms in the later stages of fermentation [49]. The results showed that the relative abundance of Aspergillus was relatively stable during fermentation, reaching 41.51%-56.11% (L), 63.25%-67.16% (M), and 72.49%-87.42% (M), respectively, by day 35. This indicated that Aspergillus demonstrated good adaptability to the high-salt environment in BBP-meju. However, the metabolism of Aspergillus is closely linked to the development of musty and metallic off-flavors in BBP, along with the presence of mycelium in the final product, consequently affecting consumer acceptance [50]. Mortierella is capable of producing polyunsaturated fatty acids and exhibits inhibitory effects on some pathogens [51]. The relative abundance of Mortierella did not change significantly during fermentation, but decreased significantly with increasing salt concentrations, in contrast to Aspergillus. This suggested that the high osmotic pressure under high-salt conditions exerted inhibitory effects on the growth of Mortierella, while salt-reduced fermentation provided suitable conditions for the accumulation of flavor compounds in BBP-meju.
Bacillus, Staphylococcus, Aspergillus, and Mortierella were the predominant microbial communities during BBP-meju fermentation. Reducing salt concentrations promoted the growth of Bacillus, Staphylococcus, and Mortierella, while inhibiting the growth of Aspergillus. Therefore, salt-reduced fermentation facilitated the production of flavor compounds such as amino acids and organic acids and attenuated the musty taste of Aspergillus.

3.7. Correlation of Microbial Community with Volatile Flavor Compounds

Based on the Spearman correlation coefficient, correlation clustering heatmaps and correlation network diagrams were used to reveal the potential correlations between dominant microbial communities and 22 key volatile flavor compounds with P<0.05 and VIP>1, aiming to capture the core microbial community in the salt-reduced fermentation. The results showed that the 20 dominant microbial genera could be classified into five categories, A, B, C, D, and E, while the 22 key volatile flavor compounds could be classified into six categories, F, G, H, I, J, and K (Figure 8A). The microbial genera of class B were significantly negatively correlated with isobutanol (V17) and 1-naphthalenol (V19) in flavor compounds class F, but significantly positively correlated with the flavor compounds of class J; microbial genera of class C showed a significant positive correlations with the flavor compounds of classes I and J, however, Enterobacter (M2) in this group exhibited a significant negative correlation with the flavor compounds of class G; the microbial genera of class D were significantly negatively correlated with the flavor compounds of class J and K, but showed a significant positive correlation with isobutanol (V17); microbial genera of class E were significantly positively correlated with flavor compounds of classes G and K. Furthermore, according to the correlation network diagram, 16 dominant microbial genera were significantly correlated with 17 key volatile flavor compounds (p < 0.01, |ρ| > 0.6) (Figure 8B). Wickerhamomyces (M19), Bacillus (M1), Staphylococcus (M4), and Mortierella (M12) all showed highly significant positive correlations with ≥3 volatile flavor compounds, implying their crucial roles in the formation of characteristic flavors in different salt concentrations BBP-meju [52]. These results agreed with the high-throughput sequencing results, again emphasizing the importance of Bacillus, Staphylococcus, and Mortierella. Wickerhamomyces (M19) is a dominant fungal community in traditional fermented foods, such as kimchi, sour pork, and sourdough, known for its ability to secrete proteases that hydrolyze proteins in raw materials into peptides and amino acids, further converting them into various flavor compounds, adding freshness to the products and coordinating the overall aroma characteristics of fermented foods [53,54]. Research by Chen et al. [55] indicated that Wickerhamomyces (M19) was positively correlated with esters such as ethyl acetate, heptadecanoic acid ethyl ester, ethyl tridecanoate, and decanoic acid ethyl ester, especially a high-quality producer of ethyl acetate [56]. In this study, Wickerhamomyces (M19) showed significantly positive correlations with ethyl acetate (V6), pentyl acetate (V7), 1-nonanol (V10), 3-methylthiopropanol (V14), 2,3-butanediol (V15), glycerol (V16), and 1-naphthalenol (V19), while exhibiting a significantly negative correlation with crotonaldehyde (V2). Meanwhile, the relative abundance of Wickerhamomyces (M19) increased gradually during fermentation, with the highest abundance in medium-salt meju and the lowest in low-salt meju. It is known that Wickerhamomyces (M19) has a good tolerance to high osmotic pressure [57]. Therefore, the high abundance of Wickerhamomyces (M19) in medium-salt meju contributed to the accumulation of fruity, sweet, and other quality flavors and attenuated the harsh flavors caused by crotonaldehyde (V2). Apart from Wickerhamomyces (M19), Staphylococcus (M4) and Weissella (M10) were significantly positively correlated with ethyl acetate (V6) and pentyl acetate (V7). This suggested a synergistic effect among Wickerhamomyces (M19), Staphylococcus (M4), and Weissella (M10), collectively promoting the formation of ester flavors. Figure 7C demonstrated that the relative abundance of both Staphylococcus (M4) and Weissella (M10) increased with decreasing salinity up to day 35, suggesting that salt-reduced fermentation promoted the growth of microbial genera associated with the synthesis of ester flavor compounds, thus contributing positively to the overall flavor of BBP-meju. Similarly, within microbial class B, Mortierella (M12), Fusarium (M13), Acremonium (M14), Thelonectria (M15), Nigrospora (M18), and Cladosporium (M20) were all significantly positively correlated with 1-indanone (V8) and acetic acid (V21), while showing a significant negative correlation with isobutanol (V17). By day 35, the relative abundance of all the above microbial genera increased with decreasing salt concentration, suggesting that salt reduction could alleviate the inhibition of their growth by high osmotic pressure, further promoting the accumulation of acidic flavors through synergistic effects and inhibiting off-flavors produced by isobutanol (V17). As the absolute dominant bacterial genus in all meju samples, Bacillus (M1) showed a highly significant positive correlation with phenylacetaldehyde (V1), nonanal (V3), 1-indanone (V8), and 2,4-di-t-butylphenol (V20), while showing a significant negative correlation with isobutanol ( V17) (p<0.05). This result aligned with the positive correlation of Bacillus with most of the high-quality volatile flavor compounds reported by Yang et al. [17]. Meanwhile, Bacillus (M1) could, to some extent, suppress the production of the unpleasant compound isobutanol (V17), further facilitating the formation of high-quality flavors in BBP-meju during salt-reduced fermentation. Notably, as a dominant fungal community in the fermentation of BBP-meju, Aspergillus (M11) was significantly negatively correlated with nonanal (V3), ethyl acetate (V6), 1-indanone (V20), and acetic acid (V21), while showing a significant positive correlation with isobutanol (V17). Thus, high levels of Aspergillus (M11) in high-salt meju would be detrimental to the formation and accumulation of high-quality flavor compounds.
In conclusion, the key microbial genera Bacillus, Staphylococcus, and Mortierella in BBP-meju all play critical roles in forming high-quality volatile flavor compounds. They may be the core functional microbiota in the fermentation process of BBP-meju, which is essential for forming its characteristic flavors. Furthermore, salt-reduced fermentation further accumulated high-quality flavor compounds in BBP-meju, positively impacting its characteristic flavor development.

4. Conclusions

This study comprehensively investigated the physicochemical properties, volatile flavor compounds, and microbial community dynamics during BBP-meju fermentation with different salt concentrations and further analyzed the correlation between the dominant microbial communities and key volatile flavor compounds. The results indicated that the salt reduction contributed to the accumulation of AAN, reducing sugars, FAAs, OAs, and volatile flavor compounds during BBP-meju fermentation, while also increasing the total acid level. High-throughput sequencing results revealed that Bacillus, Staphylococcus, Aspergillus, and Mortierella were the dominant microbial communities during fermentation. Except for Aspergillus, their relative abundance was elevated in salt-reduced fermentation and positively correlated with several high-quality flavor compounds. However, the presence of higher levels of opportunistic pathogens in the low-salt meju posed a threat to the safety of the final product. These results provided a theoretical basis for the quality and safety control of BBP during salt-reduced fermentation, as well as a guideline for further developing the low-salt fermented food industry.

Supplementary Materials

The following supporting information can be downloaded at the website of this paper posted on Preprints.org, Table S1: The sensitivities of sensors contained in the PEN3 electronic nose sensor array.; Figure S1: PLS-DA diagram results of volatile flavor compounds during fermentation of BBP-meju with different salt concentrations; Figure S2: Rarefaction curves and shannon index curve for bacteria (a-b) and fungi (c- d).; Table S2: The α-diversity of bacterial and fungal community during fermentation of BBP-meju with different salt concentrations.

Author Contributions

Conceptualization, Q. G.; methodology, J. P. and J. Z.; software, J. Z. and J, L.; validation, Q. G., Y. H. and B. S.; formal analysis, J. P. and J. L.; investigation, J. P. and J. L.; resources, Y. H.; data curation, J. P. and J. Z.; writing - original draft preparation, Q. G.; writing - review and editing, J. P., J. Z., Y. H. and B. S.; visualization, J. Z. and J. L.; supervision, Q. G., Y. H. and B. S.; project administration, B. S.; funding acquisition, Q. G.; All authors have read and agreed to the published version of the manuscript.

Funding

This research was funded by the Natural Science Foundation Program of Sichuan Province, grant number 2023NSFSC1205 and the Talent Introduction Project of Xihua University, grant number Z211045.

Institutional Review Board Statement

Not applicable.

Informed Consent Statement

Not applicable.

Data Availability Statement

Data are contained within the article and Supplementary Materials.

Conflicts of Interest

The authors declare no conflicts of interest.

References

  1. Qiao, Y.; Zhang, K.; Zhang, Z.; Zhang, C.; Sun, Y.; Feng, Z. Fermented soybean foods: A review of their functional components, mechanism of action and factors influencing their health benefits. Food Res. Int 2022, 158, 111575. [Google Scholar] [CrossRef] [PubMed]
  2. Lu, Y.; Chi, Y.; Lv, Y.; Yang, G., & He, Q. Evolution of the volatile flavor compounds of chinese horse bean-chili-paste. LWT 2019, 102, 131-135. [CrossRef]
  3. Lu, Y.; Yang, L.; Yang, G.; Chi, Y.; Sun, Q., & He, Q. Insight into the fermentation of chinese horse bean-chili-paste. Food Rev. Int 2020, 37, 1-23. [CrossRef]
  4. Li, H.; Deng, W.; Lu, Z.; Li, X.; Fan, Z.; Zhang, Q.; Chen, G.; Li, Q.; Ma, Y., & Xu, Z.-H. Salinity plays a dual role in broad bean paste-meju fermentation. LWT 2023, 173, 114181. [CrossRef]
  5. Lu, Y.; Tan, X.; Lv, Y.; Yang, G.; Chi, Y., & He, Q. Physicochemical properties and microbial community dynamics during chinese horse bean-chili-paste fermentation, revealed by culture-dependent and culture-independent approaches. Food Microbiol 2020, 85, 103309. [CrossRef]
  6. Li, M.; Fan, W., & Xu, Y. Identification of angiotensin converting enzyme (ace) inhibitory and antioxidant peptides derived from pixian broad bean paste. LWT 2021, 151, 112221. [CrossRef]
  7. Lin, H.; Zhao, J.; Xie, Y.; Tang, J.; Wang, Q.; Zhao, J.; Xu, M., & Liu, P. Identification and molecular mechanisms of novel antioxidant peptides from fermented broad bean paste: A combined in silico and in vitro study. Food Chem 2024, 450, 139297. [CrossRef]
  8. Sichuan Province, Chengdu City, Pi County Technical Supervision Committee; PI County Food Industry Association; Sichuan Pixian Douban Co., & Sichuan Dandan Seasoning Co. 2015. Product of geographical indication-Pixian douban. In (vol GB/T 20560-2006, pp.1): General Administration of Quality Supervision, Inspection and Quarantine of the People‘s Republic of China; National Standardization Administration of China.
  9. Wu, M.; Wu, X.; Zhu, J.; Li, F.; Wei, X. , & Wang, Y. Selenium-enriched and ordinary green tea extracts prevent high blood pressure and alter gut microbiota composition of hypertensive rats caused by high-salt diet. Food Sci. Hum. Wellness 2022, 11(3), 738–751. [Google Scholar] [CrossRef]
  10. Lin, X.; Tang, Y.; Hu, Y.; Lu, Y.; Sun, Q.; Lv, Y.; Zhang, Q.; Wu, C.; Zhu, M.; He, Q., & Chi, Y. Sodium reduction in traditional fermented foods: Challenges, strategies, and perspectives. J. Agric. Food Chem 2021, 69 (29), 8065-8080. [CrossRef]
  11. Chen, H. C.; Cao, J.; Zhang, Y.; Ma, Y.; Zhang, L.; Su, X.; Gao, L., & Jing, Y. High salt diet exacerbates cognitive deficits and neurovascular abnormalities in app/ps1 mice and induces ad-like changes in wild-type mice. J. Nutr. Biochem 2024, 125, 109570. [CrossRef]
  12. Webster, J.; Trieu, K.; Dunford, E., & Hawkes, C. Target salt 2025: A global overview of national programs to encourage the food industry to reduce salt in foods. Nutrients 2014, 6, 3274-3287. [CrossRef]
  13. National Nutrition Program (2017-203). Acta Nutrimenta Sinica 2017, 39(04), 315–320. [CrossRef]
  14. Codina, G.; Voinea, A., & Dabija, A. Strategies for reducing sodium intake in bakery products, a review. Appl. Sci 2021, 11, 3093. [CrossRef]
  15. Chun, B. H.; Kim, K. H.; Jeong, S. E., & Jeon, C. O. The effect of salt concentrations on the fermentation of doenjang, a traditional korean fermented soybean paste. Food Microbiol 2020, 86, 103329. [CrossRef]
  16. Jiang, L.; Shen, S.; Zuo, A.; Chi, Y.; Lu, Y., & He, Q. Unveiling the aromatic differences of low-salt chinese horse bean-chili-paste using metabolomics and sensomics approaches. Food Chem 2024, 445, 138746. [CrossRef]
  17. Yang, Y.; Niu, C.; Shan, W.; Zheng, F.; Liu, C.; Wang, J., & Li, Q. Physicochemical, flavor and microbial dynamic changes during low-salt doubanjiang (broad bean paste) fermentation. Food Chem 2021, 351, 128454. [CrossRef]
  18. Lin, H.; Liao, S.; Zhou, Z.; Yan, Z.; Zhao, J.; Xiang, Y.; Xu, M.; Zhao, J.; Liu, P.; Ding, W.; Rao, Y. , & Tang, J. Investigation into the potential mechanism of bacillus amyloliquefaciens in the fermentation of broad bean paste by metabolomics and transcriptomics. Food Res. Int. 2024, 183, 114202. [Google Scholar] [CrossRef] [PubMed]
  19. Kim, M. J.; Kwak, H. S., & Kim, S. S. Effects of salinity on bacterial communities, maillard reactions, isoflavone composition, antioxidation and antiproliferation in korean fermented soybean paste (doenjang). Food Chem 2018, 245, 402-409. [CrossRef]
  20. Liang, J.; Li, D.; Shi, R.; Wang, J.; Guo, S.; Ma, Y. , & Xiong, K. Effects of microbial community succession on volatile profiles and biogenic amine during sufu fermentation. LWT 2019, 114, 108379. [Google Scholar] [CrossRef]
  21. Zhao, C.; Kim, D., & Eun, J. Physicochemical properties and bacterial community dynamics of hongeo, a korean traditional fermented skate product, during fermentation at 10 °c. LWT 2019, 104, 109-119. [CrossRef]
  22. Gil, N. Y.; Song, J.; Eom, J.; Park, S. Y., & Choi, H. S. Changes of physicochemical properties of cheonggukjang prepared with various soybean cultivars and bacillus subtilis hj18-9. Korean J. Food Preserv. 2016, 23, 811-818. [CrossRef]
  23. DuBois, M.; Gilles, K. A.; Hamilton, J. K.; Rebers, P. A. , & Smith, F. Colorimetric method for determination of sugars and related substances. Anal. Chem. 1956, 28(3), 350–356. [Google Scholar] [CrossRef]
  24. Ding, W.; Ye, X.; Zhao, X.; Liu, Y.; Zhang, M.; Luo, Y.; Xiong, Y.; Liu, Y.; Che, Z.; Lin, H.; Huang, J., & Tang, X. Fermentation characteristics of pixian broad bean paste in closed system of gradient steady-state temperature field. Food Chem 2022, 374, 131560. [CrossRef]
  25. Lin, H.; Yu, X.; Fang, J.; Lu, Y.; Liu, P.; Xing, Y.; Wang, Q.; Che, Z. , & He, Q. Flavor compounds in pixian broad-bean paste: Non-volatile organic acids and amino acids. Molecules (Basel, Switzerland) 2018, 23, 1299. [Google Scholar] [CrossRef] [PubMed]
  26. Gao, L.; Liu, T.; An, X.; Zhang, J.; Ma, X., & Cui, J. Analysis of volatile flavor compounds influencing chinese-type soy sauces using gc–ms combined with hs-spme and discrimination with electronic nose. J. Food Sci. Technol. 2017, 54. [CrossRef]
  27. Xu, D.; Wang, P.; Zhang, X.; Zhang, J.; Sun, Y.; Gao, L. , & Wang, W. High-throughput sequencing approach to characterize dynamic changes of the fungal and bacterial communities during the production of sufu, a traditional chinese fermented soybean food. Food Microbiol. 2020, 86, 103340. [Google Scholar] [CrossRef]
  28. Li, Z.; Zhao, C.; Dong, L.; Zhang, F.; Wang, X.; Zhao, S., & Li, L. Impact of nacl on physicochemical properties, microbial community, and pathogen surveillance in the chinese traditional fermented broad bean (vicia faba l.) paste. LWT 2024, 199, 116071. [CrossRef]
  29. Zhang, L.; Xiong, S.; Du, T.; Xiao, M.; Peng, Z.; Xie, M.; Guan, Q. , & Xiong, T. Effects of microbial succession on the dynamics of flavor metabolites and physicochemical properties during soy sauce koji making. Food Biosci 2023, 53, 102636. [Google Scholar] [CrossRef]
  30. Shukla, S.; Park, J.; Kim, D. H.; Hong, S. Y.; Lee, J. S., & Kim, M. Total phenolic content, antioxidant, tyrosinase and α-glucosidase inhibitory activities of water soluble extracts of noble starter culture doenjang, a korean fermented soybean sauce variety. Food Control 2016, 59, 854-861. [CrossRef]
  31. Zhang, P.; Zhang, P.; Wu, J.; Tao, D., & Wu, R. Effects of leuconostoc mesenteroides on physicochemical and microbial succession characterization of soybean paste, da-jiang. LWT 2019, 115, 108028. [CrossRef]
  32. Yu, S.; Song, J.; Hu, T.; Wang, J.; Liu, X.; Zheng, Y.; Shi, L.; Wan, S. , & Wang, M. Unraveling the core functional bacteria and their succession throughout three fermentation stages of broad bean paste with chili. Food Sci. Hum. Wellness 2022, 11(4), 874–885. [Google Scholar] [CrossRef]
  33. Jo, Y.; Bang, W.; Kim, M.K. Changes of physiochemical and enzymatic activities of doenjang prepared with different amount of rice koji during 30 days of fermentation. Foods 2021, 10(2), 372. [Google Scholar] [CrossRef] [PubMed]
  34. Zhao, C. J.; Schieber, A., & Gänzle, M. G. Formation of taste-active amino acids, amino acid derivatives and peptides in food fermentations – a review. Food Res. Int. 2016, 89, 39-47. [CrossRef]
  35. Wang, D. (2013). Catalytic kinetics of Aspergillus oryzae protease in high-salt environment and its application in soy sauce fermenation. Jiangna n University 2013.
  36. Shukla, S.; Choi, T. B.; Park, H.-K.; Kim, M.; Lee, I. K., & Kim, J.-K. Determination of non-volatile and volatile organic acids in korean traditional fermented soybean paste (doenjang). ood Chem Toxicol 2010, 48 (8), 2005-2010. [CrossRef]
  37. Yang, M.; Huang, J.; Zhou, R.; Qi, Q.; Peng, C.; Zhang, L.; Jin, Y. , & Wu, C. Characterizing the microbial community of pixian doubanjiang and analysing the metabolic pathway of major flavour metabolites. LWT 2021, 143, 111170. [Google Scholar] [CrossRef]
  38. Wu, S.; Yang, J.; Dong, H.; Liu, Q.; Li, X.; Zeng, X., & Bai, W. Key aroma compounds of chinese dry-cured spanish mackerel (scomberomorus niphonius) and their potential metabolic mechanisms. Food Chem 2021, 342, 128381. [CrossRef]
  39. Lan, T.; Wang, J.; Yuan, Q.; Lei, Y.; Peng, W.; Zhang, M.; Li, X.; Sun, X., & Ma, T. Evaluation of the color and aroma characteristics of commercially available chinese kiwi wines via intelligent sensory technologies and gas chromatography-mass spectrometry. Food Chem X 2022, 15, 100427. [CrossRef]
  40. Zhao, C.; Fan, W. , & Xu, Y. Characterization of key aroma compounds in pixian broad bean paste through the molecular sensory science technique. LWT 2021, 148, 111743. [Google Scholar] [CrossRef]
  41. Jia, Y.; Niu, C.; Lu, Z.; Zhang, X.; Chai, L.; Shi, J.; Xu, Z. , & Li, Q. A bottom-up approach to develop a synthetic microbial community model: Application for efficient reduced-salt broad bean paste fermentation. Appl Environ Microbiol 2020, 86(12), e00306–e00320. [Google Scholar] [CrossRef] [PubMed]
  42. Gao, P.; Jiang, Q.; Xu, Y., & Xia, W. Biosynthesis of acetate esters by dominate strains, isolated from chinese traditional fermented fish (suan yu). Food Chem 2018, 244, 44-49. [CrossRef]
  43. Li, X.; Zhao, C.; Zheng, C.; Liu, J.; Vu, V. H.; Wang, X. , & Sun, Q. Characteristics of microbial community and aroma compounds in traditional fermentation of pixian broad bean paste as compared to industrial fermentation. Int. J. Food Prop 2017, 20, S2520–S2531. [Google Scholar] [CrossRef]
  44. Xie, M.; An, F.; Zhao, Y.; Wu, R., & Wu, J. Metagenomic analysis of bacterial community structure and functions during the fermentation of da-jiang, a chinese traditional fermented food. LWT 2020, 129, 109450. [CrossRef]
  45. Wang, Y.; Sheng, H.; He, Y.; Wu, J.; Jiang, Y.; Tam, N. F. Y., & Zhou, H. Comparison of the levels of bacterial diversity in freshwater, intertidal wetland, and marine sediments by using millions of illumina tags. Appl Environ Microbiol 2012, 78 (23), 8264-8271. [CrossRef]
  46. Grice, E.; Kong, H.; Conlan, S.; Deming, C.; Davis, J.; Young, A.; Bouffard, G.; Blakesley, R.; Murray, P.; Green, E.; Turner, M., & Segre, J. Topographical and temporal diversity of the human skin microbiome. Science (New York, N.Y.) 2009, 324, 1190-1192. [CrossRef]
  47. Zhou, H.; Zhang, S.; Zhao, B.; Li, S.; Pan, X.; Ren, S.; Qu, C., & Cheng, X. Effect of starter culture mixture of Staphylococcus xylosus and S. carnosus on the quality of dry-cured meat. Food Sci 2018, 39 (22), 32-38.
  48. Yao, S.; Zhou, R.; Jin, Y.; Zhang, L.; Huang, J. , & Wu, C. Co-culture with tetragenococcus halophilus changed the response of zygosaccharomyces rouxii to salt stress. Process Biochemistry 2020, 95, 279–287. [Google Scholar] [CrossRef]
  49. Zhao, G.; Hou, L.; Yao, Y.; Wang, C., & Cao, X. Comparative proteome analysis of aspergillus oryzae 3.042 and a. Oryzae 100-8 strains: Towards the production of different soy sauce flavors. J Proteomics 2012, 75, 3914-3924. [CrossRef]
  50. Bull, S. M.; Yong, F. M. , & Wong, H. A. The production of aroma by aspergillus oryzae during the preparation of soy sauce koji. Food Chem 1985, 17(4), 251–264. [Google Scholar] [CrossRef]
  51. Xiwerwanimu, A.; Hainiziguli, N.; Zhao, Q.; Li, S.; Liu, J.; Zhao, H., & Zhao, H. Effects of Bacillus subtilis J-15 secondary metabolites against Verticillium dahliae on diversity of soil fungi. Microbio China 2021, 48 (06), 1997-2007. [CrossRef]
  52. Han, D. M.; Chun, B. H.; Kim, H. M. , & Jeon, C. O. Characterization and correlation of microbial communities and metabolite and volatile compounds in doenjang fermentation. Food Res. Int. 2021, 148, 110645. [Google Scholar] [CrossRef] [PubMed]
  53. Zha, M.; Sun, B.; Wu, Y.; Yin, S. , & Wang, C. Improving flavor metabolism of saccharomyces cerevisiae by mixed culture with wickerhamomyces anomalus for chinese baijiu making. J. Biosci. Bioeng. 2018, 126(2), 189–195. [Google Scholar] [CrossRef] [PubMed]
  54. Zhong, A.; Chen, W.; Duan, Y.; Li, K.; Tang, X.; Tian, X.; Wu, Z.; Li, Z.; Wang, Y. , & Wang, C. The potential correlation between microbial communities and flavors in traditional fermented sour meat. LWT 2021, 149, 111873. [Google Scholar] [CrossRef]
  55. Chen, Z.; Geng, Y.; Wang, M.; Lv, D.; Huang, S.; Guan, Y., & Hu, Y. Relationship between microbial community and flavor profile during the fermentation of chopped red chili (capsicum annuum l.). Food Biosci 2022, 50, 102071. [CrossRef]
  56. Passoth, V.; Fredlund, E.; Druvefors, U., & Schnürer, J. Biotechnology, physiology and genetics of the yeast pichia anomala. FEMS Yeast Res 2006, 6, 3-13. [CrossRef]
  57. Walker, G. M. Pichia anomala: Cell physiology and biotechnology relative to other yeasts. Antonie van Leeuwenhoek 2011, 99(1), 25–34. [Google Scholar] [CrossRef]
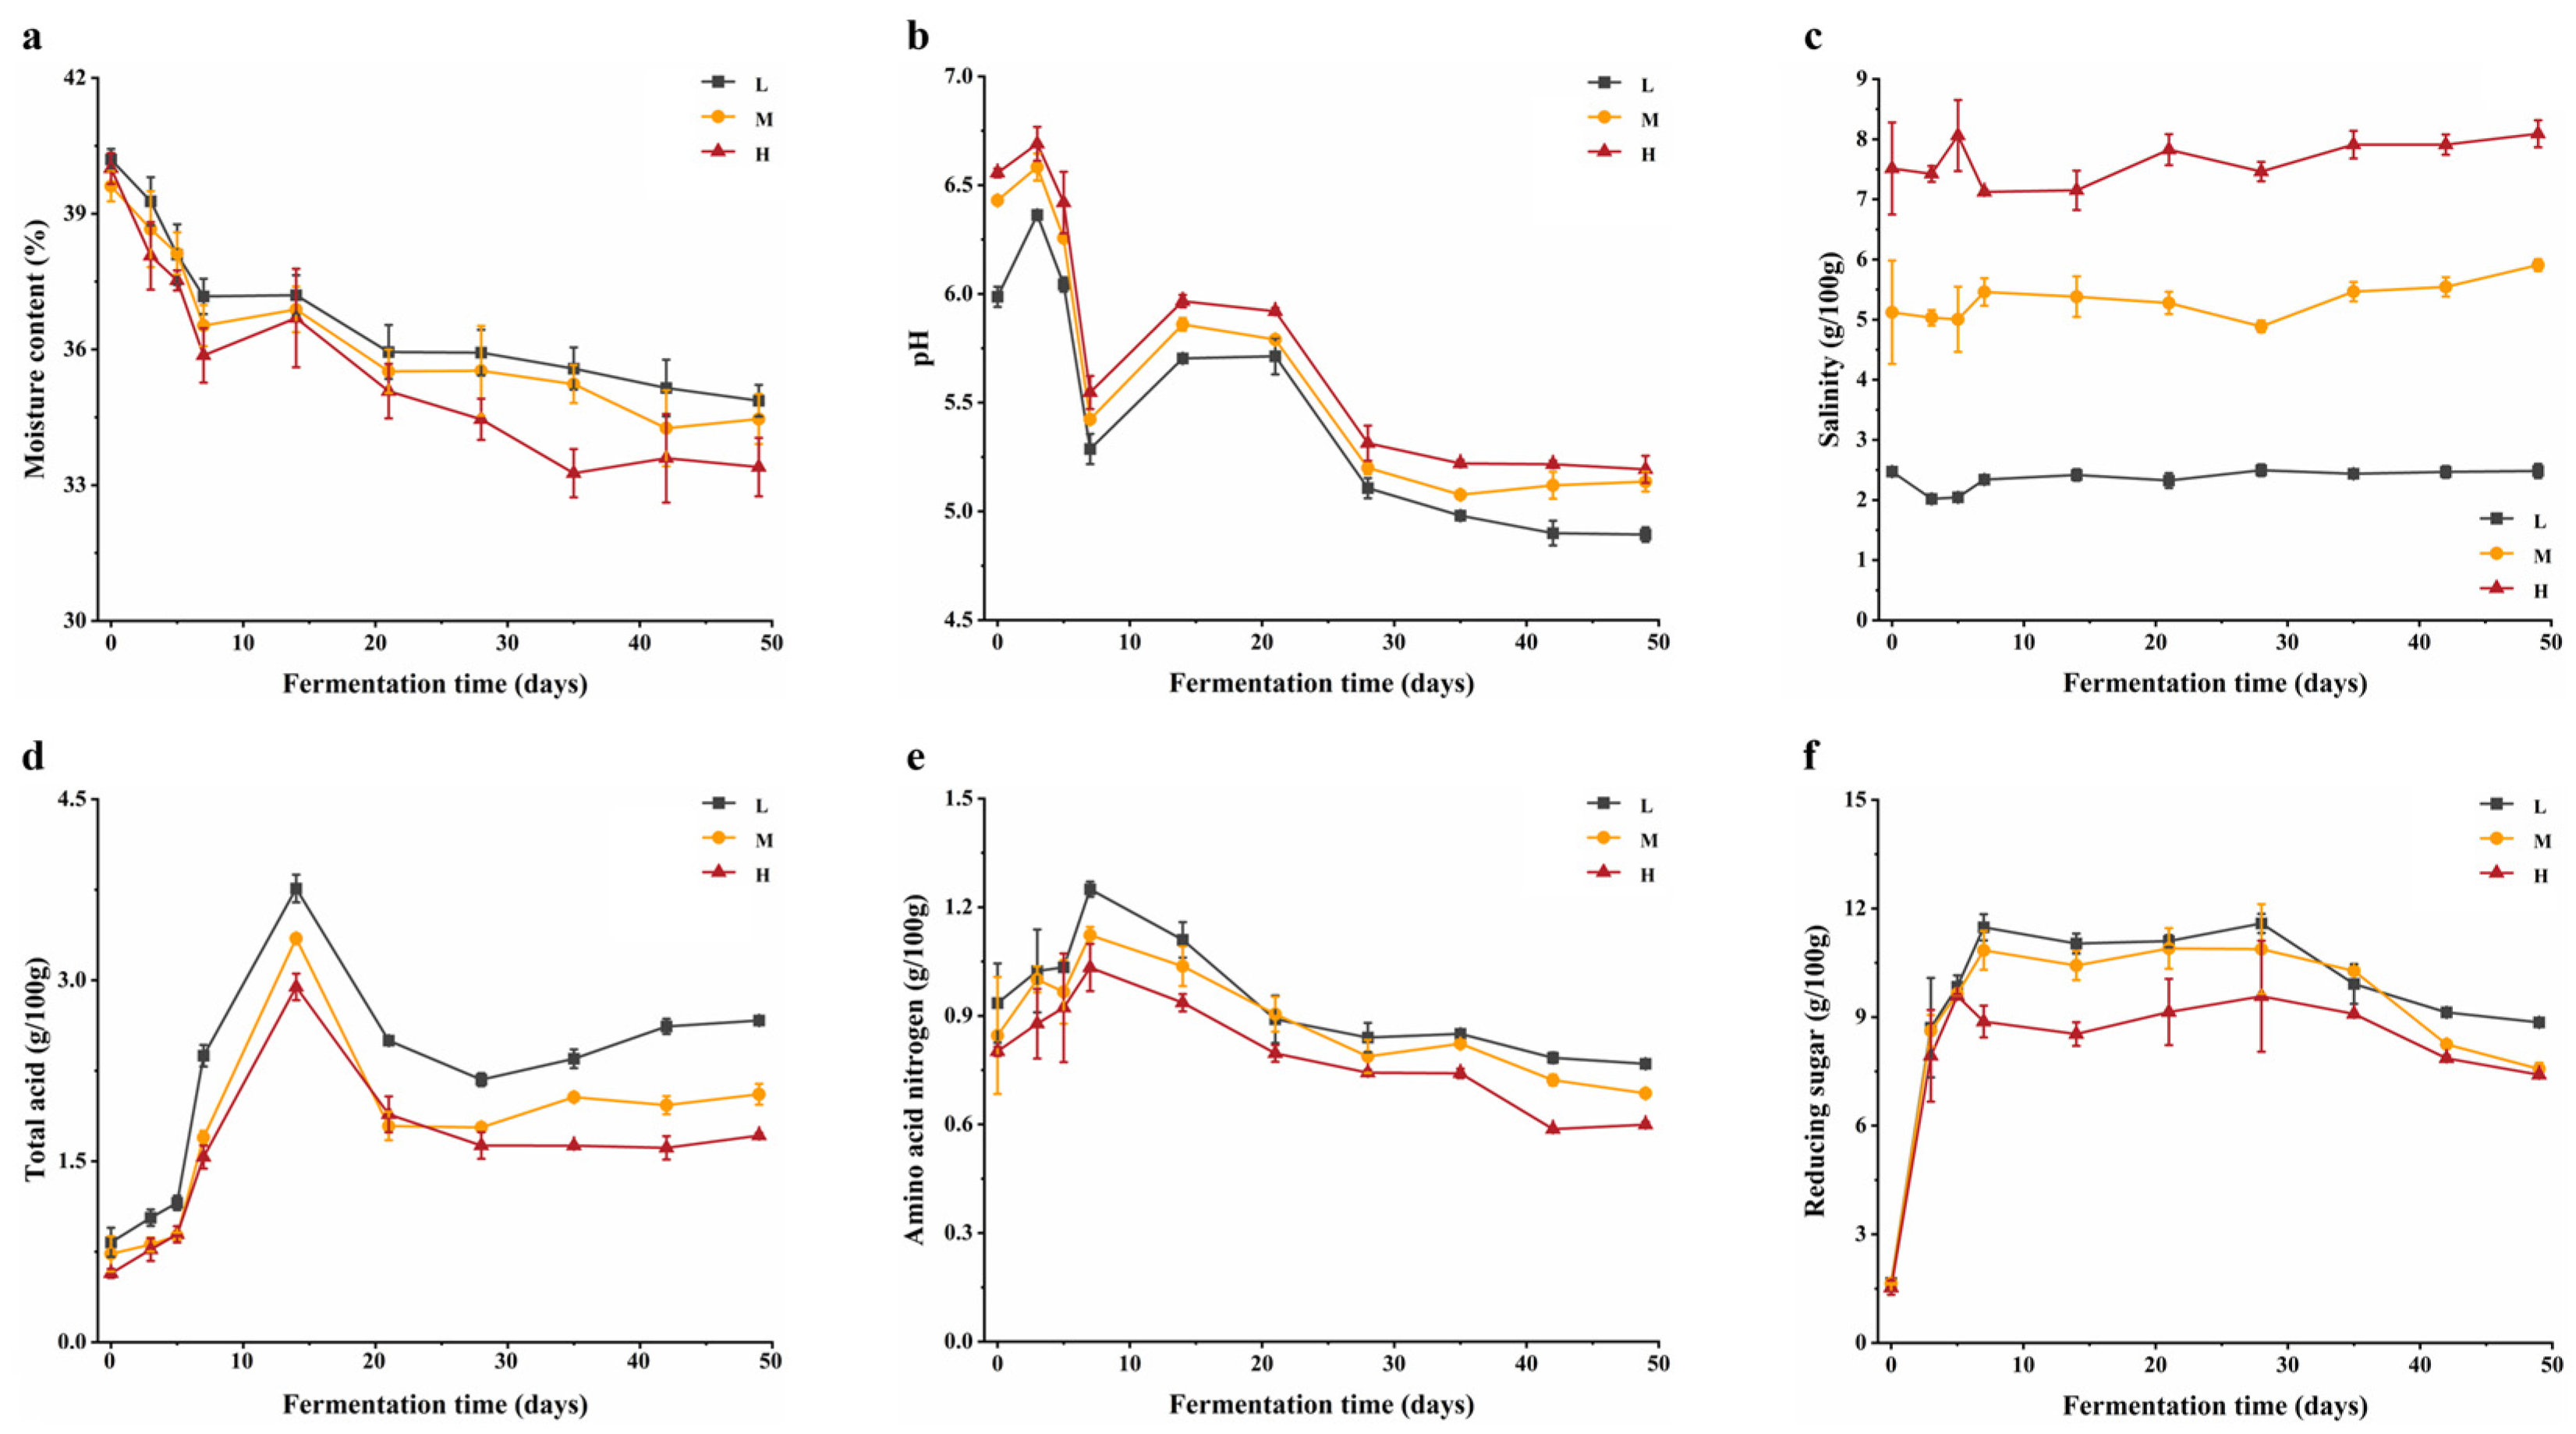
Figure 1. Physicochemical properties during fermentation of BBP-meju with different salt concentrations: (a) moisture contents; (b) pH; (c) salinity; (d) total acid contents; (e) AAN contents; (f) reducing sugar contents.
Preprints 108199 g001
Figure 2. FAAs during fermentation of BBP-meju with different salt concentrations: (a) content of amino acids; (b) relative abundance of amino acids; (c) average content of amino acids in BBP-meju samples.
Preprints 108199 g002
Figure 3. OAs during fermentation of BBP-meju with different salt concentrations: (a) content of OAs; (b) relative abundance of OAs; (c) average content of OAs in BBP-meju samples with different salt concentrations.
Preprints 108199 g003
Figure 4. The volatile compounds of BBP-meju with different salt concentrations based on E-nose data: (a) PCA scores and (b) radar chart.
Preprints 108199 g004
Figure 5. Content distribution of volatile flavor compounds during fermentation of BBP-meju with different salt concentrations: (a) relative abundance of different types of volatile flavor compounds; (b) content of different types of volatile flavor compounds; (c) variation in the content of different types of volatile flavor compounds across samples.
Preprints 108199 g005
Figure 6. The α-diversity of bacterial (a-e) and fungal (f-j) communities during fermentation of BBP-meju with different salt concentrations.
Preprints 108199 g006
Figure 7. Structural analysis of bacterial and fungal communities in BBP-meju samples: (a-b) comparison of OTUs of bacteria (a) and fungi (b); (c-d) Relative abundance of bacteria (c) and fungi (d) at genus level.
Preprints 108199 g007
Figure 8. Correlation clustering heat map (a) and correlation network diagram (b) between dominant microbial genera and key volatiles flavor compounds (VIP > 1) during BBP-meju fermentation with different salt concentrations. (A): the red and blue indicate positive and negative correlation, respectively, and the darker the color, the stronger the correlation, asterisks represent significance, * is p < 0.05, and ** is p < 0.01. (B): blue squares represent key volatile flavor compounds, red circles represent dominant microbial genera, and the yellow solid line and gray dotted line represent positive and negative correlation, respectively, and the thicker the lines, the stronger the correlation.
Preprints 108199 g008
Table 1. Relative contents (μg/kg) of volatile compounds during fermentation of BBP-meju with different salt concentrations.
Compounds CAS N. RI MW L7 M7 H7 L35 M35 H35
Aldehydes
Benzaldehyde 100-52-7 1520 106 211.20±25.03 202.72±31.54 105.28±6.93 375.42±26.64 901.52±142.50 590.74±18.71
Apricolin 104-61-0 2024 156 5.64±1.15 7.83±1.50 4.15±0.37 8.64±1.39 13.08±2.51 8.01±0.96
Valeraldehyde 110-62-3 979 86 21.04±2.31 20.42±1.24 23.94±2.85 n.d. n.d. n.d.
Phenylacetaldehyde 122-78-1 1641 120 184.42±37.72 165.04±16 103.33±14.12 62.40±7.80 123.84±15.01 78.05±6.01
Crotonaldehyde 123-73-9 1039 70 12.96±2.58 9.97±1.44 4.77±0.34 n.d. n.d. n.d.
Nonanal 124-19-6 1391 142 18.64±2.42 5.52±0.65 5.97±0.60 6.48±0.64 10.92±1.50 7.00±0.93
2-Phenyl-5-methyl-2-hexenal 21834-92-4 2056 188 3.14±0.36 4.18±0.27 1.91±0.39 0.86±0.06 4.39±0.59 3.29±0.33
2-Phenyl-2-butenal 4411-89-6 1925 146 1.99±0.53 46.13±4.22 18.71±2.08 41.02±3.72 78.61±3.39 37.57±1.38
2-Heptenal 57266-86-1 1322 112 62.46±27.04 54.47±8.83 73.33±7.26 127.99±9.04 197.97±7.72 71.04±4.18
Hexanal 66-25-1 1083 100 77.79±22.37 83.92±4.55 90.47±6.70 129.98±8.11 177.17±7.27 125.81±17.98
5-Hydroxymethylfurfural 67-47-0 2496 126 n.d. n.d. n.d. 10.31±1.34 11.90±2.54 7.61±0.58
Esters
Ethyl phenylacetate 101-97-3 1783 164 7.71±1.34 4.30±0.30 2.13±0.91 12.83±0.24 27.91±2.48 12.99±2.23
Phenethyl acetate 103-45-7 1813 164 30.33±2.36 17.33±4.73 8.01±0.71 59.10±7.29 171.31±4.41 97.81±14.24
Ethyl isovalerate 108-64-5 1068 130 21.34±3.94 33.77±7.24 32.74±6.23 114.48±14.71 194.59±5.08 74.18±6.29
Isobutyl acetate 110-19-0 1012 116 n.d. n.d. n.d. 49.14±5.77 85.72±6.25 36.79±2.29
Isoamyl acetate 123-92-2 1123 130 33.55±4.54 42.07±8.34 26.73±3.94 1105.69±69.78 2318.01±50.17 1214.85±36.47
Ethyl acetate 141-78-6 888 88 n.d. n.d. n.d. 115.82±4.42 4.04±0.86 n.d.
Hexyl acetate 142-92-7 1273 144 n.d. n.d. n.d. 12.54±1.81 5.97±1.79 4.76±0.60
3-Hydroxydihydro-2(3H)-furanone 19444-84-9 2142 102 2.89±0.27 7.27±0.65 2.65±0.37 8.96±1.06 19.77±4.84 13.33±3.04
Pentyl acetate 628-63-7 1176 130 n.d. n.d. n.d. 29.56±5.74 4.95±0.84 20.61±3.79
Ethyl palmitate 628-97-7 2251 284 20.02±3.69 22.43±6.14 8.70±0.75 22.59±2.25 141.25±10.07 19.42±2.13
Isoamyl isovalerate 659-70-1 1293 172 n.d. n.d. n.d. 26.40±1.51 26.07±3.15 9.30±1.10
Oct-1-en-1-yl acetate 77149-68-9 - 170 n.d. n.d. n.d. 18.99±3.29 13.06±1.52 4.14±0.78
Ketones
3-Octanone 106-68-3 1253 128 n.d. n.d. n.d. 107.83±13.27 100.55±8.66 66.61±4.30
6-Methylhept-5-en-2-one 110-93-0 1339 126 5.30±0.61 7.51±0.97 4.81±0.56 6.03±0.78 10.69±2.43 6.10±1.01
2-Octanone 111-13-7 1287 128 18.48±4.47 15.09±5.06 13.68±2.29 29.07±5.59 25.06±3.17 24.57±4.55
1-Indanone 83-33-0 1969 132 10.80±1.20 4.31±1.17 1.71±0.17 2.98±0.24 3.27±0.56 n.d.
Alcohols
2-Ethylhexanol 104-76-7 1491 130 2.64±0.36 2.31±0.65 1.99±0.44 4.36±0.87 2.16±0.76 1.22±0.35
7-Oxabicyclo [4.1.0]heptan-2-ol 1192-78-5 - 114 63.57±11.36 53.02±7.55 53.54±6.46 26.54±3.12 50.92±6.88 58.01±4.96
3-Methyl-1-butanol 123-51-3 1209 88 257.77±27.04 493.88±35.04 356.84±32.37 1555.05±124.29 2279.02±23.54 987.25±54.18
1-Nonanol 143-08-8 1660 144 2.11±0.57 n.d. n.d. 614.12±33.58 1018.33±69.98 1555.05±29.24
4-Phenyl-3-buten-2-ol 17488-65-2 - 148 n.d. n.d. n.d. 5.94±1.52 11.41±1.91 5.08±0.97
Trans-2-Octen-1-ol 18409-17-1 1613 128 n.d. 123.7±10.07 79.07±8.03 62.23±7.46 71.87±6.98 56.19±4.73
DL-β-Ethylphenethyl alcohol 2035-94-1 1978 150 n.d. n.d. n.d. 9.05±1.38 12.01±2.26 4.88±1.35
2-Nonen-1-ol 22104-79-6 1692 142 n.d. n.d. n.d. 12.71±2.43 30.80±1.85 16.21±1.14
Hexaethyleneglycol 2615-15-8 - 282 22.43±4.92 75.40±6.24 84.44±7.47 61.33±13.09 173.39±18.23 12.71±0.94
1-Octen-3-ol 3391-86-4 1450 128 1089.31±80.20 1955.59±88.13 1273.05±57.24 1503.75±104.23 2574.37±90.06 1215.44±66.28
3-Methylthiopropanol 505-10-2 1719 106 25.75±3.18 24.68±4.64 15.07±3.10 105.89±7.47 127.21±2.27 1585.01±15.91
3,6,9,12,15,18,21-Heptaoxatricosane-1,23-diol 5117-19-1 - 370 451.37±23.44 421.89±67.97 277.92±25.86 1257.43±41.33 2234.17±82.86 66.16±3.62
2,3-Butanediol 513-85-9 1543 90 16.22±2.31 11.92±2.01 11.72±2.61 47.86±6.41 269.48±6.66 516.18±19.89
2-Heptanol 543-49-7 1320 116 n.d. 0.67±0.06 0.65±0.15 3.92±1.33 4.98±0.55 2.18±0.50
Heptaethylene glycol 5617-32-3 - 326 750.05±15.98 618.79±27.42 517.64±36.38 1133.89±103.43 1687.66±51.89 1092.49±87.83
Glycerol 56-81-5 2303 92 n.d. 20.35±3.68 n.d. 57.41±6.31 313.04±35.48 712.67±29.45
3-Octyl alcohol 589-98-0 1393 130 20.80±9.84 28.42±4.40 24.21±4.9 49.39±6.73 117.58±6.76 105.33±14.29
Ethanol 64-17-5 932 46 32.05±3.62 13.22±1.70 2.88±0.70 35.72±3.41 117.03±8.52 7.74±1.12
Butanol 71-36-3 1142 74 2.54±0.46 1.91±0.24 2.31±0.72 3.97±1.06 8.01±0.43 6.16±0.81
Pentanol 71-41-0 1250 88 16.09±3.36 15.23±3.16 17.28±3.19 42.04±5.10 28.54±4.10 21.05±2.05
Isobutanol 78-83-1 1092 74 n.d. 16.89±4.27 12.81±2.96 4.38±0.15 9.69±1.25 16.02±1.42
Furfuryl alcohol 98-00-0 1661 98 10.31±1.27 13.74±3.76 6.32±0.56 23.23±4.86 34.04±1.94 20.60±2.27
Phenols
Phenol 108-95-2 2000 94 37.53±2.95 32.10±5.87 20.88±6.79 88.39±5.72 58.85±3.54 24.00±3.16
Phenol,2-methoxy-4-(1E)-1-propen-1-yl 5932-68-3 2362 164 5.17±0.66 n.d. 0.43±0.05 11.36±2.70 n.d. 6.04±0.64
4-Hydroxy-3-methoxystyrene 7786-61-0 2188 150 4.43±2.34 7.63±1.99 4.24±0.85 1.27±0.07 10.29±1.25 6.50±0.97
1-Naphthalenol 90-15-3 - 144 2.19±0.60 3.03±0.46 3.67±0.46 3.87±0.60 9.51±1.12 12.97±2.35
2,4-Di-t-butylphenol 96-76-4 2321 206 32.58±3.39 35.69±7.33 21.06±1.74 1.27±0.29 36.01±3.30 20.01±1.92
Acids
Octanoic acid 124-07-2 2060 144 10.17±1.34 14.08±4.26 4.63±1.05 14.57±2.34 32.33±1.29 12.16±1.72
3,6,9-Trioxaundecanedioic acid 13887-98-4 - 222 n.d. n.d. n.d. 68.78±10.04 16.22±0.90 6.42±0.67
3-Methylbutanoic acid 503-74-2 1666 102 176.89±15.88 304.65±34.84 199.65±18.91 374.81±21.66 1246.03±45.46 313.80±25.25
Acetic acid 64-19-7 1449 60 1131.94±98.26 1292.95±74.64 863.68±41.96 2765.65±85.66 202.76±39.63 101.72±8.92
Agaric acid 666-99-9 - 416 5.64±1.22 2.37±0.61 2.22±0.51 17.38±1.52 14.99±2.76 7.53±0.98
Isobutyric acid 79-31-2 1570 88 11.49±3.14 17.78±4.31 11.42±1.12 17.52±2.43 42.86±1.66 21.70±3.62
Others
Styrene 100-42-5 1261 104 n.d. n.d. n.d. 162.42±2.41 303.57±16.54 321.14±18.16
2,3-Dihydrofuran 1191-99-7 - 70 11.08±1.21 n.d. n.d. 12.38±2.30 26.47±6.20 11.16±1.44
12-Crown-4 294-93-9 - 176 n.d. n.d. n.d. 103.34±17.03 33.37±2.26 21.69±1.94
Dodecyl octaethylene glycol ether 3055-98-9 - 538 497.12±26.96 439.28±44.62 241.99±23.12 609.81±61.44 572.30±43.08 432.97±18.86
Hexamethylcyclotrisiloxane 541-05-9 - 222 216.53±29.17 116.39±24.08 129.30±5.65 366.79±33.16 497.18±10.58 231.39±10.99
Octadecane,3-ethyl-5-(2-ethylbutyl) 55282-12-7 - 366 2.19±1.57 n.d. 1.33±0.28 12.87±2.08 53.12±5.23 15.97±1.77
†MW: molecular weight; RI: retention index; n.d.: volatile compounds not detected.
Table 2. OTUs distribution on effective and high-quality sequences number of BBP-meju under different salt concentration.
Samples Bacteria Fungal
Effective sequences High-quality sequences Proportions (%) Effective sequences High-quality sequences Proportions (%)
L7a 58786 51006 86.77 79408 77311 97.36
L7b 55060 48152 87.45 79349 76322 96.19
L7c 53262 44432 83.42 64427 61232 95.04
M7a 59931 52944 88.34 79834 77046 96.51
M7b 47009 37853 80.52 79900 77360 96.82
M7c 49382 39638 80.27 79670 76885 96.50
H7a 60083 48920 81.42 79347 76045 95.84
H7b 45747 37236 81.40 79642 77067 96.77
H7c 75497 66553 88.15 79429 77070 97.03
L35a 59664 53408 89.51 79848 77580 97.16
L35b 59740 50317 84.23 79681 76918 96.53
L35c 53049 42808 80.70 79504 76834 96.64
M35a 56810 49493 87.12 79866 76747 96.09
M35b 76969 70391 91.45 79381 76878 96.85
M35c 76296 69324 90.86 79952 77843 97.36
H35a 60505 50971 84.24 79845 77852 97.50
H35b 63071 50920 80.73 79611 77127 96.88
H35c 68939 60942 88.40 79808 76747 96.16
Disclaimer/Publisher’s Note: The statements, opinions and data contained in all publications are solely those of the individual author(s) and contributor(s) and not of MDPI and/or the editor(s). MDPI and/or the editor(s) disclaim responsibility for any injury to people or property resulting from any ideas, methods, instructions or products referred to in the content.
Copyright: This open access article is published under a Creative Commons CC BY 4.0 license, which permit the free download, distribution, and reuse, provided that the author and preprint are cited in any reuse.
Prerpints.org logo

Preprints.org is a free preprint server supported by MDPI in Basel, Switzerland.

Subscribe

© 2024 MDPI (Basel, Switzerland) unless otherwise stated